Cite as: Dolnicar, S. & Grün, B. (2013) Validly Measuring Destination Images in Survey Studies. Journal of Travel Research, 52(1): 3-13. Validly measuring destination image in survey studies Sara Dolnicar and Bettina Grün Acknowledgements We thank the Australian Research Council (ARC) through grants LX088190 and DP0878338 and the Austrian Science Fund (FWF) through Elise-Richter grant V170-N18 for contributing to the funding of this study, John Rossiter and Dan Fesenmaier for their feedback on the Page 1 of 32

Welcome message from author
This document is posted to help you gain knowledge. Please leave a comment to let me know what you think about it! Share it to your friends and learn new things together.
Transcript
Cite as:
Dolnicar, S. & Grün, B. (2013) Validly Measuring
Destination Images in Survey Studies. Journal of
Travel Research, 52(1): 3-13.
Validly measuring destination image in survey
studies
Sara Dolnicar and Bettina Grün
AcknowledgementsWe thank the Australian Research Council (ARC) through grants LX088190 and DP0878338 and the Austrian Science Fund (FWF) through Elise-Richter grant V170-N18 for contributing to the funding of this study, John Rossiter and Dan Fesenmaier for their feedback on the
Page 1 of 32

questionnaire; Brad Braithwaite for being instrumental inmanaging the data collection; and Hannah Kelly for performing the literature search relating to this study.
Page 2 of 32
Validly measuring destination image in survey
studies
Abstract
Destination image is among the most frequently measured constructs in empirical survey research. Academic tourism researchers tend to use multi-category scales, often referring to them as “Likert scales,” while industry typically uses “pick-any” measures. But which leads to results that are more valid? Findings from a large-scale experimental study show that a “forced-choice full binary”format (where respondents have to tick YES or NO for each destination attribute combination) performs better than both current preferred formats in academic and applied studies.Keywords: destination image, image measurement, brand image, Likert, DLF IIST, binary
Page 3 of 32

Introduction
Destination image measurement has a long history both in academic tourism research and in applied research conducted by or for the tourism industry. According to Pike (2002), destination image measurement has developed to become the single most popular topic of investigation in tourism research. Suh and Gartner (2004) refer to destination image studies as “a staple of destination market research” (p. 40). The reason for the high level of interest in destination image is the acknowledgement that destination image affects both destination preference and tourists’ intention to visit (Mayo 1973; Hunt 1975; Goodrich 1978). According to Baloglu and McCleary (1999), the “initial image formation stage before the trip is the most important phase in tourits’ [sic] destination selection processes” (p. 869). Empirical evidence also suggests that destination image significantly affects recommendation behavior of destinations (for example, Bigne, Sanchez & Sanchez 2001). Destination image is one of the key building blocks of successful tourism marketing. Both academic researchers and tourism marketing managers thus frequently measure destination image in empirical survey studies to: 1) assess how tourists currently view a destination, 2) define how the destination would like to be perceived by tourists, 3) develop and implement marketing action to modify destination image and, 4) check if the intended change in destination image has occurred. The success of both the assessment and the attempt to modify the image of a destination depends on valid empirical measurement. A wide range of approaches have
Page 4 of 32

been taken in survey studies in the past: the top three tourism journals internationally (Journal of Travel Research, Tourism Management and Annals of Tourism Research, see Appendix for full list of reviewed articles) published a total of 86 journal articles on destination image in the past decade. Studies view different entities as “destinations”. In most studies (43 percent) the destination was a country (for example, New Zealand, China, Turkey); while in 14 percent of studies it was a city (for example, Las Vegas, Seoul); in 8 percent of cases it was attractions (for example, museums) and in 17percent of cases the destination was a state in the US ora region in a different country.Of all reviewed studies, 85 percent included an empiricalcomponent that involved measuring destination image. A number of studies used qualitative methods (such as content analysis, word association tests, content analysis of webpages, visitor employed photography) to determine destination image, but the majority of the empirical studies (75 percent) ask respondents to assess destination image using a questionnaire and following theoperationalization of brand image as proposed by Keller (1993), which involves assessing the association of destinations with a list of attributes.When analyzing in detail which measures or answer formatswere used in these studies, a very clear pattern emerges:the dominance of seven- and five-point scales. The vast majority (89 percent) of all empirical survey studies on destination image published in the Journal of Travel Research, Tourism Management and Annals of Tourism Research in the past 10 years used one of those two answer formats. More specifically, two percent used a nine-point scale, 40 percent used a seven-point scale, six percent used a six-
Page 5 of 32

point scale, 48 percent used a five-point scale and four percent used a binary question format. Despite the wide range of approaches used, no attempt hasbeen made to date to assess the comparative validity of these different quantitative measures of destination image and little guidance is available to researchers anddata analysts on which measure should be preferred. Filling this research gap is the aim of the present study. More specifically, the performance of six different methods of measuring destination image which can be used in survey studies is compared using three keycriteria of data quality: concurrent validity, survey completion time, and stability (or test-retest reliability). Prior work only investigated stability in the examination of a range of different answer formats (Dolnicar & Grün, 2007). Dolnicar, Grün and Leisch (2011)used similar criteria but only compared two different answer formats.The recommendation on how to measure destination image validly in a survey study, which results from this study,has significant implications for both knowledge development in academia and empirical market research in tourism industry. Knowledge development about certain objects or phenomena can only occur if the objects or phenomena are measured validly. The same holds for marketresearch which is used by tourism industry to inform strategic and tactical decisions: high quality market research data improves the quality of strategic tourism planning, tourism marketing and operation of tourism businesses.
Page 6 of 32
Method
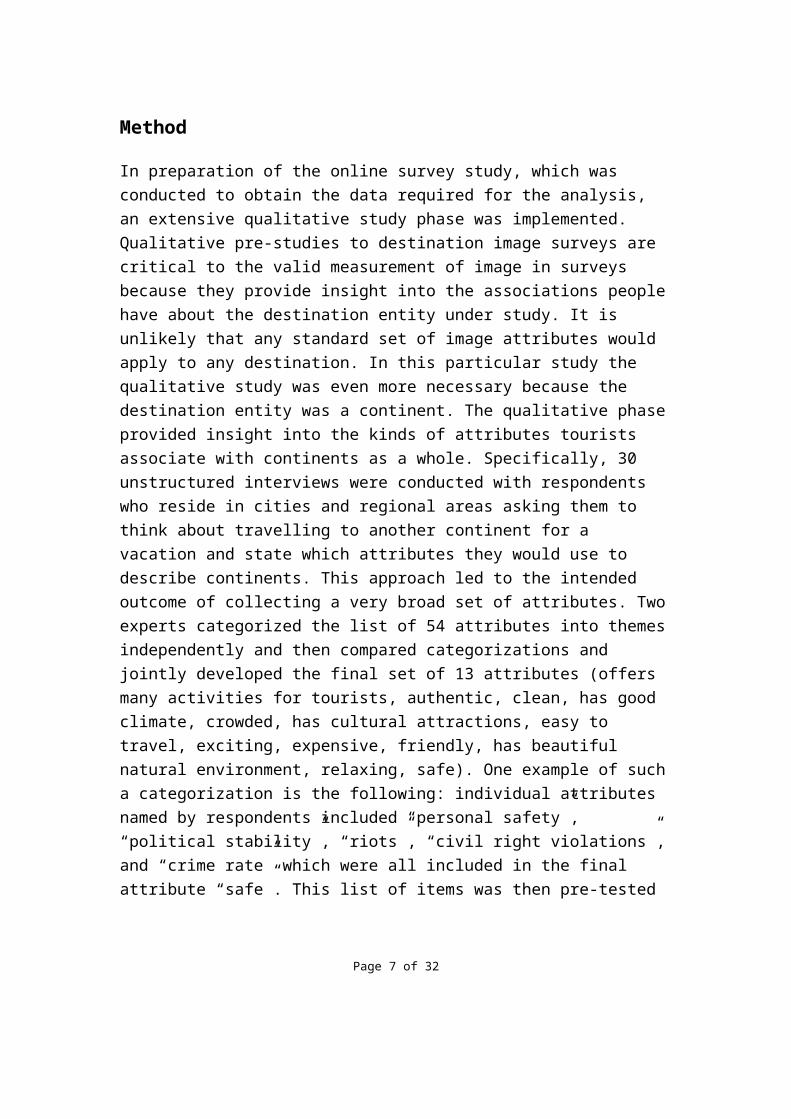
In preparation of the online survey study, which was conducted to obtain the data required for the analysis, an extensive qualitative study phase was implemented. Qualitative pre-studies to destination image surveys are critical to the valid measurement of image in surveys because they provide insight into the associations peoplehave about the destination entity under study. It is unlikely that any standard set of image attributes would apply to any destination. In this particular study the qualitative study was even more necessary because the destination entity was a continent. The qualitative phaseprovided insight into the kinds of attributes tourists associate with continents as a whole. Specifically, 30 unstructured interviews were conducted with respondents who reside in cities and regional areas asking them to think about travelling to another continent for a vacation and state which attributes they would use to describe continents. This approach led to the intended outcome of collecting a very broad set of attributes. Twoexperts categorized the list of 54 attributes into themesindependently and then compared categorizations and jointly developed the final set of 13 attributes (offers many activities for tourists, authentic, clean, has good climate, crowded, has cultural attractions, easy to travel, exciting, expensive, friendly, has beautiful natural environment, relaxing, safe). One example of sucha categorization is the following: individual attributes named by respondents included “personal safety”, “political stability”, “riots”, “civil right violations”,and “crime rate” which were all included in the final attribute “safe”. This list of items was then pre-tested
Page 7 of 32

in the process of questionnaire development and was assessed to be meaningful in the context of continents asdestinations by the respondents. Once the list of attributes and the questionnaire were finalized, a large-scale experimental study using an international online survey panel was conducted. Respondents from four continents (North America, Australia, Europe, and Asia) were asked to assess the images of seven continents (Africa, Asia, Europe, Australia, South America, North America, and Antarctica).The final sample size amounted to 2,532 respondents (594 from the US, 669 from Australia, 689 from the UK, and 580from India). The large sample size was required because subsets of the sample were exposed to different answer formats. Between 408 and 434 respondents were randomly assigned to one of six answer formats. Within each answerformat approximately 100 respondents were from each of the four continents.
Answer formats included in the study
Pick-any format (n = 418)
This format lists all attributes for each destination andasks respondents to tick those attributes that they associate with the destination. Ticking a box indicates that they positively associate that attribute with the destination. Not ticking the box indicates that they do not associate the attribute with the destination. However, this choice also offers respondents a way of notresponding to the question. In the data set this format is coded as binary, where a 1 means that the respondent
Page 8 of 32
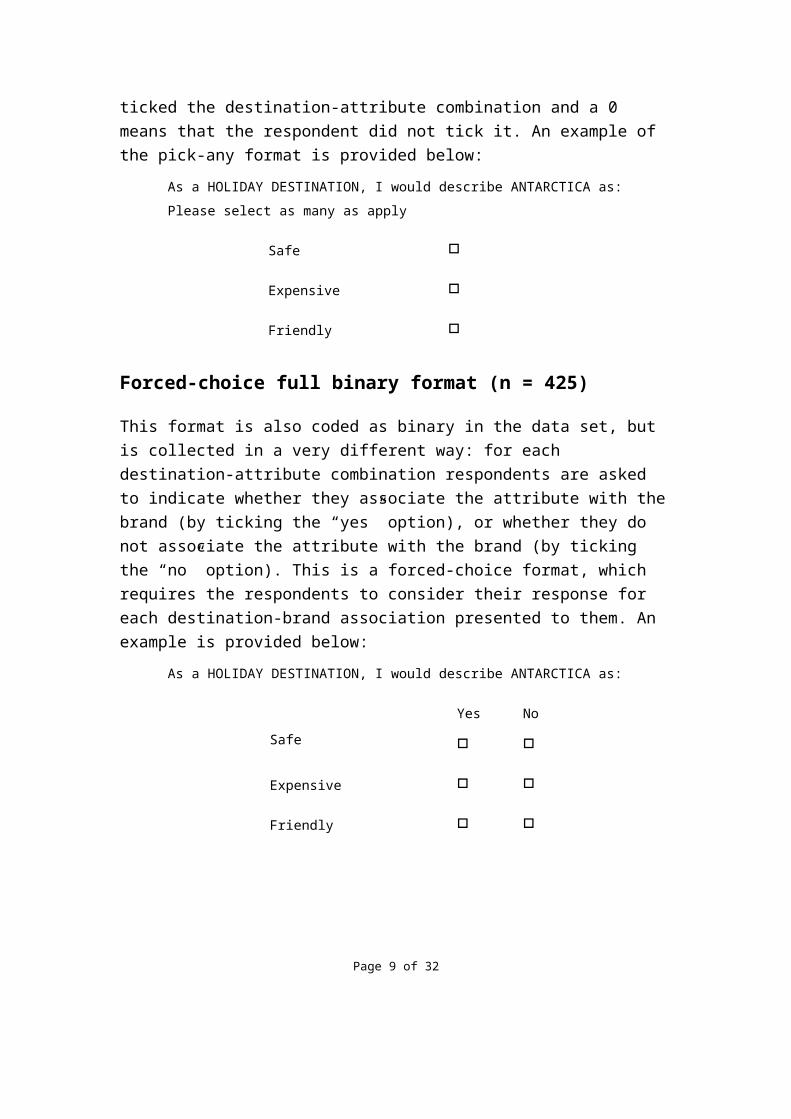
ticked the destination-attribute combination and a 0 means that the respondent did not tick it. An example of the pick-any format is provided below:
As a HOLIDAY DESTINATION, I would describe ANTARCTICA as: Please select as many as apply
Safe
Expensive
Friendly
Forced-choice full binary format (n = 425)
This format is also coded as binary in the data set, but is collected in a very different way: for each destination-attribute combination respondents are asked to indicate whether they associate the attribute with thebrand (by ticking the “yes” option), or whether they do not associate the attribute with the brand (by ticking the “no” option). This is a forced-choice format, which requires the respondents to consider their response for each destination-brand association presented to them. An example is provided below:
As a HOLIDAY DESTINATION, I would describe ANTARCTICA as:
SafeYes
No
Expensive
Friendly
Page 9 of 32
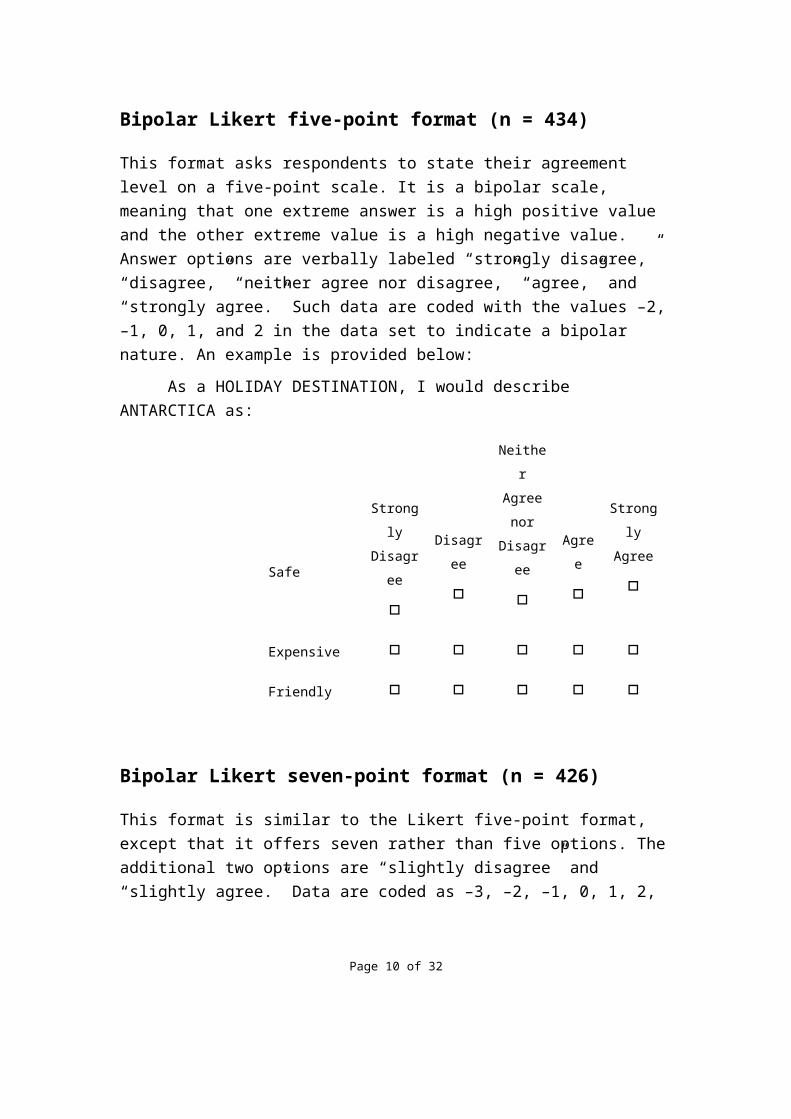
Bipolar Likert five-point format (n = 434)
This format asks respondents to state their agreement level on a five-point scale. It is a bipolar scale, meaning that one extreme answer is a high positive value and the other extreme value is a high negative value. Answer options are verbally labeled “strongly disagree,” “disagree,” “neither agree nor disagree,” “agree,” and “strongly agree.” Such data are coded with the values –2,–1, 0, 1, and 2 in the data set to indicate a bipolar nature. An example is provided below:
As a HOLIDAY DESTINATION, I would describe ANTARCTICA as:
Safe
Strongly
Disagree
Disagree
Neither
Agreenor
Disagree
Agree
Strongly
Agree
Expensive
Friendly
Bipolar Likert seven-point format (n = 426)
This format is similar to the Likert five-point format, except that it offers seven rather than five options. Theadditional two options are “slightly disagree” and “slightly agree.” Data are coded as –3, –2, –1, 0, 1, 2,
Page 10 of 32

and 3 to account for the bipolar nature of the answer format. An example is provided below:
Page 11 of 32

As a HOLIDAY DESTINATION, I would describe ANTARCTICA as:
Safe
Strongly
Disagree
Disagree
Slightly
Disagree
Neither
AgreeNor
Disagree
Slightly
Agree
Agree
StronglyAgree
Expensive
Friendly
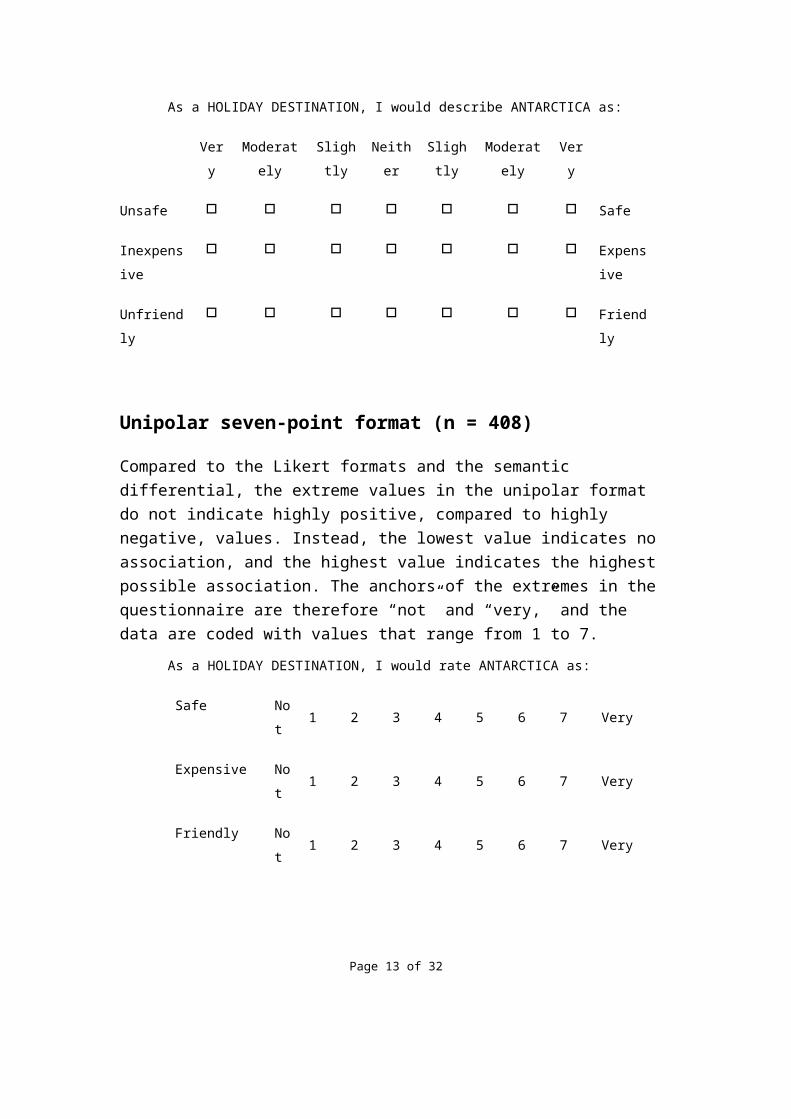
Semantic differential seven-point format (n =
421)
This format also offers seven answer options and is bipolar. For each attribute opposed pairs are offered, for example, “unsafe–safe.” The respondent is asked to tick one of seven boxes located between these pairs of extremes. The seven options are labeled: “very,” “moderately,” “slightly,” “neither,” “slightly,” moderately,” and “very,” where the left side of the scalerefers to one extreme (for example, unsafe) and the otherto the other extreme (for example, safe). Data are coded as –3, –2, –1, 0, 1, 2, and 3 to account for the bipolar nature of the answer format. An example is provided below:
Page 12 of 32
As a HOLIDAY DESTINATION, I would describe ANTARCTICA as:
Very
Moderately
Slightly
Neither
Slightly
Moderately
Very
Unsafe Safe
Inexpensive
Expensive
Unfriendly
Friendly
Unipolar seven-point format (n = 408)
Compared to the Likert formats and the semantic differential, the extreme values in the unipolar format do not indicate highly positive, compared to highly negative, values. Instead, the lowest value indicates no association, and the highest value indicates the highest possible association. The anchors of the extremes in the questionnaire are therefore “not” and “very,” and the data are coded with values that range from 1 to 7.
As a HOLIDAY DESTINATION, I would rate ANTARCTICA as:
Safe Not
1 2 3 4 5 6 7 Very
Expensive Not
1 2 3 4 5 6 7 Very
Friendly Not
1 2 3 4 5 6 7 Very
Page 13 of 32

As mentioned above, each respondent was randomly assignedto one of these answer formats, and twice completed the destination image part of the survey, with one week in between each test. This design enabled computation of oneof the criteria: test-retest reliability, or stability (which requires two measurements from the same individuals).In the following, if answers over different answer formats are to be compared, the scores are transformed tobe in the interval [–1, 1], where the extreme answers at the endpoints of the answer formats are assigned the values –1 and 1.In the first wave 3,625 respondents filled in the questionnaire; only 2,532 of these also completed the questionnaire a second time. A comparison of dropout numbers across all answer formats indicates no significant difference between formats that could bias the random assignment (χ2 = 2.81, df = 5, p-value = 0.73).
Page 14 of 32

The three criteria used to assess the performance of
each of the answer formats
Test-retest reliability (stability)
Stability is a necessary condition for a measure to be valid (Rossiter, 2011). Test-retest reliability is measured by presenting the same respondent with the same destination-attribute combination; for example, “US” and “safe” twice, and asking them to provide a response to the same question twice. Stability can be measured in several different ways. In this study three measures thatdiffer in their level of strictness were used: in the case of strict stability merely giving the exact same answer twice counts as a stable response. For the binary measures, this means that the respondent must have two 1sor two 0s for the response to be counted as stable. For the answer formats with more than two options, the exact same option must be ticked; for example, “slightly agree.” The second measure, which is slightly less strict, is commonly referred to as the Jaccard coefficient and is therefore in the following denoted as Jaccard stability. In this case, all data are binarized. This is achieved for all non-binary (except for the unipolar seven-point) formats by transforming all positive values to a 1, and transforming all negative values as well as the neutral option to a 0. For the unipolar seven-point format also the three options indicating strongest agreement are transformed to a 1 andall other answer options to a 0 similar to the other seven-point answer formats. Then all the stable agreements (respondents answered with a 1 twice in a row)
Page 15 of 32
are divided by the sum of the stable agreements, and all the unstable answers (all cases where respondents have a value of 1 on one, and a value of 0 on the other occasionfor the same destination-attribute combination). In this measure, two repeated 0s are omitted, implying that not associating an attribute with a destination twice in a row is not a stable response. Removing the repeated 0s iscrucial if a risk exists that people use 0s to avoid responding, rather than truly answering the survey question in the negative. Finally, the least-strict measure of stability is referred to as binary stability. In this case, a repeat response that remains the same forthe binarized answers across the two measurements is counted as a stable response.
Concurrent validity
Concurrent validity tests whether the measure of destination image can predict another construct (measuredat the same time), which is seen as depending on a tourist’s perception of the destination. In the present study the following question was used to assess concurrent validity: “Please select the continent that you think is MOST DESIRABLE for a holiday.” A drop box was provided with all continents, and the respondents hadto choose one only. The selected option was coded as 1; all others were coded 0 in the data set. Multinomial conditional logit models were computed with the information about which continent was seen as the most desirable for a holiday serving as the dependent variable. As independent variables the measured destination image items were used with their corresponding scores. For a fair comparison, tenfold
Page 16 of 32
cross-validation was performed. The data were split into 10 parts, and each part was used once for prediction, while the remaining data were used to fit the model; thatis, the model was fitted to 90 percent of the data and the remaining 10 percent of data were used for validationcomparing the predicted destination to the actual observed value. The correct classification rates on the left-out data were compared over answer formats using an analysis of variance.
Survey completion time
Survey completion time (the time that each respondent took to complete the survey) is critical because it affects the engagement of respondents with the survey as well as fieldwork cost. Brand image studies are known to be particularly tedious. According to Dolnicar and Rossiter (2008) commercial market research surveys on brand image include as many as 100 pairs of brands and attributes. The shorter the completion time of a survey (1) the less likely will fatigue effects occur in respondents which have been shown to have negative effects on data quality (Johnson, Lehmann & Horne, 1990), and (2) the cheaper thefieldwork cost will be. The practical implication is thatif two answer formats are found to perform equally well with respect to stability and validity, it is preferable to choose the answer format which is quicker to use. In the present study survey completion time was recorded by the fieldwork company automatically. Given that the studywas conducted in an online environment, respondents couldinterrupt their answering of the questions and return
Page 17 of 32

later. Consequently, a large number of outliers indicating extremely long completion times exist in the data. To compare whether completion times were significantly different across the answer formats, a robust statistical test procedure based on the ranks was used in order to account for these outliers. A Kruskal-Wallis rank sum test was computed to test for significantdifferences over all answer formats and a Wilcoxon rank sum test to assess significance of pair-wise comparison.
Page 18 of 32

Results and Discussion
Figure 1 illustrates the nature of data used for all continents assessed using Antarctica as an example. In this case, respondents assessed Antarctica using 13 attributes. In Figure 1 the bars represent the average results for Antarctica using one answer format. The line with a circle at the end represents the overall assessment across all objects; in this case, continents. The figure shows that Antarctica was generally perceived as: offering fewer activities, being cleaner, having a less pleasant climate, being less crowded, less cultural,less easy to travel within, less friendly and relaxing, but more expensive than other continents. For some items the interpretation varies across answer formats. For example, if measured using the forced-choice full binary answer format, Antarctica was perceived as safer; if measured by the pick-any format, it was perceived as lesssafe. Such differences occur despite the fact that Antarctica has the most distinct image of all continents,and they tend to occur for attributes associated with Antarctica to a similar extent as with other continents.
Test-retest reliability (stability)
Figure 2 provides stability results. Results for each of the answer formats are displayed in the rows, and are given for all measures of stability in columns. The stability measures are determined separately for each respondent. The differences between the answer formats are statistically significant (analysis of variance: FSS =664.6, FBS = 15.1, FJS = 76.3, df1 = 5, df2,SS = df2,BS = 2526,
Page 19 of 32
df2,JS = 2513, p-value < 0.0001, where SS denotes strict stability, JS Jaccard stability and BS binary stability).In Figure 2 the different stability values of the respondents are summarized for each answer format using box plots. The box plot consists of a box that indicates where the middle 50 percent of the data is located. The length of the box corresponds to the interquartile range.The line within the box shows the median, which is the value of the observation in the middle of the data list after sorting. The whiskers stretch out of the box to indicate the minimum (maximum) value observed if it lies within 1.5 times the length of the box. Observations morethan 1.5 times the box length away from the box are indicated using circles. By comparing the medians, differences in location between the answer formats are assessed. The significance of the difference is indicatedby the length of the boxes, which serve as a measure of variability.The forced-choice full binary measure produces more stable results than any other answer format on all three stability measures. These differences are significant according to t-tests comparing the different answer formats to forced-choice full binary using linear models (all p-values < 0.0001). All seven-point formats perform lowest when strict stability was assessed. This is not unexpected, because — under this measure — respondents are expected to tick exactly the same answer option (out of seven possible). This finding cannot be declared as a mere statistical artifact. Rather, it has major theoretical implications in terms of the validity of measurement in the social sciences: if it is not expectedthat respondents can repeatedly tick the exact same option without any external factors having changed their
Page 20 of 32

beliefs about an object (which is the underlying assumption of the strict stability measure), it has to bequestioned whether any response on such a format is valid. For example, if a respondent ticks 2 for “Antarctica” and “safe” the first time, and 1 the second time, which response actually reflects their true belief?Does this respondent think Antarctica is “very safe” or “safe”?A standard image study would only take the measure once, and that response would be used in the data analysis on the assumption that it was the respondent’s true belief and that they would replicate the response when asked thequestion again. Therefore, comparing answer formats usingthis criterion is not unreasonable, and actually reflectsthe underlying assumptions by the researcher: that each answer option in each answer format is indeed meaningful to the respondents.Another interesting finding relates to the criterion of stability of the pick-any answer format. The pick-any format performs well when the binary stability measure orthe strict stability measure is used as criterion of comparison. However, when the Jaccard criterion is used, its performance drops to effectively the worst-performingof all answer formats. This occurs because the pick-any format only records instances where respondents associatean attribute with a brand by ticking a 1. However, a 0 can either mean that the respondent does not associate the attribute with the brand or that the respondent was too lazy to think about all the questions and just tickeda few to complete the survey task. Krosnick (1991) calls this behavior “satisficing.” In both the binary measure and the strict measure, 0s are treated as a response, anda repeated 0 across the two measurements is assumed to
Page 21 of 32
mean stability in response — although this is only partially the case, because it actually captures evasion behavior on the part of the respondent.Figure 3 shows that this is indeed the case. It shows thedistribution of responses across all continents across all attributes (left), and for the attribute “relaxing” only (right). The frequency of responses indicating that the object is not associated with the attribute (lighter grey) for all answer formats is similar; only the pick-any format has a much higher frequency. This effect is strongest for the attribute “relaxing,” where clearly thevast majority of respondents indicate that all destinations are relaxing. Despite this, using the pick-any format misleads the researcher to believe that in fact a reasonably high proportion (36%) of respondents does not associate the destinations with being relaxing, while for all other answer formats this proportion is 4–12 percent (including neutral answers).
Concurrent validity
Our research found that differences in concurrent validity were not significant (F = 1.00, df1 = 5, df2 = 54, p-value = 0.43). This is likely due to two factors: first, destination image is only one of many factors thatcan affect how desirable a destination is for a holiday for a respondent. Second, respondents may tend to associate more attributes with their preferred destination regardless of the answer format, which would then be the main reason for leading to correct predictions.
Page 22 of 32

Survey completion time
Table 7 provides results for survey completion times, including the median time taken by respondents to complete the survey in survey waves 1 and 2. In addition,the length of the interquartile range is provided as a measure of variation in parentheses. In survey wave 1, respondents were asked a larger number of questions because a section on their socio-demographics and generaltravel-related behaviour was included. In wave 2 they were only asked to complete the image questions. The second wave was therefore used for the comparative analysis.Results indicate that significant differences existed in completion times (Kruskal-Wallis χ2 = 235.1, df = 5, p-value < 0.0001). The pick-any measure emerged as the quickest. This is unsurprising, given that this format allows respondents to skip tasks without completing them properly because only a response in the affirmative requires them to tick a box in the survey. The second-quickest answer format was the forced-choice full binary measure. In our tests it was 13 percent quicker than the next-quickest answer format (the Likert five-point answerformat). This difference is statistically significant (Wilcoxon rank sum test: W = 6.66 ·108, p-value < 0.0001).The bipolar seven-point answer formats (Likert seven-point and semantic differential) took respondents the longest time to complete.
Page 23 of 32
Conclusions
A number of key conclusions can be drawn: 1) differences in concurrent validity across different
answer formats are not statistically significant; 2) the forced-choice full binary measure is the most
stable for all stability measures. This result confirms prior findings reported by Dolnicar and Grün (2007) on stability of brand image measures. Seven-point answer formats are the least stable whenthe strict stability measure is applied;
3) the pick-any answer format “invites” respondents to evade questions, thus leading to fewer stated object-attribute associations;
4) the pick any as well as the forced-choice full binary formats are quicker than any of the multi-category answer formats, and the bipolar seven-pointformats take the longest time to complete.
In light of these results, researchers conducting image studies generally, and more specifically in the context of touristic image studies, may need to rethink the currently dominant and generally accepted measurement approaches used by image measurement. The measure used most commonly in industry (the pick-any measure) producesmisleading results because it allows respondents to evaderesponding. The most common measure used by academics (the multi-category Likert scale) does not perform well on the strict stability measure and takes longer to complete. It is therefore recommended that researchers make increased use of the forced-choice full binary measure,
Page 24 of 32
because it performs better than competing approaches in terms of stability, and outperforms most other answer formats in terms of speed of completion.Note that the use of the forced-choice full binary answerformat does not have any disadvantages with respect to data analysis. Most commonly used statistical methods canbe applied to binary data: frequency counts for descriptive statistics and χ2-tests to test for an association between variables. Cluster analysis can be conducted if distance measures suitable for binary data (e.g. Jaccard distance) are used; analysis of variance ispossible if the brand image item is used as an independent variable; and correlation-based analyses suchas factor analysis and structural equation modeling are possible if polychoric correlations are employed.The experimental approach used in this study proved to beappropriate for the research problem at hand. An improvement that could be made in a follow-up study is tocollect a different dependent variable for the assessmentof concurrent validity. In the present study the test forconcurrent validity was based on correctly predicting which each respondent’s favorite continent is. Results interms of concurrent validity may be different if respondents were asked to nominate a set of continents they are considering or if they are asked to rank all continents by likelihood that each respondent will visit them in future. Another improvement would be to conduct the qualitative study, which was instrumental in determining the attributes, in all countries from which respondents for the quantitative study were sourced. Further studies are needed to explore the issue of measurement validity in empirical tourism research. With respect to destination image it would be interesting to
Page 25 of 32

investigate if the size of the destination entity influences results. Furthermore, comparative studies of empirical measures should be conducted for constructs other than image. Key constructs regularly investigated in tourism survey studies include satisfaction, intentions to return and loyalty. These constructs are different in nature to brand attribute associations and thus warrant separate investigation (Dolnicar & Grün, 2009). Another issue is that of scale development in empirical tourism research, which currently predominantlyfollows the traditional Churchill (1979) approach which has recently been questioned by a number of measurement researchers in marketing, most prominently Rossiter (2002, 2011) arguing that it puts Psychometrics before validity, often at the expense of validity.
Page 26 of 32
ReferencesBigne, J. Enrique, Sanchez, M. Isabel, and Javier
Sanchez. (2001). “Tourism Image, Evaluation Variables and After Purchase Behaviour: Inter-Relationship.” Tourism Management, 22: 607–616.
Churchill, G.A. Jr. (1979). “A paradigm for developing better measures of marketing constructs.” Journal of Marketing Research, 16(1): 64–73
Dolnicar, Sara and Bettina Grün. (2007). “Question Stability in Brand Image Measurement — Comparing Alternative Answer Formats and Accounting for Heterogeneity in Descriptive Models.” Australasian MarketingJournal, 15(2): 26–41.
Dolnicar, Sara and Bettina Grün. (2009). “Does One Size Fit All?—The Suitability of Answer Formats for Different Constructs Measured. Australasian Marketing Journal, 17(1), 58–64.
Dolnicar, Sara, Grün, Bettina and Friedrich Leisch. (2011). “Quick, Simple and Reliable: Forced Binary Survey Questions.” International Journal of Market Research, 53(2): 231–252.
Dolnicar, Sara and John R. Rossiter. (2008). “The Low Stability of Brand-Attribute Associations is Partly Dueto Measurement Factors.” International Journal of Research in Marketing, 25(2): 104–108.
Johnson, Michael, Lehmann, Donald, and Daniel Horne. (1990). “The Effects of Fatigue on Judgments of Interproduct Similarity.” International Journal of Research in Marketing, 7(1): 35–43.
Page 27 of 32
Keller, Kevin Lane. (1993). “Conceptualizing, Measuring, and Managing Customer-Based Brand Equity.” Journal of Marketing, 57(1): 1–22.
Krosnick, Jon A. (1991). “Response Strategies for Coping with the Cognitive Demands of Attitude Measures in Surveys.” Applied Cognitive Psychology, 5(3): 213–236.
Pike, Steve. (2002). “Destination Image Analysis — A Review of 142 Papers from 1973 to 2000.” Tourism Management, 23: 541–549.
Rossiter, John R. (2002). “The C-OAR-SE Procedure for Scale Development in Marketing.” International Journal of Research in Marketing, 19(4): 305-335.
Rossiter, John R. (2011). Measurement for the Social Sciences. The C-OAR-SE Method and Why it Must Replace Psychometrics. New York: Springer.
Suh, Yong K. and William C. Gartner (2004). “Perceptions in International Urban Tourism: An Analysis of Travellers to Seoul, Korea.” Journal of Travel Research, 43(1): 39–45.
Page 28 of 32
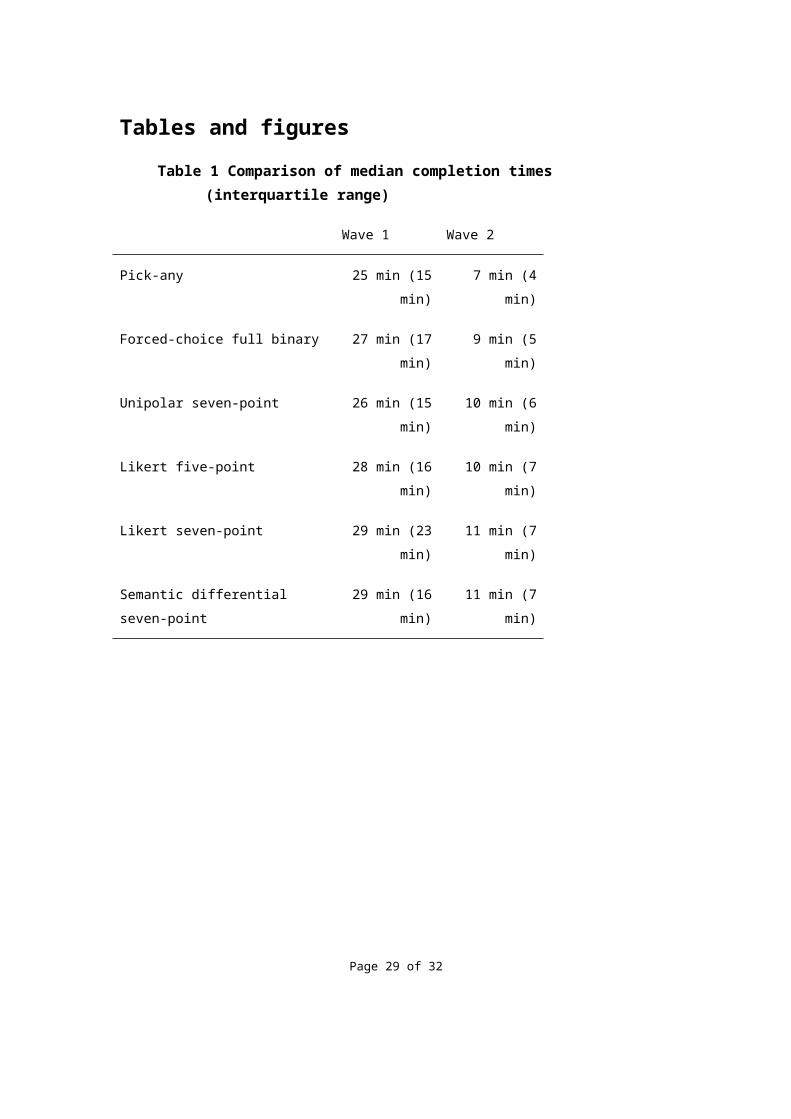
Tables and figuresTable 1 Comparison of median completion times
(interquartile range)
Wave 1 Wave 2
Pick-any 25 min (15min)
7 min (4min)
Forced-choice full binary 27 min (17min)
9 min (5min)
Unipolar seven-point 26 min (15min)
10 min (6min)
Likert five-point 28 min (16min)
10 min (7min)
Likert seven-point 29 min (23min)
11 min (7min)
Semantic differential seven-point
29 min (16min)
11 min (7min)
Page 29 of 32
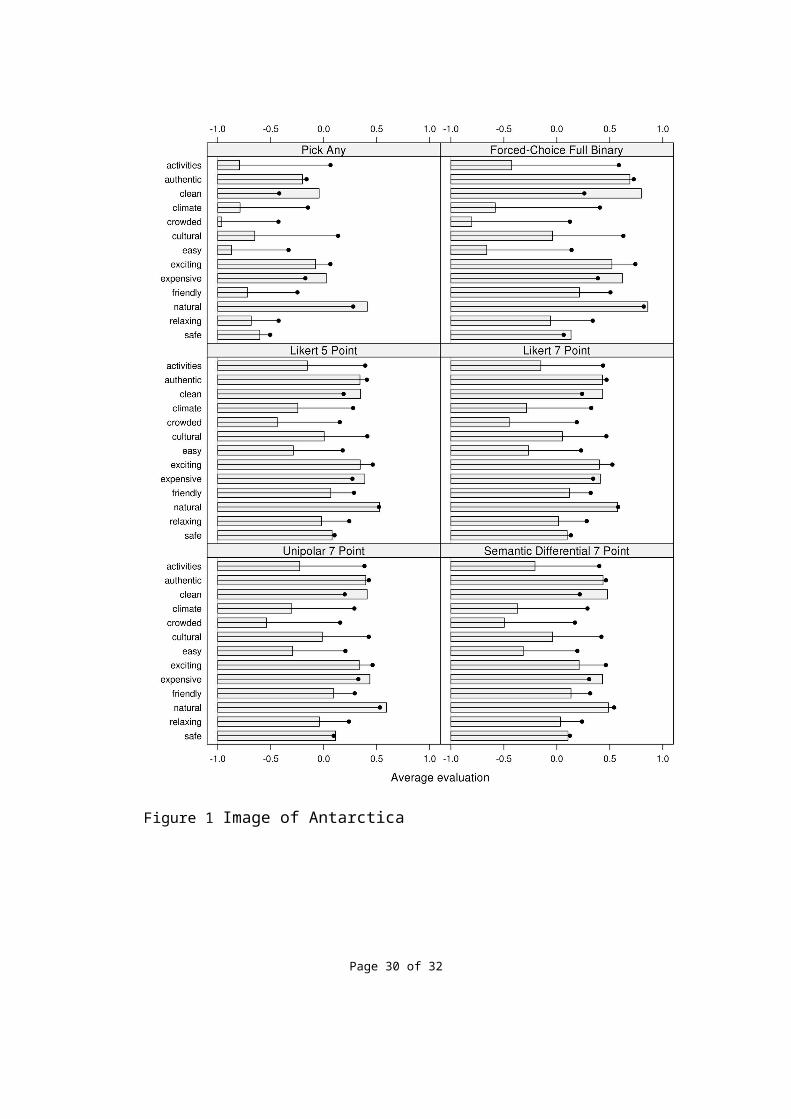
Figure 1 Image of Antarctica
Page 30 of 32
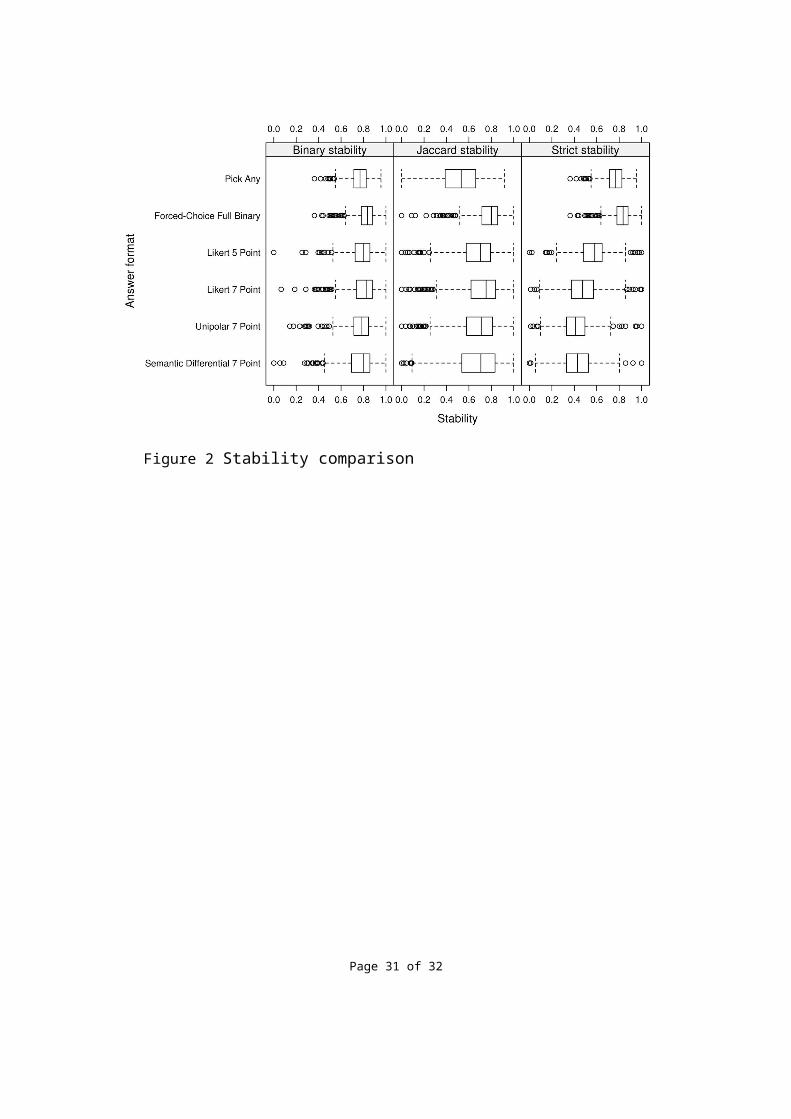
Figure 2 Stability comparison
Page 31 of 32
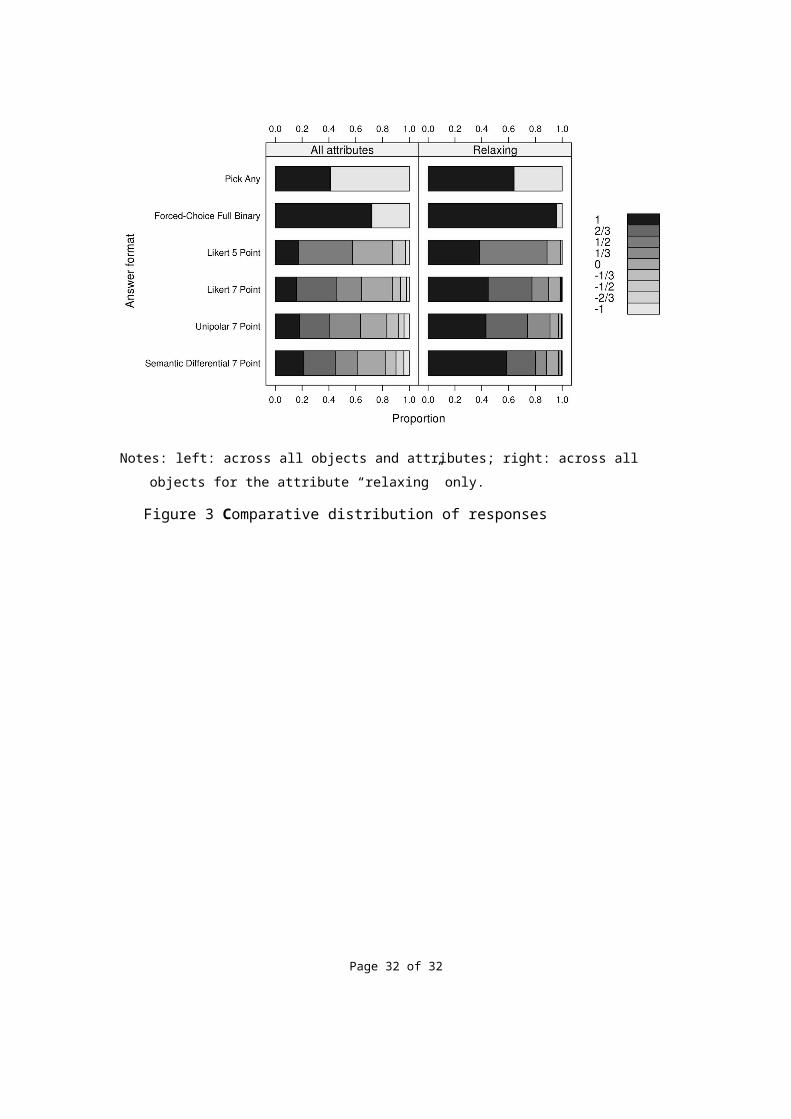
Notes: left: across all objects and attributes; right: across all objects for the attribute “relaxing” only.
Figure 3 Comparative distribution of responses
Page 32 of 32
Related Documents


![[NOIP-JPO] Procedures to JPO · The JPO application, which validly claims priority to multiple NOIP or direct PCT applications, or which is the divisional application validly based](https://static.cupdf.com/doc/110x72/6039855ee68fd879637d1412/noip-jpo-procedures-to-jpo-the-jpo-application-which-validly-claims-priority.jpg)