Validity in Measurements of Fricative Voicing: Evidence from Argentine Spanish Michael Stephen Gradoville Indiana University 1. Introduction The disciplinary boundary between laboratory phonology and sociolinguistics is becoming ever more blurred. For instance, some variationist studies recently carried out (e.g. Alba 2006, Brown 2008) have as their object of study not the social organization around particular linguistic variables, but rather issues of phonological representation and processing. Likewise, some recent studies that would probably more likely be classified as being in the domain of laboratory phonology due to their detailed acoustic analyses (e.g. Eddington 2011, Gahl 2008) use naturalistic data instead of highly controlled laboratory data that has been the primary data source in laboratory phonology. The push that is leading to this break-down of the disciplinary boundary comes from both sides. Eddington (2011: 2) sums up the rationale for using a detailed acoustic analysis in place of impressionistic coding by stating that it “removes the problem created when binary classifications are imposed on gradient data” and “[i]t also reduces possible experimenter bias, and allows the results of a study to be more easily replicated by other researchers.” Within laboratory phonology there is also a perceived need to look at both controlled and naturalistic data, with Face (2010) noting that certain issues of Spanish intonation were unknown until naturalistic data were examined. Eddington (2011) also rationalizes the use of spontaneous running speech rather than isolated words on the basis that the two may lead to different generalizations. In other words, the study of laboratory speech may not lead to a completely accurate account of the behavior of real speaker-hearers in real speech situations. With this shift in the field, with sociolinguists making greater use of instrumental acoustic measurements and laboratory phonologists making greater use of naturalistic speech data, comes the need to assess the validity of instrumental acoustic measurements of naturalistic speech data. Acoustic measures may be defined as constructs, or “abstraction[s] that cannot be observed directly” (Gay, Mills, & Airasian 2009: 600). We can and should certainly perform articulatory studies, which can directly account for articulation (see Colantoni & Kochetov this volume for an articulatory study of the sound examined here); however, articulatory studies cannot represent what occurs in more naturalistic speech due to their highly controlled nature. Therefore, if we wish to observe what was occurring in the vocal tract at the time of naturalistic speech we must use these indirect instrumental acoustic measures. However, while the methods used in instrumental studies are reported, the issues of validity of these instrumental measures are not a frequent topic of conversation within linguistics 1 . Consequently, the results of such studies may or may not be based on measures that accurately * The author is indebted to several people in the design of elements of this study: Manuel Díaz-Campos, Sandra Ortiz, and Erik Willis during the design phase of data collection; Natalia Amelotti, Alejandra Balestra, Vane Eirin, Stephen Fafulas, and Jorge Luis Torres in helping locate research participants; J. Clancy Clements, Kenneth de Jong, and Manuel Díaz-Campos for feedback on the analysis and design of the perception study; Silvina Bongiovanni, Stephen Fafulas, Sandra Ortiz, and Ronald Roosevelt for lending their ear in the perception task; and Lígia Bezerra for proofreading the manuscript. The author additionally thanks the audience of Laboratory Approaches to Romance Phonology and two anonymous reviewers for their questions and comments. All errors are the exclusive responsibility of the author. 1 A reviewer has pointed out that, although the linguistics literature only infrequently discusses issues of validity and reliability, this topic figures more prominently in speech signal processing circles (e.g. Fant 1960, Rabiner & Schafer 2011). © 2011 Michael Stephen Gradoville. Selected Proceedings of the 5th Conference on Laboratory Approaches to Romance Phonology, ed. Scott M. Alvord, 59-74. Somerville, MA: Cascadilla Proceedings Project.

Welcome message from author
This document is posted to help you gain knowledge. Please leave a comment to let me know what you think about it! Share it to your friends and learn new things together.
Transcript
Validity in Measurements of Fricative Voicing:Evidence from Argentine Spanish
Michael Stephen GradovilleIndiana University
1. Introduction
The disciplinary boundary between laboratory phonology and sociolinguistics is becoming ever more blurred. For instance, some variationist studies recently carried out (e.g. Alba 2006, Brown 2008) have as their object of study not the social organization around particular linguistic variables, but rather issues of phonological representation and processing. Likewise, some recent studies that would probably more likely be classified as being in the domain of laboratory phonology due to their detailed acoustic analyses (e.g. Eddington 2011, Gahl 2008) use naturalistic data instead of highly controlled laboratory data that has been the primary data source in laboratory phonology. The push that is leading to this break-down of the disciplinary boundary comes from both sides. Eddington (2011: 2) sums up the rationale for using a detailed acoustic analysis in place of impressionistic coding by stating that it “removes the problem created when binary classifications are imposed on gradient data” and “[i]t also reduces possible experimenter bias, and allows the results of a study to be more easily replicated by other researchers.” Within laboratory phonology there is also a perceived need to look at both controlled and naturalistic data, with Face (2010) noting that certain issues of Spanish intonation were unknown until naturalistic data were examined. Eddington (2011) also rationalizes the use of spontaneous running speech rather than isolated words on the basis that the two may lead to different generalizations. In other words, the study of laboratory speech may not lead to a completely accurate account of the behavior of real speaker-hearers in real speech situations.
With this shift in the field, with sociolinguists making greater use of instrumental acoustic measurements and laboratory phonologists making greater use of naturalistic speech data, comes the need to assess the validity of instrumental acoustic measurements of naturalistic speech data. Acoustic measures may be defined as constructs, or “abstraction[s] that cannot be observed directly” (Gay, Mills, & Airasian 2009: 600). We can and should certainly perform articulatory studies, which can directly account for articulation (see Colantoni & Kochetov this volume for an articulatory study of the sound examined here); however, articulatory studies cannot represent what occurs in more naturalistic speech due to their highly controlled nature. Therefore, if we wish to observe what was occurring in the vocal tract at the time of naturalistic speech we must use these indirect instrumental acoustic measures. However, while the methods used in instrumental studies are reported, the issues of validity of these instrumental measures are not a frequent topic of conversation within linguistics1. Consequently, the results of such studies may or may not be based on measures that accurately
* The author is indebted to several people in the design of elements of this study: Manuel Díaz-Campos, Sandra Ortiz, and Erik Willis during the design phase of data collection; Natalia Amelotti, Alejandra Balestra, Vane Eirin, Stephen Fafulas, and Jorge Luis Torres in helping locate research participants; J. Clancy Clements, Kenneth de Jong, and Manuel Díaz-Campos for feedback on the analysis and design of the perception study; Silvina Bongiovanni, Stephen Fafulas, Sandra Ortiz, and Ronald Roosevelt for lending their ear in the perception task; and Lígia Bezerra for proofreading the manuscript. The author additionally thanks the audience of Laboratory Approaches to Romance Phonology and two anonymous reviewers for their questions and comments. All errors are the exclusive responsibility of the author.
1 A reviewer has pointed out that, although the linguistics literature only infrequently discusses issues of validity and reliability, this topic figures more prominently in speech signal processing circles (e.g. Fant 1960, Rabiner & Schafer 2011).
© 2011 Michael Stephen Gradoville. Selected Proceedings of the 5th Conference on Laboratory Approaches toRomance Phonology, ed. Scott M. Alvord, 59-74. Somerville, MA: Cascadilla Proceedings Project.
represent the activity in the vocal tract they purport to represent.The purpose of this study is to assess different aspects of validity in the instrumental acoustic
measurement of voicing in the Buenos Aires palato-alveolar fricative /ʒ/2. Sociolinguistic research (Chang 2008, Fontanella de Weinberg 1979, Rohena-Madrazo to appear, Wolf 1984, Wolf & Jiménez 1979) has shown that in the Spanish spoken in the Río de la Plata region, the palato-alveolar fricative has been undergoing a process of devoicing, whereby the formerly voiced [ʒ] is with ever greater frequency being pronounced as [ʃ]. The sociolinguistic literature has shown that the devoicing is socially stratified in the region. Likewise, a usage-based account of the topic has demonstrated that phonetic context and lexical frequency play a role in the diffusion of the change (Díaz-Campos & Gradoville 2011). However, many of these studies have been carried out using impressionistic coding methods that have categorically distinguished two or three degrees of voicing. As has become a trend in the field, recent studies (e.g. Chang 2008, Rohena-Madrazo to appear) have eschewed impressionistic coding methods in favor of instrumental acoustic techniques that can account for the gradient nature of fricative voicing. No evaluation of the validity and reliability of the instrumental acoustic measures or their relation to the previously used impressionistic coding methods has been carried out and this study intends to fill that gap.
2. Validity
Validity may be defined as “the appropriateness, correctness, meaningfulness, and usefulness of the specific inferences researchers make based on the data they collect” (Fraenkel & Wallen 2008: 148). Likewise, reliability may be defined as the “consistency of the scores obtained” (Fraenkel & Wallen 2008: 154). Before drawing conclusions about data based upon any measurement, it is important to consider issues of validity and reliability in the measurements taken. Should a measurement poorly represent a given variable, inappropriate generalizations could be made.
According to Fraenkel & Wallen (2008: 148), the three main types of evidence for validity are content-related, criterion-related, and construct-related. Content-related evidence of validity addresses whether an instrument “logically get[s] at the intended variable” (Fraenkel & Wallen 2008: 148). For example, since vocal cord vibration produces “a complex periodic wave” (Johnson 1997: 63), we would expect that a measurement of acoustic periodicity to correlate with voicing. Content-related evidence of validity will be discussed in section 4 when the procedures surrounding each measurement are presented.
Criterion-related evidence of validity addresses “the relationship between scores obtained using the instrument and scores obtained using one or more other instruments or measures (often called a criterion)” (Fraenkel & Wallen 2008: 148). This is where it is important to see how two measurements purporting to measure the same thing correlate in actual practice, since if they do indeed measure the same thing we would expect a high correlation. Criterion-related evidence of validity will be discussed in sections 5, 6, and 7. Section 5 will discuss correlations between the acoustic measures, while section 6 will discuss the relationship between the acoustic measures and the perceptions of linguistically-trained listeners. Section 7 will discuss the values assigned by the measurements to some example tokens and how they correspond to another form of measurement, the visual inspection of the spectrogram.
Construct-related evidence of validity addresses “[t]he degree to which an instrument measures an intended hypothetical psychological, or nonobservable trait” (Fraenkel & Wallen 2008: G-2). In the context of naturalistic speech acts, vocal cord vibration amounts to a nonobservable trait, at least not directly. A future study should test this in a laboratory setting where vocal cord vibration is more directly observable, but given the emphasis on naturalistic data here, it will not be tested in this study.
This study tests a variety of acoustic measures for their validity in representing gradient voicing in the fricative /ʒ/ to be used as a dependent variable in statistical analyses of semi-spontaneous speech.
2 In this paper I use the short-hand /ʒ/ to represent the Río de la Plata palato-alveolar fricative sound category. However, this should not be interpreted as taking a position on the underlying representation of this sound category, since I do not assume the existence of underlying representations.
60
Additionally, these acoustic measures will be compared to the perception of linguistically-trained individuals to establish a relationship between data obtained by acoustic measurements and data obtained by impressionistic coding, as has been a mainstay in many linguistic studies.
This study will show that, while all the measurements tested might have some evidence of content-related validity as acoustic correlates of gradient fricative voicing, not all measurements are equally valid, given their vulnerability to other elements of the speech stream. In particular, criterion-related evidence of validity will show that, while none of the measurements assessed is likely perfect, some measurements actually represent gradient fricative voicing quite poorly. This study will also show that, while the reliability of linguistically-trained perception of gradient fricative voicing might be called into question, it does provide us with some evidence as to which instrumental acoustic measures of gradient fricative voicing provide the most reliable results.
3. Data for acoustic analysis
This study makes use of recordings of Buenos Aires Spanish to test the acoustic measures under investigation. The participants in the recordings include nine native speakers of Buenos Aires Spanish from the neighborhoods of Belgrano, Palermo, and Recoleta. They engaged in a conversation with the researcher after which they were asked to narrate two wordless children's picture books (Lehman 2007, Ormerod 2005) and to read aloud a paragraph (see Appendix A)3. The data used here come from the narrations and the paragraph reading. The participants were recorded in Buenos Aires using a Sony PCM-D50 solid state digital recorder and a Shure WH20 head-mounted microphone. The sampling rate was 44.1 kHz with 24-bit quantization.
The tokens analyzed were limited to word-medial, intervocalic tokens to constrain the variability of the dataset. A total of 170 tokens were analyzed. Nine tokens were excluded: four due to interference in the recording, one due to overlap with the researcher, two because of the attempted use of the palatal lateral [ʎ] in the reading task, and two tokens of ella (the most frequent word in the data set) to bring the total to an even 170. The frication of each token of /ʒ/ was delimited in Praat using text grids (Boersma & Weenink 2008). The beginning points and end points were determined through an examination of the spectrogram. In particular a block of uninterrupted aperiodic energy extending past 10,000 Hz was used as the major criterion for determining where the boundaries of the token of /ʒ/ were.
4. Procedure and content-related evidence of validity
All of the measures addressed in this paper have some degree of content-related evidence of validity, in that they might logically be believed to correlate with voicing. This evidence of validity will be touched on throughout this section, since it makes sense to explain why a given measurement should be valid along with how the measurement was obtained. Voicing in fricatives may be approached in a variety of ways. Pulse-based, harmonicity, intensity-based, center of gravity, and traditional impressionistic approaches will be discussed in the following sections.
4.1. Pulse-based
The Praat software has a function designed to give a voice report which is primarily based on pulses. Many factors are included in the report, but the primary output is the “[f]raction of locally unvoiced frames”. As such, higher percentages correspond with a lesser degree of voicing. The voice report using the default parameters on the tokens, hereafter VR0, was taken for all 170 tokens as they
3 A reviewer has commented that the elicitation paragraph should look odd to native speakers of Spanish. A native speaker of Buenos Aires Spanish collaborated in writing the paragraph and none of the participants made any comment to the effect that it sounded odd, although on a couple of occasions the participant replaced one word with another (e.g. así for allí).
61
had been delimited in text grids4. A second measurement using the voice report, hereinafter referred to as VR1, was also taken with the pitch settings modified so that the maximum pitch was set at 250 Hz. In section 7 it will become clear why it was necessary to take a second voice report measurement.
4.2. Harmonicity
Another logical approach to voicing is to use Praat's harmonicity object, which according to Praat's manual “represents the degree of acoustic periodicity, also called the Harmonics-to-Noise Ratio (HNR). Harmonicity is expressed in dB: if 99% of the energy of the signal is in the periodic part, and 1% is noise, the HNR is 10*log10(99/1) = 20 dB. A HNR of 0 dB means that there is equal energy in the harmonics and in the noise”. The details of its calculation can be found in Boersma (1993). Harmonicity would seem to be a good measurement of voicing since vocal cord vibration produces “a complex periodic wave” (Johnson 1997: 63).
Each token was extracted to a separate sound object and a cross-correlation harmonicity object was created, from which the mean harmonicity was calculated, hereafter the HNR. Based on the discussion from Praat's manual, higher values for harmonicity should correspond with more voicing.
4.3. Intensity-based
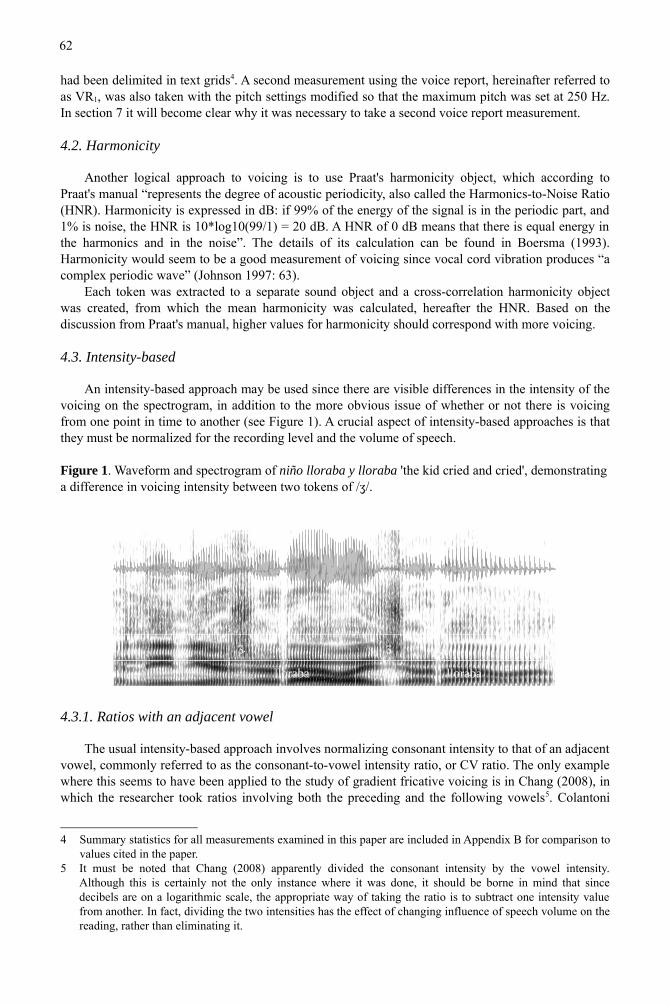
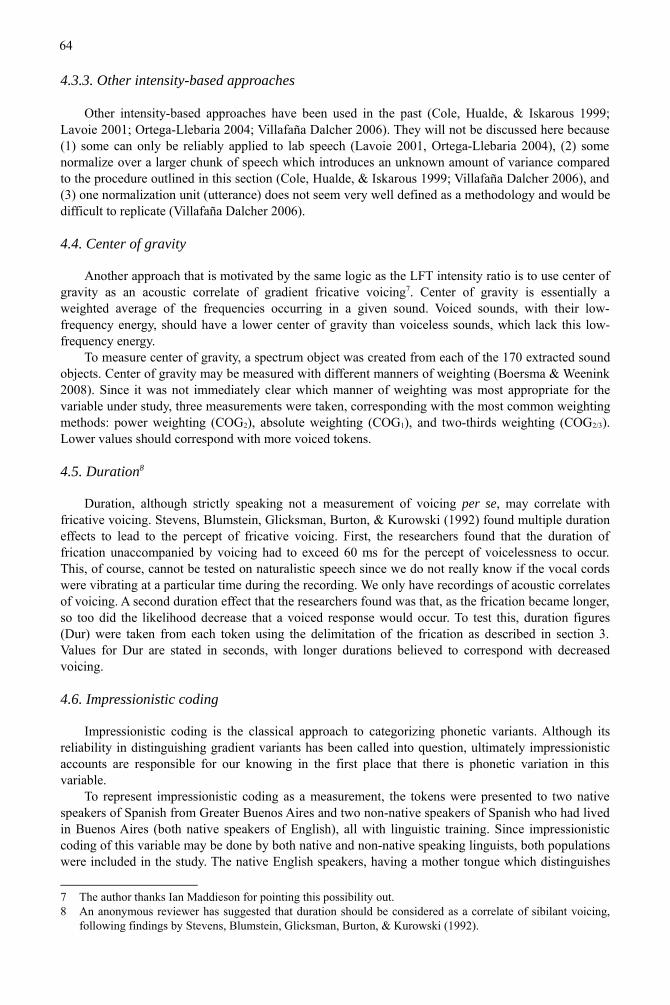
An intensity-based approach may be used since there are visible differences in the intensity of the voicing on the spectrogram, in addition to the more obvious issue of whether or not there is voicing from one point in time to another (see Figure 1). A crucial aspect of intensity-based approaches is that they must be normalized for the recording level and the volume of speech.
Figure 1. Waveform and spectrogram of niño lloraba y lloraba 'the kid cried and cried', demonstrating a difference in voicing intensity between two tokens of /ʒ/.
4.3.1. Ratios with an adjacent vowel
The usual intensity-based approach involves normalizing consonant intensity to that of an adjacent vowel, commonly referred to as the consonant-to-vowel intensity ratio, or CV ratio. The only example where this seems to have been applied to the study of gradient fricative voicing is in Chang (2008), in which the researcher took ratios involving both the preceding and the following vowels5. Colantoni
4 Summary statistics for all measurements examined in this paper are included in Appendix B for comparison to values cited in the paper.
5 It must be noted that Chang (2008) apparently divided the consonant intensity by the vowel intensity. Although this is certainly not the only instance where it was done, it should be borne in mind that since decibels are on a logarithmic scale, the appropriate way of taking the ratio is to subtract one intensity value from another. In fact, dividing the two intensities has the effect of changing influence of speech volume on the
Z Z
lloraba lloraba
reading, rather than eliminating it.
62
(2006) also used a CV ratio involving the following vowel in her study of the assibilation of /j/ and its contrast with rhotics in the Argentine provinces of Corrientes and San Juan.
A CV ratio has been used in the study of other speech sounds, as well. For example, Lewis (2001) used CV ratios involving both adjacent vowels in his study of the weakening of Spanish voiceless stops. This approach has been subsequently applied to all Spanish stops (Colantoni & Marinescu 2010) as well as Spanish voiced stops (Eddington 2011, Kaplan 2010).
It is important to note what Ladefoged (2003: 91-92) says about the intensity of vowels:Different speech sounds have different intensities, even when they have been pronounced with the same degree of stress. Other things being equal, voiced sounds have greater intensities than voiceless sounds. For vowel sounds, the intensity is largely proportional to the degree of opening of the lips... [T]he words two and three have about 6 dB less intensity than four, in which the mouth is more open. Other things being equal, the vowel in four is about twice as loud as the vowels in three and two.
To paraphrase, all things being equal, low vowels will have higher intensities than high vowels. Likewise, Hualde (2005: 245) states of Spanish vowels that intensity “plays some role in enhancing the prominence of stressed syllables.” As such, by normalizing to a preceding or following vowel, we are not normalizing to a 'constant' sound. The measurement obtained will be a function of the vowel to which the consonant was compared. In a sense, we are exchanging one source of variance (recording level/speech volume) for another (vowel intensity). This issue will be demonstrated later on in the paper.
The intensity values for this test were taken for the middle 50 ms of each vowel and consonant. The intensity value at the midpoint of each was also taken, but it was not found to make larger than about a 1 dB difference for the vowels. In a few extreme cases for the consonant, the 50 ms measurement yielded a value more than 2 dB louder than that of the midpoint value. In general, the values seem comparable and the 50 ms measure was selected to more accurately characterize the entire consonant. Ratios were taken by subtracting the intensity of the flanking vowel from that of the fricative. This produced two ratios, the fricative-to-left-vowel intensity ratio (FTL) and the fricative-to-right-vowel intensity ratio (FTR).
4.3.2. A novel approach: A ratio of low frequency-to-total intensity
An approach that, to my knowledge has never been applied to the study of gradient fricative voicing is to take the ratio of low frequency intensity to that of the entire sound. The logic behind this approach is that voicing is only ever going to happen at low frequencies and the frication from /ʒ/ is only ever going to happen at higher frequencies. Such a ratio tells us how much of the intensity for the fricative is accounted for by low frequency intensity, which in general will be voicing if the recording is relatively free of extraneous noise. This approach to fricative voicing has not been previously used, although it does share certain common elements with the method used by Silbert & de Jong (2008).
Each of the 170 tokens of /ʒ/ was extracted as an object in Praat as delimited in Section 3. A pass Hann band filter was applied to the extracted sound object with the following parameters: from frequency = 0 Hz; to frequency = 900 Hz6; smoothing = 100 Hz. This left a filtered sound with the sound from 0 Hz to 900 Hz. The mean intensity was then taken from the unfiltered sound and the filtered sound. The former was subtracted from the latter to yield an intensity ratio (LFT). Values closer to zero are predicted to be more voiced, whereas values farther from zero are predicted to be more voiceless.
6 The upper bound of 900 Hz was selected because it was deemed to yield the most comparable results, including the fundamental frequency and the first formant (if either exist), but unlikely to include the second formant of any speaker. It would be impossible to choose one frequency as the upper bound to only include the fundamental frequency because some speakers with high voices could have a fundamental frequency that would be an entirely plausible first formant frequency for a high vowel for a speaker with a low voice. If different upper bounds were chosen for different speakers in order to only include the fundamental frequency, this measurement would be less comparable across speakers.
63
4.3.3. Other intensity-based approaches
Other intensity-based approaches have been used in the past (Cole, Hualde, & Iskarous 1999; Lavoie 2001; Ortega-Llebaria 2004; Villafaña Dalcher 2006). They will not be discussed here because (1) some can only be reliably applied to lab speech (Lavoie 2001, Ortega-Llebaria 2004), (2) some normalize over a larger chunk of speech which introduces an unknown amount of variance compared to the procedure outlined in this section (Cole, Hualde, & Iskarous 1999; Villafaña Dalcher 2006), and (3) one normalization unit (utterance) does not seem very well defined as a methodology and would be difficult to replicate (Villafaña Dalcher 2006).
4.4. Center of gravity
Another approach that is motivated by the same logic as the LFT intensity ratio is to use center of gravity as an acoustic correlate of gradient fricative voicing7. Center of gravity is essentially a weighted average of the frequencies occurring in a given sound. Voiced sounds, with their low-frequency energy, should have a lower center of gravity than voiceless sounds, which lack this low-frequency energy.
To measure center of gravity, a spectrum object was created from each of the 170 extracted sound objects. Center of gravity may be measured with different manners of weighting (Boersma & Weenink 2008). Since it was not immediately clear which manner of weighting was most appropriate for the variable under study, three measurements were taken, corresponding with the most common weighting methods: power weighting (COG2), absolute weighting (COG1), and two-thirds weighting (COG2/3). Lower values should correspond with more voiced tokens.
4.5. Duration8
Duration, although strictly speaking not a measurement of voicing per se, may correlate with fricative voicing. Stevens, Blumstein, Glicksman, Burton, & Kurowski (1992) found multiple duration effects to lead to the percept of fricative voicing. First, the researchers found that the duration of frication unaccompanied by voicing had to exceed 60 ms for the percept of voicelessness to occur. This, of course, cannot be tested on naturalistic speech since we do not really know if the vocal cords were vibrating at a particular time during the recording. We only have recordings of acoustic correlates of voicing. A second duration effect that the researchers found was that, as the frication became longer, so too did the likelihood decrease that a voiced response would occur. To test this, duration figures (Dur) were taken from each token using the delimitation of the frication as described in section 3. Values for Dur are stated in seconds, with longer durations believed to correspond with decreased voicing.
4.6. Impressionistic coding
Impressionistic coding is the classical approach to categorizing phonetic variants. Although its reliability in distinguishing gradient variants has been called into question, ultimately impressionistic accounts are responsible for our knowing in the first place that there is phonetic variation in this variable.
To represent impressionistic coding as a measurement, the tokens were presented to two native speakers of Spanish from Greater Buenos Aires and two non-native speakers of Spanish who had lived in Buenos Aires (both native speakers of English), all with linguistic training. Since impressionistic coding of this variable may be done by both native and non-native speaking linguists, both populations were included in the study. The native English speakers, having a mother tongue which distinguishes
7 The author thanks Ian Maddieson for pointing this possibility out.8 An anonymous reviewer has suggested that duration should be considered as a correlate of sibilant voicing,
following findings by Stevens, Blumstein, Glicksman, Burton, & Kurowski (1992).
64
the phones [ʒ] and [ʃ] would be expected to more reliably distinguish the two phones than the two native Spanish speakers, for whose mother tongue these two sounds belong to a single sound category.
The participants were presented with the 170 tokens from the dataset in random order. The tokens were presented in word-sized sound files in seventeen groups of ten tokens each. In the interest of comparability, the participants were allowed two opportunities to listen to the token before they moved onto the next token. The participants were told to make a forced choice between voiced and voiceless and were given a continuous scale to indicate their degree of certainty in their choice.
Table 1 presents the percentages of the tokens on which each pair of participants agreed. As we can see, no pair of participants agreed more than 82.4% of the time, which is lower than, for example the inter-rater reliability reported in Brown (2008: 48), who reported an average of 91.0% inter-rater reliability.
Table 1. Rate of agreement between each pair of linguistically-trained individuals.
The low inter-rater reliability may be due to the nature of fricative voicing, which is likely more gradient acoustically than /s/ reduction. Nevertheless, it is more than a little disconcerting that all four participants gave precisely the same judgment only 48.2% of the time9. The task may have affected the rate of agreement, since the participants were only allowed to hear each token twice, while in real life they would have been able to repeat difficult tokens as many times as they saw fit. Given the low total agreement, the comparison of the impressionistic coding with the instrumental acoustic measures is based on only the tokens where at least three participants agreed on the judgment (87.6% of the tokens; 149/170).
5. Criterion-related validity: Correlations between instrumental measures
During the analysis of the correlations between the different measures, it became clear that some of the measures related better with a logarithmic transformation (LFT, COG2). Table 2 presents the correlation coefficients between the different measures. Aside from the expected strong relationships between VR0 and VR1 as well as COG2 and log(COG2), the strongest relationships we can observe are between log(-LFT) and log(COG2) followed by log(-LFT) and COG2. This is not surprising since LFT and COG2 generally get at a similar issue, which is that of low-frequency energy. VR0 and VR1
correlate most strongly with log(-LFT) and log(COG2), suggesting that the latter two are best viewed with this logarithmic transformation.
HNR also seems to correlate with both voice report measures, LFT, and COG2. This relationship is weaker than those measurements are with each other. A scatterplot of HNR with LFT reveals outliers in the relationship, which correspond to tokens with periodic energy in the frication (see section 7). Aside from FTL and FTR, Dur seems to have the weakest correlation with the other variables, although its correlations are still generally statistically significant, meaning that there is some degree of correspondence between them. What is notable about FTL and FTR's correlations with other measures, on the other hand, is that, for the most part, they are not statistically significant. In fact, except for Dur's correlation with HNR, the correlations that are not statistically significant always involve FTL or FTR.
9 Jeffrey Steele has rightly pointed out that NNS1 has a rate of agreement considerably lower than the other participants. This did not go unnoticed and the possibility of replacing NNS1's judgments was considered. The rate of agreement between the other three participants, however, was only 69.4%. As such, the overall rate of agreement is not particularly high even when we leave out NNS1. Replacing NNS1's judgments would likely not improve the overall rate of agreement very much, and the fact that some listeners may be less able to discriminate fricative voicing is a real issue when we discuss impressionistic coding. Because of this, it was decided to let the result stand.
NS175.3% NS267.6% 59.4% NNS182.4% 81.2% 66.4% NNS2
65
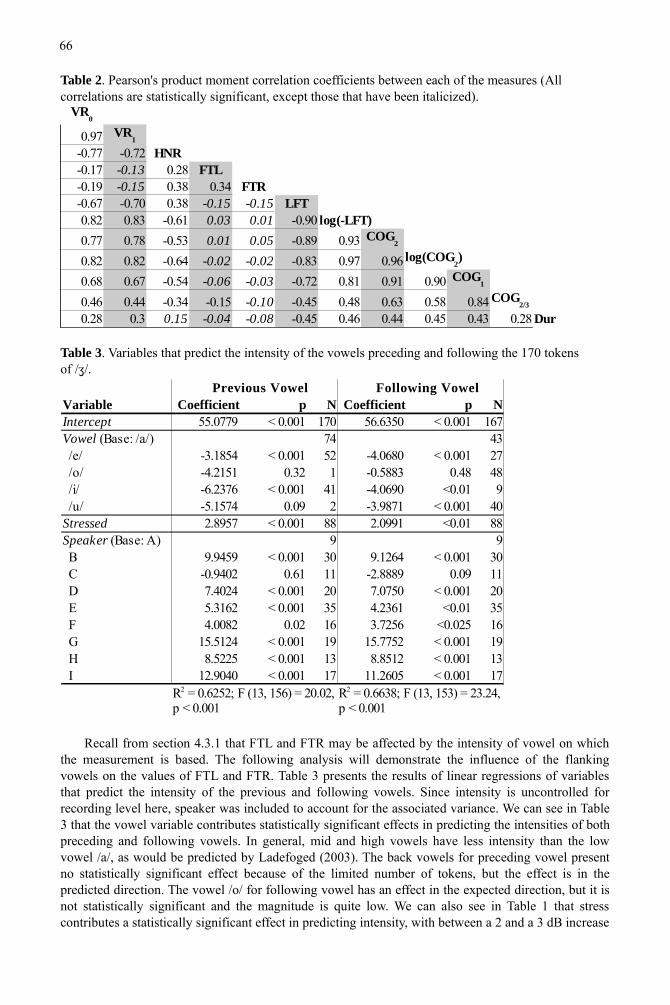
Table 2. Pearson's product moment correlation coefficients between each of the measures (All correlations are statistically significant, except those that have been italicized).
Table 3. Variables that predict the intensity of the vowels preceding and following the 170 tokens of /ʒ/.
Recall from section 4.3.1 that FTL and FTR may be affected by the intensity of vowel on which the measurement is based. The following analysis will demonstrate the influence of the flanking vowels on the values of FTL and FTR. Table 3 presents the results of linear regressions of variables that predict the intensity of the previous and following vowels. Since intensity is uncontrolled for recording level here, speaker was included to account for the associated variance. We can see in Table 3 that the vowel variable contributes statistically significant effects in predicting the intensities of both preceding and following vowels. In general, mid and high vowels have less intensity than the low vowel /a/, as would be predicted by Ladefoged (2003). The back vowels for preceding vowel present no statistically significant effect because of the limited number of tokens, but the effect is in the predicted direction. The vowel /o/ for following vowel has an effect in the expected direction, but it is not statistically significant and the magnitude is quite low. We can also see in Table 1 that stress contributes a statistically significant effect in predicting intensity, with between a 2 and a 3 dB increase
0.97-0.77 -0.72 HNR-0.17 -0.13 0.28 FTL-0.19 -0.15 0.38 0.34 FTR-0.67 -0.70 0.38 -0.15 -0.15 LFT0.82 0.83 -0.61 0.03 0.01 -0.90 log(-LFT)
0.77 0.78 -0.53 0.01 0.05 -0.89 0.93
0.82 0.82 -0.64 -0.02 -0.02 -0.83 0.97 0.96
0.68 0.67 -0.54 -0.06 -0.03 -0.72 0.81 0.91 0.90
0.46 0.44 -0.34 -0.15 -0.10 -0.45 0.48 0.63 0.58 0.840.28 0.3 0.15 -0.04 -0.08 -0.45 0.46 0.44 0.45 0.43 0.28
VR0
VR1
COG2
log(COG2)
COG1
COG2/3
Dur
Previous Vowel Following VowelVariable Coefficient p N Coefficient p NIntercept 55.0779 < 0.001 170 56.6350 < 0.001 167
74 43 /e/ -3.1854 < 0.001 52 -4.0680 < 0.001 27 /o/ -4.2151 0.32 1 -0.5883 0.48 48 /i/ -6.2376 < 0.001 41 -4.0690 <0.01 9 /u/ -5.1574 0.09 2 -3.9871 < 0.001 40Stressed 2.8957 < 0.001 88 2.0991 <0.01 88
9 9 B 9.9459 < 0.001 30 9.1264 < 0.001 30 C -0.9402 0.61 11 -2.8889 0.09 11 D 7.4024 < 0.001 20 7.0750 < 0.001 20 E 5.3162 < 0.001 35 4.2361 <0.01 35 F 4.0082 0.02 16 3.7256 <0.025 16 G 15.5124 < 0.001 19 15.7752 < 0.001 19 H 8.5225 < 0.001 13 8.8512 < 0.001 13 I 12.9040 < 0.001 17 11.2605 < 0.001 17
Vowel (Base: /a/)
Speaker (Base: A)
R2 = 0.6252; F (13, 156) = 20.02, p < 0.001
R2 = 0.6638; F (13, 153) = 23.24, p < 0.001
66
for stress, consistent with what Hualde (2005) says. As a result of stress and height differences between the beginning and following vowels, using one or the other to normalize consonant intensity may yield different results. Table 4 shows the summary statistics for the ratio of the intensity of the previous vowel to that of the following vowel. The statistics of both regular values and absolute values are presented to show that either vowel may have much greater intensity than the other and how large the differences are regardless of which vowel has greater intensity. We can see that the absolute maximum difference between the vowels in the dataset is 16.67 dB, which is quite high, certainly enough to influence results considerably. On average, the intensity difference between any pair of vowels in the dataset is 4.47 dB, which is not trivial.
Table 4. Summary statistics of the intensity ratio of the previous vowel to the following vowel for the 167 tokens. (positive values for regular row indicate that the intensity of the first vowel was greater than that of the second)
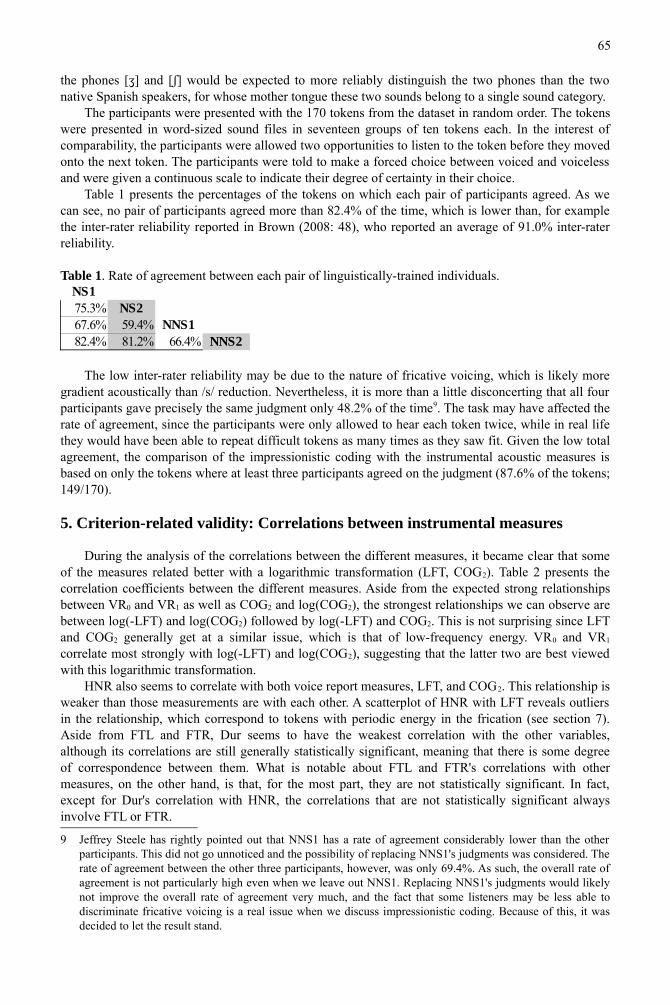
Figure 2 shows an example of a token where the difference in intensity between the preceding and following vowels is notably high. This token is not the most extreme example in the dataset, but it is above the third quartile for absolute differences. Of note about this token is that the sound preceding /a/ is /s/, which in Buenos Aires Spanish occasionally seems to reduce an adjacent vowel when the vowel is in contact with another voiceless sibilant, in this case [ʃ]10.
Figure 2. Waveform, spectrogram, and intensity curve of desayuno 'breakfast', demonstrating a previous vowel 11.51 dB quieter than the following vowel.
Figure 3. Boxplot of the intensity ratio of the previous vowel to the following vowel organized by the vowel height of each vowel. (H=high; M=mid; L=low)
Figure 3 presents a boxplot of the intensity ratio of the previous vowel to the following vowel, classified by height pattern. As in Table 4, positive values indicate that the first vowel has greater intensity than the second. Table 5 summarizes the predictions that would be made based on what is
10 This effect may not be unlike what has been reported for highland Mexican and Andean varieties where unstressed vowels may reduce in contact with two voiceless sounds, particularly sibilants (e.g. pues, entonces). More research on this particular phenomenon is warranted.
Mean Std. Dev. Minimum Median MaximumRegular -0.77 5.51 -13.28 -4.62 -0.58 3.45 16.67
Absolute Value 4.47 3.30 0.01 1.95 3.71 6.08 16.67
1st Q 3rd Q
S
desayuno
67
known about the relationship between vowel height and acoustic intensity and offers explanations for why some of the data in Figure 3 do not match those predictions. For the most part, the predictions are borne out in the data, although we must note that there is considerable within-category variation.
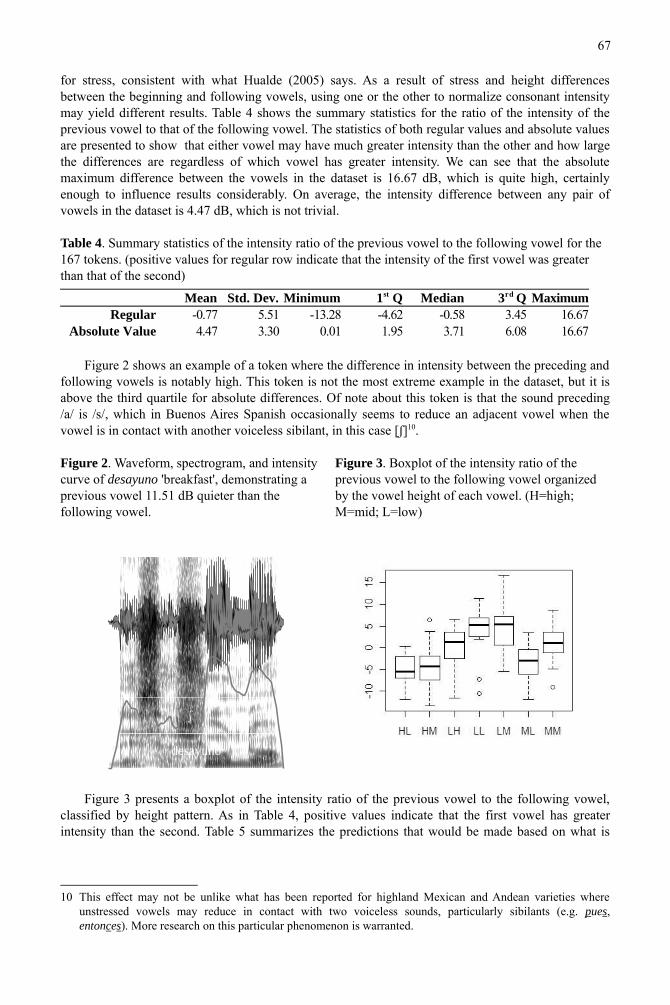
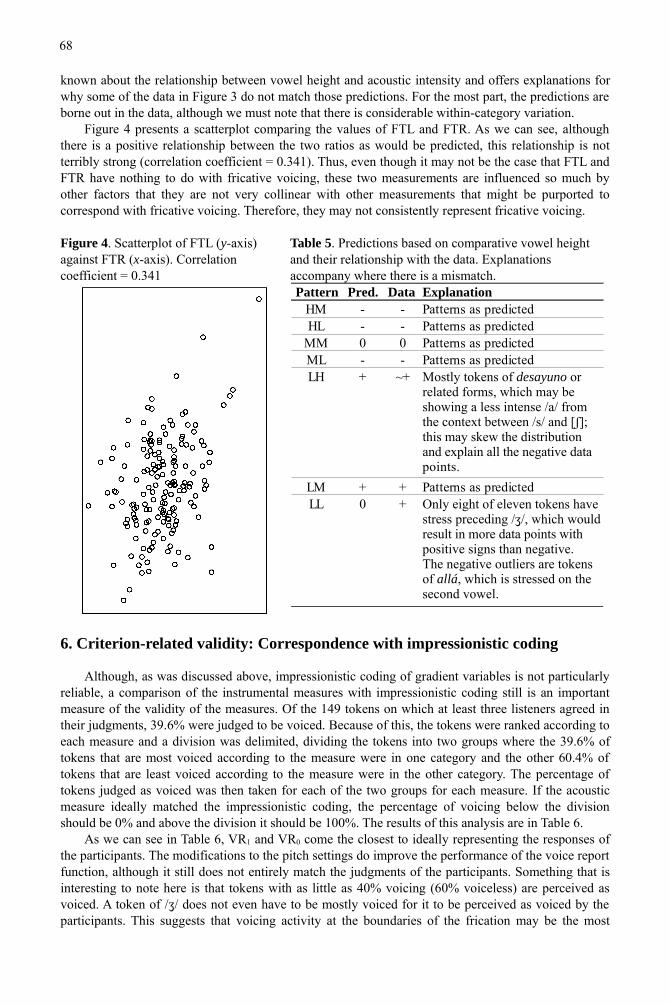
Figure 4 presents a scatterplot comparing the values of FTL and FTR. As we can see, although there is a positive relationship between the two ratios as would be predicted, this relationship is not terribly strong (correlation coefficient = 0.341). Thus, even though it may not be the case that FTL and FTR have nothing to do with fricative voicing, these two measurements are influenced so much by other factors that they are not very collinear with other measurements that might be purported to correspond with fricative voicing. Therefore, they may not consistently represent fricative voicing.
Figure 4. Scatterplot of FTL (y-axis) against FTR (x-axis). Correlation coefficient = 0.341
Table 5. Predictions based on comparative vowel height and their relationship with the data. Explanations accompany where there is a mismatch.Pattern Pred. Data Explanation
HM - - Patterns as predictedHL - - Patterns as predicted
MM 0 0 Patterns as predictedML - - Patterns as predictedLH + ~+
LM + + Patterns as predictedLL 0 +
Mostly tokens of desayuno or related forms, which may be showing a less intense /a/ from the context between /s/ and [ʃ]; this may skew the distribution and explain all the negative data points.
Only eight of eleven tokens have stress preceding /ʒ/, which would result in more data points with positive signs than negative. The negative outliers are tokens of allá, which is stressed on the second vowel.
6. Criterion-related validity: Correspondence with impressionistic coding
Although, as was discussed above, impressionistic coding of gradient variables is not particularly reliable, a comparison of the instrumental measures with impressionistic coding still is an important measure of the validity of the measures. Of the 149 tokens on which at least three listeners agreed in their judgments, 39.6% were judged to be voiced. Because of this, the tokens were ranked according to each measure and a division was delimited, dividing the tokens into two groups where the 39.6% of tokens that are most voiced according to the measure were in one category and the other 60.4% of tokens that are least voiced according to the measure were in the other category. The percentage of tokens judged as voiced was then taken for each of the two groups for each measure. If the acoustic measure ideally matched the impressionistic coding, the percentage of voicing below the division should be 0% and above the division it should be 100%. The results of this analysis are in Table 6.
As we can see in Table 6, VR1 and VR0 come the closest to ideally representing the responses of the participants. The modifications to the pitch settings do improve the performance of the voice report function, although it still does not entirely match the judgments of the participants. Something that is interesting to note here is that tokens with as little as 40% voicing (60% voiceless) are perceived as voiced. A token of /ʒ/ does not even have to be mostly voiced for it to be perceived as voiced by the participants. This suggests that voicing activity at the boundaries of the frication may be the most
68
important aspect in perceiving [ʒ] and not [ʃ].After the voice report measures, LFT (followed by COG2) corresponds most closely with the
responses of the participants. LFT and COG2 are pretty close in their rate of agreement with the participants, but it seems that the artificial division of the sound at 900 Hz does in fact help in the measurement of fricative voicing. Regarding center of gravity, it seems clear that power weighting is the most appropriate method of weighting to look at fricative voicing, since COG1 and COG2/3 get progressively worse in matching the participants' responses.
Table 6. Comparison of instrumental acoustic measures with the perception of the linguistically-trained participants.
The HNR measurement comes in as slightly better than COG1 in corresponding with the impressionistic coding. An issue pertaining to acoustic periodicity in the speech stream not associated with voicing is responsible for the lesser performance of HNR compared to other measures. This will be discussed in section 7. Of the different measurements that were taken, Dur is the worst predictor of the participants responses before the consonant-to-vowel ratios. There certainly is some relationship between the duration of /ʒ/ and the perception of voicing, but it is a fairly weak effect.
Finally, the two consonant-to-vowel ratios are farthest away from matching the participants' responses. Again, this would seem to be due to the fact that the output of that measurement is so dependent on the height and stress of the vowel in question.
7. Criterion-related validity: Correspondence with the spectrogram
In this section we will see additional criterion-related evidence of validity in a comparison of the measurement obtained with what we can see through an inspection of the spectrogram. In Figure 5 we can see the spectrogram of a token that is auditorily voiceless and also appears to be voiceless in our examination of the spectrogram. In Figure 6 we can see the spectrogram of a token that is auditorily voiced and also appears to be voiced in our examination of the spectrogram. Figure 7 shows a token that auditorily appears to be voiceless and whose spectrogram shows little evidence of voicing. The following discussion will address what the measurements tell us about each of these tokens.
Under normal circumstances, VR0 yields reasonable measurements. VR0 gives us a value of 96.0% voiceless for the token in Figure 5, which seems quite reasonable given what we can see on the spectrogram. VR0 gives us a value of 0.0% voiceless for the token in Figure 6, which also seems to correspond with the evidence on the spectrogram. Using the default settings, Praat's voice report function may be 'fooled', however, if the speech signal contains periodic sound that is not a result of glottal vibration. Despite a lack of evidence for voicing in the spectrogram, periodic noise in the frication has been detected as glottal pulses by Praat. As a result, VR0 has yielded a value of 48.65% voiceless, meaning that this token should be more than half voiced, something which is not supported
Measure Values at 39.6% Division % V < Div. % V > Div. Rank
57.9% 56.3% 7.8% 88.1% 2
60.6% 60.0% 5.6% 91.5% 1HNR 2.93 3.00 15.6% 76.3% 5FTL -5.89 -5.59 36.7% 44.1% 10
FTR† -6.88 -6.79 36.0% 47.5% 9LFT -3.21 -2.82 10.0% 84.7% 3
2238.43 2030.46 11.1% 83.1% 4
4115.33 4110.15 16.7% 74.6% 6
5381.96 5379.59 25.6% 61.0% 70.1014 0.1013 27.8% 57.6% 8
VR0
VR1
COG2
COG1
COG2/3
Dur†FTR only includes 146 tokens, 40.4% of which were judged voiced. The division for this measurement occurs at 40.4%.
69
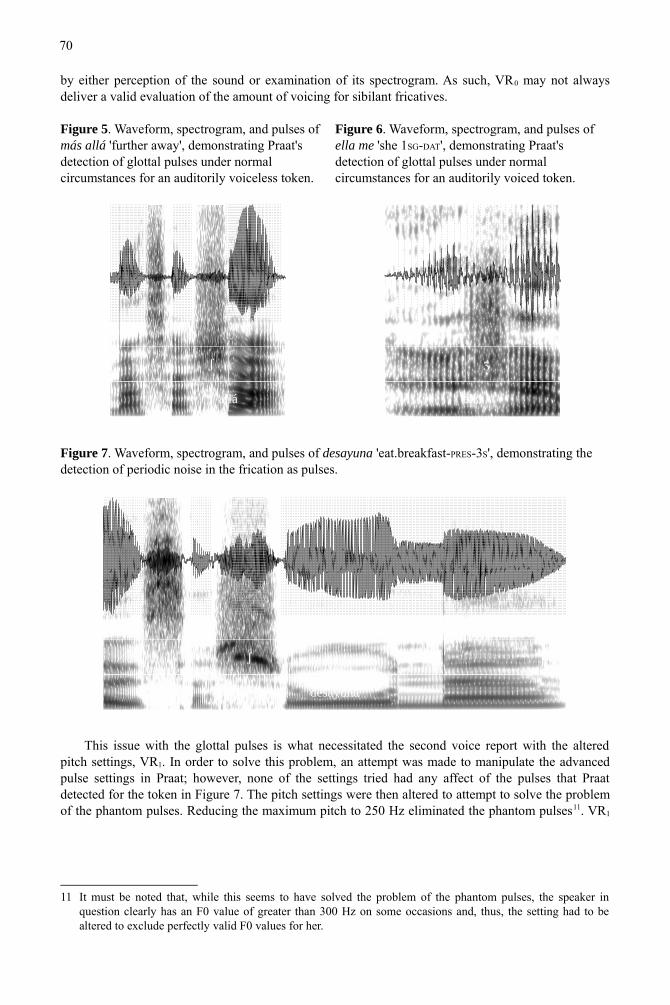
by either perception of the sound or examination of its spectrogram. As such, VR0 may not always deliver a valid evaluation of the amount of voicing for sibilant fricatives.
Figure 5. Waveform, spectrogram, and pulses of más allá 'further away', demonstrating Praat's detection of glottal pulses under normal circumstances for an auditorily voiceless token.
Figure 6. Waveform, spectrogram, and pulses of ella me 'she 1SG-DAT', demonstrating Praat's detection of glottal pulses under normal circumstances for an auditorily voiced token.
Figure 7. Waveform, spectrogram, and pulses of desayuna 'eat.breakfast-PRES-3S', demonstrating the detection of periodic noise in the frication as pulses.
This issue with the glottal pulses is what necessitated the second voice report with the altered pitch settings, VR1. In order to solve this problem, an attempt was made to manipulate the advanced pulse settings in Praat; however, none of the settings tried had any affect of the pulses that Praat detected for the token in Figure 7. The pitch settings were then altered to attempt to solve the problem of the phantom pulses. Reducing the maximum pitch to 250 Hz eliminated the phantom pulses11. VR1
11 It must be noted that, while this seems to have solved the problem of the phantom pulses, the speaker in question clearly has an F0 value of greater than 300 Hz on some occasions and, thus, the setting had to be
S
allá
Z
ella
S
desayuna
altered to exclude perfectly valid F0 values for her.
70
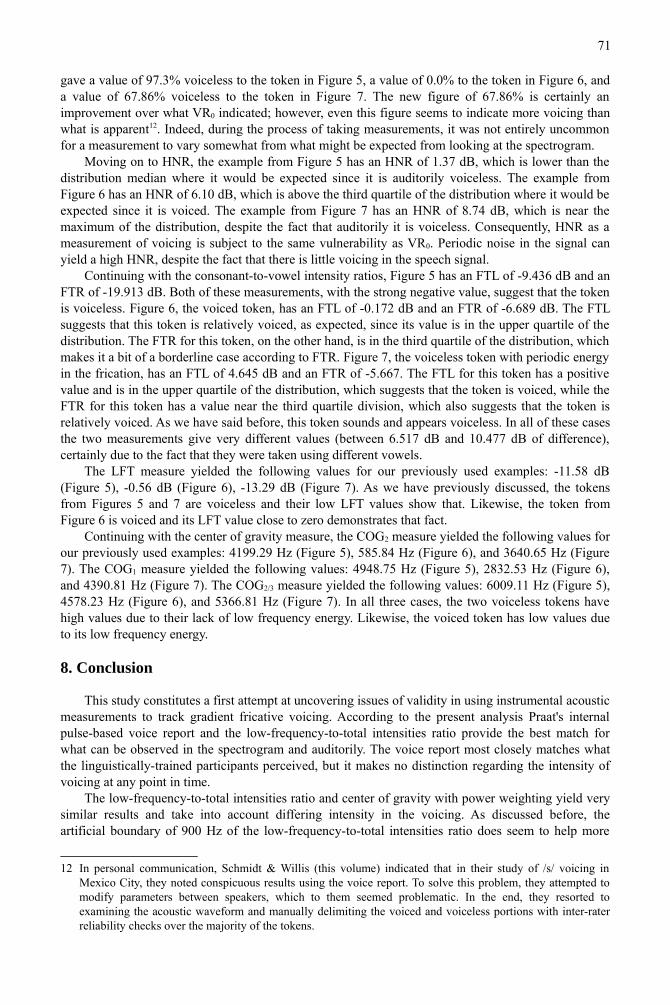
gave a value of 97.3% voiceless to the token in Figure 5, a value of 0.0% to the token in Figure 6, and a value of 67.86% voiceless to the token in Figure 7. The new figure of 67.86% is certainly an improvement over what VR0 indicated; however, even this figure seems to indicate more voicing than what is apparent12. Indeed, during the process of taking measurements, it was not entirely uncommon for a measurement to vary somewhat from what might be expected from looking at the spectrogram.
Moving on to HNR, the example from Figure 5 has an HNR of 1.37 dB, which is lower than the distribution median where it would be expected since it is auditorily voiceless. The example from Figure 6 has an HNR of 6.10 dB, which is above the third quartile of the distribution where it would be expected since it is voiced. The example from Figure 7 has an HNR of 8.74 dB, which is near the maximum of the distribution, despite the fact that auditorily it is voiceless. Consequently, HNR as a measurement of voicing is subject to the same vulnerability as VR0. Periodic noise in the signal can yield a high HNR, despite the fact that there is little voicing in the speech signal.
Continuing with the consonant-to-vowel intensity ratios, Figure 5 has an FTL of -9.436 dB and an FTR of -19.913 dB. Both of these measurements, with the strong negative value, suggest that the token is voiceless. Figure 6, the voiced token, has an FTL of -0.172 dB and an FTR of -6.689 dB. The FTL suggests that this token is relatively voiced, as expected, since its value is in the upper quartile of the distribution. The FTR for this token, on the other hand, is in the third quartile of the distribution, which makes it a bit of a borderline case according to FTR. Figure 7, the voiceless token with periodic energy in the frication, has an FTL of 4.645 dB and an FTR of -5.667. The FTL for this token has a positive value and is in the upper quartile of the distribution, which suggests that the token is voiced, while the FTR for this token has a value near the third quartile division, which also suggests that the token is relatively voiced. As we have said before, this token sounds and appears voiceless. In all of these cases the two measurements give very different values (between 6.517 dB and 10.477 dB of difference), certainly due to the fact that they were taken using different vowels.
The LFT measure yielded the following values for our previously used examples: -11.58 dB (Figure 5), -0.56 dB (Figure 6), -13.29 dB (Figure 7). As we have previously discussed, the tokens from Figures 5 and 7 are voiceless and their low LFT values show that. Likewise, the token from Figure 6 is voiced and its LFT value close to zero demonstrates that fact.
Continuing with the center of gravity measure, the COG2 measure yielded the following values for our previously used examples: 4199.29 Hz (Figure 5), 585.84 Hz (Figure 6), and 3640.65 Hz (Figure 7). The COG1 measure yielded the following values: 4948.75 Hz (Figure 5), 2832.53 Hz (Figure 6), and 4390.81 Hz (Figure 7). The COG2/3 measure yielded the following values: 6009.11 Hz (Figure 5), 4578.23 Hz (Figure 6), and 5366.81 Hz (Figure 7). In all three cases, the two voiceless tokens have high values due to their lack of low frequency energy. Likewise, the voiced token has low values due to its low frequency energy.
8. Conclusion
This study constitutes a first attempt at uncovering issues of validity in using instrumental acoustic measurements to track gradient fricative voicing. According to the present analysis Praat's internal pulse-based voice report and the low-frequency-to-total intensities ratio provide the best match for what can be observed in the spectrogram and auditorily. The voice report most closely matches what the linguistically-trained participants perceived, but it makes no distinction regarding the intensity of voicing at any point in time.
The low-frequency-to-total intensities ratio and center of gravity with power weighting yield very similar results and take into account differing intensity in the voicing. As discussed before, the artificial boundary of 900 Hz of the low-frequency-to-total intensities ratio does seem to help more
12 In personal communication, Schmidt & Willis (this volume) indicated that in their study of /s/ voicing in Mexico City, they noted conspicuous results using the voice report. To solve this problem, they attempted to modify parameters between speakers, which to them seemed problematic. In the end, they resorted to examining the acoustic waveform and manually delimiting the voiced and voiceless portions with inter-rater reliability checks over the majority of the tokens.
71
reliably match the perception of linguistically-trained individuals.Intensities ratios involving normalization to an adjacent vowel show systematic noise related to
the height and stress of the vowel used for comparison. For fricative voicing, other solutions have been outlined in this study. It remains an open question whether this is really a problem for other consonants where the object of study is not voicing. The point that Eddington (2011) makes about fully reduced Spanish voiced obstruents having no difference in intensity with adjacent vowels is clear. What is not clear, however, is whether or not “fully produced” Spanish [β], [ð], and [ɣ] have their own intensities independent of their co-occurrence with vowels of a particular height and stress. Further research of this methodological issue is warranted.
Harmonicity has been shown to be a less than ideal measure of gradient fricative voicing. Nevertheless, it clearly does correlate some with what we perceive as voiced and voiceless fricatives. It may even be a good candidate for measuring fricative voicing in particularly noisy recordings where intensities ratios and center of gravity would be unreliable.
A weak relationship between fricative duration and other measures of fricative voicing, including perception, was found. Due to the fact that this relationship is so weak, the validity of its use to represent voicing should be questioned, but the existence of a relationship between duration and voicing is upheld.
In any case, the results of this study support looking at multiple measures that could be purported to correlate with a given tract variable. Such an exercise may be most helpful in identifying problems in one of the measures that might not be captured if only one measure is taken.
Finally, while task effects may have played a role in the low agreement among the participants in the perceptual study, the results still suggest that even linguistically-trained individuals cannot perceive the difference reliably, probably owing to the gradient nature of the phenomenon. A future study should investigate what might have motivated such divergent judgments on the part of the participants in the perception study. If a binary distinction must be made, it should at least be made using a combination of perception and an examination of the spectrogram. It is clearly not possible to entirely abandon impressionistic coding in methodology, since doing so would probably exclude from phonetic study corpora whose sound quality does not permit instrumental analysis, which would be a real loss given the amount of resources from the linguistics community that were invested in producing those corpora. If impressionistic coding is used, however, it should be accompanied by a robust inter-rater reliability check.
Appendix A. Elicitation paragraph
All tokens of /ʒ/ are bolded. Word-medial, intervocalic tokens are also underlined.Me acuerdo de la última vez que me pusieron una inyección. En la escalera de la universidad yo
me había caído y me había cortado con un tornillo oxidado. Al llegar al consultorio del médico donde me dieron la inyección, me di cuenta de que iba a tener que esperar por casi una hora, ya que la sala de espera estaba llena. Yo ya había esperado cuarenta y cinco minutos cuando la enfermera me llamó y me llevó al consultorio donde yo iba a ser atendido por un doctor que se llama Andrés Yáñez. Allí yo escuchaba el llanto de un niño. Parece que antes de que yo llegara al consultorio, habían llegado una mujer y su hijo. El niño lloraba y lloraba. La enfermera los había puesto en el consultorio adyacente al mío. Por fin el Doctor Yáñez llegó y me preguntó qué me había pasado. Yo le expliqué todo con mucho detalle y él me dijo que necesitaba darme la vacuna del tétanos. Me dijo que iba a llamar a la enfermera para que me diera la inyección. Ella me aconsejó que me fuera a casa y que descansara.
‘I remember the last time they gave me a shot. On the staircase at the university I had fallen and I had cut myself on a rusty screw. Upon arriving at the doctor’s office where they gave me the shot, I realized that I was going to have to wait for almost an hour, since the waiting room was full. I already had waited for forty-five minutes when the nurse called me and took me to the room where I was going to be examined by a doctor called Andrés Yáñez. There I heard the cry of a child. It seems that before I got to the room, a woman and her child had arrived. The child cried and cried. The nurse had put them in the room adjacent to mine. Finally Doctor Yáñez arrived and asked me what had happened
72
to me. I explained everything to him with a lot of detail and he told me that he needed to give me the tetanus vaccine. He told me that he was going to call the nurse so she could give me the shot. She advised me to go home and to rest.’
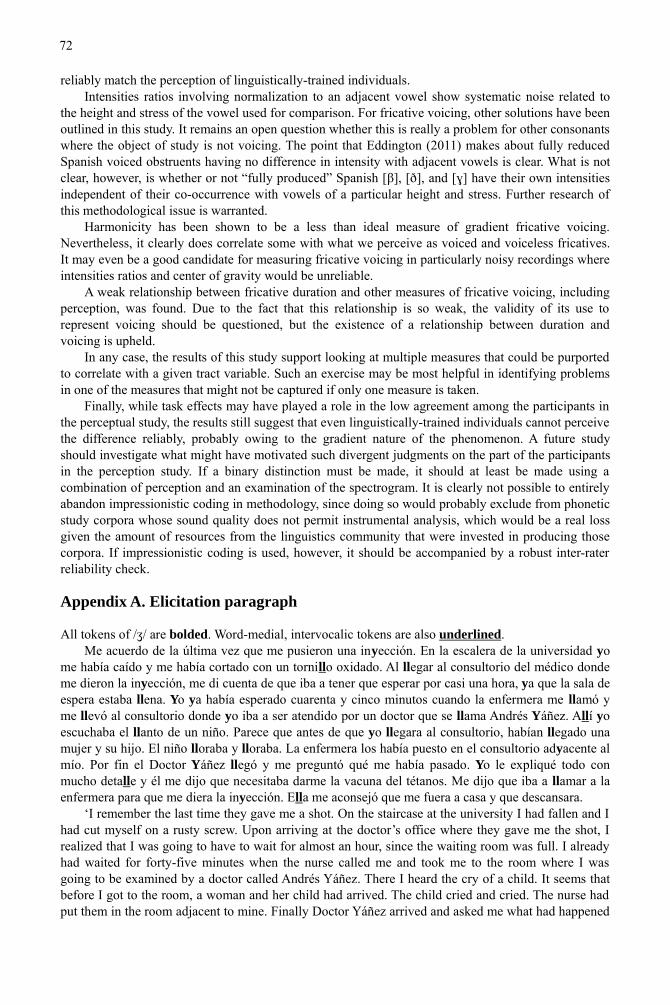
Appendix B. Summary statistics for each measure
Std. Dev. 1st Q MaximumMean Minimum Median 3rd Q
References
Alba, Matthew C. 2006. Accounting for variability in the production of Spanish vowel sequences. Selected Proceedings of the 9th Hispanic Linguistics Symposium, ed. by Nuria Sagarra & Almeida Jacqueline Toribio, 273-285. Somerville, MA: Cascadilla Proceedings Project.
Boersma, Paul. 1993. Accurate short-term analysis of the fundamental frequency and the harmonics-to-noise ratio of a sampled sound. IFA Proceedings 17: 97-110.
Boersma, Paul, & David Weenink. 2008. Praat: doing phonetics by computer (Version 5.0.21) [Computer program]. http://www.praat.org/
Brown, Earl K. 2008. A usage-based account of syllable- and word-final /s/ reduction in four dialects of Spanish. University of New Mexico dissertation.
Chang, Charles B. 2008. Variation in palatal production in Buenos Aires Spanish. Selected Proceedings of the 4th
Workshop on Spanish Sociolinguistics, ed. by Maurice Westmoreland & Juan Antonio Thomas, 54-63. Somerville, MA: Cascadilla Proceedings Project.
Colantoni, Laura. 2006. Micro and macro sound variation and change in Argentine Spanish. Selected Proceedings of the 9th Hispanic Linguistics Symposium, ed. by Nuria Sagarra & Almeida Jacqueline Toribio, 91-102. Somerville, MA: Cascadilla Proceedings Project.
Colantoni, Laura, & Alexei Kochetov. This Volume. An articulatory study of sibilant consonants in two Spanish varieties.
Colantoni, Laura, & Irina Marinescu. 2010. The scope of stop weakening in Argentine Spanish. Selected Proceedings of the 4th Conference on Laboratory Approaches to Spanish Phonology, ed. by Marta Ortega-Llebaria, 100-114. Somerville, MA: Cascadilla Proceedings Project.
Cole, Jennifer, José Ignacio Hualde, & Khalil Iskarous. 1999. Effects of prosodic and segmental context on /g/ deletion in Spanish. Proceedings of the Fourth Linguistics and Phonetics Conference, ed. by O. Fujimura, Brian D. Joseph, & B. Palek, 575-589. Prague: The Karolinum Press.
Díaz-Campos, Manuel, & Michael Gradoville. 2011. An analysis of frequency as a factor contributing to the diffusion of variable phenomena. Evidence from Spanish data. Selected Proceedings of the 13th Hispanic Linguistics Symposium, ed. by Luis A. Ortíz-López, 224-38. Someville, MA: Cascadilla Proceedings Project.
Eddington, David. 2011. What are the contextual phonetic variants of /β,ð,γ/ in colloquial Spanish? Probus 23:1-19.
Face, Timothy. 2010. The necessity of both naturally-occurring and elicited data in Spanish intonational phonology. Studies in Hispanic and Lusophone Linguistics 3(2): 485-99.
Fant, Gunnar. 1960. Acoustic theory of speech production. The Hague: Mouton.Fontanella de Weinberg, María Beatriz. 1979. Dinámica social de un cambio lingüístico. Mexico: Universidad
Nacional Autónoma de México.Fraenkel, Jack R., & Norman E. Wallen. 2008. How to design and evaluate research in education. 7th ed. New
York: McGraw-Hill.
56.8% 32.2% 0.0% 31.6% 71.4% 81.2% 96.0%
57.5% 33.1% 0.0% 26.4% 71.7% 82.4% 97.3%HNR 2.35 3.08 -2.49 0.15 1.53 3.98 11.11FTL -7.21 5.13 -19.71 -10.65 -7.36 -3.72 12.99FTR -7.94 4.38 -19.91 -10.52 -7.87 -5.73 7.77LFT -5.35 3.88 -17.43 -8.13 -4.69 -2.05 -0.24
2581.29 494..40 545.12 1695.30 2687.32 3324.95 5040.69
4253.95 892.15 2683.83 3889.07 4281.17 4680.97 5599.16
5490.67 1279.67 4338.22 5277.53 5473.09 5712.28 6395.380.1107 0.0290 0.0481 0.0928 0.1062 0.1262 0.1992
VR0
VR1
COG2
COG1
COG2/3
Dur
73
Gahl, Susanne. 2008. Time and thyme are not homophones. The effect of lemma frequency on word durations in spontaneous speech. Language 84(3): 474-96.
Gay, L.R., Geoffrey E. Mills, & Peter Airasian. 2009. Educational research. Competencies for analysis and applications. 9th ed. Upper Saddle River, NJ: Pearson.
Hualde, José Ignacio. 2005. The sounds of Spanish. Cambridge: Cambridge University Press.Johnson, Keith. 1997. Acoustic and auditory phonetics. Hoboken, NJ: Wiley-Blackwell.Kaplan, Abby. 2010. Phonetic motivations for intervocalic spirantization in Romance. Paper presented at the 5th
Conference on Laboratory Approaches to Romance Phonology.Ladefoged, Peter. 2003. Phonetic data analysis. An introduction to fieldwork and instrumental techniques.
Oxford: Blackwell.Lehman, Barbara. 2007. Rainstorm. New York: Houghton Mifflin.Lewis, Anthony M. 2001. Weakening of intervocalic /p, t, k/ in two Spanish dialects. Toward the quantification of
lenition processes. University of Illinois at Urbana-Champaign dissertation.Ormerod, Jan. 2005. Buenos días/Sunshine. Barcelona: Serres.Ortega-Llebaria, Marta. 2004. Interplay between phonetic and inventory constraints in the degree of spirantization
of voiced stops. Comparing intervocalic /b/ and intervocalic /g/ in Spanish and English. Laboratory Approaches to Spanish Phonology, 237-53. Berlin: Mouton de Gruyter.
Rabiner, Lawrence, & Ronald Schafer. 2011. Theory and applications of digital speech processing. Upper Saddle River, NJ: Prentice Hall.
Rohena-Madrazo, Marcos. To Appear. Variación y cambio de sonoridad de la fricativa postalveolar del español de Buenos Aires. Perspectivas teóricas y experimentales sobre el español de la Argentina, ed. by Laura Colantoni & Celeste Rodríguez Louro. Madrid: Iberoamericana.
Schmidt, Lauren, & Erik Willis. This Volume. Systematic investigation of voicing assimilation of Spanish /s/ in Mexico City.
Silbert, Noah, & Kenneth de Jong. 2008. Focus, prosodic context, and phonological feature specification. Patterns of variation in fricative production. Journal of the Acoustical Society of America 123(5):2769-2779.
Stevens, Kenneth N., Sheila E. Blumstein, Laura Glicksman, Martha Burton, & Kathleen Kurowski. 1992. Acoustic and perceptual characteristics of voicing in fricatives and fricative clusters. Journal of the Acoustic Society of America 91(5): 2979-3000.
Villafaña Dalcher, Christina. 2006. Consonant weakening in Florentine Italian. An acoustic study of gradient and variable sound change. Georgetown University Dissertation.
Wolf, Clara. 1984. Tiempo real y tiempo aparente en el estudio de una variación lingüística. Ensordecimiento y sonorización del yeísmo porteño. Homenaje a Ana María Barrenechea, ed. by Ana María Barrenechea, Lía Schwartz, & Isaías Lerner, 175-96. Madrid: Editorial Castalia.
Wolf, Clara, & Elena Jiménez. 1979. El ensordecimiento del yeísmo porteño, un cambio fonológico en marcha. Estudios lingüísticos y dialectológicos. Temas hispánicos, ed. by Ana María Barrenechea, Mabel de Rosetti, María Luisa Freyre, Elena Jiménez, Teresa Orecchia, and Clara Wolf, 115-44. Buenos Aires: Hachette.
74
Selected Proceedings of the5th Conference on LaboratoryApproaches to Romance Phonology
edited by Scott M. AlvordCascadilla Proceedings Project Somerville, MA 2011
Copyright information
Selected Proceedings of the 5th Conference on Laboratory Approaches to Romance Phonology© 2011 Cascadilla Proceedings Project, Somerville, MA. All rights reserved
ISBN 978-1-57473-449-2 library binding
A copyright notice for each paper is located at the bottom of the first page of the paper.Reprints for course packs can be authorized by Cascadilla Proceedings Project.
Ordering information
Orders for the library binding edition are handled by Cascadilla Press.To place an order, go to www.lingref.com or contact:
Cascadilla Press, P.O. Box 440355, Somerville, MA 02144, USAphone: 1-617-776-2370, fax: 1-617-776-2271, [email protected]
Web access and citation information
This entire proceedings can also be viewed on the web at www.lingref.com. Each paper has a unique document #which can be added to citations to facilitate access. The document # should not replace the full citation.
This paper can be cited as:
Gradoville, Michael Stephen. 2011. Validity in Measurements of Fricative Voicing: Evidence from ArgentineSpanish. In Selected Proceedings of the 5th Conference on Laboratory Approaches to Romance Phonology,ed. Scott M. Alvord, 59-74. Somerville, MA: Cascadilla Proceedings Project. www.lingref.com, document #2635.
Related Documents