ECMWF COPERNICUS REPORT Copernicus Atmosphere Monitoring Service Validation report for the CO 2 fluxes estimated by atmospheric inversion, v18r2 Version 1.0 Issued by: CEA / Frédéric Chevallier Date: 11/07/2019 REF.: CAMS73_2018SC1_D73.1.4.1-2018-v1_201907_Validation inversion CO2 fluxes_v1

Welcome message from author
This document is posted to help you gain knowledge. Please leave a comment to let me know what you think about it! Share it to your friends and learn new things together.
Transcript

ECMWF COPERNICUS REPORT
Copernicus Atmosphere Monitoring Service
Validation report for the CO2 fluxes estimated by atmospheric inversion, v18r2 Version 1.0
Issued by: CEA / Frédéric Chevallier
Date: 11/07/2019
REF.: CAMS73_2018SC1_D73.1.4.1-2018-v1_201907_Validation inversion CO2
fluxes_v1

Copernicus Atmosphere Monitoring Service
Author 2 of 19
This document has been produced in the context of the Copernicus Atmosphere Monitoring Service (CAMS). The activities leading to these results have been contracted by the European Centre for Medium-Range Weather Forecasts, operator of CAMS on behalf of the European Union (Delegation Agreement signed on 11/11/2014). All information in this document is provided "as is" and no guarantee or warranty is given that the information is fit for any particular purpose. The user thereof uses the information at its sole risk and liability. For the avoidance of all doubts, the European Commission and the European Centre for Medium-Range Weather Forecasts has no liability in respect of this document, which is merely representing the authors view.

Copernicus Atmosphere Monitoring Service
Author 3 of 19
Contributors
CEA Frédéric Chevallier
Copernicus Atmosphere Monitoring Service
Author 4 of 19
Table of Contents
1. Introduction 5
2. Inversion configuration 5
3. Evaluation 12
3.1 Fit to the assimilated measurements 12
3.2 Fit to unassimilated aircraft measurements 12
3.3 Fit to TCCON GGG2014 14
3.4 Country and annual scale CO2 budgets Error! Bookmark not defined.
Acknowledgements 16
References 16
Copernicus Atmosphere Monitoring Service
Author 5 of 19
1. Introduction The inversion system that generates the CAMS global CO2 atmospheric inversion product is called PyVAR. It has been initiated, developed and maintained at CEA/LSCE within CAMS and its precursor projects GEMS/MACC/MACC-II/MACC-III (Chevallier 2019, and references therein). Here, we synthesize the evaluation of version 18r2 that was released in July 2019. Version 18r2 covers the period between January 1979 and December 2018. It mainly improves compared to the earlier v18r1 shown in Chevallier (2018) by the assimilation of more sites and of data for the third trimester of 20191 and by the use of a more sophisticated transport model. The presentation of the evaluation procedure is primarily based on the fit of the inversion posterior simulation to large databases: ObsPack Globalview+_v4.2.1 of Cooperative Global Atmospheric Data Integration Project (2019), ObsPack NRT v4.4.1 of NOAA Carbon Cycle Group ObsPack Team (2019), ObsPack INPE_RESTRICTED v2.0 of NOAA Carbon Cycle Group ObsPack Team (2018) and the Total Carbon Column Observing Network (TCCON) GGG2014 archive (Wunch et al. 2011). In addition, time series at national annual scale are shown and briefly discussed. Section 2 describes the PyVAR-CO2 configuration that was used and Section 3 presents the evaluation synthesis.
2. Inversion configuration The transport model in PyVAR-CO2 is the global general circulation model LMDz in its version LMDz6A (Remaud et al. 2018), that uses the deep convection model of Emanuel (1991). This version has a regular horizontal resolution of 3.75o in longitude and 1.875o in latitude, with 39 hybrid layers in the vertical. The inferred fluxes are estimated in each horizontal grid point of the transport model with a temporal resolution of 8 days, separately for day-time and night-time. The state vector of the inversion system is therefore made of a succession of global maps with 9,200 grid points. Per month it gathers 73,700 variables (four day-time maps and four night-time maps). It also includes a map of the total CO2 columns at the initial time step of the inversion window in order to account for the uncertainty in the initial state of CO2. The prior values of the fluxes combine estimates of (i) gridded annual anthropogenic emissions (EC-JRC/PBL EDGAR version 4.2, CDIAC and GCP), (ii) monthly ocean fluxes (Landschützer et al. 20182), 3-hourly (when available) or monthly biomass burning emissions (GFED 4.1s until 20163 and GFAS
1 Measurements after December 2018 are used to constrain the year 2018 better, but fluxes for those months are not publicly distributed. 2 This database covers the period 1982-2017. We use the monthly values for the years 1982 and 2017 before and after it, respectively. 3 Before 1997, a monthly climatology of this database is used.
Copernicus Atmosphere Monitoring Service
Author 6 of 19
afterwards) and climatological 3-hourly biosphere-atmosphere fluxes taken as the 1989-2010 mean of a simulation of the ORganizing Carbon and Hydrology In Dynamic EcosystEms model (ORCHIDEE, Krinner et al. 2005), version 1.9.5.2. The mass of carbon emitted annually during specific fire events is compensated here by the same annual flux of opposite sign representing the re-growth of burnt vegetation, which is distributed regularly throughout the year. The gridded prior fluxes exhibit 3-hourly variations but their inter-annual variations over land are only caused by anthropogenic emissions. This feature was explicitly demanded by some users who wanted the interannual signals in the inverted natural fluxes to be strictly driven by the atmospheric measurements. Over land, the errors of the prior biosphere-atmosphere fluxes are assumed to dominate the error budget and the covariances are constrained by an analysis of mismatches with in situ flux measurements (Chevallier et al. 2006, 2012): temporal correlations on daily mean Net Carbon Exchange (NEE) errors decay exponentially with a length of one month but night-time errors are assumed to be uncorrelated with daytime errors; spatial correlations decay exponentially with a length of 500 km; standard deviations are set to 0.8 times the climatological daily-varying heterotrophic respiration flux simulated by ORCHIDEE with a ceiling of 4 gC∙m-2 per day. Over a full year, the total 1-sigma uncertainty for the prior land fluxes amounts to about 3.0 GtC∙yr-1. The error statistics for the open ocean correspond to a global air-sea flux uncertainty about 0.5 GtC∙yr-1 and are defined as follows: temporal correlations decay exponentially with a length of one month; unlike land, daytime and night-time flux errors are fully correlated; spatial correlations follow an e-folding length of 1000 km; standard deviations are set to 0.1 gC∙m-2 per day. Land and ocean flux errors are not correlated. Observation uncertainty in the inversion system is dominated by uncertainty in transport modelling and is initially represented from the variance of the high frequency variability of the de-seasonalized and de-trended CO2 time series of the daily-mean measurements at a given location. The values are then adjusted, first by inflating all error variances by the number of measurements at a given location within each calendar day, then by averaging consecutive measurements and defining the resulting error variance as the average of the individual error variances. Version 18r2 analyzed 40.4 years of surface measurements, from January 1979 to May 2019. The assimilated measurements are surface air-sample measurements of the CO2 dry air mole fraction made at 135 sites over the globe. These data are a carefully-selected subset of four large living databases of atmospheric measurements:
• the NOAA Earth System Research Laboratory Observation Package (https://www.esrl.noaa.gov/gmd/ccgg/obspack/, Cooperative Global Atmospheric Data Integration Project, 2019, and NOAA Carbon Cycle Group Obspack Team, 2019),
• the World Data Centre for Greenhouse Gases archive (WDCGG, https://gaw.kishou.go.jp/),
• the Réseau Atmosphérique de Mesure des Composés à Effet de Serre database (RAMCES, http://www.lsce.ipsl.fr/),
• the Integrated Carbon Observation System- Atmospheric Thematic Center (ICOS-ATC, https://icos-atc.lsce.ipsl.fr/).

Copernicus Atmosphere Monitoring Service
Author 7 of 19
The detailed list of selected sites is provided in Tables 1 and 2 and their location is displayed per year in Figure 1. The irregular space-time density of the measurements implies a variable constraint on the inversion throughout the 39.8 years, which is documented by the associated Bayesian error statistics.
Figure 1- Location of the assimilated measurements over the globe for each year in v18r2.
Table 1 - List of the continuous sites used in v18r2 together with the period of coverage (defined as the period between the first sample and the last one), and the data source. Each station is identified by the name of the place, the corresponding country (abbreviated) and the code used in the corresponding database provider. Note that only a subset of the data at each site is selected, based on local time and also excluding outliers.
Locality (indentifier) Period Source
Alert, Nunavut, CA (ALT) 1988-2018 NOAA/ EC
Amsterdam Island, FR (AMS) 1981-2019 ICOS/ LSCE
Argyle, Maine, US (AMT) 2003-2019 NOAA/ ESRL
Behchoko, Northwest Territories, CA (BCK) 2010-2018 NOAA/ EC
Baring Head, NZ (BHD) 1979-2017 NOAA/ NIWA

Copernicus Atmosphere Monitoring Service
Author 8 of 19
Bratt’s Lake Saskatchewan, CA (BRA) 2009-2018 NOAA/ EC
Barrow, Alaska, US (BRW) 1979-2019 NOAA/ ESRL
Cambridge Bay, Nunavut Territory (CBY) 2012-2018 NOAA/ EC
Candle Lake, Saskatchewan, CA (CDL) 2002-2010 NOAA/ EC
Cesar, Cabauw (CES) 1992-2016 NOAA/ ECN
Churchill, CA (CHL) 2011-2018 NOAA/ EC
Chibougamau, Quebec, CA (CHM) 2007-2011 NOAA/ EC
Monte Cimone, IT (CMN) 1996-2019 WDCGG/ IAFMS
Cape Ochi-ishi, JP (COI) 1995-2017 WDCGG/ NIES
Copley Square (COP) 2012-2017 NOAA/ HU
Chapais, Quebec, CA (CPS) 2012-2018 NOAA/ EC
Cape Point, SA (CPT) 1993-2017 NOAA/ SAWS Carbon in Arctic Reservoirs Vulnerability
Experiment, US (CRV) 2011-2019 NOAA/ ESRL
Egbert, Ontario, CA (EGB) 2005-2016 NOAA/ EC
Estevan Point, British Columbia, CA (ESP) 2009-2018 WDCGG/ EC
Esther, Alberta, CA (EST) 2010-2018 NOAA/ EC
East Trout Lake, Saskatchewan, CA (ETL) 2005-2018 NOAA/ EC
Fraserdale, CA (FSD) 1990-2018 NOAA/ EC
Hateruma, JP (HAT) 1993-2002 WDCGG/ NIES
Hidden Peak (Snowbird), Utah, US (HDP) 2006-2015 NOAA/ NCAR
Heidelberg, DE (HEI) 1996-2017 NOAA/ UHEI-IUP
Harvard Forest, Massachusetts, US (HFM) 2012-2017 NOAA/ HU
Hohenpeissenberg, DE (HPB) 2015-2019 NOAA/ Scripps
Hegyhatsal tower, 115m level, HU (HUN0115) 1994-2017 NOAA/ HMS
Inuvik,Northwest Territories, CA (INU) 2012-2018 NOAA/ EC
Ivittuut, Greenland, DK (IVI) 2011-2014 ICOS/ LSCE
Tenerife, Canary Islands, ES (IZO) 1984-2017 NOAA/ AEMET
Jubany, Antartica, AR (JBN) 1994-2009 WDCGG/ ISAC IAA
Jungfraujoch, CH (JFJ) 2004-2017 NOAA/ Univ. Of Bern
Jungfraujoch, CH (JFJ) 2016-2019 NOAA/ ICOS-ATC
Kasprowy Wierch, High Tatra, PL (KAS) 1996-2017 NOAA/ AGH
K-puszta, HU (KPS) 1981-1999 WDCGG/ HMS
Park Falls, Wisconsin, US (LEF) 2000-2019 NOAA/ ESRL
Lac La Biche, Alberta, CA (LLB) 2000-2018 NOAA/ EC
Lutjewad, NL (LUT) 2006-2017 NOAA/RUG
Mace Head, County Galway, IE (MHD) 1992-2019 ICOS/ LSCE
Mt. Bachelor Observatory, US (MBO) 2012-2019 NOAA/ ESRL
Mauna Loa, Hawaii, US (MLO) 1979-2019 NOAA/ ESRL
Minamitorishima, JP (MNM) 1993-2017 NOAA/ JMA
Niwot Ridge, Colorado, US (NWR) 2005-2015 NOAA/ NCAR
Marys Peak, Oregon, US (OMP) 2007-2017 NOAA/ ESRL
Silverton, Oregon, US (OSI) 2012-2017 NOAA/ OSU
Walton, Oregon, US (OWA) 2012-2017 NOAA/OSU
Yaquina Head, Oregon, US (OYQ) 2007-2011 NOAA/ OSU
Pallas-Sammaltunturi, GAW Station, FI (PAL) 2000-2019 NOAA/ FMI

Copernicus Atmosphere Monitoring Service
Author 9 of 19
Plateau Rosa, IT (PRS) 2000-2017 NOAA/ CESI RICERCA
Kermadec Island, Raoul Island, NZ (RK1) 2012-2017 NOAA/ Scripps
Rio Branco, BR (RBA) 2007-2014 NOAA/ INPE
Ridge Hill, UK (RGL) 2012-2017 NOAA/ UNIVBRIS
Ryori, JP (RYO) 1987-2017 NOAA/ JMA
Southern Great Plains, Oklahoma, US (SGP) 2003-2017 NOAA/ LBNL-ARM
Tutuila, American Samoa (SMO) 1979-2019 NOAA/ ESRL
Hyytiala, FI (SMR) 2012-2019 NOAA/ Scripps
Sonnblick, AU (SNB) 1999-2018 WDCGG/ EEA
Shenandoah National Park, US (SNP) 2008-2019 NOAA/ ESRL
Storm Peak Laboratory (SPL) 2005-2015 NOAA/ NCAR
South Pole, Antarctica, US (SPO) 1979-2019 NOAA/ ESRL
Schauinsland, Baden-Wuerttemberg, DE (SSL) 1979-2017 NOAA/ UBA
Syowa Station, Antarctica, JP (SYO) 1984-2017 NOAA/ Tohoku University
Tacolneston, UK (TAC) 2013-2017 NOAA/ ESRL
Turkey Point, Ontario (TPD) 2012-2018 NOAA/ EC
Weybourne, UK (WAO) 2007-2016 NOAA/ UEA
Moody, Texas, US (WKT) 2003-2018 NOAAA/ ESRL
Sable Island, Nova Scotia (WSA) 1992-2018 NOAA/ EC
Yonagunijima, JP (YON) 1997-2017 NOAA/ JMA Ny-Alesund, Svalbard, Norway and Sweden
(ZEP) 1995-2019 NOAA/ EC
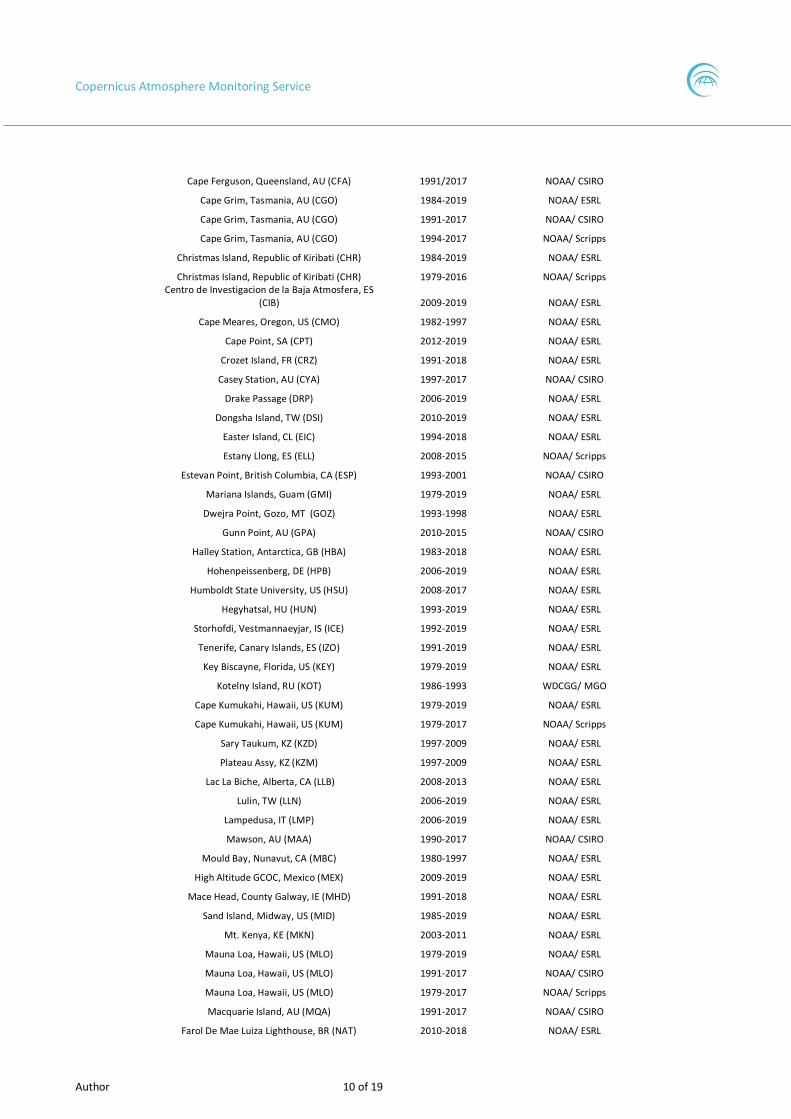
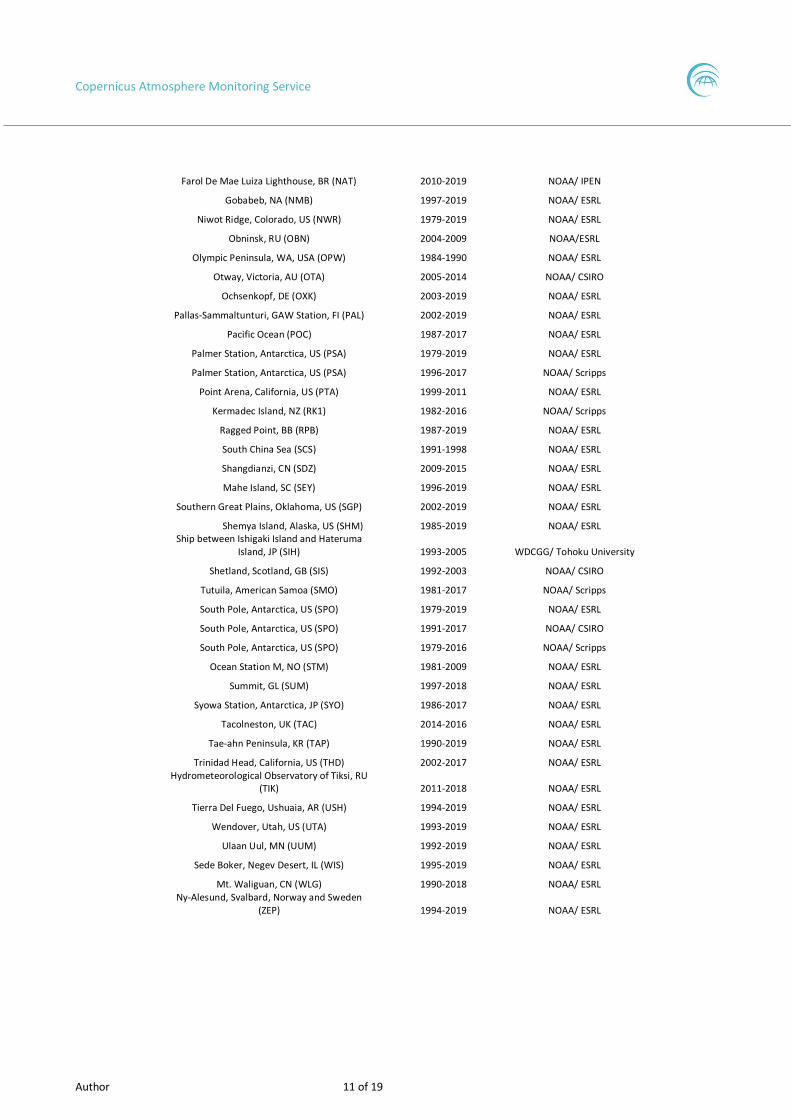
Table 2 - Same as Table 1 but for the flask-sampling sites. Note that only a subset of the data at each site is selected, avoiding outliers.
Locality (indentifier) Period Source
Alert, Nunavut, CA (ALT) 1985-2019 NOAA/ ESRL
Alert, Nunavut, CA (ALT) 1985-2017 NOAA/ Scripps
Alert, Nunavut, CA (ALT) 1991-2017 NOAA/ CSIRO
Amsterdam Island, FR (AMS) 1982-1990 NOAA/ ESRL
Anmyeon-do, KR (AMY) 2013-2018 NOAA/ ESRL
Ascension Island, GB (ASC) 1979-2019 NOAA/ ESRL
Assekrem, DZ (ASK) 1995-2019 NOAA/ ESRL
St. Croix, Virgin Islands, USA (AVI) 1979-1990 NOAA/ ESRL
Terceira Island, Azores, PT (AZR) 1979-2018 NOAA/ ESRL
Baltic Sea, PL (BAL) 1992-2011 NOAA/ ESRL
Baja California Sur, MX (BCS) 1997-2009 NOAA/ Scripps
Bering Island, RU (BER) 1986-1993 WDCGG/ MGO
Baring Head, NZ (BHD) 1999-2018 NOAA/ ESRL
Baring Head, NZ (BHD) 1979-2017 NOAA/ Scripps
St. Davids Head, Bermuda, GB (BME) 1989-2009 NOAA/ ESRL
Tudor Hill, Bermuda, GB (BMW) 1989-2019 NOAA/ ESRL
Barrow, Alaska, US (BRW) 1979-2019 NOAA/ ESRL
Barrow, Alaska, US (BRW) 1979-2017 NOAA/ Scripps
Cold Bay, Alaska, US (CBA) 1979-2019 NOAA/ ESRL
Cold Bay, Alaska, US (CBA) 1995-2017 NOAA/ Scripps
Copernicus Atmosphere Monitoring Service
Author 10 of 19
Cape Ferguson, Queensland, AU (CFA) 1991/2017 NOAA/ CSIRO
Cape Grim, Tasmania, AU (CGO) 1984-2019 NOAA/ ESRL
Cape Grim, Tasmania, AU (CGO) 1991-2017 NOAA/ CSIRO
Cape Grim, Tasmania, AU (CGO) 1994-2017 NOAA/ Scripps
Christmas Island, Republic of Kiribati (CHR) 1984-2019 NOAA/ ESRL
Christmas Island, Republic of Kiribati (CHR) 1979-2016 NOAA/ Scripps Centro de Investigacion de la Baja Atmosfera, ES
(CIB) 2009-2019 NOAA/ ESRL
Cape Meares, Oregon, US (CMO) 1982-1997 NOAA/ ESRL
Cape Point, SA (CPT) 2012-2019 NOAA/ ESRL
Crozet Island, FR (CRZ) 1991-2018 NOAA/ ESRL
Casey Station, AU (CYA) 1997-2017 NOAA/ CSIRO
Drake Passage (DRP) 2006-2019 NOAA/ ESRL
Dongsha Island, TW (DSI) 2010-2019 NOAA/ ESRL
Easter Island, CL (EIC) 1994-2018 NOAA/ ESRL
Estany Llong, ES (ELL) 2008-2015 NOAA/ Scripps
Estevan Point, British Columbia, CA (ESP) 1993-2001 NOAA/ CSIRO
Mariana Islands, Guam (GMI) 1979-2019 NOAA/ ESRL
Dwejra Point, Gozo, MT (GOZ) 1993-1998 NOAA/ ESRL
Gunn Point, AU (GPA) 2010-2015 NOAA/ CSIRO
Halley Station, Antarctica, GB (HBA) 1983-2018 NOAA/ ESRL
Hohenpeissenberg, DE (HPB) 2006-2019 NOAA/ ESRL
Humboldt State University, US (HSU) 2008-2017 NOAA/ ESRL
Hegyhatsal, HU (HUN) 1993-2019 NOAA/ ESRL
Storhofdi, Vestmannaeyjar, IS (ICE) 1992-2019 NOAA/ ESRL
Tenerife, Canary Islands, ES (IZO) 1991-2019 NOAA/ ESRL
Key Biscayne, Florida, US (KEY) 1979-2019 NOAA/ ESRL
Kotelny Island, RU (KOT) 1986-1993 WDCGG/ MGO
Cape Kumukahi, Hawaii, US (KUM) 1979-2019 NOAA/ ESRL
Cape Kumukahi, Hawaii, US (KUM) 1979-2017 NOAA/ Scripps
Sary Taukum, KZ (KZD) 1997-2009 NOAA/ ESRL
Plateau Assy, KZ (KZM) 1997-2009 NOAA/ ESRL
Lac La Biche, Alberta, CA (LLB) 2008-2013 NOAA/ ESRL
Lulin, TW (LLN) 2006-2019 NOAA/ ESRL
Lampedusa, IT (LMP) 2006-2019 NOAA/ ESRL
Mawson, AU (MAA) 1990-2017 NOAA/ CSIRO
Mould Bay, Nunavut, CA (MBC) 1980-1997 NOAA/ ESRL
High Altitude GCOC, Mexico (MEX) 2009-2019 NOAA/ ESRL
Mace Head, County Galway, IE (MHD) 1991-2018 NOAA/ ESRL
Sand Island, Midway, US (MID) 1985-2019 NOAA/ ESRL
Mt. Kenya, KE (MKN) 2003-2011 NOAA/ ESRL
Mauna Loa, Hawaii, US (MLO) 1979-2019 NOAA/ ESRL
Mauna Loa, Hawaii, US (MLO) 1991-2017 NOAA/ CSIRO
Mauna Loa, Hawaii, US (MLO) 1979-2017 NOAA/ Scripps
Macquarie Island, AU (MQA) 1991-2017 NOAA/ CSIRO
Farol De Mae Luiza Lighthouse, BR (NAT) 2010-2018 NOAA/ ESRL
Copernicus Atmosphere Monitoring Service
Author 11 of 19
Farol De Mae Luiza Lighthouse, BR (NAT) 2010-2019 NOAA/ IPEN
Gobabeb, NA (NMB) 1997-2019 NOAA/ ESRL
Niwot Ridge, Colorado, US (NWR) 1979-2019 NOAA/ ESRL
Obninsk, RU (OBN) 2004-2009 NOAA/ESRL
Olympic Peninsula, WA, USA (OPW) 1984-1990 NOAA/ ESRL
Otway, Victoria, AU (OTA) 2005-2014 NOAA/ CSIRO
Ochsenkopf, DE (OXK) 2003-2019 NOAA/ ESRL
Pallas-Sammaltunturi, GAW Station, FI (PAL) 2002-2019 NOAA/ ESRL
Pacific Ocean (POC) 1987-2017 NOAA/ ESRL
Palmer Station, Antarctica, US (PSA) 1979-2019 NOAA/ ESRL
Palmer Station, Antarctica, US (PSA) 1996-2017 NOAA/ Scripps
Point Arena, California, US (PTA) 1999-2011 NOAA/ ESRL
Kermadec Island, NZ (RK1) 1982-2016 NOAA/ Scripps
Ragged Point, BB (RPB) 1987-2019 NOAA/ ESRL
South China Sea (SCS) 1991-1998 NOAA/ ESRL
Shangdianzi, CN (SDZ) 2009-2015 NOAA/ ESRL
Mahe Island, SC (SEY) 1996-2019 NOAA/ ESRL
Southern Great Plains, Oklahoma, US (SGP) 2002-2019 NOAA/ ESRL
Shemya Island, Alaska, US (SHM) 1985-2019 NOAA/ ESRL Ship between Ishigaki Island and Hateruma
Island, JP (SIH) 1993-2005 WDCGG/ Tohoku University
Shetland, Scotland, GB (SIS) 1992-2003 NOAA/ CSIRO
Tutuila, American Samoa (SMO) 1981-2017 NOAA/ Scripps
South Pole, Antarctica, US (SPO) 1979-2019 NOAA/ ESRL
South Pole, Antarctica, US (SPO) 1991-2017 NOAA/ CSIRO
South Pole, Antarctica, US (SPO) 1979-2016 NOAA/ Scripps
Ocean Station M, NO (STM) 1981-2009 NOAA/ ESRL
Summit, GL (SUM) 1997-2018 NOAA/ ESRL
Syowa Station, Antarctica, JP (SYO) 1986-2017 NOAA/ ESRL
Tacolneston, UK (TAC) 2014-2016 NOAA/ ESRL
Tae-ahn Peninsula, KR (TAP) 1990-2019 NOAA/ ESRL
Trinidad Head, California, US (THD) 2002-2017 NOAA/ ESRL Hydrometeorological Observatory of Tiksi, RU
(TIK) 2011-2018 NOAA/ ESRL
Tierra Del Fuego, Ushuaia, AR (USH) 1994-2019 NOAA/ ESRL
Wendover, Utah, US (UTA) 1993-2019 NOAA/ ESRL
Ulaan Uul, MN (UUM) 1992-2019 NOAA/ ESRL
Sede Boker, Negev Desert, IL (WIS) 1995-2019 NOAA/ ESRL
Mt. Waliguan, CN (WLG) 1990-2018 NOAA/ ESRL Ny-Alesund, Svalbard, Norway and Sweden
(ZEP) 1994-2019 NOAA/ ESRL

Copernicus Atmosphere Monitoring Service
Author 12 of 19
3. Evaluation We have run the LMDz global transport model using the surface fluxes and the initial CO2 state inferred by the inversion as boundary conditions and now compare it with dependent and independent observations.
3.1 Fit to the assimilated measurements Figure 2 shows the posterior root mean square (RMS) and bias of the model-minus-measurement difference as a function of the corresponding error statistics that we have assigned at each assimilated data. Measurement error is negligible here and the assigned error statistics refer to transport model errors and to representation errors (see Section 2). As expected, the inversion fits the assimilated data within the standard deviation of the assigned observation uncertainty. Biases are usually less than 1 ppm in absolute value.
Figure 2 - Statistics of the differences between the posterior inversion simulation and individual assimilated surface measurements as a function of the assigned observation error standard deviation for each measurement site. The statistics cover the full assimilation period, starting in 1979 and including the first months of 2019.
3.2 Fit to unassimilated aircraft measurements Following the approach defined in Chevallier et al. (2019), we now focus on the continuous or flask dry air mole fraction measurements made by aircraft in the free troposphere. The free troposphere is simply defined here as the atmospheric layer between 2 and 7 km above sea level (asl). The measurements are all from ObsPack Globalview+ v4.2.1, NRT v4.4.1 and INPE_RESTRICTED v2.0 for the period 1979-2018. All model equivalents to individual Globalview+_v4.0 data are publicly
Copernicus Atmosphere Monitoring Service
Author 13 of 19
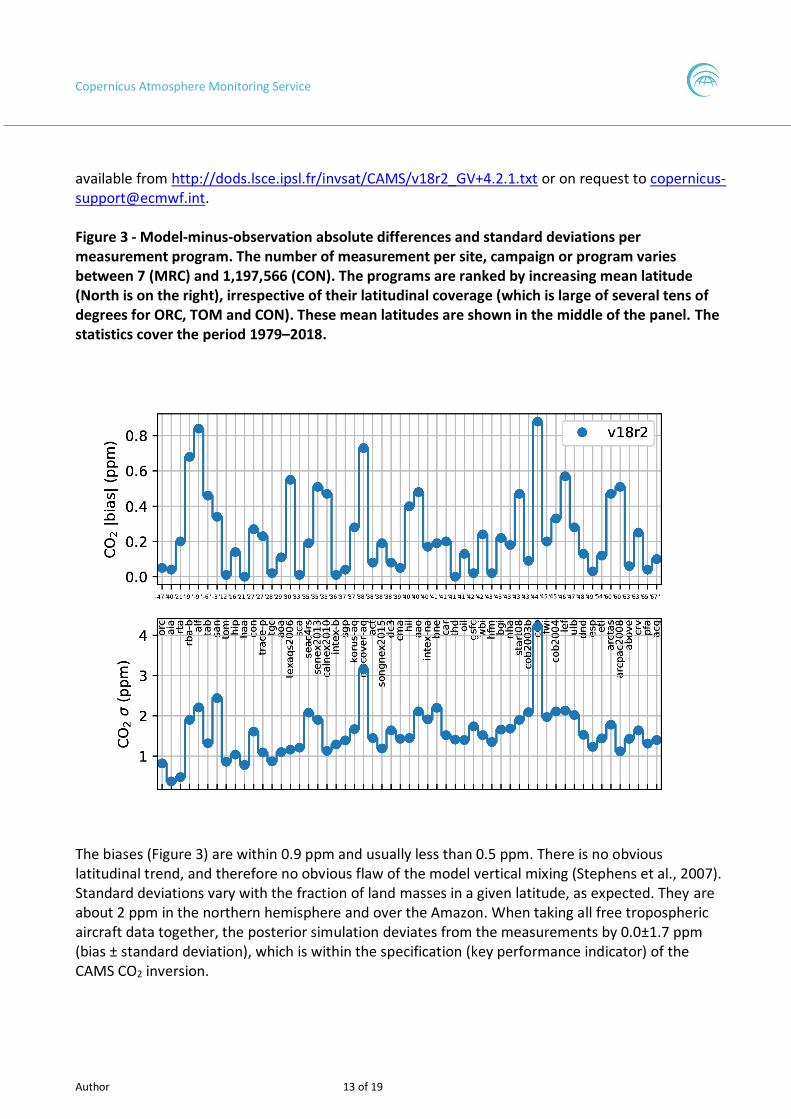
available from http://dods.lsce.ipsl.fr/invsat/CAMS/v18r2_GV+4.2.1.txt or on request to [email protected]. Figure 3 - Model-minus-observation absolute differences and standard deviations per measurement program. The number of measurement per site, campaign or program varies between 7 (MRC) and 1,197,566 (CON). The programs are ranked by increasing mean latitude (North is on the right), irrespective of their latitudinal coverage (which is large of several tens of degrees for ORC, TOM and CON). These mean latitudes are shown in the middle of the panel. The statistics cover the period 1979–2018.
The biases (Figure 3) are within 0.9 ppm and usually less than 0.5 ppm. There is no obvious latitudinal trend, and therefore no obvious flaw of the model vertical mixing (Stephens et al., 2007). Standard deviations vary with the fraction of land masses in a given latitude, as expected. They are about 2 ppm in the northern hemisphere and over the Amazon. When taking all free tropospheric aircraft data together, the posterior simulation deviates from the measurements by 0.0±1.7 ppm (bias ± standard deviation), which is within the specification (key performance indicator) of the CAMS CO2 inversion.
Copernicus Atmosphere Monitoring Service
Author 14 of 19
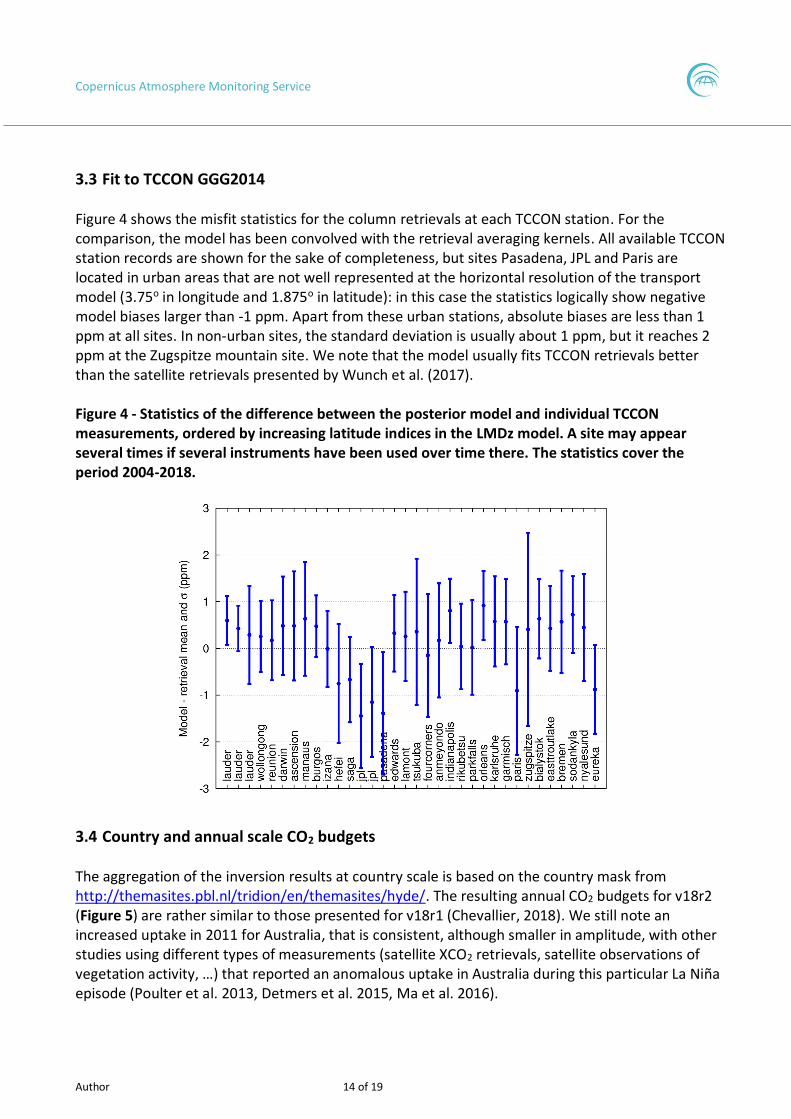
3.3 Fit to TCCON GGG2014 Figure 4 shows the misfit statistics for the column retrievals at each TCCON station. For the comparison, the model has been convolved with the retrieval averaging kernels. All available TCCON station records are shown for the sake of completeness, but sites Pasadena, JPL and Paris are located in urban areas that are not well represented at the horizontal resolution of the transport model (3.75o in longitude and 1.875o in latitude): in this case the statistics logically show negative model biases larger than -1 ppm. Apart from these urban stations, absolute biases are less than 1 ppm at all sites. In non-urban sites, the standard deviation is usually about 1 ppm, but it reaches 2 ppm at the Zugspitze mountain site. We note that the model usually fits TCCON retrievals better than the satellite retrievals presented by Wunch et al. (2017). Figure 4 - Statistics of the difference between the posterior model and individual TCCON measurements, ordered by increasing latitude indices in the LMDz model. A site may appear several times if several instruments have been used over time there. The statistics cover the period 2004-2018.
3.4 Country and annual scale CO2 budgets The aggregation of the inversion results at country scale is based on the country mask from http://themasites.pbl.nl/tridion/en/themasites/hyde/. The resulting annual CO2 budgets for v18r2 (Figure 5) are rather similar to those presented for v18r1 (Chevallier, 2018). We still note an increased uptake in 2011 for Australia, that is consistent, although smaller in amplitude, with other studies using different types of measurements (satellite XCO2 retrievals, satellite observations of vegetation activity, …) that reported an anomalous uptake in Australia during this particular La Niña episode (Poulter et al. 2013, Detmers et al. 2015, Ma et al. 2016).

Copernicus Atmosphere Monitoring Service
Author 15 of 19
Figure 5 - Time series of the total flux (natural+anthropogenic) in v18r2 at annual scale (solid blue) and at 5-yearly scale with its 1-σ uncertainty (dashed blue with the light blue envelop) in large countries or in the European Union. Additionnally, emissions from land use, land use change and forestry (LULUCF) emission (green) and from the energy sector (grey) reported to UNFCCC in 2019 are displayed when available. Large countries are defined by surface areas larger than 4,000,000 km2. Positive values denote sources to the atmosphere (emissions), while negative values denote storage in soils and vegetation (sink). The model grid points associated to each country appear in red on the global maps.
Copernicus Atmosphere Monitoring Service
Author 16 of 19
Acknowledgements The author is very grateful to the many people involved in the surface and aircraft CO2 measurements and in the archiving of these data that were kindly made available to him by various means. TCCON data were obtained from the TCCON Data Archive, operated by the California Institute of Technology from the website at http://tccon.ornl.gov/. Obspack data were obtained from https://www.esrl.noaa.gov/gmd/ccgg/obspack/. Mass fluxes for the LMDz transport model have been provided by M. Remaud. Some of this work was performed using HPC resources of DSM-CCRT and of CCRT under allocation A0050102201 made by GENCI (Grand Équipement National de Calcul Intensif).
References Chevallier, F., N. Viovy, M. Reichstein, and P. Ciais: On the assignment of prior errors in Bayesian inversions of CO2 surface fluxes. Geophys. Res. Lett., 33, L13802, doi:10.1029/2006GL026496, 2006. Chevallier, F., T. Wang, P. Ciais, F. Maignan, M. Bocquet, A. Arain, A. Cescatti, J.-Q. Chen, H. Dolman, B. E. Law, H. A. Margolis, L. Montagni, and E. J. Moors: What eddy-covariance flux measurements tell us about prior errors in CO2-flux inversion schemes. Global Biogeochem. Cy., 26, GB1021, doi:10.1029/2010GB003974, 2012. Chevallier, F., Validation report for the inverted CO2 fluxes, v18r1. CAMS deliverable CAMS73_2018SC1_ D73.1.4.1-2017-v0_201812. http://atmosphere.copernicus.eu/, 2018. Chevallier, F., Description of the CO2 inversion production chain. CAMS deliverable CAMS73_2018SC1_D73.5.2.1-2019_201904_CO2 inversion production chain_v1. http://atmosphere.copernicus.eu/, 2019. Chevallier, F., Remaud, M., O'Dell, C. W., Baker, D., Peylin, P., and Cozic, A.: Objective evaluation of surface- and satellite-driven CO2 atmospheric inversions, Atmos. Chem. Phys. Discuss., https://doi.org/10.5194/acp-2019-213, in review, 2019. Cooperative Global Atmospheric Data Integration Project. (2019). Multi-laboratory compilation of atmospheric carbon dioxide data for the period 1957-2017; obspack_co2_1_GLOBALVIEWplus_v4.2.1_2019-05-20 [Data set]. NOAA Earth System Research Laboratory, Global Monitoring Division. https://doi.org/10.25925/20190520 Detmers, R. G., O. Hasekamp, I. Aben, S. Houweling, T. T. van Leeuwen, A. Butz, J. Landgraf, P. Köhler, L. Guanter, and B. Poulter, Anomalous carbon uptake in Australia as seen by GOSAT, Geophys. Res. Lett., 42, 8177–8184, doi:10.1002/2015GL065161, 2015. Emanuel, K.: A Scheme for Representing Cumulus Convection in Large-Scale Models, J. Atmos. Sci., 48, 2313–2329, doi:10.1175/1520-0469(1991)048<2313:ASFRCC2.0.CO;2, 1991.
Copernicus Atmosphere Monitoring Service
Author 17 of 19
Krinner, G., Viovy, N., de Noblet-Ducoudré, N., Ogée, J., Polcher, J., Friedlingstein, P., Ciais, P., Sitch, S., and Prentice, I. C.: A dynamic global vegetation model for studies of the coupled atmosphere-biosphere system, Global Biogeochem. Cy., 19, GB1015, doi:10.1029/2003GB002199, 2005. Landschützer, P., N. Gruber and D.C.E. Bakker. 2015. An observation-based global monthly gridded sea surface pCO2 product from 1982 onward and its monthly climatology (NCEI Accession 0160558). Version 4.4. NOAA National Centers for Environmental Information. Dataset. https://doi.org/10.7289/V5Z899N6. [2019-03-27] Ma, X., A. Huete, J. Cleverly, D. Eamus, F. Chevallier, J. Joiner, B. Poulter, Y. Zhang, L. Guanter, W. Meyer, Z. Xie, G. Ponce-Campos, 2016: Drought rapidly disseminates the 2011 large CO2 uptake in semi-arid Australia. Scientific Reports, 6. doi: 10.1038/srep37747. NOAA Carbon Cycle Group ObsPack Team (2018): INPE atmospheric carbon dioxide data for the period 2015-2017; obspack_co2_1_INPE_RESTRICTED_v2.0_2018-11-13; NOAA Earth System Research Laboratory, Global Monitoring Division. http://dx.doi.org/10.25925/20181030. NOAA Carbon Cycle Group ObsPack Team. (2019). Multi-laboratory compilation of atmospheric carbon dioxide data for the years 2018-2019; obspack_co2_1_NRT_v4.4.1_2019-05-31 [Data set]. NOAA Earth System Research Laboratory, Global Monitoring Division. https://doi.org/10.25925/20190531 Poulter, B., D. Frank, P. Ciais, R. B. Myneni, N. Andela, J. Bi, G. Broquet, J. G. Canadell, F. Chevallier, Y. Y. Liu, S. W. Running, S. Sitch and G. R. van der Werf: Contribution of semi-arid ecosystems to interannual variability of the global carbon cycle. Nature, doi:10.1038/nature13376, 2014 Remaud, M., Chevallier, F., Cozic, A., Lin, X., and Bousquet, P.: On the impact of recent developments of the LMDz atmospheric general circulation model on the simulation of CO2 transport, Geosci. Model Dev., 11, 4489-4513, https://doi.org/10.5194/gmd-11-4489-2018, 2018. Stephens, B. B., et al.: Weak northern and strong tropical land carbon uptake from vertical profiles of atmospheric CO2, Science, 316, 1732–1735, 2007. Wunch, D., Toon, G. C., Blavier, J.-F. L., Washenfelder, R. A., Notholt, J., Connor, B. J., Griffith, D. W. T., Sherlock, V., and Wennberg, P. O., The Total Carbon Column Observing Network, Phil. Trans. R. Soc. A:2011369 2087-2112, doi10.1098/rsta.2010.0240, 2011. Wunch, D., Wennberg, P. O., Osterman, G., Fisher, B., Naylor, B., Roehl, C. M., O'Dell, C., Mandrake, L., Viatte, C., Kiel, M., Griffith, D. W. T., Deutscher, N. M., Velazco, V. A., Notholt, J., Warneke, T., Petri, C., De Maziere, M., Sha, M. K., Sussmann, R., Rettinger, M., Pollard, D., Robinson, J., Morino, I., Uchino, O., Hase, F., Blumenstock, T., Feist, D. G., Arnold, S. G., Strong, K., Mendonca, J., Kivi, R., Heikkinen, P., Iraci, L., Podolske, J., Hillyard, P. W., Kawakami, S., Dubey, M. K., Parker, H. A., Sepulveda, E., García, O. E., Te, Y., Jeseck, P., Gunson, M. R., Crisp, D., and Eldering, A.: Comparisons
Copernicus Atmosphere Monitoring Service
Author 18 of 19
of the Orbiting Carbon Observatory-2 (OCO-2) XCO2 measurements with TCCON, Atmos. Meas. Tech., 10, 2209-2238, https://doi.org/10.5194/amt-10-2209-2017, 2017.

Copernicus Atmosphere Monitoring Service
atmosphere.copernicus.eu copernicus.eu ecmwf.int
ECMWF - Shinfield Park, Reading RG2 9AX, UK
Contact: [email protected]
Related Documents


![How ocean CO 2 fluxes are estimated/measured Colm Sweeney [ csweeney@ldeo.columbia.edu ] Princeton University and Lamont-Doherty Earth Observatory.](https://static.cupdf.com/doc/110x72/56649ecf5503460f94bdd98c/how-ocean-co-2-fluxes-are-estimatedmeasured-colm-sweeney-csweeneyldeocolumbiaedu.jpg)