Validation of TROPOMI Surface UV Radiation Product Kaisa Lakkala 1,2 , Jukka Kujanpää 1 , Colette Brogniez 3 , Nicolas Henriot 3 , Antti Arola 2 , Margit Aun 2,4 , Frédérique Auriol 3 , Alkiviadis F. Bais 5 , Germar Bernhard 6 , Veerle De Bock 7 , Maxime Catalfamo 3 , Christine Deroo 3 , Henri Diémoz 8,9 , Luca Egli 10 , Jean-Baptiste Forestier 11 , Ilias Fountoulakis 8 , Rosa Delia Garcia 12,13 , Julian Gröbner 10 , Seppo Hassinen 1 , Anu Heikkilä 2 , Stuart Henderson 14 , Gregor Hülsen 10 , Bjørn Johnsen 15 , Niilo Kalakoski 1 , Angelos Karanikolas 5 , Tomi Karppinen 1 , Kevin Lamy 11 , Sergio F. León-Luis 13 , Anders V. Lindfors 16 , Jean-Marc Metzger 17 , Fanny Minvielle 3 , Harel B. Muskatel 18 , Thierry Portafaix 11 , Alberto Redondas 13 , Ricardo Sanchez 19 , Anna Maria Siani 20 , Tove Svendby 21 , and Johanna Tamminen 1 1 Finnish Meteorological Institute, Space and Earth Observation Centre 2 Finnish Meteorological Institute, Climate Research Programme 3 Univ. Lille, CNRS,UMR 8518, Laboratoire D’Optique Atmosphérique, Lille, France 4 University of Tartu, Estonia 5 Aristotle University of Thessaloniki, Greece 6 Biospherical Instruments, Inc, San Diego, U.S. 7 Royal Meteorological Institute of Belgium, Brussels, Belgium 8 Aosta Valley Regional Environmental Protection Agency (ARPA), Saint-Christophe, Italy 9 Institute of Atmospheric Science and Climate, ISAC-CNR, Rome, Italy 10 Physical Meteorological Observatory in Davos - World Radiation Center, Switzerland 11 LACy, Laboratoire de l’Atmosphère et des Cyclones (UMR 8105 CNRS, Université de La Réunion, Météo-France), Saint-Denis, Reunion Island, France 12 Atmospheric Optics Group, Valladolid University, Valladolid, Spain 13 Izaña Atmospheric Research Center (IARC), State Meteorological Agency (AEMET), Spain 14 Australian Radiation Protection And Nuclear Safety Agency 15 Norwegian Radiation and Nuclear Safety Authority, Norway 16 Finnish Meteorological Institute, Meteorological and Marine Research Programme 17 Observatoire des Sciences de l’Univers de La Réunion, UMS3365 (CNRS, Université de La Réunion, Météo-France), Saint-Denis de la Réunion, France 18 Israel Meteorological Service 19 National Meteorological Service, Argentina 20 Sapienza Università di Roma, Italy 21 NILU - Norwegian Institute for Air Research, Norway Correspondence: Kaisa Lakkala (kaisa.lakkala@fmi.fi) Abstract. The TROPOspheric Monitoring Instrument (TROPOMI) onboard the Sentinel-5 Precursor (S5P) satellite was launched on 13 October 2017 to provide the atmospheric composition for atmosphere and climate research. The S5P is a sun-synchronous polar-orbiting satellite providing global daily coverage. The TROPOMI swath is 2600 km wide, and the ground resolution for most data products is 7.2x3.5 km 2 (5.6x3.5 km 2 since 6 August 2019) at nadir. The Finnish Meteorological Institute (FMI) is responsible for the development and processing of the TROPOMI Surface Ultraviolet (UV) Radiation Product which includes 5 36 UV parameters in total. Ground-based data from 25 sites located in arctic, subarctic, temperate, equatorial and antarctic areas were used for validation of TROPOMI overpass irradiance at 305, 310, 324 and 380 nm, overpass erythemally weighted 1 https://doi.org/10.5194/amt-2020-121 Preprint. Discussion started: 15 June 2020 c Author(s) 2020. CC BY 4.0 License.

Welcome message from author
This document is posted to help you gain knowledge. Please leave a comment to let me know what you think about it! Share it to your friends and learn new things together.
Transcript
Validation of TROPOMI Surface UV Radiation ProductKaisa Lakkala1,2, Jukka Kujanpää1, Colette Brogniez3, Nicolas Henriot3, Antti Arola2, Margit Aun2,4,Frédérique Auriol3, Alkiviadis F. Bais5, Germar Bernhard6, Veerle De Bock7, Maxime Catalfamo3,Christine Deroo3, Henri Diémoz8,9, Luca Egli10, Jean-Baptiste Forestier11, Ilias Fountoulakis8, RosaDelia Garcia12,13, Julian Gröbner10, Seppo Hassinen1, Anu Heikkilä2, Stuart Henderson14,Gregor Hülsen10, Bjørn Johnsen15, Niilo Kalakoski1, Angelos Karanikolas5, Tomi Karppinen1,Kevin Lamy11, Sergio F. León-Luis13, Anders V. Lindfors16, Jean-Marc Metzger17, Fanny Minvielle3,Harel B. Muskatel18, Thierry Portafaix11, Alberto Redondas13, Ricardo Sanchez19, Anna Maria Siani20,Tove Svendby21, and Johanna Tamminen1
1Finnish Meteorological Institute, Space and Earth Observation Centre2Finnish Meteorological Institute, Climate Research Programme3Univ. Lille, CNRS,UMR 8518, Laboratoire D’Optique Atmosphérique, Lille, France4University of Tartu, Estonia5Aristotle University of Thessaloniki, Greece6Biospherical Instruments, Inc, San Diego, U.S.7Royal Meteorological Institute of Belgium, Brussels, Belgium8Aosta Valley Regional Environmental Protection Agency (ARPA), Saint-Christophe, Italy9Institute of Atmospheric Science and Climate, ISAC-CNR, Rome, Italy10Physical Meteorological Observatory in Davos - World Radiation Center, Switzerland11LACy, Laboratoire de l’Atmosphère et des Cyclones (UMR 8105 CNRS, Université de La Réunion, Météo-France),Saint-Denis, Reunion Island, France12Atmospheric Optics Group, Valladolid University, Valladolid, Spain13Izaña Atmospheric Research Center (IARC), State Meteorological Agency (AEMET), Spain14Australian Radiation Protection And Nuclear Safety Agency15Norwegian Radiation and Nuclear Safety Authority, Norway16Finnish Meteorological Institute, Meteorological and Marine Research Programme17Observatoire des Sciences de l’Univers de La Réunion, UMS3365 (CNRS, Université de La Réunion, Météo-France),Saint-Denis de la Réunion, France18Israel Meteorological Service19National Meteorological Service, Argentina20Sapienza Università di Roma, Italy21NILU - Norwegian Institute for Air Research, Norway
Correspondence: Kaisa Lakkala ([email protected])
Abstract. The TROPOspheric Monitoring Instrument (TROPOMI) onboard the Sentinel-5 Precursor (S5P) satellite was launched
on 13 October 2017 to provide the atmospheric composition for atmosphere and climate research. The S5P is a sun-synchronous
polar-orbiting satellite providing global daily coverage. The TROPOMI swath is 2600 km wide, and the ground resolution for
most data products is 7.2x3.5 km2 (5.6x3.5 km2 since 6 August 2019) at nadir. The Finnish Meteorological Institute (FMI) is
responsible for the development and processing of the TROPOMI Surface Ultraviolet (UV) Radiation Product which includes5
36 UV parameters in total. Ground-based data from 25 sites located in arctic, subarctic, temperate, equatorial and antarctic
areas were used for validation of TROPOMI overpass irradiance at 305, 310, 324 and 380 nm, overpass erythemally weighted
1
https://doi.org/10.5194/amt-2020-121Preprint. Discussion started: 15 June 2020c© Author(s) 2020. CC BY 4.0 License.
dose rate / UV index and erythemally weighted daily dose for the period from 1 January 2018 to 31 August 2019. The val-
idation results showed that for most sites 60–80% of TROPOMI data was within ±20% from ground-based data for snow
free surface conditions. The median relative differences to ground-based measurements of TROPOMI snow free surface daily10
doses were within ±10% and ±5% at two thirds and at half of the sites, respectively. At several sites more than 90% of clear
sky TROPOMI data were within ±20% from ground-based measurements. Generally median relative differences between
TROPOMI data and ground-based measurements were a little biased towards negative values, but at high latitudes where non-
homogeneous topography and albedo/snow conditions occurred, the negative bias was exceptionally high, from -30% to -65%.
Positive biases of 10–15% were also found for mountainous sites due to challenging topography. The TROPOMI Surface UV15
Radiation Product includes quality flags to detect increased uncertainties in the data due to heterogeneous surface albedo and
rough terrain which can be used to filter the data retrieved under challenging conditions.
Copyright statement. TEXT
1 Introduction
The Tropospheric Monitoring Instrument (TROPOMI) is a nadir-viewing imaging spectrometer measuring in the ultraviolet,20
visible, near-infrared, and the shortwave infrared wavelengths onboard the Sentinel-5 Precursor (S5P) polar-orbiting satellite.
The S5P was launched on 13 October 2017 as part of the EU Copernicus programme to monitor atmospheric composition with
nominal life time of seven years. The mission is a cooperative undertaking between the European Space Agency (ESA) and the
Netherlands. The S5P satellite is on a sun-synchronized afternoon orbit with an ascending node equatorial crossing at 13:30,
which provides global daily observations of the sunlit part of the Earth for air quality and climate applications. The S5P is the25
first Copernicus mission dedicated to atmospheric observations and it will be complemented by Sentinel 4 with geostationary
orbit and Sentinel 5 on sun-synchronous morning orbit with planned launches in the coming years. The TROPOMI Level 2 data
products include information of aerosols, carbon monoxide, clouds, formaldehyde, methane, nitrogen oxide, sulphur dioxide,
ozone and surface ultraviolet (UV) radiation. Other products are generated within the Copernicus ground system, while the
surface UV radiation is generated through the Finnish Sentinel collaborative ground segment.30
Solar UV radiation at short wavelengths (280-400 nm) is harmful for the whole ecosystem including humans, animals,
plants, aquatic environments and materials (e.g., EEAP, 2019, and references therein). For humans the well known harmful
effects of UV radiation are sunburns and other skin problems, increased risk of skin cancer and cataract, premature aging of
the skin and weakening of the immune system (EEAP, 2019). On the other hand UV radiation initiates vitamin D production
in the skin (Webb, 2006) and has many more positive effects (Juzeniene and Moan, 2012). The ozone layer in the stratosphere35
protects the Earth from the most dangerous UV wavelengths by absorbing the shortest part of the spectrum. In the late 1970s
the ozone layer was found to decrease at an alarming speed above Antarctica (Farman et al., 1985; WMO, 1990). Later, also
in the Arctic the total ozone was found to decrease in the spring and ozone trends turned to negative at mid-latitudes (WMO,
2
https://doi.org/10.5194/amt-2020-121Preprint. Discussion started: 15 June 2020c© Author(s) 2020. CC BY 4.0 License.

1999). The international Montreal Protocol was signed in 1987 to restrict ozone depleting substances, which has led to the start
of the recovery of the ozone layer (WMO, 2018). Despite the slow ozone recovery at middle latitudes and in the polar regions,40
ozone loss occurrences can still be experienced related to circulation patterns, which in turn affect solar UV levels at ground
(Petkov et al., 2014; Fountoulakis et al., 2020).
Ground-based UV monitoring started to increase in the late 1980s to respond to the concerns about increased surface UV
levels due to the depleting ozone layer (Solomon et al., 1986). However, the ground-based UV monitoring network is sparse
from a global point of view and many places are not covered. The advantage of retrievals from space is that satellites provide45
global coverage of biologically effective UV parameters. The disadvantage is that for polar-orbiting satellites there is only one
overpass per day for most sites. However, daily doses can be estimated using combination of radiative transfer calculations and
measurements from satellite instrument during the overpass (e.g., Kalliskota et al., 2000; Tanskanen et al., 2007).
The Finnish Meteorological Institute is responsible for the development, processing and archiving of the TROPOMI Surface
UV Radiation Product, which continues UV records started by NASA Total Ozone Mapping Spectrometer (TOMS) instrument50
in 1978 (Eck et al., 1995; Krotkov et al., 2001) and followed by the Dutch-Finnish Ozone Monitoring Instrument (OMI)
onboard NASA’s Aura satellite launched in 2004 (Levelt et al., 2006; Tanskanen et al., 2006). Compared to the preceding
instruments, TROPOMI has an increased spatial resolution with a swath of 2600 km including 450 across-track pixels. The
ground resolution of the UV product was 7.2x3.5 km2 at nadir until 6 August 2019, and is 5.6x3.5 km2 since then. The
TROPOMI Surface UV Radiation Product responds to the increasing need of information regarding the troposheric chemistry55
and biologically active wavelengths of the solar spectrum reaching the surface. In this paper, overpass irradiances at 305, 310,
324 and 380 nm, overpass erythemally weighted dose rates / UV index and daily doses are validated against well maintained
and calibrated ground-based spectroradiometer, broadband and multichannel radiometer measurements from 25 sites.
2 Data
2.1 TROPOMI surface UV radiation product60
The TROPOMI surface UV algorithm is explained in detail in Lindfors et al. (2018) and Kujanpää et al. (2020). It is based on
the heritage of the surface UV algorithms for the TOMS (Eck et al., 1995; Krotkov et al., 2001; Herman et al., 2009), the OMI
(Levelt et al., 2006; Tanskanen et al., 2006; Arola et al., 2009) and the offline UV product (OUV) of the EUMETSAT Satellite
Application Facility on Atmospheric Composition Monitoring (AC SAF) (Kujanpää and Kalakoski, 2015). Satellite surface
UV products are based on radiative transfer modelling using as main inputs: solar zenith angle (SZA), total ozone column,65
cloud optical depth, aerosol optical properties, surface pressure and surface albedo. For the TROPOMI product, the VLIDORT
radiative transfer model (Spurr, 2006) is used for the radiative transfer calculations.
The TROPOMI UV algorithm is based on two pre-computed lookup tables (LUT) in order to save computing time compared
to runtime radiative transfer calculations. The first LUT is used to retrieve the cloud optical depth from the measured 354 nm
reflectance using SZA, viewing zenith angle, relative azimuth angle, surface pressure and surface albedo as other inputs. The70
measured 354 nm reflectance together with the angles and surface pressure are obtained from the TROPOMI L2 aerosol index
3
https://doi.org/10.5194/amt-2020-121Preprint. Discussion started: 15 June 2020c© Author(s) 2020. CC BY 4.0 License.

(AI) product (Stein Zweers, 2018) while the surface albedo is obtained from the surface albedo climatology used in the AC
SAF OUV product (Kujanpää and Kalakoski, 2015). More details can be found in Sect. 3.3 of Lindfors et al. (2018). The
second LUT stores the irradiances and dose rates as a function of total ozone column, surface pressure, surface albedo, cloud
optical depth and SZA. The irradiances and dose rates are obtained by Lagrange polynomial interpolation using the total ozone75
column from the offline version of the TROPOMI L2 total ozone column product (Garane et al., 2019). Surface albedo and
pressure are the same as in the first step. The SZA is either the overpass time value or calculated for the solar noon time. A
post-correction for the effect of absorbing aerosols based on an aerosol climatology by Kinne et al. (2013) is applied to the
irradiances (Arola et al., 2009). The correction for erythemal and vitamin D synthesis weightings is the same as for the 310 nm
irradiance. A correction for the variation in Sun-Earth distance is also applied in the post-processing step.80
The TROPOMI L2 UV product contains 36 UV parameters in total (Table 1), including irradiances at four different wave-
lengths and dose rates for erythemal (Commission Internationale de l’Eclairage, 1998) and vitamin D synthesis (Bouillon et al.,
2006) action spectra. All parameters are calculated for overpass time, solar noon time, and for theoretical clear sky conditions
with no clouds or aerosols. Daily doses and accumulated irradiances are also calculated by integrating over the sunlit part of
the day. As the cloud optical depth is retrieved at the overpass time, the uncertainties in the final cumulative product (daily dose85
and accumulated irradiances) increases especially for changing cloudiness. For rapidly changing cloudiness the effect is seen
also in noon parameters. In addition to UV parameters, quality flags related to the UV product and processing are generated
(Kujanpää, 2020). The processing quality flags are a standard set included in all TROPOMI L2 products while the product
quality flags are specific to the surface UV product. A continuous overall quality value number (UVQAV ∈ [0,1], over 0.5
representing the most reliable data) computed from the product quality flags indicates increasing product quality and can be90
used together with the quality flags to filter out problematic data.
The level 2 data are stored in netCDF-4/HDF5 format. One file is ca. 250 MB (190 MB before 6 Aug 2019) in size. UV
product version 1.02.02 was used for the current study. The input total ozone and aerosol index files were collected from the
reprocessed and offline data in order to construct as homogeneous a time-series as possible. However, the total ozone product
version varies from 1.01.02 (starting from 7 Nov 2017) to 1.01.05 (15 Apr 2018) to 1.07.07 (30 Apr 2018) while the aerosol95
index product version goes from 1.00.01 (7 Nov 2017) to 1.02.02 (15 Apr 2018) to 1.03.01 (30 Apr 2018) to 1.03.02 (27 Jun
2019).
To facilitate the validation work, ground station overpass text files containing the UV parameters and supporting input and
quality flag data were extracted from the large L2 files. The extractor (version 1.02.00) computes the great-circle distance
between the ground station and TROPOMI pixel centre coordinates using the haversine formula and the Earth radius at the100
ground station coordinates. When the great-circle distance is smaller than a pre-defined limit, here set to 10 km, the data for
the TROPOMI ground pixel are stored. No interpolation between the ground pixels is performed.
4
https://doi.org/10.5194/amt-2020-121Preprint. Discussion started: 15 June 2020c© Author(s) 2020. CC BY 4.0 License.
Table 1. TROPOMI surface UV parameters
Overpass and solar noon time irradiance at 305, 310, 324 and 380 nm [W/m2/nm]
Overpass and solar noon time dose rate for erythemal and vitamin D synthesis action spectra [W/m2]
Daily accumulated irradiances at 305, 310, 324 and 380 nm [J/m2]
Daily dose for erythemal and Vitamin D synthesis action spectra [J/m2]
Overpass and solar noon time UV index (dimensionless)
+ all parameters for clear sky conditions (no clouds nor aerosols)
+ quality flags (UV product and processing flags, and UV quality value (UVQAV))
2.2 Ground-based reference data
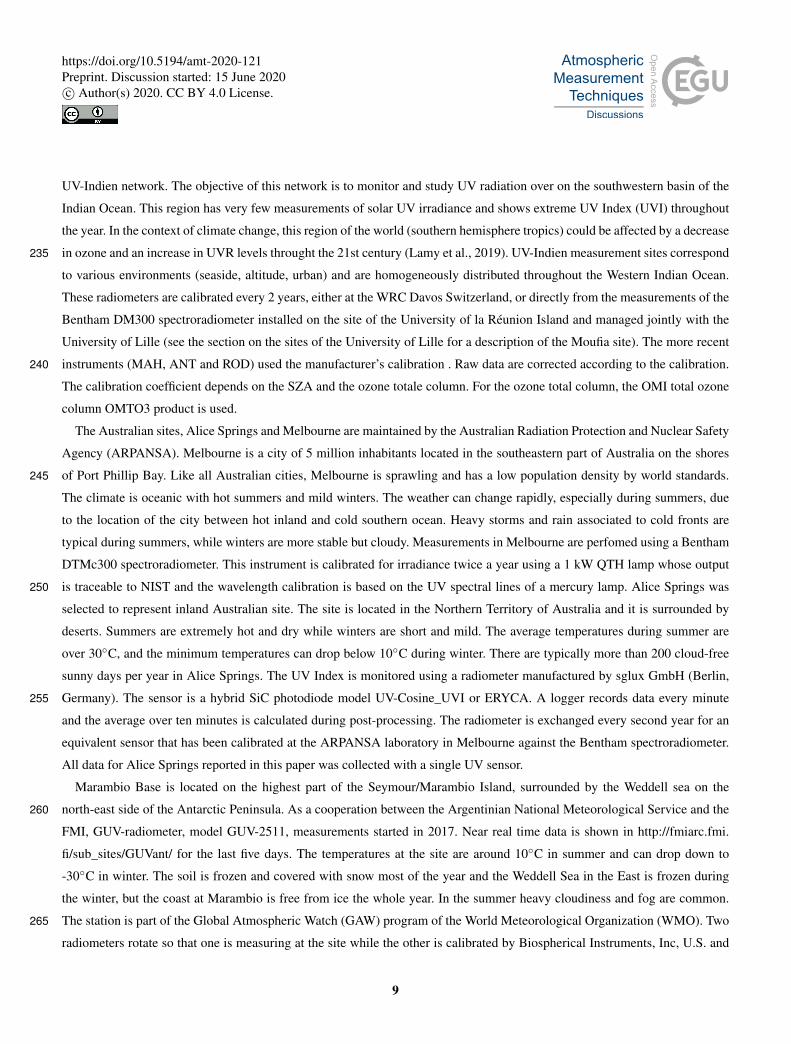
The TROPOMI surface UV radiation product is compared with ground-based UV measurements. The location and charac-
teristics of the sites are shown in Fig. 1 and Table 2 in which they are listed from North to South. The sites were chosen to105
represent different latitudes, longitudes and topography. The sites are located in arctic, subarctic, temperate, equatorial and
antarctic areas including inland, coastal and mountainous stations. At few stations, snow occurs during some period of the
year. Ground-based UV measurements are performed using spectroradiometers, broadband and multiband radiometers. The
instrumentation and its characteristics are shown in Tables 3 and 4. Many of the spectroradiometers have participated in on-site
quality assurance of spectral solar UV measurements performed by the traveling reference spectroradiometer QASUME since110
2002 (Gröbner et al., 2005). The reports of the site visits can be found at https://www.pmodwrc.ch/en/world-radiation-center-
2/wcc-uv/qasume-site-audits/.
The Norwegian UV Monitoring Program includes UV measurements at 9 sites throughout Norway. It is a cooperation
between the Norwegian Radiation and Nuclear Safety Authority (DSA), Norwegian Institute for Air Research (NILU) and the
University of Oslo. Four sites were chosen for this study based on their latitude and topography. Ny-Ålesund is the northernmost115
site and located in Svalbard. Measurements from the GUV-instrument reveals snow cover typically from mid of September to
early July (albedo >0.2). The seasonal maximum albedo is 0.8, but during the later years the albedo is now 0.5-0.6. Andøya is
located at the tip of a long island, locally influenced by snow in winter and spring. The sea around the site is usually open. Finse
is a mountain village at an altitude of 1200 m, close to the Hardanger-Jøkulen glacier. Measurements from the GUV instrument
reveal snow cover typically lasting from 20 September to mid of July (albedo >0.2), but the timing of the melting season may120
be shifted by ±1 month (2015 and 2018), interspersed with periods with wet snow (end of April 2019). The maximum albedo
exceeds 0.90. Blindern is located at the suburban area of the city of Oslo. At all sites, the cloudiness is characterized by rapidly
moving clouds. The network is equipped with GUV multifilter radiometers which measure UV irradiance at five channels as
one minute averages. The data is used to retrieve the UV index and UV dose rates using several action spectra (Bernhard et al.,
2005; Johnsen et al., 2002, 2008) and is freely available at https://github.com/uvnrpa/. The quality assurance of the network125
includes transfer of the absolute calibration using a regularly calibrated traveling reference. The data is corrected for drift and
5
https://doi.org/10.5194/amt-2020-121Preprint. Discussion started: 15 June 2020c© Author(s) 2020. CC BY 4.0 License.

for angular dependency. Intercomparisons of UVI against the QASUME reference (2003, 2005, 2009, 2010, 2014, 2019) show
an interquartile range within ±5% for all GUV instruments and campaigns performed within the period 2003-2019.
The FMI performs spectral UV measurements with Brewer spectroradiometers in the South of Finland in Helsinki and in the
North in Sodankylä. The spectral time series of Sodankylä is one of the longest in the Arctic (Lakkala et al., 2003). The site in130
Helsinki is located in the vicinity of the city centre, but characterized by urban green area. The measurements are performed at
the roof of the FMI main building and the horizon is free except in the North side. The weather is characterized by convective
cloudiness in summer afternoons and humid winters. UV measurements in Sodankylä are part of the research infrastructure of
the Arctic Space Centre. The research centre is located 5 km from the village by the river Kitinen and surrounded by swamps
and boreal forest. Snow occurs from October to April/May. Temperatures can reach -40◦C and +30◦C in winter and summer,135
respectively. The Sun is below the horizon for a couple of weeks during winter, and stays above the horizon during a couple
of weeks around mid-summer. The FMI Brewer spectroradiometers are calibrated every second or third month using 1 kW
lamps in the laboratory (Lakkala et al., 2016). The primary calibration lamps are calibrated yearly at the National Standard
Laboratory MIKES-Aalto (Heikkilä et al., 2016; Kübarsepp et al., 2000). The quality assurance of the measurements includes
corrections for temperature dependence and cosine error (Lakkala et al., 2008; Mäkelä et al., 2016; Lakkala et al., 2018) and140
data are submitted to the European UV data base (Heikkilä et al., 2016). Data is regularly compared to the QASUME reference
and differences of less than 6% have been found for wavelengths > 305 nm (Lakkala et al., 2008).
The Royal Meteorological Institute of Belgium operates two Brewer spectrophotometers on the roof of its building at Uccle,
a residential suburb of Brussels about 100 km from the shore of the North Sea. The climate is influenced by the Gulf stream
with mild winters and warm summers. Cloudiness is most of the time variable. The measurements of the Brewer no. 178145
were used in this study. It is a double monochromator Mk III which was installed in September 2001. The raw UV counts
are converted to counts per second and corrected for instrument dead time, dark count and temperature. Brewer measurements
are calibrated with 50 W tungsten halogen lamps on a monthly basis and with 1 kW lamps during less frequent but regular
intercomparisons. The instruments were also compared with the traveling QUASUME (Quality Assurance of Spectral UV
Measurements in Europe) unit in 2004 (Gröbner et al., 2006).150
The Laboratoire d’Optique Atmosphérique (LOA) performs spectral UV measurements with Bentham spectroradiometers
at three French sites, in metropolitan and overseas regions (Brogniez et al., 2016). The first site, Villeneuve d’Ascq (VDA),
is a semi-urban site located in a flat region of the North of France close to Lille. It is characterized by an oceanic midlatitude
climate (warm summers, mild humid winters). The second site, Observatory of Haute-Provence (OHP), is a rural mountainous
site located in the French Southern Alps. It is characterized by a mountainous Mediterranean climate (warm summers, harsh155
winters). The third site, Saint-Denis (OPA) is a coastal urban site located on the Moufia campus in the small mountainous
island of La Réunion in the Indian Ocean. This environment leads to frequent occurrence of orographic clouds forming in
early afternoon especially in summer. OPA is characterized by a tropical climate (hot-humid summers, mild-warm winters). At
the tropical site UV radiation level in summer is much higher around noon than at the two metropolitan sites due to a higher
sun elevation and a lower total ozone column. Note that, at VDA and OHP sites, absorbing aerosols are present, and need160
to be accounted for in satellite UV algorithms (Arola et al., 2009). Due to its oceanic and mountainous surroundings, OPA
6
https://doi.org/10.5194/amt-2020-121Preprint. Discussion started: 15 June 2020c© Author(s) 2020. CC BY 4.0 License.

is a challenging site for satellite validation, since there might be a large spatial variability of cloud cover and surface type in
a satellite pixel. The three instruments are affiliated with NDACC (Network for the Detection of Atmospheric Composition
Change), thus to meet the requirements of this network they are calibrated every 2-4 months with 1kW lamps traceable to
National Institute of Standards and Technology (NIST) and the measurements are corrected from wavelength misalignment165
and cosine response. Following Bernhard and Seckmeyer (1999), the expanded uncertainties (k=2) are 5.3% at VDA and OHP
and 5% at OPA. At OHP and OPA global irradiance measurements are available every 15 min. At VDA, scans are performed
every 30 min. Spectroradiometer’s data have been already used for OMI validation (Buchard et al., 2008; Brogniez et al., 2016).
Central European mountainous sites are Davos in Switzerland and Aosta in Italy. Both sites are located in the Alps: Aosta
(570 m a.s.l.) being located in a large valley floor with a wide field of view, surrounded by mountains (as high as 3500 m a.s.l.),170
and Davos a mountainous site stretching from around 1500 m a.s.l. to just above 3000 m. a.s.l. in altitude. UV measurements in
Aosta are maintained by ARPA and performed with a Bentham DTMc300 spectroradiometer, which is calibrated on a monthly
basis using a set of three 200 W lamps, recently complemented with a setup including two 1 kW lamps. The spectroradiometer
is additionally compared to the world calibration reference QASUME every second year. Average differences are generally
within ±2%, with a diurnal variability below 4%. The whole dataset has been subjected to QA/QC and has been recently175
re-evaluated and homogenized. The expanded uncertainty for wavelengths above 305 nm and SZAs below 70 degrees is 4%.
For larger SZAs and shorter wavelengths the uncertainty is larger, reaching 11% at 300 nm when SZA is 75 degrees. The
spectroradiometer is preprogrammed to take measurements every 15 minutes. Weather in Aosta is characterized by warm
summer, when convective clouds usually develop along the mountain slopes, and dry winter. Snowfalls occur at the station
during some winter days in December-March, while the mountains around the station are covered by snow for most part of the180
year (October-June).
The measurements of the Swiss site Davos are part of the Physikalisch-Meteorologisches Observatorium Davos, World
Radiation Centre (PMOD-WRC). They include spectroradiometer measurements performed with the World reference spectro-
radiometer QASUMEII and with the double Brewer #163 using an optimized diffuser (Gröbner, 2003). The spectral solar UV
irradiance measurements are traceable to the SI using a set of transfer standards (Gröbner and Sperfeld, 2005). The expanded185
uncertainty of the spectral solar UV irradiance measurements (k=2) is 1.7% for overcast situations (diffuse sky), and 2.0% for
clear sky situations (Hülsen et al., 2016). In addition, 5 broadband UV radiometers (SL1492, SL3860, SL1492, YES010938,
KZ 560) measure solar UV irradiance continuously at the site. The average of these measurements is used in this study. The
estimated expanded uncertainty (k=2) throughout the year for clear sky measurements of these radiometers is 3.6%, while for
all sky conditions the expanded uncertainty is increased to 6.6% due to the increased uncertainty for broken cloud conditions190
and the corresponding uncertainty of the angular response cosine correction applied to the radiometers. In Davos, mountains
limit the field of view so the diffuse radiation is reduced approximately by 5%. There is snow cover from November to March.
Rome and Thessaloniki are both urban sites at the Mediterranean coast. The climate at both sites is characterized by mild
humid winters and warm dry summers. Both sites are occasionally under the influence of Saharan dust (Amiridis et al., 2005;
Gobbi et al., 2019), which is seen as increased aerosol concentration. The aerosol load can also be increased due to pollution195
(Fountoulakis et al., 2019). In the summer, most of the days are sunny. In Thessaloniki measurements are performed by
7
https://doi.org/10.5194/amt-2020-121Preprint. Discussion started: 15 June 2020c© Author(s) 2020. CC BY 4.0 License.
the Aristotle University of Thessaloniki with a Brewer MKIII spectroradiometer. The quality assurance of the measurements
include: 1 kW lamp calibrations traceable to PTB, temperature and cosine correction (Bais et al., 1998; Garane et al., 2006;
Fountoulakis et al., 2017). Detailed information on data quality control and analysis can be found in Fountoulakis et al. (2016).
The measurements of Rome are maintained by Sapienza Università di Roma and are performed with a Brewer spectrora-200
diometer. UV irradiance and total ozone content have been measured since 1992 at Rome by the Brewer Mk IV spectropho-
tometer No. 067. The overall performance of Brewer 067 has been controlled every 2 years since 1992 by the intercomparison
with the traveling standard reference Brewer 017 from International Ozone Services Inc. (IOS), (Siani et al., 2018).The last
calibration was performed in July 2019 and the UV calibration was completed using IOS 1 kW lamp. UV data are processed
using cosine and temperature correction. The instrument was also compared with the traveling spectroradiometer QUASUME205
unit during the UV intercomparison campaign in Arosa (Switzerland) in 2012. UV measurements are taken every 30 minutes.
Measurements at the Israeli sites, Bet-Dagan, Jerusalem and Eilat are maintained by the Israel Meteorological service (IMS).
Bet-Dagan station is located in open shrublands near Tel-Aviv metropolis on the coast of the Mediterranean Sea. It is charac-
terized by hot and humid summers and mild winters. The city of Jerusalem is located on the Judean Mountains with hot and
dry summers and cold winters. Most of the rain occurs between October and May. Eilat is located on the north coast of the210
Red Sea surrounded by the mountains of Eilat. The climate there is typical for deserts with hot and arid conditions, the maxi-
mum temperature in summer are often over 40◦C with constant clear skies conditions between June and September. Winter is
also relatively hot with maximum temperatures around 20◦C and with an annual average precipitation of 25 mm. UV index is
monitored every minute by calibrated Yankee Environmental Systems (YES) UVB-1 radiometers, and the data is saved as 10
minute averages.215
The Izaña Atmospheric Observatory is a high-mountain station located on the island of Tenerife (Canary Islands, Spain;
2373 m a.s.l.). The observatory is thus located in the region below the descending branch of the Hadley cell, typically above a
stable inversion layer and on an island far away from any significant industrial activities. This ensures clean-air and clear-sky
conditions all year. This predominant meteorological conditions of trade wind inversion give rise to the presence of a dense
stratocumulus layer of clouds lying below the observatory (García et al., 2016). The surroundings of the observatory is char-220
acterized by low bushes and rocks (García et al., 2019).The UV measurements reported are performed with a Brewer no. 183
from the European Brewer Calibration Centre (RBCC-E) maintained by the Spanish State Meteorological Agency (AEMET).
The RBCC-E triad is calibrated annually from of 1 KW (NIST traceable) lamps used the observatory facilities (Guirado et al.,
2012). The UV response of each instrument is checked regularly used a 200W portable lamp system (Sierra Ramos, 2012). In
addition, during the RBCC-E campaign, the travelling reference Brewer no. 185 is compared every year with the QASUME225
unit from PMOD-WRC (Egli, 2019; Gröbner et al., 2006). The comparison has been shown to be within 2% with a daily
variation of less than 5%. Then, in the Izaña Observatory, the UV measurements of Brewer no. 183 and no. 157 are intercom-
pared with those obtained by the Brewer no. 185 to check its calibration. The difference between Brewer no. 183 used in this
comparison and Brewer no. 185 is arround 1%.
The University of La Réunion monitors UV radiation with Kipp&Zonen UVS-E-T radiometers at four sites: Mahé - Sey-230
chelles, Antananarivo - Madagascar, Anse Quitor - Rodriguez, and Saint-Denis - Reunion Island. The stations are part of the
8
https://doi.org/10.5194/amt-2020-121Preprint. Discussion started: 15 June 2020c© Author(s) 2020. CC BY 4.0 License.
UV-Indien network. The objective of this network is to monitor and study UV radiation over on the southwestern basin of the
Indian Ocean. This region has very few measurements of solar UV irradiance and shows extreme UV Index (UVI) throughout
the year. In the context of climate change, this region of the world (southern hemisphere tropics) could be affected by a decrease
in ozone and an increase in UVR levels throught the 21st century (Lamy et al., 2019). UV-Indien measurement sites correspond235
to various environments (seaside, altitude, urban) and are homogeneously distributed throughout the Western Indian Ocean.
These radiometers are calibrated every 2 years, either at the WRC Davos Switzerland, or directly from the measurements of the
Bentham DM300 spectroradiometer installed on the site of the University of la Réunion Island and managed jointly with the
University of Lille (see the section on the sites of the University of Lille for a description of the Moufia site). The more recent
instruments (MAH, ANT and ROD) used the manufacturer’s calibration . Raw data are corrected according to the calibration.240
The calibration coefficient depends on the SZA and the ozone totale column. For the ozone total column, the OMI total ozone
column OMTO3 product is used.
The Australian sites, Alice Springs and Melbourne are maintained by the Australian Radiation Protection and Nuclear Safety
Agency (ARPANSA). Melbourne is a city of 5 million inhabitants located in the southeastern part of Australia on the shores
of Port Phillip Bay. Like all Australian cities, Melbourne is sprawling and has a low population density by world standards.245
The climate is oceanic with hot summers and mild winters. The weather can change rapidly, especially during summers, due
to the location of the city between hot inland and cold southern ocean. Heavy storms and rain associated to cold fronts are
typical during summers, while winters are more stable but cloudy. Measurements in Melbourne are perfomed using a Bentham
DTMc300 spectroradiometer. This instrument is calibrated for irradiance twice a year using a 1 kW QTH lamp whose output
is traceable to NIST and the wavelength calibration is based on the UV spectral lines of a mercury lamp. Alice Springs was250
selected to represent inland Australian site. The site is located in the Northern Territory of Australia and it is surrounded by
deserts. Summers are extremely hot and dry while winters are short and mild. The average temperatures during summer are
over 30◦C, and the minimum temperatures can drop below 10◦C during winter. There are typically more than 200 cloud-free
sunny days per year in Alice Springs. The UV Index is monitored using a radiometer manufactured by sglux GmbH (Berlin,
Germany). The sensor is a hybrid SiC photodiode model UV-Cosine_UVI or ERYCA. A logger records data every minute255
and the average over ten minutes is calculated during post-processing. The radiometer is exchanged every second year for an
equivalent sensor that has been calibrated at the ARPANSA laboratory in Melbourne against the Bentham spectroradiometer.
All data for Alice Springs reported in this paper was collected with a single UV sensor.
Marambio Base is located on the highest part of the Seymour/Marambio Island, surrounded by the Weddell sea on the
north-east side of the Antarctic Peninsula. As a cooperation between the Argentinian National Meteorological Service and the260
FMI, GUV-radiometer, model GUV-2511, measurements started in 2017. Near real time data is shown in http://fmiarc.fmi.
fi/sub_sites/GUVant/ for the last five days. The temperatures at the site are around 10◦C in summer and can drop down to
-30◦C in winter. The soil is frozen and covered with snow most of the year and the Weddell Sea in the East is frozen during
the winter, but the coast at Marambio is free from ice the whole year. In the summer heavy cloudiness and fog are common.
The station is part of the Global Atmospheric Watch (GAW) program of the World Meteorological Organization (WMO). Two265
radiometers rotate so that one is measuring at the site while the other is calibrated by Biospherical Instruments, Inc, U.S. and
9
https://doi.org/10.5194/amt-2020-121Preprint. Discussion started: 15 June 2020c© Author(s) 2020. CC BY 4.0 License.
also participates in solar comparisons in Sodankylä, Finland. The expanded (k=2) uncertainty of the GUV measurements in
Marambio is 9% at SZAs smaller than 80◦.
Palmer Station is located on Anvers Island on the west coast of the Antarctic continent. It is a research station of the United
States, operated by the U.S. National Science Foundation. UV measurements are performed with a SUV-100 spectroradiometer270
and are part of the NOAA Antarctic UV monitoring network. The effective albedo at Palmer Station is about 0.8 in winter and
0.4 in summer (Bernhard et al., 2005). The sea adjacent to the station is frozen during winter and open during summer.
Temperatures can fall below -20◦C in winter and can reach up to 10◦C in summer. Heavy winds are frequent during winter
time. The quality assurance of the spectroradiometer was described by Bernhard et al. (2005) and includes comparisons with
results of radiative transfer models and measurements of a GUV-511 multi-channel filter radiometer that is deployed next to275
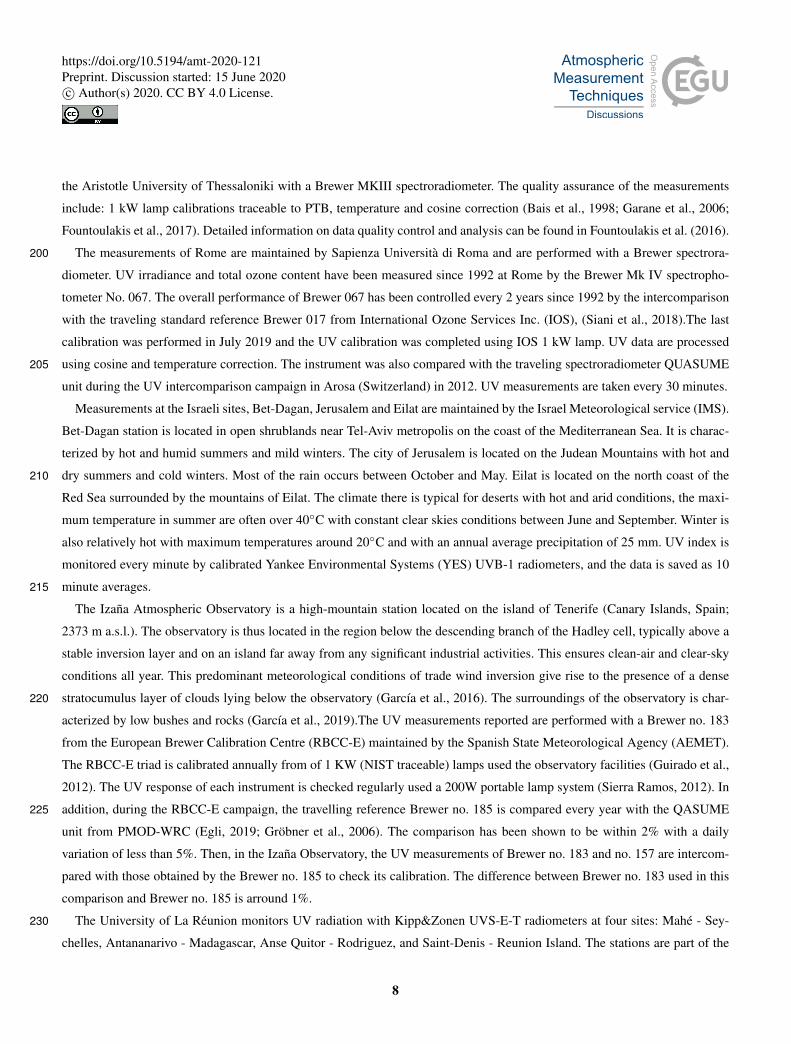
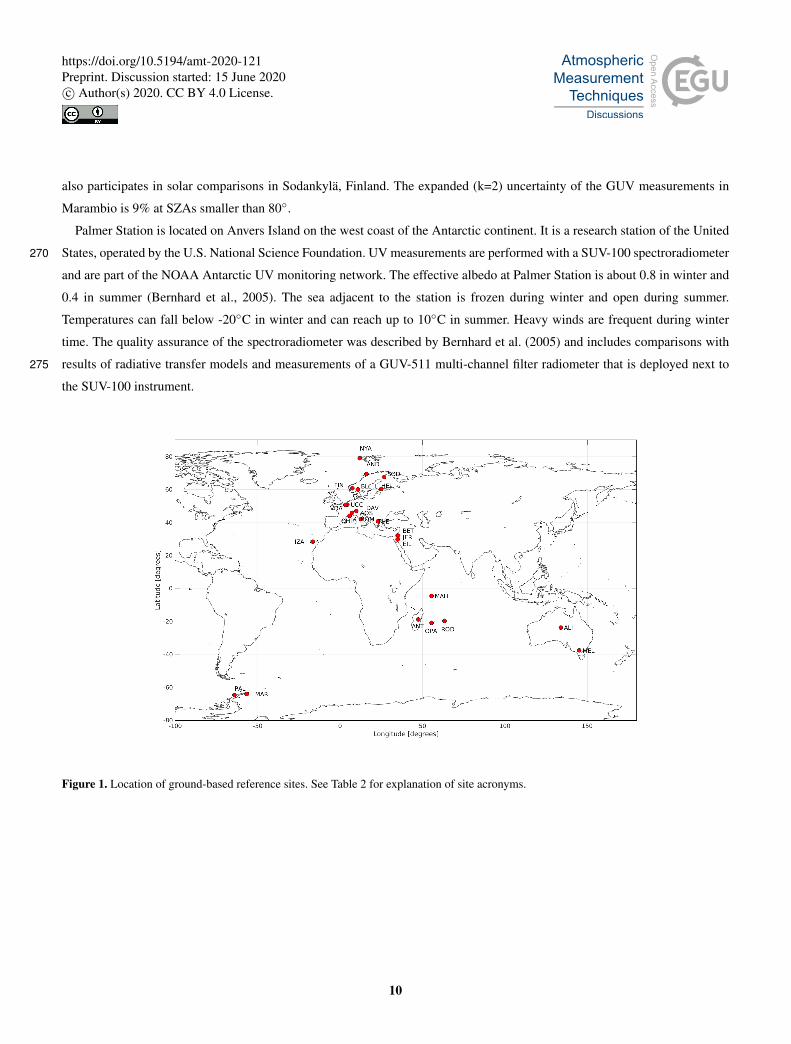
the SUV-100 instrument.
Figure 1. Location of ground-based reference sites. See Table 2 for explanation of site acronyms.
10
https://doi.org/10.5194/amt-2020-121Preprint. Discussion started: 15 June 2020c© Author(s) 2020. CC BY 4.0 License.
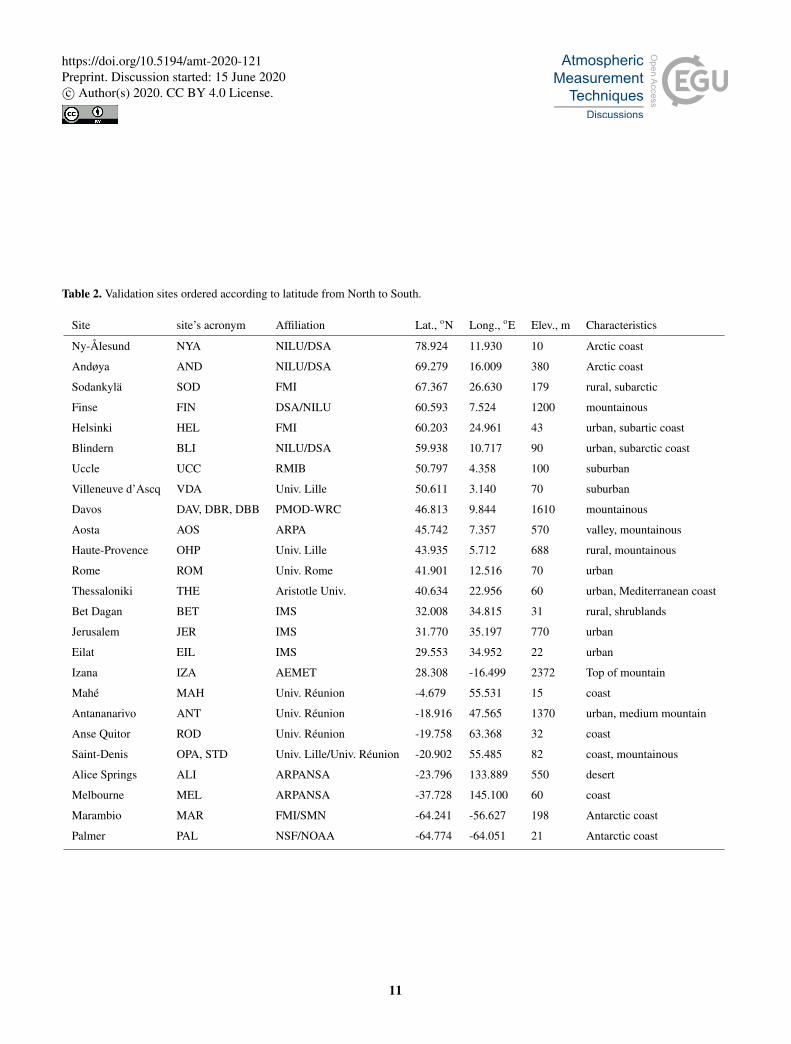
Table 2. Validation sites ordered according to latitude from North to South.
Site site’s acronym Affiliation Lat., oN Long., oE Elev., m Characteristics
Ny-Ålesund NYA NILU/DSA 78.924 11.930 10 Arctic coast
Andøya AND NILU/DSA 69.279 16.009 380 Arctic coast
Sodankylä SOD FMI 67.367 26.630 179 rural, subarctic
Finse FIN DSA/NILU 60.593 7.524 1200 mountainous
Helsinki HEL FMI 60.203 24.961 43 urban, subartic coast
Blindern BLI NILU/DSA 59.938 10.717 90 urban, subarctic coast
Uccle UCC RMIB 50.797 4.358 100 suburban
Villeneuve d’Ascq VDA Univ. Lille 50.611 3.140 70 suburban
Davos DAV, DBR, DBB PMOD-WRC 46.813 9.844 1610 mountainous
Aosta AOS ARPA 45.742 7.357 570 valley, mountainous
Haute-Provence OHP Univ. Lille 43.935 5.712 688 rural, mountainous
Rome ROM Univ. Rome 41.901 12.516 70 urban
Thessaloniki THE Aristotle Univ. 40.634 22.956 60 urban, Mediterranean coast
Bet Dagan BET IMS 32.008 34.815 31 rural, shrublands
Jerusalem JER IMS 31.770 35.197 770 urban
Eilat EIL IMS 29.553 34.952 22 urban
Izana IZA AEMET 28.308 -16.499 2372 Top of mountain
Mahé MAH Univ. Réunion -4.679 55.531 15 coast
Antananarivo ANT Univ. Réunion -18.916 47.565 1370 urban, medium mountain
Anse Quitor ROD Univ. Réunion -19.758 63.368 32 coast
Saint-Denis OPA, STD Univ. Lille/Univ. Réunion -20.902 55.485 82 coast, mountainous
Alice Springs ALI ARPANSA -23.796 133.889 550 desert
Melbourne MEL ARPANSA -37.728 145.100 60 coast
Marambio MAR FMI/SMN -64.241 -56.627 198 Antarctic coast
Palmer PAL NSF/NOAA -64.774 -64.051 21 Antarctic coast
11
https://doi.org/10.5194/amt-2020-121Preprint. Discussion started: 15 June 2020c© Author(s) 2020. CC BY 4.0 License.
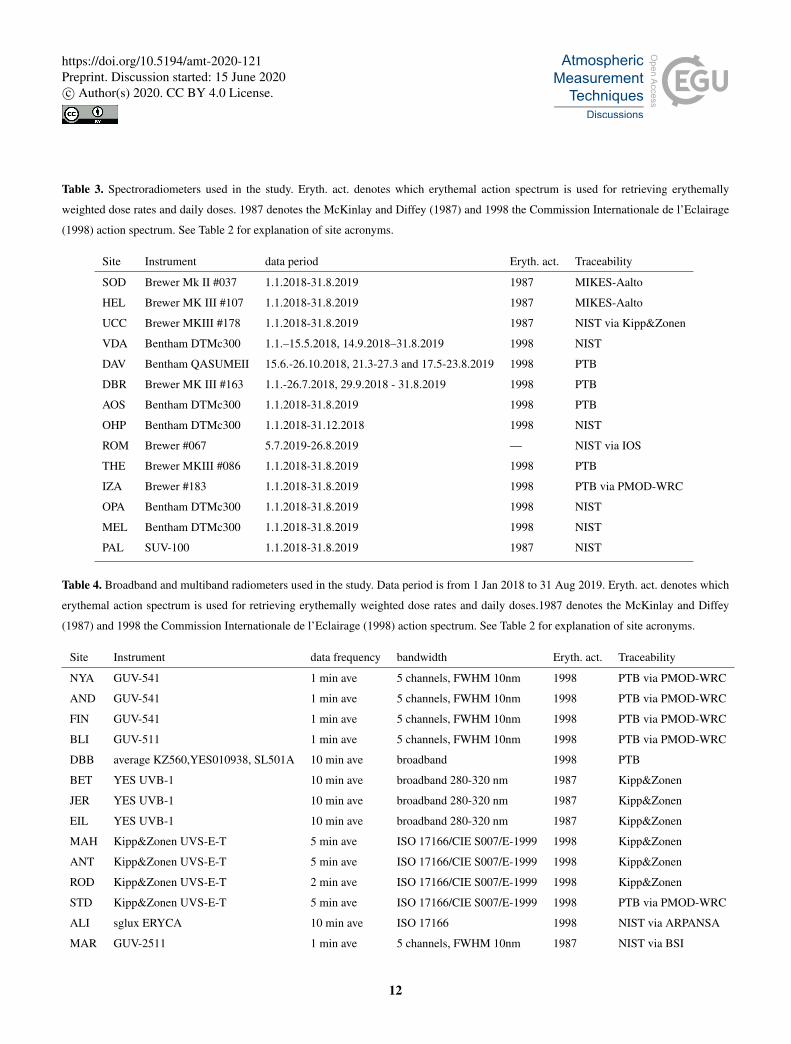
Table 3. Spectroradiometers used in the study. Eryth. act. denotes which erythemal action spectrum is used for retrieving erythemally
weighted dose rates and daily doses. 1987 denotes the McKinlay and Diffey (1987) and 1998 the Commission Internationale de l’Eclairage
(1998) action spectrum. See Table 2 for explanation of site acronyms.
Site Instrument data period Eryth. act. Traceability
SOD Brewer Mk II #037 1.1.2018-31.8.2019 1987 MIKES-Aalto
HEL Brewer MK III #107 1.1.2018-31.8.2019 1987 MIKES-Aalto
UCC Brewer MKIII #178 1.1.2018-31.8.2019 1987 NIST via Kipp&Zonen
VDA Bentham DTMc300 1.1.–15.5.2018, 14.9.2018–31.8.2019 1998 NIST
DAV Bentham QASUMEII 15.6.-26.10.2018, 21.3-27.3 and 17.5-23.8.2019 1998 PTB
DBR Brewer MK III #163 1.1.-26.7.2018, 29.9.2018 - 31.8.2019 1998 PTB
AOS Bentham DTMc300 1.1.2018-31.8.2019 1998 PTB
OHP Bentham DTMc300 1.1.2018-31.12.2018 1998 NIST
ROM Brewer #067 5.7.2019-26.8.2019 — NIST via IOS
THE Brewer MKIII #086 1.1.2018-31.8.2019 1998 PTB
IZA Brewer #183 1.1.2018-31.8.2019 1998 PTB via PMOD-WRC
OPA Bentham DTMc300 1.1.2018-31.8.2019 1998 NIST
MEL Bentham DTMc300 1.1.2018-31.8.2019 1998 NIST
PAL SUV-100 1.1.2018-31.8.2019 1987 NIST
Table 4. Broadband and multiband radiometers used in the study. Data period is from 1 Jan 2018 to 31 Aug 2019. Eryth. act. denotes which
erythemal action spectrum is used for retrieving erythemally weighted dose rates and daily doses.1987 denotes the McKinlay and Diffey
(1987) and 1998 the Commission Internationale de l’Eclairage (1998) action spectrum. See Table 2 for explanation of site acronyms.
Site Instrument data frequency bandwidth Eryth. act. Traceability
NYA GUV-541 1 min ave 5 channels, FWHM 10nm 1998 PTB via PMOD-WRC
AND GUV-541 1 min ave 5 channels, FWHM 10nm 1998 PTB via PMOD-WRC
FIN GUV-541 1 min ave 5 channels, FWHM 10nm 1998 PTB via PMOD-WRC
BLI GUV-511 1 min ave 5 channels, FWHM 10nm 1998 PTB via PMOD-WRC
DBB average KZ560,YES010938, SL501A 10 min ave broadband 1998 PTB
BET YES UVB-1 10 min ave broadband 280-320 nm 1987 Kipp&Zonen
JER YES UVB-1 10 min ave broadband 280-320 nm 1987 Kipp&Zonen
EIL YES UVB-1 10 min ave broadband 280-320 nm 1987 Kipp&Zonen
MAH Kipp&Zonen UVS-E-T 5 min ave ISO 17166/CIE S007/E-1999 1998 Kipp&Zonen
ANT Kipp&Zonen UVS-E-T 5 min ave ISO 17166/CIE S007/E-1999 1998 Kipp&Zonen
ROD Kipp&Zonen UVS-E-T 2 min ave ISO 17166/CIE S007/E-1999 1998 Kipp&Zonen
STD Kipp&Zonen UVS-E-T 5 min ave ISO 17166/CIE S007/E-1999 1998 PTB via PMOD-WRC
ALI sglux ERYCA 10 min ave ISO 17166 1998 NIST via ARPANSA
MAR GUV-2511 1 min ave 5 channels, FWHM 10nm 1987 NIST via BSI
12
https://doi.org/10.5194/amt-2020-121Preprint. Discussion started: 15 June 2020c© Author(s) 2020. CC BY 4.0 License.

3 Validation methods
TROPOMI overpass irradiance at 305, 310, 324 and 380 nm, overpass erythemally weighted dose rate, overpass UV index and
erythemally weighted daily dose were compared to ground-based measurements. The ground-based data were used as such,
as provided by operators, and no conversion between UV index and dose rate was done. The TROPOMI UV parameters are280
calculated using the erythemal action spectrum from Commission Internationale de l’Eclairage (1998). Most of ground-based
measurements used the same action spectrum, while a couple of sites had still in use the action spectrum from McKinlay and
Diffey (1987). The effect of using different action spectrum was modeled (results not shown), and they were in agreement with
those of Webb et al. (2011). The uncertainty related to the choice of action spectrum was assumed to be less than 1% for low
and middle latitudes sites and less than 2% for high latitude sites.285
Spectroradiometers measure complete UV spectra and their data were used for the validation of irradiances. Each spectrum
was first deconvoluted and then convoluted using a triangular slit of 1 nm at full-width-at-half-maximum using the Shicrivm
package (Slaper et al., 1995) freely available at https://www.rivm.nl/en/uv-ozone-layer-and-climate/shicrivm (last visited 19
Mar 2020) as the TROPOMI irradiance is calculated using that standard slit. Data from Palmer were processed with the
algorithm described by (Bernhard et al., 2004).290
The validation of overpass erythemally weighted dose rate was performed against both spectroradiometer and broadband
radiometer measurements. The measurement frequency of these instruments is different: a spectroradiometer may take from 3
to 6 minutes to scan the whole UV range, while a broadband radiometer can measure every second, even if the final product
is saved as 1, 2, 5 or 10 minute average. This means that e.g. during changing cloudiness, the cloudiness conditions in the
beginning of the spectrum (at short wavelengths) measured by a spectroradiometer may differ from those at the end of the295
spectrum (at longer wavelengths). The time stamp of spectroradiometer dose rate can differ between sites. For some sites the
time stamp is set at the beginning of the spectrum and for some it is set at the most effective wavelength regarding erythemally
weighted UV irradiance, at around 308–311 nm. Most of the spectroradiometers measure only 2–4 scans per hour. In order
to get enough points between satellite overpasses and ground-based measurements, the allowed time difference between the
satellite overpass and the spectroradiometer measurement was set to less than 5 minutes.300
Recording frequencies of broadband and multichannel radiometers are listed in Table 4: averages were made over 1, 2, 5 or
10 minutes. The allowed time difference between the satellite overpass and the ground-based measurement was set to be less
than half of the recording frequency. Eg. if ground-based data were recorded every minute, then the allowed time difference
was set to less than 30 seconds. If the ground-based data was ten minute average, then the maximum time difference was set to
be less than 5 minutes.305
For the validation of overpass UV index both broadband and multichannel radiometers were used and the time difference
between satellite overpass and ground-based data was limited to half of the recording frequency, as for the dose rate valida-
tion. All type of instruments (spectroradiometer, broadband and multichannel radiometer) were used for the validation of the
erythemally weighted daily dose.
13
https://doi.org/10.5194/amt-2020-121Preprint. Discussion started: 15 June 2020c© Author(s) 2020. CC BY 4.0 License.

For all TROPOMI overpass pixels a ground-based measurement was chosen if found within the allowed time difference. No310
quality filtering was performed for the TROPOMI data. The distance between the TROPOMI pixel and the ground station was
filtered to be less than 5 km, the SZA less than 80◦, and following Tanskanen et al. (2007) the altitude difference between the
altitude of the site and the TROPOMI pixel less than 500 m. For mountainous sites of Davos and Aosta the maximum distance
between the TROPOMI pixel and the site was limited to be less than 3 km. The SZA of 80◦ was chosen to avoid very low UV
irradiances, as for very low irradiances the ratio between satellite and ground-based data becomes unstable (Tanskanen et al.,315
2007). Also at SZAs smaller than 80◦ the effect of stray light in single monochromator Brewers (Bais et al., 1996) is avoided.
The relative difference ρ between satellite data and ground-based data was calculated for each pair of satellite data (sat) and
ground-based data (gr) using the following equation:
ρ= 100% ∗ [(sat− gr)/gr] (1)
The median and 25th and 75th percentiles of the ρ values were calculated for each site. The W10 and W20 from Tanskanen320
et al. (2007) were calculated also in this study. The WX is determined as percentage of satellite data which is within X% from
ground-based data:
WX = P (−X < ρ <X) (2)
Similarly to Tanskanen et al. (2007) data sets were divided into subsets according to albedo. Snow cover was considered,
when the albedo used by the TROPOMI UV processor (Kujanpää et al., 2020) was higher than 0.1, and the data set was divided325
into snow cover (SC) and snow free (SF) ground conditions. The albedo used by the TROPOMI UV processor is derived from
albedo climatology (Kujanpää and Kalakoski, 2015), thus it may differ from the true albedo conditions of the site (Tanskanen
et al., 2007; Bernhard et al., 2015). In addition, a subset of clear sky data was selected. Clear skies were assumed when the
cloud optical depth retrieved by the TROPOMI UV processor was lower than 0.5. Clear sky data sets included both snow cover
and snow free conditions. Here again, one needs to keep in mind, that it is the cloud optical depth as derived from the LUT of330
the TROPOMI UV processor, not the cloudiness observation from the site.
The spatial resolution of TROPOMI data is very high compared to older generation satellite instruments. This leads to huge
amount of data and at most sites several satellite pixels fulfilling the selection criteria were colocated with the same ground-
based measurement. Thus, the sensitivity of the results was studied by comparing three different data selection methods for
Villeneuve d’Ascq measurements: 1) Each TROPOMI pixel was treated as individual measurement, 2) the pixel nearest of335
the site was chosen, 3) the average of the TROPOMI pixels fulfilling the chosen limitations (time difference, SZA, altitude,
distance) was used. Results are shown in the Fig. S13 and Table S6 of the Supplement material.
4 Results
Results for validation of overpass spectral irradiances, dose rates, UV index and daily doses are discussed separately in the
following sections. Scatter plots, histograms and tables including the statistics were prepared for all studied UV parameters,340
and they are shown in the Supplement material of this paper. Here they are shown only for dose rate / UV index.
14
https://doi.org/10.5194/amt-2020-121Preprint. Discussion started: 15 June 2020c© Author(s) 2020. CC BY 4.0 License.
4.1 Spectral irradiances
TROPOMI overpass irradiances were compared with the following spectroradiometers listed in Table 3: SOD, HEL, VDA,
DAV, DBR, AOS, OHP, ROM, THE, IZA, OPA, MEL and PAL. The statistics are shown in the Tables S1–S4 of the Supplement
material. Scatter plots and histograms are showed in Figs. S1-S8. For irradiances at 305, 310, 324 and 380 nm the median ρwas345
within ±10% at 11, 9, 10 and 6 sites from the 13 sites (7 sites for 380 nm), respectively, for snow free ground conditions. For
the four wavelengths, at all sites except one, more than 50% of satellite data were within ±20% from ground measurements.
During snow conditions the percentage of satellite data being within ±20% from ground measurements decreased in Davos
from more than 60% to around 20%. This is seen as a shift of ρ towards negative values when comparing snow cover data set
to snow free data set. For the other four sites which had data sets during snow cover, Sodankylä, Helsinki, Aosta and Palmer,350
no significant difference was observed between snow cover and snow free surfaces. At Palmer, a systematic underestimation of
irradiances occured at all wavelengths. The median ρ at 305 nm was -46% and -56% for snow free and snow covered surface,
respectively. Satellite data had a positive bias at Davos, Aosta and Izaña, while at other sites the bias was more randomly
distributed. The spread of the scatter plot was larger at 380 nm than at 305 nm, which is related to the influence of clouds:
radiation distribution at short UV wavelengths is less affected by clouds than at longer wavelengths. For all stations, over 50%355
of clear sky satellite data were within ±20% from ground measurements.
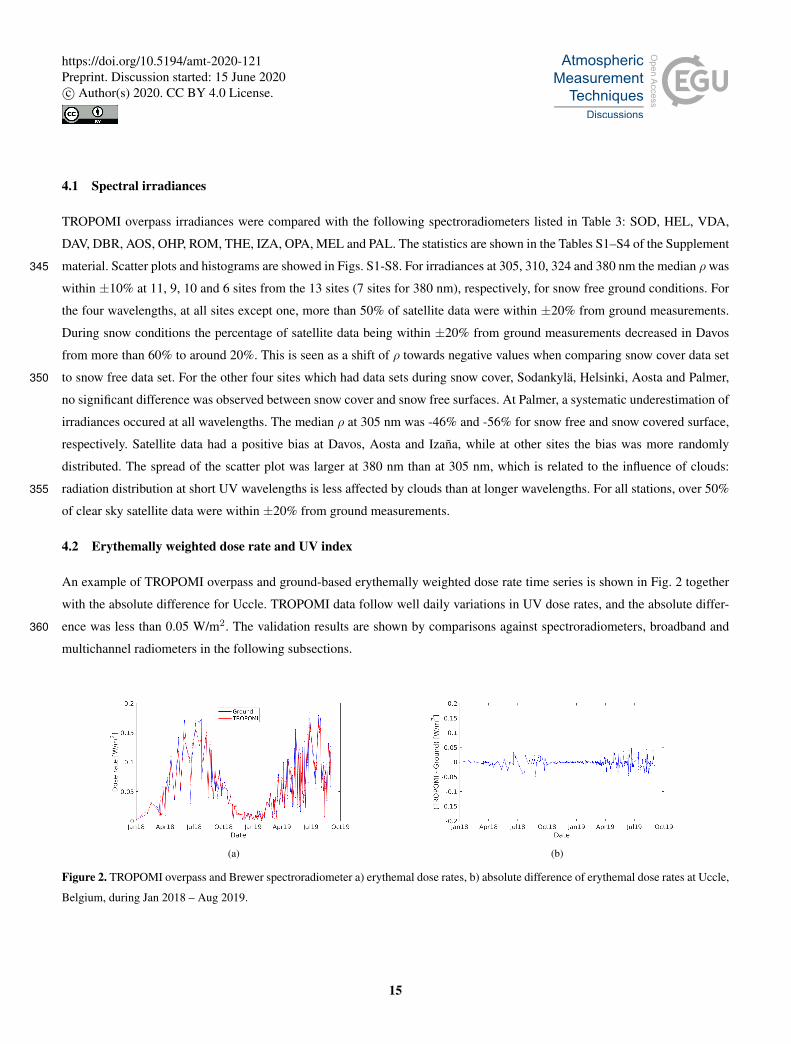
4.2 Erythemally weighted dose rate and UV index
An example of TROPOMI overpass and ground-based erythemally weighted dose rate time series is shown in Fig. 2 together
with the absolute difference for Uccle. TROPOMI data follow well daily variations in UV dose rates, and the absolute differ-
ence was less than 0.05 W/m2. The validation results are shown by comparisons against spectroradiometers, broadband and360
multichannel radiometers in the following subsections.
(a) (b)
Figure 2. TROPOMI overpass and Brewer spectroradiometer a) erythemal dose rates, b) absolute difference of erythemal dose rates at Uccle,
Belgium, during Jan 2018 – Aug 2019.
15
https://doi.org/10.5194/amt-2020-121Preprint. Discussion started: 15 June 2020c© Author(s) 2020. CC BY 4.0 License.

4.2.1 Validation against spectroradiometers
The comparison of TROPOMI overpass erythemally weighted dose rates against spectroradiometer measurements showed
similar patterns as the comparison of single irradiances at 305 and 310 nm. The scatter plot and histograms are showed in
Figs 3 and 4, respectively, and the statistics in Table 5. At ten and seven sites the median ρ was within ±8% and ±5%,365
respectively, for snow free conditions. As for irradiances, TROPOMI UV dose rates show a systematic negative bias at Palmer,
with median ρ of -45% during snow cover conditions. The histograms of ρ are similar for snow cover and snow free conditions.
Also at the other sites which have data sets for snow cover conditions, there are no noticeable differences between snow cover
and snow free conditions.
At all sites, except Palmer, over 60% of TROPOMI data are within ±20% from ground-based measurements. In Aosta and370
Izaña there is a large positive bias for some pixels. The feature is more pronounced when small dose rates are measured,
which suggests the reason to be how TROPOMI interpret cloudiness: underestimation of cloudiness leads to positive bias in
TROPOMI data.
16
https://doi.org/10.5194/amt-2020-121Preprint. Discussion started: 15 June 2020c© Author(s) 2020. CC BY 4.0 License.

(a) (b) (c) (d)
(e) (f) (g) (h)
(i) (j) (k)
Figure 3. Erythemally weighted dose rates from spectroradiometer measurements and retrieved from satellite overpass at a) Sodankylä, b)
Helsinki, c) Uccle, d) Villeneuve d’Ascq , e) Aosta, f) Haute-Provence, g) Thessaloniki, h) Izaña, i) Saint-Denis, j) Melbourne and k) Palmer.
Red diamond denotes snow free surface, blue star snow cover and black circle clear sky.
17
https://doi.org/10.5194/amt-2020-121Preprint. Discussion started: 15 June 2020c© Author(s) 2020. CC BY 4.0 License.
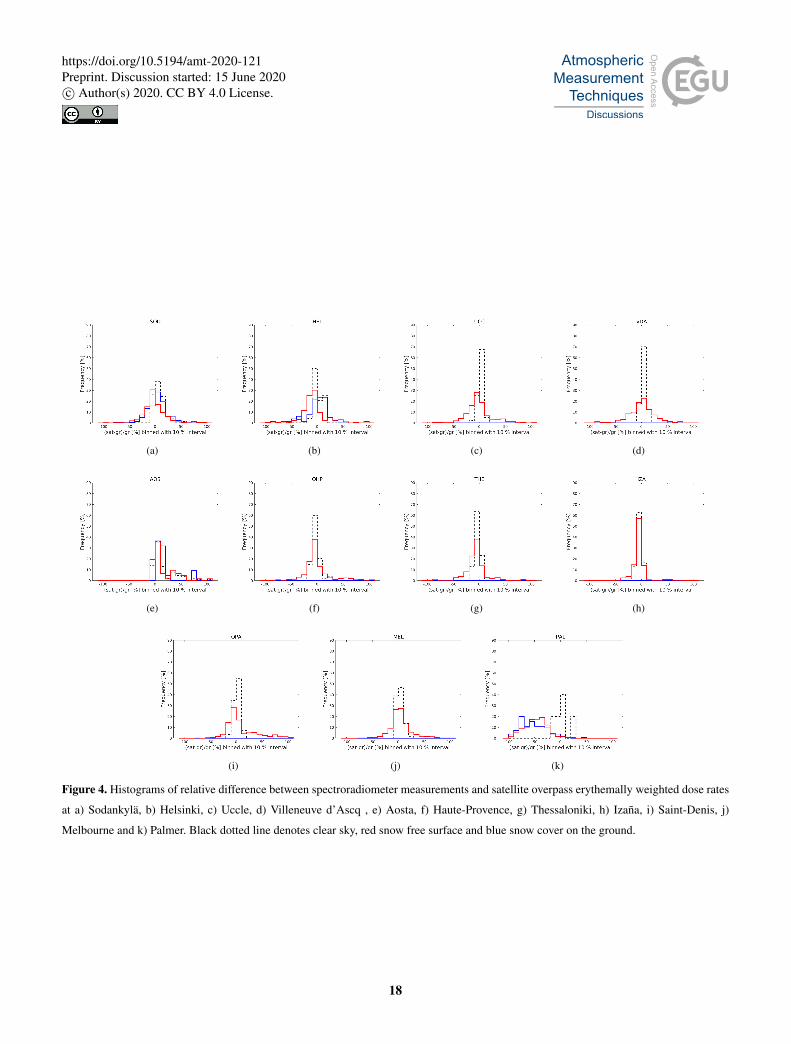
(a) (b) (c) (d)
(e) (f) (g) (h)
(i) (j) (k)
Figure 4. Histograms of relative difference between spectroradiometer measurements and satellite overpass erythemally weighted dose rates
at a) Sodankylä, b) Helsinki, c) Uccle, d) Villeneuve d’Ascq , e) Aosta, f) Haute-Provence, g) Thessaloniki, h) Izaña, i) Saint-Denis, j)
Melbourne and k) Palmer. Black dotted line denotes clear sky, red snow free surface and blue snow cover on the ground.
18
https://doi.org/10.5194/amt-2020-121Preprint. Discussion started: 15 June 2020c© Author(s) 2020. CC BY 4.0 License.

Table 5. TROPOMI overpass erythemally weighted dose rates compared to spectroradiometer measurements. The percentage relative differ-
ences 100%*(sat-gr)/gr, their medians (median) and 25th (p25) and 75th (p75) percentiles were calculated. N is the number of measurement
days included in the study. W10 and W20 are percentage of satellite data which are within 10% and 20% from ground measurements.
CS=Clear sky, SCAS=Snow cover at ground, all sky, SFAS=Snow free ground, all sky.
Station Conditions N median [%] p25 [%] p75 [%] W10 W20
SOD CS 132 5.92 -0.45 12.48 64.39 88.64
SOD SCAS 211 4.09 -6.49 14.50 44.08 76.78
SOD SFAS 451 -3.19 -12.22 8.82 47.23 71.62
HEL CS 48 -0.86 -4.24 8.80 70.83 100.00
HEL SCAS 80 2.43 -6.48 11.99 45.00 76.25
HEL SFAS 275 -8.11 -15.22 0.29 40.00 67.64
UCC CS 40 3.01 -1.09 4.84 92.50 100.00
UCC SFAS 399 -4.42 -13.89 6.64 46.87 69.42
VDA CS 40 6.65 3.60 7.83 87.50 100.00
VDA SFAS 337 1.63 -13.17 14.14 41.84 64.39
AOS CS 84 10.19 1.96 43.24 50.00 63.10
AOS SCAS 22 15.00 6.68 73.36 36.36 68.18
AOS SFAS 62 7.22 1.43 41.87 54.84 61.29
OHP CS 89 -2.44 -7.19 0.25 79.78 96.63
OHP SFAS 280 -4.11 -11.07 3.40 50.36 73.93
THE CS 30 -2.57 -8.61 -0.50 86.67 100.00
THE SFAS 235 -7.68 -14.10 -0.62 51.06 76.17
IZA CS 386 -4.50 -7.34 -0.11 79.02 91.97
IZA SFAS 454 -5.38 -9.02 -1.15 70.93 86.12
OPA CS 29 1.29 -1.18 6.32 89.66 100.00
OPA SFAS 424 0.05 -8.14 28.19 45.28 63.68
MEL CS 142 2.34 -2.02 7.56 85.21 98.59
MEL SFAS 1074 2.24 -6.36 12.34 53.91 76.16
PAL CS 5 3.13 -7.07 9.87 60.00 80.00
PAL SCAS 180 -56.64 -72.29 -34.24 5.56 10.56
PAL SFAS 393 -44.88 -60.74 -31.96 2.80 7.89
4.2.2 Validation against broadband and multiband radiometers
The scatter plots and histograms of TROPOMI overpass UV index and dose rates comparison against broadband and multi-375
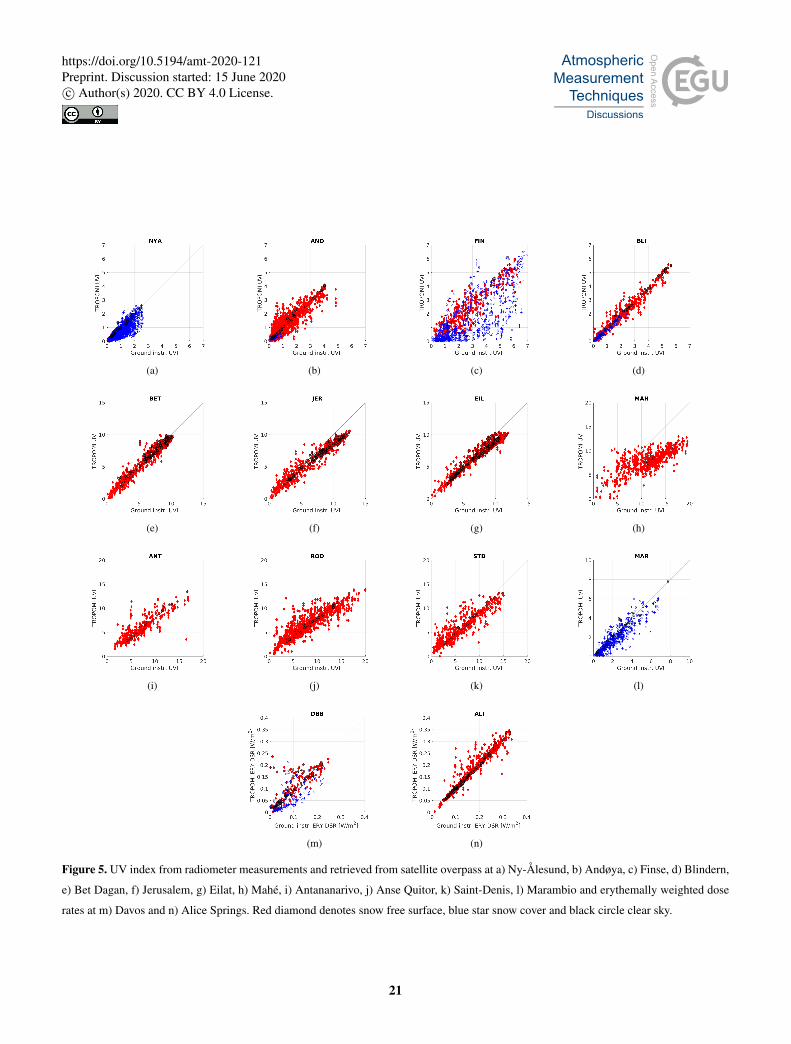
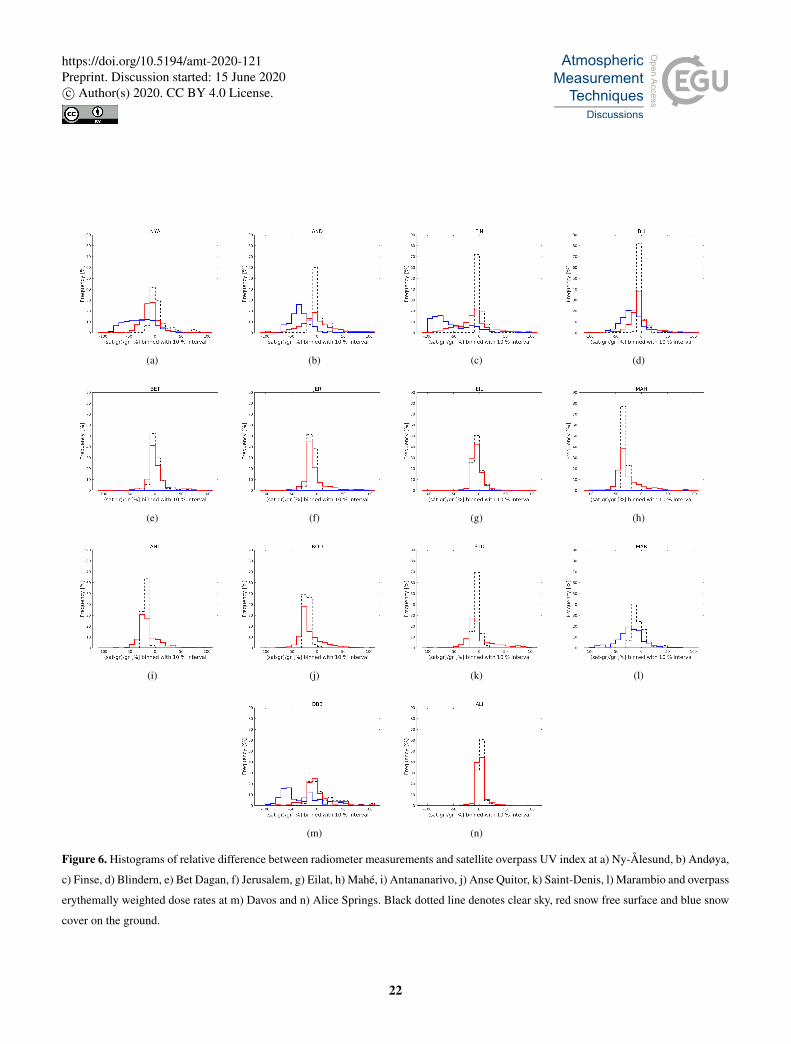
channel radiometers are shown in Figs 5 and 6, respectively, and the statistics in Table 6. The number of colocated pixels is
19
https://doi.org/10.5194/amt-2020-121Preprint. Discussion started: 15 June 2020c© Author(s) 2020. CC BY 4.0 License.
much higher for broadband instruments than for spectroradiometers, as they measure continuously. At several sites (Jerusalem,
Mahé, Antananarivo, Anse Quitor, Saint-Denis and Alice Springs), the UV index can be higher than 11, categorized as "ex-
treme" UV (WMO, 1997). These extreme values are underestimated by TROPOMI, except in Alice Springs. The feature is
pronounced in the Indian Ocean sites Mahé, Antananarivo and Anse Quitor. The strongest underestimation is seen in Mahé,380
where the median ρ was -34% with the 25th and 75th percentiles of -40% and -20%, respectively.
For the other sites, the median ρ for snow free conditions was between -1 and -10%. At the high latitude site of Ny-Ålesund
where snow covers the surface almost half a year, and at the mountainous site of Finse, similar underestimation to Palmer
is seen. However, at Ny-Ålesund and Finse, differences occur between snow cover and snow free data sets. The medians ρ
for snow free conditions are -10% at both sites, and for snow cover conditions -30% and -65% at Ny-Ålesund and Finse,385
respectively. The difference of snow cover and snow free conditions is distinctly seen in the histogram (Fig. 6a and 6c). Also
at Davos and Andøya, underestimation occurred during snow cover, and ρ differed between snow cover and snow free data
sets. The median ρ was approximately -5% and -35% for snow free and snow covered conditions, respectively, at both sites.
At Blindern, the same feature was seen, but with a smaller difference between the two conditions: -5% and -20% for snow
free and snow cover conditions, respectively. At Marambio, the Antarctic station which has snow cover all year round, the390
underestimation was similar to Blindern with median ρ of -20%.
The median ρ for clear sky conditions was within ±10% for all sites except the Indian Ocean sites, Mahé, Antananarivo and
Anse Quitor, and the Israeli site of Jerusalem. At 8 sites the median was within ±5% for clear skies.
A study on the effect of taking into account quality flags was done for the site of Davos. Data for which the quality value
number UVQAV was less than 0.5 were excluded (see Section 2.1 for explanation of UVQAV). This removed e.g., unreliable395
values when the cloud optical depth was 0. Indeed, as mentioned in Section 2.2, Davos is a mountainous site with heterogeneous
albedo during the winter. As shown in Supplement material Figs. S14, setting a limit of 0.5 for the UVQAV, results in removing
satellite observations with at least two of the following warnings: "rough_terrain", "alb_hetero" or "clearsky_assumed".
20
https://doi.org/10.5194/amt-2020-121Preprint. Discussion started: 15 June 2020c© Author(s) 2020. CC BY 4.0 License.
(a) (b) (c) (d)
(e) (f) (g) (h)
(i) (j) (k) (l)
(m) (n)
Figure 5. UV index from radiometer measurements and retrieved from satellite overpass at a) Ny-Ålesund, b) Andøya, c) Finse, d) Blindern,
e) Bet Dagan, f) Jerusalem, g) Eilat, h) Mahé, i) Antananarivo, j) Anse Quitor, k) Saint-Denis, l) Marambio and erythemally weighted dose
rates at m) Davos and n) Alice Springs. Red diamond denotes snow free surface, blue star snow cover and black circle clear sky.
21
https://doi.org/10.5194/amt-2020-121Preprint. Discussion started: 15 June 2020c© Author(s) 2020. CC BY 4.0 License.
(a) (b) (c) (d)
(e) (f) (g) (h)
(i) (j) (k) (l)
(m) (n)
Figure 6. Histograms of relative difference between radiometer measurements and satellite overpass UV index at a) Ny-Ålesund, b) Andøya,
c) Finse, d) Blindern, e) Bet Dagan, f) Jerusalem, g) Eilat, h) Mahé, i) Antananarivo, j) Anse Quitor, k) Saint-Denis, l) Marambio and overpass
erythemally weighted dose rates at m) Davos and n) Alice Springs. Black dotted line denotes clear sky, red snow free surface and blue snow
cover on the ground.
22
https://doi.org/10.5194/amt-2020-121Preprint. Discussion started: 15 June 2020c© Author(s) 2020. CC BY 4.0 License.

Table 6. TROPOMI overpass UV index/erythemally weighted dose rates compared to broadband and multichannel radiometer measurements.
The percentage relative differences 100%*(sat-gr)/gr, their medians (median) and 25th (p25) and 75th (p75) percentiles were calculated. N
is the number of measurement days included in the study. W10 and W20 are percentage of satellite data which are within 10% and 20% from
ground measurements. CS=Clear sky, SCAS=Snow cover at ground, all sky, SFAS=Snow free ground, all sky.
Station Conditions N median [%] p25 [%] p75 [%] W10 W20
NYA CS 110 0.64 -4.18 8.55 71.82 86.36
NYA SCAS 3333 -30.28 -52.24 -9.25 18.33 34.26
NYA SFAS 832 -9.96 -18.93 -1.49 38.94 70.07
AND CS 177 -2.71 -5.53 1.48 73.45 89.83
AND SCAS 69 -33.66 -43.95 -22.00 7.25 18.84
AND SFAS 2378 -3.23 -18.94 22.13 29.48 49.54
FIN CS 25 -2.17 -4.52 0.19 92.00 100.00
FIN SCAS 1099 -64.96 -82.27 -21.73 8.55 17.93
FIN SFAS 446 -9.86 -28.60 3.79 29.60 50.67
BLI CS 120 -3.76 -5.84 -1.11 94.17 100.00
BLI SCAS 345 -20.00 -32.41 -8.06 20.87 44.93
BLI SFAS 620 -5.26 -14.33 2.77 49.03 74.03
DBB CS 163 1.90 -9.26 39.66 34.97 61.35
DBB SCAS 233 -37.33 -60.86 2.90 10.30 24.03
DBB SFAS 142 -4.88 -12.92 16.17 35.92 63.38
BET CS 305 -0.85 -4.06 4.13 81.97 96.39
BET SFAS 886 -1.21 -6.28 6.76 64.33 84.09
JER CS 250 -10.82 -14.94 -6.86 45.60 96.80
JER SFAS 899 -12.10 -16.83 -2.98 27.81 77.09
EIL CS 406 -5.31 -10.10 -0.25 68.23 99.01
EIL SFAS 872 -5.99 -11.48 0.63 59.06 92.66
MAH CS 22 -32.84 -36.91 -31.24 0.00 0.00
MAH SFAS 719 -33.81 -39.83 -19.79 8.48 17.80
ANT CS 42 -18.16 -21.70 -16.43 2.38 66.67
ANT SFAS 431 -17.81 -25.34 -5.12 16.71 48.49
ROD CS 88 -19.69 -21.81 -17.78 4.55 51.14
ROD SFAS 1527 -20.82 -26.54 -3.69 15.46 35.30
STD CS 46 -6.69 -9.01 -4.31 82.61 100.00
STD SFAS 610 -8.11 -14.96 14.35 30.33 63.11
ALI CS 286 1.79 -0.72 5.59 92.66 97.20
ALI SFAS 898 0.75 -2.62 5.33 83.74 91.54
MAR CS 124 -9.68 -14.84 1.85 41.13 87.90
MAR SCAS 1169 -20.00 -33.53 -4.76 21.90 43.3723
https://doi.org/10.5194/amt-2020-121Preprint. Discussion started: 15 June 2020c© Author(s) 2020. CC BY 4.0 License.

4.3 Erythemally weighted daily dose
TROPOMI erythemally weighted daily doses were compared against daily doses derived from spectroradiometer measure-400
ments (SOD, HEL, UCC, VDA, AOS, OHP, IZA, OPA, MEL and PAL), multichannel radiometers (NYA, AND, FIN, BLI and
MAR) and a broadband radiometer (ALI). The scatter plots, histograms and statistics are showed in the Figs. S9-S10, S11-S12
and Table S5 of the Supplement material, respectively.
As the satellite daily dose is calculated using the assumption that the cloudiness retrieved by the satellite during the overpass
would be the same during the whole day, which is an oversimplified assumption for many sites, larger deviation in the results405
were expected than for overpass dose rates. At all sites except Palmer, Aosta, Finse and Ny-Ålesund, the increased deviation
was seen in both positive and negative biases. However, the median ρwas within±10% and±5% at 11 and 8 sites, respectively.
The total number of sites providing daily doses for this study was 16. At all sites, except Palmer, over 50% of satellite data were
within ±20% from ground-based measurements during snow free surface conditions. Marambio was always snow-covered.
At Palmer, the pattern was similar to results of the dose rate validation indicating large underestimation with median ρ of -410
49% and -62% for snow free and snow covered conditions. Also at Ny-Ålesund there was significant underestimation, but daily
doses differed from dose rates by having also several overestimation cases. At Ny-Ålesund the median ρ was -12% and -33%
for snow free and snow cover conditions, while during clear skies there was an overestimation with a median ρ of 6%. This
could occur at situations, when the sky was clear during the overpass, but later changed towards more cloudy conditions, or
would have been more cloudy before the overpass. Also at Andøya, Blindern and Finse large differences between the median of415
snow free (ρ=-2%, ρ=-5% and ρ=-12%, respectively) and snow cover (ρ=-36%, ρ=-22% and ρ=-66%, respectively) condition
occurred. At Sodankylä and Helsinki the difference between the median of snow free and snow cover conditions was less than
10% and 4%, respectively.
At Aosta and Izaña there were large clear sky overestimations. At Aosta, the reason is the non-homogeneous topography
around this mountainous site. At Aosta almost all satellite data is flagged with the "rough_terrain" and "clearsky_assumed"420
flags, and the data agree with measurements only during real clear sky conditions. At Izaña there were similar overestimation
cases but also several underestimations. The underestimations can be due to situations, when the station is above the clouds,
but the satellite interprets surrounding clouds, which in reality are below the station, as cloudiness of the site.
5 Discussion
Tanskanen et al. (2007) summarized the key validation statistics of OMI daily dose by plotting W20 in function of median425
ρ (Fig. 6 in Tanskanen et al. (2007)). The same was done for this validation. Figure 7 shows results for overpass irradiance
validation, and Fig. 8 for overpass dose rates and daily doses. One notable difference between the OMI results from Tanskanen
et al. (2007) and the results of the TROPOMI validation study is that positive bias due to tropospheric extinction is missing from
TROPOMI results. That is due to the correction for absorbing aerosols which was not implemented in the OMI data in the study
of Tanskanen et al. (2007). The current OMI UV algorithm is updated with the absorbing aerosol correction method described430
in Arola et al. (2009) and the same method is used in the TROPOMI UV algorithm. Thessaloniki is a site for which aerosols are
24
https://doi.org/10.5194/amt-2020-121Preprint. Discussion started: 15 June 2020c© Author(s) 2020. CC BY 4.0 License.

an important factor affecting UV radiation (e.g., Fountoulakis et al., 2016). Tanskanen et al. (2007) found a median difference
of 10% (OMI/ground -1) between OMI and ground based erythemally weighted daily dose, while the TROPOMI validation
showed an underestimation of -8% with 15% more satellite retrievals within ±20% from ground-based measurements.
(a) (b)
(c) (d)
Figure 7. W20 in function of ρ for validation sites measuring overpass irradiance at a) 305, b) 310, c) 324 and d) 380 nm.
Kalliskota et al. (2000) found an underestimation of TOMS UV daily dose at Ushuaia, Argentina, and Palmer, and an435
overestimation in San Diego, U.S. Also TROPOMI underestimated the daily dose at Palmer (median ρ of -49%) for snow
free surface, while agreed quite well (median ρ of -8%) during clear sky conditions. The monthly average underestimation of
erythemally weighted daily dose was -35% for TOMS and the median underestimation (OMI/ground-1) was -49% for OMI.
The results of OMI refer to those calculated using the cloud correction method based on the Lambertian equivalent refectivity
(Tanskanen et al., 2007). OMI overestimated erythemally weighted daily doses by 9% (median of (OMI/ground -1)) for snow440
covered conditions at Sodankylä. For TROPOMI, the corresponding overestimation was 6%. For snow free conditions at
25
https://doi.org/10.5194/amt-2020-121Preprint. Discussion started: 15 June 2020c© Author(s) 2020. CC BY 4.0 License.
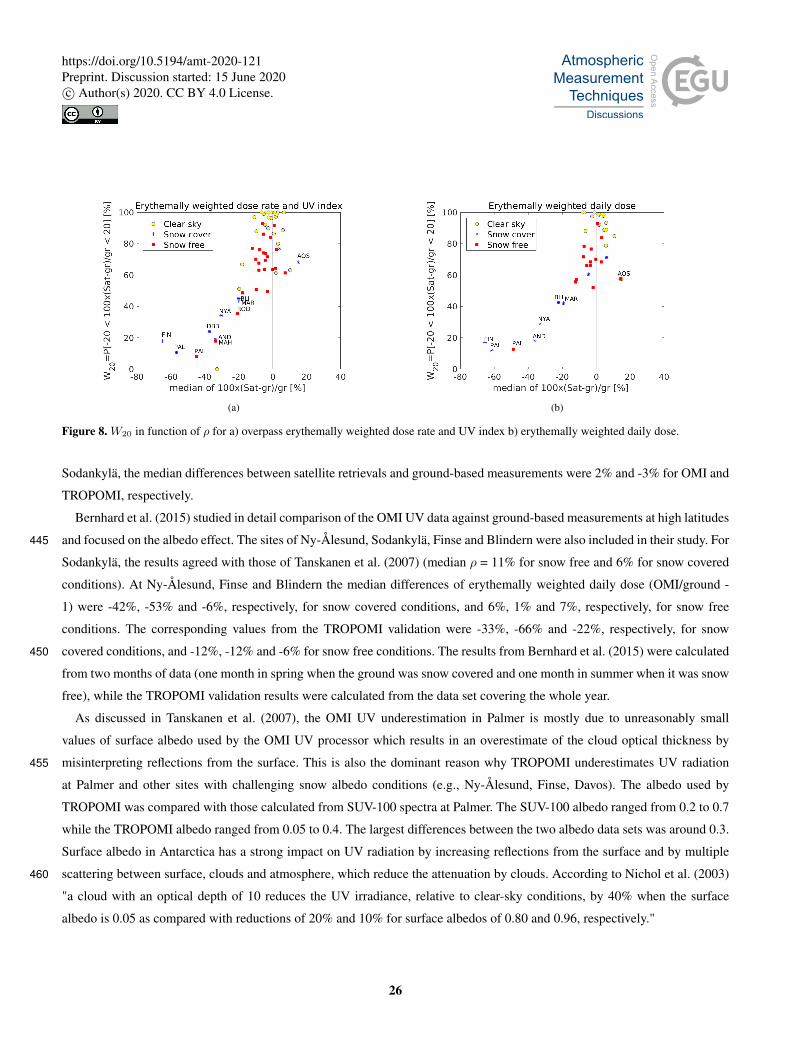
(a) (b)
Figure 8. W20 in function of ρ for a) overpass erythemally weighted dose rate and UV index b) erythemally weighted daily dose.
Sodankylä, the median differences between satellite retrievals and ground-based measurements were 2% and -3% for OMI and
TROPOMI, respectively.
Bernhard et al. (2015) studied in detail comparison of the OMI UV data against ground-based measurements at high latitudes
and focused on the albedo effect. The sites of Ny-Ålesund, Sodankylä, Finse and Blindern were also included in their study. For445
Sodankylä, the results agreed with those of Tanskanen et al. (2007) (median ρ = 11% for snow free and 6% for snow covered
conditions). At Ny-Ålesund, Finse and Blindern the median differences of erythemally weighted daily dose (OMI/ground -
1) were -42%, -53% and -6%, respectively, for snow covered conditions, and 6%, 1% and 7%, respectively, for snow free
conditions. The corresponding values from the TROPOMI validation were -33%, -66% and -22%, respectively, for snow
covered conditions, and -12%, -12% and -6% for snow free conditions. The results from Bernhard et al. (2015) were calculated450
from two months of data (one month in spring when the ground was snow covered and one month in summer when it was snow
free), while the TROPOMI validation results were calculated from the data set covering the whole year.
As discussed in Tanskanen et al. (2007), the OMI UV underestimation in Palmer is mostly due to unreasonably small
values of surface albedo used by the OMI UV processor which results in an overestimate of the cloud optical thickness by
misinterpreting reflections from the surface. This is also the dominant reason why TROPOMI underestimates UV radiation455
at Palmer and other sites with challenging snow albedo conditions (e.g., Ny-Ålesund, Finse, Davos). The albedo used by
TROPOMI was compared with those calculated from SUV-100 spectra at Palmer. The SUV-100 albedo ranged from 0.2 to 0.7
while the TROPOMI albedo ranged from 0.05 to 0.4. The largest differences between the two albedo data sets was around 0.3.
Surface albedo in Antarctica has a strong impact on UV radiation by increasing reflections from the surface and by multiple
scattering between surface, clouds and atmosphere, which reduce the attenuation by clouds. According to Nichol et al. (2003)460
"a cloud with an optical depth of 10 reduces the UV irradiance, relative to clear-sky conditions, by 40% when the surface
albedo is 0.05 as compared with reductions of 20% and 10% for surface albedos of 0.80 and 0.96, respectively."
26
https://doi.org/10.5194/amt-2020-121Preprint. Discussion started: 15 June 2020c© Author(s) 2020. CC BY 4.0 License.

At sites with homogeneous albedo conditions, even at locations with high surface albedo like Sodankylä, the differences
between satellite retrievals and ground-based data are much smaller than for non-homogeneous conditions. In this study even
the two Antarctic sites, Palmer and Marambio, differed from each other regarding the underestimation during snow cover465
conditions. At Marambio, the median ρ of erythemally weighted dose rate and daily doses was -20%, while at Palmer it was
-62% for snow covered conditions. The smaller bias at Marambio can be attributed to the fact that the albedo values used in
the TROPOMI UV algorithm (ranging from 0.2 to 0.7) are more realistic than at Palmer.
At high latitudes also long-term changes in the effective albedo resulting from climate change have to be considered in
the future. Already now, at some Arctic sites the length of snow cover period has shortened by several weeks compared to a470
couple of decades ago (Bernhard, 2011; Luomaranta et al., 2019; Takala et al., 2011). That might be one reason for the positive
median ρ of Sodankylä and Helsinki dose rates compared to snow free negative median ρ: If the climatological albedo used by
TROPOMI is too high it can lead to underestimation of cloudiness. The results of Bernhard et al. (2015) showed that for the
OMI instrument, overestimations and underestimations of up to 55% and -59%, respectively, were due to errors in the albedo
climatology used in the OMI UV algorithm.475
As discussed also by Tanskanen et al. (2007) validation results become unstable when UV irradiance is low, which is the case
when SZAs or cloud optical depths are very large. Then, even small absolute differences are seen as large relative differences.
This is frequent at high latitudes where large SZAs are present even at noon (overpass time) in winters. An example is shown
in Fig. 9 for Ny-Ålesund, a site where UV index underestimations of more than -50% were found. Most of differences in the
UV index are less than 0.5 when the whole data set is studied (including snow covered and snow free conditions) (Fig. 9a).480
The maximum differences are 1.5 for the lowest SZAs during snow cover conditions (9b).
(a) (b)
Figure 9. The absolute difference between the TROPOMI overpass UV index and ground-based measurement at Ny-Ålesund as a) histogram
binned with 0.1 interval and b) a function of SZA.
For many sites with uniform topography, stable albedo conditions, or predictable changes in albedo over the course of a
year, TROPOMI UV data products agreed with ground-based measurements to within ±5%. Aosta is a good example of
27
https://doi.org/10.5194/amt-2020-121Preprint. Discussion started: 15 June 2020c© Author(s) 2020. CC BY 4.0 License.
problems faced when retrieving satellite UV for mountainous sites. The non-homegeneous topography leads to uncertainties in
the retrieval of cloud optical depth, which often result in a cloud optical depth of zero when in fact clouds were present, which485
in turn leads to overestimations of UV radiation by TROPOMI. Quality flags related to topography and cloud optical thickness
are included in the TROPOMI surface UV product and could be used to identify such cases of heterogeneous topography.
As the TROPOMI pixel is between 7x3.5 km2 (nadir) and 9x14 km2 (edge of swath), also the surroundings of a site are
included in the pixel. Coastal high-latitude sites are particularly challenging (e.g., NYA, AND, PAL and MAR) because both
open ocean and land covered by snow can be within the area of a pixel. The albedo is determined by the climatology of the490
central point of the pixel which can be open ocean even if the radiation field of the site is characterized by the surrounding
snow cover. As for heterogeneous topography, the quality flagging also includes a flag for heterogeneous surface albedo.
The same applies for the impact of cloudiness when clouds are non-uniformly located around the site due to topography
or changes in surface (e.g. sea/ground). For example the site itself is free from clouds but there can be small cumulus clouds
at the edge of the pixel which increase the reflection towards the satellite. In that case the TROPOMI would most probably495
underestimate the UV irradiance as the small fraction of clouds is considered as cloudiness of the whole pixel. Under scattered
clouds, the UV radiation at the surface can be larger than during clear skies (Calbó et al., 2005; Jégou et al., 2011). This
phenomenon occurs when the direct radiation from the Sun is not obstructed and additional radiation is scattered by clouds to
the radiometer at the surface. The TROPOMI algorithm does not consider these situations, resulting UV levels that are too low.
This phenomenon is likely one reasons for the underestimation found in the TROPOMI UV dose rates during high UV levels500
at tropical sites.
The calculation of daily UV doses is based on the cloud optical depth at the time of the satellite overpass and the assumption
that cloud cover is constant throughout this day. While this simplification leads to uncertainties, day-to-day variations in daily
doses measured by the radiometers at the ground are generally well reproduced by TROPOMI. One could expect systematic
biases at sites in which a diurnal cycle occurs, e.g. differences in cloudiness between morning and afternoon like orographic505
clouds forming in the afternoon. This is the case for Sait-Denis, however, the effect on the bias of TROPOMI data is not very
large. Rapidly changing cloudiness can be seen as large deviation between UV irradiances measured at successive pixels.
The smaller pixel size of TROPOMI increases the amount of data compared to previous satellite instruments. Only TROPOMI
pixels with center points less than 5 km away from a ground station were included in this study. For certain sites, especially
at high latitudes, this increased the number of data to include more than 5 pixels for each overpass. In this study the results510
were calculated for each pixel separately. The results did not differ significantly when changing the method to use either 1) the
average of the pixels or 2) the nearest pixel of the site.
6 Conclusions
The TROPOMI Surface UV Radiation Product was validated against ground-based measurements at 25 sites for the period
from 1 Jan 2018 to 31 Aug 2019. TROPOMI overpass irradiances at 305, 310, 324 and 380 nm were compared against spec-515
troradiometer measurements from 13 sites (7 sites for 380 nm). No major differences between results of different wavelengths
28
https://doi.org/10.5194/amt-2020-121Preprint. Discussion started: 15 June 2020c© Author(s) 2020. CC BY 4.0 License.
were found, except that cloudiness affected the irradiance at 380 nm by enlarging the spread of the deviation from ground-based
measurements. The median relative difference between TROPOMI data and ground-based measurements was within ±10% at
11, 9, 10 and 6 sites for irradiance at 305, 310, 324 and 380 nm, respectively, during snow free surface conditions. More than
half of the satellite data were within ±20% from ground-based measurements.520
TROPOMI overpass erythemally weighted dose rates were compared against dose rates measured by spectroradiometers at
11 sites and by broadband or multiband radiometers at two sites. The TROPOMI overpass UV index, which is directly propor-
tional to the erythemally weighted dose rate, was compared against broadband and multichannel radiometer measurements at
12 sites. These validation results showed that the median relative difference between TROPOMI and ground-based dose rates
was within ±10% and ±5% at 18 and 10 sites, respectively, for snow free surface conditions.525
TROPOMI erythemally weighted daily doses were compared against spectroradiometer, broadband and multichannel ra-
diometer measurements at 16 sites. The median relative difference was within ±10% and ±5% at 11 and 8 sites, respectively,
for snow free surface conditions. For both dose rates and daily doses, 60 – 80% of TROPOMI data were within ±20% from
ground-based data at most of the sites for snow free surface conditions.
For all UV parameters an increased over- or underestimation was found at challenging conditions for satellite retrievals.530
Those are related to non-homogeneous topography (large altitude differences within the satellite pixel), non-homogeneous
surface albedo (e.g. open water + snow cover on land within the satellite pixel), surface albedo differing from the albedo
climatology used by the TROPOMI (at high latitudes where year-to-year changes are large) and high UV levels in tropics. The
TROPOMI UV parameters include quality flagging to help identifying many of the above mentioned cases.
Retrieving the correct cloud optical depth is still challenging over snow albedo when reflections from snow and clouds are535
misinterpreted or confused with each other. The underestimation in satellite retrievals is related to the albedo climatology used
by TROPOMI, which should be updated. Also, the current albedo climatology does not change from year to year while the
actual albedo (e.g., timing of snow melt) can change a lot. The challenge is that the albedo climatology should be retrieved in
at least as small pixel size as used by the TROPOMI, preferably from the TROPOMI data itself.
The TROPOMI Surface UV Radiation Product continues the former TOMS and OMI UV time series with an upgraded540
spatial resolution. The nominal life time is 7 years after which the S5P mission hopefully could be extended as has been the
case for e.g. OMI with already over 15 years of observations. Together these UV time series based on satellite retrievals form
a unique 30 years long global data set which can be used for multiple UV impact studies all over the World. For this purpose
special efforts to develop homogenized long term satellite time series are needed.
Data availability. The station overpass files and documentation are available from https://nsdc.fmi.fi/data/data_s5puv.php. Ground-based545
data are available from the authors.
29
https://doi.org/10.5194/amt-2020-121Preprint. Discussion started: 15 June 2020c© Author(s) 2020. CC BY 4.0 License.
Author contributions. K. Lakkala analyzed the data and led the manuscript preparation. She was responsible for the QC/QA and processing
of Sodankylä data, and supervised the QC/QA and monitoring of Marambio data.
J. Kujanpää implemented the TROPOMI UV data processor and processing system, processed the L2 data and extracted the station overpass
files, participated in data analysis and contributed to the writing of the manuscript.550
C. Brogniez supervised the monitoring, processing and QC/QA of French spectroradiometer’s data and contributed to the writing of the
manuscript.
N. Henriot contributed to the sensitivity study regarding the pixel selection and the UVQAV flag.
A. Arola contributed to the development of the TROPOMI UV algorithm, data analysis and the writing of the manuscript.
M. Aun processed Marambio UV data and contributed to the writing of the manuscript.555
F. Auriol: Responsible of calibration of the three French spectroradiometers.
A. F. Bais supervised the monitoring, calibration and quality control of THE data.
G. Bernhard: Responsible for QC/QA and processing of Palmer SUV-100 data, and contributed to the writing of the manuscript.
V. De Bock is co-responsible (together with Hugo De Backer) for the QC/QA and processing of Uccle Brewer spectroradiometer data.
M. Catalfamo contributed in calibration of VDA and OHP spectroradiometers.560
C. Deroo: Responsible of automatic processing of the three French spectroradiometer’s data.
H. Diémoz: Responsible of QC/QA and processing of Aosta data and contributing to the writing of the manuscript.
L. Egli: Responsible for QC/QA and processing of the Davos Brewer spectroradiometer data.
J.-B. Forestier: Technical manager of MAH,ANT,ROD and STD.
I. Fountoulakis: Contribution in QC/QA and processing of Aosta data and contributing to the writing of the manuscript.565
R. D. Garcia responsible for QC/QA and processing of data of the Izaña BSRN.
J. Gröbner: Responsible for QC/QA of the Davos measurements and contributed to the writing of the manuscript.
S. Hassinen: Overseeing the work in the group and contributed to the TROPOMI data handling.
A. Heikkilä: Responsible for the maintenance of Helsinki Brewer and QC/QA and processing of Helsinki Brewer data.
S. Henderson: Responsible for QC/QA and processing of data of ALI and MEL and contributed to the writing of the manuscript.570
G. Hülsen: Responsible for QC/QA and processing of the Davos Qasume spectroradiometer and broadband data and contributed to the writ-
ing of the manuscript.
B. Johnsen: Responsible for the QC/QA of the Norwegian UV-network sites and contributed to the writing of the manuscript.
N. Kalakoski contributed to the development of the TROPOMI UV algorithm.
A. Karanikolas contributed in calibration and analysis of THE data.575
T. Karppinen contributed to the QC/QA of the Sodankylä Brewer data.
K. Lamy: Responsible for QC/QA and processing of data of MAH, ANT, ROD and STD and contributed to the writing of the manuscript.
S. Leon: Co-Responsible for QC/QA and processing of IZO Brewer spectroradiometer data.
A. V. Lindfors contributed to the development of the TROPOMI UV algorithm and writing of the manuscript.
J.-M. Metzger contributed in calibration and maintenance of OPA spectroradiometer.580
F. Minvielle contributed in calibration of VDA and OHP spectroradiometers.
H. B. Muskatel: is responsible for the QC/QA and data processing of the measurements from BET, JER and EIL.
T. Portafaix: P.I. of UV-Indien network and responsible for QC/QA of MAH,ANT,ROD and STDR.
A. Redondas: Team leader of Regional Brewer Calibration Center-Europe (RBCC-E). Co-Responsible for QC/QA and processing of IZO
30
https://doi.org/10.5194/amt-2020-121Preprint. Discussion started: 15 June 2020c© Author(s) 2020. CC BY 4.0 License.

Brewer spectroradiometer data.585
R. Sanchez: Responsible in SMN for Marambio UV measurements.
A. Siani: Responsible for QC/QA and processing of ROM data and contributed to the writing of the manuscript.
T. Svendby: Responsible for GUV measurements at Blindern, Andøya and Ny-Ålesund.
J. Tamminen participated in the development of TROPOMI UV data product, discussion of the validation results and manuscript preparation.
590
Competing interests. No competing interests are present.
Acknowledgements. The TROPOMI UV-VIS-NIR-SWIR spectrometer on-board EU’s Copernicus Sentinel -5P satellite has been developed
in cooperation by The Netherlands and European Space Agency. We acknowledge the contribution of the international TROPOMI/Sentinel-
5P team, and in particular want to thank KNMI and ESA. We thank the operators of each site for their valuable work in everyday housekeeping
of the measurements. We acknowledge Mikko Pitkänen for help with data acquisition. Juha M. Karhu and Markku Ahponen are acknowl-595
edged for calibrations of the Brewer measurements in Sodankylä. We thank Patrick Disterhoft and Scott Stierle for providing data of NOAA’s
UV Monitoring Network. Data from Palmer are from NOAA’s UV Monitoring Network data base (https://www.esrl.noaa.gov/gmd/grad/antuv/).
UV-Indien program is funded by European Union throught the PO INTERREG V, by the Reunion Island Council and by the French Gov-
ernment. OPAR station (Observatoire de Physique de l’Atmosphère de La Réunion), and the OSU-R activities are funded by Université de
La Réunion and CNRS. Measurements from the French sites are supported by CNES within the TOSCA program, by the Région Hauts-de-600
France and the Ministère de l’Enseignement Supérieur et de la Recherche (CPER Climibio). GUV measurements at Blindern, Ny-Ålesund
and Andøya are funded by the Norwegian Environment Agency. K. Lakkala is supported by the CHAMPS project of the Academy of Finland
under the CLIHE program.
31
https://doi.org/10.5194/amt-2020-121Preprint. Discussion started: 15 June 2020c© Author(s) 2020. CC BY 4.0 License.

References
Amiridis, V., Balis, D. S., Kazadzis, S., Bais, A., Giannakaki, E., Papayannis, A., , and Zerefos, C.: Four-year aerosol observations with a Ra-605
man lidar at Thessaloniki, Greece, in the framework of European Aerosol Research Lidar Network (EARLINET), Journal of Geophysical
Research: Atmospheres, 110, https://doi.org/10.1029/2005jd006190, 2005.
Arola, A., Kazadzis, S., Lindfors, A., Krotkov, N., Kujanpää, J., Tamminen, J., Bais, A., di Sarra, A., Villaplana, J. M., Brognier, C., Siani,
A. M., Janouch, M., Weihs, P., Webb, A., Koskela, T., Kouremeti, N., Meloni, D., Buchard, V., Auriol, F., Ialongo, I., Staneck, M.,
Simic, S., Smedley, A., and Kinne, S.: A new approach to correct for absorbing aerosols in OMI UV, Geophys. Res. Lett., 36, L22 805,610
https://doi.org/10.1029/2009GL041137, 2009.
Bais, A., Zerefos, C., and McElroy, C.: Solar UVB measurements with the double- and single-monochromator Brewer Ozone Spectropho-
tometers, Geophys. Res. Lett., 23, 833–836, 1996.
Bais, A., Kazadzis, S., Balis, D., Zerefos, C., and Blumthaler, M.: Correcting global solar ultraviolet spectra recorded by a Brewer spectro-
radiometer for its angular response error, Appl. Optics, 37, 6339–6344, 1998.615
Bernhard, G.: Trends of solar ultraviolet irradiance at Barrow, Alaska, and the effect of measurement uncertainties on trend detection,
Atmospheric Chemistry and Physics, 11, 13 029–13 045, https://doi.org/10.5194/acp-11-13029-2011, https://www.atmos-chem-phys.net/
11/13029/2011/, 2011.
Bernhard, G. and Seckmeyer, G.: Uncertainty of measurements of spectral solar UV irradiance, J. Geophys. Res., 104, 14 321–14 345, 1999.
Bernhard, G., Booth, C. R., and Ehramjian, J. C.: Version 2 data of the National Science Foundation’s Ultraviolet Radiation Monitoring620
Network: South Pole, J. Geophys. Res., 109, D21 207, https://doi.org/10.1029/2004JD005584, 2004.
Bernhard, G., Booth, C. R., and Ehramjian, J. C.: Real-time ultraviolet and column ozone from multichannel ultraviolet radiome-
ters deployed in the National Science Foundation’s ultraviolet monitoring network, Optical Engineering, 44, 041 011–1–041 011–12,
https://doi.org/10.1117/1.1887195, https://doi.org/10.1117/1.1887195, 2005.
Bernhard, G., Arola, A., Dahlback, A., Fioletov, V., Heikkilä, A., Johnsen, B., Koskela, T., Lakkala, K., Svendby, T., and Tamminen, J.:625
Comparison of OMI UV observations with ground-based measurements at high northern latitudes, Atmospheric Chemistry and Physics,
15, 7391–7412, https://doi.org/10.5194/acp-15-7391-2015, https://www.atmos-chem-phys.net/15/7391/2015/, 2015.
Bouillon, R., Eisman, J., Garabedian, M., Holick, M. F., Kleinschmidt, J., Suda, T., Terenet-skaya, I., and Webb, A. R.: Actionspectrum for
the production of previtamin D3 in human skin, Interational commission on illumination technical report 174, 2006.
Brogniez, C., Auriol, F., Deroo, C., Arola, A., Kujanpää, J., Sauvage, B., Kalakoski, N., Pitkänen, M. R. A., Catalfamo, M., Metzger, J.-M.,630
Tournois, G., and Da Conceicao, P.: Validation of satellite-based noontime UVI with NDACC ground-based instruments: influence of
topography, environment and satellite overpass time, Atmos. Chem. Phys., 16, https://doi.org/10.5194/acp-16-15049-2016, 2016.
Buchard, V., Brogniez, C., Auriol, F., Bonnel, B., Lenoble, J., Tanskanen, A., Bojkov, B., and Veefkind, P.: Comparison of OMI ozone and
UV irradiance data with ground-based measurements at two French sites, Atmos. Chem. Phys., 8, 4517–4528, https://doi.org/10.5194/acp-
8-4517-2008, 2008.635
Calbó, J., Pags, D., and Gonzalez, J.-A.: Empirical studies of cloud effects on UV radiation: A review, Rev. Geophys, 43, RG2002,
https://doi.org/10.1029/2004RG000155, 2005.
Commission Internationale de l’Eclairage: Erythema Reference Action Spectrum and Standard Erythema Dose, CIE S007E-1998. CIE
Central Bureau, Vienna, Austria, 1998.
32
https://doi.org/10.5194/amt-2020-121Preprint. Discussion started: 15 June 2020c© Author(s) 2020. CC BY 4.0 License.

Eck, T. F., Bhartia, P. K., and Kerr, J. B.: Satellite estimation of spectral UVB irradiance using TOMS derived total ozone and UV reflectivity,640
Geophys. Res. Lett., 22, 611–614, 1995.
EEAP: Environmental Effects and Interactions of Stratospheric Ozone Depletion, UV Radiation, and Climate Change, 2018 Assess-
ment Report. Nairobi: Environmental Effects Assessment Panel, United Nations Environment Programme (UNEP), p. 390 pp.,
https://ozone.unep.org/science/assessment/eeap, 2019.
Egli, L.: Protocol of the solar UV intercomparison at INTA, El Arenosillo, Spain from June 17 to June645
27, 2019 with the travelling reference spectroradiometer QASUME from PMOD/WR., Available at (
https://www.pmodwrc.ch/wcc_uv/qasume_audit/reports/2019_06_spain_INTA_RBCCE14.pdf), last visited 2 April 2020, 2019.
Farman, J., Gardiner, B., and Shanklin, J.: Large losses of total ozone in Antarctica reveal seasonal CLOx/NOx interaction, Nature, 315,
207–210, 1985.
Fountoulakis, I., Bais, A. F., Fragkos, K., Meleti, C., Tourpali, K., and Zempila, M. M.: Short- and long-term variability of spectral solar650
UV irradiance at Thessaloniki, Greece: effects of changes in aerosols, total ozone and clouds, Atmospheric Chemistry and Physics, 16,
2493–2505, https://doi.org/10.5194/acp-16-2493-2016, https://www.atmos-chem-phys.net/16/2493/2016/, 2016.
Fountoulakis, I., Redondas, A., Lakkala, K., Berjon, A., Bais, A., Dopler, L., Feister, U., Heikkilä, A., Karppinen, T., Karhu, J., Koskela, T.,
Garane, K., Fragkos, K., and Savastiouk, V.: Temperature dependence of the Brewer global UV measurements, acp, Submitted, 2017.
Fountoulakis, I., Natsis, A., Siomos, N., Drosoglou, T., and Bais, A. F.: Deriving Aerosol Absorption Properties from Solar Ultraviolet655
Radiation Spectral Measurements at Thessaloniki, Greece, Remote Sensing, 2019.
Fountoulakis, I., Diémoz, H., Siani, A.-M., Laschewski, G., Filippa, G., Arola, A., Bais, A., De Backer, H., Lakkala, K., Webb, A., De Bock,
V., Karppinen, T., Garane, K., and Kapsomenakis, J.: Solar UV Irradiance in a Changing Climate: Trends in Europe and the Significance
of Spectral Monitoring in Italy, Environments, 7, 2020.
Garane, K., Bais, A. F., Kazadzis, S., Kazantzidis, A., and Meleti, C.: Monitoring of UV spectral irradiance at Thessaloniki (1990–2005):660
data re-evaluation and quality control, Ann. Geophys., 24, 3215–3228, 2006.
Garane, K., Koukouli, M.-E., Verhoelst, T., Lerot, C., Heue, K.-P., Fioletov, V., Balis, D., Bais, A., Bazureau, A., Dehn, A., Goutail, F.,
Granville, J., Griffin, D., Hubert, D., Keppens, A., Lambert, J.-C., Loyola, D., McLinden, C., Pazmino, A., Pommereau, J.-P., Redondas,
A., Romahn, F., Valks, P., Van Roozendael, M., Xu, J., Zehner, C., Zerefos, C., and Zimmer, W.: TROPOMI/S5P total ozone column data:
global ground-based validation and consistency with other satellite missions, Atmospheric Measurement Techniques, 12, 5263–5287,665
https://doi.org/10.5194/amt-12-5263-2019, https://www.atmos-meas-tech.net/12/5263/2019/, 2019.
García, R. D., Cuevas, E., Ramos, R., Cachorro, V. E., Redondas, A., and Moreno-Ruiz, J. A.: Description of the Baseline Sur-
face Radiation Network (BSRN) station at the Izaña Observatory (2009–2017): measurements and quality control/assurance pro-
cedures, Geoscientific Instrumentation, Methods and Data Systems, 8, 77–96, https://doi.org/10.5194/gi-8-77-2019, https://www.
geosci-instrum-method-data-syst.net/8/77/2019/, 2019.670
García, R. D., Cachorro, V. E., Cuevas, E., Toledano, C., Redondas, A., Blumthaler, M., and Benounna, Y.: Comparison of measured and
modelled spectral UV irradiance at Izaña high mountain station: estimation of the underlying effective albedo, International Journal of
Climatology, 36, 377–388, https://doi.org/10.1002/joc.4355, https://rmets.onlinelibrary.wiley.com/doi/abs/10.1002/joc.4355, 2016.
Gobbi, G., Barnaba, F., Di Liberto, L., Bolignano, A., Lucarelli, F., Nava, S., Perrino, C., Pietrodangelo, A., Basart, S., Costabile, F.,
Dionisi, D., Rizza, U., Canepari, S., Sozzi, R., Morelli, M., Manigrasso, M., Drewnick, F., Struckmeier, C., Poenitz, K., and Wille,675
H.: An inclusive view of Saharan dust advections to Italy and the Central Mediterranean, Atmospheric Environment, 201, 242–256,
https://doi.org/10.1016/j.atmosenv.2019.01.002, iSSN 1352-2310, 2019.
33
https://doi.org/10.5194/amt-2020-121Preprint. Discussion started: 15 June 2020c© Author(s) 2020. CC BY 4.0 License.
Gröbner, J.: Improved entrance optic for global irradiance measurements with a Brewer spectrophotometer, Applied Optics, 42, 3516– 3521,
2003.
Gröbner, J. and Sperfeld, P.: Direct traceability of the portable QASUME irradiance standard of the PTB, Metrologia, 42, 134–139, 2005.680
Gröbner, J., J., S., Kazadzis, S., Bais, A. F., Blumthaler, M., Görts, P., Tax, R., Koskela, T., Seckmeyer, G., Webb, A. R., and Rembges, D.:
Traveling reference spectroradiometer for routine quality assurance of spectral solar ultraviolet irradiance measurements, Appl. Optics,
44, 5321–5331, 2005.
Gröbner, J., Blumthaler, M., Kazadzis, S., Bais, A.and Webb, A., Schreder, J., and Seckmeyer, G.: Quality assurance of spectral solar
UV measurements: results from 25 UV monitoring sites in Europe, 2002 to 2004, Metrologia, p. S66, https://doi.org/10.1088/0026-685
1394/43/2/S14, 2006.
Guirado, C., Ramos López, R., Baraja, F., Berjón Arroyo, A. J., Redondas, A., López, C., Cachorro Revilla, V. E., Cuevas, E., Gónzalez, R.,
and Gonzalez, S.: Optical calibration facility at the Izaña Atmospheric Research Center, Opt. Pura Apl., 45, 2012.
Heikkilä, A., Kaurola, J., Lakkala, K., Karhu, J. M., Kyrö, E., Koskela, T., Engelsen, O., Slaper, H., and Seckmeyer, G.: European UV
DataBase (EUVDB) as a repository and quality analyzer for solar spectral UV irradiance monitored in Sodankylä, Geoscientific Instru-690
mentation, Methods and Data Systems, 5, 333–345, https://doi.org/10.5194/gi-5-333-2016, http://www.geosci-instrum-method-data-syst.
net/5/333/2016/, 2016.
Heikkilä, A., Mäkelä, J., Lakkala, K., Meinander, O., Kaurola, J., Koskela, T., Karhu, J. M., Karppinen, T., Kyrö, E., and de Leeuw, G.: In
search of traceability: Two decades of calibrated Brewer UV measurements in Sodankylä and Jokioinen, Geosci. Instrum. Method. Data
Syst., 5, 531, 2016.695
Herman, J. R., Labow, G., Hsu, N. C., and Larko, D.: Changes in cloud and aerosol cover (1980–2006) from reflectivity time se-
ries using SeaWiFS, N7-TOMS, EP-TOMS, SBUV-2, and OMI radiance data, Journal of Geophysical Research: Atmospheres, 114,
https://doi.org/10.1029/2007JD009508, https://agupubs.onlinelibrary.wiley.com/doi/abs/10.1029/2007JD009508, 2009.
Hülsen, G., Gröbner, J., Nevas, S., Sperfeld, P., Egli, L., Porrovecchio, G., and Smid, M.: Traceability of solar UV measurements using the
Qasume reference spectroradiometer, Appl. Opt., 55, 7265–7275, https://doi.org/10.1364/AO.55.007265, http://ao.osa.org/abstract.cfm?700
URI=ao-55-26-7265, 2016.
Jégou, F., Godin-Beekman, S., Corrêa, M. P., Brogniez, C., Auriol, F., Peuch, V. H., Haeffelin, M., Pazmino, A., Saiag, P., Goutail, F., and
Mahé, E.: Validity of satellite measurements used for the monitoring of UV radiation risk on health, Atmospheric Chemistry and Physics,
11, 13 377–13 394, https://doi.org/10.5194/acp-11-13377-2011, https://www.atmos-chem-phys.net/11/13377/2011/, 2011.
Johnsen, B., Mikkelborg, O., Hannevik, M., Nilsen, L., Saxebøl, G., and Blaasaas, K.: The Norwegian UV-monitoring program Period705
1995/96 to 2001, Strålevern Rapport 2002:4, Norwegian Radiation Protection Authority, Østerås, 2002.
Johnsen, B., Kjeldstad, B., Aalerud, T. N., Nilsen, L. T., Schreder, J., Blumthaler, M., Bernhard, G., Topaloglou, C., Meinander, O., Bagheri,
A., Slusser, J. R., and Davis, J.: Intercomparison of Global UV Index from Multiband Filter Radiometers: Harmonization of global UVI
and spectral irradiance, GAW report no. 179 / WMO/TD-No. 1454., Geneve: World Meteorological Organization, 2008.
Juzeniene, A. and Moan, J.: Beneficial effects of UV radiation other than via vitamin D production, Dermato-Endocrinology, 4, 109–117,710
https://doi.org/10.4161/derm.20013, 2012.
Kalliskota, S., Kaurola, J., Taalas, P., Herman, J., Celarier, E., and Krotkov, N.: Comparisons of daily UV doses estimated from Nimbus-
7/TOMS measurements and ground based spectroradiometric data, J. Geophys. Res., 105, 5059–5067, 2000.
34
https://doi.org/10.5194/amt-2020-121Preprint. Discussion started: 15 June 2020c© Author(s) 2020. CC BY 4.0 License.
Kinne, S., O’Donnel, D., Stier, P., Kloster, S., Zhang, K., Schmidt, H., Rast, S., Giorgetta, M., Eck, T. F., and Stevens, B.:
MAC-v1: A new global aerosol climatology for climate studies, Journal of Advances in Modeling Earth Systems, 5, 704–740,715
https://doi.org/10.1002/jame.20035, https://agupubs.onlinelibrary.wiley.com/doi/abs/10.1002/jame.20035, 2013.
Krotkov, N. A., Bhartia, P. K., Herman, J. R., Ahmad, Z., and Fioletov, V.: Satellite estimation of spectral surface UV irradiance 2: effect of
horizontally homogeneous clouds and snow, J. Geophys. Res., 106, 11 743–11 759, 2001.
Kübarsepp, T., Kärhä, P., Manoocheri, F., Nevas, S., Ylianttila, L., and Ikonen, E.: Spectral irradiance measurements of tungsten lamps with
filter radiometers in the spectral range 290 nm to 900 nm, Metrologia, 37, 305–312, 2000.720
Kujanpää, J.: Sentinel-5 precursor/TROPOMI Level 2 Product User Manual Surface UV Radiation, issue 1.2, available via
https://nsdc.fmi.fi/data/data_s5puv.php (last access 8 Apr 2020), 2020.
Kujanpää, J. and Kalakoski, N.: Operational surface UV radiation product from GOME-2 and AVHRR/3 data, Atmospheric Measurement
Techniques, 8, 4399–4414, https://doi.org/10.5194/amt-8-4399-2015, https://www.atmos-meas-tech.net/8/4399/2015/, 2015.
Kujanpää, J., Lindfors, A., Kalakoski, N., and Lakkala, K.: Sentinel-5 precursor/TROPOMI Level 2 Algorithm Theoretical Basis Document725
Surface UV Radiation, issue 1.2.0, 2020-03-01, available via https://nsdc.fmi.fi/data/data_s5puv.php (last access 13 Jun 2020), 2020.
Lakkala, K., Kyrö, E., and Turunen, T.: Spectral UV Measurements at Sodankylä during 1990-2001, J. Geophys. Res., 108,
https://doi.org/10.1029/2002JD003300, 2003.
Lakkala, K., Arola, A., Heikkilä, A., Kaurola, J., Koskela, T., Kyrö, E., Lindfors, A., Meinander, O., Tanskanen, A., Gröbner, J., and Hülsen,
G.: Quality assurance of the Brewer spectral UV measurements in Finland, Atmos. Chem. Phys., 8, 3369–3383, 2008.730
Lakkala, K., Suokanerva, H., Karhu, J. M., Aarva, A., Poikonen, A., Karppinen, T., Ahponen, M., Hannula, H.-R., Kontu, A., and Kyrö, E.:
Optical laboratory facilities at the Finnish Meteorological Institute – Arctic Research Centre, Geoscientific Instrumentation, Methods and
Data Systems, 5, 315–320, https://doi.org/10.5194/gi-5-315-2016, http://www.geosci-instrum-method-data-syst.net/5/315/2016/, 2016.
Lakkala, K., Arola, A., Gröbner, J., León-Luis, S. F., Redondas, A., Kazadzis, S., Karppinen, T., Karhu, J. M., Egli, L., Heikkilä, A., Koskela,
T., Serrano, A., and Vilaplana, J. M.: Performance of the FMI cosine error correction method for the Brewer spectral UV measurements,735
Atmospheric Measurement Techniques, 11, 5167–5180, https://doi.org/10.5194/amt-11-5167-2018, https://www.atmos-meas-tech.net/11/
5167/2018/, 2018.
Lamy, K., Portafaix, T., Josse, B., Brogniez, C., Godin-Beekmann, S., Bencherif, H., Revell, L., Akiyoshi, H., Bekki, S., Hegglin, M. I.,
Jöckel, P., Kirner, O., Liley, B., Marecal, V., Morgenstern, O., Stenke, A., Zeng, G., Abraham, N. L., Archibald, A. T., Butchart, N., Chip-
perfield, M. P., Di Genova, G., Deushi, M., Dhomse, S. S., Hu, R.-M., Kinnison, D., Kotkamp, M., McKenzie, R., Michou, M., O’Connor,740
F. M., Oman, L. D., Pitari, G., Plummer, D. A., Pyle, J. A., Rozanov, E., Saint-Martin, D., Sudo, K., Tanaka, T. Y., Visioni, D., and
Yoshida, K.: Clear-sky ultraviolet radiation modelling using output from the Chemistry Climate Model Initiative, Atmospheric Chemistry
and Physics, 19, 10 087–10 110, https://doi.org/10.5194/acp-19-10087-2019, https://www.atmos-chem-phys.net/19/10087/2019/, 2019.
Levelt, P. F., van den Oord, G. H. J., Dobber, M. R., Malkki, A., Huib Visser, Johan de Vries, Stammes, P., Lundell, J. O. V., and Saari, H.:
The ozone monitoring instrument, IEEE Transactions on Geoscience and Remote Sensing, 44, 1093–1101, 2006.745
Lindfors, A. V., Kujanpää, J., Kalakoski, N., Heikkilä, A., Lakkala, K., Mielonen, T., Sneep, M., Krotkov, N. A., Arola, A., and Tamminen, J.:
The TROPOMI surface UV algorithm, Atmospheric Measurement Techniques, 11, 997–1008, https://doi.org/10.5194/amt-11-997-2018,
https://www.atmos-meas-tech.net/11/997/2018/, 2018.
Luomaranta, A., Aalto, J., and Jylhä, K.: Snow cover trends in Finland over 1961–2014 based on gridded snow depth observations., Int. J.
Climatol., p. 3147–3159, 2019.750
35
https://doi.org/10.5194/amt-2020-121Preprint. Discussion started: 15 June 2020c© Author(s) 2020. CC BY 4.0 License.

Mäkelä, J. S., Lakkala, K., Koskela, T., Karppinen, T., Karhu, J. M., Savastiouk, V., Suokanerva, H., Kaurola, J., Arola, A., Lindfors, A. V.,
Meinander, O., de Leeuw, G., and Heikkilä, A.: Data flow of spectral UV measurements at Sodankylä and Jokioinen, Geosci. Instrum.
Method. Data Syst., 5, 193, 2016.
McKinlay, A. F. and Diffey, B. L.: A reference action spectrum for ultraviolet induced erythema in human skin, CIE J., 6, 17–22, 1987.
Nichol, S. E., Pfister, G., Bodeker, G. E., McKenzie, R. L., Wood, S. W., and Bernhard, G.: Moderation of Cloud Reduction of755
UV in the Antarctic Due to High Surface Albedo, Journal of Applied Meteorology, 42, 1174–1183, https://doi.org/10.1175/1520-
0450(2003)042<1174:MOCROU>2.0.CO;2, https://doi.org/10.1175/1520-0450(2003)042<1174:MOCROU>2.0.CO;2, 2003.
Petkov, B., Vitale, V., Tomasi, C., Siani, A., Seckmeyer, G., Webb, A., Smedley, A., Casale, G., Werner, R., Lanconelli, C., Mazzola, M.,
Lupi, A., Busetto, M., Diémoz, H., Goutail, F., Köhler, U., Mendeva, B., Josefsson, W., Moore, D., Bartolomé, M., Moreta González, J.,
Misaga, O., Dahlback, A., Tóth, Z., Varghese, S., De Backer, H., Stübi, R., and Vanicek, K.: Response of the ozone column over Europe760
to the 2011 Arctic ozone depletion event according to ground-based observations and assessment of the consequent variations in surface
UV irradiance, Atmospheric Environment, 85, 169–178, 2014.
Siani, A. M., Frasca, F., Scarlatti, F., Religi, A., Diémoz, H., Casale, G. R., Pedone, M., and Savastiouk, V.: Examination on total ozone
column retrievals by Brewer spectrophotometry using different processing software, Atmospheric Measurement Techniques, 11, 5105–
5123, https://doi.org/10.5194/amt-11-5105-2018, https://www.atmos-meas-tech.net/11/5105/2018/, 2018.765
Sierra Ramos, M.: RBCC-E laboratory UV measurements at Izaña Atmospheric Research Centre (II), [online] Available from:
https://repositorio.aemet.es/handle/20.500.11765/3439 (Accessed 1 April 2020), 2012.
Slaper, H., Reinen, H. A. J. M., Blumthaler, M., Huber, M., and Kuik, F.: Comparing ground-level spectrally resolved solar UV measurements
using various instruments: A technique resolving effects of wavelength shift and slit width, Geophys. Res. Lett., 22, 2721–2724, 1995.
Solomon, S., Garcia, R., Rowland, F., and Wuebbles, D.: On the depletion of Antarctic ozone, Nature, 321, 755–758,770
https://doi.org/10.1038/321755a0, 1986.
Spurr, R. J.: VLIDORT: A linearized pseudo-spherical vector discrete ordinate radiative transfer code for forward model and re-
trieval studies in multilayer multiple scattering media, Journal of Quantitative Spectroscopy and Radiative Transfer, 102, 316 – 342,
https://doi.org/https://doi.org/10.1016/j.jqsrt.2006.05.005, http://www.sciencedirect.com/science/article/pii/S0022407306001191, 2006.
Stein Zweers, D.: TROPOMI ATBD of the UV aerosol index, available at: http://www.tropomi.eu/data-products/level-2-products, available775
at: http://www.tropomi.eu/data-products/level-2-products (last access: 20 March 2020), issue 1.1, 2018.
Takala, M., Luojus, K., Pulliainen, J., Derksen, C., Lemmetyinen, J., Kärnä, J.-P., Koskinen, J., and Bojkov, B.: Estimating northern hemi-
sphere snow water equivalent for climate research through assimilation of space-borne radiometer data and ground-based measurements,
Remote Sensing of Environment, 115, 3517 – 3529, https://doi.org/https://doi.org/10.1016/j.rse.2011.08.014, http://www.sciencedirect.
com/science/article/pii/S0034425711003166, 2011.780
Tanskanen, A., Krotkov, N., Herman, J. R., and Arola, A.: Surface ultraviolet irradiance from OMI, IEEE T. Geosci. Remote, 44, 1267–1271,
2006.
Tanskanen, A., Lindfors, A., Määttä, A., Krotkov, N., Herman, J., Kaurola, J., Koskela, T., Lakkala, K., Fioletov, V., Bernhard, G., McKenzie,
R., Kondo, Y., O’Neill, M., Slaper, H., den Outer, P., Bais, A. F., and Tamminen, J.: Validation of daily erythemal doses from Ozone
Monitoring Instrument with ground-based UV measurement data, J. Geophys. Res., 112, D2S44, https://doi.org/10.1029/2007JD008830,785
2007.
Webb, A. R.: Who, what, where and when—influences on cutaneous vitamin D synthesis, Progress in Biophysics and Molecular Bi-
ology, 92, 17 – 25, https://doi.org/https://doi.org/10.1016/j.pbiomolbio.2006.02.004, http://www.sciencedirect.com/science/article/pii/
36
https://doi.org/10.5194/amt-2020-121Preprint. Discussion started: 15 June 2020c© Author(s) 2020. CC BY 4.0 License.
S0079610706000204, uV exposure guidance: A balanced approach between health risks and health benefits of UV and Vitamin D.
Proceedings of an International Workshop, International Commission on Non-ionizing Radiation Protection, Munich, Germany, 17-18790
October, 2005, 2006.
Webb, A. R., Slaper, H., Koepke, P., and Schmalwieser, A. W.: Know Your Standard: Clarifying the CIE Erythema Action Spectrum,
Photochemistry and Photobiology, 87, 483–486, https://doi.org/10.1111/j.1751-1097.2010.00871.x, https://onlinelibrary.wiley.com/doi/
abs/10.1111/j.1751-1097.2010.00871.x, 2011.
WMO: Scientific Assessment of Stratospheric ozone: 1989, World Meteorological Organization (WMO), Global Ozone Research and Mon-795
itoring Project–Report No. 20, 1990.
WMO: Report of the WMO-WHO Meeting of Experts on Standardization of UV Indices and their Dissemination to the Public, World
Meteorological Organization (WMO), Global Atmosphere Watch Report No. 127, 1997.
WMO: Scientific Assessment of Ozone Depletion:1998, World Meteorological Organization (WMO), Global Ozone Research and Monitor-
ing Project–Report No. 44, 1999.800
WMO: Scientific Assessment of Ozone Depletion: 2018, World Meteorological Organization (WMO), Global Ozone Research and Moni-
toring Project–Report No. 58, 2018.
37
https://doi.org/10.5194/amt-2020-121Preprint. Discussion started: 15 June 2020c© Author(s) 2020. CC BY 4.0 License.
Related Documents