Pergamon Chemosphere, Vol. 37, No. 13, pp. 2627-2643, 1998 © 1998Elsevier Science Ltd. All rights reserved 0045-6535/98/$ - see front matter PII: S01M5-6535(98)00162-3 VALIDATION OF THE USE OF BLOOD SAMPLES TO ASSESS TISSUE CONCENTRATIONS OF ORGANOCHLORINES IN GLAUCOUS GULLS, Larus hyperboreus Espen O. Henriksen 1., Geir W. Gabrielsen ~ and Janneche Utne Skaare 2~ J Norwegian Polar Institute, N-9005 TROMSO, Norway 2 Norwegian College of Veterinary Medicine, PO Box 8146 Dep., N-0033 OSLO, Norway 3 National Veterinary Institute, PO Box 8156, N-0033 OSLO, Norway (Receivedin Germany 18 February 1998; accepted 21 April 1998) ABSTRACT Fitteen adult glaucous gulls, Larus hyperboreus, were captured near Ny-Alesund, Svalbard. The birds were kept in captivity for 24 - 41 days and fed a diet of polar cod, Boreogadus saida. A range of organochlorines (OCs) were quantified in blood, brain, liver, and subcutaneous fat tissue. For more than 80 % of the quantified OCs, r 2 values >0.75 were found for the blood-liver concentration correlations. Repeated sampling revealed intra-individual temporal variability in blood OC concentrations. Much of the temporal variability in OC blood concentrations was associated with changes in nutritional condition. ©1998 Elsevier Science Ltd. All rights reserved -~ INTRODUCTION In recent years, disturbingly high levels of anthropogenic persistent organochlorines (OCs) have been found to bioaccumulate in arctic marine top predators [ 1,2]. The monitoring of OC levels and the studies of their possible effects depends on the analysis of tissues or body fluids. As noted by Friend and co-workers [3], the use of blood samples has several advantages compared to sacrificing animals. In endangered species, sacrificing even a few individuals may be unacceptable. Non-destructive sampling also allows long-term studies with repeated sampling and monitoring of potential impact of OCs on survival and reproduction. The use of blood as sample matrix for OC analysis depends on the assumption that the concentrations of OCs in blood are related to tissue concentrations. This assumption is supported by studies on a number of species including man (e.g. [4]), polar bear, Ursus maritimus, [1], and various birds [3,5,6]. In the case of the polychlorinated biphenyls (PCBs), regression analysis has demonstrated that the tissue:blood partition coefficient can be expressed as a function of molecular structure [7]. The present study focuses on the glaucous gull, Larus hyperboreus, an opportunistic arctic predatory gull which can accumulate high tissue concentrations of OCs, in particular PCBs [2,8]. All previous studies on OCs in the ' to whomcorrespondenceshould be addressed 2627

Welcome message from author
This document is posted to help you gain knowledge. Please leave a comment to let me know what you think about it! Share it to your friends and learn new things together.
Transcript
Pergamon Chemosphere, Vol. 37, No. 13, pp. 2627-2643, 1998 © 1998 Elsevier Science Ltd. All rights reserved
0045-6535/98/$ - see front matter PII: S01M5-6535(98)00162-3
V A L I D A T I O N O F T H E U S E O F B L O O D S A M P L E S T O A S S E S S
T I S S U E C O N C E N T R A T I O N S O F O R G A N O C H L O R I N E S I N
G L A U C O U S G U L L S , Larus hyperboreus
Espen O. Henriksen 1., Geir W. Gabrielsen ~ and Janneche Utne Skaare 2~
J Norwegian Polar Institute, N-9005 TROMSO, Norway 2 Norwegian College of Veterinary Medicine, PO Box 8146 Dep., N-0033 OSLO, Norway
3 National Veterinary Institute, PO Box 8156, N-0033 OSLO, Norway
(Received in Germany 18 February 1998; accepted 21 April 1998)
ABSTRACT
Fitteen adult glaucous gulls, Larus hyperboreus, were captured near Ny-Alesund, Svalbard. The birds were kept
in captivity for 24 - 41 days and fed a diet of polar cod, Boreogadus saida. A range of organochlorines (OCs) were
quantified in blood, brain, liver, and subcutaneous fat tissue. For more than 80 % of the quantified OCs, r 2 values
>0.75 were found for the blood-liver concentration correlations. Repeated sampling revealed intra-individual
temporal variability in blood OC concentrations. Much of the temporal variability in OC blood concentrations was
associated with changes in nutritional condition. ©1998 Elsevier Science Ltd. All rights reserved
-~ INTRODUCTION
In recent years, disturbingly high levels of anthropogenic persistent organochlorines (OCs) have been found to
bioaccumulate in arctic marine top predators [ 1,2]. The monitoring of OC levels and the studies of their possible
effects depends on the analysis of tissues or body fluids. As noted by Friend and co-workers [3], the use of blood
samples has several advantages compared to sacrificing animals. In endangered species, sacrificing even a few
individuals may be unacceptable. Non-destructive sampling also allows long-term studies with repeated sampling
and monitoring of potential impact of OCs on survival and reproduction.
The use of blood as sample matrix for OC analysis depends on the assumption that the concentrations of OCs in
blood are related to tissue concentrations. This assumption is supported by studies on a number of species
including man (e.g. [4]), polar bear, Ursus maritimus, [1], and various birds [3,5,6]. In the case of the
polychlorinated biphenyls (PCBs), regression analysis has demonstrated that the tissue:blood partition coefficient
can be expressed as a function of molecular structure [7].
The present study focuses on the glaucous gull, Larus hyperboreus, an opportunistic arctic predatory gull which
can accumulate high tissue concentrations of OCs, in particular PCBs [2,8]. All previous studies on OCs in the
' to whom correspondence should be addressed
2627
2628
glaucous gull have been based on analysis of tissue samples or eggs. The purpose of the present study was to
validate the use of blood samples to assess OC levels in the glaucous gull. Our primary objective was to determine
the relationship between concentrations in blood and the corresponding concentrations in selected tissues for a
range of OC compounds. We also examined the temporal variation in blood OC levels under the standardised
conditions of the experiment. This was done because any inherent intra-individual temporal variation would
underlie the additional variation expected under less standardised sampling from free-living birds. In effect studies
on free-living birds, it is desirable to know whether an elevated blood concentration of an OC compound at a
single point in time is related to a chronic load.
MATERIALS AND METHODS
Between May 31 and June 10 1995, 22 adult glaucous gulls were caught in the vicinity of Ny-Alesund, Svalbard
(79°N, 12°E) with a cannon-net, using seal blubber as bait. The birds were kept in captivity at the Norwegian
Polar Institute's research station in Ny-,~lesund. Seven of the birds had to be rele.ased after 1-3 days because they
did not acclimatize to captivity. The remaining 15 individuals (11 females and 4 males) were placed separately in
plastic covered wire mesh cages (0.75m x 0.75m x 0.60m) on an outdoor platform, covered by a plastic roof. The
walls of the platform allowed light to pass through between each board. Thus, the birds were exposed to the
ambient light and air temperatures, while they were protected against direct sunlight and precipitation. The birds
were weighed, using a Mettler PE 16 (±0.1 g) balance, and examined every morning.
The birds were fed polar cod (Boreogadus saida), which is an important species in their natural diet [9,10]. Polar
cod were collected in the Kongsfjorden area in June 1995, and kept frozen at -10°C until thawed. OC
concentrations were not determined in the fish, However, a mean EPCB-concentration of 33.3 ng/g lipid has been
found in whole polar cod from the northern Barents Sea [11]. Apart from 12 hours before each blood sampling,
food was available ad libitum. The birds had free access to water. All birds ate voluntarily during the entire
experiment.
Blood samples were taken every fifth day from the brachial vein on the inside of each wing, altemating between
the two wings. The terminal blood samples were analysed for OCs as described below. In addition, selected OCs
were also quantified in one of the two first blood samples from each bird. The birds were sensitive to handling.
To reduce stress, handling was limited to once a day. Refilling of food and water was done twice a day. Individual
birds were kept in captivity for between 24 and 41 days. Nine birds lost <15% of their initial body mass at the end
of the experiment. These birds were fasted for 2 days before they were killed. Initial body masses were 1240-
1520 g for females and 1620-1860 g for males. Body masses at the end of the experiment were 980-1260 g for
females and 1350-1540 g for males. The birds were killed by decapitation or cervical dislocation.
2629
OCs were quantified in blood and tissue samples using the method described by Brevik [12] with modifications by
Bernhoft et aL [1]. Briefly, samples were homogenized and extracted twice with cyclohexane and acetone using
an ultrasonic homogeniser. Extractable fat was determined gravimetrically. Cleanup was done with sulphuric
acid. The samples were injected on a gas cromatograph with a SB-5 capillary column and an electron capture
detector. The following OCs were determined: ct-, 13-, and T-HCH, oxychlordane, trans-chlordane, cis-chlordane,
trans-nonachlor, p,p '-DDE, o,p '-DDD, p,p '-DDD, p,p '-DDT, HCB, Mirex, and 33 PCB-congeners (IUPAC nos.):
28, 31, 47, 52 (not analysed in brain samples), 56, 66, 74, 87, 99, 101,105, 110, 114, 118, 128, 136, 137, 138, 141,
149, 151,153, 156, 157, 170, 180, 187, 189, 194, 196, 199, 206 and 209. In each batch of 24 samples, recoveries
of added standard mixtures to clean samples were calculated. Percentage recoveries were in the in the range of 70-
130%. Quantification limits for individual OCs were 0.3-8 ng/g in blood lipids, 0.9-17 ng/g in liver tipids, 1.8-31
ng/g in brain lipids and 0.3-58 ng/g in lipid from subcutaneous fat tissue. The laboratory's analytical quality was
approved in several intercalibration tests, including the four steps of the ICES/IOC/OSPARCOM intercomparison
exercise on the analysis of PCBs in marine media.
Statistical methods
JMP and SAS statistical software (SAS Institute, Cary, NC, USA) were used in the statistical analysis. P-values
less than 0.05 were considered statistically significant. In general, the OC concentration data departed significantly
from the normal-distribution, according to the Shapiro-Wilk test. After loglo transformation, the Shapiro-Wilk test
indicated that only 6 out of 152 variables (38 compounds x 4 matrices) departed significantly from normal
distributions. Based on this, underlying normally distributed populations were assumed for the logl0-transformed
OC concentration data. All statistics on OC data were based on logl0-transformed values. For comparison of
concentration ratios (between blood and tissues or between different blood samples), log~0-transformations were
performed on the ratios. The means and confidence-intervals of the ratios were then back-transformed to
geometric means with 95% confidence intervals. Sexes were pooled because OC concentrations did not differ
significantly between the sexes. The data for percentage extracted lipid from subcutaneous fat was consistent with
a normal distribution and was not transformed. Correlations were explored using squared Pearson's product-
moment correlations (r 2) and associated p-values, assuming independent observations from normally distributed
populations. Correlations between blood and tissues were not calculated if the OC was below the quantification
limit in more than half of the tissue or blood samples. In the remaining cases, half the quantification limits were
used for OCs below the quantification limits. OC-concentrations are presented as median and ranges. To facilitate
comparison with other studies, arithmetic means are provided.
To investigate variation in blood concentrations, multivariable linear regression models were fitted to the data for
the 13 individual OC compounds that were quantified twice (SAS General Linear Model). Models were created to
describe the relationship between OC concentrations in the I st and the 2 "d (terminal) set of blood samples. In the
models, the concentration of an OC in the 2 nd blood sample (Y) was assumed to depend on X1, the corresponding
2630
concentration in the 1 st blood sample, and on X2, the change in body mass between the 1 st and the 2 "d sampling.
Body mass change was included in the models because nutritional condition is important for tissue OC
concentrations [13]. The period between the 1 st and the 2 "d blood sample varied between birds (22-35 days).
The model fit was: Y = ,80 + flIXl + ~X2 + E,
Y = cone. of specific OC in the 2 nd blood sample X1 = corresponding OC cone. in the 1 st blood sample X2 = change in body mass between 1 st and 2 "d blood sampling fl0, ,81, ~ = regression coefficients E = error component.
These models partitioned the total variance of Y based on the proportion of the total sum of squares that could be
accounted for by Xt and X2 (Type I sum of squares) (Fig. 4). Significance of the regression coefficients for Xl and
X2 (i.e., fll and ,82) was judged from t-tests (H0: regression coefficient = 0).
RESULTS
Prevalence and levels of OCs in blood at the end of the experiment
The following OCs were above the quantification limit in all the analysed blood samples: chlordanes (sum of oxy-
and cis-chlordane, and trans-nonachlor), HCB, HCHs (sum of cx- and [3-HCH), DDTs (sum ofp,p '-DDT and p,p "-
DDE), Mirex and PCBs (29 individual congeners with 3-10 chloro substituents). PCBs dominated the OCs present
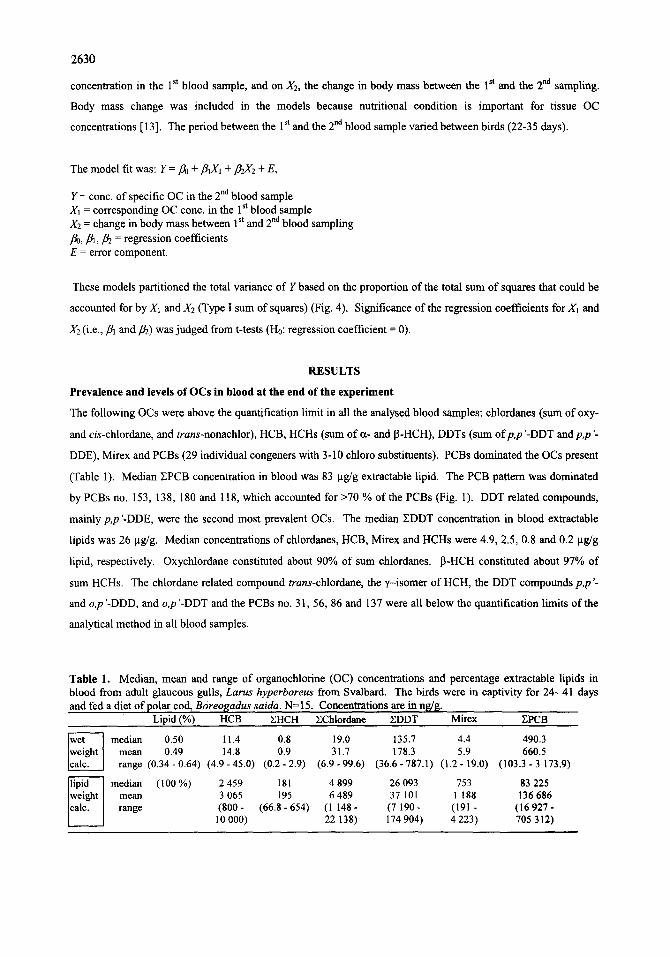
(Table 1). Median ZPCB concentration in blood was 83 lag/g extractable lipid. The PCB pattern was dominated
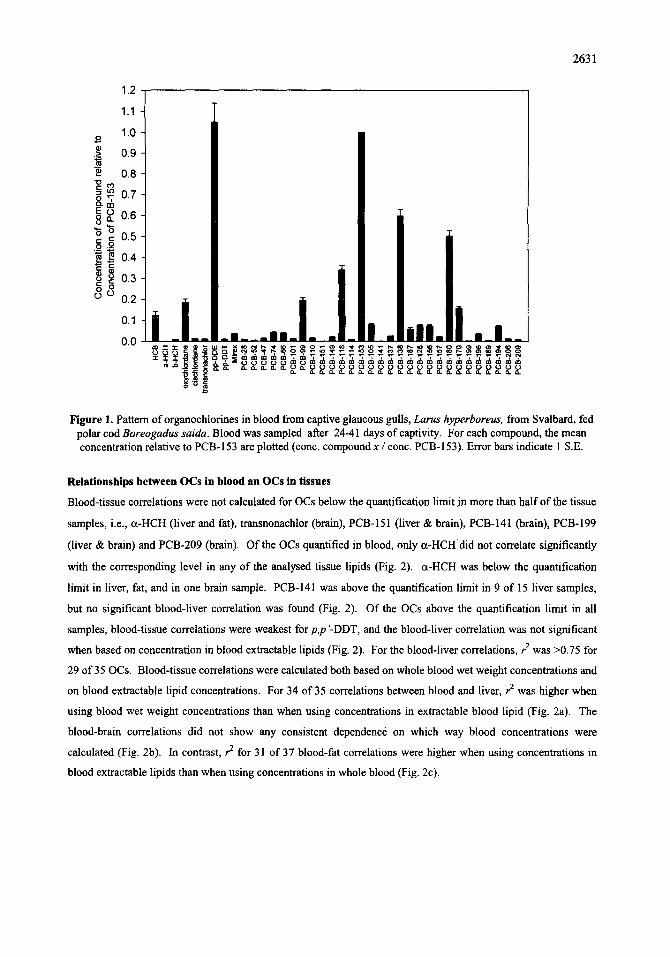
by PCBs no. 153, 138, 180 and 118, which accounted for >70 % of the PCBs (Fig. 1). DDT related compounds,
mainly p,p'-DDE, were the second most prevalent OCs. The median EDDT concentration in blood extractable
lipids was 26 ~tg/g. Median concentrations of chlordanes, HCB, Mirex and HCHs were 4.9, 2.5, 0.8 and 0.2 ~tg/g
lipid, respectively. Oxychlordane constituted about 90% of sum chlordanes. 13-HCH constituted about 97% of
sum HCHs. The chlordane related compound trans-chlordane, the ~'-isomer of HCH, the DDT compounds p,p'-
and o,p '-DDD, and o,p '-DDT and the PCBs no. 31, 56, 86 and 137 were all below the quantification limits of the
analytical method in all blood samples.
Table 1. Median, mean and range of organochlorine (OC) concentrations and percentage extractable lipids in blood from adult glaucous gulls, Larus hyperboreus from Svalbard. The birds were in captivity for 24- 41 days and fed a diet of polar cod, Boreogadus saida. N=15. Concentrations are in ng/g.
Lipid (%) HCB EHCH EChlordane EDDT Mirex EPCB
median 0.50 11.4 0.8 19.0 135.7 4.4 490.3 mean 0.49 14.8 0.9 31.7 178.3 5.9 660.5 range (0.34-0.64) (4.9-45.0) (0.2-2.9) (6.9-99.6) (36.6-787.1) (I.2-19.0) (103.3-3 173.9)
median (100 %) 2 459 181 4 899 26 093 753 83 225 mean 3 065 195 6 489 37 101 1 188 136 686 range (800 - (66.8 - 654) (1 148 - (7 190 - (191 - (16 927 -
10 000) 22 138) 174 904) 4 223) 705 312)
2631
1.2
1.1
o 1.0
0.9
0.8
= ~ 0.7
~ 0.4 88
0.3
0.2
0.1
~ ® ' & O o o O 0 0 0 0 0 0 0
Figure 1. Pattern oforganochlorines in blood from captive glaucous gulls, Larus hyperboreus, from Svalbard, fed polar cod Boreogadus saida. Blood was sampled after 24-41 days of captivity. For each compound, the mean concentration relative to PCB-153 are plotted (cone. compound x / cone. PCB-153). Error bars indicate 1 S.E.
Relationships between OCs in blood an OCs in tissues
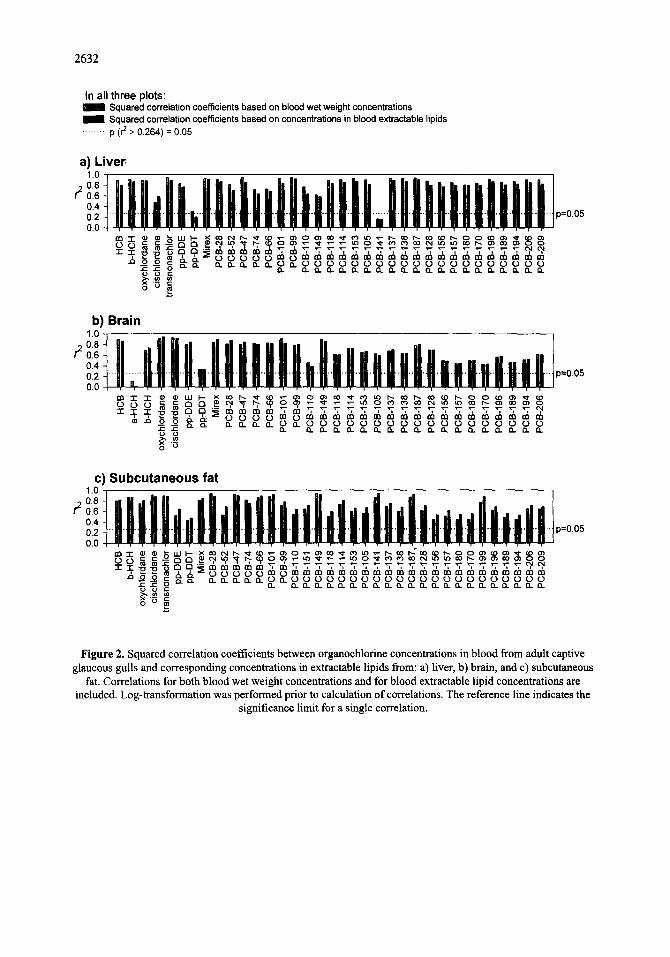
Blood-tissue correlations were not calculated for OCs below the quantification limit jn more than half of the tissue
samples, i.e., ct-HCH (liver and fat), transnonachlor (brain), PCB-151 (liver & brain), PCB-141 (brain), PCB-199
(liver & brain) and PCB-209 (brain). Of the OCs quantified in blood, only a-HCHdid not correlate significantly
with the corresponding level in any of the analysed tissue lipids (Fig. 2). a-HCH was below the quantification
limit in liver, fat, and in one brain sample. PCB-141 was above the quantification limit in 9 of 15 liver samples,
but no significant blood-liver correlation was found (Fig. 2). Of the OCs above the quantification limit in all
samples, blood-tissue correlations were weakest for p,p '-DDT, and the blood-liver correlation was not significant
when based on concentration in blood extractable lipids (Fig. 2). For the blood-liver correlations, r 2 was >0.75 for
29 of 35 OCs. Blood-tissue correlations were calculated both based on whole blood wet weight concentrations and
on blood extractable lipid concentrations. For 34 of 35 correlations between blood and liver, r ~ was higher when
using blood wet weight concentrations than when using concentrations in extractable blood lipid (Fig. 2a). The
blood-brain correlations did not show any consistent dependence on which way blood concentrations were
calculated (Fig. 2b). In contrast, r 2 for 31 of 37 blood-fat correlations were higher when using concentrations in
blood extractable lipids than when using concentrations in whole blood (Fig. 2c).
2632
In all t h ree p lots : mum Squared correlation coefficients based on blood wet weight concentrations
Squared correlation coefficients based on concentrations in blood extractable lipids ........ p (r 2 > 0.264) = 0.05
a) Liver 1.0 0,8
/2 0.6 0.4 0.2 0.0
p=O.05
$ $ ~ 6.6. oo 0. o o o o o o o o o o u o o o o o o o 0. ~0. 13. O o Q. f t . f t . O. I~ n n Ck Q. ft. O_ Q. 13_ ft. Q. ft. n n ~.=_ ==
b) Brain 1.0
°"!!! Illll IIIIHHK,,HKNNultNHN u Buui /2 0 6
o., " U . . . . . . . . . . . " , II N 0.2 . . . . . n . . . . . . . . . . . . . . . . . . . . . . . . . . . . . . p=0.05
~ ~ 0 0 ~ ~ m m m m m m m m m m m m m m m m m m ~ 0 o o o o o o 0 o o o o ~ o o o 0 ~
"0
c) Subcutaneous fat 1.0 0.8
/2 0.6 0.4 0.2 0.0
p = O . 0 5
_~ ×°0
O0 ~ m d~ m m co ¢fi ~ d~ m d~ m d~ m m m d~ m g m m~ _ _ ~ ~ oo
~ Q. I~ Q. Q,. I~. 13_ O. I~. I~. I~. O. n I~. O. I~. O. Q. I~ Q.
O O ~0
Figure 2. Squared correlation coefficients between organochlorine concentrations in blood from adult captive glaucous gulls and corresponding concentrations in extractable lipids from: a) liver, b) brain, and c) subcutaneous
fat, Correlations for both blood wet weight concentrations and for blood extractable lipid concentrations are included, Log-transformation was performed prior to calculation of correlations. The reference line indicates the
significance limit for a single correlation.
2633
t : i - i ! o _Bra,,, _
j i , i
10 -1 1 : ~ i . ::
I i!: ::::: :f:! {77!
V-
. . . . L . i t z__==o ° o =" ~.,,-'~a t a t a ° ° ° ~ ° = t a o o o o o o o o o t a o o o o o o = o o o o o o
t a Q. t a r t Q. t a Q . Q . t a D _ t a t a t a t a t a Q.
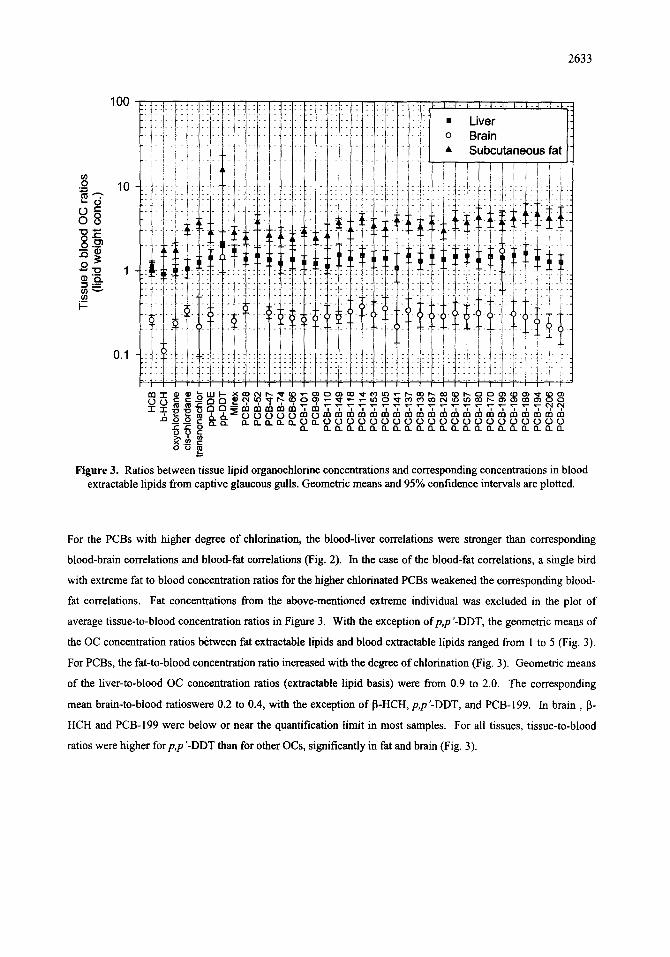
Figure 3. Ratios between tissue lipid organochlorine concentrations and corresponding concentrations in blood extractable lipids from captive glaucous gulls. Geometric means and 95% confidence intervals are plotted.
For the PCBs with higher degree of chlorination, the blood-liver correlations were stronger than corresponding
blood-brain correlations and blood-fat correlations (Fig. 2). In the case of the blood-fat correlations, a single bird
with extreme fat to blood concentration ratios for the higher chlorinated PCBs weakened the corresponding blood-
fat correlations. Fat concentrations from the above-mentioned extreme individual was excluded in the plot of
average tissue-to-blood concentration ratios in Figure 3. With the exception ofp,p '-DDT, the geometric means of
the OC concentration ratios between fat extractable lipids and blood extractable lipids ranged from 1 to 5 (Fig. 3).
For PCBs, the fat-to-blood concentration ratio increased with the degree of chlorination (Fig. 3). Geometric means
of the liver-to-blood OC concentration ratios (extractable lipid basis) were from 0.9 to 2.0. The corresponding
mean brain-to-blood ratioswere 0.2 to 0.4, with the exception of 13-HCH, p,p'-DDT, and PCB-199. In brain, 13-
HCH and PCB-199 were below or near the quantification limit in most samples. For all tissues, tissue-to-blood
ratios were higher for p,p '-DDT than for other OCs, significantly in fat and brain (Fig. 3).
2634
100
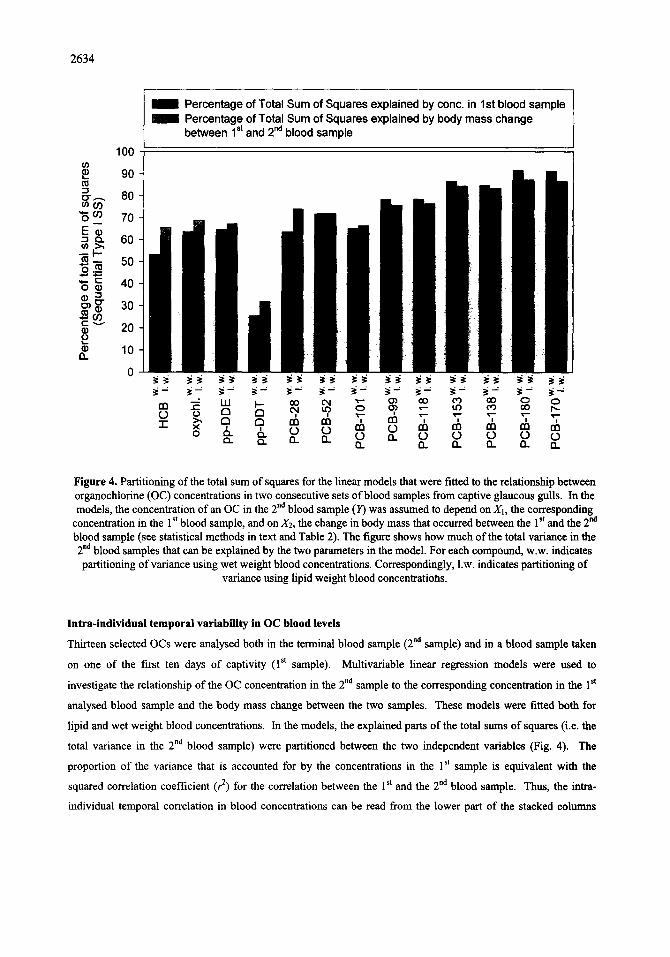
1 Percentage of Total Sum of Squares explained by conc. in 1st blood sample 1 Percentage of Total Sum of Squares explained by body mass change
between 1st and 2 nd blood sample
O0 ,= -=l O'.--.. ¢n09
E ~
I-.-
~ . . c - O
90
80
70
60
50
40
30
20
10
0
Figure 4. Partitioning of the total sum of squares for the linear models that were fitted to the relationship between organochlorine (OC) concentrations in two consecutive sets of blood samples from captive glaucous gulls. In the models, the concentration of an OC in the 2 "d blood sample (]/) was assumed to depend on X1, the corresponding
concentration in the 1 st blood sample, and on X2, the change in body mass that occurred between the 1 st and the 2 na blood sample (see statistical methods in text and Table 2). The figure shows how much of the total variance in the 2 "a blood samples that can be explained by the two parameters in the model. For each compound, w.w. indicates partitioning of variance using wet weight blood concentrations. Correspondingly, 1.w. indicates partitioning of
variance using lipid weight blood concentratiohs.
lntra-individual temporal variability in OC blood levels
Thirteen selected OCs were analysed both in the terminal blood sample (2 nd sample) and in a blood sample taken
on one of the first ten days of captivity (1 st sample). Multivariable linear regression models were used to
investigate the relationship of the OC concentration in the 2 "d sample to the corresponding concentration in the 1 st
analysed blood sample and the body mass change between the two samples. These models were fitted both for
lipid and wet weight blood concentrations. In the models, the explained parts of the total sums of squares (i.e. the
total variance in the 2 "d blood sample) were partitioned between the two independent variables (Fig. 4). The
proportion of the variance that is accounted for by the concentrations in the 1 st sample is equivalent with the
squared correlation coefficient (r 2) for the correlation between the 1 st and the 2 nd blood sample. Thus, the intra-
individual temporal correlation in blood concentrations can be read from the lower part of the stacked columns
2635
(Fig. 4). Intra-individual temporal correlations were stronger when based on wet weight values than when based
on concentrations in extractable lipids (Fig. 4). Even when using the wet weight calculation, the correlation
between the 1 st and the 2 na sample were absent for p,p '-DDT and accounted for less than 25 % of the variance for
HCB and PCB-28. For PCBs, the proportion of variance explained by the 1 st sample seemed to improve with the
degree of chlorination (Fig. 4).
Excluding p,p '-DDT, variation in the 2 nd blood concentration was significantly better explained when the body
mass change was included, when compared to models based only on the initial blood concentration (Fig. 4, Table
2). Regression coefficients for body mass change ranged from -0.0038 to -0.0026 (Table 2). Thus, according to
the model, a 100g decrease in body mass between the 1 st and 2 nd sampling would add an estimated 0.26-0.38 to
[Log (conc. in 2 nd blood sample)] for the different compounds. This is equivalent to multiplicative factors in the
range from 1.8 to 2.4 for the concentration of the different OCs.
With the exception ofp ,p '-DDT, these complete models accounted for 53 % (HCB) to 92 % (PCB-180) of the total
variance in the 2 na blood samples (Fig. 4). According to the multivariable models, the compounds differed with
respect to which parameter that explained most of the variation in the 2 nd blood concentration (Fig. 4). For PCBs-
153, -170 and -180s, the blood concentration in the 1 st sample accounted for most of the variance explained by the
model. In contrast, most of the variance in the 2 "d sample for HCB and PCB-28 was related to change in body
mass (Fig. 4).
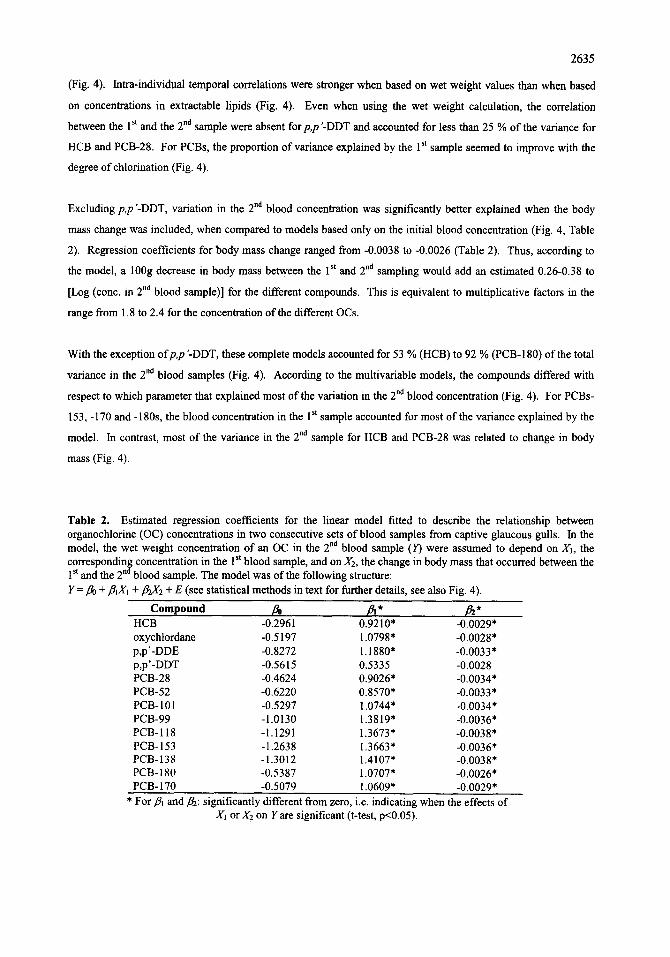
Table 2. Estimated regression coefficients for the linear model fitted to describe the relationship between organochlorine (OC) concentrations in two consecutive sets of blood samples from captive glaucous gulls. In the model, the wet weight concentration of an OC in the 2 nd blood sample (Y) were assumed to depend on XI, the
St corresponding concentration in the 1 blood sample, and on )(2, the change in body mass that occurred between the st n o 1 and the 2 blood sample. The model was of the following structure:
Y = ,80 + fllXl + ,82X2 + E (see statistical methods in text for further details, see also Fig. 4).
Compound ~ ,~* ~ * HCB -0.2961 0.9210* -0.0029* oxychlordane -0.5197 1.0798" -0.0028* p,p'-DDE -0.8272 1.1880* -0.0033* p,p'-DDT -0.5615 0.5335 -0.0028 PCB-28 -0.4624 0.9026* -0.0034* PCB-52 -0.6220 0.8570* -0.0033* PCB-101 -0.5297 1.0744" -0.0034* PCB-99 - 1.0130 1.3819 * -0.0036* PCB-118 -1.1291 1.3673' -0.0038* PCB- 153 -1.2638 1.3663" -0.0036* PCB-138 -1.3012 1.4107" -0.0038* PCB-180 -0.5387 1.0707" -0.0026* PCB- 170 -0.5079 1.0609* -0.0029*
* For ]~1 and/~: significantly different from zero, i.e. indicating when the effects of Xl or)(2 on Y are significant (t-test, p<0.05).
2636
As noted above, intra-individual temporal correlations were stronger for wet weight blood concentrations than for
lipid weight concentrations. In contrast, the association of the 2 "d blood concentrations to changes in body mass
were stronger on a lipid weight basis than on a wet weight basis (Fig. 4). Overall, wet weight and lipid weight
concentrations gave roughly the same r 2 for the total models. However, lipid weight concentrations tended to give
higher total r 2 for the compounds for which changes in body mass were more important (HCB and PCB-28). In
contrast, wet weight concentrations gave higher r 2 for the compounds were the 1 st concentration were more
important (i.e., the higher chlorinated PCBs).
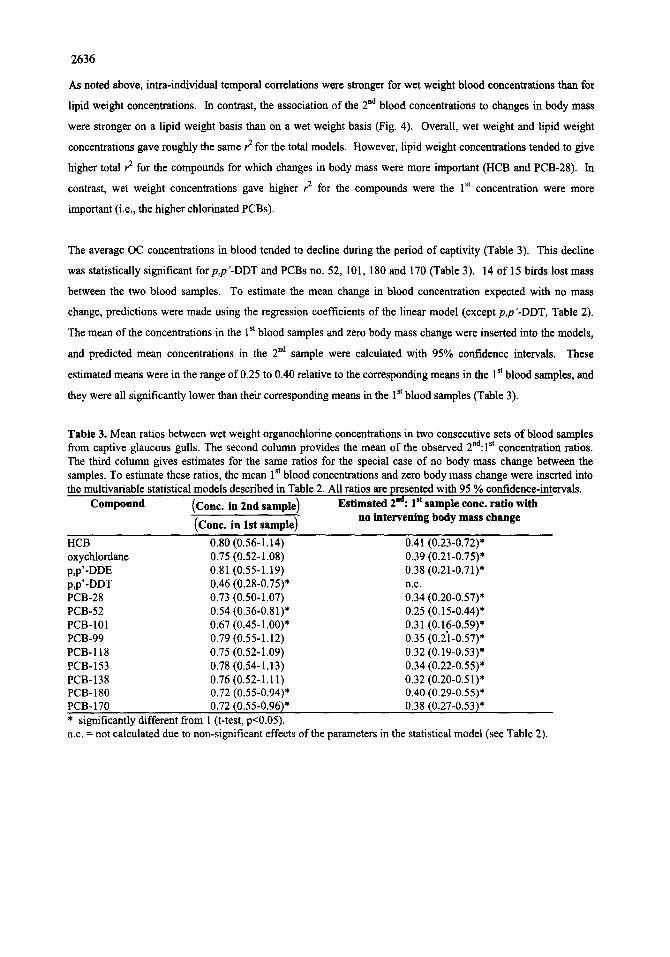
The average OC concentrations in blood tended to decline during the period of captivity (Table 3). This decline
was statistically significant for p,p'-DDT and PCBs no. 52, 101,180 and 170 (Table 3). 14 of 15 birds lost mass
between the two blood samples. To estimate the mean change in blood concentration expected with no mass
change, predictions were made using the regression coefficients of the linear model (except p,p'-DDT, Table 2).
The mean of the concentrations in the 1 st blood samples and zero body mass change were inserted into the models,
and predicted mean concentrations in the 2 nd sample were calculated with 95% confidence intervals. These
estimated means were in the range of 0.25 to 0.40 relative to the corresponding means in the 1 st blood samples, and
they were all significantly lower than their corresponding means in the 1 st blood samples (Table 3).
Table 3. Mean ratios between wet weight organochlorine concentrations in two consecutive sets of blood samples from captive glaucous gulls. The second column provides the mean of the observed 2nd:lSt concentration ratios. The third column gives estimates for the same ratios for the special case of no body mass change between the samples. To estimate these ratios, the mean 1 st blood concentrations and zero body mass change were inserted into the multivariable statistical models described in Table 2. All ratios are presented with 95 % confidence-intervals.
Compound (Cone. in 2nd sample) Estimated 2ha: I st sample cone. ratio with (Cone. in 1st sample) no intervening body mass change
HCB 0.80 (0.56-1,14) 0.41 (0.23-0.72)* oxychlordane 0.75 (0.52-1.08) 0,39 (0.21-0.75)* p,p'-DDE 0.81 (0.55-1.19) 0,38 (0.21-0.71)* p,p'-DDT 0.46 (0.28-0.75)* n.c. PCB-28 0.73 (0.50-1.07) 034 (0.20-0.57)* PCB-52 0.54 (0.36-0.81)* 0.25 (0.15-0.44)* PCB-101 0.67 (0.45-1.00)* 0.31 (0.16-0.59)* PCB-99 0.79 (0.55-1.12) 0.35 (0.21-0.57)* PCB-118 0.75 (0.52-1.09) 0.32 (0.19-0.53)* PCB-153 0.78 (0.54-1.13) 0.34 (0.22-0.55)* PCB-138 0.76 (0.52-1.11) 0.32 (0.20-0.51)* PCB-180 0.72 (0.55-0.94)* 0.40 (0.29-0.55)* PCB-170 0.72 (0.55-0.96)* 0.38 (0.27-0.53)* * significantly different from 1 (t-test, p<0.05). n.c. = not calculated due to non-significant effects of the parameters in the statistical model (see Table 2).
2637
~0 10 s o .0
r-
"i lOa o
o
• ~PCB, r2=0.59, p=0.0008 0 I;DDT, rZ=0.53, p=0.002
• • HCB, rZ=0.74, p<0.0001 o v I;HCH, r2=0.70, p<0.0001
4 •
V --
v v ~ v
20 40 60 80 1 O0
% extracted lipid from subcutaneous fat
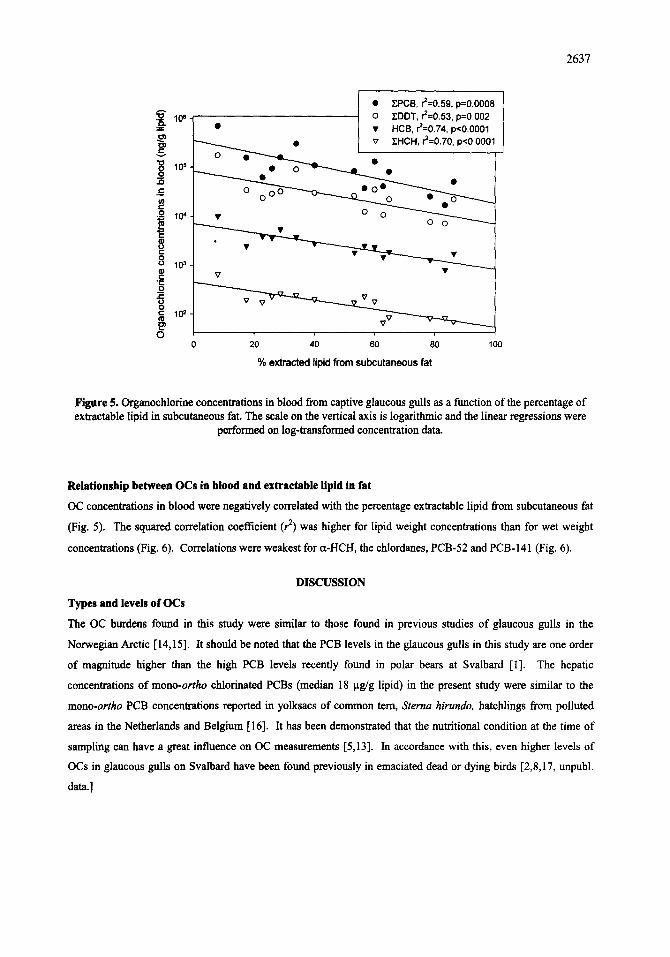
Figure 5. Organochlorine concentrations in blood from captive glaucous gulls as a function of the percentage of extractable lipid in subcutaneous fat. The scale on the vertical axis is logarithmic and the linear regressions were
performed on log-transformed concentration data.
Relationship between OCs in blood and extractable lipid in fat
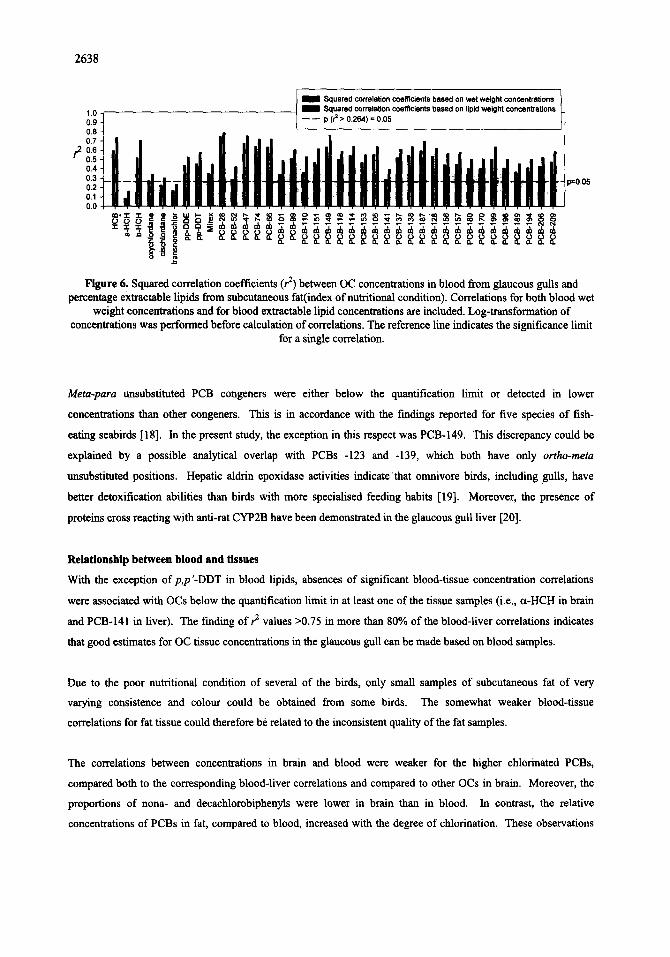
OC concentrations in blood were negatively correlated with the percentage extractable lipid from subcutaneous fat
(Fig. 5). The squared correlation coefficient (r 2) was higher for lipid weight concentrations than for wet weight
concentrations (Fig. 6). Correlations were weakest for a-HCH, the chlordanes, PCB-52 and PCB-141 (Fig. 6).
DISCUSSION
Types and levels of OCs
The OC burdens found in this study were similar to those found in previous studies of glaucous gulls in the
Norwegian Arctic [14,15]. It should he noted that the PCB levels in the glaucous gulls in this study are one order
of magnitude higher than the high PCB levels recently found in polar hears at Svalbard [I]. The hepatic
concentrations of mono-ortho chlorinated PCBs (median 18 ~g/g lipid) in the present study were similar to the
mono-ortho PCB concentrations reported in yolksacs of common tem, Sterna hirundo, hatchlings from polluted
areas in the Netherlands and Belgium [16]. It has been demonstrated that the nutritional condition at the time of
sampling can have a great influence on OC measurements [5,13]. In accordance with this, even higher levels of
OCs in glaucous gulls on Svalbard have been found previously in emaciated dead or dying birds [2,8,17, unpubl.
data.]
2638
~ 1 Squared correlation coefficients based on wet weight concentrations 1.0 " ~ Squared correlation coefficients based on lipid weight concentrations
0.9 0.8 0.7
.20.6 0.5 0.4 (1.3 0.2 p~0.05
0.1 0.0
Figure 6. Squared correlation coefficients (r 2) between OC concentrations in blood from glaucous gulls and percentage exmLctable lipids from subcutaneous fat(index of nutritional condition). Correlations for both blood wet
weight concentrations and for blood extractable lipid concentrations are included. Log-transformation of concentrations was performed before calculation of correlations. The reference line indicates the significance limit
for a single correlation.
Meta-para unsubstituted PCB congeners were either below the quantification limit or detected in lower
concentrations than other congeners. This is in accordance with the findings reported for five species of fish-
eating seabirds [18]. In the present study, the exception in this respect was PCB-149. This discrepancy could be
explained by a possible analytical overlap with PCBs -123 and -139, which both have only ortho-meta
unsubstituted positions. Hepatic aldrin epoxidase activities indicatethat omnivore birds, including .gulls, have
better detoxification abilities than birds with more speeialised feeding habits [19]. Moreover, the presence of
proteins cross reacting with anti-rat CYP2B have been demonstrated in the glaucous gull liver [20].
Relationship between blood and tissues
With the exception of p,p '-DDT in blood lipids, absences of significant blood-tissue concentration correlations
were associated with OCs below the quantification limit in at least one of the tissue samples (i.e., ct-HCH in brain
and PCB-141 in liver). The finding of r 2 values >0.75 in more than 80% of the blood-liver correlations indicates
that good estimates for OC tissue concentrations in the glaucous gull can be made based on blood samples.
Due to the poor nutritional condition of several of the birds, only small samples of subcutaneous fat of very
varying consistence and colour could be obtained from some birds. The somewhat weaker blood-tissue
correlations for fat tissue could therefore be related to the inconsistent quality of the fat samples.
The correlations between concentrations in brain and blood were weaker for the higher chlorinated PCBs,
compared both to the corresponding blood-liver correlations and compared to other OCs in brain. Moreover, the
proportions of nona- and decachlorobiphenyls were lower in brain than in blood. In contrast, the relative
concentrations of PCBs in fat, compared to blood, increased with the degree of chlorination. These observations

2639
may relate to differences in lipid composition between tissues. In glaucous gulls, the brain contains more
cholesterol and phospholipids, and less triglycerids, than liver and subcutaneous fat [21]. Thus, the brain contain
more polar lipids than the other tissues. The tissue:blood partition coefficients of PCBs depends on each
congeners molecular structure and the amounts and types of lipids in the tissue [7]. The lipophilicity of PCBs
generally increases with increasing number of chlorines [22]. It is therefore not surprising that the highest
chlorinated PCBs are most skewed towards the least polar compartments. In accordance with this, higher
proportions of the higher chlorinated PCBs were found in blubber when PCB patterns in blubber and serum from
the grey seal, Halichoerus grypus, were compared [23]. In contrast, similar PCB patterns in subcutaneous fat and
plasma were observed in the polar bear, possibly due to a less polar plasma compartment in polar bear compared to
other species [ 1 ].
lntra-individual temporal variability
As illustrated in Fig. 4, the correlation between blood samples taken 3-5 weeks apart were stronger for wet weight
OC concentrations than for the corresponding lipid weight concentrations. A possible reason is that the low
amounts of extractable lipids in blood could result in loss of precision in the gravimetrical determination of
extractable lipids. The available blood samples in the present study were between 5 and 10 ml. For their method
for determination of PCBs in human blood, Mes et al. concluded that 50 ml was the minimum acceptable sample
volume with regard to the blood lipid determination [24]. An intedaboratory study on organochlorine analysis in
fish found that analytical methods need to be improved if OC concentrations are to be standardised to percent lipid
for valid comparison between species and localities [25]. When data are standardised to lipid weight, different
extraction methods may hamper comparison between studies because different lipids are extracted with varying
efficiency, Nevertheless, lipid weight values can have superior informative value when the lipid-content of the
tissue is variable [13,26]. As the lipid content of the tissue is decisive for the tissue:blood partition coefficients
[27], expression on a lipid weight basis gives values that are more directly comparable between blood and tissues,
and between different tissues.
The correlation between the 1 st and the 2 no blood samples in our study should be expected to be highest for the
most persistent compounds. Since all birds were given similar food with low OC levels food during captivity, the
initial variance in OC-concentrations between birds should have greatest retention for the compounds with lowest
clearance rates. Thus, no intra-individual temporal correlation was found for p,p '-DDT, which is metabolised in
birds [28] (Fig. 4). Whole-body clearance rates have been estimated in juvenile herring gulls Larus argentatus for
ten OC compounds [29]. HCB had a higher clearance rate than p,p'-DDE and oxychlordane [29]. In the present
study, the intra-individual temporal correlation for HCB had a r 2 value <0.20, which is about 50% of the
corresponding value for p,p'-DDE and oxychlordane. This suggests that HCB may have a clearance rate higher
than oxychlordane and p,p '-DDE in the glaucous gull. In juvenile herring gulls, clearance ofp,p '-DDE was <50%
of the clearance of oxychlordane [29]. We did not find a similar relationship in the present study. However, the
intra-individual temporal correlations are only indirect measures of clearance rates. The background levels in
264O
study diet may have confounded the results. In particular, HCB is one of the major OCs in polar cod from the
Barents Sea [11 ]. In the case of the higher chlorinated PCBs, good intraindividual temporal correlations suggests
consistent differences in body burdens between individuals. Thus, concentrations of the higher chlorinated PCBs
in a single blood sample integrate exposure over a longer period of time, compared to p,p'-DDT and HCB.
Based on the loss of body mass during the experiment, OC concentrations could have been expected to increase
during the experiment [13]. The results from the multivariable model (Table 2) also indicated an inverse
relationship between mass change and OC concentrations in blood. However, all congeners that were measured
twice decreased from the 1 st to the 2 nd sample. The decrease was significant for 5 out of 13 compounds.
According to the empirical association between mass loss and blood OC levels (Table 2), the mean decreases in
blood OC concentrations would have been larger in absence of mass loss (Table 3). A possible explanation is that
the polar cod consumed during captivity had lower concentrations of OCs than the average diet of free-living
glaucous gulls [11]. The largest concentration decreases were observed for p,p'-DDT, PCB-52 and PCB-101,
which could indicate comparably lower persistence. In contrast to the other PCB congeners that were measured
twice, both PCB-52 and PCB-101 are meta-para unsubstituted. They could therefore be expected to be more
easily metabolised [ 18].
For half of the OCs measured twice in the present study (i.e., HCB, p,p '-DDE, p,p '-DDT, PCBs -28, -99 and -118),
the concentrations in the 2 "0 blood sample correlated stronger to lipid status (see Fig. 6) than to the corresponding
blood levels 3-5 weeks earlier (see Fig. 4, lower bars). Temporal variability could be expected to be even larger in
free-living glaucous gulls, which experience fluctuations in nutritional condition and have a very diverse diet [30].
Repeated sampling of free-living gulls over an extended period could provide information on the consistency of
the interindividual variability in blood concentrations. To relate OC burdens to possible effects, it is of interest to
know whether certain individuals have chronically higher OC burdens over time, or if a point sample is heavily
influenced by intra-individual temporal variability.
Relationship between levels of OCs and nutritional condition
The relationship between tissue concentrations of OCs and nutritional condition has been established previously in
birds [13,31]. For most OCs included in the present study, more than 40% of the,variation in blood concentration
was associated with variation in nutritional condition (measured as percentage extractable lipids from
subcutaneous fat). The weaker correlations of the meta-para unsubstituted PCB-52 and PCB-141 with nutritional
condition may be related to the higher metabolic clearance that is expected for these PCBs [18]. The meta-para
unsubstituted octachlorobiphenyl PCB-199 is, however, not less correlated with nutritional condition than most
other PCBs (Fig. 6).
In the present study, the ranges of measured concentrations of each compound span more than one order of
magnitude, with about 50% of the variation related to nutritional condition. Moreover, in the model for the
2641
relationship between the 1 st and the 2 nd blood sample, the inclusion of body mass change gave an improvement in
the explained proportion of the total variance (see Fig. 4). Regression coefficients in the same model indicated that
a 100 g decrease in body mass was associated with an approximate doubling of blood OC concentrations. Thus, in
seabirds, mere concentration measurements of organochlorines give only a rough indication of the actual OC
burden, as long as the nutritional condition of the sampled individuals are unaccounted for. The more laborious
and not completely non-destructive approach of homogenising whole bird carcasses to measure whole-body
burdens of OCs [32] could possibly give results that are easier to interpret.
Conclusions
Blood concentrations seem to be roughly equivalent to tissue concentrations in assessing body burdens of most of
the investigated OCs. Similar to tissue concentrations, the utility of blood concentrations are limited by their
interrelationship with fluctuations in the size of the body lipid pool, i. e., nutritional condition. Blood and tissue
concentrations are point samples in time of a dynamic process, and great care should be taken to avoid
unwarranted conclusions about differences in OC burdens between individuals or populations. The possible
confounding factor of recent feeding was not investigated and may add noise when sampling from free-living
birds. In this study, we found that in birds on identical diets and with standardised blood sampling, blood levels of
several OCs could only roughly be predicted from corresponding levels in the same birds 3-5 weeks earlier. In
terms of the parameters associated with blood levels, the investigated OCs could be described as spanning a range
f/ore p,p'-DDT, HCB and PCB-28 to the higher chlorinated PCBs. For the former compounds, lipid status was
found most important for blood concentrations, while for the higher chlorinated PCBs, the results indicated that the
chronic body burden was more decisive.
ACKNOWLEDGEMENTS
We would like to thank Bente Brekke for her care 6f captive gulls in Ny-Alesund. We are also grateful for the
technical assistance from Anuschka Polder and Elisabeth Lie. Andrew E. Derocher provided valuable comments
on the manuscript. This study was funded by the Norwegian Research Council (grant I09120/720), the Norwegian
Polar Institute, Tromso, and the National Veterinary Institute, Oslo. This paper is contribution no. 328 from the
Norwegian Polar Institute.
REFERENCES
1. A. Bernhoft, t0. Wiig and J. U. Skaare. Organochlorines in polar bears (Ursus maritimus) at Svalbard.
Environ. Pollut. 95, 159-75 (1997).
2. G.W. Gabrielsen, J. U. Skaare, A. Polder and V. Bakken. Chlorinated hydrocarbons in glaucous gulls (Larus
hyperboreus) in the southern part of Svalbard. Sci. Total Environ. 160/161,337-46 (1995).
3. M. Friend, M. A. Haegle, D. L. Meeker, R. Hudson and U. H. Baer. Correlations between residues of
dichlorodiphenylethane, polychlorinated biphenyl, and dieldrin in the serum and tissues of mallard ducks
(Anas platyrhynchos). In: Animals as monitors of environmental pollutants pp. 319-26, National Academy
2642
of Sciences, Washington D.C., (I 979).
4. J. Mes. Organochlorine residues in human blood and biopsy fat and their ~elationship. Bull. Environ.
Contain. Toxicol. 48, 815-20 (1992).
5. D.E. Capen and T. J. Leiker. DDE residues in blood and other tissues of white-faced ibis. Environ.
Pollut. 19, 163-71 (1979).
6. L. Marsili, M. C. Fossi, S. Casini and S. Focardi. PCB levels in bird blood and relationship to MFO
responses. Chemosphere 33, 699-710 (1996).
7. F.M. Parham, M. C. Kohn, H. B. Matthcws, G DeRosa and C. J. Portier. Using structural information to
create physiologically based pharmacokinetic models for all polychlorinated biphenyls I. Tissue:blood
partition coefficients. Toxicol. Appl. Pharmacol. 144, 340-47 (1997).
8. F. Daelemans. Polychlorinated biphenyls and some selected organochlorine pesticides in seabirds and marine
mammals from the Svalbard archipelago. Dr. thesis, University of Antwerp (1994).
9. K.E. Erikstad, Winter diets of four seabird species in the Barents sea after a crash in the capelin stock. Polar
Biol. I0) 619-27 (1990).
I0. C. Lydersen, I. Gjertz and J. M. Weslawski. Stomach contents of autumn-feeding marine vertebrates from
Hornsund, Svalbard. Polar Record 25, I07-17 (1989).
i I. K. Borg~. Bioaccumulation of organochlorines (OCs) in an Arctic marine food chain. Candidata Scientiarum
thesis, University of Tromso (1997).
12. E.M. Brevik. Gas chromatographic method for the determination of organochlorine pesticides in human
milk. Bull. Environ. Contain. Toxicol, 19, 281-86 (1978).
13. E.O. Henriksen, G. W. Gabrielsen and J. U. Skaare. Levels and congener pattern ofpolychlorinated
biphenyls in kittiwakes (Rissa tridactyla), in relation to mobilization of body-lipids associated with
reproduction. Environ. Pollut. 92, 27-37 (1996).
14. G. Norheim and B. Kjos-Hanssen. Persistent chlorinated hydrocarbons and mercury in birds caught off the
west coast of Spitsbergen. Environ. Pollut. Set. A 33, 143-52 (1984).
15. F. Mehlum and F. F. Daelemans. PCBs in Arctic seabirds from the Svalbard region. Sci. Total Environ.
160/161,441-46 (1995).
16. A.J. Murk, A. T. C. Bosveld, M. van den Berg and A. Brouwer. Effects of polyhalogenated aromatic
hydrocarbons (PHAHs) on biochemical parameters in chicks of the common tern (Sterna hirundo). Aquat.
Toxicol. 30, 91-I 15 (1994).
17. J.A. Bogan and W. R. P. Bourne. Organochlorine levels in Atlantic seabirds. Nature 240, 358 (1972).
18. J.T. Borlakoglu, J. P. G. Wilkins, C. H. Walker and R. R. Dils. Polychlorinated Biphenyls (PCBs) in Fish-
eating Sea Birds -III. Molecular Features and Metabolic Interpretations of PCB Isomers and Congeners in
Adipose Tissues. Comp. Biochem. PhysioL Ser. C97C, 173-77 (1990).
19. M.C. Fossi, A. Massi, L. Lari, L. Marsili, S. Focardi, C. Leonzio and A. Renzoni. Interspecies differences in
mixed function oxidase activity in birds: Relationship between feeding habits, detoxication activities and
2643
organochlorine accumulation. Eitviron. Pollut. 90, 15-24 (1995).
20. E.O. Heoriksen, G. W. Gabrielsen, J. U. Skaare, N. Skjegstad and B. M. Jenssen. Relationships between
PCB levels, hepatic EROD activity and plasma retinol in glaucous gulls, Larus hyperboreus. Mar. Environ.
Res. (in press).
21. I. Halvorsen. Lipidsammensetning i polarmLke (Larus hyperboreus). Candidatus Scientiarum thesis,
University of Tromso (1997).
22. M.D. Erickson. Physical, chemical, commercial, environmental, and biological properties of PCBs. In:
Analytical chemistry of PCBs pp. 5-40, ed. M. D. Erickson, Butterworth Publ., Boston, USA (1986).
23. R.F. Addison and P. F. Brodie. Transfer of organoehlorine residues from blubber through the circulatory
system to milk in the lactating grey seal Halichoerus grypus. Can. J. Fish. Aquat. Sci. 44, 782-86 (1987).
24. J. Mes; L. Marchand, D. Turton and P.-Y. Lau. The determination ofpolychlorinated biphenyl congeners and
other chlorinated hydrocarbon residues in human blood, serum and plasma. A comparative study. Intern. J.
Environ. Anal. Chem. 48, 175-86 (1992).
25. A.G. Miskiewicz and P. J. Gibbs. Variability in organoehlorine analysis in fish: An interlaboratory study and
its implications for environmental monitoring and regulatory standards. Arch. Environ. Contam. ToxicoL 23,
45-53 (1992).
26. A. Bignert, A. G6thberg, S. Jensen, K. Litz6n, T. Odsj6, M. Olsson and L. Reuterg~dh. The need for
adequate biological sampling in ecotoxilogical investigations: a retrospective study of twenty years pollution
monitoring. Sci. TotalEnviron. 128, 121-39 (1993).
27. P. Poulin and K. Krishnan. A biologically-based algorithm for predicting human tissue: blood partition
coefficients of organic chemicals. Hum. Exp. Toxicol. 14, 273-80 (1995).
28. L.J. Blus. DDT, DDD, and DDE in Birds. In: Environmental contaminants in wildlife. Interpreting tissue
concentrations pp. 49-71, eds. W. N. Beyer, G. H. Heinz and A. W. Redmon-Norwood, CRC Press, Boca
Raton, USA (1996).
29. T.P. Clark, R. J. Norstrom, G. A. Fox and H. T. Won. Dynamics of organoehlorine compounds in herring
gulls (Larus argentatus): II. A two-compartment model and data for ten compounds. Environ. ToxicoL
Chem. 6, 547-59 (1987).
30. S.J. Barry and T.W. Barry. Food habits of glaucous gulls in the Beaufort Sea. Arctic 43, 43-49 (1990).
31. A. Sfidergren and S. Ulfstrand. DDT and PCB relocate when caged robins use/'at reserves. Ambio 1, 36-40
(1972).
32. D.W. Anderson, D.G. Raveling, R. W. Risebrough and A. M. Springer. Dynamics of low-level
organochlorines in adult cackling geese over the annual cycle. J. Wildl. Manage. 48, 1112-27 (1984).
Related Documents


