1 HTR 2006, October 1-4, 2006, Johannesburg, South Africa Validation of the CATHARE code against experimental data from Brayton cycle plants Validation of the CATHARE code Validation of the CATHARE code against experimental data from against experimental data from Brayton Brayton cycle cycle plants plants Fabrice Bentivoglio, Nicolas Tauveron CEA, DEN/DER

Welcome message from author
This document is posted to help you gain knowledge. Please leave a comment to let me know what you think about it! Share it to your friends and learn new things together.
Transcript
1HTR 2006, October 1-4, 2006, Johannesburg, South AfricaValidation of the CATHARE code against experimental data from Brayton cycle plants
Validation of the CATHARE code Validation of the CATHARE code against experimental data from against experimental data from BraytonBrayton cycle cycle
plantsplants
Fabrice Bentivoglio, Nicolas TauveronCEA, DEN/DER
2HTR 2006, October 1-4, 2006, Johannesburg, South AfricaValidation of the CATHARE code against experimental data from Brayton cycle plants
ContextContext
Gas Cooled Reator Thermal Hydraulic simulations, with the system code CATHARE:
•Describe the thermal hydraulics of the whole plant, primary and secondary circuits.
•Analyze the behavior of GCR in both normal operation and various accident transients
•Answer to specific demand of designers
•Design and optimisation of I&C systems
•Incidents and accidents analyses for plant safety evaluation
Need of validation against existing experimental data for a reliable and efficient tool
Comparison CATHARE/ Experiment on two system loopsOberhausen I and II (Brayton cycles, Germany),
3HTR 2006, October 1-4, 2006, Johannesburg, South AfricaValidation of the CATHARE code against experimental data from Brayton cycle plants
CATHARECATHARE appliedapplied to to GasGas CooledCooled ReactorReactor
• CATHARE is the reference safety code for French nuclear program (EdF, IRSN, FRA-ANP, CEA) firstly developed for Pressurized Water Reactors
• Adapted for all the different concepts of Gas-Cooled Reactors (GCR) with Specific features integrated as independent options in the standard version of CATHARE
– OD turbomachinery module
– Specific Core thermal modeling with a simplified 2D conduction calculation (for VHTR)
– Neutron kinetics feedback model specific to the GCR
– Physical correlations (gas properties, specific components correlations (HX)…)
A unique version of CATHARE to take benefit of the code “structure” (stringent procedures for documentation and maintenance)
4HTR 2006, October 1-4, 2006, Johannesburg, South AfricaValidation of the CATHARE code against experimental data from Brayton cycle plants
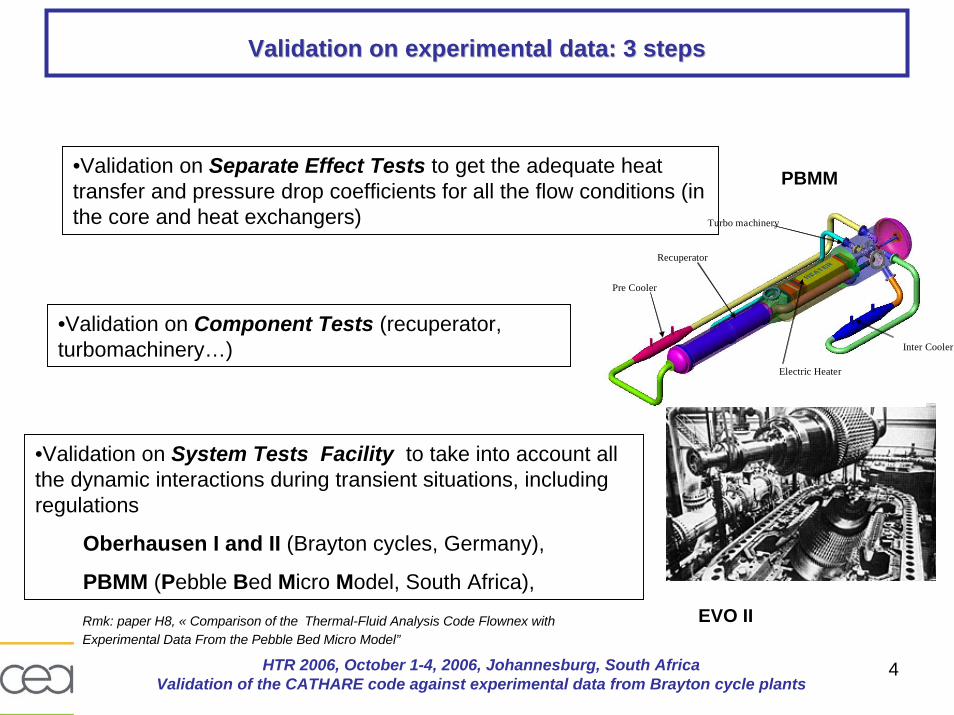
Validation on Validation on experimentalexperimental data: 3 data: 3 stepssteps
•Validation on Component Tests (recuperator, turbomachinery…)
•Validation on System Tests Facility to take into account allthe dynamic interactions during transient situations, includingregulations
Oberhausen I and II (Brayton cycles, Germany),
PBMM (Pebble Bed Micro Model, South Africa),EVO II
Recuperator
Inter Cooler
Turbo machinery
Electric Heater
Pre Cooler
•Validation on Separate Effect Tests to get the adequate heattransfer and pressure drop coefficients for all the flow conditions (in the core and heat exchangers)
Rmk: paper H8, « Comparison of the Thermal-Fluid Analysis Code Flownex with Experimental Data From the Pebble Bed Micro Model”
PBMM
5HTR 2006, October 1-4, 2006, Johannesburg, South AfricaValidation of the CATHARE code against experimental data from Brayton cycle plants
Introduction on Introduction on OberhausenOberhausen II facilityII facility
“Oberhausen II, operated by the German utility EnergieVersorgung Oberhausen(EVO), is a 50 MW(e) direct-cycle Helium turbine plant . The facility was part of a large German R&D program initiated in 1968 to demonstrate the feasibility of a Brayton-cycle power conversion system with Helium turbomachines. The power
source is a gas burner rather than a nuclear reactor core, but the power conversion system resembles those of the GCR concepts. Oberhausen II was operated for
more than 25 000 hours between 1974 and 1988.”
Measurement of temperatures, pressures and mass flows all along the circuit.
About 20 plans (burner, coolers, recuperator, turbomachinery…) and 10 internal reports, given by E.V.O in the frame of the European project HTR-E
Unique opportunity to validate CATHARE code on a large-scale helium Brayton cycle.
Proposed as benchmark test cases in the frame of the European project RAPHAEL
6HTR 2006, October 1-4, 2006, Johannesburg, South AfricaValidation of the CATHARE code against experimental data from Brayton cycle plants
Available data Available data OberhausenOberhausen II II
Data corresponding to four nominal states :
The design specification established in 1972 (Bammert & Deuster, 1974): 50MW(e) and 33% of efficiency were expected
The normal operating conditions of the real installation between 1974 and 1988 (Bammert et al., 1983), with a maximum power obtained of 30MW(e) (22% of efficiency).
Two partial load conditions at 20MW(e) and 13 MW(e)
Data corresponding to transients :
Load following, Loss of load (under progress)
7HTR 2006, October 1-4, 2006, Johannesburg, South AfricaValidation of the CATHARE code against experimental data from Brayton cycle plants
OberhausenOberhausen II : Cycle presentationII : Cycle presentation
Gear Box
Burner
HP Turbine
LP Turbine
LPC
Recuperator
Precooler
Intercooler
HPC
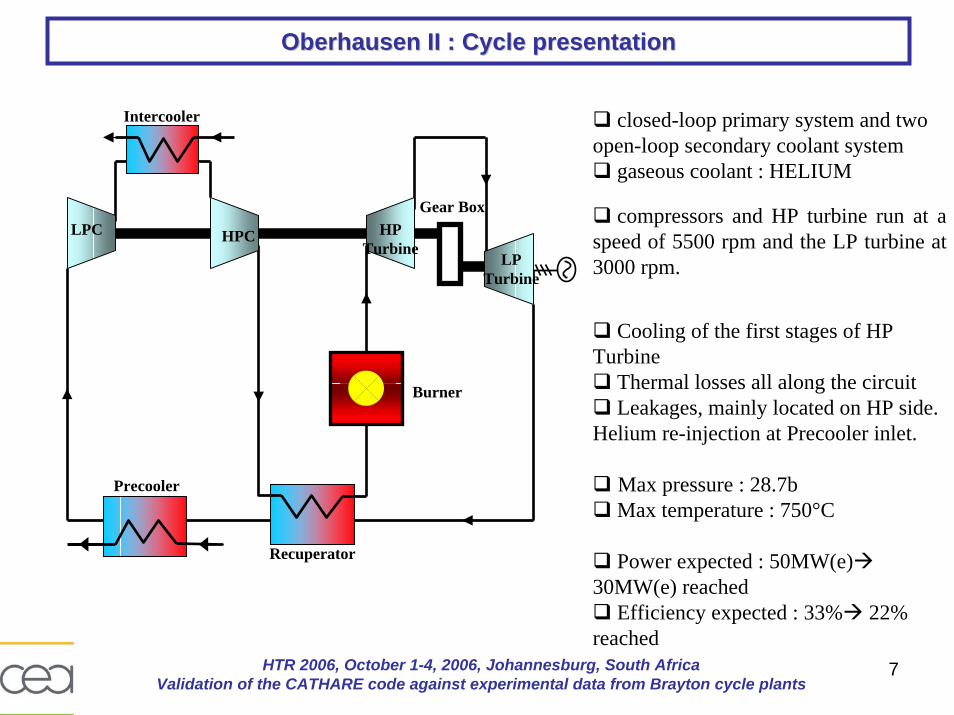
closed-loop primary system and two open-loop secondary coolant system
gaseous coolant : HELIUM
compressors and HP turbine run at a speed of 5500 rpm and the LP turbine at 3000 rpm.
Cooling of the first stages of HP Turbine
Thermal losses all along the circuit Leakages, mainly located on HP side.
Helium re-injection at Precooler inlet.
Max pressure : 28.7bMax temperature : 750°C
Power expected : 50MW(e)30MW(e) reached
Efficiency expected : 33% 22% reached
8HTR 2006, October 1-4, 2006, Johannesburg, South AfricaValidation of the CATHARE code against experimental data from Brayton cycle plants
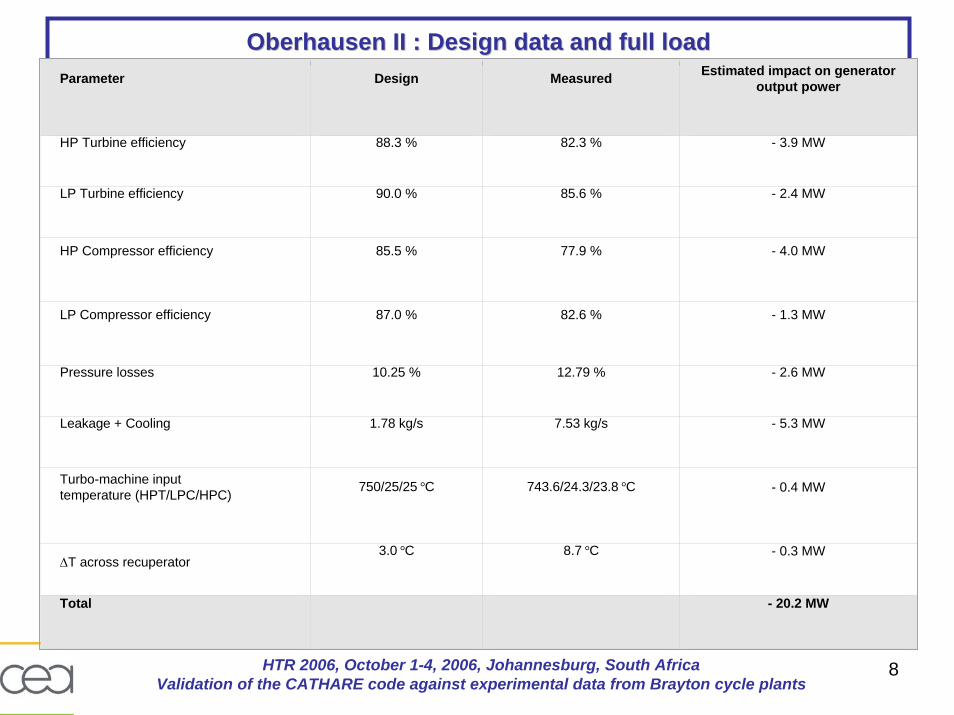
OberhausenOberhausen II : Design data and full loadII : Design data and full loadParameter Design Measured Estimated impact on generator
output power
HP Turbine efficiency 88.3 % 82.3 % - 3.9 MW
LP Turbine efficiency 90.0 % 85.6 % - 2.4 MW
HP Compressor efficiency 85.5 % 77.9 % - 4.0 MW
LP Compressor efficiency 87.0 % 82.6 % - 1.3 MW
Pressure losses 10.25 % 12.79 % - 2.6 MW
Leakage + Cooling 1.78 kg/s 7.53 kg/s - 5.3 MW
Turbo-machine input temperature (HPT/LPC/HPC) 750/25/25 °C 743.6/24.3/23.8 °C - 0.4 MW
∆T across recuperator3.0 °C 8.7 °C - 0.3 MW
Total - 20.2 MW
9HTR 2006, October 1-4, 2006, Johannesburg, South AfricaValidation of the CATHARE code against experimental data from Brayton cycle plants
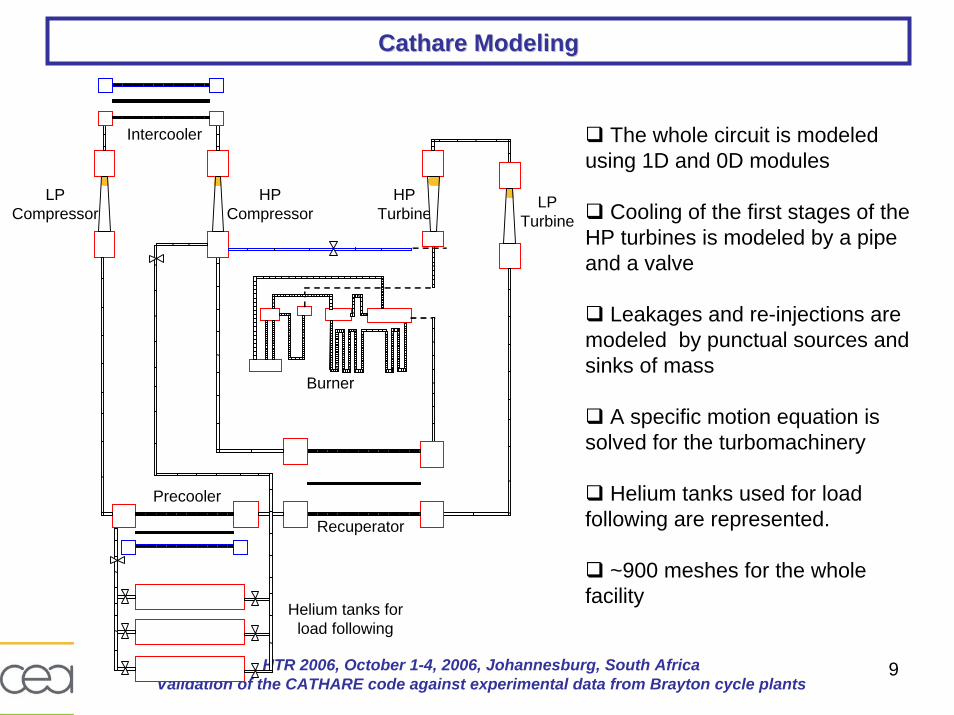
CathareCathare ModelingModeling
HP Turbine
LP Turbine
HP Compressor
LP Compressor
Intercooler
Burner
Recuperator
Precooler
Helium tanks for load following
The whole circuit is modeled using 1D and 0D modules
Cooling of the first stages of the HP turbines is modeled by a pipe and a valve
Leakages and re-injections are modeled by punctual sources and sinks of mass
A specific motion equation is solved for the turbomachinery
Helium tanks used for load following are represented.
~900 meshes for the whole facility
10HTR 2006, October 1-4, 2006, Johannesburg, South AfricaValidation of the CATHARE code against experimental data from Brayton cycle plants
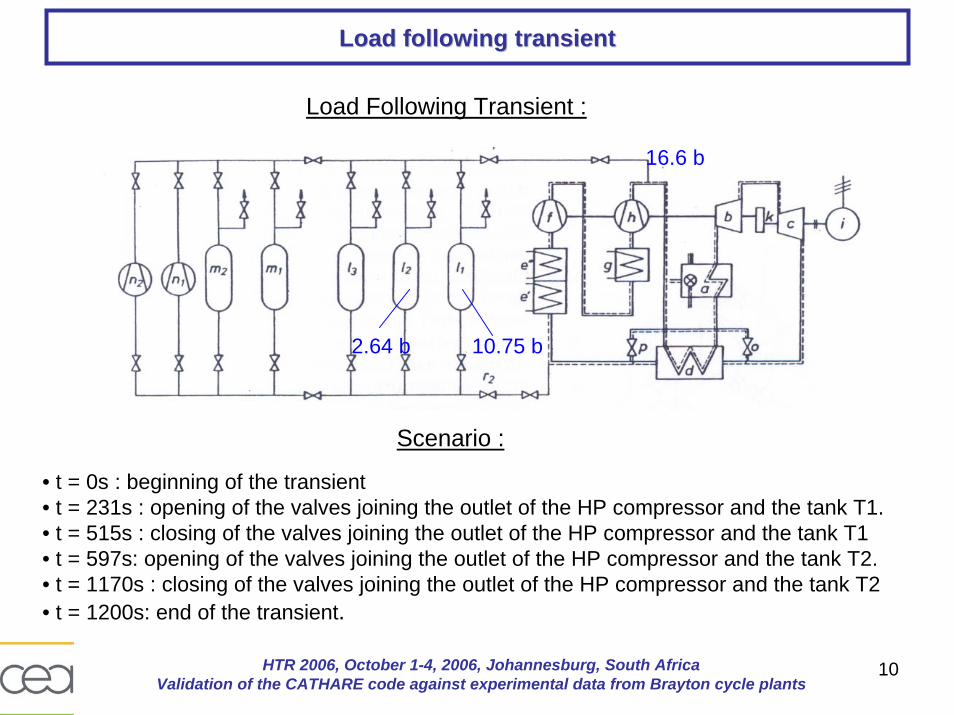
Load following transientLoad following transient
Load Following Transient :
10.75 b2.64 b
16.6 b
Scenario :
• t = 0s : beginning of the transient• t = 231s : opening of the valves joining the outlet of the HP compressor and the tank T1. • t = 515s : closing of the valves joining the outlet of the HP compressor and the tank T1• t = 597s: opening of the valves joining the outlet of the HP compressor and the tank T2.• t = 1170s : closing of the valves joining the outlet of the HP compressor and the tank T2• t = 1200s: end of the transient.
11HTR 2006, October 1-4, 2006, Johannesburg, South AfricaValidation of the CATHARE code against experimental data from Brayton cycle plants
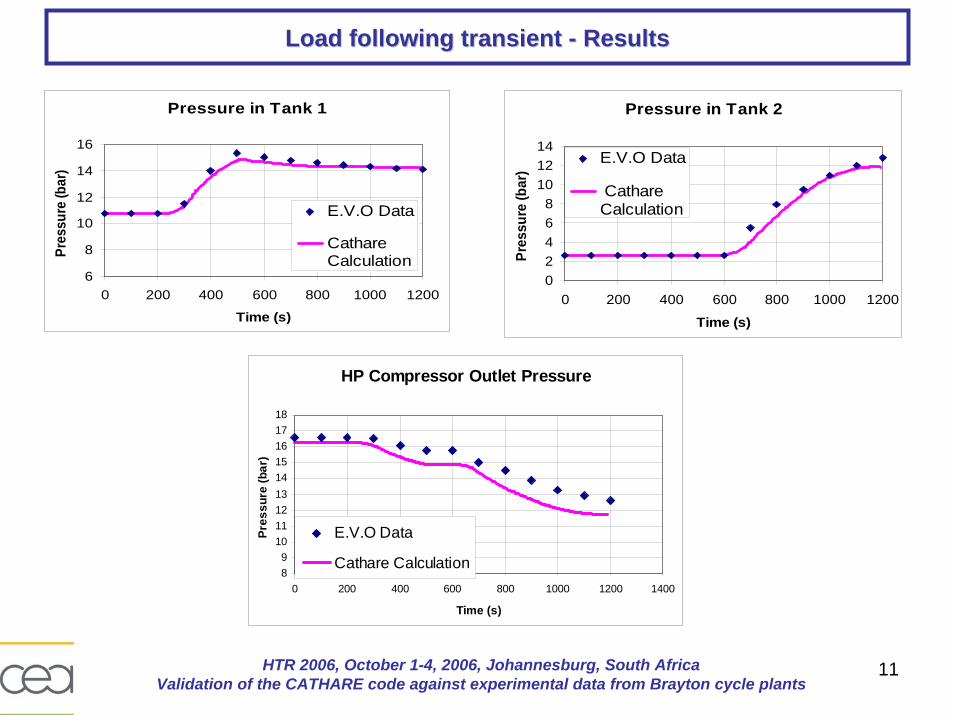
Load following transient Load following transient -- ResultsResults
Pressure in Tank 1
6
8
10
12
14
16
0 200 400 600 800 1000 1200
Time (s)
Pres
sure
(bar
)
E.V.O Data
CathareCalculation
Pressure in Tank 2
02468
101214
0 200 400 600 800 1000 1200
Time (s)
Pres
sure
(bar
)
E.V.O Data
CathareCalculation
HP Compressor Outlet Pressure
89
101112131415161718
0 200 400 600 800 1000 1200 1400
Time (s)
Pres
sure
(bar
)
E.V.O Data
Cathare Calculation
12HTR 2006, October 1-4, 2006, Johannesburg, South AfricaValidation of the CATHARE code against experimental data from Brayton cycle plants
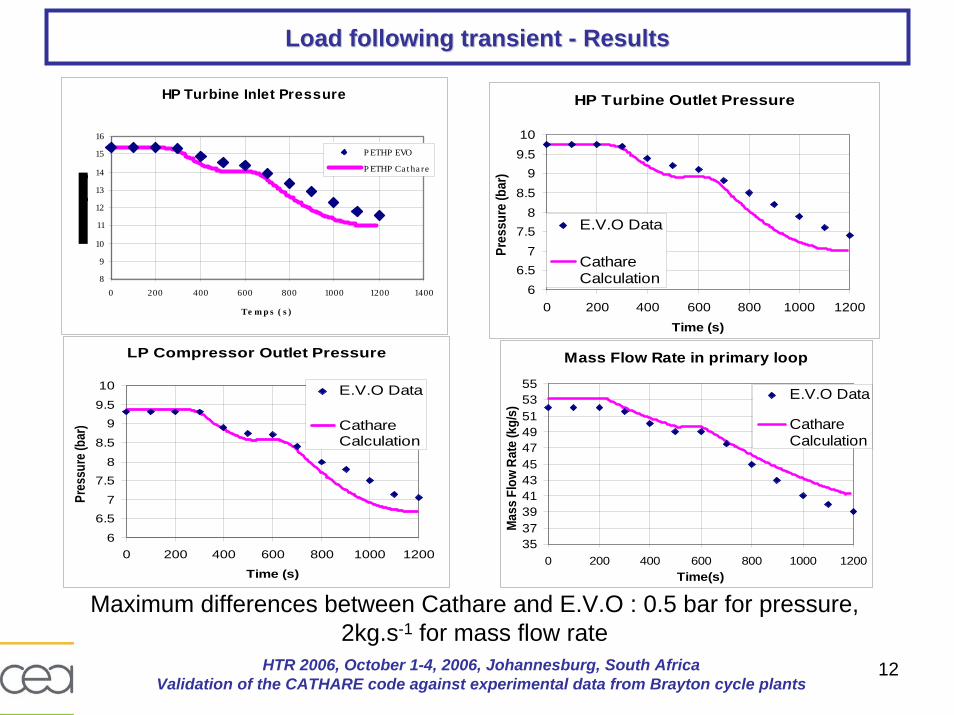
Load following transient Load following transient -- ResultsResults
LP Compressor Outlet Pressure
6
6.57
7.58
8.5
99.5
10
0 200 400 600 800 1000 1200
Time (s)
Pres
sure
(bar
)
E.V.O Data
CathareCalculation
HP Turbine Outlet Pressure
66.5
77.5
88.5
99.510
0 200 400 600 800 1000 1200Time (s)
Pres
sure
(bar
)
E.V.O Data
CathareCalculation
HP Turbine Inlet Pressure
8
9
10
11
12
13
14
15
16
0 200 400 600 800 1000 1200 1400
Te m p s ( s )
P ETHP EVO
P ETHP Ca t ha re
Mass Flow Rate in primary loop
3537394143454749515355
0 200 400 600 800 1000 1200Time(s)
Mas
s Fl
ow R
ate
(kg/
s)
E.V.O Data
CathareCalculation
Maximum differences between Cathare and E.V.O : 0.5 bar for pressure, 2kg.s-1 for mass flow rate
13HTR 2006, October 1-4, 2006, Johannesburg, South AfricaValidation of the CATHARE code against experimental data from Brayton cycle plants
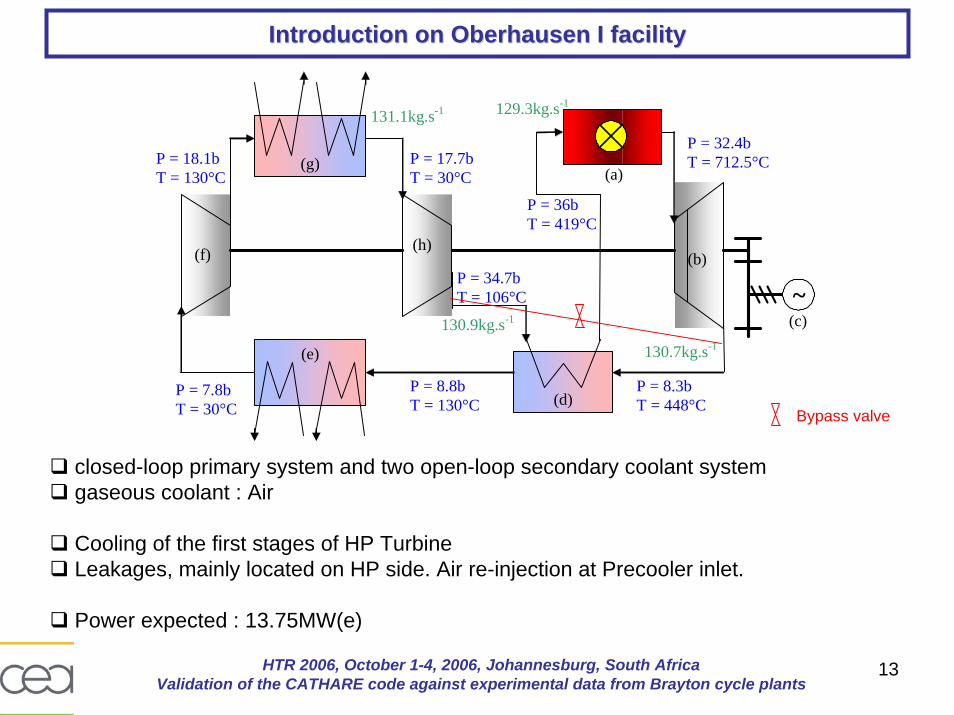
Introduction on Introduction on OberhausenOberhausen I facilityI facility
(f) (b)
(a)
(d)
(e)
(g)
(h)
~(c)
P = 32.4b T = 712.5°C
P = 8.3b T = 448°C
P = 8.8b T = 130°C
P = 7.8b T = 30°C
P = 18.1b T = 130°C
P = 17.7b T = 30°C
P = 34.7b T = 106°C
P = 36b T = 419°C
129.3kg.s-1
130.7kg.s-1
131.1kg.s-1
130.9kg.s-1
closed-loop primary system and two open-loop secondary coolant systemgaseous coolant : Air
Cooling of the first stages of HP TurbineLeakages, mainly located on HP side. Air re-injection at Precooler inlet.
Power expected : 13.75MW(e)
Bypass valve
14HTR 2006, October 1-4, 2006, Johannesburg, South AfricaValidation of the CATHARE code against experimental data from Brayton cycle plants
Available data on Available data on OberhausenOberhausen I facility I facility
two nominal states :
The normal operating conditions of the real installation between 1974 and 1988 (Bammert et al., 1983), with a maximum power obtained of 13.75MW(e)
A partial load conditions 10 MW(e)
three transients :
An aperture and closure of the turbo-machine by-pass valveLoss of electrical load without turbo-machine tripAn house load rejection without turbo-machine trip
15HTR 2006, October 1-4, 2006, Johannesburg, South AfricaValidation of the CATHARE code against experimental data from Brayton cycle plants
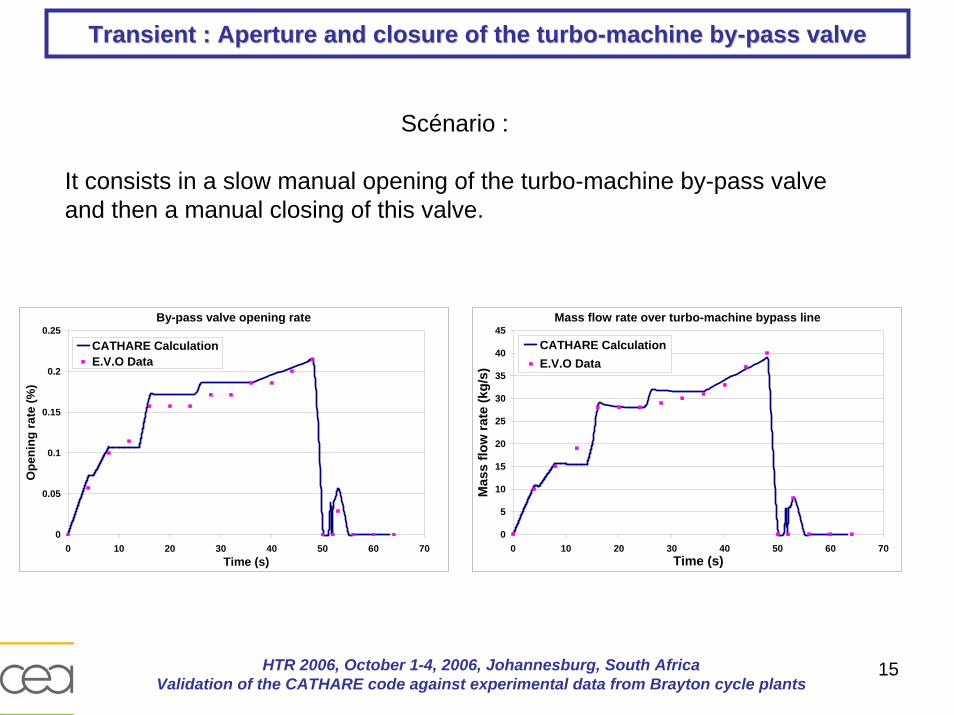
Transient : Aperture and closure of the turboTransient : Aperture and closure of the turbo--machine bymachine by--pass valvepass valve
Scénario :
It consists in a slow manual opening of the turbo-machine by-pass valve and then a manual closing of this valve.
By-pass valve opening rate
0
0.05
0.1
0.15
0.2
0.25
0 10 20 30 40 50 60 70Time (s)
Ope
ning
rate
(%)
CATHARE CalculationE.V.O Data
Mass flow rate over turbo-machine bypass line
0
5
10
15
20
25
30
35
40
45
0 10 20 30 40 50 60 70Time (s)
Mas
s flo
w ra
te (k
g/s)
CATHARE CalculationE.V.O Data
16HTR 2006, October 1-4, 2006, Johannesburg, South AfricaValidation of the CATHARE code against experimental data from Brayton cycle plants
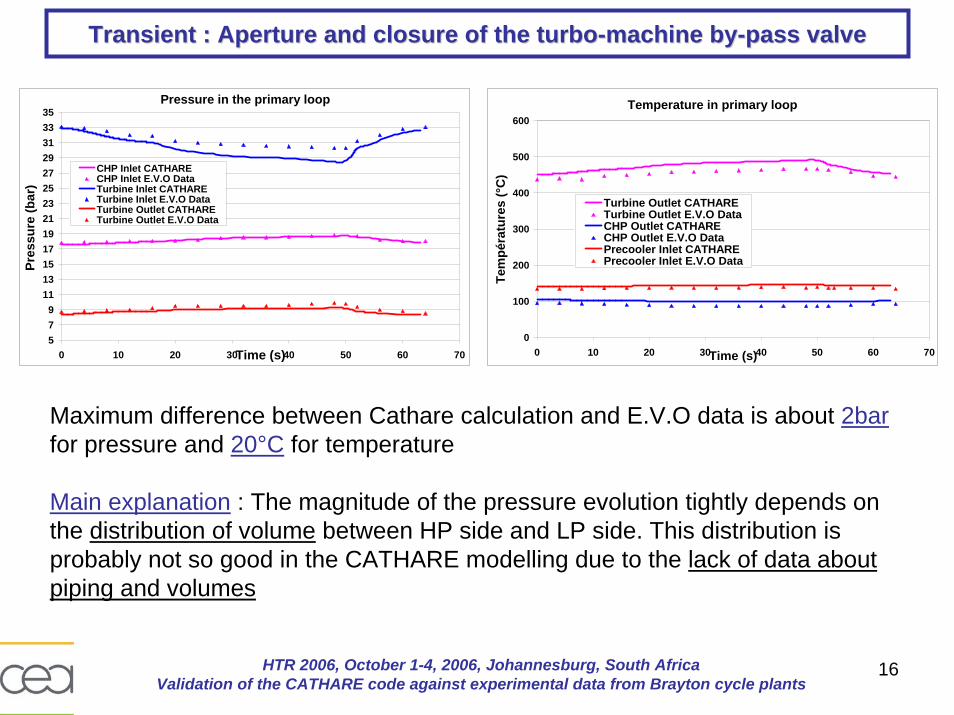
Transient : Aperture and closure of the turboTransient : Aperture and closure of the turbo--machine bymachine by--pass valvepass valve
Pressure in the primary loop
579
11131517192123252729313335
0 10 20 30 40 50 60 70Time (s)
Pres
sure
(bar
)
CHP Inlet CATHARECHP Inlet E.V.O DataTurbine Inlet CATHARETurbine Inlet E.V.O DataTurbine Outlet CATHARETurbine Outlet E.V.O Data
Temperature in primary loop
0
100
200
300
400
500
600
0 10 20 30 40 50 60 70Time (s)
Tem
péra
ture
s (°
C)
Turbine Outlet CATHARETurbine Outlet E.V.O DataCHP Outlet CATHARECHP Outlet E.V.O DataPrecooler Inlet CATHAREPrecooler Inlet E.V.O Data
Maximum difference between Cathare calculation and E.V.O data is about 2barfor pressure and 20°C for temperature
Main explanation : The magnitude of the pressure evolution tightly depends on the distribution of volume between HP side and LP side. This distribution is probably not so good in the CATHARE modelling due to the lack of data about piping and volumes
17HTR 2006, October 1-4, 2006, Johannesburg, South AfricaValidation of the CATHARE code against experimental data from Brayton cycle plants
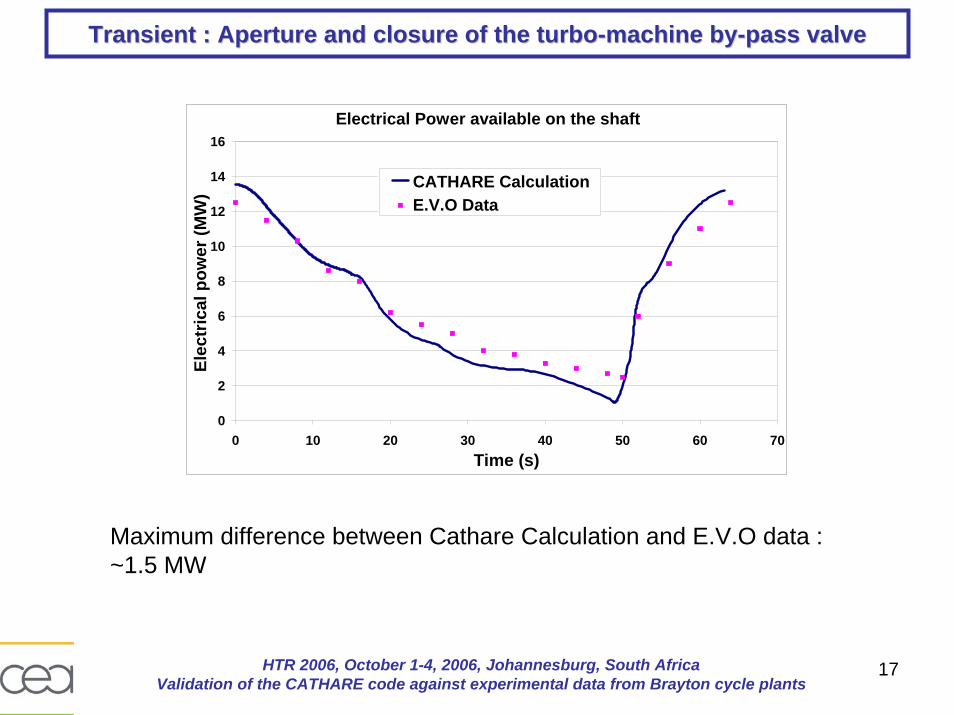
Transient : Aperture and closure of the turboTransient : Aperture and closure of the turbo--machine bymachine by--pass valvepass valve
Electrical Power available on the shaft
0
2
4
6
8
10
12
14
16
0 10 20 30 40 50 60 70Time (s)
Elec
tric
al p
ower
(MW
)CATHARE CalculationE.V.O Data
Maximum difference between Cathare Calculation and E.V.O data :~1.5 MW
18HTR 2006, October 1-4, 2006, Johannesburg, South AfricaValidation of the CATHARE code against experimental data from Brayton cycle plants
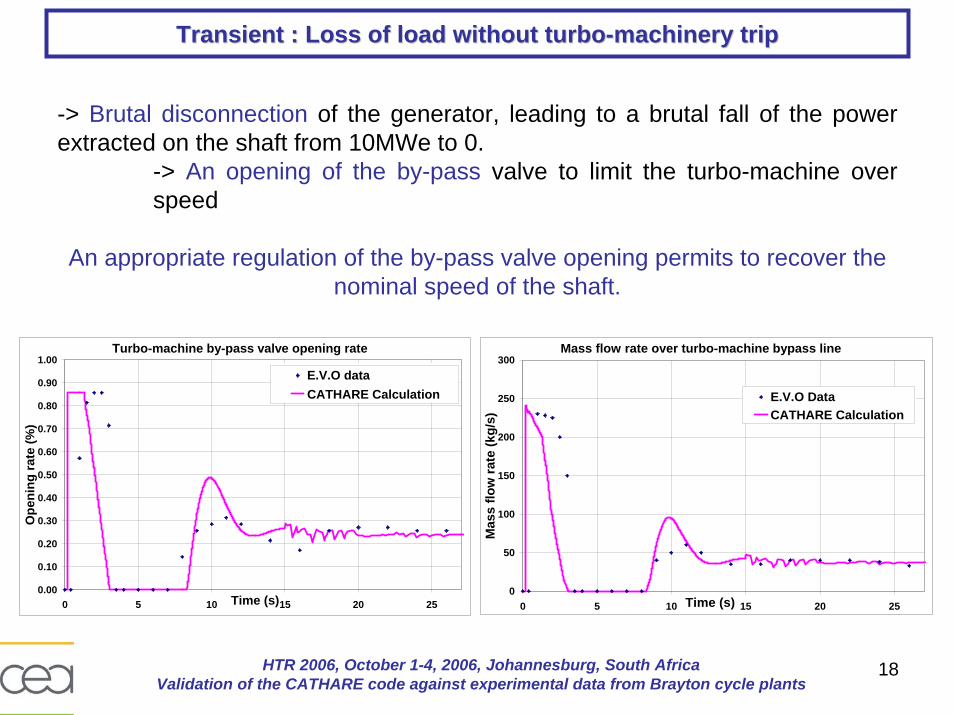
Transient : Loss of load without turboTransient : Loss of load without turbo--machinery tripmachinery trip
-> Brutal disconnection of the generator, leading to a brutal fall of the power extracted on the shaft from 10MWe to 0.
-> An opening of the by-pass valve to limit the turbo-machine over speed
An appropriate regulation of the by-pass valve opening permits to recover the nominal speed of the shaft.
Turbo-machine by-pass valve opening rate
0.00
0.10
0.20
0.30
0.40
0.50
0.60
0.70
0.80
0.90
1.00
0 5 10 15 20 25Time (s)
Ope
ning
rate
(%)
E.V.O dataCATHARE Calculation
Mass flow rate over turbo-machine bypass line
0
50
100
150
200
250
300
0 5 10 15 20 25Time (s)
Mas
s flo
w ra
te (k
g/s)
E.V.O DataCATHARE Calculation
19HTR 2006, October 1-4, 2006, Johannesburg, South AfricaValidation of the CATHARE code against experimental data from Brayton cycle plants
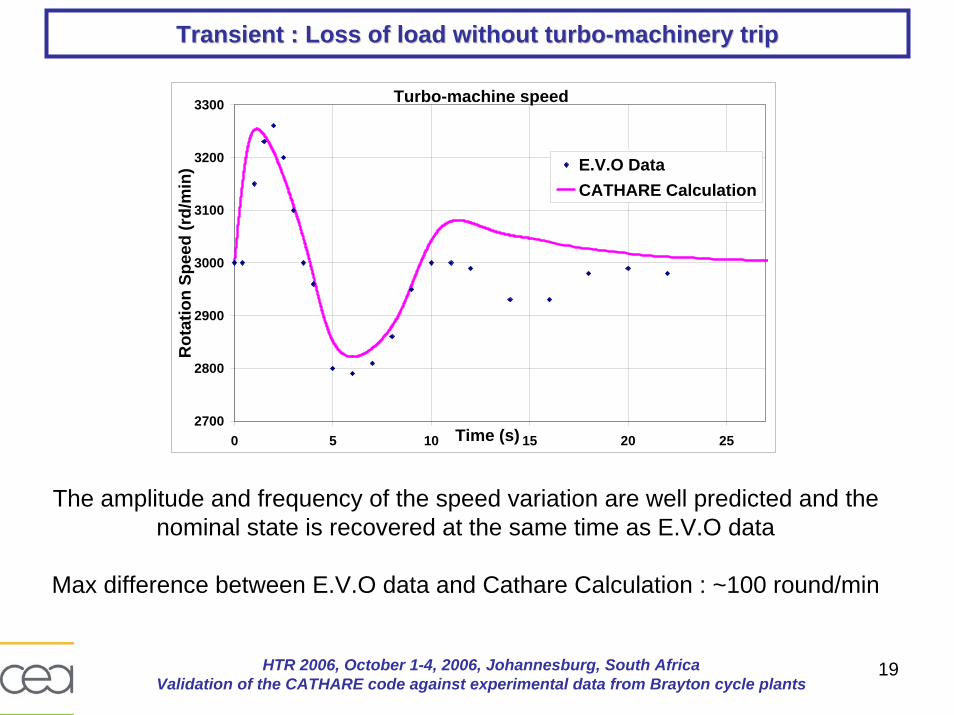
Transient : Loss of load without turboTransient : Loss of load without turbo--machinery tripmachinery trip
Turbo-machine speed
2700
2800
2900
3000
3100
3200
3300
0 5 10 15 20 25Time (s)
Rot
atio
n Sp
eed
(rd/
min
) E.V.O DataCATHARE Calculation
The amplitude and frequency of the speed variation are well predicted and the nominal state is recovered at the same time as E.V.O data
Max difference between E.V.O data and Cathare Calculation : ~100 round/min
20HTR 2006, October 1-4, 2006, Johannesburg, South AfricaValidation of the CATHARE code against experimental data from Brayton cycle plants
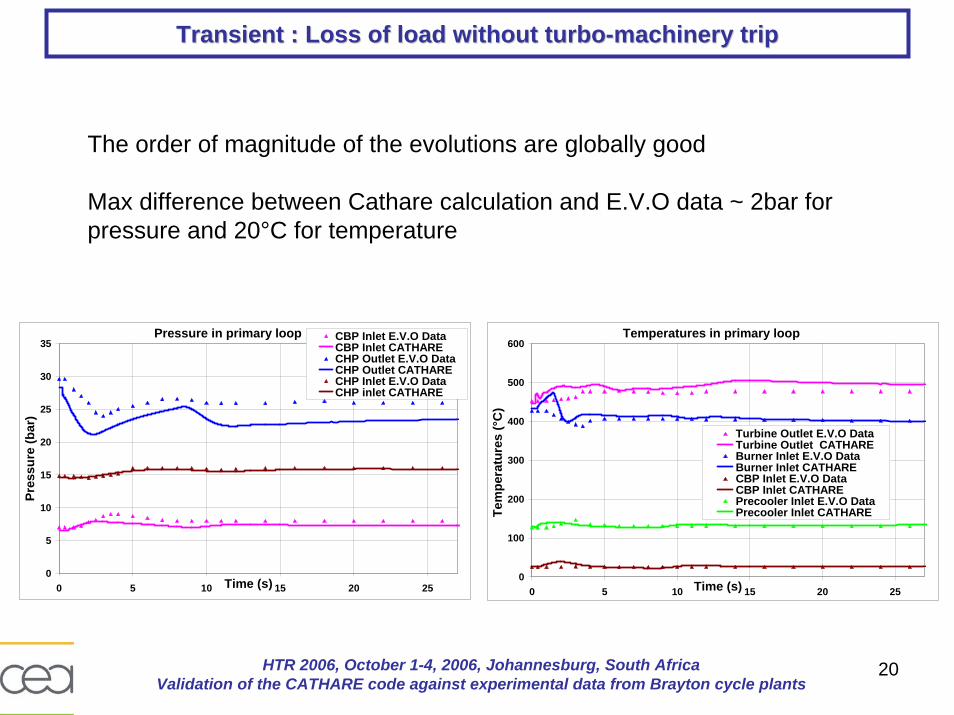
Transient : Loss of load without turboTransient : Loss of load without turbo--machinery tripmachinery trip
The order of magnitude of the evolutions are globally good
Max difference between Cathare calculation and E.V.O data ~ 2bar for pressure and 20°C for temperature
Pressure in primary loop
0
5
10
15
20
25
30
35
0 5 10 15 20 25Time (s)
Pres
sure
(bar
)
CBP Inlet E.V.O DataCBP Inlet CATHARECHP Outlet E.V.O DataCHP Outlet CATHARECHP Inlet E.V.O DataCHP inlet CATHARE
Temperatures in primary loop
0
100
200
300
400
500
600
0 5 10 15 20 25Time (s)
Tem
pera
ture
s (°
C)
Turbine Outlet E.V.O DataTurbine Outlet CATHAREBurner Inlet E.V.O DataBurner Inlet CATHARECBP Inlet E.V.O DataCBP Inlet CATHAREPrecooler Inlet E.V.O DataPrecooler Inlet CATHARE
21HTR 2006, October 1-4, 2006, Johannesburg, South AfricaValidation of the CATHARE code against experimental data from Brayton cycle plants
ConclusionConclusion
•• The study highlights some interesting feedback on The study highlights some interesting feedback on OberhausenOberhausen I and II I and II facilities :facilities :o Influence of some critical parameters : leakages, cooling, repartition of volume
between HP side and LP side…o Necessity to well represent these phenomenon in Cathare simulation.
•• These calculations are a first step in the validation of These calculations are a first step in the validation of CathareCathare applied to applied to GCR : GCR : o Oberhausen I and II are unique opportunities to compare Cathare calculation with
large scale helium and air Brayton cycles. o Nominal states for the design cycle and for three operating cycles are well
predicted.o Load following, aperture and closure of by-pass valve and loss of load transient
calculation give results in good agreement with experimental data.
•• PerspectivesPerspectiveso Calculation of the Loss of load transient for Oberhausen IIo Find and collect additional data (more detailed geometrical data, other transient
measurements) through the European project Raphael.
Related Documents