Validation of Streamflow Measurements Made with M9 and RiverRay Acoustic Doppler Current Profilers Justin A. Boldt 1 and Kevin A. Oberg 2 Abstract: The USGS Office of Surface Water (OSW) previously validated the use of Teledyne RD Instruments (TRDI) Rio Grande (in 2007), StreamPro (in 2006), and Broadband (in 1996) acoustic Doppler current profilers (ADCPs) for streamflow (discharge) measurements made by the USGS. Two new ADCPs, the SonTek M9 and the TRDI RiverRay, were first used in the USGS Water Mission Area programs in 2009. Since 2009, the OSW and USGS Water Science Centers (WSCs) have been conducting field measurements as part of their stream- gauging program using these ADCPs. The purpose of this paper is to document the results of USGS OSW analyses for validation of M9 and RiverRay ADCP streamflow measurements. The OSW required each participating WSC to make comparison measurements over the range of operating conditions in which the instruments were used until sufficient measurements were available. The performance of these ADCPs was evaluated for validation and to identify any present and potential problems. Statistical analyses of streamflow measurements indicate that measurements made with the SonTek M9 ADCP using firmware 2.00–3.00 or the TRDI RiverRay ADCP using firmware 44.12–44.15 are unbiased and, therefore, can continue to be used to make streamflow measurements in the USGS stream-gauging program. However, for the M9 ADCP, some important issues must be considered in making future measurements. Possible future work may include additional validation of streamflow measurements made with these instruments from other locations in the United States and measurement validation using updated firmware and software. DOI: 10.1061/(ASCE)HY.1943-7900.0001087. © 2015 American Society of Civil Engineers. Author keywords: Streamflow; Discharge measurements; Validation; Acoustic Doppler current profilers; Field tests. Introduction The use of acoustic Doppler current profilers (ADCPs) to measure streamflow (discharge) as part of the USGS stream-gauging pro- gram continues to increase. Two new ADCPs for measuring flow in rivers, canals, and estuaries became commercially available in 2009: the SonTek (San Diego, California) RiverSurveyor M9 ADCP [Fig. 1(a)] and the Teledyne RD Instruments (TRDI) (Poway, California) RiverRay ADCP [Fig. 1(b)]. These instruments are used by the USGS and other hydrometric entities, such as other governmental agencies, engineering companies, and academic in- stitutions. In 2013, discharge measurements made with acoustic instruments (including both ADCPs and acoustic Doppler velocim- eters) comprised more than 90% of all USGS streamflow measure- ments. For sites where streams were not wadable, ADCPs were used almost exclusively (>99%) to make streamflow measurements. During the 12-month period from May 1, 2013, to April 30, 2014, USGS personnel made more than 120,000 streamflow measurements throughout the United States and Puerto Rico, 31% of which were made using an ADCP. The majority (63%) of these ADCP streamflow measurements were made with TRDI 600- and 1,200-kHz Workhorse Rio Grande (18%), 2,000-kHz StreamPro (43%), or other broadband ADCPs (2%). The remaining 37% of these ADCP streamflow measurements were made with SonTek RiverSurveyor M9 (28%) and S5 (1%) ADCPs or TRDI RiverRay (8%) ADCPs. These newer ADCPs (i.e., M9, S5, and RiverRay) were used less than other instruments during this period because the Rio Grande and StreamPro ADCPs have been in use throughout the USGS for over 10 years and because, possibly to a lesser extent, streamflow measurements made with the newer ADCPs have not been completely validated. Nevertheless, use of the M9 ADCP is rapidly increasing because of its compact size, turnkey operation, ease of use, and capacity to measure in a wide range of hydraulic conditions. The number of streamflow measurements made by the USGS using the RiverRay ADCP is also increasing because of similar reasons. To ensure the accuracy, precision, and consis- tency of USGS streamflow records, it is imperative to determine whether the M9 and RiverRay ADCPs are comparable with proven streamflow measurement instruments and methods such that one instrument may replace other instruments with sufficient accuracy and precision. Purpose and Scope of Paper The purpose of this paper is to present the results of field valida- tions of streamflow measurements made with the M9 and RiverRay ADCPs. The S5 ADCP is similar to the M9 ADCP, but it was not validated owing to an insufficient number of measurements. Apart from the physical differences, the M9 and RiverRay ADCPs differ substantially from ADCPs previously tested and used by the USGS in that these newer ADCPs utilize (1) multiple acoustic frequencies (M9) for velocity measurements, (2) a flat-surface, phased-array transducer with larger beam angles (RiverRay), (3) automatic con- figuration and adaptive measurement methods (M9 and RiverRay) when making velocity measurements, and (4) the application of new (M9) or updated (RiverRay) software for data collection and analysis. Also, little documentation of field validation is avail- able for these new instruments, especially for a wide range of op- erating conditions. For these reasons, it is necessary to validate that 1 Hydrologist, USGS, Indiana-Kentucky Water Science Center, 9818 Bluegrass Parkway, Louisville, KY 40299 (corresponding author). E-mail: [email protected] 2 Hydrologist, USGS, Office of Surface Water, 405 N. Goodwin Ave., Urbana, IL 61801. E-mail: [email protected] Note. This manuscript was submitted on October 29, 2014; approved on July 26, 2015; published online on October 1, 2015. Discussion period open until March 1, 2016; separate discussions must be submitted for in- dividual papers. This paper is part of the Journal of Hydraulic Engineer- ing, © ASCE, ISSN 0733-9429/04015054(16)/$25.00. © ASCE 04015054-1 J. Hydraul. Eng. J. Hydraul. Eng., 04015054 Downloaded from ascelibrary.org by US Geological Survey Library on 12/16/15. Copyright ASCE. For personal use only; all rights reserved.

Welcome message from author
This document is posted to help you gain knowledge. Please leave a comment to let me know what you think about it! Share it to your friends and learn new things together.
Transcript

Validation of Streamflow Measurements Made with M9 andRiverRay Acoustic Doppler Current Profilers
Justin A. Boldt1 and Kevin A. Oberg2
Abstract: The USGS Office of Surface Water (OSW) previously validated the use of Teledyne RD Instruments (TRDI) Rio Grande (in2007), StreamPro (in 2006), and Broadband (in 1996) acoustic Doppler current profilers (ADCPs) for streamflow (discharge) measurementsmade by the USGS. Two new ADCPs, the SonTek M9 and the TRDI RiverRay, were first used in the USGSWater Mission Area programs in2009. Since 2009, the OSW and USGS Water Science Centers (WSCs) have been conducting field measurements as part of their stream-gauging program using these ADCPs. The purpose of this paper is to document the results of USGS OSWanalyses for validation of M9 andRiverRay ADCP streamflow measurements. The OSW required each participating WSC to make comparison measurements over the range ofoperating conditions in which the instruments were used until sufficient measurements were available. The performance of these ADCPs wasevaluated for validation and to identify any present and potential problems. Statistical analyses of streamflow measurements indicate thatmeasurements made with the SonTek M9 ADCP using firmware 2.00–3.00 or the TRDI RiverRay ADCP using firmware 44.12–44.15 areunbiased and, therefore, can continue to be used to make streamflow measurements in the USGS stream-gauging program. However, for theM9 ADCP, some important issues must be considered in making future measurements. Possible future work may include additional validationof streamflow measurements made with these instruments from other locations in the United States and measurement validation usingupdated firmware and software. DOI: 10.1061/(ASCE)HY.1943-7900.0001087. © 2015 American Society of Civil Engineers.
Author keywords: Streamflow; Discharge measurements; Validation; Acoustic Doppler current profilers; Field tests.
Introduction
The use of acoustic Doppler current profilers (ADCPs) to measurestreamflow (discharge) as part of the USGS stream-gauging pro-gram continues to increase. Two new ADCPs for measuring flowin rivers, canals, and estuaries became commercially available in2009: the SonTek (San Diego, California) RiverSurveyor M9ADCP [Fig. 1(a)] and the Teledyne RD Instruments (TRDI)(Poway, California) RiverRay ADCP [Fig. 1(b)]. These instrumentsare used by the USGS and other hydrometric entities, such as othergovernmental agencies, engineering companies, and academic in-stitutions. In 2013, discharge measurements made with acousticinstruments (including both ADCPs and acoustic Doppler velocim-eters) comprised more than 90% of all USGS streamflow measure-ments. For sites where streams were not wadable, ADCPs were usedalmost exclusively (>99%) to make streamflow measurements.
During the 12-month period from May 1, 2013, to April 30,2014, USGS personnel made more than 120,000 streamflowmeasurements throughout the United States and Puerto Rico, 31%of which were made using an ADCP. The majority (63%) of theseADCP streamflow measurements were made with TRDI 600- and1,200-kHz Workhorse Rio Grande (18%), 2,000-kHz StreamPro(43%), or other broadband ADCPs (2%). The remaining 37% ofthese ADCP streamflow measurements were made with SonTek
RiverSurveyor M9 (28%) and S5 (1%) ADCPs or TRDI RiverRay(8%) ADCPs. These newer ADCPs (i.e., M9, S5, and RiverRay)were used less than other instruments during this period becausethe Rio Grande and StreamPro ADCPs have been in use throughoutthe USGS for over 10 years and because, possibly to a lesser extent,streamflow measurements made with the newer ADCPs have notbeen completely validated. Nevertheless, use of the M9 ADCP israpidly increasing because of its compact size, turnkey operation,ease of use, and capacity to measure in a wide range of hydraulicconditions. The number of streamflow measurements made bythe USGS using the RiverRay ADCP is also increasing becauseof similar reasons. To ensure the accuracy, precision, and consis-tency of USGS streamflow records, it is imperative to determinewhether the M9 and RiverRay ADCPs are comparable with provenstreamflow measurement instruments and methods such that oneinstrument may replace other instruments with sufficient accuracyand precision.
Purpose and Scope of Paper
The purpose of this paper is to present the results of field valida-tions of streamflow measurements made with the M9 and RiverRayADCPs. The S5 ADCP is similar to the M9 ADCP, but it was notvalidated owing to an insufficient number of measurements. Apartfrom the physical differences, the M9 and RiverRay ADCPs differsubstantially from ADCPs previously tested and used by the USGSin that these newer ADCPs utilize (1) multiple acoustic frequencies(M9) for velocity measurements, (2) a flat-surface, phased-arraytransducer with larger beam angles (RiverRay), (3) automatic con-figuration and adaptive measurement methods (M9 and RiverRay)when making velocity measurements, and (4) the application ofnew (M9) or updated (RiverRay) software for data collectionand analysis. Also, little documentation of field validation is avail-able for these new instruments, especially for a wide range of op-erating conditions. For these reasons, it is necessary to validate that
1Hydrologist, USGS, Indiana-Kentucky Water Science Center, 9818Bluegrass Parkway, Louisville, KY 40299 (corresponding author). E-mail:[email protected]
2Hydrologist, USGS, Office of Surface Water, 405 N. Goodwin Ave.,Urbana, IL 61801. E-mail: [email protected]
Note. This manuscript was submitted on October 29, 2014; approved onJuly 26, 2015; published online on October 1, 2015. Discussion periodopen until March 1, 2016; separate discussions must be submitted for in-dividual papers. This paper is part of the Journal of Hydraulic Engineer-ing, © ASCE, ISSN 0733-9429/04015054(16)/$25.00.
© ASCE 04015054-1 J. Hydraul. Eng.
J. Hydraul. Eng., 04015054
Dow
nloa
ded
from
asc
elib
rary
.org
by
US
Geo
logi
cal S
urve
y L
ibra
ry o
n 12
/16/
15. C
opyr
ight
ASC
E. F
or p
erso
nal u
se o
nly;
all
righ
ts r
eser
ved.

the M9 and RiverRay ADCPs accurately measure discharge to en-sure that there are no appreciable changes in long-term streamflowrecords (usually 30 years or greater) that may be caused by changesin equipment and measurement technology.
A total of 313 validation measurements collected by USGSWater Science Centers (WSCs) and other agencies, includingthe South Florida Water Measurement District (SFWMD) andNew Zealand’s National Institute of Water and Atmospheric Re-search (NIWA), were submitted to an online data depository to bereviewed and analyzed. This number of measurements representsonly validation measurements made with the ADCPs describedhere but includes all firmware versions. Firmware and softwarecontrol the instrument operation and processing algorithms frominside the ADCP and from an externally connected device, respec-tively. Changes in firmware or software can affect the dischargecomputation algorithms, so it is important to analyze each updatedfirmware/software separately. Updates that do not affect the dis-charge computation can be included with the previous firmwareversions. Here the authors consider only the firmware versions inuse at the time of this work.
From this database, 72 M9 measurements (firmware version2.00–3.00) and 56 RiverRay measurements (firmware version44.12–44.15) were analyzed. Of the M9 validation measurements,68 had a navigation reference of bottom track (BT), whereas 49 hada global positioning system (GPS) reference. Bottom tracking is atechnique for measuring the velocity of an ADCP (mounted on amoving platform) over the bottom (streambed) by analyzing reflec-tions of sound pulses returned from the streambed (Teledyne RDInstruments 2001a; Simpson 2002). GPS is a space-based satellitenavigation system that provides location and time information(Kaplan 1996) and is often used as a navigation reference forADCP measurements when bottom tracking is unreliable or isbiased by sediment transport (Mueller et al. 2013). All 56 of theRiverRay field validation measurements used BT as the navigationreference. The final data sets used in the analysis were collected inthe period April 11, 2011–May 8, 2013, by at least 35 differenthydrographers using various ADCPs and deployment techniques(e.g., from bridge, cableway, moving boat) at 93 different sites(91 sites in the United States and 2 sites in New Zealand).
Previous Work
The first detailed analyses of ADCP discharge measurements wereconducted by Christensen and Herrick (1982) for the USGS and by
Simpson and Oltmann (1993). Subsequently, Morlock (1996)documented evaluations of discharge measurements made with1,200- and 600-kHz versions of a broadband ADCP manufacturedby RD Instruments. (RD Instruments became Teledyne RD Instru-ments in 2005.) In Morlock’s study, a total of 31 ADCP streamflowmeasurements were made at 12 USGS stream-gauging stations andwere evaluated by comparison with river discharges determined byconventional USGS methods, such as current meters. The referencedischarges used by Morlock (1996) were obtained either from con-current (or nearly concurrent) current-meter measurements or fromstable rating curves at USGS streamflow-gauging stations. Of the31 ADCP discharge measurements, 25 were within 5% of the refer-ence discharges, and all ADCP-measured discharges were within8% of the reference discharges. No statistical bias was detected inany of the measurements.
Mueller (2002) performed a field assessment of ADCP dis-charge measurements at five different sites using instrumentsmanufactured by SonTek (1,500- and 3,000-MHz RiverSurveyor)and TRDI (1,200- and 600-kHz Rio Grande). The mean dischargesmeasured with each ADCP were within 5% of the discharge mea-sured using a Price AA meter or discharge obtained from a stage-discharge rating. A key finding of this work was that the coefficientof variation of the discharge measurements was usually less for themeasurements made with TRDI Rio Grande ADCPs than with theSonTek ADCPs tested. The RiverSurveyor ADCPs used narrow-band technology, and production of these instruments was discon-tinued in 2009. Broadband processing is a technique that usescoded pulses to make multiple measurements of the Doppler shiftwith a single ping, whereas narrowband processing uses a singlepulse per ping to measure velocity (Mueller et al. 2013).
Rehmel (2006) found that when the mean channel velocity wasgreater than 0.25 m=s, discharges measured with the StreamProADCP compared well to discharges measured using referenceinstruments. When the mean channel velocity was less than0.25 m=s, the individual transect discharges had greater variabilitybut were not biased. Oberg and Mueller (2007) analyzed 100 RioGrande ADCP field validation discharge measurements and foundthat streamflow measurements made with these ADCPs were un-biased when compared to a reference discharge regardless of thewater-tracking mode used for making the measurement. Water-tracking mode refers to a particular configuration of ADCP pingsand processing algorithms that can be changed either manually orautomatically to optimize the ADCP performance for the watervelocity, turbulence level, and depth being measured (Muelleret al. 2013).
Collection and Analysis of ADCP ValidationMeasurement Data
Instruments Tested
The M9 ADCP (SonTek 2012) utilizes nine transducers withthree acoustic frequencies. This ADCP has dual four-beam3- and 1-MHz transducers in a Janus configuration (TeledyneRD Instruments 2001a; Simpson 2002), with the 3-MHz beamsoffset horizontally 45° from the 1-MHz beams. All of the 3- and1-MHz transducers are fixed at a 25° beam angle in the vertical andare used for velocity and depth measurements. For water depths ator less than 75 cm, the 3-MHz transducers are used for BT. Forwater depths greater than 75 cm, the 1-MHz transducers are usedfor BT. The M9 also is equipped with a 500-kHz vertical beam fordepth measurement. The M9 ADCP has automatic adaptive sam-pling (depth-cell size, acoustic frequency, type of signal processing,
Fig. 1. (a) M9 ADCP; (b) RiverRay ADCP (images by Justin A. Boldt)
© ASCE 04015054-2 J. Hydraul. Eng.
J. Hydraul. Eng., 04015054
Dow
nloa
ded
from
asc
elib
rary
.org
by
US
Geo
logi
cal S
urve
y L
ibra
ry o
n 12
/16/
15. C
opyr
ight
ASC
E. F
or p
erso
nal u
se o
nly;
all
righ
ts r
eser
ved.

and ping configuration) based on measured flow conditions (waterdepth and velocity) to optimize the discharge measurement, and italso has parallel processing capabilities that allow the ADCP sys-tem to ping while it is processing the acoustic return from the pre-vious set of pings. The continuous processing allows the ADCPsystem to optimize the next ping configuration for the hydraulicconditions encountered. Additional details on the M9 ADCP can befound in Mueller et al. (2013, p. 7 and Appendix C).
The RiverRay ADCP (Teledyne RD Instruments 2009, 2012)has a flat-surface, phased-array transducer that forms four beamsin a Janus configuration with 30° beam angles in the vertical. ThisADCP also has automatic adaptive sampling based on measuredflow conditions to optimize the collection and processing of thedischarge measurement. This autoadaptive configuration algo-rithm varies the standard depth-cell size, standard depth-cell pingconfiguration, and the number of surface depth cells based ondepth and hydraulic conditions. Additional details regarding theRiverRay characteristics and configuration can be found in Muelleret al. (2013, p. 9–10 and Appendix C).
Data Collection and Processing Methods
All field streamflow measurements are based on some assumptionsand are subject to error. For this and other reasons, presently (2015)there is no method for measuring discharge that provides the trueflow value at any instant in time. For many years, the USGS hasused the Price AA or Pygmy current mechanical meter to makestreamflow measurements in accordance with methods defined inRantz et al. (1982). Oberg andMueller (2007) and other researchershave shown that streamflow measurements made with a broadbandADCP were equivalent to streamflow measurements made withthese mechanical meters and other commonly used instruments andtechniques.
For the present work, the acceptable types of reference stream-flow allowed in this study (ranked from most ideal to least ideal)include (1) simultaneous acoustic measurement, (2) simultaneouscurrent-meter measurement, (3) stable rating curve (stage-dischargerelation), and (4) sequential acoustic measurement. A stable ratingcurve is one that has not experienced a recent shift or is not fre-quently shifted. Simultaneous measurements are always better thansequential measurements because the measured flow is more likelyto be the same, and acoustic measurements are preferred becausethey are most similar to the instruments being tested. If the refer-ence and comparison measurements were not concurrent, thehydrographer was required to provide stage data or some otherdocumentation to show that the measured flow was not changingsubstantially during the time that the streamflow measurementswere being made. The reference measurements were typicallymade using a 1,200-kHz Rio Grande ADCP using BT as the nav-igation reference but also included 600-kHz Rio Grande ADCP,2,000-kHz StreamPro ADCP, FlowTracker acoustic Dopplervelocimeter, Price AA mechanical meter, or gauge (stable stage-discharge relation) measurements. All of these instruments andmethods were previously validated or are accepted methods formeasuring streamflow in the USGS. In some cases, the ADCPsused for reference measurements were also equipped with differ-ential GPS.
In this study, the hydrographer was asked to process the mea-surements submitted using established USGS procedures (Muelleret al. 2013). These procedures included, but were not limited to,evaluation of moving-bed test results, evaluation of the qualityof BT and GPS data (where available), any data screening thatwas necessary, an evaluation of the extrapolation methods to beused, and a qualitative assessment of streamflow measurement
quality. When this work was accomplished, the validation data setand supporting documentation were submitted to an online datadepository established and maintained by the USGS Office of Sur-face Water (OSW). This database provides an effective and efficientway to compile and share hydroacoustic instrument evaluationdata. Using numerous hydrographers (rather than a single hydrog-rapher) reduces the amount of time needed to collect a sufficientnumber of validation measurements for statistical analyses and,thus, enables more timely analysis of field validation testing toevaluate the performance of acoustic instruments in a wide varietyof hydraulic conditions and identify potential data-collection andanalysis problems or ADCP bias. Every validation data submissioncontained not only the comparison measurement data files for eachinstrument but also hydrographer contact information, a descriptionof the data files, and other documentation, such as measurementcomments, field notes, and photographs.
Rather than conducting all M9 or RiverRay comparisons usinga single ADCP, all hydrographers used their own instruments andequipment. Consequently, comparison measurements were madeusing many different ADCPs for each type of ADCP tested, min-imizing any potential bias from use of a single instrument. Toensure consistency and adequate processing and review of the val-idation measurements submitted, the authors also thoroughly re-viewed and reprocessed each data set following the proceduresoutlined in Mueller et al. (2013) and Oberg et al. (2005). Field notesand other available information were also reviewed to help providean indication of adherence to USGS measurement policies and pro-cedures. These additional data—hydrographer contact information,description of files, comments, field notes, and photographs—proved valuable in ensuring quality comparisons.
The manufacturers made numerous changes in firmware andsoftware over time after the introduction of these ADCPs in2009. Many of these firmware and software changes were madein response to issues identified during preliminary USGS evalua-tions. Because most of the issues identified by the testing could biasor otherwise adversely affect the quality of measured discharges,comparison measurements using this outdated firmware/softwarecould not be included in the subsequent analysis. Therefore, onlyM9 validation measurements collected using firmware 2.00–3.00(2.00, 2.31, and 3.00) and RiverRay validation measurementscollected using firmware 44.12–44.15 (44.12, 44.13, 44.14, and44.15) were used for the analyses described in this paper. For mostof the M9 validation measurements, GPS data were simultaneouslycollected with BT data when possible. Two independent GPS nav-igation references were available—GGA, a position-based GPSreference, and VTG, a Doppler-based GPS reference velocity(National Marine Electronics Association 2002). The number ofaccepted validation measurements for each firmware group accord-ing to ADCP navigation reference is shown in Table 1. The firm-ware groupings presented in this paper were also justified becausefirmware changes incorporated into these versions should not result
Table 1. Number of Field Validation Measurements Available for Analysisfor Each ADCP Firmware Group
ADCPnavigationreference
M9 ADCP firmwareRiverRay ADCP
firmware
0.80–0.84 1.00–1.05 1.50–1.71 2.00–3.00 44.12–44.15
BT 46 27 45 68 56GPS-GGA 21 13 29 47 N/AGPS-VTG 21 13 30 49 N/A
Note: ADCP = acoustic Doppler current profiler; BT = bottom track;GGA = position-based GPS; VTG = vector-based GPS.
© ASCE 04015054-3 J. Hydraul. Eng.
J. Hydraul. Eng., 04015054
Dow
nloa
ded
from
asc
elib
rary
.org
by
US
Geo
logi
cal S
urve
y L
ibra
ry o
n 12
/16/
15. C
opyr
ight
ASC
E. F
or p
erso
nal u
se o
nly;
all
righ
ts r
eser
ved.

in substantive changes in measured discharge. In contrast, M9 firm-ware version 1.00 introduced the SmartPulseHD adaptive acousticpulse scheme algorithm (SonTek 2012), and M9 firmware version2.00 had an improved BT algorithm, both of which resulted in sub-stantial changes in measured discharge or measurement quality.Although prior M9 firmware groups are not presented in this paper,preliminary analyses indicate that discharge measurements madeusing these firmware groups may be biased low, which is what inpart motivated this study.
Comparison measurements were never excluded from analysisjust because the measured discharges did not compare well(e.g., more than 5% difference between measurements); however,some measurements had to be excluded because of serious qualityissues (approximately 15% of submitted measurements). In somecases, it was determined that the quality of the reference measure-ment was such that a valid comparison could not be made. Seriousquality issues included measurements with invalid BT, invalidmoving-bed test, invalid/poor-quality GPS, improper/invalid com-pass calibration, poor measurement technique (e.g., rapid changesin boat heading, pitch, roll, or speed; low exposure time; air entrain-ment; unsuitable cross section; poor instrument choice), or water
velocities outside the ADCP operating range. Consequently, mea-surements with a poor reference or serious quality issues were re-moved from subsequent analyses. These quality issues could havebeen avoided by good site selection and proper techniques andequipment, which can be controlled by the hydrographer. In con-trast, comparison measurements may not compare well with thereference measurement because of deficiencies in the ADCPdesign, physical components, or processing algorithms. These aredeficiencies in the ADCP and are beyond the user’s control. M9ADCP data were processed using SonTek’s RiverSurveyor Livesoftware version 3.50 (SonTek 2012), and RiverRay ADCP datawere processed using TRDI’s WinRiver II software version 2.08(Teledyne RD Instruments 2011b).
Description of Sites and Flow Characteristics
After the submitted measurements were screened, 128 comparisonmeasurements (72 of M9 and 56 of RiverRay) from a total of 93different sites were available for analysis. The location of the evalu-ation sites used in this study are shown in Fig. 2. Almost all of thesesites are located at or near continuous-record streamflow-gaugingstations. The drainage area for the sites used for validation ranged
(a)
Fig. 2. Measurement location sites for the M9 and RiverRay ADCP validation data sets in (a) the continental United States (source: U.S. NationalPark Service); (b) Alaska (source: U.S. Park Service, Esri, HERE, DeLorme, MapmyIndia, © OpenStreetMap contributors, the GIS user community;Inset Source: USGS TNMNational structures data set; USGS TNMNational transportation data set; TomTom commercial roads; U.S. CensusBureauTIGER/Line; USGS TNMNational boundaries data set; USGS TNMGeographic names information); (c) New Zealand (source: U.S. NationalPark Service)
© ASCE 04015054-4 J. Hydraul. Eng.
J. Hydraul. Eng., 04015054
Dow
nloa
ded
from
asc
elib
rary
.org
by
US
Geo
logi
cal S
urve
y L
ibra
ry o
n 12
/16/
15. C
opyr
ight
ASC
E. F
or p
erso
nal u
se o
nly;
all
righ
ts r
eser
ved.
from 10 to 1,800,000 km2. Detailed station and location informa-tion is presented in the Appendix.
Site and channel characteristics for these validation measure-ments varied greatly because this analysis was based on user-submitted data from hydrographers at sites throughout the UnitedStates and at two sites in New Zealand (Fig. 2). Measurement sitecross sections ranged from concrete trapezoidal canals to smallstreams to large rivers. Care was taken to ensure that the final,screened data cover the range of operating conditions to avoidany bias in the statistical results. The distribution of measured dis-charge, mean velocity, mean depth, and mean width for M9 andRiverRay validation measurements are shown in Fig. 3. TheRiverRay measurements comprised slightly larger flows (and, thus,higher mean velocities, mean depths, and mean widths) than theM9 measurements (Fig. 3), which could be expected because theconditions for which these two instruments were designed do notexactly overlap.
Statistical Analysis
A percentage-difference value, Per diff, was computed for eachreference and comparison measurement pair to normalize the datasets and is given by
Per diff ¼ Qcomparison −Qreference
Qreference× 100% ð1Þ
where Qcomparison is the comparison instrument discharge (M9 orRiverRay) and Qreference is the reference discharge. Four differenttests for normality [probability plot correlation coefficient (PPCC)test (Helsel and Hirsch 2002), Shapiro–Wilk test (Shapiro and Wilk1965), Lilliefors test (Lilliefors 1967), and Jarque–Bera test (Jarqueand Bera 1987)] were used to determine whether the percentage-difference values for each data set group (M9 2.00–3.00 BT,
M9 2.00–3.00 GGA, M9 2.00–3.00 VTG, and RiverRay 44.12–44.15 BT) were from a nonnormal distribution as shown in Table 2.Testing for normality ensures that the most appropriate statisticaltest is used. The PPCC test at a 0.10 significance level (Helsel andHirsch 2002) was the primary test for normality, and the other threetests were used to verify the PPCC test results.
For the PPCC test, the table of critical values (r�) for the cor-relation coefficient was obtained from Looney and Gulledge (1985)and was developed using the Blom (1958) plotting position. For theM9 2.00–3.00 BT group, the PPCC test (along with both theShapiro–Wilk and Lilliefors tests) rejects the null hypothesis thatthe data are from a normal distribution because the correlation co-efficient (r ¼ 0.945) was less than the critical r� value of 0.986.A log-transform of the percentage-difference data best improvedthe distribution of the data, but results from the normality tests stillindicated nonnormality of the data. Therefore, a Wilcoxon signed-rank test was used for the statistical analysis of the M9 2.00–3.00BT data. The Wilcoxon signed-rank test is a nonparametric hypoth-esis test that is equivalent to a t-test but is valid for a nonnormalpopulation (Helsel and Hirsch 2002). For each of the M9 2.00–3.00GGA, M9 2.00–3.00 VTG, and RiverRay 44.12–44.15 BT groups,the PPCC test (along with the Shapiro–Wilk, Lilliefors, andJarque–Bera tests) fails to reject the null hypothesis that the dataare from a normal distribution. Therefore, a t-test was used for thestatistical analyses of these three data groups.
For the t-test, the null hypothesis is that the mean of thepercentage-difference values is equal to zero, and the alternativehypothesis is that the mean of the percentage-difference values isnot equal to zero. For the Wilcoxon signed-rank test, the null hy-pothesis is that the median of the percentage-difference values isequal to zero, and the alternative hypothesis is that the medianof the percentage-difference values is not equal to zero (Ott andLongnecker 2010). All hypothesis tests were performed at a 0.05
(b) (c)
Fig. 2. (Continued.)
© ASCE 04015054-5 J. Hydraul. Eng.
J. Hydraul. Eng., 04015054
Dow
nloa
ded
from
asc
elib
rary
.org
by
US
Geo
logi
cal S
urve
y L
ibra
ry o
n 12
/16/
15. C
opyr
ight
ASC
E. F
or p
erso
nal u
se o
nly;
all
righ
ts r
eser
ved.

significance level with a two-sidedp-value because the ADCP com-parison measurement could be greater or less than the referencestreamflow measurement.
The ADCP validation data sets were characterized and exam-ined by means of exploratory data analysis based on one-to-one andresidual plots. Exploratory data analysis refers to the visualization
of data sets in order to identify any trends, patterns, or outliers.Summary statistics (median, mean, and standard deviation) are re-ported, and bootstrap methods (Moore et al. 2010) were employedusing MATLAB software (MATLAB version 8.1) to obtain a 95%confidence interval for the mean percentage-difference values.Bootstrap methods (bootstrapping) are beneficial because they
Fig. 3. Ranges of (a) discharge; (b) mean velocity; (c) mean depth; (d) mean width for the M9 and RiverRay ADCP validation data sets
Table 2. Selection of Hypothesis Test for Each Data Group Based on Normality Test Results; Null Hypothesis: Data Are from a Normal Distribution
Data group PPCC testa Shapiro–Wilk testb Lilliefors testb Jarque–Bera testb Hypothesis test
M9 2.00–3.00 BT Reject Reject Reject Fail to reject Wilcoxon signed-rankM9 2.00–3.00 GGA Fail to reject Fail to reject Fail to reject Fail to reject t-testM9 2.00–3.00 VTG Fail to reject Fail to reject Fail to reject Fail to reject t-testRiverRay 44.12–44.15 BT Fail to reject Fail to reject Fail to reject Fail to reject t-test
Note: BT = bottom track; GGA = position-based GPS; PPCC = probability plot correlation coefficient; VTG = vector-based GPS.aPrimary test for normality.bSecondary tests for normality.
© ASCE 04015054-6 J. Hydraul. Eng.
J. Hydraul. Eng., 04015054
Dow
nloa
ded
from
asc
elib
rary
.org
by
US
Geo
logi
cal S
urve
y L
ibra
ry o
n 12
/16/
15. C
opyr
ight
ASC
E. F
or p
erso
nal u
se o
nly;
all
righ
ts r
eser
ved.

allow for the computation of confidence intervals without the needfor a data set with a normal distribution or containing a large num-ber of samples. The percentage differences are assumed to be arandom sample and are resampled with replacement thousands oftimes. With adequate resamples, the bootstrap distribution of astatistic represents the sampling distribution of the statistic. Thebootstrap estimate of bias is the difference between the mean ofthe bootstrap distribution and the value of the statistic in the orig-inal data sample. If the bootstrap distribution is approximatelynormal with a small bias, then a confidence interval for the param-eter can be calculated using the bootstrap standard error (Mooreet al. 2010).
Validation of SonTek M9 Streamflow Measurements
M9 Validation Measurement Data
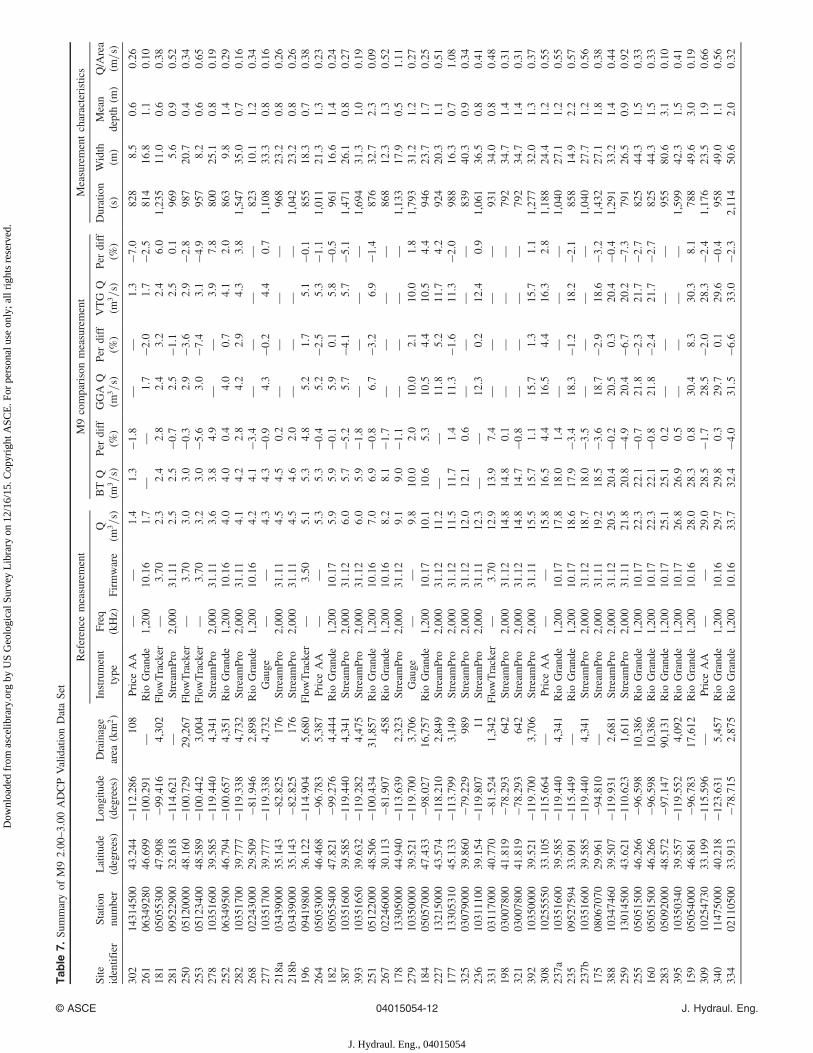
Sixty-eight M9 validation measurements using BT navigationreference with firmware 2.00–3.00 were available for analysis.Additionally, 47 GGA-referenced and 49 VTG-referenced valida-tion measurements were also available for analysis (Table 3). Thenumber of BT validation measurements is greater because GPSdata (i.e., GGA and VTG) were not collected for all validationmeasurements. The number of GPS-referenced measurements isnot necessarily the same because certain issues affecting measure-ment quality, such as multipath, affect one GPS reference butnot the other. Four of the 68 M9 validation measurements withBT reference had moving-bed conditions and were corrected withan appropriate moving-bed correction method (Mueller et al.2013). A summary of the validation streamflow measurementsand the flow characteristics for the M9 data set can be found inthe appendix.
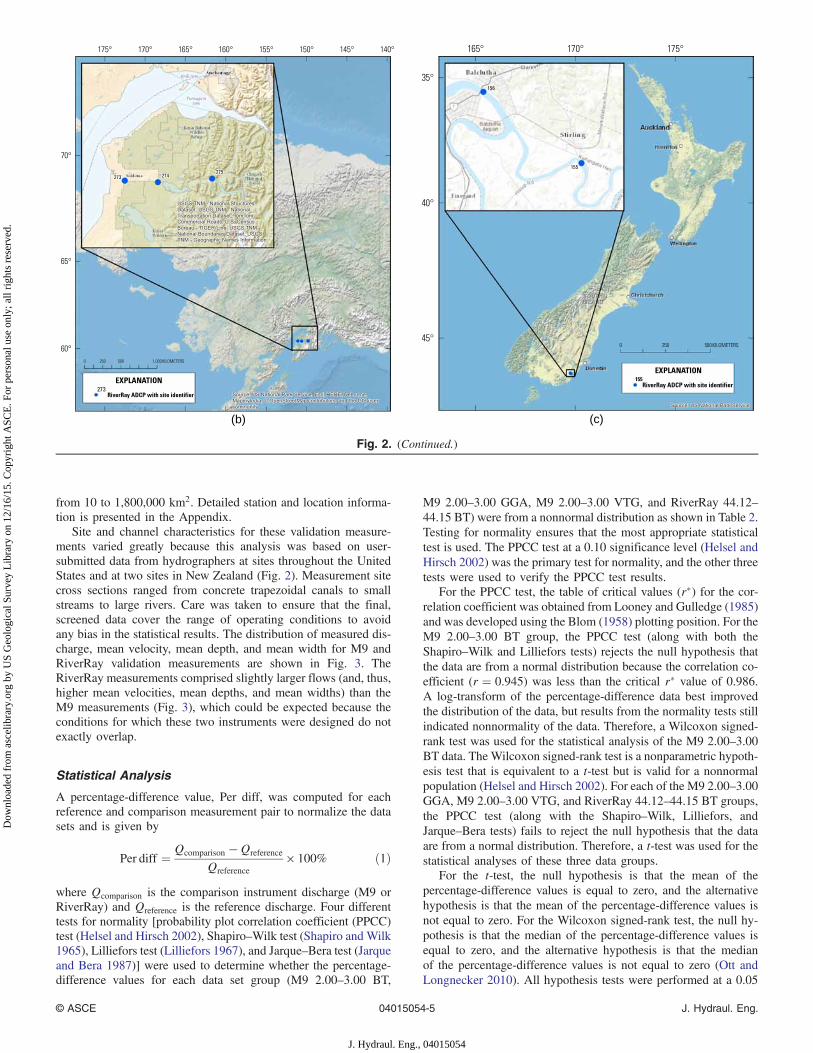
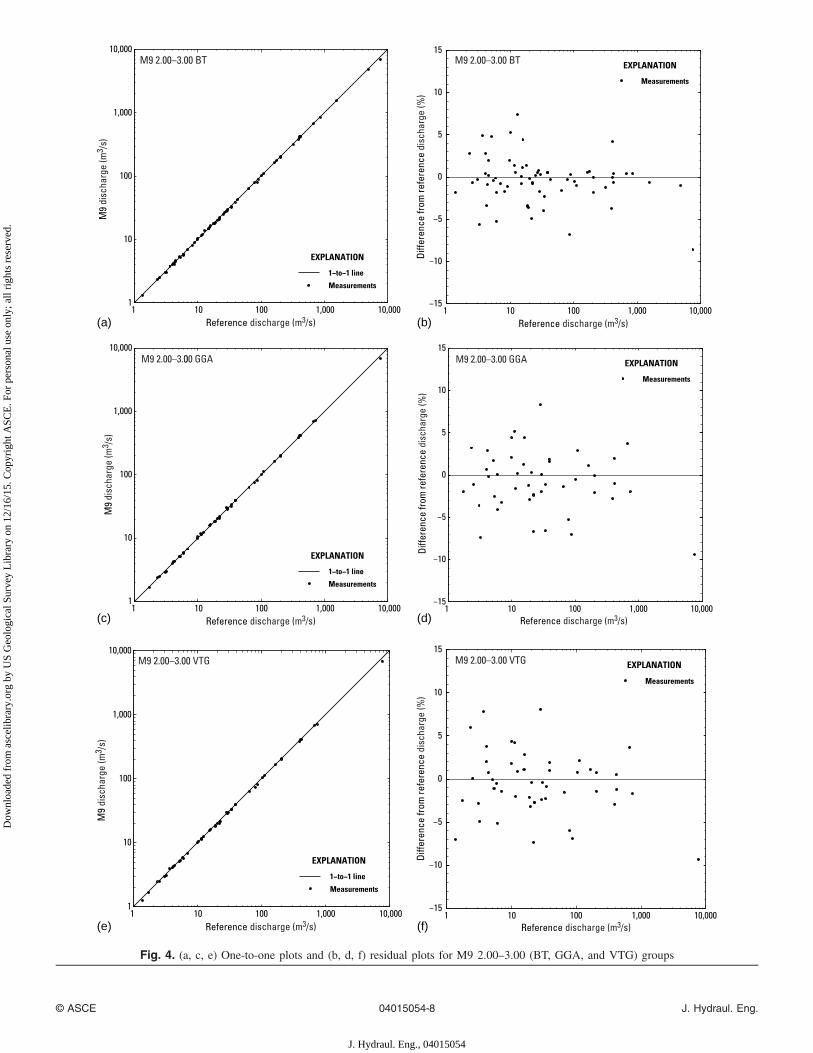
Selected plots used in exploratory data analysis for the M9 dataset are shown in Fig. 4. Measured discharge ranges over four ordersof magnitude, and no bias is evident from examination of the one-to-one plots [Figs. 4(a, c, e)]. Residual plots [Figs. 4(b, d, f)] in-dicate that scatter is greater at lower discharges for the BT-, GGA-,and VTG-referenced discharges. Additional plots of percentagedifference versus various hydraulic parameters (stream width, meandepth, and mean velocity) were also examined (Fig. 5). The vari-ability of the residuals shown in Fig. 5 appears to decrease as themean depth increases. This is not altogether unexpected. The per-centage unmeasured area for ADCP discharge measurements willbe greater when the mean depth is shallower. Moreover, as thevelocity decreases, the relative contribution of instrument noise(García et al. 2012) becomes greater. Similarly, as the mean widthof the stream decreases, the unmeasured (estimated) flow near theedges becomes proportionally larger. All of these factors may con-tribute to the increased variability observed for shallower depths(<3 m). No trends between stream width or mean velocity andpercentage differences were evident.
M9 Validation Results
The p-values from the hypothesis tests (on the percentage-difference values) and the median, mean, and standard deviationof the percentage differences between the M9-measured dischargesand the reference discharges are shown in Table 4. A Wilcoxonsigned-rank test was used to analyze the BT data, and a t-testwas used to analyze the GGA and VTG data. Statistical analysesindicate that there is no significant difference between the M9-measured discharges and the reference discharge at the 0.05 signifi-cance level. The mean and median percentage-difference values areall negative but close to zero. The standard deviation of the percent-age differences is smallest for the BT-referenced discharges.
Bootstrapping with 100,000 resamples was performed on themean percentage differences for each data group (BT, GGA, andVTG). The mean percentage difference from the bootstrap distri-bution is the same as the mean percentage difference of the vali-dation data, indicating that the mean of the bootstrap distributionhas no bias as an estimator of the mean of the original sample. The95% confidence intervals for the mean percentage differencesfrom the bootstrap method are shown in Table 5. Graphical analysisof the percentage differences, along with a hypothesis test andbootstrap methods on the percentage differences, indicate that theBT-, GGA-, and VTG-referenced M9 data are not biased relative tothe reference measurements.
Validation of TRDI RiverRay StreamflowMeasurements
RiverRay Validation Measurement Data
Fifty-six RiverRay validation measurements using BT navigationreference with firmware 44.12–44.15 were available for analysis(41 measurements with firmware 44.12, 1 with firmware 44.13, 8with firmware 44.14, and 6 with firmware 44.15). GPS-referenceddata were not collected. Of the 56 RiverRay validation measure-ments, 9 had moving-bed conditions and were corrected with anappropriate moving-bed correction method (Mueller et al. 2013).A summary of the validation streamflow measurements and theflow characteristics for the RiverRay data set can be found in theappendix.
Selected plots used in exploratory data analysis for the availableRiverRay 44.12–44.15 data set are shown in Fig. 6. Measured dis-charge ranges over four orders of magnitude, and no bias is evidentfrom examination of the one-to-one plots [Fig. 6(a)]. A residualplot [Fig. 6(b)] indicates that the percentage-difference values arehomoscedastic with no trends. Additional plots of percentage dif-ference versus various hydraulic parameters (stream width, meandepth, and mean velocity) are shown in Fig. 7. No trends betweenthese parameters and percentage differences are evident.
RiverRay Validation Results
The p-values from the hypothesis test (on the percentage-differencevalues) and the median, mean, and standard deviation of the per-centage differences between the RiverRay-measured dischargesand the reference discharges are shown in Table 4. A t-test was usedon the RiverRay data. Statistical analysis indicates that there isno significant difference between RiverRay-measured dischargesand the reference discharge at the 0.05 significance level. Thepercentage-difference values and variability are comparable be-tween the RiverRay measurements and the M9 measurements.
Bootstrapping with 100,000 resamples was performed on themean percentage differences. The mean percentage difference from
Table 3. Number of M9 Validation Measurements by Firmware Version
ADCP navigationreference n
M9 ADCP firmware
2.00 2.31 3.00
BT 68 44 6 18GPS-GGA 47 31 3 13GPS-VTG 49 33 3 13
Note: ADCP = acoustic Doppler current profiler; BT = bottom track;GGA = position-based GPS; n = number of measurements; VTG =vector-based GPS.
© ASCE 04015054-7 J. Hydraul. Eng.
J. Hydraul. Eng., 04015054
Dow
nloa
ded
from
asc
elib
rary
.org
by
US
Geo
logi
cal S
urve
y L
ibra
ry o
n 12
/16/
15. C
opyr
ight
ASC
E. F
or p
erso
nal u
se o
nly;
all
righ
ts r
eser
ved.
(a) (b)
(c) (d)
(e) (f)
Fig. 4. (a, c, e) One-to-one plots and (b, d, f) residual plots for M9 2.00–3.00 (BT, GGA, and VTG) groups
© ASCE 04015054-8 J. Hydraul. Eng.
J. Hydraul. Eng., 04015054
Dow
nloa
ded
from
asc
elib
rary
.org
by
US
Geo
logi
cal S
urve
y L
ibra
ry o
n 12
/16/
15. C
opyr
ight
ASC
E. F
or p
erso
nal u
se o
nly;
all
righ
ts r
eser
ved.
the bootstrap distribution is the same as the mean percentage differ-ence of the validation data, indicating that the mean of the bootstrapdistribution has no bias as an estimator of the mean of the originalsample data. The 95% confidence interval for the mean percentagedifference from the bootstrap method is shown in Table 5. Graphi-cal analysis of the percentage differences, along with a hypothesistest and bootstrap methods on the percentage differences, indicate
that the BT-referenced RiverRay data are not biased relative to thereference streamflow measurements.
Discussion
The ADCP validation data sets and statistical analyses indicatethat measurements made with the SonTek M9 ADCP using firm-ware 2.00–3.00 or the TRDI RiverRay ADCP using firmware44.12–44.15 are unbiased. The uncertainty associated with SonTekM9 and TRDI RiverRay ADCP measurements with BT navigationreference using the data and analysis presented here are �5.4 and�6.8%, respectively. The uncertainty associated with SonTek M9ADCP measurements with GGA and VTG navigation referenceare �7.0 and �7.4%, respectively. These uncertainty values areat the 95% confidence level (two standard deviations). Traditionalcurrent-meter measurements performed under ideal conditionswith the two-point method have an uncertainty at two standarddeviations of �5.6–6.1% (Pelletier 1988). Oberg and Mueller(2007) calculated an uncertainty of �4.4% for a set of ADCP mea-surements with measurement durations of 500 to 1,000 s. Sourcesof variability come from the reference instrument and the com-parison instrument, and the results presented here are comparablewith previous studies. Therefore, the M9 and RiverRay ADCPs(with the proper firmware/software) can be used to make stream-flow measurements in the USGS stream-gauging program. How-ever, for the M9 ADCP, some important quality issues must beconsidered in making future measurements in the stream-gaugingprogram.
Of the M9 validation measurements submitted with a BT refer-ence, 15% had serious quality issues and, therefore, were excludedfrom the final analysis. Serious quality issues included measure-ments with invalid BT, invalid moving-bed test, invalid/poor-qualityGPS, improper/invalid compass calibration, poor measurementtechnique, or water velocities outside the ADCP operating range.Because these quality issues were not documented in the data sub-mission, it is likely that many of these issues were not noticed by thehydrographers submitting them. This result indicates that the afore-mentioned quality issues were not readily apparent in the ADCPdata collection and processing software. For example, dependingon how the hydrographer configures the software (e.g., compositetracks and track reference code), it is relatively common for the
(a) (b)
Fig. 5. Residual plots versus mean depth [grouped by (a) mean width and (b) mean velocity]
Table 4. Summary of Test Statistics for M9 2.00–3.00 and RiverRay44.12–44.15 Data Groups
ADCPADCP navigation
reference p-value
Percentage difference
Median MeanStandarddeviation
SonTek M9 BT 0.16 −0.3 −0.4 2.7SonTek M9 GPS-GGA 0.16 −1.0 −0.7 3.5SonTek M9 GPS-VTG 0.29 −0.5 −0.6 3.7TRDI RiverRay BT 0.12 0.3 0.7 3.4
Note: ADCP = acoustic Doppler current profiler; BT = bottom track;GGA = position-based GPS; VTG = vector-based GPS; and negativevalues for the median and mean denote that the comparison streamflowmeasurement (M9 or RiverRay) was less than the reference streamflowmeasurement, and vice versa.
Table 5. Mean Percentage Differences for M9 2.00–3.00 and RiverRay44.12–44.15 Validation Measurements with Corresponding 95% Confi-dence Intervals from Bootstrapping
ADCPADCP navigation
reference
Percentage difference
Samplemean
Bootstrapmean
95% confidenceinterval
SonTek M9 BT −0.4 −0.4 −1.0–0.3SonTek M9 GPS-GGA −0.7 −0.7 −1.8–0.3SonTek M9 GPS-VTG −0.6 −0.6 −1.6–0.5TRDI RiverRay BT 0.7 0.7 −0.2–1.6Note: ADCP = acoustic Doppler current profiler; BT = bottom track;GGA = position-based GPS; VTG = vector-based GPS; and negativevalues for the percentage difference statistics denote that the comparisonstreamflow measurement (M9 or RiverRay) was less than the referencestreamflow measurement, and vice versa.
© ASCE 04015054-9 J. Hydraul. Eng.
J. Hydraul. Eng., 04015054
Dow
nloa
ded
from
asc
elib
rary
.org
by
US
Geo
logi
cal S
urve
y L
ibra
ry o
n 12
/16/
15. C
opyr
ight
ASC
E. F
or p
erso
nal u
se o
nly;
all
righ
ts r
eser
ved.

hydrographer to be unaware of any resulting BT issues. In addition,since the time that these data were collected and analyzed, theUSGS has modified its data-analysis software (loop and sta-tionary moving-bed tests; see Mueller et al. 2013) to help identifypotential invalid moving-bed tests so that the hydrographer couldbe so informed of some of these issues while in the field. If thestreamflow measurements with these serious quality issues had notbeen excluded, statistical analysis indicates that the M9-measureddischarges would be biased low relative to the reference measure-ments. The implication is that M9 BT-referenced streamflow mea-surements may be biased low if these measurements have the sameserious quality issues. In contrast, no RiverRay BT validation mea-surements were excluded from analysis owing to serious qualityissues.
For the reasons described earlier, M9 ADCP users shouldexercise appropriate caution with this instrument in making
streamflow measurements. Preliminary analyses indicate that earlyfirmware/software versions of the M9 (firmware less than 2.00)may have resulted in discharge measurements that were biasedlow, but the statistical analyses of data collected with more recentfirmware versions (2.00–3.00) presented here indicate that the nullhypothesis—that the discharges are unbiased—cannot be rejected.Nevertheless, it is suggested that users of these instruments peri-odically make comparison measurements, review the measurementfiles carefully, and stay current on testing being conducted bythe USGS and other hydrometric entities. One source for suchinformation are the USGS Hydroacoustics Web pages (http://hydroacoustics.usgs.gov/).
At least three factors may have affected the results of this study,including (1) the possibility of regional trends or hydrographerbias, (2) the effect of the reference instrument used, and (3) theassumption that the comparison measurements analyzed are a
(a) (b)
Fig. 6. (a) One-to-one plot; (b) residual plot for RiverRay 44.12–44.15 group
(a) (b)
Fig. 7. Residual plots versus mean depth [grouped by (a) mean width and (b) mean velocity]
© ASCE 04015054-10 J. Hydraul. Eng.
J. Hydraul. Eng., 04015054
Dow
nloa
ded
from
asc
elib
rary
.org
by
US
Geo
logi
cal S
urve
y L
ibra
ry o
n 12
/16/
15. C
opyr
ight
ASC
E. F
or p
erso
nal u
se o
nly;
all
righ
ts r
eser
ved.
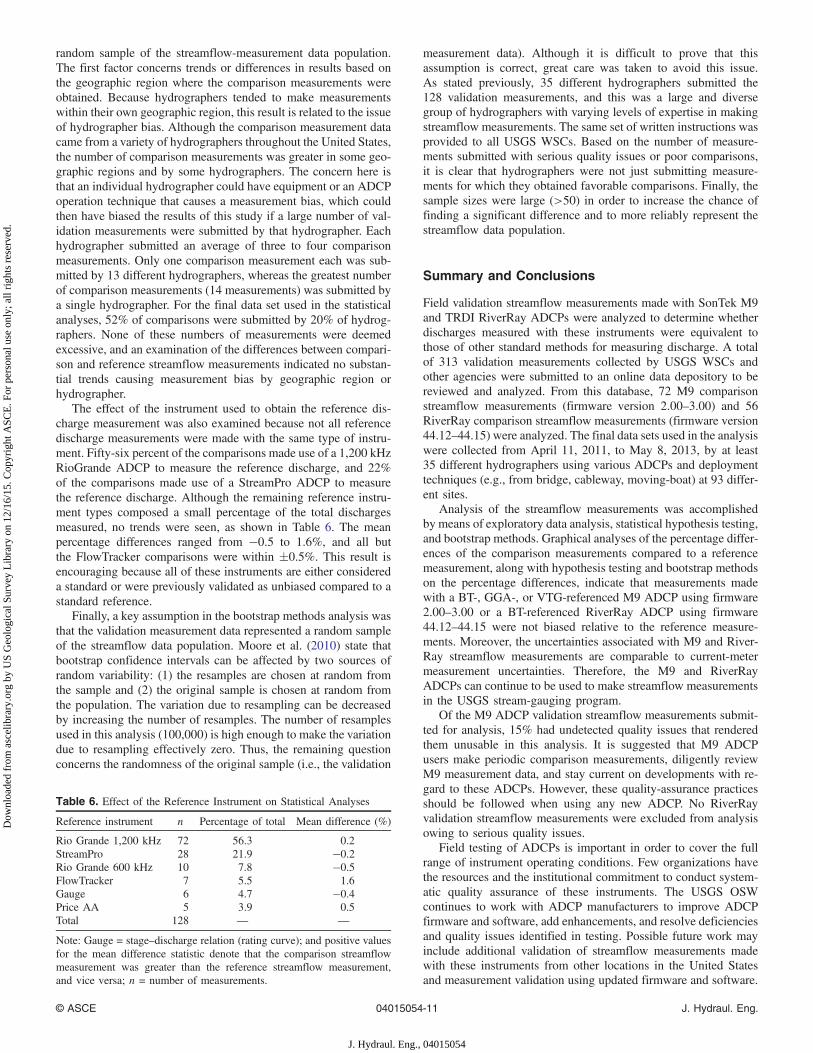
random sample of the streamflow-measurement data population.The first factor concerns trends or differences in results based onthe geographic region where the comparison measurements wereobtained. Because hydrographers tended to make measurementswithin their own geographic region, this result is related to the issueof hydrographer bias. Although the comparison measurement datacame from a variety of hydrographers throughout the United States,the number of comparison measurements was greater in some geo-graphic regions and by some hydrographers. The concern here isthat an individual hydrographer could have equipment or an ADCPoperation technique that causes a measurement bias, which couldthen have biased the results of this study if a large number of val-idation measurements were submitted by that hydrographer. Eachhydrographer submitted an average of three to four comparisonmeasurements. Only one comparison measurement each was sub-mitted by 13 different hydrographers, whereas the greatest numberof comparison measurements (14 measurements) was submitted bya single hydrographer. For the final data set used in the statisticalanalyses, 52% of comparisons were submitted by 20% of hydrog-raphers. None of these numbers of measurements were deemedexcessive, and an examination of the differences between compari-son and reference streamflow measurements indicated no substan-tial trends causing measurement bias by geographic region orhydrographer.
The effect of the instrument used to obtain the reference dis-charge measurement was also examined because not all referencedischarge measurements were made with the same type of instru-ment. Fifty-six percent of the comparisons made use of a 1,200 kHzRioGrande ADCP to measure the reference discharge, and 22%of the comparisons made use of a StreamPro ADCP to measurethe reference discharge. Although the remaining reference instru-ment types composed a small percentage of the total dischargesmeasured, no trends were seen, as shown in Table 6. The meanpercentage differences ranged from −0.5 to 1.6%, and all butthe FlowTracker comparisons were within �0.5%. This result isencouraging because all of these instruments are either considereda standard or were previously validated as unbiased compared to astandard reference.
Finally, a key assumption in the bootstrap methods analysis wasthat the validation measurement data represented a random sampleof the streamflow data population. Moore et al. (2010) state thatbootstrap confidence intervals can be affected by two sources ofrandom variability: (1) the resamples are chosen at random fromthe sample and (2) the original sample is chosen at random fromthe population. The variation due to resampling can be decreasedby increasing the number of resamples. The number of resamplesused in this analysis (100,000) is high enough to make the variationdue to resampling effectively zero. Thus, the remaining questionconcerns the randomness of the original sample (i.e., the validation
measurement data). Although it is difficult to prove that thisassumption is correct, great care was taken to avoid this issue.As stated previously, 35 different hydrographers submitted the128 validation measurements, and this was a large and diversegroup of hydrographers with varying levels of expertise in makingstreamflow measurements. The same set of written instructions wasprovided to all USGS WSCs. Based on the number of measure-ments submitted with serious quality issues or poor comparisons,it is clear that hydrographers were not just submitting measure-ments for which they obtained favorable comparisons. Finally, thesample sizes were large (>50) in order to increase the chance offinding a significant difference and to more reliably represent thestreamflow data population.
Summary and Conclusions
Field validation streamflow measurements made with SonTek M9and TRDI RiverRay ADCPs were analyzed to determine whetherdischarges measured with these instruments were equivalent tothose of other standard methods for measuring discharge. A totalof 313 validation measurements collected by USGS WSCs andother agencies were submitted to an online data depository to bereviewed and analyzed. From this database, 72 M9 comparisonstreamflow measurements (firmware version 2.00–3.00) and 56RiverRay comparison streamflow measurements (firmware version44.12–44.15) were analyzed. The final data sets used in the analysiswere collected from April 11, 2011, to May 8, 2013, by at least35 different hydrographers using various ADCPs and deploymenttechniques (e.g., from bridge, cableway, moving-boat) at 93 differ-ent sites.
Analysis of the streamflow measurements was accomplishedby means of exploratory data analysis, statistical hypothesis testing,and bootstrap methods. Graphical analyses of the percentage differ-ences of the comparison measurements compared to a referencemeasurement, along with hypothesis testing and bootstrap methodson the percentage differences, indicate that measurements madewith a BT-, GGA-, or VTG-referenced M9 ADCP using firmware2.00–3.00 or a BT-referenced RiverRay ADCP using firmware44.12–44.15 were not biased relative to the reference measure-ments. Moreover, the uncertainties associated with M9 and River-Ray streamflow measurements are comparable to current-metermeasurement uncertainties. Therefore, the M9 and RiverRayADCPs can continue to be used to make streamflow measurementsin the USGS stream-gauging program.
Of the M9 ADCP validation streamflow measurements submit-ted for analysis, 15% had undetected quality issues that renderedthem unusable in this analysis. It is suggested that M9 ADCPusers make periodic comparison measurements, diligently reviewM9 measurement data, and stay current on developments with re-gard to these ADCPs. However, these quality-assurance practicesshould be followed when using any new ADCP. No RiverRayvalidation streamflow measurements were excluded from analysisowing to serious quality issues.
Field testing of ADCPs is important in order to cover the fullrange of instrument operating conditions. Few organizations havethe resources and the institutional commitment to conduct system-atic quality assurance of these instruments. The USGS OSWcontinues to work with ADCP manufacturers to improve ADCPfirmware and software, add enhancements, and resolve deficienciesand quality issues identified in testing. Possible future work mayinclude additional validation of streamflow measurements madewith these instruments from other locations in the United Statesand measurement validation using updated firmware and software.
Table 6. Effect of the Reference Instrument on Statistical Analyses
Reference instrument n Percentage of total Mean difference (%)
Rio Grande 1,200 kHz 72 56.3 0.2StreamPro 28 21.9 −0.2Rio Grande 600 kHz 10 7.8 −0.5FlowTracker 7 5.5 1.6Gauge 6 4.7 −0.4Price AA 5 3.9 0.5Total 128 — —
Note: Gauge = stage–discharge relation (rating curve); and positive valuesfor the mean difference statistic denote that the comparison streamflowmeasurement was greater than the reference streamflow measurement,and vice versa; n = number of measurements.
© ASCE 04015054-11 J. Hydraul. Eng.
J. Hydraul. Eng., 04015054
Dow
nloa
ded
from
asc
elib
rary
.org
by
US
Geo
logi
cal S
urve
y L
ibra
ry o
n 12
/16/
15. C
opyr
ight
ASC
E. F
or p
erso
nal u
se o
nly;
all
righ
ts r
eser
ved.
Tab
le7.
Summaryof
M92.00
–3.00ADCPValidationDataSet
Site
identifier
Station
number
Latitu
de(degrees)
Longitude
(degrees)
Drainage
area
(km
2)
Reference
measurement
M9comparisonmeasurement
Measurementcharacteristics
Instrument
type
Freq
(kHz)
Firm
ware
Q(m
3=s)
BTQ
(m3=s)
Perdiff
(%)
GGA
Q(m
3=s)
Perdiff
(%)
VTG
Q(m
3=s)
Perdiff
(%)
Duration
(s)
Width
(m)
Mean
depth(m
)Q/Area
(m=s)
302
14314500
43.244
−112.286
108
PriceAA
——
1.4
1.3
−1.8
——
1.3
−7.0
828
8.5
0.6
0.26
261
06349280
46.699
−100.291
—Rio
Grande
1,200
10.16
1.7
——
1.7
−2.0
1.7
−2.5
814
16.8
1.1
0.10
181
05055300
47.908
−99.416
4,302
Flow
Tracker
—3.70
2.3
2.4
2.8
2.4
3.2
2.4
6.0
1,235
11.0
0.6
0.38
281
09522900
32.618
−114.621
—Stream
Pro
2,000
31.11
2.5
2.5
−0.7
2.5
−1.1
2.5
0.1
969
5.6
0.9
0.52
250
05120000
48.160
−100.729
29,267
Flow
Tracker
—3.70
3.0
3.0
−0.3
2.9
−3.6
2.9
−2.8
987
20.7
0.4
0.34
253
05123400
48.589
−100.442
3,004
Flow
Tracker
—3.70
3.2
3.0
−5.6
3.0
−7.4
3.1
−4.9
957
8.2
0.6
0.65
278
10351600
39.585
−119.440
4,341
Stream
Pro
2,000
31.11
3.6
3.8
4.9
——
3.9
7.8
800
25.1
0.8
0.19
252
06349500
46.794
−100.657
4,351
Rio
Grande
1,200
10.16
4.0
4.0
0.4
4.0
0.7
4.1
2.0
863
9.8
1.4
0.29
282
10351700
39.777
−119.338
4,732
Stream
Pro
2,000
31.11
4.1
4.2
2.8
4.2
2.9
4.3
3.8
1,547
35.0
0.7
0.16
268
02243000
29.509
−81.946
2,898
Rio
Grande
1,200
10.16
4.2
4.1
−3.4
——
——
823
10.1
1.2
0.34
277
10351700
39.777
−119.338
4,732
Gauge
——
4.3
4.3
−0.9
4.3
−0.2
4.4
0.7
1,108
33.3
0.8
0.16
218a
03439000
35.143
−82.825
176
Stream
Pro
2,000
31.11
4.5
4.5
0.2
——
——
968
23.2
0.8
0.26
218b
03439000
35.143
−82.825
176
Stream
Pro
2,000
31.11
4.5
4.6
2.0
——
——
1,042
23.2
0.8
0.26
196
09419800
36.122
−114.904
5,680
Flow
Tracker
—3.50
5.1
5.3
4.8
5.2
1.7
5.1
−0.1
855
18.3
0.7
0.38
264
05053000
46.468
−96.783
5,387
PriceAA
——
5.3
5.3
−0.4
5.2
−2.5
5.3
−1.1
1,011
21.3
1.3
0.23
182
05055400
47.821
−99.276
4,444
Rio
Grande
1,200
10.17
5.9
5.9
−0.1
5.9
0.1
5.8
−0.5
961
16.6
1.4
0.24
387
10351600
39.585
−119.440
4,341
Stream
Pro
2,000
31.12
6.0
5.7
−5.2
5.7
−4.1
5.7
−5.1
1,471
26.1
0.8
0.27
393
10351650
39.632
−119.282
4,475
Stream
Pro
2,000
31.12
6.0
5.9
−1.8
——
——
1,694
31.3
1.0
0.19
251
05122000
48.506
−100.434
31,857
Rio
Grande
1,200
10.16
7.0
6.9
−0.8
6.7
−3.2
6.9
−1.4
876
32.7
2.3
0.09
267
02246000
30.113
−81.907
458
Rio
Grande
1,200
10.16
8.2
8.1
−1.7
——
——
868
12.3
1.3
0.52
178
13305000
44.940
−113.639
2,323
Stream
Pro
2,000
31.12
9.1
9.0
−1.1
——
——
1,133
17.9
0.5
1.11
279
10350000
39.521
−119.700
3,706
Gauge
——
9.8
10.0
2.0
10.0
2.1
10.0
1.8
1,793
31.2
1.2
0.27
184
05057000
47.433
−98.027
16,757
Rio
Grande
1,200
10.17
10.1
10.6
5.3
10.5
4.4
10.5
4.4
946
23.7
1.7
0.25
227
13215000
43.574
−118.210
2,849
Stream
Pro
2,000
31.12
11.2
——
11.8
5.2
11.7
4.2
924
20.3
1.1
0.51
177
13305310
45.133
−113.799
3,149
Stream
Pro
2,000
31.12
11.5
11.7
1.4
11.3
−1.6
11.3
−2.0
988
16.3
0.7
1.08
325
03079000
39.860
−79.229
989
Stream
Pro
2,000
31.12
12.0
12.1
0.6
——
——
839
40.3
0.9
0.34
236
10311100
39.154
−119.807
11Stream
Pro
2,000
31.11
12.3
——
12.3
0.2
12.4
0.9
1,061
36.5
0.8
0.41
331
03117000
40.770
−81.524
1,342
Flow
Tracker
—3.70
12.9
13.9
7.4
——
——
931
34.0
0.8
0.48
198
03007800
41.819
−78.293
642
Stream
Pro
2,000
31.12
14.8
14.8
0.1
——
——
792
34.7
1.4
0.31
321
03007800
41.819
−78.293
642
Stream
Pro
2,000
31.12
14.8
14.7
−0.8
——
——
792
34.7
1.4
0.31
392
10350000
39.521
−119.700
3,706
Stream
Pro
2,000
31.11
15.5
15.7
1.1
15.7
1.3
15.7
1.1
1,277
32.0
1.3
0.37
308
10255550
33.105
−115.664
—PriceAA
——
15.8
16.5
4.4
16.5
4.4
16.3
2.8
1,188
24.4
1.2
0.55
237a
10351600
39.585
−119.440
4,341
Rio
Grande
1,200
10.17
17.8
18.0
1.4
——
——
1,040
27.1
1.2
0.55
235
09527594
33.091
−115.449
—Rio
Grande
1,200
10.17
18.6
17.9
−3.4
18.3
−1.2
18.2
−2.1
858
14.9
2.2
0.57
237b
10351600
39.585
−119.440
4,341
Stream
Pro
2,000
31.12
18.7
18.0
−3.5
——
——
1,040
27.7
1.2
0.56
175
08067070
29.961
−94.810
—Stream
Pro
2,000
31.11
19.2
18.5
−3.6
18.7
−2.9
18.6
−3.2
1,432
27.1
1.8
0.38
388
10347460
39.507
−119.931
2,681
Stream
Pro
2,000
31.12
20.5
20.4
−0.2
20.5
0.3
20.4
−0.4
1,291
33.2
1.4
0.44
259
13014500
43.621
−110.623
1,611
Stream
Pro
2,000
31.11
21.8
20.8
−4.9
20.4
−6.7
20.2
−7.3
791
26.5
0.9
0.92
255
05051500
46.266
−96.598
10,386
Rio
Grande
1,200
10.17
22.3
22.1
−0.7
21.8
−2.3
21.7
−2.7
825
44.3
1.5
0.33
160
05051500
46.266
−96.598
10,386
Rio
Grande
1,200
10.17
22.3
22.1
−0.8
21.8
−2.4
21.7
−2.7
825
44.3
1.5
0.33
283
05092000
48.572
−97.147
90,131
Rio
Grande
1,200
10.17
25.1
25.1
0.2
——
——
955
80.6
3.1
0.10
395
10350340
39.557
−119.552
4,092
Rio
Grande
1,200
10.17
26.8
26.9
0.5
——
——
1,599
42.3
1.5
0.41
159
05054000
46.861
−96.783
17,612
Rio
Grande
1,200
10.16
28.0
28.3
0.8
30.4
8.3
30.3
8.1
788
49.6
3.0
0.19
309
10254730
33.199
−115.596
—PriceAA
——
29.0
28.5
−1.7
28.5
−2.0
28.3
−2.4
1,176
23.5
1.9
0.66
340
11475000
40.218
−123.631
5,457
Rio
Grande
1,200
10.16
29.7
29.8
0.3
29.7
0.1
29.6
−0.4
958
49.0
1.1
0.56
334
02110500
33.913
−78.715
2,875
Rio
Grande
1,200
10.16
33.7
32.4
−4.0
31.5
−6.6
33.0
−2.3
2,114
50.6
2.0
0.32
© ASCE 04015054-12 J. Hydraul. Eng.
J. Hydraul. Eng., 04015054
Dow
nloa
ded
from
asc
elib
rary
.org
by
US
Geo
logi
cal S
urve
y L
ibra
ry o
n 12
/16/
15. C
opyr
ight
ASC
E. F
or p
erso
nal u
se o
nly;
all
righ
ts r
eser
ved.

Tab
le7.
(Contin
ued.)
Site
identifier
Station
number
Latitu
de(degrees)
Longitude
(degrees)
Drainage
area
(km
2)
Reference
measurement
M9comparisonmeasurement
Measurementcharacteristics
Instrument
type
Freq
(kHz)
Firm
ware
Q(m
3=s)
BTQ
(m3=s)
Perdiff
(%)
GGA
Q(m
3=s)
Perdiff
(%)
VTG
Q(m
3=s)
Perdiff
(%)
Duration
(s)
Width
(m)
Mean
depth(m
)Q/Area
(m=s)
293
05092000
48.572
−97.147
90,131
Rio
Grande
1,200
10.17
34.0
33.2
−2.3
33.6
−1.1
33.7
−0.9
786
80.1
3.2
0.13
276a
09522500
32.876
−114.455
—Rio
Grande
1,200
10.17
39.0
39.2
0.5
39.8
1.9
39.7
1.9
871
24.5
2.4
0.66
276b
09522500
32.876
−114.455
—Rio
Grande
1,200
10.17
39.0
39.2
0.6
39.6
1.6
39.4
1.0
769
24.5
2.4
0.66
249
02273230
27.214
−81.202
—Rio
Grande
600
10.17
42.8
42.7
−0.3
——
——
971
33.1
2.7
0.47
265
05211000
47.232
−93.530
8,728
Stream
Pro
2,000
31.12
64.4
63.3
−1.6
63.5
−1.4
63.4
−1.5
948
37.1
1.8
0.94
165
03284230
37.843
−84.441
10,621
Rio
Grande
1,200
10.16
78.8
78.6
−0.3
74.6
−5.3
74.1
−6.0
1,048
78.7
4.0
0.25
254
13013650
43.654
−110.715
4,343
Stream
Pro
2,000
31.11
86.7
80.8
−6.8
80.6
−7.0
80.7
−6.9
755
78.5
0.8
1.37
338
06933500
37.930
−91.977
7,356
Stream
Pro
2,000
31.12
90.0
90.3
0.3
——
——
900
109.3
1.8
0.47
166
03286500
37.829
−84.724
13,043
Rio
Grande
1,200
10.16
102.4
101.9
−0.5
101.8
−0.5
103.2
0.8
1,118
89.0
7.9
0.15
167
03287000
37.926
−84.821
13,214
Rio
Grande
1,200
10.16
110.1
109.0
−1.0
113.3
2.9
112.4
2.1
922
108.6
6.6
0.15
234
09527700
32.704
−115.048
—Rio
Grande
1,200
10.16
163.4
164.4
0.6
165.2
1.1
165.2
1.1
713
39.5
4.0
1.03
263
05092000
48.572
−97.147
90,131
Rio
Grande
1,200
10.17
175.8
176.9
0.7
——
——
1,266
85.1
4.2
0.50
336
13171620
42.946
−115.979
105,671
Rio
Grande
1,200
10.17
202.9
199.2
−1.8
198.6
−2.1
199.9
−1.4
875
95.4
2.3
0.94
335
—43.287
−116.416
105,671
Rio
Grande
1,200
10.17
203.3
203.4
0203.2
−0.1
204.7
0.7
983
84.5
3.4
0.70
266
02321000
29.998
−82.274
495
Rio
Grande
1,200
10.16
321.0
317.1
−1.2
——
——
2,079
246.9
2.2
0.60
270
02320500
29.956
−82.928
20,409
Rio
Grande
1,200
10.16
394.2
379.6
−3.7
383.1
−2.8
382.7
−2.9
873
125.6
5.3
0.59
374
11530500
41.511
−123.978
31,339
Rio
Grande
1,200
10.16
409.6
426.6
4.2
——
——
930
146.9
2.4
1.16
333
03371500
38.770
−86.410
10,000
Rio
Grande
1,200
10.17
410.2
410.0
0418.6
2.0
412.1
0.5
941
122.6
4.0
0.84
288
—46.506
−84.346
—Rio
Grande
600
10.17
422.3
419.6
−0.6
417.9
−1.0
417.4
−1.2
1,003
103.9
3.4
1.18
269
02320000
30.100
−83.172
18,855
Rio
Grande
1,200
10.16
423.9
425.8
0.4
——
——
823
107.0
5.0
0.79
289
—46.498
−84.332
—Rio
Grande
600
10.17
669.6
672.5
0.4
694.4
3.7
694.3
3.7
425
430.5
6.1
0.26
256
06342500
46.814
−100.821
482,771
Rio
Grande
1,200
10.16
731.5
——
716.9
−2.0
719.3
−1.7
599
203.9
3.6
1.01
330
12308000
48.701
−116.197
—Rio
Grande
1,200
10.17
855.6
859.3
0.4
——
——
968
131.3
5.2
1.25
230
06935965
38.789
−90.471
1,357,147
Rio
Grande
1,200
10.16
1553.3
1544.4
−0.6
——
——
2,649
355.3
4.9
0.89
233
07010000
38.629
−90.180
1,805,213
Rio
Grande
1,200
10.16
4899.2
4851.0
−1.0
——
——
886
511.8
8.2
1.16
225
12472800
46.629
−119.864
248,638
Gauge
——
7617.2
6961.5
−8.6
6898.1
−9.4
6906.3
−9.3
743
379.1
9.9
1.85
Min
——
——
——
—1.4
1.3
−8.6
1.7
−9.4
1.3
−9.3
425
5.6
0.4
0.09
Mean
——
——
——
—287.6
282.8
−0.4
234.6
−0.7
225.3
−0.6
1,040
71.0
2.3
0.53
Max
——
——
——
—7617.2
6961.5
7.4
6898.1
8.3
6906.3
8.1
2,649
511.8
9.9
1.85
Note:—
=datanotavailable;BT=botto
mtrack;
Duration=duratio
nof
M9comparisonstream
flow
measurement;Freq
=frequency;Gauge
=stage-dischargerelatio
n(ratingcurve);G
GA=positio
n-basedGPS
;Latitu
de=decimaldegrees(positive
valueindicatesNorth
andvice
versa);L
ongitude
=decimaldegrees(negativevalueindicatesWestand
vice
versa);M
ax=maxim
um;M
in=minim
um;P
erdiff=percentage
difference
from
referencemeasurement(positiv
evaluemeans
M9stream
flow
measurementw
asgreaterthanthereferencestream
flow
measurement,andvice
versa);Q
=discharge;Q/Area=meanvelocity;S
tatio
nnumber=USG
Sgauging-stationnumber;VTG
=vector-based
GPS
.
© ASCE 04015054-13 J. Hydraul. Eng.
J. Hydraul. Eng., 04015054
Dow
nloa
ded
from
asc
elib
rary
.org
by
US
Geo
logi
cal S
urve
y L
ibra
ry o
n 12
/16/
15. C
opyr
ight
ASC
E. F
or p
erso
nal u
se o
nly;
all
righ
ts r
eser
ved.

Tab
le8.
Summaryof
RiverRay
44.12–44.15ADCPValidationDataSet
Site
identifier
Station
number
Latitu
de(degrees)
Longitude
(degrees)
Drainage
area
(km
2)
Reference
measurement
RiverRay
comparison
measurement
Measurementcharacteristics
Instrumenttype
Freq
(kHz)
Firm
ware
Q(m
3=s)
BTQ
(m3=s)
Perdiff(%
)Duration(s)
Width
(m)
Meandepth(m
)Q/Area(m
=s)
303
05453520
41.715
−91.530
8,068
Rio
Grande
1,200
10.17
4.0
4.0
−0.5
914
79.5
2.4
0.02
217
03439000
35.143
−82.825
176
Stream
Pro
2,000
31.11
4.2
4.1
−2.5
730
20.9
0.9
0.21
381
05455500
41.470
−91.714
1,487
Flow
Tracker
—3.70
5.6
6.1
7.7
811
32.2
0.4
0.41
216b
01064000
43.818
−70.450
1,142
Stream
Pro
2,000
31.12
5.7
5.5
−3.1
1,196
23.0
2.5
0.10
216a
01064000
43.818
−70.450
1,142
Rio
Grande
1,200
10.17
5.9
5.7
−3.1
992
23.5
2.4
0.10
226
01064000
43.818
−70.450
1,142
Rio
Grande
1,200
10.17
7.8
7.7
−1.5
836
20.3
2.8
0.14
382
05487980
41.247
−93.290
862
Flow
Tracker
—3.70
9.5
9.0
−5.8
659
22.4
0.6
0.68
384b
01064000
43.818
−70.450
1,142
Rio
Grande
1,200
10.17
9.6
9.6
−0.2
1,069
21.3
2.3
0.19
384a
01064000
43.818
−70.450
1,142
Rio
Grande
1,200
10.17
9.8
9.8
−0.2
1,040
19.8
2.5
0.20
185
05453520
41.715
−91.530
8,068
Rio
Grande
1,200
10.17
12.4
12.4
−0.5
649
73.7
2.7
0.06
157a
05453520
41.715
−91.530
8,068
Rio
Grande
600
10.17
12.4
12.4
−0.5
649
73.8
2.7
0.06
186
05458300
42.737
−92.470
4,007
Rio
Grande
1,200
10.17
13.8
14.7
6.2
2,406
127.2
1.2
0.09
175b
08067070
29.961
−94.810
—Stream
Pro
2,000
31.11
19.1
20.0
4.5
682
28.3
1.9
0.37
175a
08067070
29.961
−94.810
—Stream
Pro
2,000
31.11
19.2
19.9
3.5
1,326
27.1
1.8
0.38
390
01022500
44.608
−67.935
588
Rio
Grande
1,200
10.17
24.8
26.2
5.4
905
29.6
1.5
0.55
383a
01055500
44.269
−70.230
438
Gauge
——
29.0
29.9
3.0
989
26.4
1.1
1.04
383b
01055500
44.269
−70.230
438
Gauge
——
29.5
30.3
2.8
905
25.8
1.1
1.06
189
05488110
41.361
−92.973
31,934
Rio
Grande
1,200
10.17
30.2
32.2
6.8
749
120.5
2.1
0.12
144
—26.697
−80.807
—Rio
Grande
600
10.17
30.6
31.6
3.4
1,966
43.8
1.6
0.43
215
01054300
44.593
−70.733
337
Stream
Pro
2,000
31.12
31.3
30.9
−1.4
670
25.7
2.0
0.60
323
05465500
41.178
−91.182
32,375
Rio
Grande
1,200
10.17
33.2
33.3
0.3
934
125.7
1.1
0.25
188
05488110
41.361
−92.973
31,934
Rio
Grande
1,200
10.17
40.8
41.8
2.4
1,008
126.2
2.2
0.15
157b
05488110
41.361
−92.973
31,934
Rio
Grande
1,200
10.17
40.9
42.1
3.0
1,008
126.2
2.2
0.15
271
12100490
47.275
−122.207
1,228
PriceAA
——
84.4
86.0
1.9
504
47.5
1.1
1.83
371
04165500
42.596
−82.909
1,901
Rio
Grande
1,200
10.16
90.0
95.8
6.4
850
43.9
2.3
0.91
187
05465500
41.178
−91.182
32,375
Rio
Grande
1,200
10.17
90.0
90.6
0.6
856
169.2
1.6
0.33
220
05465700
41.103
−91.064
32,711
Rio
Grande
1,200
10.17
91.4
96.6
5.7
1,162
154.1
1.4
0.43
389
01021000
45.137
−67.318
3,559
Stream
Pro
2,000
31.12
92.2
97.4
5.6
1,075
78.2
1.7
0.67
373
04165500
42.596
−82.909
1,901
Rio
Grande
1,200
10.16
96.1
97.5
1.4
732
44.3
2.3
0.96
219
05465500
41.178
−91.182
32,375
Rio
Grande
1,200
10.17
96.3
98.0
1.8
886
181.1
1.3
0.42
372
04165500
42.596
−82.909
1,901
Rio
Grande
1,200
12.16
97.5
104.7
7.4
879
44.3
2.3
0.95
242
05330920
44.870
−93.192
43,771
Rio
Grande
1,200
10.17
110.8
108.8
−1.8
1,643
96.1
4.6
0.25
149
01046500
45.052
−69.886
7,032
Rio
Grande
1,200
10.17
117.3
108.1
−7.8
985
97.3
2.6
0.46
190
05465500
41.178
−91.182
32,375
Rio
Grande
1,200
10.17
169.1
167.1
−1.2
1,163
174.3
2.0
0.49
141
04266500
44.235
−74.572
1,867
Rio
Grande
1,200
10.16
192.5
187.7
−2.5
878
63.4
3.4
0.88
155
NIW
A752
−46.255
169.784
21,963
Rio
Grande
1,200
10.16
203.4
202.4
−0.5
933
85.0
2.2
1.10
245
05344490
44.749
−92.804
19,813
Rio
Grande
1,200
10.17
228.4
230.3
0.8
1,637
160.2
7.0
0.20
158b
05344490
44.749
−92.804
19,813
Rio
Grande
1,200
10.17
228.4
229.3
0.4
1,637
160.2
7.0
0.20
192
05420460
41.827
−90.190
221,702
Rio
Grande
600
10.17
234.5
238.5
1.7
879
160.9
3.8
0.38
275
15258000
60.493
−149.808
1,642
Rio
Grande
1,200
10.16
244.4
243.8
−0.3
764
108.5
2.1
1.09
114a
01042500
45.340
−69.962
4,118
Rio
Grande
1,200
10.17
369.4
362.4
−1.9
736
43.2
3.1
2.78
274
15266110
60.467
−150.599
3,124
Rio
Grande
1,200
10.16
383.3
380.7
−0.7
801
121.2
2.2
1.43
273
15266300
60.478
−151.079
5,053
Rio
Grande
1,200
10.16
419.2
434.9
3.7
731
124.5
2.2
1.56
193
05474000
40.754
−91.277
11,168
Rio
Grande
600
10.17
512.3
478.7
−6.6
897
100.0
3.8
1.34
156
NIW
A7520
7−4
6.236
169.746
21,963
Rio
Grande
1,200
10.16
648.1
624.0
−3.7
1,058
169.9
3.1
1.24
114b
01042500
45.340
−69.962
4,118
Rio
Grande
1,200
10.17
760.9
744.9
−2.1
826
123.6
3.4
1.83
© ASCE 04015054-14 J. Hydraul. Eng.
J. Hydraul. Eng., 04015054
Dow
nloa
ded
from
asc
elib
rary
.org
by
US
Geo
logi
cal S
urve
y L
ibra
ry o
n 12
/16/
15. C
opyr
ight
ASC
E. F
or p
erso
nal u
se o
nly;
all
righ
ts r
eser
ved.

Appendix. M9 and RiverRay ADCP Validation DataSets
Collecting a large ADCP validation data set is such a colossaltask that it was deemed important and valuable to make these dataavailable. Tables 7 and 8 show a summary of the location and sta-tion information, the reference and comparison streamflow mea-surements, and the flow characteristics for the M9 2.00–3.00 andRiverRay 44.12–44.15 ADCP validation data sets, respectively.The first column refers to the site identifiers shown in Fig. 2. Thetables are sorted in ascending order by reference streamflow.
Acknowledgments
The USGS OSW provided financial support for the data analysisand reporting. The authors gratefully acknowledge all hydrogra-phers who submitted ADCP streamflow measurement data usedfor validation to the online data depository. Nick Stasulis (USGS)assisted with the processing and review of comparison measure-ments. David Mueller and Mike Rehmel from the USGS providedadvice and independent review for some data sets and statisticalanalyses. Tom Over, Tim Cohn, and Julie Kiang from the USGSare gratefully acknowledged for their review and advice regardingthe statistical analyses. Angel Martin, Jr., Stacey Archfield, andthree anonymous reviewers provided useful comments and sugges-tions for improving the manuscript.
Disclaimer
The use of trade, firm, or product names is for descriptive purposesonly and does not imply endorsement by the U.S. government.
References
Blom, G. (1958). Statistical estimates and transformed beta variables,Wiley, New York, 68–75, 143–146.
Christensen, J. L., and Herrick, L. E. (1982). “Mississippi river test,volume 1.” Final Rep. DCP4400/300 Prepared for the U.S. GeologicalSurvey, AMETEK/Straza Division, El Cajon, CA, A5–A10.
García, C. M., Tarrab, L., Oberg, K., Szupiany, R., and Cantero, M. I.(2012). “Variance of discharge estimates sampled using acousticDoppler current profilers from moving platforms.” J. Hydraul. Eng.,10.1061/(ASCE)HY.1943-7900.0000558, 684–694.
Helsel, D. R., and Hirsch, R. M. (2002). “Statistical methods in waterresources.” Techniques of Water Resources Investigations, U.S.Geological Survey, Reston, VA, 522.
Jarque, C. M., and Bera, A. K. (1987). “A test for normality of observationsand regression residuals.” Int. Stat. Rev., 55(2), 163–172.
Kaplan, E. D. (1996). Understanding GPS: Principles and applications,Artech House, Boston, 554.
Lilliefors, H. W. (1967). “On the Kolmogorov-Smirnov test for normalitywith mean and variance unknown.” J. Am. Stat. Assoc., 62(318),399–402.
Looney, S. W., and Gulledge, T. R. (1985). “Use of the correlationcoefficient with normal probability plots.” Am. Stat., 39(1), 75–79.
MATLAB version 8.1 [Computer software]. MathWorks, Natick, MA.Moore, D. S., McCabe, G. P., and Craig, B. A. (2010). Introduction to the
practice of statistics, 7th Ed., W. H. Freeman, New York, 694.Morlock, S. E. (1996). “Evaluation of acoustic Doppler current profiler
measurements of river discharge.” Water Resources InvestigationRep. 95-4218, USGS, Reston, VA, 37.
Mueller, D. S. (2002). “Field assessment of acoustic Doppler baseddischarge measurements.” Proc., Hydraulic Measurements and Exper-imental Methods 2002 (CD-ROM), ASCE, Reston, VA, 9.T
able
8.(Contin
ued.)
Site
identifier
Station
number
Latitu
de(degrees)
Longitude
(degrees)
Drainage
area
(km
2)
Reference
measurement
RiverRay
comparison
measurement
Measurementcharacteristics
Instrumenttype
Freq
(kHz)
Firm
ware
Q(m
3=s)
BTQ
(m3=s)
Perdiff(%
)Duration(s)
Width
(m)
Meandepth(m
)Q/Area(m
=s)
116
01049265
44.472
−69.684
13,994
Rio
Grande
600
10.17
847.3
816.5
−3.6
952
217.2
3.5
1.12
158a
05331580
44.746
−92.848
96,088
Rio
Grande
1,200
10.17
869.9
871.5
0.2
785
176.5
8.7
0.57
244
05331580
44.746
−92.848
96,088
Rio
Grande
1,200
10.17
874.7
885.5
1.2
785
176.5
8.7
0.57
243
05331000
44.944
−93.088
95,311
Rio
Grande
1,200
10.17
1353.2
1346.2
−0.5
913
253.5
5.4
0.99
231
06935965
38.789
−90.471
1,357,147
Rio
Grande
1,200
10.16
1538.2
1581.4
2.8
1,263
348.5
5.0
0.88
176
08111500
30.129
−96.188
113,648
Rio
Grande
600
10.17
1596.1
1642.5
2.9
1,035
117.7
8.8
1.55
191
05474500
40.394
−91.374
308,207
Rio
Grande
1,200
10.17
1841.7
1841.6
0.0
1,036
734.5
3.0
0.83
232
07010000
38.629
−90.180
1,805,213
Rio
Grande
1,200
10.16
4885.7
4973.9
1.8
1,355
517.3
8.2
1.16
394
05474500
40.394
−91.374
308,207
Rio
Grande
600
10.17
6333.6
6225.3
−1.7
1,006
741.8
6.7
1.27
224
12472800
46.629
−119.864
248,638
Gauge
——
7688.0
7619.7
−0.9
690
378.3
10.3
1.97
Min
——
——
——
—4.0
4.0
−7.8
504
19.8
0.4
0.02
Mean
——
——
——
—603.9
602.7
0.7
990
133.1
3.2
0.71
Max
——
——
——
—7688.0
7619.7
7.7
2,406
741.8
10.3
2.78
Note:—
=datanotavailable;BT=botto
mtrack;Duration=duratio
nof
RiverRay
comparisonstream
flow
measurement;Freq
=frequency;Gauge
=stage–dischargerelatio
n(ratingcurve);G
GA=positio
n-based
GPS
;Latitu
de=decimal
degrees(positive
valueindicatesnorthandvice
versa);Longitude
=decimal
degrees(negativevalueindicateswestandvice
versa);Max
=maxim
um;Min
=minim
um;Perdiff=
percentage
difference
from
referencemeasurement(positiv
evaluemeans
RiverRay
stream
flow
measurementw
asgreaterthanthereferencestream
flow
measurement,andvice
versa);Q
=discharge;Q/Area=mean
velocity;Stationnumber=USG
Sgauging-stationnumber;VTG
=vector-based
GPS
.
© ASCE 04015054-15 J. Hydraul. Eng.
J. Hydraul. Eng., 04015054
Dow
nloa
ded
from
asc
elib
rary
.org
by
US
Geo
logi
cal S
urve
y L
ibra
ry o
n 12
/16/
15. C
opyr
ight
ASC
E. F
or p
erso
nal u
se o
nly;
all
righ
ts r
eser
ved.
Mueller, D. S., Wagner, C. R., Rehmel, M. S., Oberg, K. A., and Rainville, F.(2013). “Measuring discharge with acoustic Doppler current pro-filers from a moving boat (v. 2.0, December 2013).” Techniques andMethods, USGS, Reston, VA, 95.
National Marine Electronics Association (NMEA). (2002). “Standard forinterfacing marine electronic devices.” NMEA 0183, Severna Park,MD, 88.
Oberg, K. A., Morlock, S. E., and Caldwell, W. S. (2005). “Quality-assurance plan for discharge measurements using acoustic Dopplercurrent profilers.” Scientific Investigations Rep. 2005-5183, USGS,Reston, VA, 35.
Oberg, K. A., and Mueller, D. S. (2007). “Validation of streamflow mea-surements made with acoustic Doppler current profilers.” J. Hydraul.Eng., 10.1061/(ASCE)0733-9429(2007)133:12(1421), 1421–1432.
Ott, R. L., and Longnecker, M. (2010). An introduction to statisticalmethods and data analysis, 6th Ed., Brooks/Cole, Cengage Learning,Belmont, CA, 1273.
Pelletier, P. M. (1988). “Uncertainties in the single determination of riverdischarge: A literature review.” Can. J. Civ. Eng., 15(5), 834–850.
Rantz, S. E., et al. (1982). “Measurement and computation of streamflow.”Water-Supply Paper 2175, USGS, Reston, VA, 631.
Rehmel, M. S. (2006). “Field evaluation of shallow-water acoustic Dopplercurrent profiler discharge measurements.” Proc., World Environmentaland Water Resource Congress 2006, ASCE, Reston, VA, 8.
Shapiro, S. S., and Wilk, M. B. (1965). “An analysis of variance test fornormality (complete samples).” Biometrika, 52(3–4), 591–611.
Simpson, M. R. (2002). “Discharge measurements using a broad-bandacoustic Doppler current profiler.” Open-File Rep. 01-1, USGS, Reston,VA, 123.
Simpson, M. R., and Oltmann, R. N. (1993). “Discharge-measurement sys-tem using an acoustic Doppler current profiler with applications to largerivers and estuaries.”Water-Supply Paper 2395, USGS, Reston, VA, 32.
SonTek. (2012). RiverSurveyor S5/M9 system manual firmware version3.00, SonTek/YSI, San Diego, 152.
Teledyne RD Instruments. (2009). RiverRay ADCP user’s guide, TRDI,San Diego, 28.
Teledyne RD Instruments. (2011a). Acoustic Doppler current profilerprinciples of operation, a practical primer, TRDI, San Diego, 56.
Teledyne RD Instruments. (2011b). WinRiver II user’s guide, TRDI,San Diego, 168.
Teledyne RD Instruments. (2012). RiverRay operation manual, TRDI,San Diego, 142.
© ASCE 04015054-16 J. Hydraul. Eng.
J. Hydraul. Eng., 04015054
Dow
nloa
ded
from
asc
elib
rary
.org
by
US
Geo
logi
cal S
urve
y L
ibra
ry o
n 12
/16/
15. C
opyr
ight
ASC
E. F
or p
erso
nal u
se o
nly;
all
righ
ts r
eser
ved.
Related Documents