PAGE PROOF INSTRUCTIONS AND QUERIES Greetings, and thank you for publishing with SAGE Publications. We have prepared this page proof for your review. Please respond to each of the below queries by digitally marking this PDF and sending the marked PDF back. Please use only the icons shown below for your mark-up, and do not use “sticky notes” or other “pop-up” comments. Please use: Please do NOT use: Help with Digital Mark-up 1. Do you have Adobe Reader? Quick, safe, free download is available at http://get.adobe.com/reader/ 2. To access the recommended tools, please click “Comment” in upper right of Adobe Reader, then “Drawing Markups.” 3. Using tools other than those recommended may cause data loss. 4. Some mark-up examples are shown below. Please note that sending corrections in any form other than the marked-up PDF can significantly delay the processing of your corrections. These proofs is an opportunity to correct any errors that may have been introduced during the the production process not an opportunity for rewriting. Your article has been peer reviewed and accepted, so any substantial rewriting will need to be approved by the journal editor, delaying publication significantly. In addition to requiring journal editor approval, a fee may be charged for extensive rewriting not due to SAGE error or request. are [delete] [italics] , Please assist us by clarifying the following queries: No Query Journal title: Human Factors Article Number: 566454 1 Please confirm that all author information, including names, affiliations, sequence, and contact details, is correct. 2 Please review the entire document for typographical errors, mathematical errors, and any other necessary corrections; check headings, tables, and figures. 3 Please confirm you have reviewed this proof to your satisfaction and understand this is your final opportunity for review prior to publication. 4 In the sentence beginning “Our model imposed a penalty…,” citation for Sheridan, 1970, is missing a corresponding reference. Please provide complete reference details. 5 In the same sentence, citation for Woods, 1984, is missing a corresponding reference. Please provide complete reference details. 6 In the sentence beginning “Importantly, the distinction…,” which is the correct year for Morrow, Wickens, & North: 2005, as indicated in the text citation, or 2006, as indicated in the reference list? 7 Jamieson, G.A. & Vicente, K.J. (2005). This reference is not cited. Please indicate where text citation should appear, or allow us to remove the reference. 8 Li, H., Sarter, N., Wickens, C. & Sebok, A. (2013). This reference is not cited. Please indicate where text citation should appear, or allow us to remove the reference. 566454HFS

Welcome message from author
This document is posted to help you gain knowledge. Please leave a comment to let me know what you think about it! Share it to your friends and learn new things together.
Transcript
PA G E P R O O F I N S T R U C T I O N S A N D Q U E R I E S
Greetings, and thank you for publishing with SAGE Publications. We have prepared this page proof for your review.
Please respond to each of the below queries by digitally marking this PDF and sending the marked PDF back.
Please use only the icons shown below for your mark-up, and do not use “sticky notes” or other “pop-up” comments.
Please use: Please do NOT use:
Help with Digital Mark-up
1. Do you have Adobe Reader? Quick, safe, free download is available at http://get.adobe.com/reader/2. To access the recommended tools, please click “Comment” in upper right of Adobe Reader, then
“Drawing Markups.”3. Using tools other than those recommended may cause data loss.4. Some mark-up examples are shown below.
Please note that sending corrections in any form other than the marked-up PDF can significantly delay the processing of your corrections.
These proofs is an opportunity to correct any errors that may have been introduced during thethe production process not an opportunity for rewriting. Your article has been peer reviewed andaccepted, so any substantial rewriting will need to be approved by the journal editor, delayingpublication significantly. In addition to requiring journal editor approval, a fee may becharged for extensive rewriting not due to SAGE error or request.
are [delete]
[italics]
,
Please assist us by clarifying the following queries:
No Query
Journal title: Human Factors
Article Number: 566454
1 Please confirm that all author information, including names, affiliations, sequence, and contact details, is correct.
2 Please review the entire document for typographical errors, mathematical errors, and any other necessary corrections; check headings, tables, and figures.
3 Please confirm you have reviewed this proof to your satisfaction and understand this is your final opportunity for review prior to publication.
4 In the sentence beginning “Our model imposed a penalty…,” citation for Sheridan, 1970, is missing a corresponding reference. Please provide complete reference details.
5 In the same sentence, citation for Woods, 1984, is missing a corresponding reference. Please provide complete reference details.
6 In the sentence beginning “Importantly, the distinction…,” which is the correct year for Morrow, Wickens, & North: 2005, as indicated in the text citation, or 2006, as indicated in the reference list?
7 Jamieson, G.A. & Vicente, K.J. (2005). This reference is not cited. Please indicate where text citation should appear, or allow us to remove the reference.
8 Li, H., Sarter, N., Wickens, C. & Sebok, A. (2013). This reference is not cited. Please indicate where text citation should appear, or allow us to remove the reference.
566454 HFS
cwickens
Inserted Text

9 Sebok, A., Wickens, C. D., Sarter, N., et al. (2013). Please provide all author names for this reference.
10 Wickens, C. D. (2002). This reference is not cited. Please indicate where text citation should appear, or allow us to remove the reference.
11 Wickens, C.D. & Hollands, J.G. (2000). This reference is not cited. Please indicate where text citation should appear, or allow us to remove the reference.
Objective: The aim of this study was to develop and vali-date a computational model of the automation complacency effect, as operators work on a robotic arm task, supported by three different degrees of automation.
Background: Some computational models of complacency in human–automation interaction exist, but those are formed and validated within the context of fairly simplified monitor-ing failures. This research extends model validation to a much more complex task, so that system designers can establish, without need for human-in-the-loop (HITL) experimentation, merits and shortcomings of different automation degrees.
Method: We developed a realistic simulation of a space-based robotic arm task that could be carried out with three different levels of trajectory visualization and execution auto-mation support. Using this simulation, we performed HITL testing. Complacency was induced via several trials of cor-rectly performing automation and then was assessed on trials when automation failed. Following a cognitive task analysis of the robotic arm operation, we developed a multicomponent model of the robotic operator and his or her reliance on auto-mation, based in part on visual scanning.
Results: The comparison of model predictions with empiri-cal results revealed that the model accurately predicted routine performance and predicted the responses to these failures after complacency developed. However, the scanning models do not account for the entire attention allocation effects of complacency.
Applications: Complacency modeling can provide a use-ful tool for predicting the effects of different types of imper-fect automation. The results from this research suggest that focus should be given to supporting situation awareness in automation development.
Keywords: human–automation interaction, stages and levels of automation, complacency, function allocation, modeling, robotics, space operations, validation
IntroductIonAs operators in many industries deal with
increasingly complex technology, automation is frequently identified as a potential solution. How-ever, as years of experience indicate, automation is not a panacea. It offers the potential both to sig-nificantly improve and to severely impair perfor-mance, particularly in conditions where automa-tion fails or behaves in ways that the operator does not expect or understand (Wiener & Curry, 1989). Further, there is the question of how to implement automation to best support operator performance.
Empirical human-in-the-loop (HITL) studies can identify automation gains and circumstances in which automation failures may compromise performance (e.g., Kaber, Onal, & Endsley, 2000; Li, Wickens, Sarter, & Sebok, 2014), but they require considerable resources. Time, the cost of building functioning prototypes, and recruiting appropriate participants all limit the number of designs and scenarios that can be evaluated with these studies.
A complementary approach to developing automation that effectively supports operator performance is through the use of computational modeling to predict operator performance in dif-ferent automation instantiations. These models can be used to perform “what-if” analyses of dif-ferent designs and identify how the designs are likely to affect operator workload, awareness, and objective performance.
Although numerous examples of computa-tional models of human interaction with complex systems can be found in the literature (see Wick-ens et al., 2013), the number that have explicitly modeled human–automation interaction is much smaller, and those that have received true empiri-cal validation are fewer still (Wickens et al.,
XXX10.1177/0018720814566454Human FactorsPredicting Automation Complacency
Address correspondence to Christopher Wickens, Alion Science and Technology, 4949 Pearl East Circle, Suite 200, Boulder, CO 80301, USA; e-mail: [email protected].
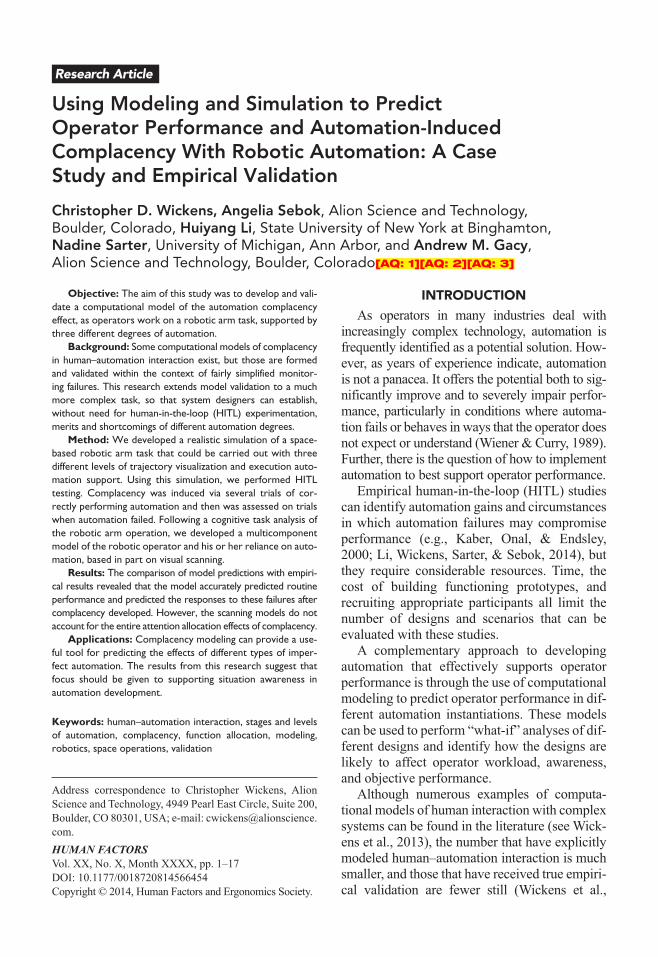
Using Modeling and Simulation to Predict Operator Performance and Automation-Induced Complacency With Robotic Automation: A Case Study and Empirical Validation
Christopher D. Wickens, Angelia Sebok, Alion Science and Technology, Boulder, Colorado, Huiyang Li, State University of New York at Binghamton, Nadine Sarter, University of Michigan, Ann Arbor, and Andrew M. Gacy, Alion Science and Technology, Boulder, Colorado[AQ: 1][AQ: 2][AQ: 3]
HUMAN FACTORSVol. XX, No. X, Month XXXX, pp. 1 –17DOI: 10.1177/0018720814566454Copyright © 2014, Human Factors and Ergonomics Society.
Research Article
2 Month XXXX - Human Factors
2013). Our particular interest in the current research is to develop and validate a computa-tional model of the critical human–automation interaction concept of automation complacency (Parasuraman & Manzey, 2010; Parasuraman, Molloy, & Singh, 1993). Such models do exist (e.g., Bagheri & Jamieson, 2004; Farrell & Lewandowski, 2000; Moray & Inagake, 2000). However, these models have primarily been implemented in the context of simple automated monitoring tasks in which the automation fails to detect deviations, and predictions are made of human monitoring (oversight) performance as a function of automation reliability. In the current research, we extend these efforts by (a) examin-ing performance on more complex and realistic robotic control tasks and (b) examining the influ-ence of the degree of automation (Onnasch, Wickens, Li, & Manzey, 2014; Parasuraman, Sheridan, & Wickens, 2000) on automation-induced complacency.
The application domain for this research—space missions, such as building or repairing the International Space Station—requires the con-trol of a remotely manipulated robotic arm. These robotic arms are challenging to use (Li et al., 2014). The operator monitors numerous arm segments and joints, controlling their move-ment and maintaining sufficient clearance between the arm and obstructions in the environ-ment. An additional challenge is presented by the cameras that provide views of the arm. The cameras are located such that arm movements are frequently incompatible with the direction of movement and control actions. Thus, using these cameras imposes a significant degree of visual-spatial-manual complexity.
Although modeling offers great flexibility and a potentially cost-effective solution to evaluat-ing different design concepts for robotic arm con-trol, the model must accurately predict operator performance. This article describes a research effort in which we developed a human perfor-mance model of an operator controlling a robotic system and performed empirical HITL research both (a) to inform model development and (b) to validate the model predictions regarding differ-ences in automation complacency across differ-ent stages of automation.
Approach: Stages and Levels of Automation
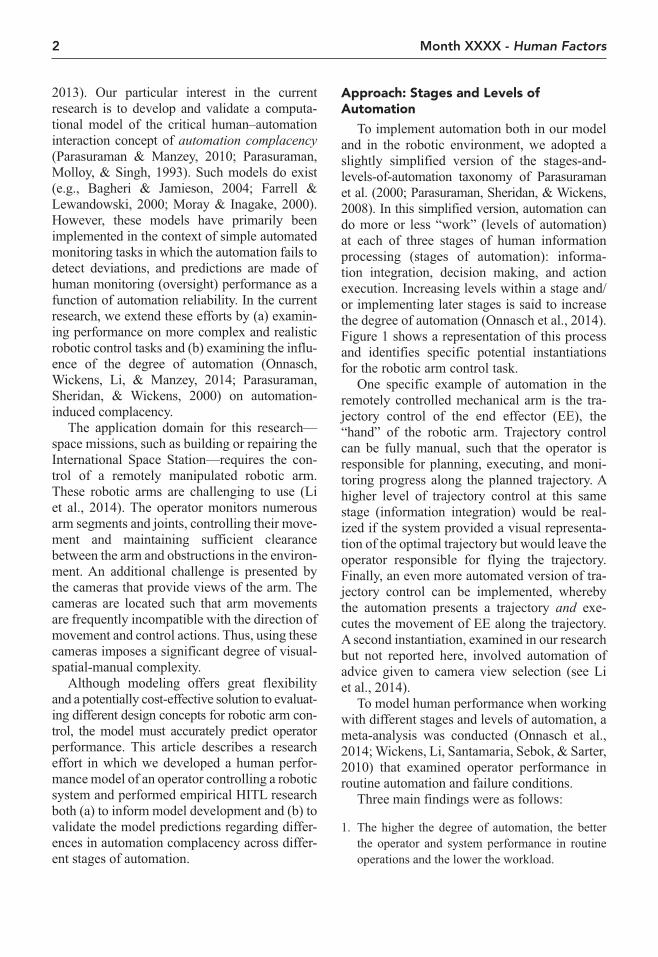
To implement automation both in our model and in the robotic environment, we adopted a slightly simplified version of the stages-and- levels-of-automation taxonomy of Parasuraman et al. (2000; Parasuraman, Sheridan, & Wickens, 2008). In this simplified version, automation can do more or less “work” (levels of automation) at each of three stages of human information processing (stages of automation): informa-tion integration, decision making, and action execution. Increasing levels within a stage and/or implementing later stages is said to increase the degree of automation (Onnasch et al., 2014). Figure 1 shows a representation of this process and identifies specific potential instantiations for the robotic arm control task.
One specific example of automation in the remotely controlled mechanical arm is the tra-jectory control of the end effector (EE), the “hand” of the robotic arm. Trajectory control can be fully manual, such that the operator is responsible for planning, executing, and moni-toring progress along the planned trajectory. A higher level of trajectory control at this same stage (information integration) would be real-ized if the system provided a visual representa-tion of the optimal trajectory but would leave the operator responsible for flying the trajectory. Finally, an even more automated version of tra-jectory control can be implemented, whereby the automation presents a trajectory and exe-cutes the movement of EE along the trajectory. A second instantiation, examined in our research but not reported here, involved automation of advice given to camera view selection (see Li et al., 2014).
To model human performance when working with different stages and levels of automation, a meta-analysis was conducted (Onnasch et al., 2014; Wickens, Li, Santamaria, Sebok, & Sarter, 2010) that examined operator performance in routine automation and failure conditions.
Three main findings were as follows:
1. The higher the degree of automation, the better the operator and system performance in routine operations and the lower the workload.
Predicting AutomAtion comPlAcency 3
2. The higher the degree of automation, the lower the operator situation awareness.
3. Most critically, the higher the degree of auto-mation, the more significant the performance degradation that occurred when the automation unexpectedly failed.
These findings suggest that the major per-formance decrements that occur when automa-tion fails are due to loss of situation awareness or—quite likely—increasing operator compla-cency reflected in a change in monitoring/attention strategies (Metzger & Parasuraman, 2005; Moray & Inagake, 2000; Parasuraman et al., 1993; Parasuraman & Manzey, 2010). If the operator has learned that the automation typically and reliably performs its functions, he or she is less likely to monitor the system dili-gently. Rather, operators adapt to the reliability of the automation and devote cognitive resources to monitoring other aspects of the system (e.g., Duley, Westerman, Molloy, & Parasuraman, 1997; Parasuraman & Manzey, 2010; Wickens, Dixon, Goh, & Hammer, 2005). These find-ings also suggest that a system that adequately supports operator situation awareness, even in highly automated conditions, will potentially result in better overall performance—both in routine and in failure conditions—hence avoid-ing the routine/off-nominal trade-off.
cognitive task Analysis (ctA) of robotics operations
To develop the comprehensive model of an operator controlling a robotic arm, which is nec-essary to model the complacency effects in its automation, we undertook robotics training and conducted interviews with robotics trainers at NASA Johnson Space Center (JSC) in order to generate a CTA. This section presents the results of the CTA, how that analysis was used to invoke different performance submodels, and how these model features were influenced by three trajectory control automation implementations.
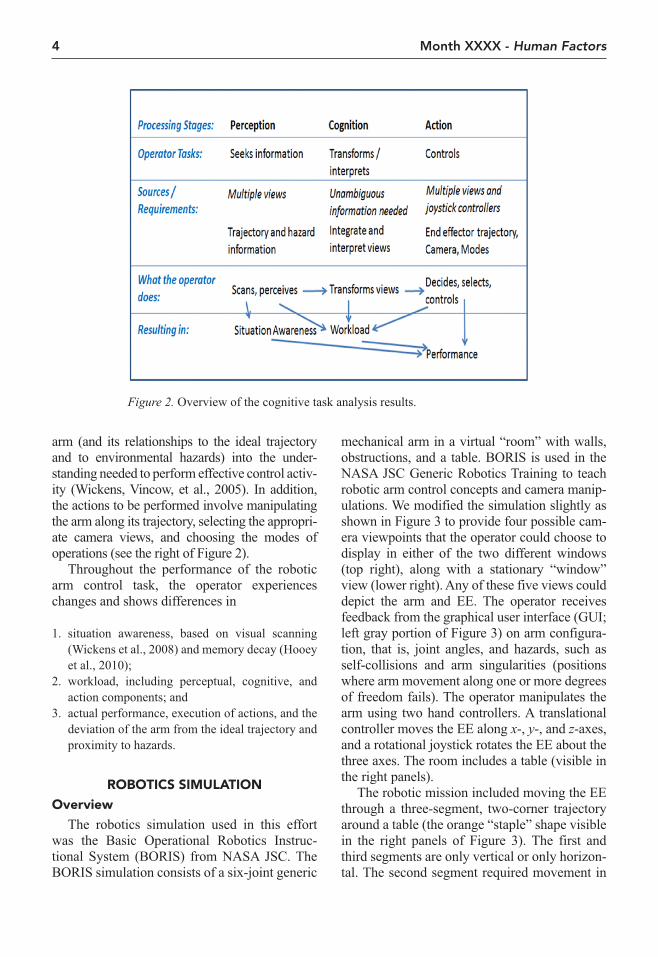
The top of Figure 2 presents three fundamen-tal stages of processing as they are invoked in the robotics task: perception, cognition, and action. Perceptual information is needed about both the arm trajectory and hazards in the work environment, and this information both comes from multiple sources (requiring visual scan-ning) and should result in unambiguous percep-tion, that is, information that is not distorted by perceptual biases inherent in 3-D views. This inherent 3-D ambiguity (e.g., depth perception) is the reason that multiple views are needed (Wickens, Vincow, & Yeh, 2005).
Spatial cognition is required to integrate and interpret the multiple, ambiguous sources of infor-mation. This cognition includes transforming the frame of reference of the perceived state of the
Figure 1. Examples of stages and levels of automation in a robotic arm.
4 Month XXXX - Human Factors
arm (and its relationships to the ideal trajectory and to environmental hazards) into the under-standing needed to perform effective control activ-ity (Wickens, Vincow, et al., 2005). In addition, the actions to be performed involve manipulating the arm along its trajectory, selecting the appropri-ate camera views, and choosing the modes of operations (see the right of Figure 2).
Throughout the performance of the robotic arm control task, the operator experiences changes and shows differences in
1. situation awareness, based on visual scanning (Wickens et al., 2008) and memory decay (Hooey et al., 2010);
2. workload, including perceptual, cognitive, and action components; and
3. actual performance, execution of actions, and the deviation of the arm from the ideal trajectory and proximity to hazards.
robotIcS SImuLAtIonoverview
The robotics simulation used in this effort was the Basic Operational Robotics Instruc-tional System (BORIS) from NASA JSC. The BORIS simulation consists of a six-joint generic
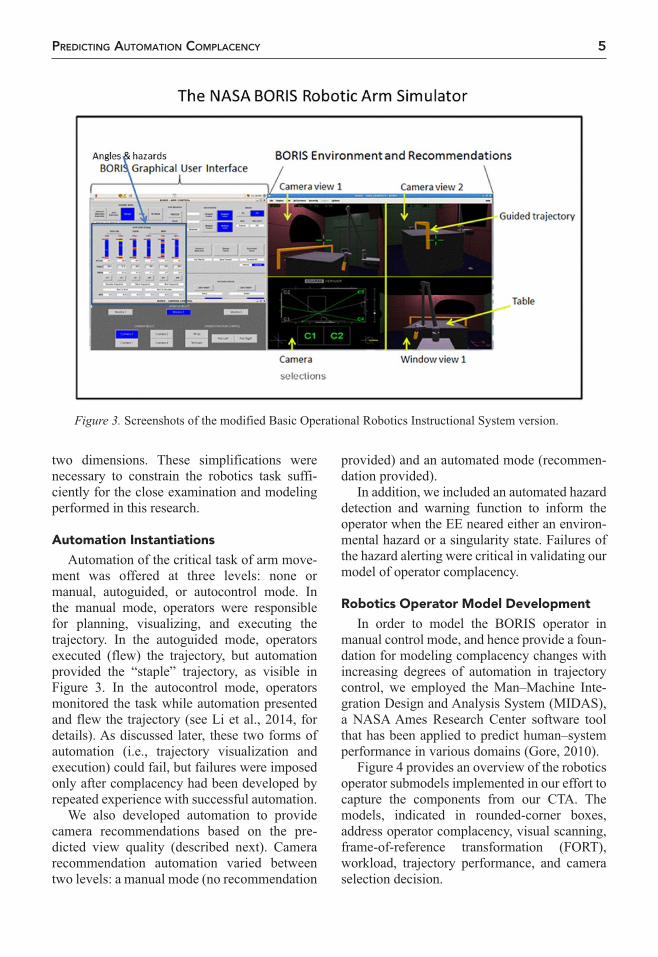
mechanical arm in a virtual “room” with walls, obstructions, and a table. BORIS is used in the NASA JSC Generic Robotics Training to teach robotic arm control concepts and camera manip-ulations. We modified the simulation slightly as shown in Figure 3 to provide four possible cam-era viewpoints that the operator could choose to display in either of the two different windows (top right), along with a stationary “window” view (lower right). Any of these five views could depict the arm and EE. The operator receives feedback from the graphical user interface (GUI; left gray portion of Figure 3) on arm configura-tion, that is, joint angles, and hazards, such as self-collisions and arm singularities (positions where arm movement along one or more degrees of freedom fails). The operator manipulates the arm using two hand controllers. A translational controller moves the EE along x-, y-, and z-axes, and a rotational joystick rotates the EE about the three axes. The room includes a table (visible in the right panels).
The robotic mission included moving the EE through a three-segment, two-corner trajectory around a table (the orange “staple” shape visible in the right panels of Figure 3). The first and third segments are only vertical or only horizon-tal. The second segment required movement in
Figure 2. Overview of the cognitive task analysis results.
Predicting AutomAtion comPlAcency 5
two dimensions. These simplifications were necessary to constrain the robotics task suffi-ciently for the close examination and modeling performed in this research.
Automation InstantiationsAutomation of the critical task of arm move-
ment was offered at three levels: none or manual, autoguided, or autocontrol mode. In the manual mode, operators were responsible for planning, visualizing, and executing the trajectory. In the autoguided mode, operators executed (flew) the trajectory, but automation provided the “staple” trajectory, as visible in Figure 3. In the autocontrol mode, operators monitored the task while automation presented and flew the trajectory (see Li et al., 2014, for details). As discussed later, these two forms of automation (i.e., trajectory visualization and execution) could fail, but failures were imposed only after complacency had been developed by repeated experience with successful automation.
We also developed automation to provide camera recommendations based on the pre-dicted view quality (described next). Camera recommendation automation varied between two levels: a manual mode (no recommendation
provided) and an automated mode (recommen-dation provided).
In addition, we included an automated hazard detection and warning function to inform the operator when the EE neared either an environ-mental hazard or a singularity state. Failures of the hazard alerting were critical in validating our model of operator complacency.
robotics operator model developmentIn order to model the BORIS operator in
manual control mode, and hence provide a foun-dation for modeling complacency changes with increasing degrees of automation in trajectory control, we employed the Man–Machine Inte-gration Design and Analysis System (MIDAS), a NASA Ames Research Center software tool that has been applied to predict human–system performance in various domains (Gore, 2010).
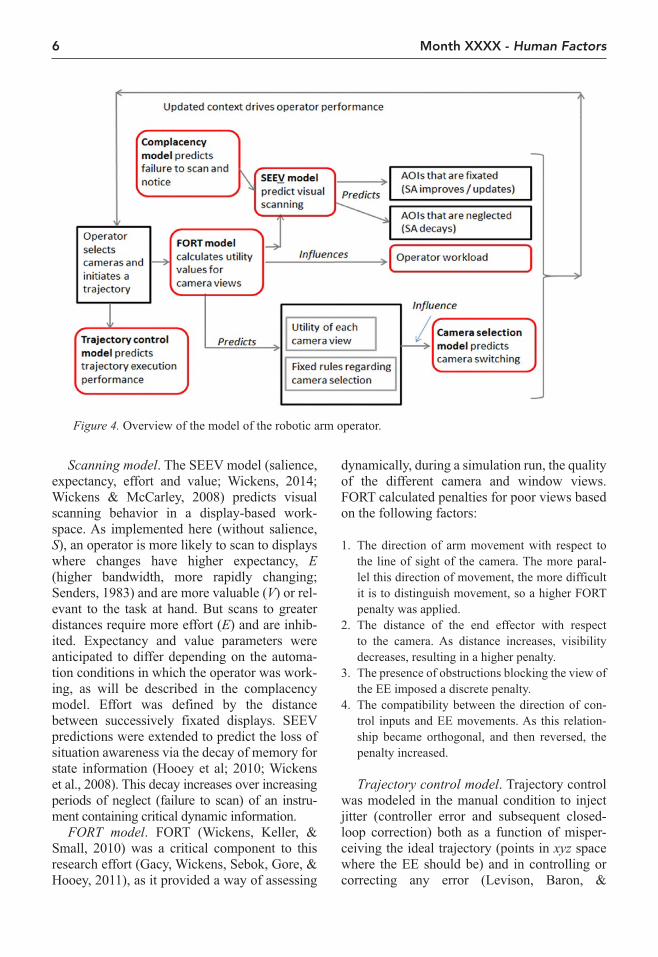
Figure 4 provides an overview of the robotics operator submodels implemented in our effort to capture the components from our CTA. The models, indicated in rounded-corner boxes, address operator complacency, visual scanning, frame-of-reference transformation (FORT), workload, trajectory performance, and camera selection decision.
Figure 3. Screenshots of the modified Basic Operational Robotics Instructional System version.
6 Month XXXX - Human Factors
Scanning model. The SEEV model (salience, expectancy, effort and value; Wickens, 2014; Wickens & McCarley, 2008) predicts visual scanning behavior in a display-based work-space. As implemented here (without salience, S), an operator is more likely to scan to displays where changes have higher expectancy, E (higher bandwidth, more rapidly changing; Senders, 1983) and are more valuable (V) or rel-evant to the task at hand. But scans to greater distances require more effort (E) and are inhib-ited. Expectancy and value parameters were anticipated to differ depending on the automa-tion conditions in which the operator was work-ing, as will be described in the complacency model. Effort was defined by the distance between successively fixated displays. SEEV predictions were extended to predict the loss of situation awareness via the decay of memory for state information (Hooey et al; 2010; Wickens et al., 2008). This decay increases over increasing periods of neglect (failure to scan) of an instru-ment containing critical dynamic information.
FORT model. FORT (Wickens, Keller, & Small, 2010) was a critical component to this research effort (Gacy, Wickens, Sebok, Gore, & Hooey, 2011), as it provided a way of assessing
dynamically, during a simulation run, the quality of the different camera and window views. FORT calculated penalties for poor views based on the following factors:
1. The direction of arm movement with respect to the line of sight of the camera. The more paral-lel this direction of movement, the more difficult it is to distinguish movement, so a higher FORT penalty was applied.
2. The distance of the end effector with respect to the camera. As distance increases, visibility decreases, resulting in a higher penalty.
3. The presence of obstructions blocking the view of the EE imposed a discrete penalty.
4. The compatibility between the direction of con-trol inputs and EE movements. As this relation-ship became orthogonal, and then reversed, the penalty increased.
Trajectory control model. Trajectory control was modeled in the manual condition to inject jitter (controller error and subsequent closed-loop correction) both as a function of misper-ceiving the ideal trajectory (points in xyz space where the EE should be) and in controlling or correcting any error (Levison, Baron, &
Figure 4. Overview of the model of the robotic arm operator.
Predicting AutomAtion comPlAcency 7
Kleinman, 1969). In the autoguided condition, perceptual error was removed because of the explicit visual guidance line, but control error was still present. In autocontrol, both forms of error were removed. The time (speed) of control was modeled to be the speed with which the automation could execute the trajectory.
Workload model. Workload was modeled using a multiple resource approach. The robotics task includes three main components of work-load: visual, cognitive spatial, and fine motor, as shown in Table 1. Operator workload varied depending on the degree of automation, in Table 1, and the FORT values of the camera views, described next.
Visual workload was considered to be high in all three conditions because the robotics task, whether it requires active interaction or monitor-ing, is a dynamic, engaging visual task. Cogni-tive-spatial workload was coded highest in the manual condition because of the need to visual-ize the trajectory. In the autoguided condition, the operator was shown the trajectory but still needed to monitor the EE location, resulting in moderate cognitive-spatial workload. In con-trast, no such interpretations were required of the operator in the autocontrol condition, thereby affording low cognitive-spatial workload. In the manual and autoguided conditions, the operator manually moved the EE across the table, result-ing in high fine-motor workload. In the autocon-trol condition, automation moved the EE, so operator fine-motor workload was low.
FORT also affected workload. When FORT predicted control-response incompatibilities, fine-motor workload was increased in the man-ual and autoguided conditions. When FORT pre-dicted poor-quality views, cognitive-spatial workload increased.
Decision model. The operator decision we modeled was camera selection. The selection was predicted to occur based on current selec-tion being considered sufficiently poor accord-ing to the utility of each view predicted by FORT values. Our model imposed a penalty for switch-ing (Sheridan, 1970[AQ: 4]) based on the loss of visual momentum and need to reorient (Woods, 1984[AQ: 5]), and thus our model assumed that operators would not consistently seek an optimum viewpoint. Instead we pre-dicted that the operator would have to become sufficiently dissatisfied with the current views (higher FORT penalty) before choosing to change the view.
Complacency model. The basis of the com-placency model of human–automation interac-tion is that as an operator becomes increasingly disengaged from the automated processes under his or her control with higher degrees of automa-tion, he or she ceases to monitor it effectively (e.g., Bagheri & Jamieson, 2004; Metzger & Parasuraman, 2005; Moray & Inagaki, 2000; Parasuraman, 1987; Wickens, Dixon, et al., 2005). Qualitative changes in scanning and quantitative changes in percentage dwell times (PDTs) on different regions in the visual field are expected to occur with higher degrees of automation. These changes can be predicted by the SEEV scanning model, because this model is partially driven by operator expectancy that rel-evant events (automation failures) will be seen. This expectancy decreases as the reliability of automation increases (Wickens, Dixon, et al., 2005). These assumptions form the basis of our scan-based complacency model. These assump-tions allowed us (a) to predict scanning behavior during normal trials on the basis of the SEEV model and (b) to infer the manner in which
TAbLE 1: Workload in Different Automation Conditions
Workload Component
Trajectory Automation Condition Visual Cognitive Spatial Fine Motor
Manual High High HighAutoguided High Moderate HighAutocontrol High Low Low
cwickens
Inserted Text
(Wickens, 2002)
cwickens
Inserted Text
and tracking error changes
cwickens
Inserted Text
and quality
8 Month XXXX - Human Factors
automation-induced differences in scanning across the three conditions would modulate automation failure detection ability. The specific implementation of the complacency model is described in more detail later.
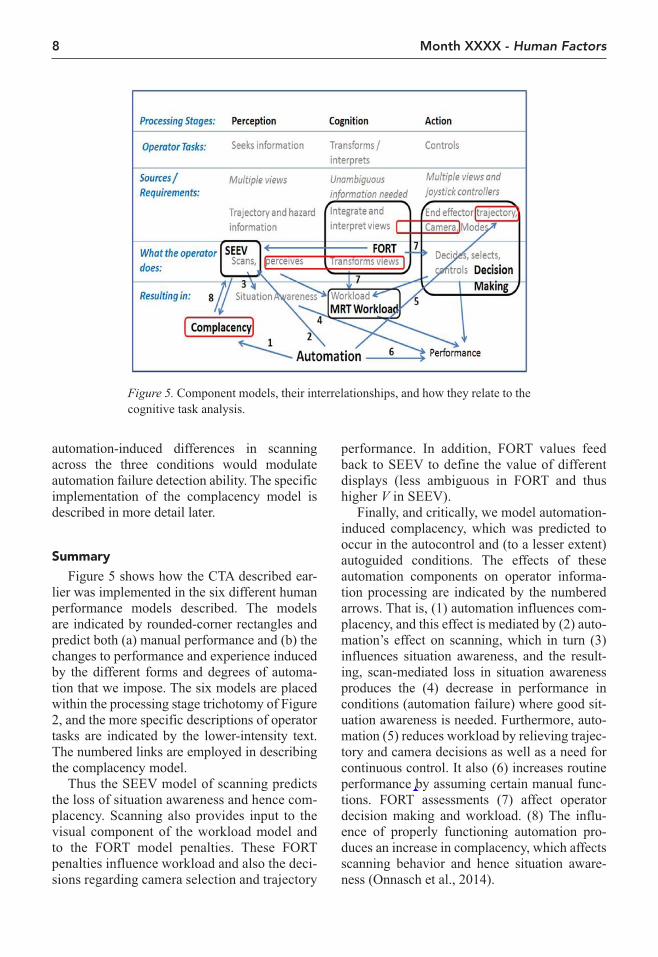
SummaryFigure 5 shows how the CTA described ear-
lier was implemented in the six different human performance models described. The models are indicated by rounded-corner rectangles and predict both (a) manual performance and (b) the changes to performance and experience induced by the different forms and degrees of automa-tion that we impose. The six models are placed within the processing stage trichotomy of Figure 2, and the more specific descriptions of operator tasks are indicated by the lower-intensity text. The numbered links are employed in describing the complacency model.
Thus the SEEV model of scanning predicts the loss of situation awareness and hence com-placency. Scanning also provides input to the visual component of the workload model and to the FORT model penalties. These FORT penalties influence workload and also the deci-sions regarding camera selection and trajectory
performance. In addition, FORT values feed back to SEEV to define the value of different displays (less ambiguous in FORT and thus higher V in SEEV).
Finally, and critically, we model automation-induced complacency, which was predicted to occur in the autocontrol and (to a lesser extent) autoguided conditions. The effects of these automation components on operator informa-tion processing are indicated by the numbered arrows. That is, (1) automation influences com-placency, and this effect is mediated by (2) auto-mation’s effect on scanning, which in turn (3) influences situation awareness, and the result-ing, scan-mediated loss in situation awareness produces the (4) decrease in performance in conditions (automation failure) where good sit-uation awareness is needed. Furthermore, auto-mation (5) reduces workload by relieving trajec-tory and camera decisions as well as a need for continuous control. It also (6) increases routine performance by assuming certain manual func-tions. FORT assessments (7) affect operator decision making and workload. (8) The influ-ence of properly functioning automation pro-duces an increase in complacency, which affects scanning behavior and hence situation aware-ness (Onnasch et al., 2014).
Figure 5. Component models, their interrelationships, and how they relate to the cognitive task analysis.
cwickens
Inserted Text
(reduces tracking error and error bandwidth)
Predicting AutomAtion comPlAcency 9
ExpErImEntAL StudyAn HITL experimental study was conducted
to provide data to parameterize this model and for the validation regarding model predictions of performance in the various conditions of trajectory control and camera automation. The experiment is described in detail in Li et al. (2014), but a brief summary of the most relevant points is described next.
ScenarioThirty-six participants were randomly
assigned to one of three trajectory control condi-tions: manual, autoguided, or autocontrol. Cam-era automation was varied within participants (manual or recommendations provided). Par-ticipants played the role of a payload specialist using the BORIS simulator to execute the three-segment trajectory of the robotic arm across a table obstruction (Figure 3). To perform the
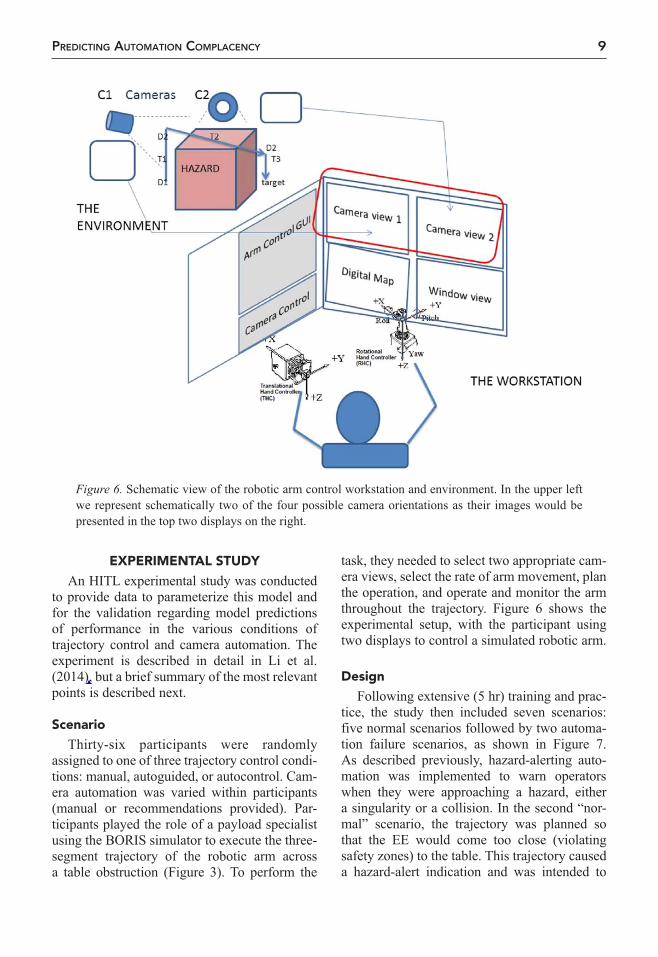
task, they needed to select two appropriate cam-era views, select the rate of arm movement, plan the operation, and operate and monitor the arm throughout the trajectory. Figure 6 shows the experimental setup, with the participant using two displays to control a simulated robotic arm.
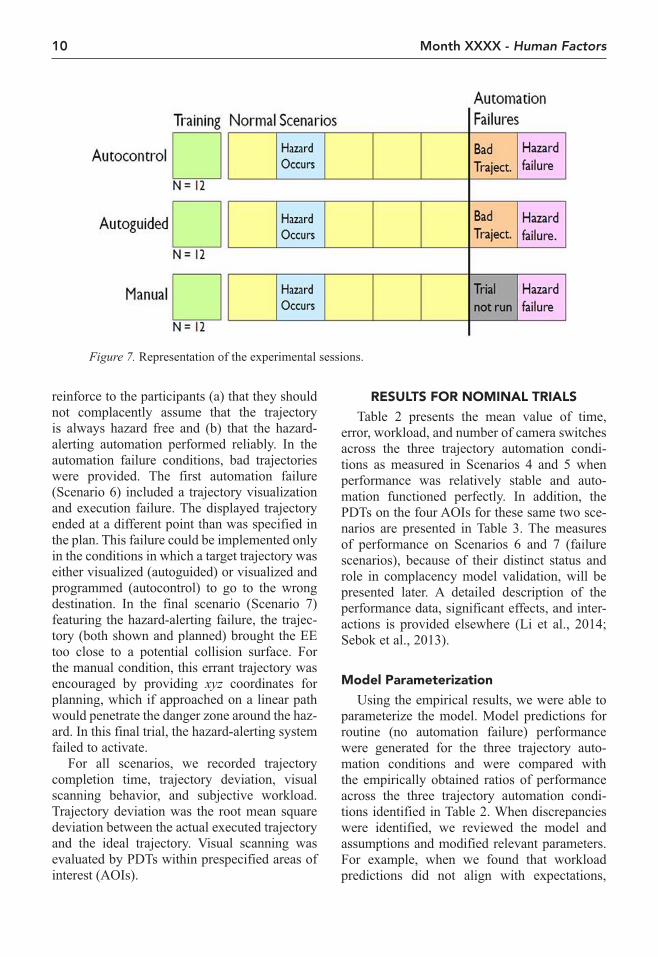
designFollowing extensive (5 hr) training and prac-
tice, the study then included seven scenarios: five normal scenarios followed by two automa-tion failure scenarios, as shown in Figure 7. As described previously, hazard-alerting auto-mation was implemented to warn operators when they were approaching a hazard, either a singularity or a collision. In the second “nor-mal” scenario, the trajectory was planned so that the EE would come too close (violating safety zones) to the table. This trajectory caused a hazard-alert indication and was intended to
Figure 6. Schematic view of the robotic arm control workstation and environment. In the upper left we represent schematically two of the four possible camera orientations as their images would be presented in the top two displays on the right.
cwickens
Cross-Out
cwickens
Inserted Text
10 Month XXXX - Human Factors
reinforce to the participants (a) that they should not complacently assume that the trajectory is always hazard free and (b) that the hazard-alerting automation performed reliably. In the automation failure conditions, bad trajectories were provided. The first automation failure (Scenario 6) included a trajectory visualization and execution failure. The displayed trajectory ended at a different point than was specified in the plan. This failure could be implemented only in the conditions in which a target trajectory was either visualized (autoguided) or visualized and programmed (autocontrol) to go to the wrong destination. In the final scenario (Scenario 7) featuring the hazard-alerting failure, the trajec-tory (both shown and planned) brought the EE too close to a potential collision surface. For the manual condition, this errant trajectory was encouraged by providing xyz coordinates for planning, which if approached on a linear path would penetrate the danger zone around the haz-ard. In this final trial, the hazard-alerting system failed to activate.
For all scenarios, we recorded trajectory completion time, trajectory deviation, visual scanning behavior, and subjective workload. Trajectory deviation was the root mean square deviation between the actual executed trajectory and the ideal trajectory. Visual scanning was evaluated by PDTs within prespecified areas of interest (AOIs).
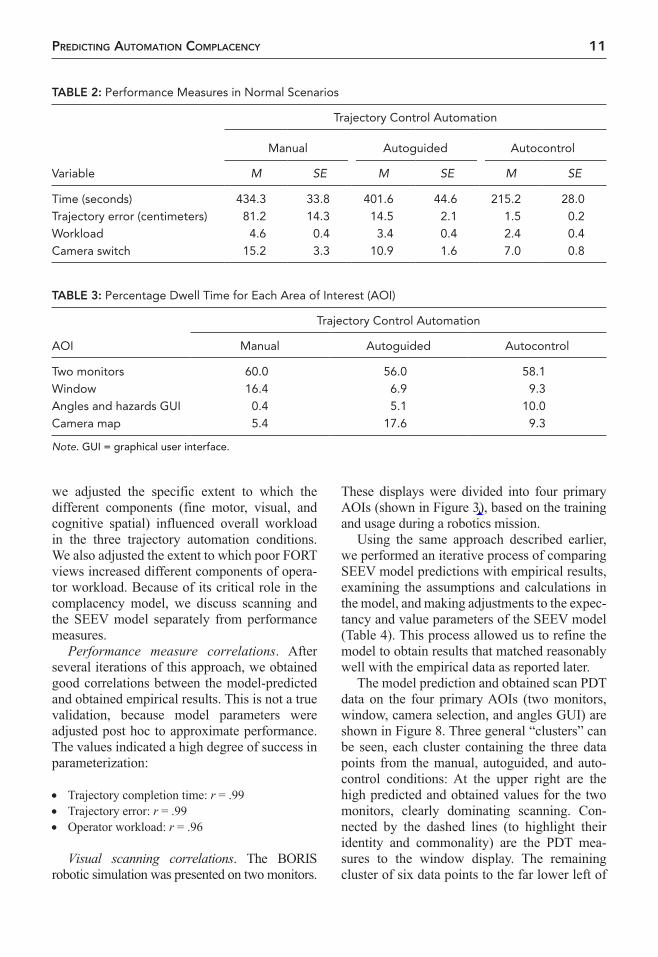
rESuLtS for nomInAL trIALSTable 2 presents the mean value of time,
error, workload, and number of camera switches across the three trajectory automation condi-tions as measured in Scenarios 4 and 5 when performance was relatively stable and auto-mation functioned perfectly. In addition, the PDTs on the four AOIs for these same two sce-narios are presented in Table 3. The measures of performance on Scenarios 6 and 7 (failure scenarios), because of their distinct status and role in complacency model validation, will be presented later. A detailed description of the performance data, significant effects, and inter-actions is provided elsewhere (Li et al., 2014; Sebok et al., 2013).
model parameterizationUsing the empirical results, we were able to
parameterize the model. Model predictions for routine (no automation failure) performance were generated for the three trajectory auto-mation conditions and were compared with the empirically obtained ratios of performance across the three trajectory automation condi-tions identified in Table 2. When discrepancies were identified, we reviewed the model and assumptions and modified relevant parameters. For example, when we found that workload predictions did not align with expectations,
Figure 7. Representation of the experimental sessions.
Predicting AutomAtion comPlAcency 11
we adjusted the specific extent to which the different components (fine motor, visual, and cognitive spatial) influenced overall workload in the three trajectory automation conditions. We also adjusted the extent to which poor FORT views increased different components of opera-tor workload. Because of its critical role in the complacency model, we discuss scanning and the SEEV model separately from performance measures.
Performance measure correlations. After several iterations of this approach, we obtained good correlations between the model-predicted and obtained empirical results. This is not a true validation, because model parameters were adjusted post hoc to approximate performance. The values indicated a high degree of success in parameterization:
• Trajectory completion time: r = .99 • Trajectory error: r = .99 • Operator workload: r = .96
Visual scanning correlations. The BORIS robotic simulation was presented on two monitors.
These displays were divided into four primary AOIs (shown in Figure 3), based on the training and usage during a robotics mission.
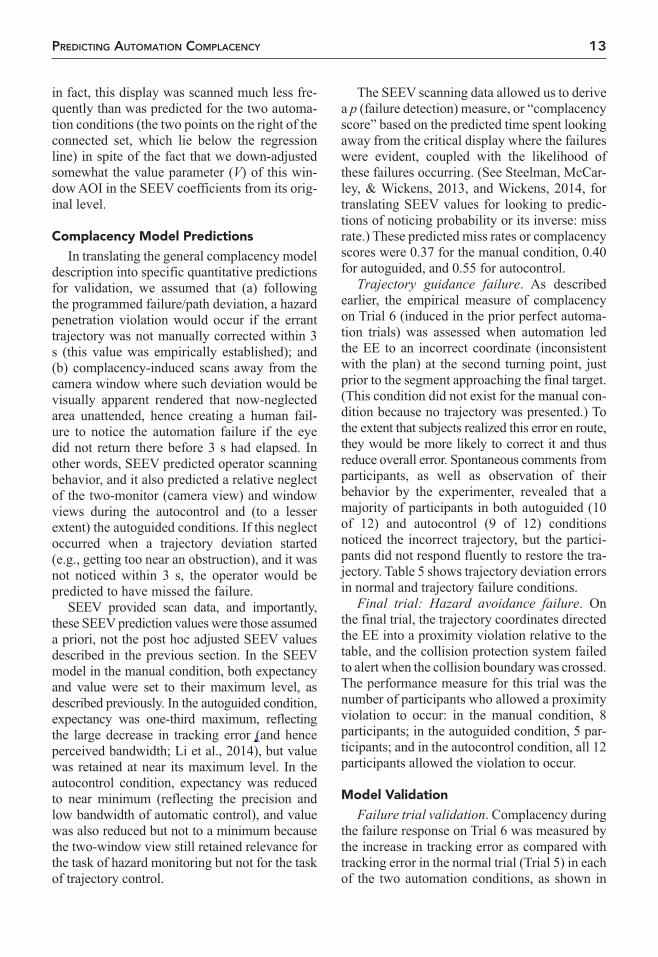
Using the same approach described earlier, we performed an iterative process of comparing SEEV model predictions with empirical results, examining the assumptions and calculations in the model, and making adjustments to the expec-tancy and value parameters of the SEEV model (Table 4). This process allowed us to refine the model to obtain results that matched reasonably well with the empirical data as reported later.
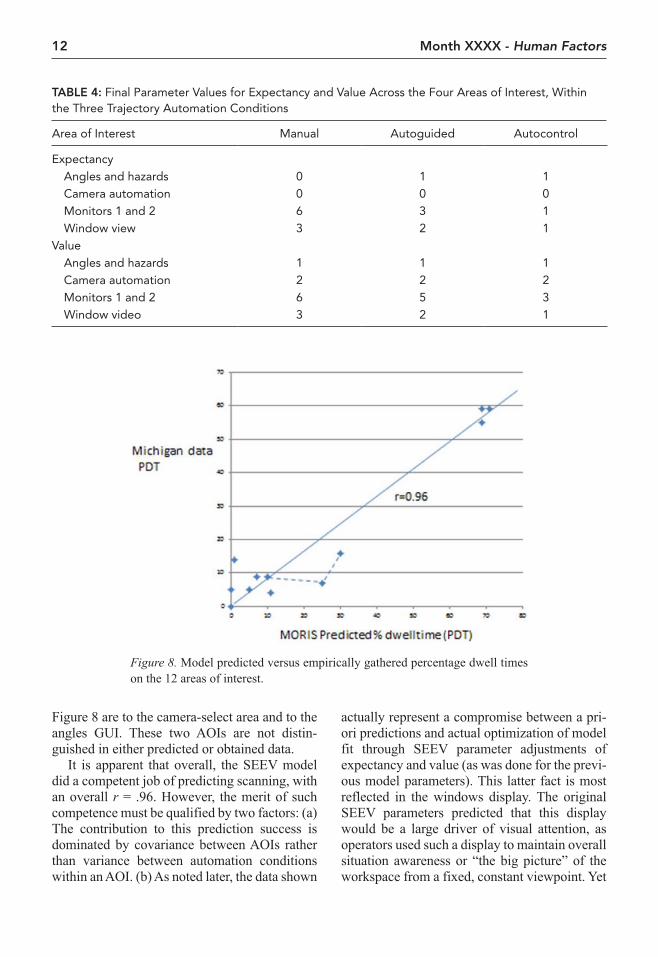
The model prediction and obtained scan PDT data on the four primary AOIs (two monitors, window, camera selection, and angles GUI) are shown in Figure 8. Three general “clusters” can be seen, each cluster containing the three data points from the manual, autoguided, and auto-control conditions: At the upper right are the high predicted and obtained values for the two monitors, clearly dominating scanning. Con-nected by the dashed lines (to highlight their identity and commonality) are the PDT mea-sures to the window display. The remaining cluster of six data points to the far lower left of
TAbLE 2: Performance Measures in Normal Scenarios
Trajectory Control Automation
Manual Autoguided Autocontrol
Variable M SE M SE M SE
Time (seconds) 434.3 33.8 401.6 44.6 215.2 28.0Trajectory error (centimeters) 81.2 14.3 14.5 2.1 1.5 0.2Workload 4.6 0.4 3.4 0.4 2.4 0.4Camera switch 15.2 3.3 10.9 1.6 7.0 0.8
TAbLE 3: Percentage Dwell Time for Each Area of Interest (AOI)
Trajectory Control Automation
AOI Manual Autoguided Autocontrol
Two monitors 60.0 56.0 58.1Window 16.4 6.9 9.3Angles and hazards GUI 0.4 5.1 10.0Camera map 5.4 17.6 9.3
Note. GUI = graphical user interface.
cwickens
Inserted Text
and 6
12 Month XXXX - Human Factors
Figure 8 are to the camera-select area and to the angles GUI. These two AOIs are not distin-guished in either predicted or obtained data.
It is apparent that overall, the SEEV model did a competent job of predicting scanning, with an overall r = .96. However, the merit of such competence must be qualified by two factors: (a) The contribution to this prediction success is dominated by covariance between AOIs rather than variance between automation conditions within an AOI. (b) As noted later, the data shown
actually represent a compromise between a pri-ori predictions and actual optimization of model fit through SEEV parameter adjustments of expectancy and value (as was done for the previ-ous model parameters). This latter fact is most reflected in the windows display. The original SEEV parameters predicted that this display would be a large driver of visual attention, as operators used such a display to maintain overall situation awareness or “the big picture” of the workspace from a fixed, constant viewpoint. Yet
TAbLE 4: Final Parameter Values for Expectancy and Value Across the Four Areas of Interest, Within the Three Trajectory Automation Conditions
Area of Interest Manual Autoguided Autocontrol
Expectancy Angles and hazards 0 1 1 Camera automation 0 0 0 Monitors 1 and 2 6 3 1 Window view 3 2 1Value Angles and hazards 1 1 1 Camera automation 2 2 2 Monitors 1 and 2 6 5 3 Window video 3 2 1
Figure 8. Model predicted versus empirically gathered percentage dwell times on the 12 areas of interest.
Predicting AutomAtion comPlAcency 13
in fact, this display was scanned much less fre-quently than was predicted for the two automa-tion conditions (the two points on the right of the connected set, which lie below the regression line) in spite of the fact that we down-adjusted somewhat the value parameter (V) of this win-dow AOI in the SEEV coefficients from its orig-inal level.
complacency model predictionsIn translating the general complacency model
description into specific quantitative predictions for validation, we assumed that (a) following the programmed failure/path deviation, a hazard penetration violation would occur if the errant trajectory was not manually corrected within 3 s (this value was empirically established); and (b) complacency-induced scans away from the camera window where such deviation would be visually apparent rendered that now-neglected area unattended, hence creating a human fail-ure to notice the automation failure if the eye did not return there before 3 s had elapsed. In other words, SEEV predicted operator scanning behavior, and it also predicted a relative neglect of the two-monitor (camera view) and window views during the autocontrol and (to a lesser extent) the autoguided conditions. If this neglect occurred when a trajectory deviation started (e.g., getting too near an obstruction), and it was not noticed within 3 s, the operator would be predicted to have missed the failure.
SEEV provided scan data, and importantly, these SEEV prediction values were those assumed a priori, not the post hoc adjusted SEEV values described in the previous section. In the SEEV model in the manual condition, both expectancy and value were set to their maximum level, as described previously. In the autoguided condition, expectancy was one-third maximum, reflecting the large decrease in tracking error (and hence perceived bandwidth; Li et al., 2014), but value was retained at near its maximum level. In the autocontrol condition, expectancy was reduced to near minimum (reflecting the precision and low bandwidth of automatic control), and value was also reduced but not to a minimum because the two-window view still retained relevance for the task of hazard monitoring but not for the task of trajectory control.
The SEEV scanning data allowed us to derive a p (failure detection) measure, or “complacency score” based on the predicted time spent looking away from the critical display where the failures were evident, coupled with the likelihood of these failures occurring. (See Steelman, McCar-ley, & Wickens, 2013, and Wickens, 2014, for translating SEEV values for looking to predic-tions of noticing probability or its inverse: miss rate.) These predicted miss rates or complacency scores were 0.37 for the manual condition, 0.40 for autoguided, and 0.55 for autocontrol.
Trajectory guidance failure. As described earlier, the empirical measure of complacency on Trial 6 (induced in the prior perfect automa-tion trials) was assessed when automation led the EE to an incorrect coordinate (inconsistent with the plan) at the second turning point, just prior to the segment approaching the final target. (This condition did not exist for the manual con-dition because no trajectory was presented.) To the extent that subjects realized this error en route, they would be more likely to correct it and thus reduce overall error. Spontaneous comments from participants, as well as observation of their behavior by the experimenter, revealed that a majority of participants in both autoguided (10 of 12) and autocontrol (9 of 12) conditions noticed the incorrect trajectory, but the partici-pants did not respond fluently to restore the tra-jectory. Table 5 shows trajectory deviation errors in normal and trajectory failure conditions.
Final trial: Hazard avoidance failure. On the final trial, the trajectory coordinates directed the EE into a proximity violation relative to the table, and the collision protection system failed to alert when the collision boundary was crossed. The performance measure for this trial was the number of participants who allowed a proximity violation to occur: in the manual condition, 8 participants; in the autoguided condition, 5 par-ticipants; and in the autocontrol condition, all 12 participants allowed the violation to occur.
model ValidationFailure trial validation. Complacency during
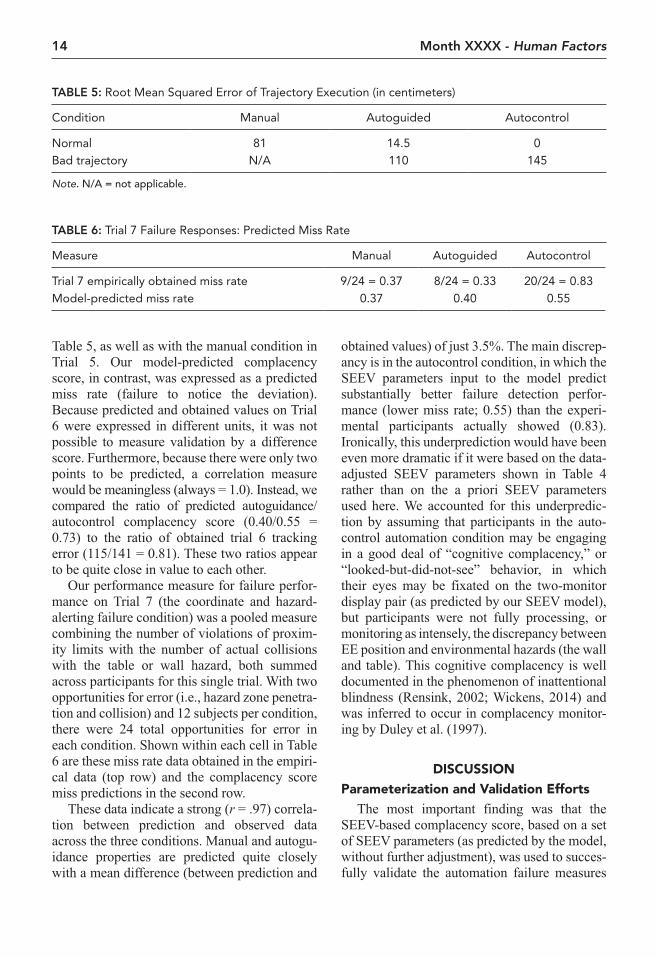
the failure response on Trial 6 was measured by the increase in tracking error as compared with tracking error in the normal trial (Trial 5) in each of the two automation conditions, as shown in
cwickens
Inserted Text
Table 2;
14 Month XXXX - Human Factors
Table 5, as well as with the manual condition in Trial 5. Our model-predicted complacency score, in contrast, was expressed as a predicted miss rate (failure to notice the deviation). Because predicted and obtained values on Trial 6 were expressed in different units, it was not possible to measure validation by a difference score. Furthermore, because there were only two points to be predicted, a correlation measure would be meaningless (always = 1.0). Instead, we compared the ratio of predicted autoguidance/ autocontrol complacency score (0.40/0.55 = 0.73) to the ratio of obtained trial 6 tracking error (115/141 = 0.81). These two ratios appear to be quite close in value to each other.
Our performance measure for failure perfor-mance on Trial 7 (the coordinate and hazard-alerting failure condition) was a pooled measure combining the number of violations of proxim-ity limits with the number of actual collisions with the table or wall hazard, both summed across participants for this single trial. With two opportunities for error (i.e., hazard zone penetra-tion and collision) and 12 subjects per condition, there were 24 total opportunities for error in each condition. Shown within each cell in Table 6 are these miss rate data obtained in the empiri-cal data (top row) and the complacency score miss predictions in the second row.
These data indicate a strong (r = .97) correla-tion between prediction and observed data across the three conditions. Manual and autogu-idance properties are predicted quite closely with a mean difference (between prediction and
obtained values) of just 3.5%. The main discrep-ancy is in the autocontrol condition, in which the SEEV parameters input to the model predict substantially better failure detection perfor-mance (lower miss rate; 0.55) than the experi-mental participants actually showed (0.83). Ironically, this underprediction would have been even more dramatic if it were based on the data-adjusted SEEV parameters shown in Table 4 rather than on the a priori SEEV parameters used here. We accounted for this underpredic-tion by assuming that participants in the auto-control automation condition may be engaging in a good deal of “cognitive complacency,” or “looked-but-did-not-see” behavior, in which their eyes may be fixated on the two-monitor display pair (as predicted by our SEEV model), but participants were not fully processing, or monitoring as intensely, the discrepancy between EE position and environmental hazards (the wall and table). This cognitive complacency is well documented in the phenomenon of inattentional blindness (Rensink, 2002; Wickens, 2014) and was inferred to occur in complacency monitor-ing by Duley et al. (1997).
dIScuSSIonparameterization and Validation Efforts
The most important finding was that the SEEV-based complacency score, based on a set of SEEV parameters (as predicted by the model, without further adjustment), was used to succes-fully validate the automation failure measures
TAbLE 5: Root Mean Squared Error of Trajectory Execution (in centimeters)
Condition Manual Autoguided Autocontrol
Normal 81 14.5 0Bad trajectory N/A 110 145
Note. N/A = not applicable.
TAbLE 6: Trial 7 Failure Responses: Predicted Miss Rate
Measure Manual Autoguided Autocontrol
Trial 7 empirically obtained miss rate 9/24 = 0.37 8/24 = 0.33 20/24 = 0.83Model-predicted miss rate 0.37 0.40 0.55
Predicting AutomAtion comPlAcency 15
in Trials 6 and 7. For the Trial 6 data, the avail-ability of only two data points (autoguided and autocontrol) prevented us from using correlation measures. Even so, ratio data indicated reason-ably good model fits. For Trial 7, the three-point correlation of model predictions with data was high (r = .97), indicating good success in vali-dation.
Importantly, however, in both Trials 6 and 7, the model departed from the data in one impor-tant respect. With both automation failures, the pedicted level of complacency for autocontrol, relative to autoguidance, was considerably less than the obtained level for autocontrol compla-cency. That is, the predictions for autocontrol showed lower tracking error (Trial 6) and miss rate (Trial 7) than was actually obtained.
The most plausible explaantion for this underprediction of complacency is that our model assumes that a scan is also a perception. That is, the “eyeball” equals the “mindball.” But if instead, some of the autocontrol fixations on the two-monitor display represented the classic looked-but-did-not-see phenomonon of inatten-tional blindness (Duley et al., 1997; Rensink, 2002), then it would explain our underpredic-tion. Some of the time, while the eyes were fix-ated on the display, the mind’s attention might have been elsewhere. This situation is particu-larly plausible because our scenario really gave the participants no additional task to perform that might otherwise have directed the scan else-where.
Such an inference is certaintly consistent with the observation that the assigned value (V) parameters of SEEV in Table 4 needed to be adjusted to account for the actual scanning behav-ior, as shown in Figure 8. Human–automation interaction research still awaits a technique for accurately measuring the attention allocation of the mindball.
The fact that we were reasonably successful in parameterizing the model is not surprising, since model parameters were adjusted post hoc to bring the correlations with the empirical data to an overall correlation of about 0.95. Such post hoc adjustments were necessary because we had no prior data available on performance measures in this robotics task. Still, this adjustment pro-cess was not as straightforward as it may seem
because of the interconnections between the dif-ferent components of the operator model (Figure 5). These interconnections meant that changes to one aspect of the model affected multiple model outputs. In particular, as described earlier, work-load predictions are influenced by some of the same components that influence SEEV and tra-jectory error, so changes to the SEEV compo-nents to maximize error fit may simulataneously reduce workload fit.
modeling degree of Automation-Induced complacency
In conclusion, we have provided validation for a scan-mediated model of automation com-placency across three degrees of automation in a complex, highly realistic task. Importantly, the distinction between the two degrees of automa-tion implemented here is fairly ubiquitous in complex systems: in health care, distinguish-ing between automated diagnosis and action or treatment administration (e.g., infusion pumps; Morrow, Wickens, & North, 2005[AQ: 6]); in aviation, the distinction between automated guidance (an instrument landing system) and control (autopilot); in collision prevention, the distinction between warnings and “hard stops” (Luz, Manzey, Modemanne, & Strauss, 2014); and even in statistics, the distinction between confidence intervals and “decision rules.” An important conclusion from that research—and supported by our research—is that automation to facilitate the integration of information can improve nominal performance without caus-ing a problematic response when automation fails, whereas the same cannot be said about automation that supports decision and action, particularly with a higher level of authority. Our complacency model here is validated against data that support this general conclusion.
AcknowLEdgmEntSWe wish to thank our project sponsors at NASA,
Barbara Woolford and Douglas Wong, and many other NASA researchers who expressed an interest in our work. Their guidance, direction, and feedback throughout the project helped shape the final prod-uct. We also wish to thank our fellow researchers at Alion (Mark Brehon, Shelly Scott-Nash), University
cwickens
Cross-Out
cwickens
Inserted Text
2006
16 Month XXXX - Human Factors
of Michigan (Joe Phillips), and San Jose State Uni-versity Research Foundation (Brian Gore and Becky Hooey). This work was funded under NASA Grant NNX09AM81G.
kEy poIntS • We developed a computational information-
processing model of the robotic arm controller, which included component models of scanning, spatial cognition, decision making, workload, and automation-based complacency.
• We ran a human-in-the-loop simulation across three degrees of automation of arm trajectory con-trol: none, perceptual guidance, and full automatic control.
• We validated some components of the model with the simulation data and, in doing so, adjusted parameters to yield a strong model fit, with cor-relations between predicted and obtained scores of about 0.95.
• We validated the model of automation-induced complacency as degree of automation increased examining the effectiveness of return to manual control following an unexpected automation fail-ure. This validation was done without adjusting parameters.
rEfErEncESBagheri, N., & Jamieson, G. A. (2004). Considering subjective
trust and monitoring behavior in assessing automation-induced “complacency.” In D. A. Vicenzi, M. Mouloua, & P. A. Han-cock (Eds.), Human performance, situation awareness, and automation (HPSAA II) (pp. 54–59). Mahwah, NJ: Lawrence Erlbaum.
Duley, J. A., Westerman, S., Molloy, R., & Parasuraman, R. (1997).Effects of display superimposition on monitoring of automation. In Proceedings of the 9th International Sympo-sium on Aviation Psychology (pp. 322–326). Columbus, OH: Association of Aviation Psychology.
Farrell, S., & Lewandowsky, S. (2000). A connectionist model of complacency and adaptive recovery under automation. Journal of Experimental Psychology: Learning, Memory, and Cogni-tion, 26, 395–410.
Gacy, A. M., Wickens, C. D., Sebok, A., Gore, B. F., & Hooey, B. L. (2011). Modeling operator performance and cognition in robotic missions. In Proceedings of the Human Factors and Ergonomics Society 55th Annual Meeting (pp. 861–865). Santa Monica, CA: Human Factors and Ergonomics Society.
Gore, B. F. (2010). Man–machine integration design and analy-sis system (MIDAS) v5: Augmentations, motivations, and directions for aeronautics applications. In P. C. Cacciabu, M. Hjalmdahl, A. Luedtke, & C. Riccioli (Eds.), Human modelling in assisted transportation (pp. 43–54). Heidelberg, Germany: Springer.
Hooey, B. L., Gore, B. G., Wickens, C. D., Scott-Nash, S., Socash, C., Salud, E., & Foyle, D. C. (2010). Modeling pilot situation
awareness. In P. C. Cacciabu, M. Hjalmdahl, A. Luedtke, & C. Riccioli (Eds.), Human modelling in assisted transportation (pp. 207–214). Heidelberg, Germany: Springer.
Jamieson, G. A., & Vicente, K. J. (2005). Designing effective human-automation-plant interfaces: A control-theoretic per-spective. Human Factors, 47, 12–34.[AQ: 7]
Kaber, D. B., Onal, E., & Endsley, M. R. (2000). Design of auto-mation for telerobots and the effect on performance, operator situation awareness, and subjective workload. Human Factors and Ergonomics in Manufacturing, 10, 409–430.
Levison, W., Baron, S., & Kleinman, D. (1969). A model for human controller remnant. IEEE Transactions in Man–Machine Sys-tems, 10, 101–108.
Li, H., Sarter, N., Wickens, C., & Sebok, A. (2013). Supporting human–automation collaboration through dynamic function allocation: The case of space teleoperation. In Proceedings of the Human Factors and Ergonomics Society 57th Annual Meeting (pp. 359–363). Santa Monica, CA: Human Factors and Ergonomics Society.[AQ: 8]
Li, H., Wickens, C., Sarter, N., & Sebok, A. (2014). Stages and levels of automation in support of space teleoperations. Human Factors. Advance online publication.
Luz, M., Manzey, D., Modemanne, S., & Strauss, C. (2014). Less is sometimes more: A comparison of distance control and nav-igated-control concepts of image guided navigation support for surgeons. Ergonomics. Advance online publication. http://dx.doi.org/10.1080/00140139.2014.970588
Metzger, U., & Parasuraman, R. (2005). Automation in future air traf-fic management: Effects of decision aid reliability on controller performance and mental workload. Human Factors, 47, 35–49.
Moray, N., & Inagaki, T. (2000). Attention and complacency. Theo-retical Issues in Ergonomics Science, 1, 354–365.
Morrow, D. G., Wickens, C. D., & North, R. (2006). Reducing and mitigating human error in medicine. In R. S. Nickerson (Ed.), Annual review of human factors and ergonomics (Vol. 1, pp. 254–296). Santa Monica, CA: Human Factors and Ergo-nomics Society.
Onnasch, L., Wickens, C., Li, H., & Manzey, D. (2014). Human performance consequences of stages and levels of automation: An integrated meta-analysis. Human Factors, 56, 476–488.
Parasuraman, R. (1987). Human–computer monitoring. Human Factors, 29, 695–706.
Parasuraman, R., & Manzey, D. (2010). Complacency and bias in human use of automation: A review and attentional synthesis. Human Factors, 52, 381–410.
Parasuraman, R., Molloy, R., & Singh, I. L. (1993). Performance consequences of automation-induced “complacency.” Interna-tional Journal of Aviation Psychology, 3, 1–23.
Parasuraman, R., Sheridan, T. B., & Wickens, C. D. (2000). A model of types and levels of human interaction with automa-tion. IEEE Transactions on Systems, Man, and Cybernetics–Part A: Systems and Humans, 30, 286–297.
Parasuraman, R., Sheridan, T. B., & Wickens, C. D. (2008). Situ-ation awareness, mental workload, and trust in automation: Viable, empirically supported cognitive engineering con-structs. Journal of Cognitive Engineering & Decision Making, 6, 140–160.
Rensink, R. A. (2002). Change detection. Annual Review of Psy-chology, 53, 245–277.
Sebok, A., Wickens, C. D., Sarter, N., et al. (2013). Space human factors and habitability MIDAS-FAST: Development and vali-dation of a tool to support function allocation final report. Submitted to the NASA Human Research Program (Grant No. NNX09AM81G).[AQ: 9]
cwickens
Cross-Out
cwickens
Cross-Out
cwickens
Cross-Out
cwickens
Inserted Text
Li, H., Gore, B., Hooey, B., Gacy, A & Brehon, M.
Predicting AutomAtion comPlAcency 17
Senders, J. W. (1983). Visual sampling processes. Hillsdale, NJ: Lawrence Erlbaum.
Steelman, K. S., McCarley, J. S., & Wickens, C. D. (2013). Great expectations: Top-down attentional control modulates the costs of the clutter and eccentricity on alert detection performance. Journal of Experimental Psychology: Applied, 19, 403–419.
Wickens, C. D. (2002). Multiple resources and performance pre-diction. Theoretical Issues in Ergonomics Science, 3, 159–177.[AQ: 10]
Wickens, C. D. (2014). Noticing events in the visual workplace: The SEEV and NSEEV models. In R. Hoffman & R. Parasura-man (Eds.), Handbook of applied perception (Chap. 37). Cam-bridge, UK: Cambridge University Press.
Wickens, C. D., Dixon, S., Goh, J., & Hammer, B. (2005, March). Pilot dependence on imperfect diagnostic automation in simu-lated UAV flights: An attentional visual scanning analysis. Paper presented at the 13th International Symposium on Avia-tion Psychology, Wright-Patterson AFB, Dayton, OH.
Wickens, C. D., & Hollands, J. G. (2000). Engineering psychology and human performance (3rd ed.). Upper Saddle River, NJ: Pearson.[AQ: 11]
Wickens, C. D., Keller, J., & Small, R (2010). Development of the Frame of Reference Transformation Tool (FORT). In Pro-ceedings of the Human Factors and Ergonomics Society 54th Annual Meeting (pp. 1022–1026). Santa Monica, CA: Human Factors and Ergonomics Society.
Wickens, C. D., Li, H., Santamaria, A., Sebok, A., & Sarter, N. (2010). Stages and levels of automation: An integrated meta-analysis. In Proceedings of the Human Factors and Ergonom-ics Society 54th Annual Meeting (pp. 389–393). Santa Monica, CA: Human Factors and Ergonomics Society.
Wickens, C. D., & McCarley, J. M. (2008). Applied attention the-ory. Boca Raton, FL: CRC Press/Taylor & Francis.
Wickens, C. D., McCarley, J. S., Alexander, A. L., Thomas, L. C., Ambinder, M., & Zheng, S. (2008). Attention-situation aware-ness (A-SA) model of pilot error. In D. Foyle & B. Hooey (Eds.), Human performance models in aviation (pp. 213–242). Boca Raton, FL: Taylor & Francis.
Wickens, C. D., Sebok, A., Keller, J., Peters, S., Small, R., Hutchins, S., & Algarín, L. (2013). Modeling and evaluating pilot performance in NextGen. Washington, DC: NASA.
Wickens, C. D., Vincow, M., & Yeh, M. (2005). Design applica-tions of visual spatial thinking: The importance of frame of
reference. In A. Miyaki & P. Shah (Eds.), Handbook of visual spatial thinking (pp. 383–425). Oxford, UK: Oxford Univer-sity Press.
Wiener, E. L., & Curry, R. E. (1980). Flight-deck automation: Promises and problems. Ergonomics, 23, 995–1011.
Christopher D. Wickens is a professor emeritus of aviation and psychology at the University of Illinois and is currently a senior scientist at Alion Science and Technology, Boulder, Colorado.
Angelia Sebok is a principal human factors engineer and program manager at Alion Science and Technol-ogy. She earned her MS degree in industrial and systems engineering from Virginia Tech in 1991.
Huiyang Li is an assistant professor in the Depart-ment of Systems Science and Industrial Engineering at State University of New York at Binghamton. She received her PhD in industrial and operations engi-neering from the University of Michigan in 2013.
Nadine Sarter is a professor in the Department of Industrial and Operations Engineering, Center for Ergonomics, at the University of Michigan. She received her PhD in industrial and systems engineer-ing from The Ohio State University in 1994.
Andrew M. Gacy is a lead systems engineer at Alion Science and Technology. He earned his PhD in bio-medical sciences from the Mayo Graduate School in 1996.
Date received: May 30, 2014Date accepted: December 1, 2014
cwickens
Inserted Text
Sheridan, T.B. (1970) On how often a supervisor should sample. IEEE Transactions in Systems Science & Cybernetics. SCS-6 pp 140-145
cwickens
Inserted Text
Woods, D. (1984) Visual momentum. International Journal of Man-Machine Studies, 21, 229-244.
cwickens
Cross-Out
Related Documents