Validation of satellite derived snow cover data records with surface networks and m ulti-dataset inter-comparisons Chris Derksen Climate Research Division Environment Canada Thanks to our data providers: Rutgers Global Snow Lab ● National Snow and Ice Data Center ● World Climate Research Programme Working Group on Coupled Modelling ● University of East Anglia – Climatic Research Unit ● NASA Global Modeling and Assimilation Office ● European Centre for Midrange Weather Forecasting

Welcome message from author
This document is posted to help you gain knowledge. Please leave a comment to let me know what you think about it! Share it to your friends and learn new things together.
Transcript
Validation of satellite derived snow cover data records with surface networks and multi-dataset inter-comparisons
Chris DerksenClimate Research DivisionEnvironment Canada Thanks to our data providers:
Rutgers Global Snow Lab ● National Snow and Ice Data Center ● World Climate Research Programme Working Group on Coupled Modelling ● University of East Anglia – Climatic Research Unit ● NASA Global Modeling and Assimilation Office ● European Centre for Midrange Weather Forecasting

Outline
1. Challenges and approaches to validating snow datasets
-point in situ measurements
-gridded dataset inter-comparisons
3. Why quantifying spread in snow products matters

Snow – A Key Climate Variable
• Over the 1979 – 2013 time period, NH June snow extent decreased at a rate of -19.9% per decade (relative to 1981-2010 mean).
• September sea ice extent decreased at-13.0% per decade.
Derksen, C Brown, R (2012) Geophys. Res. Letters (updated)
Snow cover extent (SCE) anomaly time series (with respect to 1988–2007) from the NOAA snow chart CDR. Solid line denotes 5-yr running
mean.
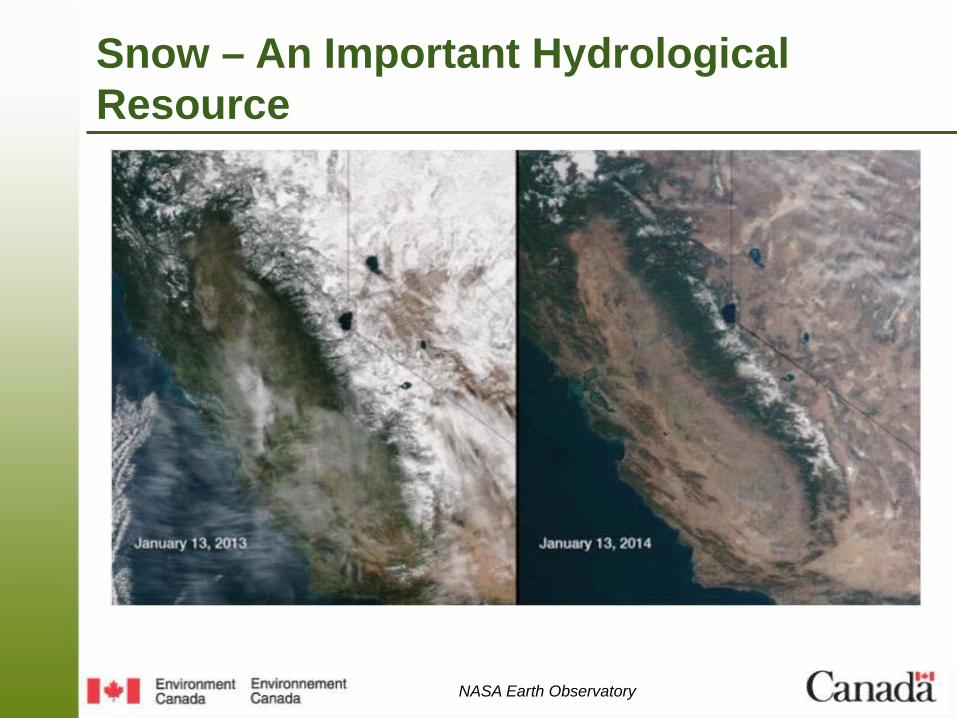
Snow – An Important Hydrological Resource
NASA Earth Observatory
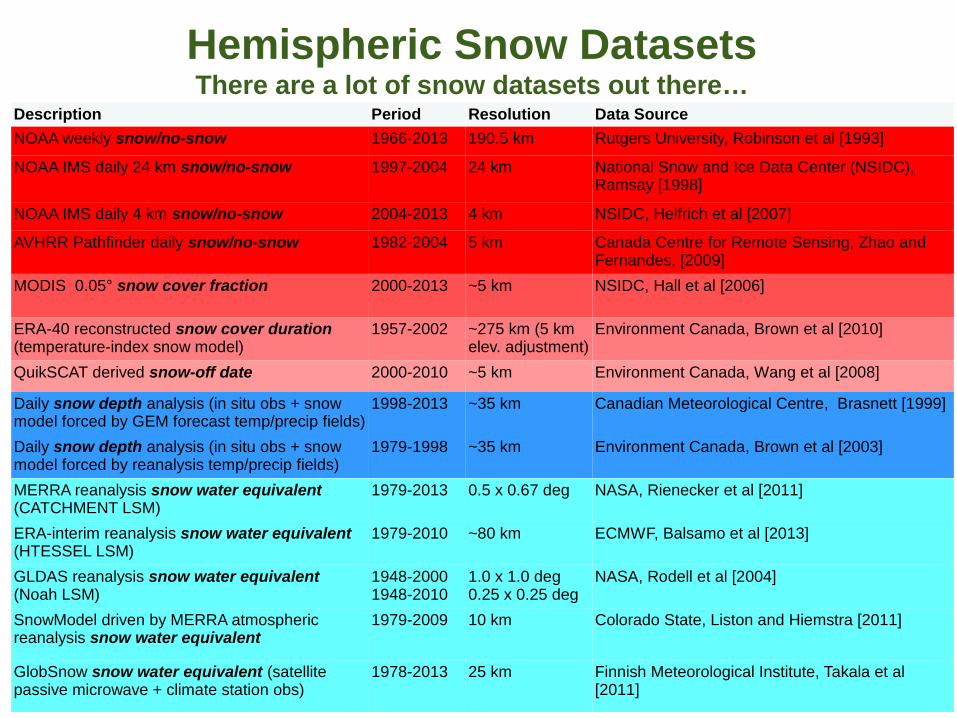
Hemispheric Snow DatasetsThere are a lot of snow datasets out there…
Description Period Resolution Data Source
NOAA weekly snow/no-snow 1966-2013 190.5 km Rutgers University, Robinson et al [1993]
NOAA IMS daily 24 km snow/no-snow 1997-2004 24 km National Snow and Ice Data Center (NSIDC), Ramsay [1998]
NOAA IMS daily 4 km snow/no-snow 2004-2013 4 km NSIDC, Helfrich et al [2007]
AVHRR Pathfinder daily snow/no-snow 1982-2004 5 km Canada Centre for Remote Sensing, Zhao and Fernandes, [2009]
MODIS 0.05° snow cover fraction 2000-2013 ~5 km NSIDC, Hall et al [2006]
ERA-40 reconstructed snow cover duration (temperature-index snow model)
1957-2002 ~275 km (5 km elev. adjustment)
Environment Canada, Brown et al [2010]
QuikSCAT derived snow-off date 2000-2010 ~5 km Environment Canada, Wang et al [2008]
Daily snow depth analysis (in situ obs + snow model forced by GEM forecast temp/precip fields)
1998-2013 ~35 km Canadian Meteorological Centre, Brasnett [1999]
Daily snow depth analysis (in situ obs + snow model forced by reanalysis temp/precip fields)
1979-1998 ~35 km Environment Canada, Brown et al [2003]
MERRA reanalysis snow water equivalent (CATCHMENT LSM)
1979-2013 0.5 x 0.67 deg NASA, Rienecker et al [2011]
ERA-interim reanalysis snow water equivalent (HTESSEL LSM)
1979-2010 ~80 km ECMWF, Balsamo et al [2013]
GLDAS reanalysis snow water equivalent (Noah LSM)
1948-20001948-2010
1.0 x 1.0 deg0.25 x 0.25 deg
NASA, Rodell et al [2004]
SnowModel driven by MERRA atmospheric reanalysis snow water equivalent
1979-2009 10 km Colorado State, Liston and Hiemstra [2011]
GlobSnow snow water equivalent (satellite passive microwave + climate station obs)
1978-2013 25 km Finnish Meteorological Institute, Takala et al [2011]

Challenges and Approaches to Validating Snow Datasets

Approaches to Validating Snow Products
Approach Strengths Weaknesses
1. Assessments with point observations(climate stations)
-Time series -Sparse networks-Point vs. area comparison-Measurement and reporting deficiencies
2. Targeted field campaigns
-Measurements where/when needed
-Cost-‘Snapshot datasets’
3. Multi-dataset comparisons
-Statistical characterization of uncertainty
-Definition of the authoritative baseline for assessment
4. High resolution EO for snow extent
-sub-pixel information
-Temporally and spatially limited

GlobSnow SWE Algorithm
Based on Pulliainen (2006) the method combines climate station snow depth observations with SWE estimates derived from satellite passive microwave measurements and microwave snow emission modelling within an assimilation framework.
Mountain mask: >1500 m
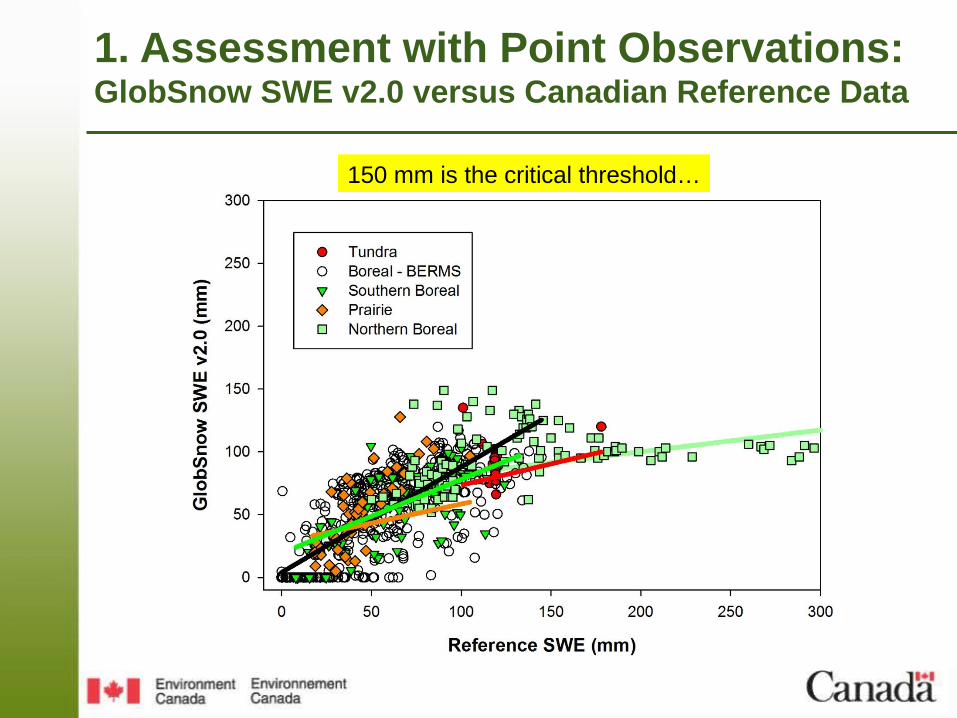
1. Assessment with Point Observations:GlobSnow SWE v2.0 versus Canadian Reference Data
150 mm is the critical threshold…

TundraN. Boreal (All)N. Boreal (SWE<150 mm)S. Boreal BERMS Prairie0
10
20
30
40
50
60
70
80V0.9
V1.0RMSE (mm)
TundraN. Boreal (All)N. Boreal (SWE<150 mm)S. Boreal BERMS Prairie-50
-40
-30
-20
-10
0
10
20
V0.9V1.0V1.2
Mean Bias (mm)
TundraN. Boreal (All)N. Boreal (SWE<150 mm)S. Boreal BERMS Prairie-1
-0.75
-0.5
-0.25
0
0.25
0.5
0.75
1
V0.9
V1.0
V1.2
Correlation (r)
Change Relative to FPS1.3 RMSE Bias CorrelationTundra -16 -14 -0.02N. Boreal SWE<150 mm 0 -8 0.04S. Boreal 1 4 0.04BERMS 1 0 -0.02Prairie 0 5 0.46
RMSE Bias
Correlation
Notable improvement relative to v1.3 at tundra and prairie sites.
1. Assessment with Point Observations:Development Sequence of GlobSnow SWE versus Canadian Reference Data
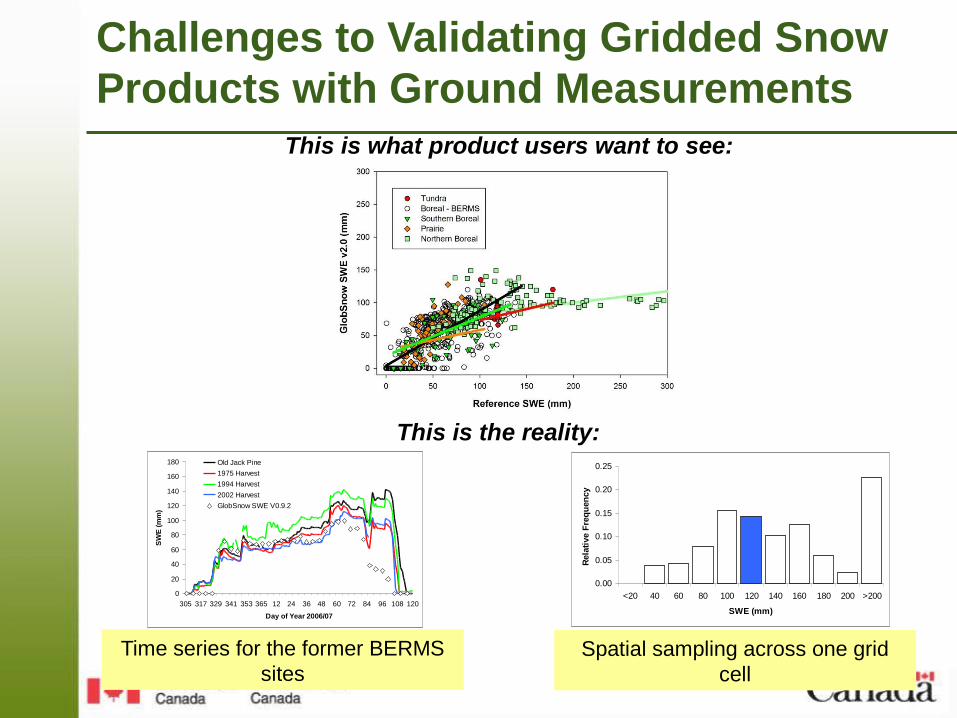
Challenges to Validating Gridded Snow Products with Ground Measurements
0.00
0.05
0.10
0.15
0.20
0.25
<20 40 60 80 100 120 140 160 180 200 >200
SWE (mm)
Rel
ativ
e F
req
uen
cy0
20
40
60
80
100
120
140
160
180
305 317 329 341 353 365 12 24 36 48 60 72 84 96 108 120
Day of Year 2006/07
SW
E (
mm
)
Old Jack Pine
1975 Harvest
1994 Harvest
2002 Harvest
GlobSnow SWE V0.9.2
Time series for the former BERMS sites
Spatial sampling across one grid cell
This is what product users want to see:
This is the reality:

% change in bulk snow properties at the scale of adjacent PMW grid cells using long transect snow
surveys
• Changes in tundra snow depth are higher over the tundra compared to the boreal forest partly due to high tundra snow depth variability due to wind redistribution
• Depth decreases by >50% across the transition from forest to tundra
Boreal to Boreal
Tundra to Tundra
Boreal to Tundra
Mean distance between sites (km) 20.3 17.5 24.6
n 63 22 9
∆ Density (%) 2.6 1.4 46.0
∆ Depth (%) -2.6 -18.2 -57.0
∆ SWE (%) 0.1 14.1 -34.7
2. Targeted field campaigns for product validation

3. Multi-dataset comparisons
• Evidence of an artificial trend (~+1.0 million km2 per decade) in October snow cover.
EUR Oct SCE: difference between NOAA snow chart CDR and 4 independent
datasets, 1982-2005
Brown, R Derksen, C (2013) Env. Res. Letters
• Tendency for NOAA to consistently map less spring snow (~0.5 to 1 million km2) than the multi-dataset average since 2007.
• Accounting for this difference reduces the June NH SCE trend from -1.27 km2 x 106 to -1.12 km2 x 106
NH June SCE time series, 1981-2012NOAA snow chart CDR (red); average of
NOAA, MERRA, ERAint (blue)
Why quantifying spread in snow products matters…
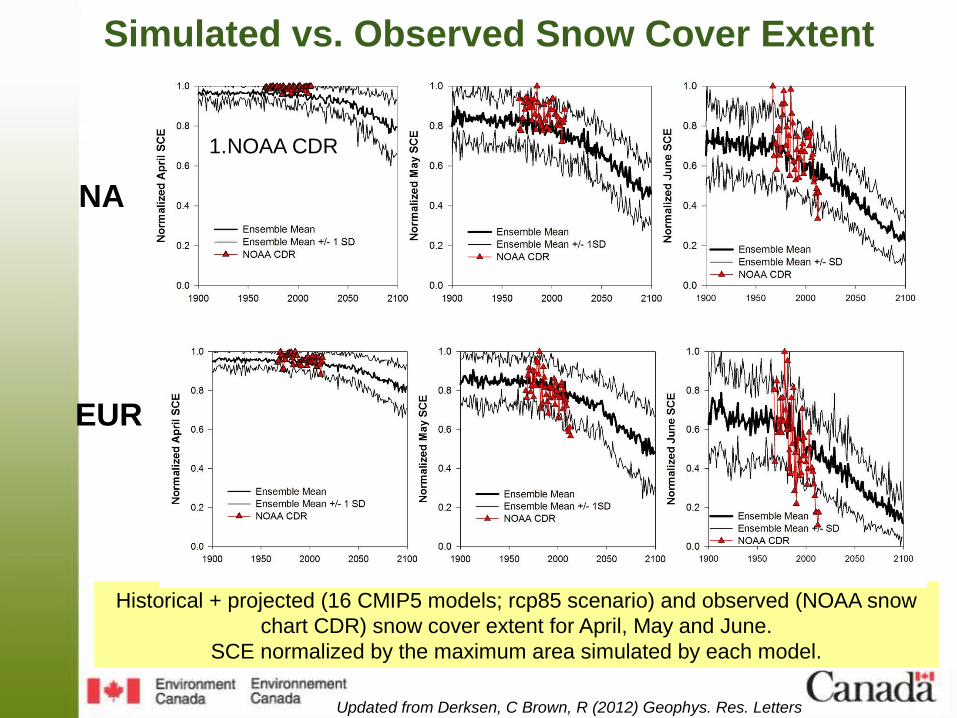
Historical + projected (16 CMIP5 models; rcp85 scenario) and observed (NOAA snow chart CDR) snow cover extent for April, May and June.
SCE normalized by the maximum area simulated by each model.
Simulated vs. Observed Snow Cover Extent
Updated from Derksen, C Brown, R (2012) Geophys. Res. Letters
NA
EUR
1.NOAA CDR

Historical + projected (16 CMIP5 models; rcp85 scenario) and multi-observational snow cover extent for April, May and June.
SCE normalized by the maximum area simulated by each model.
NA
EUR
1.NOAA CDR2.Liston & Hiemstra3.MERRA4.GLDAS-Noah5.ERA-int Recon.
Simulated vs. Observed Snow Cover Extent
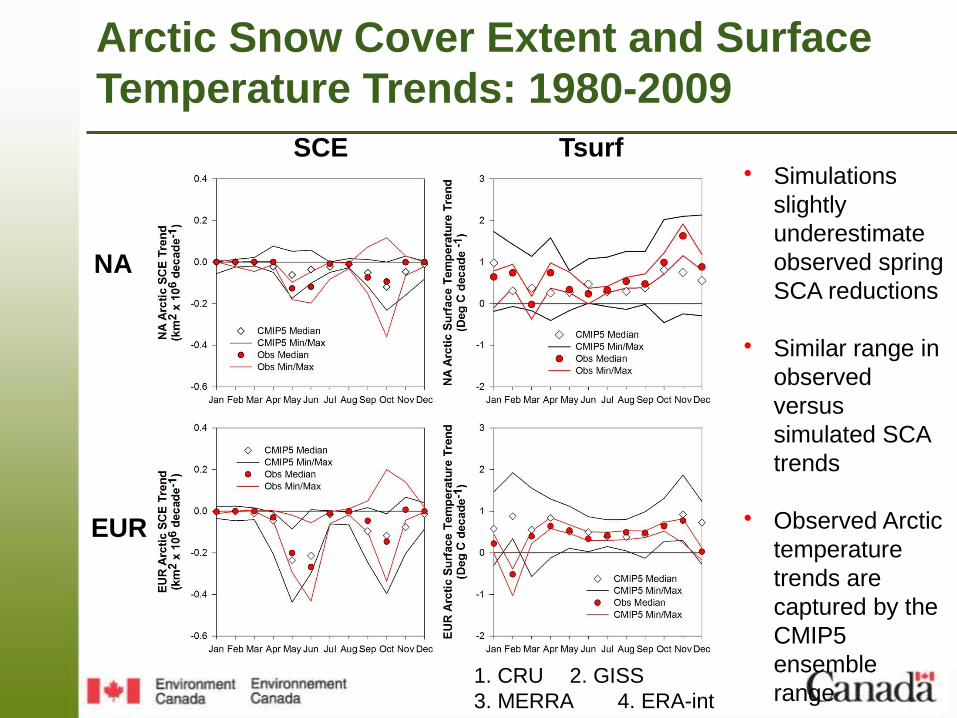
Arctic Snow Cover Extent and Surface Temperature Trends: 1980-2009
NA
EUR
SCE Tsurf• Simulations
slightly underestimate observed spring SCA reductions
• Similar range in observed versus simulated SCA trends
• Observed Arctic temperature trends are captured by the CMIP5 ensemble range
1. CRU 2. GISS3. MERRA 4. ERA-int
• Observations show rapid reductions in spring snowcover extent over the past decade – it is important to robustly characterize these trends with validated observations.
• Point climate station observations play an important role in SWE product validation, but are hampered by the disconnect between the heterogeneity in snow distribution versus the spatial resolution of current products.
• The spread between 5 ‘observational‘ SWE datasets (mean; variability) is approximately the same as across 16 CMIP5 models.
• Quantifying observational uncertainty in gridded snow products is important for modeling applications at all time scales:
-Land surface data assimilation for NWP-Land surface initialization for monthly/seasonal forecasting-Multi-decadal climate projections
• High spatial resolution snow water equivalent with sensitivity to deep snow requires a new EO measurement concept (LiDAR; Radar)
Conclusions

Questions?

Observational time seriesIPCC AR5 Summary for Policy Makers Figure 3
Climate Change and the Cryosphere
Trends in surface temperature 1901–2012
IPCC AR5 WG1 Chapter 2 Figure 2.21
Spring snow cover
Related Documents