RESEARCH Open Access Validation of digital photographs, as a tool in 24-h recall, for the improvement of dietary assessment among rural populations in developing countries Claudia E Lazarte 1,2* , Ma Eugenia Encinas 3 , Claudia Alegre 3 and Yvonne Granfeldt 1 Abstract Background: Improvement of traditional methods for dietary assessment is necessary, especially in rural areas where it is more difficult to succeed with self-reporting methods. This study presents and validates a method for improving accuracy when measuring food and nutrient intake of individuals in rural areas. It is called the “Food photography 24-h recall method” (FP 24-hR) and is a modified 24-h recall with the addition of a digital food photography record and a photo atlas. Methods: The study was carried out in a rural area in the tropical region of Bolivia; 45 women participated. Validation of the method was made by comparing it with a reference method, the Weighed Food Record (WFR). During the FP 24-hR, digital photographs were taken by the subjects of all food consumed during a day and a 24-h recall questionnaire was conducted by an interviewer. An estimate of the amount of food consumed was made using a photo atlas and the photographs taken by the subjects. For validation, comparison was made between the calculations, by both methods, of the levels of food, and nutrient, intake. Results: The comparison was made in 10 food categories; most of which were somewhat underestimated from −2.3% (cassava) to −6.8% (rice), except for beverages (+1.6%) and leafy vegetables (+8.7%), which were overestimated. Spearman’s correlation coefficients were highly significant (r from 0.75 for eggs to 0.98 for potato and cassava). Nutrient intakes calculated with data from both methods showed small differences from -0.90% (vitamin C) to -5.98% (fat). Although all nutrients were somewhat underestimated, Pearson 0 s coefficients are high (>0.93 for all) and statistically significant. Bland Altman analysis showed that differences between both methods were random and did not exhibit any systematic bias over levels of food and nutrient intake, with acceptable 95% limits of agreement. Conclusion: The FP 24-hR exhibits acceptable differences when compared with a WFR, digital photos are useful as a memory aid for the subjects during 24-h recall and as an estimation tool. The method is suitable for assessing dietary intake among rural populations in developing countries. Keywords: Weighed record, 24-h recall, Digital photographs, Photo atlas, Developing countries * Correspondence: [email protected] 1 Department of Food Technology, Lund University, P.O. Box 124, Lund 221 00, Sweden 2 Food and Natural Products Center, San Simon University, Cochabamba, Bolivia Full list of author information is available at the end of the article © 2012 Lazarte et al.; licensee BioMed Central Ltd. This is an Open Access article distributed under the terms of the Creative Commons Attribution License (http://creativecommons.org/licenses/by/2.0), which permits unrestricted use, distribution, and reproduction in any medium, provided the original work is properly cited. Lazarte et al. Nutrition Journal 2012, 11:61 http://www.nutritionj.com/content/11/1/61

Welcome message from author
This document is posted to help you gain knowledge. Please leave a comment to let me know what you think about it! Share it to your friends and learn new things together.
Transcript

RESEARCH Open Access
Validation of digital photographs, as a tool in24-h recall, for the improvement of dietaryassessment among rural populations indeveloping countriesClaudia E Lazarte1,2*, Ma Eugenia Encinas3, Claudia Alegre3 and Yvonne Granfeldt1
Abstract
Background: Improvement of traditional methods for dietary assessment is necessary, especially in rural areaswhere it is more difficult to succeed with self-reporting methods. This study presents and validates a method forimproving accuracy when measuring food and nutrient intake of individuals in rural areas. It is called the “Foodphotography 24-h recall method” (FP 24-hR) and is a modified 24-h recall with the addition of a digital foodphotography record and a photo atlas.
Methods: The study was carried out in a rural area in the tropical region of Bolivia; 45 women participated.Validation of the method was made by comparing it with a reference method, the Weighed Food Record (WFR).During the FP 24-hR, digital photographs were taken by the subjects of all food consumed during a day and a 24-hrecall questionnaire was conducted by an interviewer. An estimate of the amount of food consumed was madeusing a photo atlas and the photographs taken by the subjects. For validation, comparison was made between thecalculations, by both methods, of the levels of food, and nutrient, intake.
Results: The comparison was made in 10 food categories; most of which were somewhat underestimated from−2.3% (cassava) to −6.8% (rice), except for beverages (+1.6%) and leafy vegetables (+8.7%), which wereoverestimated. Spearman’s correlation coefficients were highly significant (r from 0.75 for eggs to 0.98 for potatoand cassava). Nutrient intakes calculated with data from both methods showed small differences from -0.90%(vitamin C) to -5.98% (fat). Although all nutrients were somewhat underestimated, Pearson0s coefficients are high(>0.93 for all) and statistically significant. Bland Altman analysis showed that differences between both methodswere random and did not exhibit any systematic bias over levels of food and nutrient intake, with acceptable 95%limits of agreement.
Conclusion: The FP 24-hR exhibits acceptable differences when compared with a WFR, digital photos are useful asa memory aid for the subjects during 24-h recall and as an estimation tool. The method is suitable for assessingdietary intake among rural populations in developing countries.
Keywords: Weighed record, 24-h recall, Digital photographs, Photo atlas, Developing countries
* Correspondence: [email protected] of Food Technology, Lund University, P.O. Box 124, Lund 22100, Sweden2Food and Natural Products Center, San Simon University, Cochabamba,BoliviaFull list of author information is available at the end of the article
© 2012 Lazarte et al.; licensee BioMed Central Ltd. This is an Open Access article distributed under the terms of the CreativeCommons Attribution License (http://creativecommons.org/licenses/by/2.0), which permits unrestricted use, distribution, andreproduction in any medium, provided the original work is properly cited.
Lazarte et al. Nutrition Journal 2012, 11:61http://www.nutritionj.com/content/11/1/61

BackgroundNutritional assessment in many low-income countriesemphasizes new simple, non-invasive approaches thatcan be used to measure the risk of both nutrientshortages and excesses, as well as to monitor and evalu-ate the effects of a nutrition intervention. One approachis to use the dietary assessment methods which canidentify any nutritional deficiencies by measuring thefood consumption of individuals [1].In some rural populations in low-income countries a
weighed food record, completed by trained researchassistants in the households, has been used as the mostprecise method available for estimating the usual foodand nutrient intake of individuals, because some subjectsare not literate or cannot use the scales [2,3], in Bolivia,the illiteracy in rural areas is 37.9% for women with15 years or more, and 15.7% for men [4]. However, themethod is time-consuming and expensive and the usualeating pattern of the respondents can easily be dis-rupted. Therefore the 24-h recall is being used widely toassess the dietary intake of individuals [5-7]; the methodis quick and economical, it can be used equally well withboth literate and illiterate subjects, and the respondentburden is small. Nevertheless, the success of the methoddepends on the subject’s memory, the ability of the sub-ject to conduct accurate estimates of portion sizes con-sumed, and the persistence of the interviewer [1].Furthermore, it has been reported that the 24-h recallapplied as the sole method in rural populations resultedin a systematic negative bias that lead to significantunderestimates of average daily energy and nutrient in-take compared with that obtained by the weighed record[8] as well as the misreporting of energy and micronu-trient intake [9].All methods used to assess self-reported daily dietary
intake have several limitations in terms of the accuracyof the portion size estimation [1,10]. To improve the ac-curacy of dietary assessment methods and overcometheir limitations it is recommended to make the existingtechniques more sensitive to community specifics byusing multiple measurement methods [3], as there is alarge variation from community to community with re-spect to staple foods, their preparation and dietary habitsin general. One of the main errors to occur in the meas-urement of food consumption in dietary surveys is theassessment of portion sizes; therefore standard portions,household measures, food models and pictures are usedas aids for the quantitative estimation of food in dietarydata collection [11]. Food photographs depicted in stan-dardized portion sizes (small, medium and large portionswhich are meant to be representative of the range ofportion sizes actually consumed), organized in a bookletor atlas have been shown to be helpful in improving theaccuracy of food quantification [12-15].
As a new approach the inclusion of digital photo-graphs has been used to estimate portion size by takingphotos of food and meals before and after consumptionand by making food estimations either with the digitalphotographs alone or by comparing them with standardphotographs. This method was validated mostly by com-paring it with weighed records (as a reference method).Studies have been conducted in a variety of settings suchas schools, colleges, university cafeterias [16-18], labora-tories [19,20], hospitals or community centers [21,22],and in free-living conditions [20,23,24]. The results indi-cate that digital photographs are useful for assessingdietary intake in individuals, and for reducing the re-spondent burden associated with completing food records.To our knowledge, the use of digital photographs has notyet been validated or used in rural populations in low-income countries.The aim of the present study was to develop and validate
a modified 24-h recall method with digital food photo-graphs as a tool for subjects to recall their intake, and aphoto atlas with standard portion sizes of the foods com-monly consumed in the area to simplify the estimation ofconsumed portions. The validity of the method wasassessed by comparing the results with a reference methodWFR running in parallel. The modifications were made toadapt the food photographs for use among rural popula-tions in low-income countries where there may be alimited ability to read or write. The method developedis designed to be used in a further study for assessingthe dietary intake of patients with leishmaniasis in thesame area.
MethodsSubjects and study designWomen aged 20–52 years, from a rural area namedEterazama, a tropical region located 180 km east ofCochabamba-Bolivia, participated. A nurse from thelocal health center visited women in their homes withina 0.5 and 3 km radius around the health center andinvited them to participate. Their participation dependedon their willingness to be followed closely for one dayduring the preparation and consumption of their meals.Figure 1 shows the design of the study. A modified 24-h
recall method in 2 steps, so-called FP 24-hR was devel-oped. In the first step, digital photographs are taken by thesubjects, of the foods they consume over a 24 hour period;in the second step, one day after, during an interviewfollowing a 24-h recall questionnaire, the subjects esti-mate and report the quantities of food consumed theday before. Their digital photographs help them to re-call all foods and also to estimate the portion size bycomparing them with standard food photographs in aphoto atlas. The FP 24-hR was validated with a refer-ence method, WFR, in which weighed amounts of the
Lazarte et al. Nutrition Journal 2012, 11:61 Page 2 of 14http://www.nutritionj.com/content/11/1/61

food consumed were recorded by assistants in the sub-ject0s home. The two methods were run in parallel duringa test day.The Ethics Committee of the Faculty of Medicine at
Lund University approved the study.
24-h recall questionnaireA 24-h recall questionnaire was elaborated according toguidelines given in Gibson (2005), and pre-tested withrespondents in the area in question in order to ensurethat the questions were relevant and understandable.The questionnaire has questions about the name of thefoods and meals consumed, whether food intake wasnormal that day, and if there was any consumption ofmedicines or vitamin-mineral supplements; also, placeand time of consumption are listed for: breakfast, mid-morning snack, lunch, mid-afternoon snack and dinner.
Photo atlasA photo atlas with color photographs of 78 commonfoods consumed in the area, in various portion sizes,was included to assist the interviewer and participants inestimating the sizes of the portions. A total of 334 pho-tos, divided into 8 food groups, that is meat, cereals,legumes, tubers, vegetables, fruits, composite meals anddrinks, are depicted in the atlas.To prepare the photo atlas, we used population-based
data as suggested by Nelson and Haraldsdóttir (1998).Nutritionists visited families in the area of interventionto acquire some knowledge of the most commonly con-sumed foods, the portion sizes and the tableware used.This information was collected in an open questionnaire
and used to design the album in terms of the number ofitems, the number of portion sizes and the kind of plateson which the food should be photographed.The photographs of the food in the photo atlas were
taken at approximately the same angle of 90° and dis-tance of 50 cm, above the plate. A second photograph,with an approximately 45° angle, used to show differ-ences between portion sizes depending on the height ofthe food on a flat plate and depth in a soup plate, wastaken when necessary. The plates were placed on a tablemat with 1.5 cm grids marked out. It was deemed usefulto keep a standard background for the photographs.Additionally, reference objects of a spoon, fork or knifewere placed next to the dish to provide some idea ofscale of the dish size.The foods were depicted in different portion sizes
from 3 to 7 judged to be representative of the range ofportion sizes actually consumed, placed on 2 differenttypes of plates, flat and soup plates, common in the area.The portions were arranged in descending order withthe biggest portion on the top. The name (in Spanish)and weight of the food is shown on the top of each photo-graph, the images were color prints in size 75 × 60 mmallowing eight photos to be displayed together on oneA4 page. Figure 2 shows an example of photographsfrom the photo atlas. Additionally the photo atlas pre-sents depicted raw ingredients (like tomatoes, onion,etc.) in different standardized sizes from 3 to 5 depend-ing on the variety of actual sizes existing on the market,these photographs were useful when the subjects weredescribing the individual food items in mixed dishessuch as soups, stews, etc.
Figure 1 Design of the study: Validation of the developed method FP 24-hR by comparing it with WFR.
Lazarte et al. Nutrition Journal 2012, 11:61 Page 3 of 14http://www.nutritionj.com/content/11/1/61
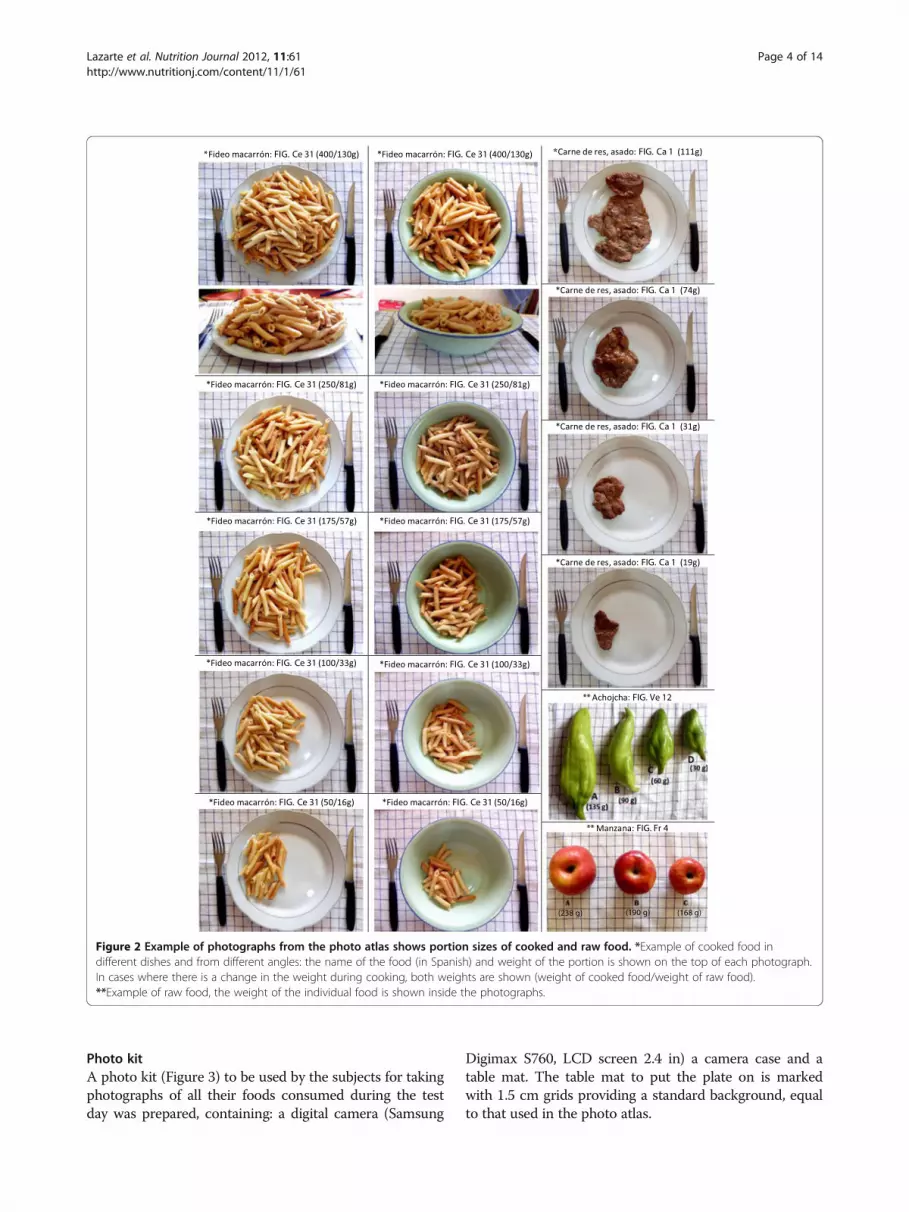
Photo kitA photo kit (Figure 3) to be used by the subjects for takingphotographs of all their foods consumed during the testday was prepared, containing: a digital camera (Samsung
Digimax S760, LCD screen 2.4 in) a camera case and atable mat. The table mat to put the plate on is markedwith 1.5 cm grids providing a standard background, equalto that used in the photo atlas.
Figure 2 Example of photographs from the photo atlas shows portion sizes of cooked and raw food. *Example of cooked food indifferent dishes and from different angles: the name of the food (in Spanish) and weight of the portion is shown on the top of each photograph.In cases where there is a change in the weight during cooking, both weights are shown (weight of cooked food/weight of raw food).**Example of raw food, the weight of the individual food is shown inside the photographs.
Lazarte et al. Nutrition Journal 2012, 11:61 Page 4 of 14http://www.nutritionj.com/content/11/1/61

Food photographs as a tool in 24-h dietary recall:FP 24-hRThe day before a test day a nurse, a nutritionist and aninterviewer visited the women one by one in their homesand explained verbally the procedure of the study. When awoman voluntarily accepted to participate, she receivedverbal instructions, was given a demonstration and allowedto practice taking adequate photographs of her meals witheasy-to-understand instructions.As a first step, the subjects took photographs of all
their meals consumed during the test day with the fol-lowing instructions: Place the plate with the food on thetable mat, take two photographs before eating and twophotographs after finishing if there are leftovers, onephotograph at 90°, approximately 50 cm straight abovethe plate (hold the camera at a sufficient distance to seethe whole marked table mat in the entire frame of cam-era screen and shoot, the size of the table mat was stan-dardized to give ~50 cm distance in this position), and asecond photograph with an approximate angle of 45°(take one step back from your original position fit thecamera screen to cover the entire table mat and shoot).Both photographs are meant to span characteristics of
appearance which are likely to influence perception ofamounts from photographs, these characteristics are:area and height of pieces, mounds on a flat plate anddepth in a soup plate, useful for a better estimation ofthe food portion sizes. Compliance with the method wasgood; 47 women were asked to participate, of which 45(96%) accepted, they all took the photographs requested.Figure 4 shows the photographs taken by a subject dur-ing the test day showing breakfast, lunch (from two dif-ferent angles) and dinner.On the following day, as a second step, a trained inter-
viewer (not the assistant who kept the weighed food record)asked the subject to recall the exact food intake duringthe preceding day, according to a four-stage, multiple-pass interviewing technique [1].The multiple-pass 24-hr recall was conducted as
described in Gibson, (2005) with small modificationsin the third pass, to estimate the amount of food andbeverages consumed; during this pass, the subjects areto be asked to estimate the amount of food consumed;comparing the digital photographs they took on thetest day with photographs of standard portion size inthe photo atlas. At the same time the interviewer is to
Figure 3 Photo kit: Digital camera, camera case and marked table mat.
Lazarte et al. Nutrition Journal 2012, 11:61 Page 5 of 14http://www.nutritionj.com/content/11/1/61

make her/his own comparison of the photographs andascertain or correct the portion size selected. The sub-jects are also to be asked to describe some hiddenfoods which are not visible in the digital photographs.
Reference method: WFRThe WFR, was run in parallel with the FP 24-hR. Anassistant, who had previously been trained by a nutri-tionist, visited each subject during the preparation andconsumption of her meals during the test day.Before consumption of the meals, the amount of each
food item and beverage was transferred to a clean dish,weighed (Ohaus Traveler TA 1501, capacity 1500 ± 0.1 g),and recorded separately, the same procedure was followafter consumption if there were leftovers, and the actualamount of each type of food eaten was subsequently cal-culated subtracting leftovers. In the case of mixed mealssuch as soups or stews, raw ingredients used in their prep-aration, were weighed (±0.1 g) and recorded individually,the final total weight of the mixed dish was weighed in thecooking pot, using a second scale with greater capacity(Ohaus Valor™ 1000 V11P30, capacity 30 kg ± 5 g), alsothe individual served dish was weighed (±0.1 g) andrecorded. The weight of each ingredient was calculated forindividual consumption.
Anthropometric measurementsMeasurements of height and weight were performed bytrained staff, using a digital electronic scale (Omron HBF-400), 150 kg ± 0.1 kg and a portable stadiometer ±1 mm.The subjects were lightly dressed and without shoes, whenthe measurements were taken, body mass index (BMI =weight [kg]/height [m2]) was calculated and evaluatedusing the World Health Organization classification[25,26].
Food intake and Nutrient calculationA data base for nutrient calculation was elaborated in anexcel file for most items with data from USDA NationalNutrient Data Base for standard reference [27]. For afew items the Bolivian Food Composition Table wasconsulted [28]. The elaborated database contains 141
food items properly encoded. We chose to use theUSDA reference database due to a lack of information inthe Bolivian table about cooked food.The data of food intake of the subjects was extracted
from questionnaires (FP 24-hR) and records (WFR) ofthe 45 subjects who participated in the validation. Thedata were divided into 10 categories of food for compar-ing weighed and estimated amounts. The selected foodcategories reflect the composition of the diet pattern inthis population as well as representing the source of cer-tain nutrients of interest. The bread, rice and noodlescategory represents the staple cereal-based food. Pota-toes and cassava are tubers mainly consumed in thearea. Eggs and meat represent the main protein sourcesof their diet. Vegetables category was divided into leafyvegetables (spinach, lettuce, etc.) and vegetables (toma-toes, carrots, etc.), because leafy vegetables may be moredifficult to estimate due to the volume they occupy doesnot represent their actual weight. And finally the cat-egory of beverages was added to evaluate the estimationof liquids.All dietary information from WFR and FP 24-hR was
coded according to the food code in the database. Foodcodes and amounts were entered into the excel files inorder to compute the total amount consumed per dayand the average daily energy and nutrient intake. Themethod has been validated with respect to actual in-take of energy, protein, total fat, carbohydrates, dietaryfiber, calcium, iron, zinc, selenium, folate, thiamin, nia-cin, β-carotenoids, and vitamins C, A and E. Themacronutrients and fiber were selected because theyare commonly requested in diet studies. The mineralsand vitamins were selected according to their relevanceto elucidate deficiencies present especially among ruralpopulations in developing countries, and according totheir different sources (i.e. folate, vitamins C, aremainly in vegetables; thiamin, niacin are mainly incereal products, etc.).
Statistical analysisNormality of distribution of data was assessed by theKolmogorov–Smirnov test and by visual inspection of
Figure 4 Representative photographs of breakfast, lunch (from two different angles) and dinner taken by a subject.
Lazarte et al. Nutrition Journal 2012, 11:61 Page 6 of 14http://www.nutritionj.com/content/11/1/61

histograms with reference to measures of skew and kur-tosis. Logarithmic transformations were used, when appro-priate, to normalize the data (food categories). Theamounts of estimated food categories and calculated nutri-ent intake are reported at group level using medians andpercentiles 25th, 75th (for not normal distributed data) andmeans and standard errors (for normal distributed data).To test the validity of the FP 24-hR, the mean or me-
dian difference in grams and percent of the intake be-tween mean amounts actually eaten (WFR), and meanamounts estimated (FP 24-hR) were calculated andexpressed at the category level. A negative difference isconsidered to indicate an underestimation of theweighed serving. The differences between amounts inportion sizes of food categories weighed and estimatedwere tested using Wilcoxon signed rank test (not normaldistributed data) and differences between nutrientintakes estimated by FP 24-hR and WFR were testedusing paired t-test (normal distributed data).Pearson’s or Spearman’s rank correlation coefficients
were calculated to assess the association between theweighed and estimated amount of food and between nu-trient intakes assessed by both methods.Agreement between both methods was assessed using
the Bland-Altman regression; the mean differences of foodamounts and nutrient intakes between both methods wereplotted against its average value, and the 95% limits ofagreement were marked. This kind of plot shows the mag-nitude of disagreement, allows outliers to be spotted andany trends to be identified; desirable agreement betweenthe two methods would result in a difference of zero.For all statistical tests the significance level was set up at
P < 0.05; and the tests were carried out using SPSS version18.0 (SPSS Inc., IBM corporation 2010, www.spss.com).
ResultsAll the 45 subjects (100%) successfully completed the FP24-hR. As 11 women had one of their meals (mid-after-noon snack or dinner) outside their home, complete data ofWRF was available for 34 women (76%). The comparisonsof food amounts estimated vs. weighed were made with themean portions for each type of food from meals consumedat home for all 45 subjects. Comparison of nutrient intakecalculated by both methods was analyzed for 34 subjects.The subjects’ characteristics are presented in Table 1;
the women aged 20 to 52, mean BMI 24.82 kg/m2. Fiftysix percent were in the range of normal BMI values,while some of the women were underweight (7%), over-weight (26%) and obese (11%).
Comparison of food categories estimated vs. weighedamountThe data of food groups were not normally distributed;therefore the accuracy of the FP 24-hR method is
presented for the foods listed as median values and per-centiles (25th, 75th) of the amounts estimated in thequestionnaires and the corresponding information ofweighed food amounts recorded by assistants with WFR.This comparison was done for 10 major food categories:bread (n = 26), rice (n = 43), noodles (n = 43), potatoes(n = 80), cassava (n = 19), meat (n = 48), egg (n = 15),vegetables (n = 198), leafy vegetables (n = 17), and bev-erages (tea, milk or refreshments) (n = 19). The medianamounts and percentiles (25th, 75th) of food estimated(FP 24-hR) and weighed (WFR) respectively are pre-sented in Table 2 as well as the differences between themedians (in grams and percentage, respectively), and thepercentiles of the differences are shown.Most of the food categories were underestimated (ran-
ging from −2.3% for cassava to −6.8% for rice), exceptingfor beverages (+1.6%) and leafy vegetables (+8.7%) whichwere somewhat overestimated. Data were analyzed withnon-parametric tests; Wilcoxon signed rank test showedthat the differences between estimated and weighed foodare not significant (P > 0.05) except for rice (<0.001), pota-toes (0.032), egg (0.030) and vegetables (0.039). Spearman0scorrelations were calculated to determine the associationat the individual level between the estimated amount andthe actual weighed amount; all the food categories presenta significant high correlation (r values from 0.75 for egg to0.98 for potatoes and cassava).The agreement between the estimated and weighed
amount was assessed by Bland Altman analysis of thelog-transformed data, because they were not normallydistributed, as shown in Figure 5 (for meat, noodles,potatoes and vegetables). The plots for the differencesof food amounts, estimated (FP 24-hR) and weighed(WFR), show that most of the differences are betweenthe limits of agreement at mean ± 2 SD, showing only afew outliers (from 0% for leafy vegetables and beveragesto 8.3% for meat).
Table 1 Characteristics of subjects
Women (n= 43)
Mean SD % (n)
Age [years] 35 8.6
Height [cm] 155.55 6.84
Weight [kg] 59.76 8.70
BMIa [kg/m2] 24.82 4.06 100 (43)
Underweight 18.40 0.12 7 (3)
Normal weight 22.80 1.64 56 (24)
Overweight (Pre-obese) 27.31 1.64 26 (11)
Overweight (Obese class1) 32.79 1.61 11 (5)aBMI [kg/m2], body mass index, classification according WHO [24];underweight (<18.5), normal weight (18.50-24.99), pre-obese (25.00-29.99),obese class I (30.00-34.99).
Lazarte et al. Nutrition Journal 2012, 11:61 Page 7 of 14http://www.nutritionj.com/content/11/1/61

For all the food categories the results from BlandAltman analysis were back-transformed and are pre-sented in Table 2, showing the geometric mean ratioof values by estimated and weighed food amount andthe 95% limits of agreement. The geometric meanratios are close to 1 and limits of agreement are nar-row for most of the food categories. For beveragesthe geometric ratio is 1.01 and narrow limits ofagreement (0.93 to 1.10), for leafy vegetables the geo-metric ratio is 0.98 with relatively broad limits ofagreement (0.65 to 1.43).
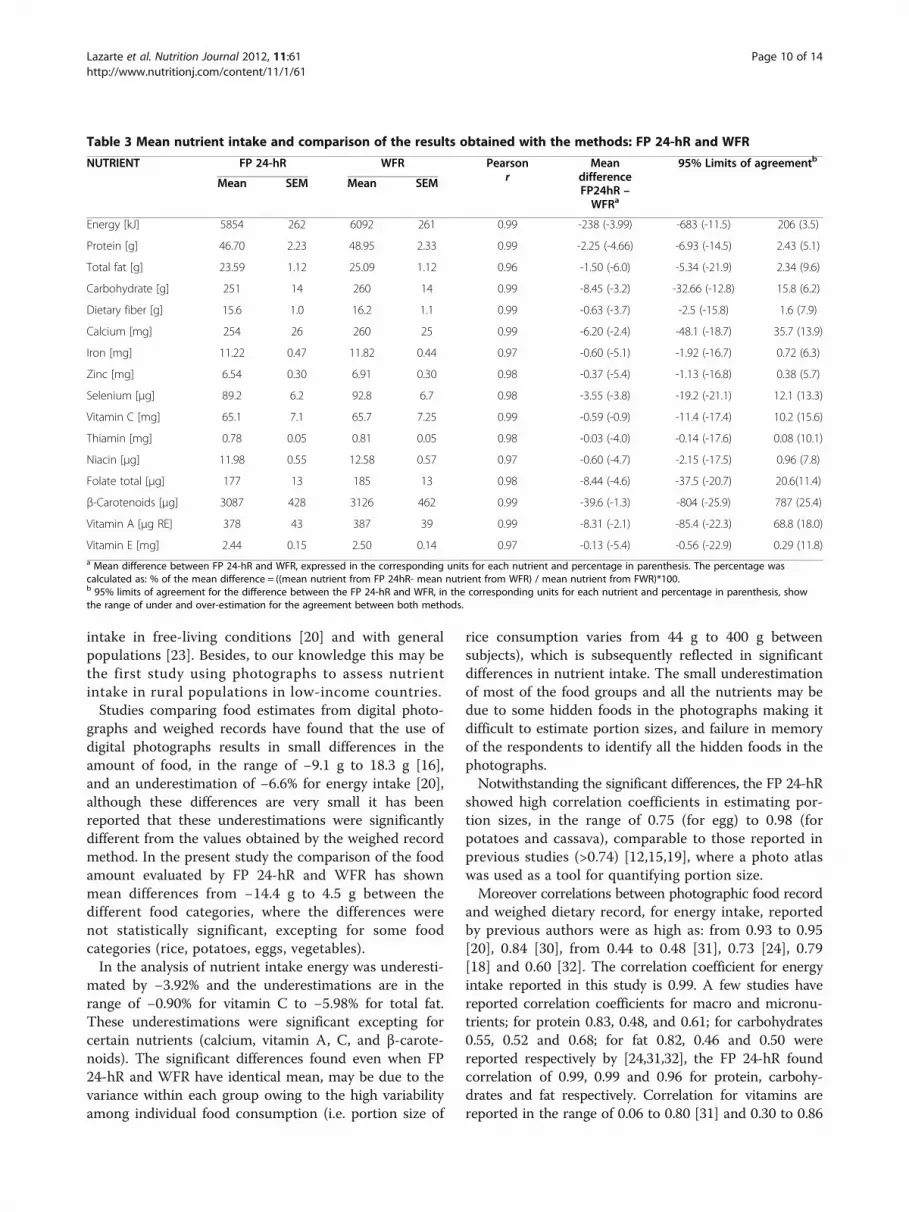
Comparison of nutrient intake calculated from FP 24-hRand WFRThe mean amount of nutrient intake from food con-sumption assessed by FP 24-hR and WFR respectivelywere calculated for energy, protein, total fat, carbohy-drates, dietary fiber, calcium, iron, zinc, selenium, thiamin,niacin, folate, β-carotenoids, and vitamins C, A and E .The data follow normal distribution and thus parametric
tests were used for the analysis. The results of mean nutri-ent intake and standard errors are shown in Table 3 aswell as the differences between means (in the corre-sponding units for each nutrient and in percentage) arepresented. The differences are in the range of −0.90%(for Vitamin C) and −5.98% (for total fat), indicatingthat both methods are comparable, with small differ-ences. All nutrient intakes were somewhat underesti-mated using the FP 24-hR method. Even though mostof the differences are small they are statistically significant(paired t-test P < 0.05) except for calcium (P = 0.098),
vitamin C (P = 0.528), vitamin A (P = 0.218) and β-carotenoids (P = 0.565).Significant correlation coefficients (Pearson) between
all nutrient intakes estimated by the FP 24-hR and theWFR were obtained (r value from 0.96 to 0.99) indicat-ing good association between both methods for all thenutrients.In order to assess the agreement between the methods,
for all nutrients, Bland Altman analysis was performedas shown in Figure 6 (for energy, calcium, vitamin C,and iron). Plots for each nutrient show a few outliers(from 0% for energy to 8.8% for calcium), the majority ofthe measurements were scattered along the equality line.The plots thus showed fairly good agreement betweenthe two methods and also indicated that the differences(including the outliers) were random and did not exhibitany systematic bias.In Table 3 the mean difference between the methods
and 95% limits of agreement for the differences are pre-sented in the corresponding units for each nutrient andin percentage; showing small differences from −0.90%(for vitamin C) to −5.98% (for total fat) and narrowlimits of agreement for energy (−11.5 to 3.5%) and car-bohydrates (−12.8 to 6.2%) and relatively broad but stillacceptable limits are shown for β-carotenoids (−25.9 to25.4%) and vitamin A (−22.9 to 11.8%).
DiscussionThe data analyses of individual food categories show thatthe FP 24-hR with digital photographs and a photo atlaswas able to estimate the weights of food portion sizes
Table 2 Amount of food estimated by FP 24-hR and compared with amount weighed in WFR
FOOD CATEGORY (n) FP 24-hR WR Sperman r Median differenceFP24hR – WFRa
Bland Altman AnalysisFP24hR – WFR (antilog)b
Median (P25, P75) Median (P25, P75) Median (P25, P75) % Geometricmean ratio
95% Limits ofagreement
Bread [g] 26 55 (50, 60) 55 (47, 65) 0.81 -1.5 (-4.3,3.0) -2.43 0.98 0.79 1.22
Rice [g] 43 165 (105, 200) 165 (108, 237) 0.95 -13.0 (-30.0, 5.0) -6.76 0.93 0.71 1.20
Noodles [g] 43 175 (154, 256) 187 (150, 263) 0.93 -12.0 (-20.0, 9.0) -5.41 0.97 0.73 1.28
Potatoes [g] 80 114 (61, 160) 115 (71, 168) 0.98 -5.0 (-10.0, 7.8) -5.80 0.96 0.79 1.18
Cassava [g] 19 117 (64, 156) 108 (66, 143) 0.98 -1.0 (-8.0, 8.0) -2.33 0.99 0.80 1.22
Meat [g] 48 36 (25, 51) 34 (26,49) 0.96 -2.0 (-4.0, 2.0) -4.88 0.95 0.71 1.28
Egg [g] 15 50(50, 50) 54 (46, 57) 0.75 -3.0 (-7.0, -1.0) -6.54 0.94 0.76 1.17
Vegetables [g] 198 25 (13, 43) 25 (14, 43) 0.96 -1.0 (-4.0, 2.0) -5.44 0.98 0.65 1.43
Leafy vegetables [g] 17 25 (25, 50) 27 (20, 46) 0.90 2.0 (-5.0, 7.0) 8.70 1.09 0.70 1.69
Beverages [g] 19 250 (200, 325) 260 (210, 310) 0.95 4.0 (-10.0, 10.0) 1.63 1.01 0.93 1.10a Median difference between FP 24-hR and WFR, in grams with 25th, 75th percentiles for the difference of each food category, and median of percentagepercentage of the difference in parenthesis (calculated as: % of the difference = ((amount from FP 24hR- amount from WFR) / mean amount from WFR)*100).b Bland Altman analysis, show the antilog values of the mean difference between FP 24-hR and WFR, represented as the geometric mean ratio of amountsestimated by the FP 24-hR and weighed by WFR, and the 95% limits of agreement, represent the range of proportional agreement between both methods.
Lazarte et al. Nutrition Journal 2012, 11:61 Page 8 of 14http://www.nutritionj.com/content/11/1/61

adequately and gave results comparable to the actualconsumed amounts recorded by the WFR. The modifi-cations with digital photographs and a photo atlas addedto the ability of the 24-h recall to minimize errors asso-ciated with the estimation of portion sizes, as well as thereduction of respondent burden. Therefore FP 24-hRrepresents a good alternative to the gold standardmethod (weighed food record) for estimating individualnutrient intakes, as it is demonstrated by the presentedresults.
Furthermore, recent studies show that the introduc-tion of digital photographs taken by the subjects as adiet assessment method helps to estimate food intakeand plate waste and this can reduce over and underesti-mates. This has been shown with children in cafeteriasettings [17,20], with children at home [24,29], adultswith intellectual disabilities living in the community[21], obese patients in hospital [22], as well as in collegeand university environments [16,18]. However, only afew studies have used digital photographs to estimate
a b
c d
Figure 5 Bland Altman plots for estimated and weighed food amount. Differences between the log amounts of food portions estimatedand weighed against their mean values, the solid line represents the average difference between the log estimated and the log weighed foodamount; the dotted lines show the 95% log limits of agreement which, when calculating the antilog, represent the range of proportionalagreement between both methods. a) Plot for noodles amount, b) Plot for potatoes, c) Plot for meat and d) Plot for vegetables. Plots show notsystematic bias and that the range of proportional agreement is narrow enough to be confident using the photo method.
Lazarte et al. Nutrition Journal 2012, 11:61 Page 9 of 14http://www.nutritionj.com/content/11/1/61
intake in free-living conditions [20] and with generalpopulations [23]. Besides, to our knowledge this may bethe first study using photographs to assess nutrientintake in rural populations in low-income countries.Studies comparing food estimates from digital photo-
graphs and weighed records have found that the use ofdigital photographs results in small differences in theamount of food, in the range of −9.1 g to 18.3 g [16],and an underestimation of −6.6% for energy intake [20],although these differences are very small it has beenreported that these underestimations were significantlydifferent from the values obtained by the weighed recordmethod. In the present study the comparison of the foodamount evaluated by FP 24-hR and WFR has shownmean differences from −14.4 g to 4.5 g between thedifferent food categories, where the differences werenot statistically significant, excepting for some foodcategories (rice, potatoes, eggs, vegetables).In the analysis of nutrient intake energy was underesti-
mated by −3.92% and the underestimations are in therange of −0.90% for vitamin C to −5.98% for total fat.These underestimations were significant excepting forcertain nutrients (calcium, vitamin A, C, and β-carote-noids). The significant differences found even when FP24-hR and WFR have identical mean, may be due to thevariance within each group owing to the high variabilityamong individual food consumption (i.e. portion size of
rice consumption varies from 44 g to 400 g betweensubjects), which is subsequently reflected in significantdifferences in nutrient intake. The small underestimationof most of the food groups and all the nutrients may bedue to some hidden foods in the photographs making itdifficult to estimate portion sizes, and failure in memoryof the respondents to identify all the hidden foods in thephotographs.Notwithstanding the significant differences, the FP 24-hR
showed high correlation coefficients in estimating por-tion sizes, in the range of 0.75 (for egg) to 0.98 (forpotatoes and cassava), comparable to those reported inprevious studies (>0.74) [12,15,19], where a photo atlaswas used as a tool for quantifying portion size.Moreover correlations between photographic food record
and weighed dietary record, for energy intake, reportedby previous authors were as high as: from 0.93 to 0.95[20], 0.84 [30], from 0.44 to 0.48 [31], 0.73 [24], 0.79[18] and 0.60 [32]. The correlation coefficient for energyintake reported in this study is 0.99. A few studies havereported correlation coefficients for macro and micronu-trients; for protein 0.83, 0.48, and 0.61; for carbohydrates0.55, 0.52 and 0.68; for fat 0.82, 0.46 and 0.50 werereported respectively by [24,31,32], the FP 24-hR foundcorrelation of 0.99, 0.99 and 0.96 for protein, carbohy-drates and fat respectively. Correlation for vitamins arereported in the range of 0.06 to 0.80 [31] and 0.30 to 0.86
Table 3 Mean nutrient intake and comparison of the results obtained with the methods: FP 24-hR and WFR
NUTRIENT FP 24-hR WFR Pearsonr
MeandifferenceFP24hR –WFRa
95% Limits of agreementb
Mean SEM Mean SEM
Energy [kJ] 5854 262 6092 261 0.99 -238 (-3.99) -683 (-11.5) 206 (3.5)
Protein [g] 46.70 2.23 48.95 2.33 0.99 -2.25 (-4.66) -6.93 (-14.5) 2.43 (5.1)
Total fat [g] 23.59 1.12 25.09 1.12 0.96 -1.50 (-6.0) -5.34 (-21.9) 2.34 (9.6)
Carbohydrate [g] 251 14 260 14 0.99 -8.45 (-3.2) -32.66 (-12.8) 15.8 (6.2)
Dietary fiber [g] 15.6 1.0 16.2 1.1 0.99 -0.63 (-3.7) -2.5 (-15.8) 1.6 (7.9)
Calcium [mg] 254 26 260 25 0.99 -6.20 (-2.4) -48.1 (-18.7) 35.7 (13.9)
Iron [mg] 11.22 0.47 11.82 0.44 0.97 -0.60 (-5.1) -1.92 (-16.7) 0.72 (6.3)
Zinc [mg] 6.54 0.30 6.91 0.30 0.98 -0.37 (-5.4) -1.13 (-16.8) 0.38 (5.7)
Selenium [μg] 89.2 6.2 92.8 6.7 0.98 -3.55 (-3.8) -19.2 (-21.1) 12.1 (13.3)
Vitamin C [mg] 65.1 7.1 65.7 7.25 0.99 -0.59 (-0.9) -11.4 (-17.4) 10.2 (15.6)
Thiamin [mg] 0.78 0.05 0.81 0.05 0.98 -0.03 (-4.0) -0.14 (-17.6) 0.08 (10.1)
Niacin [μg] 11.98 0.55 12.58 0.57 0.97 -0.60 (-4.7) -2.15 (-17.5) 0.96 (7.8)
Folate total [μg] 177 13 185 13 0.98 -8.44 (-4.6) -37.5 (-20.7) 20.6(11.4)
β-Carotenoids [μg] 3087 428 3126 462 0.99 -39.6 (-1.3) -804 (-25.9) 787 (25.4)
Vitamin A [μg RE] 378 43 387 39 0.99 -8.31 (-2.1) -85.4 (-22.3) 68.8 (18.0)
Vitamin E [mg] 2.44 0.15 2.50 0.14 0.97 -0.13 (-5.4) -0.56 (-22.9) 0.29 (11.8)a Mean difference between FP 24-hR and WFR, expressed in the corresponding units for each nutrient and percentage in parenthesis. The percentage wascalculated as: % of the mean difference = ((mean nutrient from FP 24hR- mean nutrient from WFR) / mean nutrient from FWR)*100.b 95% limits of agreement for the difference between the FP 24-hR and WFR, in the corresponding units for each nutrient and percentage in parenthesis, showthe range of under and over-estimation for the agreement between both methods.
Lazarte et al. Nutrition Journal 2012, 11:61 Page 10 of 14http://www.nutritionj.com/content/11/1/61

[32], correlation for minerals from 0.34 to 0.57 [31], andfrom 0.21 to 0.74 [32], the present study reports correla-tions for vitamins and minerals in the range from 0.97to 0.99.The results found with the Bland Altman analysis
showed that the majority of the measurements 95.2% forfood categories and nutrient intake, were scattered alongthe mean difference line and close to the equality line(difference = 0). The plots thus show fairly good agree-ment between estimated and actual food consumed andindicate that the differences (including the outliers) wererandom and did not exhibit any systematic bias, being
consistent over different levels of mean food amount.Results were similar to previous studies, which havereported that the bias between the use of digital photo-graphs and weighed food records was consistent overdifferent levels of energy intake, indicating that the twomethods were comparable, and bias was very low [16,20].In the analysis of food categories, the geometric mean
ratios are close to 1 (from 0.93 for rice to 1.09 for leafyvegetables), and limits of agreement are narrow for mostof the food categories. The ratios of proportional agree-ment indicate that for about 95% of the cases the esti-mated amounts will be between the values of the ratio
a b
c d
Figure 6 Bland Altman plots for nutrient intakes calculated from FP 24-hR and WFR. Differences between the mean dietary intakes ofnutrients calculated from FP 24-hR and WFR against their mean values. The solid line represents the average difference between the FP 24-hRand WFR; the dotted lines show the 95% limits of agreement for the differences. a) Plot for energy intake, b) Plot for calcium intake, c) Plot forvitamin C intake and d) Plot for iron intake. The ranges of proportional agreement are narrow enough to be confident using the photo method.
Lazarte et al. Nutrition Journal 2012, 11:61 Page 11 of 14http://www.nutritionj.com/content/11/1/61
respect to the weighed amount, for example for breadthe geometric mean is 0.98 with limits of agreementfrom 0.79 to 1.22; thus FP 24-hR when is compared withWFR gives values by between 0.79 to 1.22 times theweighed amount of bread. The limits of agreement arerelatively broad for vegetables (0.65 to 1.43) and leafyvegetables (0.70 to 1.69); this may be because the disper-sion of the values in these two food categories increasesas the weight increases.The analysis of nutrient intake showed that the mean
differences between FP 24-hR and WFR were low andthe limits of agreement acceptable, for example the aver-age energy intake estimated by the FP 24-hR was 5854KJ, the mean difference when it was compared to WFRwas −3.92% and the limits of agreement were from anunder-estimate of −11.5% to an over-estimate of 3.5%,most of the nutrients showed similar narrow limits ofagreement. The widest limits of agreement resulted forthe intake of β-carotenoids which presented a smallmean difference −1.27%, but the wide limits of agree-ment from an under-estimate of −25.9% to an over-estimate of 25.4%, similar for vitamin A. In spite of this,the limits are in an acceptable range to guarantee thatthe FP 24-hR can be used in place of the WFR for all thenutrients presented.The small differences, high correlations and good
agreement of the FP 24-hR with the WFR, may be be-cause the food patterns in the study area are simple andless diversified than in urban populations where the foodavailability is wider and includes more processed foodready-to-eat, which might be more complicated to evalu-ate, in addition the use of digital photos and a 24-h recallquestionnaire carried out by an interviewer make possiblefor the respondents to describe the hidden foods in thephotographs or describe poor quality photographs, thusobtaining the most complete data possible. At the sametime the volunteers were motivated with the FP 24-hRwhich involves the use of a simple but interesting and newdevice like a digital camera, because rural populationsin developing countries are not so familiar with digitalcameras. Another important factor that could enhancecompliance with the method is that it is simple andfast, demands less than 2 minutes to take two picturesof each meal, which implies a maximum investment of10 minutes per day to take digital photos of foodconsumption.Very limited data are available about food and nutrient
intake in rural areas in Bolivia. In this study we found anapparently low daily energy intake: mean 5.9 MJ, from3.6 to 9.8 MJ in women 35 ± 8.6 years old. However,similar low energy intake for women in rural areas inSouth America has been reported previously, usingdifferent methods for measuring food consumption. Ina study conducted in Calchaqui - Argentina, a 24-h recall
and a semi-quantitative food-frequency questionnairewere applied and energy intake was estimated to be6.6 MJ [33] in women 43 ± 15.2 years. Furthermore, inUra Ayllu, Peru, low energy intake such as 5.3 to 7.5 MJwas reported by the weighed food record method inwomen 31 ± 6.3 years [34]. Also in a study using multiplepass 24-h recall in a Mexican population the energy intakewas 5.9 MJ in women 32 ± 0.3 years [35].The common food pattern in the currently studied
population is based mainly on carbohydrates like: tubers(potatoes, cassava) and cereals (rice, bread, pasta);accompanied by small portions of protein from eggsor meat (mainly beef and chicken); oil or tallow as sourcesof fat, and a few vegetables and fruits. The composition ofmacronutrients as a percentage of total energy reflectsthe food pattern, in total carbohydrates 72 E%, pro-tein 13 E%, and total fat 15 E%. The macronutrientsconsumption of the study group is within the dietaryrecommendation from the World Health Organization(Total carbohydrates 55–75 E%, protein 10–15 E%, andtotal fat 15–30%) [36]. However, the carbohydrates intakeis nearly in the upper limit and the fat intake is nearly inthe lower limit.Despite the lower energy intake, 56% of the women
had normal BMI (22.80 ± 1.64), 26% and 11% respect-ively were overweight or obese, and only 7% were under-weight. These results are comparable to those found inrural areas with low energy intake such as in an study inCalchaqui- Argentina, which reported 39% of the womenpresenting normal weight [33].A possible limitation in this study might be the undi-
versified food patterns of the population under study;the photo atlas was designed and developed in accord-ance of the specific food patterns in the area, as themethod is aimed to be used in further studies of dietaryassessment in the same area, another limitation is therelatively small number of the volunteers.On the other hand the strengths of the study are: it
was performed under the normal living conditions with-out disruption of the eating behavior, therefore the foodconsumed was representative of their habitual diet, andthe inclusion of a digital camera which is a simple butinteresting device for rural populations in developingcountries may enhance the compliance with the method,and it may be used equally by both genders.
ConclusionsAssessing the dietary intake in rural communities indeveloping countries is more complicated because theindividuals are often illiterate, and not able to keep theirown food records or use scales in a proper way in orderto weigh consumed food. Other obstacles may be thatthey are busy working on farms, which leads to lessspare time over for carrying out demanding dietary
Lazarte et al. Nutrition Journal 2012, 11:61 Page 12 of 14http://www.nutritionj.com/content/11/1/61

assessment methods or self-report methods. Besides it iswell known that when keeping a weighed food diarythere is always a risk that the subject will alter hisnormal diet, while with the interview method it is easierfor the subject to make an incorrect statement about hisfood habits together with the difficulties in correctportion sizes estimation [10].Thus, in order to reduce some of these drawbacks of
the traditional methods used to assess the diet in ruralpopulations, a FP 24-hR method is proposed anddescribed, incorporating digital photographs taken bythe subjects. This procedure is easier, faster, and lessexpensive to use than the WFR method, and it is lessinvasive; thus compliance may be enhanced. Further-more the incorporation of a photo atlas facilitates andimproves the important task of estimating portion sizes.The validity of the method was assessed by several
parameters. Firstly, the median and mean valuesobtained by the FP 24-hR compared well with thoseobtained by the WFR. Secondly, the Pearson and Spearmananalysis showed high values of correlation coefficients,indicating good association between the two methods.Thirdly, the 95% limits of agreement showed acceptablevalues for the difference and, finally, Bland–Altmanplots ensured the absence of systematic bias.The FP 24-hR is associated and in agreement with the
WFR. The photographs are useful as memory aids forthe volunteers during 24-h recall and as an estimationtool for the interviewer. The proposed method is suitablefor assessing the dietary intake of rural populations inlow-income countries, and it may have important impli-cations in clinical practice and research, representing auseful alternative to obtain accurate estimation of nutrientintakes.
AbbreviationsFP 24-hR: Food photography 24-hour recall method; WFR: Weighed foodrecord; BMI: Body mass index; SD: Standard deviation; SEM: Standard error;USDA: United States Department of Agriculture; WHO: World HealthOrganization.
Competing interestsThe authors declare that they have no competing interests.
Authors’ contributionsCEL participated in the study design, as well as design of the questionnairesand photo atlas, performed data collection, statistical analyses and wrote themanuscript. MEE contributed in the design of the questionnaires,development of the photo atlas and data collection. CA contributed to thedevelopment of the photo atlas and data collection. YG participated in thestudy design, design of the questionnaires, statistical analyses, andmanuscript revision. All authors read and approved the final manuscript.
AcknowledgementsFinancial support from the Swedish International Development Agency(SIDA/SAREC) is gratefully acknowledged. We also thank the women whoparticipated as volunteers in this study.
Author details1Department of Food Technology, Lund University, P.O. Box 124, Lund 22100, Sweden. 2Food and Natural Products Center, San Simon University,Cochabamba, Bolivia. 3Departament of Nutrition, San Simon University,Cochabamba, Bolivia.
Received: 27 March 2012 Accepted: 26 July 2012Published: 29 August 2012
References1. Gibson R: Principles of Nutritional Assessment. 2nd edition. New York: Oxford
University Press; 2005.2. Abebe Y, Bogale A, Hambidge KM, Stoecker BJ, Arbide I, Teshome A, Krebs
NF, Westcott JE, Bailey KB, Gibson RS: Inadequate intakes of dietary zincamong pregnant women from subsistence households in Sidama,Southern Ethiopia. Public Health Nutr 2008, 11(04):379–386.
3. Rao S, Kanade A, Joshi S, Yajnik C: Community-specific modifications areessential for objective assessment of maternal dietary intake? PuneMaternal Nutrition Study. Public Health Nutr 2009, 12(09):1470–1476.
4. INE Instituto Nacional de Estadística: Bolivia: Características de la Población.Censo Nacional de Población y Vivienda 2001, serie I Resultados Nacionales.vol. 4th edition; 2002. Document in Spanish.
5. Steyn NP, Nel JH, Parker W-A, Ayah R, Mbithe D: Dietary, social, andenvironmental determinants of obesity in Kenyan women. ScandinavianJ Public Health 2011, 39(1):88–97.
6. Gibson R, Ferguson E: An Iteractive 24-h recall for assessing the adequacy ofiron and zinc intakes in developing countries. In. Washington: Harvest PlusTechnical Monograph Series; 2008.
7. Gibson R, Huddle J: Suboptimal zinc status in pregnant Malawianwomen: its association with low intakes of poorly available zinc,frequent reproductive cycling, and malaria. The Am J Clin Nutr1998, 67(4):702–709.
8. Alemayehu AA, Abebe Y, Gibson RS: A 24-h recall does not provide a validestimate of absolute nutrient intakes for rural women in southernEthiopia. Nutrition 2011, 27(9):919–924.
9. Poslusna K, Ruprich J, de Vries JHM, Jakubikova M, van't Veer P:Misreporting of energy and micronutrient intake estimated by foodrecords and 24 hour recalls, control and adjustment methods inpractice. Br J Nutr 2009, 101(SupplementS2):S73–S85.
10. Bingham SA: Limitations of the Various Methods for Collecting DietaryIntake Data. Ann Nutr Metab 1991, 35(3):117–127.
11. Chambers Iv E, Godwin SL, Vecchio FA: Cognitive strategies for reportingportion sizes using dietary recall procedures. J Am Diet Assoc 2000,100(8):891–897.
12. Nelson M, Atkinson M, Darbyshire S: Food Photography I: the perceptionof food portion size from photographs. Br J Nutr 1994, 72(05):649–663.
13. Nelson M, Atkinson M, Darbyshire S: Food photography II: use of foodphotographs for estimating portion size and the nutrient content ofmeals. Br J Nutr 1996, 76(01):31–49.
14. Ovaskainen ML, Paturi M, Reinivuo H, Hannila ML, Sinkko H, Lehtisalo J,Pynnonen-Polari O, Mannisto S: Accuracy in the estimation of foodservings against the portions in food photographs. Eur J Clin Nutr 2007,62(5):674–681.
15. Turconi G, Guarcello M, Berzolari FG, Carolei A, Bazzano R, Roggi C: Anevaluation of a colour food photography atlas as a tool for quantifyingfood portion size in epidemiological dietary surveys. Eur J Clin Nutr 2005,59(8):923–931.
16. Williamson DA, Allen HR, Martin PD, Alfonso AJ, Gerald B, Hunt A:Comparison of digital photography to weighed and visual estimation ofportion sizes. J Am Diet Assoc 2003,103(9):1139–1145.
17. Swanson M: Digital Photography as a Tool to Measure School CafeteriaConsumption. J Sch Health 2008, 78(8):432–437.
18. Wang DH, Kogashiwa M, Ohta S, Kira S: Validity and reliability of a dietaryassessment method: the application of a digital camera with a mobilephone card attachment. JNSV 2002, 48(6):498–504.
19. Robson PJ, Livingstone MBE: An evaluation of food photographs as a toolfor quantifying food and nutrient intakes. Public Health Nutr 2000,3(02):183–192.
20. Martin CK, Han H, Coulon SM, Allen HR, Champagne CM, Anton SD: A novelmethod to remotely measure food intake of free-living individuals in
Lazarte et al. Nutrition Journal 2012, 11:61 Page 13 of 14http://www.nutritionj.com/content/11/1/61

real time: the remote food photography method. Br J Nutr 2009,101(03):446–456.
21. Humphries K, Traci MA, Seekins T: Food on Film: Pilot Test of anInnovative Method for Recording Food Intake of Adults with IntellectualDisabilities Living in the Community. J Appl Res Intellectual Disabil2008, 21(2):168–173.
22. Gregory R, Walwyn L, Bloor S, Amin S: A feasibility study of the use ofphotographic food diaries in the management of obesity. PracticalDiabetes International 2006, 23(2):66–68.
23. Kikunaga S, Tin T, Ishibashi G, Wang D-H, Kira S: The application of ahandheld personal digital assistant with camera and mobile phone card(Wellnavi) to the general population in a dietary survey. J Nutr SciVitaminol 2007, 53(2):109–116.
24. Small L, Sidora-Arcoleo K, Vaughan L, Creed-Capsel J, Chung K-Y, Stevens C:Validity and reliability of photographic diet diaries for assessing dietaryintake among young children. ICAN: Infant, Child, & Adolescent Nutrition2009, 1(1):27–36.
25. WHO, World Health Organization: Use and interpretation of anthropometricindicators of nutritional status, Bulletin of the World Health Organization,Volume 64; 1986:929–941. http://whqlibdoc.who.int/bulletin/1986/Vol64-No6/bulletin_1986_64(6)_929-941.pdf.
26. Frisancho A: Anthropometric standards for the assessment of growth andnutritional status. Ann Arbor: The University of Michigan Press; 1990.
27. USDA National Nutrient Database for Standard Reference http://www.nal.usda.gov/fnic/foodcomp/search].
28. INLASA: Tabla Boliviana de Composicion de Alimentos. La Paz: Ministerio deSalud y Deportes; 2005. Document in Spanish.
29. Matthiessen TB, Steinberg FM, Kaiser LL: Convergent validity of a digitalimage-based food record to assess food group intake in youth.J Am Diet Assoc 2011, 111(5):756–761.
30. Suzuki AMM, Hattori I, Egami I, Wakai K, Tamakoshi A, Ando M, Nakayama T,Ohno Y, Kamura T: Inter-observer agreement and validity ofphotographic dietary assessment. Jpn Public Health 2002, 49:749–758.
31. Higgins JA, LaSalle AL, Zhaoxing P, Kasten MY, Bing KN, Ridzon SE, WittenTL: Validation of photographic food records in children: are picturesreally worth a thousand words[quest]. Eur J Clin Nutr 2009, 63(8):1025–1033.
32. Wang D-H, Kogashiwa M, Kira S: Development of a New Instrument forEvaluating Individuals' Dietary Intakes. Journal of the American DieteticAssociation 2006, 106(10):1588–1593.
33. Bassett MN, Romaguera D, Samman N: Nutritional status and dietaryhabits of the population of the Calchaqui Valleys of Tucuman, Argentina.Nutrition 2010, 27(11–12):1130–1135.
34. Margaret AG: “No somos iguales”: The effect of household economicstanding on women's energy intake in the Andes. Social Science &Medicine 2004, 58(11):2291–2300.
35. Batis C, Hernandez-Barrera L, Barquera S, Rivera JA, Popkin BM: FoodAcculturation Drives Dietary Differences among Mexicans, MexicanAmericans, and Non-Hispanic Whites. The Journal of Nutrition 2011,141(10):1898–1906.
36. WHO, World Health Organization: Dietary Recommendations in the Report ofa Joint WHO/FAO Expert Consultation on Diet, Nutrition and the Prevention ofChronic Diseases (WHO Technical Report Series 916); 2003. http://whqlibdoc.who.int/trs/WHO_TRS_916.pdf.
doi:10.1186/1475-2891-11-61Cite this article as: Lazarte et al.: Validation of digital photographs, as atool in 24-h recall, for the improvement of dietary assessment amongrural populations in developing countries. Nutrition Journal 2012 11:61. Submit your next manuscript to BioMed Central
and take full advantage of:
• Convenient online submission
• Thorough peer review
• No space constraints or color figure charges
• Immediate publication on acceptance
• Inclusion in PubMed, CAS, Scopus and Google Scholar
• Research which is freely available for redistribution
Submit your manuscript at www.biomedcentral.com/submit
Lazarte et al. Nutrition Journal 2012, 11:61 Page 14 of 14http://www.nutritionj.com/content/11/1/61
Related Documents