University of Tennessee, Knoxville University of Tennessee, Knoxville TRACE: Tennessee Research and Creative TRACE: Tennessee Research and Creative Exchange Exchange Masters Theses Graduate School 5-2018 Validation Of Complete Blood Count Methodology, And Validation Of Complete Blood Count Methodology, And Determination Of The Relationship Between Endoparasite Load Determination Of The Relationship Between Endoparasite Load And Erythrocyte Values In New World Camelids And Erythrocyte Values In New World Camelids Lisa C. Viesselmann University of Tennessee, [email protected] Follow this and additional works at: https://trace.tennessee.edu/utk_gradthes Recommended Citation Recommended Citation Viesselmann, Lisa C., "Validation Of Complete Blood Count Methodology, And Determination Of The Relationship Between Endoparasite Load And Erythrocyte Values In New World Camelids. " Master's Thesis, University of Tennessee, 2018. https://trace.tennessee.edu/utk_gradthes/5076 This Thesis is brought to you for free and open access by the Graduate School at TRACE: Tennessee Research and Creative Exchange. It has been accepted for inclusion in Masters Theses by an authorized administrator of TRACE: Tennessee Research and Creative Exchange. For more information, please contact [email protected].

Welcome message from author
This document is posted to help you gain knowledge. Please leave a comment to let me know what you think about it! Share it to your friends and learn new things together.
Transcript
University of Tennessee, Knoxville University of Tennessee, Knoxville
TRACE: Tennessee Research and Creative TRACE: Tennessee Research and Creative
Exchange Exchange
Masters Theses Graduate School
5-2018
Validation Of Complete Blood Count Methodology, And Validation Of Complete Blood Count Methodology, And
Determination Of The Relationship Between Endoparasite Load Determination Of The Relationship Between Endoparasite Load
And Erythrocyte Values In New World Camelids And Erythrocyte Values In New World Camelids
Lisa C. Viesselmann University of Tennessee, [email protected]
Follow this and additional works at: https://trace.tennessee.edu/utk_gradthes
Recommended Citation Recommended Citation Viesselmann, Lisa C., "Validation Of Complete Blood Count Methodology, And Determination Of The Relationship Between Endoparasite Load And Erythrocyte Values In New World Camelids. " Master's Thesis, University of Tennessee, 2018. https://trace.tennessee.edu/utk_gradthes/5076
This Thesis is brought to you for free and open access by the Graduate School at TRACE: Tennessee Research and Creative Exchange. It has been accepted for inclusion in Masters Theses by an authorized administrator of TRACE: Tennessee Research and Creative Exchange. For more information, please contact [email protected].
To the Graduate Council:
I am submitting herewith a thesis written by Lisa C. Viesselmann entitled "Validation Of
Complete Blood Count Methodology, And Determination Of The Relationship Between
Endoparasite Load And Erythrocyte Values In New World Camelids." I have examined the final
electronic copy of this thesis for form and content and recommend that it be accepted in partial
fulfillment of the requirements for the degree of Master of Science, with a major in Comparative
and Experimental Medicine.
Deanna M. Schaefer, Major Professor
We have read this thesis and recommend its acceptance:
Bente Flatland, John J. Schaefer, Ricardo Videla
Accepted for the Council:
Dixie L. Thompson
Vice Provost and Dean of the Graduate School
(Original signatures are on file with official student records.)
Validation Of Complete Blood Count Methodology, And Determination Of The Relationship Between Endoparasite Load And Erythrocyte Values In
New World Camelids
A Thesis Presented for the
Master of Science Degree
The University of Tennessee, Knoxville
Lisa C. Viesselmann May 2018
ii
ABSTRACT Background: Accurate measurement of RBCs (red blood cells) by automated hematology
analyzers such as the ADVIA 120/2120 requires isovolumetric cell sphering; however, camelid
RBC membranes are resistant to shape change. There are no published reports of method
validation for hematologic analysis of camelid blood. Mycoplasma haemolamae and
gastrointestinal nematodes can cause anemia in camelids. Parasite control programs aim to
suppress parasite loads without promoting resistance, but there are few evidence-based
guidelines for acceptable parasite loads in camelids.
Objectives: 1) Demonstrate whether camelid RBCs sphere in the ADVIA sphering reagent, and
determine the optimal ADVIA setting for CBC (complete blood count) analysis, 2) Compare M.
haemolamae PCR status with RBC values, and 3) Determine the fecal egg count (FEC) threshold
above which RBC values are consistently below the median of the reference interval.
Methods: Camelid and canine blood were each added to ADVIA sphering reagent or saline, and
evaluated by light microscopy for erythrocyte sphering. Camelid blood was analyzed on an
ADVIA 120 hematology analyzer using one of three species settings, and values compared to
manual measurements, including packed cell volume (PCV), Z2 Coulter counter RBC count, and
calculations of other RBC values. Mycoplasma haemolamae was detected by real-time PCR. The
number of trichostrongyle eggs per gram (epg) of feces was determined using the Modified
McMaster’s test.
Results and Conclusions: Camelid erythrocytes do not sphere when mixed with ADVIA sphering
reagent. The ADVIA 120 equine setting provides the closest approximations to Z2 counter RBC
count estimates, but ADVIA results for most other RBC values appear inaccurate. PCV,
iii
hemoglobin, and RBC count are not significantly different between M. haemolamae positive and
negative animals, but are significantly lower in animals with FEC> [greater than] 600epg. For all
animals with FEC>600epg, RBC values are below the medians of the reference intervals. Positive
M. haemolamae PCR is not associated with lower RBC values in healthy camelids, consistent
with previous reports that most infections are subclinical. Maintaining FEC below 600 epg is
recommended in camelids.
iv
TABLE OF CONTENTS
INTRODUCTION ............................................................................................................................... 1 Camelid RBC structure and function ........................................................................................... 1
Overview............................................................................................................................. 1 Studies of camelid RBCs ..................................................................................................... 2
Automated hematology analysis as it relates to camelid RBCs .................................................. 5 Problem 1: The true volume of camelid RBCs is unknown ................................................ 5 Problem 2: Optical hematology analyzers use the Mie theory of light scatter to measure cell volume ......................................................................................................................... 6 Problem 3: Species settings use cell volume to differentiate RBCs from platelets ........... 9 Problem 4: Automated cell volume measurements and RBC counts are used to determine other RBC values ............................................................................................. 11 Problem 5: Mean concentration of RBCs in healthy camelids exceeds the reportable range of the ADVIA ........................................................................................................... 13 What is known currently .................................................................................................. 14
Mycoplasma haemolamae ........................................................................................................ 15 Camelid parasitology................................................................................................................. 17
CHAPTER I AUTOMATED VS MANUAL HEMATOLOGY METHODS ................................................. 21 Abstract ..................................................................................................................................... 22 Background ............................................................................................................................... 23
Camelid erythrocyte structure and function .................................................................... 23 Hematology analyzer methodology ................................................................................. 24
Materials and Methods ............................................................................................................. 26 RBC sphering..................................................................................................................... 26 RBC linearity of the ADVIA ............................................................................................... 27 Determination of appropriate RBC size thresholds – part I ............................................. 28 Determination of appropriate RBC size thresholds – part II ............................................ 30 Patient selection and sample collection ........................................................................... 33 Statistical analyses ............................................................................................................ 36
Results ....................................................................................................................................... 37 RBC sphering..................................................................................................................... 37 RBC linearity of the ADVIA ............................................................................................... 37 Determination of appropriate RBC size thresholds.......................................................... 38 Assessment of bias between automated and manual methods ...................................... 41
Conclusion ................................................................................................................................. 43 CHAPTER II ENDOPARASITES AND ERYTHROCYTE VALUES ........................................................... 49
Abstract ..................................................................................................................................... 50 Background ............................................................................................................................... 51
Mycoplasma haemolamae ............................................................................................... 51 Gastrointestinal nematodes ............................................................................................. 52
Materials and Methods ............................................................................................................. 54 Patient population and sample collection ....................................................................... 54 M. haemolamae and FEC testing ..................................................................................... 56 Statistical analysis ............................................................................................................. 57
v
Results ....................................................................................................................................... 58 Animals ............................................................................................................................. 58 M. haemolamae and RBC values ...................................................................................... 59 Fecal egg count and RBC values ....................................................................................... 59
Conclusion ................................................................................................................................. 61 CONCLUSION ................................................................................................................................. 66 REFERENCES .................................................................................................................................. 67 APPENDIX ...................................................................................................................................... 73 VITA ............................................................................................................................................... 90
vi
LIST OF TABLES
Table 1. RBC linearity data: measured and expected RBC counts ................................................ 76 Table 2. Summary of RBC and platelet counts for whole blood, platelet-poor RBCs, PRP, and PPP.
NA=not applicable; ND=not determined. ............................................................................. 79 Table 3. Method comparison summary of RBC count and MCV between ADVIA and Z2 ............. 82 Table 4. Method comparison summary of Hct and MCHC between automated and manual
methods ................................................................................................................................ 83
vii
LIST OF FIGURES
Figure 1. Methodology for analysis of whole blood, PRP, and RBCs ............................................. 74 Figure 2. Light microscopic images of RBC sphering reactions ..................................................... 75 Figure 3. Correlation scatter plot with regression line for equine RBC dilutions .......................... 77 Figure 4. A) Comparison of mean (black lines) ± 95% CI (blue lines) for Z2 counts on camelid
whole blood B) Comparison of mean ± 95% CI for Z2 counts and ADVIA RBC counts on camelid whole blood ............................................................................................................ 78
Figure 5. Comparison of mean (black line) ± 95% CI (blue lines) for Z2 counts on platelet-poor RBCs ...................................................................................................................................... 80
Figure 6. Comparison of mean (black line) ± 95% CI (blue lines) for ADVIA platelet counts (equine setting) and Z2 counts on PRP .............................................................................................. 81
Figure 7. Comparison of ADVIA platelet counts with a manual platelet estimate ........................ 84 Figure 8. Comparison of RBC values between Mhl-positive and Mhl-negative camelids ............. 85 Figure 9. Comparison of spun PCV A) between Mhl-positive and Mhl-negative animals with
FEC>600 epg, and B) between Mhl-positive animals with CT values<30.0 and Mhl-negative animals .................................................................................................................................. 86
Figure 10. Comparison of RBC values between FEC strata (low = <450 epg; 600 = 600<FEC<1000; 1000 = ≥1000 epg) ................................................................................................................ 87
Figure 11. Distribution of hemoglobin concentration by FEC ....................................................... 88 Figure 12. ROC curve analysis for HGB and spun PCV, using an FEC threshold of 600 epg .......... 89
1
INTRODUCTION
Camelid RBC structure and function
Overview Camelid species, including the camel (Camelus dromedarius and C. bactrianus), llama (Lama
glama), alpaca (Vicugna pacos), vicuña (Vicugna vicugna), and guanaco (Lama guanicoe), have
erythrocytes that are unique in shape, size, and biochemical composition compared to those of
other mammalian species, including humans. In contrast to the biconcave disc shaped RBCs of
most mammalian species, camelid RBCs are elliptical and flat, and have a smaller volume than
those of many other animals.1-4 Additionally, camelid RBCs are rigid, less deformable, and less
susceptible to osmotic lysis than those of other mammals.2,4,5 Deformability, or the ability of a
cell to change its shape without breaking, is typically considered a beneficial feature for RBCs as
they flow through vessels of varying size (large arteries to small capillaries), and are subjected to
shearing stresses in flowing blood.6 In human patients with hereditary elliptocytosis as a result
of various RBC membrane protein deficiencies, a diagnostic hallmark of the disease is RBC
fragmentation secondary to decreased deformability.7 A report of canine elliptocytosis also
documented both decreased deformability and decreased mechanical stability of RBC
membranes in the proband compared to a healthy control dog, although RBC fragmentation was
not sufficient to cause clinically significant hemolysis in this case.8 However, the flat, elliptical
shape and rigidity of the camelid RBC appear to offer physiologic benefits for these animals,
likely by providing increased effective surface area for gas exchange (important in high altitude
environments with low oxygen tension), and by increasing the cells’ resistance to osmotic lysis
(important in arid environments where water is rapidly consumed in large volumes when it is
found).4 The potential problem of fragmentation as an elliptical, relatively non-deformable cell
2
passes through small capillary beds appears to be averted in these species as a result of their
small cell size.4
Studies of camelid RBCs Camelid RBCs have been the subject of intensive study by both clinical and basic scientists due
to their unique physical and biochemical properties. The elliptical shape of camelid RBCs on
stained blood films was first described in 1875,9 and approximately 100 years later the scanning
electron microscope (SEM) provided a three-dimensional image of these cells, which multiple
authors have described as “thin and wafer-like.”10,11 SEM images of both camel and llama
erythrocytes mixed with human erythrocytes showed that camelid RBCs are both smaller and
flatter than human RBCs.12 The author of the same study also concluded that camelid RBCs have
a higher concentration of hemoglobin within their smaller volumes, based on a higher relative
mean corpuscular hemoglobin concentration (MCHC) compared to that of human RBCs analyzed
with the same method.12 This finding has also been described in more recent reviews of camelid
hematology.2 In 2005, Bogner, et al. demonstrated that camel erythrocytes have similar water
to protein dry mass ratio as dehydrated human erythrocytes.13 Given that water-protein
interactions increase the osmotically non-responsive fraction of water within the cell, an
increased protein (hemoglobin) concentration within camelid erythrocytes may contribute to
the decreased rate of diffusion of water out of the cells, consequently increasing their resistance
to dehydration relative to human erythrocytes.13 The same group of researchers suggested that
although the concentration of water in camel and llama erythrocytes is lower than that of
normal human RBCs, the osmotically non-responsive (protein-bound) fraction of water is
actually higher, possibly due to increased numbers of charged amino acid residues on their
hemoglobin molecules, increasing the hydrophilicity of camelid hemoglobin.14 The combination
3
of increased hemoglobin water affinity and cellular hemoglobin concentration in camelid RBCs
may therefore reflect an adaptive resistance to osmotic dehydration in arid environments.13,14
The high water-binding capacity of camelid RBCs may also make them more resistant to over-
hydration, as might occur after rapid consumption of a large volume of water following a period
of dehydration. Camel RBCs have been shown to expand their volume up to 196% with
exposure to hypotonic saline prior to lysing (low osmotic fragility), despite the general trend of
increasing osmotic resistance with increasing cell volume among other domestic animals.15 In
an SEM study of camel RBCs following experimental dehydration and rehydration, minimal
changes were observed in RBC size and shape, and manual hematocrit and refractometric
plasma protein measurements changed by less than 5% over the course of the study, suggesting
a mechanism of rapid equilibration of water between intracellular and extracellular
compartments.16
In addition to intracellular differences in hemoglobin structure and concentration, camelids also
exhibit differences in their RBC membrane structure and protein composition compared to
other domestic mammal species. While camel RBC membranes have similar lipid composition
relative to those of humans and other mammals, the overall ratio of proteins to lipids in the RBC
membranes is increased (approximately 3:1).17 Additionally, while camel RBCs appear to have
similar membrane proteins as those described in humans, the distribution and relative
proportions of these proteins differ between the species. Gel electrophoresis studies of
extracted membrane proteins show that camel RBCs have identifiable bands comparable to
human peripheral membrane proteins (spectrins) and integral membrane proteins (band 3,
band 5, etc). However, the peripheral membrane protein bands are smaller and the integral
4
membrane protein bands (especially band 3) are more distinct and appear to predominate.17
This study also demonstrated that the integral membrane proteins are more closely organized in
the camel RBC membrane, compared to the peripheral membrane proteins which have a similar
concentration per unit of surface area as those in the human RBC membrane. These authors
suggested that the interactions of these integral membrane proteins contribute to increased
mechanical stability of camel RBCs (observed in response to sonication). Furthermore,
reversibility of these protein interactions might allow for the dynamic swelling (vs. lysis) of the
membrane that has been observed in response to plasma hypotonicity.15,17 Mechanical stability
has also been demonstrated in the form of decreased deformability of camel RBCs when
exposed to fluid shear stresses. In contrast to the erythrocytes of most other domestic mammal
species, which deformed readily under shear stress, camel (and llama) erythrocytes did not
deform but became oriented in the direction of the fluid flow.18
Additional work with camel and alpaca erythrocytes suggest that RBC membrane stability in
these species is at least partially due to interactions between band 3 and peripheral membrane
proteins such as ankyrin and protein 4.1, as removal of these proteins as well as the cytoplasmic
portion of band 3 resulted in increased rotational mobility of band 3 (decreased structural
organization within the membrane).19 Studies using llama erythrocytes have resulted in similar
findings, namely that there is a 2.5-3x higher concentration of band 3 in camelid RBC
membranes compared to human RBCs as a consequence of decreased relative surface area
between the species (the absolute number of band 3 proteins is similar).20 The mechanical
benefit of this higher concentration of integral membrane proteins seems appropriate, however
5
the physiologic significance of having an increased concentration of this anion transport protein
is uncertain.20
Camelid erythrocytes have decreased water content, increased resistance to osmotic and
mechanical lysis, and decreased deformability, features which are important for life in arid
environments. However, these animals are also adapted to high altitude environments as a
result of increased oxygen affinity of their RBCs relative to other mammalian species. This high
RBC oxygen affinity has been documented in all camelid species (wild and domestic), regardless
of whether the animals are currently living at high altitudes, suggesting that it is an intrinsic
characteristic of the Camelidae family. Increased oxygen affinity in this family appears to be
secondary to amino acid substitutions in hemoglobin that limit its binding to 2,3-
diphosphoglycerate (2,3-DPG), the primary molecule responsible for decreasing in vivo
hemoglobin oxygen affinity.21,22 Adult alpacas also retain higher proportions of fetal hemoglobin
molecules than adult animals of other species, which have higher affinity for oxygen than adult
hemoglobin molecules.4
Automated hematology analysis as it relates to camelid RBCs Several of the unique structural features of camelid RBCs described above contribute to
adaptation to life in arid and/or high altitude environments, however these same features also
pose challenges for accurate hematological analysis of camelid blood.
Problem 1: The true volume of camelid RBCs is unknown Despite all of the work that has been done to characterize the structure and molecular
composition of camelid erythrocytes, the true volume of these cells is not known. This is an
issue because all modern hematology analyzers, both electrical impedance and optical flow
6
cytometer based systems, determine cell counts in part by user-determined cell volume
thresholds.23 The first step in obtaining accurate automated RBC counts is therefore to know
the expected cell volume of the species being analyzed. Automated flow cytometry analyzers
are capable of directly measuring the volume of individual RBCs, 23-25 however this methodology
is dependent on specific changes in cell shape that may not be observed in camelid RBCs as a
consequence of their unique structural features (see below).
Manual methods for estimating mean RBC volume in a whole blood sample have been utilized
to validate automated hematology methods in several species. 24,26,27 In most species, manual
mean cell volume (MCV) calculations involve obtaining a RBC count from a validated method
(i.e. counts from a hemacytometer or particle counter) and dividing this by the packed cell
volume (PCV) of the blood sample obtained by simple centrifugation. Manual estimates of MCV
in camelids have been reported, with the most recent studies providing reference intervals of
21-28 fL for alpacas and 21-31 fL for llamas, although these are still rather imprecise
approximations.3,28-30 Compared to other common domestic mammals such as the dog, the
estimated camelid MCV range is lower. However, this finding is consistent with the results of
visual side by side comparisons of camelid and human RBCs, in which the camelid cells appear
consistently smaller in overall dimensions (length, width, and depth).12
Problem 2: Optical hematology analyzers use the Mie theory of light scatter to measure cell volume The majority of automated hematology analyzers currently used in veterinary clinics and
reference laboratories utilize flow cytometry to measure and differentiate blood cells. In flow
cytometers, cells suspended in fluid pass single file through a narrow laser beam, and the cells
7
are identified and counted based on how they scatter light from the laser.23 In the ADVIA 120
and 2120 hematology systems used in the present study, the two primary light scatter
measurements for RBCs are low-angle (2-3o) and high-angle (5-15o) scatter, which translate into
cell volume (in fL) and hemoglobin concentration (in g/dL), respectively.25 The analyzer’s
interpretation of these low-angle and high-angle light scatter measurements is based on the
mathematical principle of Mie theory, which works on the key assumption that the cell is a
perfect sphere with homogeneous volume and refractive index.24,25
In the ADVIA 120/2120, before the RBCs interact with the laser beam, they are first exposed to
the ADVIA RBC/PLT reagent, which is a proprietary combination of sodium dodecyl sulfate and
glutaraldehyde fixative. This reagent interacts with the plasma membrane to convert the RBCs
(and platelets) in the blood sample into isovolumetric spheres so that accurate direct volume
and hemoglobin concentration measurements can be made for individual cells as they pass
through the laser. These individual measurements are then averaged by the analyzer to provide
the MCV and CHCM (corpuscular hemoglobin concentration mean) indices commonly used by
clinicians when evaluating RBC disorders.25 MCHC (mean corpuscular hemoglobin
concentration) is another RBC index that is often used interchangeably with CHCM, although
this value is calculated by the analyzer rather than derived from direct cell measurements.
Flow cytometry analyzers have been validated for several domestic animal species, and
veterinary software is available with pre-set volume and hemoglobin concentration (HC)
thresholds for a variety of species on the ADVIA.31,32 However, there is evidence to suggest that
camelid RBCs may not exhibit the deformability necessary to be transformed into isovolumetric
8
spheres by the ADVIA’s RBC/PLT reagent. Khodadad, et al. performed a study in 1983 in which
llama and human erythrocytes were exposed to a variety of conditions, including
hyperosmolarity, ATP (adenosine triphosphate) depletion, and mixture with a non-ionic
detergent. While human RBCs exhibited marked alterations in morphology in each of these
scenarios, the llama RBCs remained essentially unchanged on SEM imaging, retaining their flat
elliptical shape.20 A separate study performed by Omorphos, et al. in 1989 also showed that
camelid RBCs are resistant to shape changes induced by various drugs and metabolic conditions
in RBCs of humans, and those of another artiodactyl outside of the Camelidae family (oryx).5 In
both studies, the resistance of the camelid erythrocytes to shape change was attributed to
structural differences in their cell membranes, as described in the preceding section. To date,
no research has been published to demonstrate a specific resistance to sphering by the RBC/PLT
reagent, however based on these previous studies it seems highly unlikely that camelid RBCs
would undergo this shape change.
Given that the analyzer’s direct volume and HC measurements are dependent on light scatter
properties of a homogeneous sphere, the ADVIA’s MCV and MCHC indices are likely to be
inaccurate for camelids, although it is unclear exactly how they would be affected. Various
studies have been performed in an attempt to document the light scatter properties of
ellipsoids33 and non-spherical RBCs in different orientations,34 and a “straight-ray
approximation” has been proposed as an alternative method of volume measurement for non-
spherical RBCs.35 However, this information is still in the realm of basic physics, and is not
currently practically applicable to the analysis of large numbers of RBCs in a patient sample.
9
The inaccuracies of MCV and MCHC values from automated analyzers have been documented in
dehydrated human RBCs, and in human patients with decreased deformability of their RBCs.36,37
In one of these studies, the use of an optical hematology analyzer on dehydrated RBCs resulted
in an overestimation of MCHC and an underestimation of MCV. The authors acknowledged that
inadequate sphering of the RBCs in these samples likely contributed to inaccurate
measurements, and cautioned against interpreting RBC size and hemoglobin concentration
based solely on automated measurements, recommending calculation of these values from a
manual PCV instead.37 Similar observations have been made in human patients with sickle cell
anemia, in which irreversibly sickled RBCs exhibit decreased deformability (and likely incomplete
sphering) as a consequence of polymerized abnormal hemoglobin bound to band 3 membrane
proteins.38 Hemograms from these individuals show a broader range of cell volume and
hemoglobin concentration measurements, and it is suspected that automated MCV and MCHC
measurements of these samples are also inaccurate.37
Problem 3: Species settings use cell volume to differentiate RBCs from platelets Another challenge in camelid hemogram interpretation arises from a lack of certainty that the
automated RBC count provided by flow cytometry analyzers represents the true RBC
concentration in a given sample. The ADVIA 120/2120 systems use the same cytometer channel
to analyze both RBCs and platelets (PLT). Cells with volumes between 0-200 fL and hemoglobin
concentrations between 0-50 g/dL are documented on the RBC volume/HC cytogram and
respective volume and HC histograms.32 Since PLTs have volumes greater than 0 fL and lower
refractive indices than RBCs, they are included in the bottom left corner of the RBC cytogram.
The analyzer then divides the optical reading area for RBCs and PLTs at the 30 fL threshold – all
cells with volumes greater than 30 fL are included in the RBC optical read area and counted as
10
RBCs, while cells with volumes between 0-30 fL are included in the PLT optical read area and PLT
count, and mapped on a separate PLT cytogram.32 The ADVIA uses “integrated RBC/platelet
analysis” to differentiate large PLTs (volumes between 20-60 fL) from other small particles of
similar size, such as microcytic RBCs, RBC fragments, and RBC ghosts. This analysis is performed
on the basis of combined volume and refractive index measurements for individual cells.25,32
Accurate RBC and PLT counts are therefore primarily dependent on accurate cell volume
measurements, which in turn are dependent on the cells undergoing adequate sphering
reactions. While there is no evidence to suggest that camelid PLTs are not susceptible to
sphering reactions in the RBC/PLT reagent, their RBCS appear to be resistant to this shape
change, as described above. It therefore seems possible for a small RBC to be incorrectly sized
and counted as a platelet, or vice versa. Additionally, since camelid RBCs are suspected to be
smaller than those of other mammalian species, including humans, even an accurately sized RBC
may fall into the PLT volume range if the appropriate species threshold is not used.28,39 In
human patients with microcytic anemia, the potential for overestimation of platelet counts by
optical analyzers has been recognized.40 One recent study identified the use of the reticulocyte
channel as a method to improve the accuracy of optical platelet counts in these patients, since
the platelets take up thiazole orange stain but the mature, microcytic RBCs do not.40
The ADVIA’s veterinary software allows for the analysis of a blood sample according to multiple
pre-defined species settings, which set different thresholds for the ideal volume and
hemoglobin concentration measurements of RBCs. For example, the pre-determined volume
threshold for the goat setting is lower than that for the dog setting, since goats are known to
11
have lower MCVs than dogs. Analyzing the same blood sample on multiple species settings will
provide different absolute RBCs counts and RBC indices (MCV, MCHC, etc), as will manually
altering the manufacturer’s pre-set thresholds for a given species setting.41 This suggests that if
the true expected volume of camelid RBCs was known, the ADVIA could be used to provide
accurate RBC counts. However, as stated in the first problem, the true volume of camelid RBCs
is still uncertain.
Even though electrical impedance counters are less dependent on a specific cell shape than
optical flow cytometers, they still use size thresholds to determine which particles to include in
their counts, and to separate cell populations.23,42,43 Overestimation of PLT counts by electrical
impedance methods has been described in human patients with microcytic anemia, specifically
those with MCVs less than 70 fL.40 Knowledge of camelid RBC volume is therefore important for
obtaining accurate RBC counts regardless of which automated instrument is utilized.
Problem 4: Automated cell volume measurements and RBC counts are used to determine other RBC values Automated flow cytometry analyzers such as the ADVIA 120/2120 provide several RBC values
which are the result of direct measurements of individual cells, including MCV and CHCM.
Absolute RBC counts are also directly measured by the analyzer, as described above, although
they are dependent on the initial cell volume measurement. Other values, such as hemoglobin
concentration (HGB) of the blood sample, are the result of direct chemical analysis that is not
dependent on cell size, shape, or number.
12
In the ADVIA 120/2120, HGB is measured spectrophotometrically after lysis of the RBCs.25 The
active ingredient in most RBC lysis buffers is ammonium chloride, which causes colloid osmotic
lysis following diffusion of NH3 into the cells, subsequent anion exchange via band 3 proteins,
and ultimately net influx of chloride anions.44 Studies utilizing various concentrations, volumes,
and incubation times of ammonium chloride solutions have been performed with alpaca blood,
however these studies do not describe an endpoint for measurement of complete hemolysis (or
potentially a lack thereof).45,46 A separate study using camel blood described incomplete lysis of
the RBCs after incubation with an ammonium chloride buffer solution.47 Additionally, protein
electrophoresis of RBC membrane ghosts from humans and llamas shows residual hemoglobin
in the llama membranes, suggesting incomplete lysis of the RBCs during ghost preparation.20
However, additional research into the susceptibility of camelid RBCs to lysis with colloid osmotic
buffers is lacking, and the specific composition of the ADVIA 120/2120 hemoglobin reagent is
unknown. The hemoglobin concentrations measured by the ADVIA in the present studies
appear physiologically appropriate, and are similar to those described by other investigators.3,28
Ultimately, however, the degree to which camelid RBCs undergo hemolysis in the ADVIA
120/2120 hemoglobin reagent is uncertain, and warrants further investigation.
Additional values relating to erythron evaluation are calculated, rather than directly measured,
by the analyzer. One of these calculated values is hematocrit (HCT), which is analogous to the
sample’s packed cell volume (PCV), a value that is often obtained manually after centrifugation
of whole blood. The ADVIA calculates HCT as a product of the RBC count and the MCV.
Therefore, if the measured RBC count and MCV of a sample are suspected to be inaccurate, then
the analyzer’s HCT calculation will also be inherently inaccurate. As mentioned briefly above,
13
most automated hematology analyzers including the ADVIA 120/2120 also provide a calculated
mean RBC hemoglobin concentration (MCHC), which is often nearly identical to the measured
CHCM in most species.25 The MCHC is derived from division of the hemoglobin (HGB)
concentration of the sample by the calculated HCT. While HGB may be unaffected by the other
problems which plague automated camelid hematology analysis (see above), the MCHC value
will be inaccurate in camelids due to its incorporation of the analyzer’s calculated HCT. Previous
studies have suggested measuring a manual PCV and substituting this value for HCT in the MCHC
equation.3,28
Problem 5: Mean concentration of RBCs in healthy camelids exceeds the reportable range of the ADVIA Automated camelid RBC counts from both flow cytometry and impedance analyzers are
susceptible to error as a consequence of their dependence on accurate individual cell volume
measurements, as described above. These values are therefore suspected to be inaccurate,
although the degree of error and difference from the true value (bias) for each method are
uncertain. Additionally, camelids are known to have a higher concentration of RBCs in their
peripheral circulation (millions of cells/µL of blood) than many other species. Estimates of
absolute RBC counts in camelids range from 10-17 million cells/µL, with some reports of counts
approaching 18 million cells/µL.3,4 This fact is problematic because the upper end of the
reportable range for RBC counts on the ADVIA 120/2120 is 7 million cells/µL.31
Reportable range (also known as analytic measurement range), as defined by the Clinical
Laboratory Improvement Amendment (CLIA) and the College of American Pathologists (CAP), is
the “range of analyte values that a method can directly measure on the specimen without any
dilution, concentration, or other pretreatment not part of the usual assay process.”48 This range
14
is determined by assessing an instrument’s linearity, or the presence of a straight-line
relationship between measured analyte value and the true specimen value (equivalent to a
slope of 1 on an x vs. y scatterplot). The upper end of the reportable range is typically defined
as the highest analyte concentration at which this linear relationship is observed, or in other
words the highest instrument value that can be trusted as accurate for a particular analyte.48 An
important question when analyzing camelid blood is therefore whether the ADVIA will
underestimate the RBC count when the true RBC concentration exceeds the instrument’s
reportable range. Additionally, because RBCs are present in such high concentrations in healthy
camelids, it is possible that the cells would not flow single-file through the path of the laser
beam, leading to a falsely decreased absolute count as multiple cells are counted as one. For
this reason, it has been suggested that impedance particle counters might provide more
accurate RBC counts than optical flow cytometry analyzers, although it is important that the
correct size thresholds and sample dilutions are used, as described above.3
What is known currently In summary, there is abundant evidence to suggest that automated complete blood count
analysis in camelid species is inaccurate. However, validated methods to improve the accuracy
of this analysis are lacking. Current recommendations include manual measurement of a PCV
instead of using the ADVIA’s HCT, and calculation of MCV and MCHC based on the PCV.28
However, the MCV calculation includes the RBC count, so the accuracy of this calculated value is
still dependent on obtaining an accurate absolute RBC concentration. To date, there is no
validated, standardized method for obtaining a trusted RBC count in camelids, either by
automated (flow cytometer or impedance) or manual (hemacytometer) methods, and previous
studies reporting hematologic reference intervals for these species have utilized different
15
methods.3,28,39 Several advanced techniques have been described in human hematology to aid
in the characterization of RBC size and morphology in various disease states, however the
practical applicability of these methods for analysis of large numbers of RBCs in clinical blood
samples has yet to be determined.49,50
Mycoplasma haemolamae Hemotropic mycoplasma (hemoplasma) infections have been described in numerous vertebrate
species, with nearly global geographic distribution. Many of these wall-less bacterial organisms
belong to the genus Mycoplasma, which combines organisms previously classified as
Hemobartonella or Eperythrozoon.51 Some hemotropic mycoplasmas, including M.
haemolamae, have an additional qualifier of Candidatus, indicating that aspects of their biology
are not fully described.52 Throughout the remainder of this thesis, this organism will be referred
to as M. haemolamae. Mycoplasma organisms have specific host ranges, but these organisms
share similar morphologic characteristics in all host species, being observed epicellularly as small
basophilic ring, coccoid, or rod-shaped structures on the surface of RBCs on Wright’s stained
blood smears, which occasionally cause slight indentations of the cell membranes. If there is a
delay in blood smear preparation, the bacteria can fall off the RBCs ex vivo, leading to their
appearance extracellularly in the background of the smear, and potentially increasing the
likelihood that they may be mistaken for artifact.52 In recent years, sequencing of the M.
haemolamae genome has allowed for development of a polymerase chain reaction (PCR) assay
for more definitive diagnosis of infection in camelid blood samples.53,54
16
Clinical disease caused by the hemotropic mycoplasmas often involves anemia. Clinical anemia
due to extravascular hemolysis is observed with hemoplasma infections in cats and pigs.52,55 In
other species (dogs, ruminants, camelids), splenectomy or immunologic compromise is often
necessary to observe clinical disease in bacteremic animals.51,52 Hypoglycemia has also been
noted in cases of clinical Mycoplasma infections, although the pathophysiology of this finding is
uncertain.52 In camelids, clinical anemia (defined as decreased PCV in most reports) has been
described in cases of M. haemolamae infections, although clinically affected animals are usually
young, stressed, or debilitated by a concurrent illness (such as gastrointestinal parasitism or
malnutrition), or otherwise immunosuppressed. Clinical disease in otherwise healthy, adult
animals infected with M. haemolamae appears to be uncommon.3,52,56,57
In most species, transmission of these organisms is presumed to occur via arthropod vectors
(fleas, ticks, etc), however supporting evidence for this presumption is lacking.52 Vertical
transmission of M. haemolamae is also suggested in camelids based on reports of bacteremia
with or without clinical disease in 1- and 4-day old crias.58,59 In the 1-day old llama, neither the
cria nor the dam were anemic, however large numbers of Mycoplasma organisms were
observed on the cria’s blood smear. Organisms were not observed on a blood smear from the
mother, although PCR assays were not available at the time of this report to definitively exclude
the possibility of maternal bacteremia.58 In contrast, the 4-day old alpaca was anemic with large
numbers of organisms observed on a blood smear. The dam in this case was not anemic and did
not have organisms on a blood smear, but both the dam and cria had PCR evidence of M.
haemolamae infection.59
17
The development and increasing availability of the M. haemolamae PCR assay has allowed for
assessment of the prevalence of this infection in camelid populations, which appears to vary
substantially based on geographic location and likely other husbandry-related factors. In a 2010
study of alpacas and llamas in Chile and Peru, the prevalence of infection ranged from 9-19%.56
A slightly higher prevalence was identified in an alpaca population in England (29%),60 while a
much lower prevalence was described in a group of 206 alpacas in New Zealand (0.97%).61
Despite their utility in diagnosing the presence of the bacteria, interpretation of M. haemolamae
PCR results can be difficult. As noted above, clinical illness secondary to this infection is
uncommon in otherwise healthy adult camelids, so the significance of a positive PCR assay is
uncertain. If the animal is healthy, is it at increased risk of developing anemia? If the animal is
anemic, is the anemia a direct consequence of M. haemolamae infection, or is there evidence of
a concurrent disease process (i.e. gastrointestinal parasitism or systemic inflammation) that may
be contributing to the decreased RBC mass? Additionally, there is experimental evidence which
indicates that infected alpacas may remain PCR positive for M. haemolamae after treatment
with oxytetracycline, despite the clearance of visible organisms from blood smears and
resolution of clinical anemia.62 Additional research is needed to further investigate the
relationship between M. haemolamae PCR status and RBC values in cases of apparent
subclinical infection.
Camelid parasitology Gastrointestinal (GI) nematode infestations represent another common source of potential
clinical illness in camelid species living in the southeastern United States. Commonly identified
nematodes include: Haemonchus contortus, Trichostrongylus axei, Teladorsagia circumcincta,
18
Ostertagia ostertagi, Lamanema chavezi, Nematodirus batti, Aonchotheca (Capillaria) spp.,
Trichuris spp., and Oesophagostomum spp.63 Of these parasites, only Lamanema chavezi is
specific to llamas and alpacas; the remainder are also found in small and/or large ruminant
species.63,64
The clinical significance of many of these nematodes in camelids is uncertain, with the exception
of H. contortus, which is a strongylid nematode known to cause severe hemorrhagic anemia.
The pathogenesis of H. contortus infections has been well-defined in sheep,65 and recently in
llamas and alpacas.66 H. contortus resides in the abomasum of sheep and goats, and in the third
gastric compartment (C3) of camelids. Whole blood is lost as the worms feed on the mucosal
blood supply, as well as secondary to mucosal irritation. Clinical signs of anemia often include
mucous membrane pallor, weight loss, and submandibular edema.66
In contrast to M. haemolamae infections, in which the relationship between PCR status and
susceptibility to clinical disease is uncertain, the link between H. contortus infections and clinical
anemia is well known. Several methods exist for diagnosis and differentiation of GI nematode
infections, including identification of adult worms within the GI tract at necropsy, various fecal
flotation and egg counting methods, fecal culture, PCR, and lectin staining.63,66,67 Fecal flotation
and calculation of a fecal egg count (FEC) is one of the most common ante-mortem diagnostic
methods for GI nematodes, and is also commonly used as a screening test at the herd level to
determine the proportion of animals likely to be shedding large numbers of eggs onto the
pasture. Screening of animals within a herd based on body condition scoring and FAMACHA
scores (see below) is currently recommended in order to allow for targeted deworming of
19
animals likely to have high egg counts, since unnecessary deworming of the entire herd is likely
to decrease refugia and promote resistance of the parasites to commonly used medications,
limiting the efficacy of these treatments when animals become clinically ill.68
The modified McMaster technique for obtaining FECs is most often described, in which a fecal
sample is mixed with a flotation solution and then loaded into a counting chamber. Microscopic
evaluation of the chamber allows for the visual identification of egg types (strongylid vs. other
nematode vs. coccidia, etc). Variations of this technique have been reported, although the use
of a sucrose flotation solution with a specific gravity of 1.200-1.350, and a chamber volume of
1.0 mL seem to yield the highest stronglyid egg counts in both sheep and camelids.67,69 In
addition to identifying the presence of a parasite infestation, an FEC also provides a semi-
quantitative assessment of the animal’s nematode burden, since a larger number of adult
female worms in the gastric compartment would be expected to produce a proportionally larger
number of eggs.65,70 Although strongylid eggs of all species appear similar on flotation,
necessitating the use of additional techniques (larval culture, lectin staining, etc) to differentiate
them, H. contortus is the nematode which is most commonly present, and of most clinical
concern.66 Additionally, both FEC and adult worm numbers have been shown to exhibit a linear
relationship with the amount of blood loss in sheep experimentally infected with H. contortus.70
The FAMACHA system (named for its inventor, Dr. Francois “Faffa” Malan) is another method
commonly associated with diagnosis of GI nematode infections in small ruminants and camelids.
The conjunctival mucous membrane color of an animal is compared to a standardized card with
five shades of pink (ranging from white to bright pink-red). This is used to provide an estimate
20
of the severity of the animal’s anemia and its relative need for deworming medication, given
that H. contortus infection is the most likely cause of clinical anemia. Pale white mucous
membranes correspond to a score of 5, which is the most severe degree of anemia. Bright pink
mucous membrane color would receive a score of 1 (clinically normal). In one study in sheep
and goats, a FAMACHA score of 3 correlated to an FEC of approximately 1000 eggs per gram
(epg), although there appears to be substantial geographic variation in typical FEC ranges.71 This
system has high specificity and fair sensitivity for detection of anemia in sheep and goats, 71 and
in alpacas and llamas, 72 and there is good correlation between FAMACHA scores and HGB and
HCT measurements of peripheral blood.73
Positive correlation has also been demonstrated between FEC and PCV in clinically ill alpacas
and llamas, 66 and in experimental and natural H. contortus infections in sheep.73,74 To date, no
research has been done to determine whether there is a correlation between FEC and RBC
values in clinically healthy camelids, and there is also a lack of certainty in the interpretation of a
clinically significant FEC value in otherwise healthy animals. In one study performed in the
southeastern United States, the majority of anemic camelids had an FEC of ≥1000 epg, 72 while
in another study performed in New Zealand a fecal egg count of 250 epg was reported as “high
and clinically significant.”61

21
CHAPTER I AUTOMATED VS MANUAL HEMATOLOGY METHODS
22
Abstract Background: Accurate measurement of erythrocyte values by automated hematology analyzers
requires isovolumetric sphering of the cells. Camelid erythrocytes have unique membrane
characteristics, which make them resistant to sphering. Validation of an optimized method for
hematologic analysis of camelid blood has not been published.
Objectives: Demonstrate whether camelid erythrocytes sphere in the ADVIA RBC/PLT reagent (a
sphering reagent), and determine the optimal ADVIA setting for camelid CBC analysis.
Methods: Camelid and canine blood were each added to ADVIA RBC/PLT reagent or saline at a
1:625 dilution, and evaluated by light microscopy for erythrocyte sphering. Camelid blood (n =
25) was analyzed on a Z2 Coulter counter using one or more lower volume thresholds (4, 5, 6, 8,
10, 12 fL) to determine the optimal threshold for manual RBC quantification. Additional camelid
blood (n = 132) was analyzed on an ADVIA 120 hematology analyzer using one of three settings
(bovine, equine, camelid). The analyzer’s playback feature was used to obtain data using the
other two settings. The playback feature was also used to obtain data using the goat setting on
a subset of samples. A manual packed cell volume (PCV) was measured, and manual
calculations performed for mean cell volume (MCV) and mean cell hemoglobin concentration
(MCHC). RBC values (RBC count, MCV, MCHC, and HCT) were compared between all ADVIA
settings, and between each setting and manual calculations using Passing-Bablok regression and
Bland-Altman plots.
Results: Canine erythrocytes sphere when mixed with ADVIA RBC/PLT reagent, while camelid
erythrocytes do not. The ADVIA 120 equine and camelid settings are identical and provide the
closest approximations to manual estimates of erythrocyte and platelet counts. MCV, MCHC,
and HCT from all settings are significantly different from manual calculations. The 8 fL threshold
23
of the Z2 Coulter counter yields the highest RBC count, although some platelets may be included
in the count.
Conclusions: Camelid erythrocytes do not sphere, resulting in inaccurate erythrocyte values
from automated hematology analyzers. Optimal determination of CBC data requires a
combination of automated and manual methodologies.
Background Results from an automated veterinary hematology analyzer are highly dependent on the species
setting that is used to analyze the blood sample, as these settings must be optimized to account
for differences between species. This is especially true for values related to erythrocytes and
platelets. It has historically been difficult to obtain accurate hematology results for camelid
species, since their red blood cells (RBC) and platelets are characterized by unique features that
are not present in more commonly studied domestic animals, including elliptically-shaped RBCs
and extremely small platelets. These characteristics can affect the way that the cells are
identified and measured by automated analyzers, making optimization of a camelid setting on
any hematology analyzer a challenge. To date, there are no published validation studies
identifying optimal settings for camelids, although anecdotal reports indicate that the equine
setting of the ADVIA 2120 is preferred.28,39
Camelid erythrocyte structure and function Camelid red blood cells are small, flat, and elliptical, with a rigid cell membrane. It is thought
that these characteristics aid in adaptation to living at high elevations and in arid environments,
by providing increased oxygen delivery and resistance to osmotic lysis, respectively.2 Specific
differences in the camelid erythrocyte plasma membrane, including relative increases in the
24
proportions of certain proteins, result in decreased erythrocyte deformability and a consequent
lack of shape change when exposed to a variety of substances that alter membrane lipids in
vitro in other species.5 While this resistance to deformation likely increases the physiologic
resistance to erythrocyte lysis during periods of dehydration, it also presents challenges to our
ability to accurately identify and quantify camelid RBCs using conventional automated
hematology methods.
Hematology analyzer methodology Automated optical flow cytometry analyzers such as the ADVIA 120/2120 (Siemens Healthcare
Diagnostics, Tarrytown, NY) identify and quantify RBCs and platelets based on species-specific
volume and hemoglobin concentration thresholds. However, the accurate determination of
these parameters requires the cells to be isovolumetrically sphered (i.e. turned into spheres
without changing their cell volume). This is accomplished in samples from species with
biconcave disc-shaped RBCs by the addition of a solution of sodium dodecyl sulfate (SDS) and
subsequent fixation with glutaraldehyde.25 SDS and glutaraldehyde are the main components of
the ADVIA RBC/PLT reagent.32 Since cell shape is eliminated as a variable in spherical cells, their
light scatter properties can be assessed based on the Mie theory of light scatter by spheres, and
converted to measurements of volume as well as internal complexity (refractive index –
translated by the analyzer into hemoglobin concentration).25 Since cell volume measurements
from optical analyzers are used to identify a cell as an RBC (vs. a platelet) and to determine the
absolute RBC count and mean cell volume (MCV), the accuracy of these values is highly
dependent on this sphering reaction. Additionally, other RBC values including mean cell
hemoglobin concentration (MCHC) and hematocrit (HCT) are based on RBC and MCV
measurements, and are therefore affected by any inaccuracies in these measurements. Camelid
25
RBCs are also smaller than those of most other domestic species. The estimated MCV of alpaca
RBCs was 21-28 fL in one study,28 while the typical canine MCV is often greater than 60 fL. As a
result, there is increased risk of RBCs being counted as platelets by the ADVIA if their volume
measurement is inaccurate or the incorrect species thresholds are used. Based on knowledge of
camelid erythrocyte morphology and membrane structure, as well as on prior studies,5 it is
reasonable to hypothesize that camelid RBCs will be resistant to sphering with the ADVIA’s
RBC/PLT reagent, and that RBC quantification and associated indices obtained from the ADVIA
120 will differ significantly from their true values as determined by other manual and automated
methods.
As there is currently no validated camelid setting for the ADVIA 120/2120, nor a way to predict
the degree or direction of any inaccuracies introduced by a lack of RBC sphering, the goal of this
study was to determine which ADVIA species setting (bovine, equine, or goat) would provide the
most accurate CBC values related to RBCs and platelets, as well as to determine the bias
between ADVIA RBC indices and those obtained with manual methods. It was hypothesized that
absolute RBC and PLT counts will vary significantly between different species channels on the
ADVIA, and that the optimal method for determining accurate CBC data will require a
combination of automated and manual methods. Results of this study are intended to aid in the
development of more accurate camelid hematology reference intervals, and potentially in the
design of future studies of certain related hematologic disorders, such as canine hereditary
elliptocytosis.
26
Materials and Methods
RBC sphering Given that the ADVIA’s measurement of MCV and quantification of RBCs is dependent on proper
RBC sphering, if camelid erythrocytes are resistant to sphering then CBC results from the ADVIA
will be inaccurate regardless of which species setting is used. One EDTA
(ethylenediaminetetraacetic acid)-anticoagulated sample each of canine and camelid whole
blood were used to prepare serial dilutions in both the ADVIA RBC/PLT reagent and normal
saline (as a control). The specific composition of the RBC/PLT reagent is proprietary
information; however, its key ingredients are sodium dodecyl sulfate and a glutaraldehyde
fixative.25 Canine and camelid blood samples from obtained from hospital patients who were
not anemic based on laboratory reference intervals, where blood had been collected as part of
their clinical evaluation. A final dilution of 1:625 (blood to reagent or blood to saline) was used
[David Zelmanovic, personal communication]. The total volumes of the dilutions were
multiplied by a factor of 3 via trial and error to increase the final volume of the dilution while
maintaining the desired final concentration of 1:625, since the sphering of normal human RBCs
is dependent on the presence of a volume of reagent sufficient to completely coat the surface of
each cell.75 For example:
1st dilution: 10 µL blood to 240 µL reagent/saline = 1:25
2nd dilution: 10 µL 1st dilution to 240 µL reagent/saline = 1:625
Multiply volume by a factor of 3:
1st dilution: 30 µL blood to 720 µL reagent/saline = 1:25
2nd dilution: 30 µL 1st dilution to 720 µL reagent/saline = 1:625
27
A drop of each final dilution was placed on a slide with a coverslip, and immediately examined
with light microscopy at 500x magnification to evaluate for RBC sphering.
RBC linearity of the ADVIA The range of absolute RBC counts measured by the ADVIA is 0-7,000,000 cells/µL, according to
the ADVIA 120 performance specifications.31 However, camelid blood has an erythrocyte
concentration that is 2-3 times that of humans and other domestic mammals, and healthy
llamas are reported to have RBC counts up to 18,000,000/µL, far exceeding the technical
specifications of the ADVIA.3,29 In order to evaluate the ADVIA’s ability to provide accurate RBC
counts above the manufacturer’s specified range, the linearity of the ADVIA 120 was assessed
through serial dilution of equine blood. Equine blood was used because the equine setting of
the ADVIA has been validated for horses, and because horses have relatively low MCVs among
the common domestic species (<60 fL), allowing for artificial concentration of a blood sample to
an absolute RBC count within the anticipated reference interval of camelid species without
exceeding a supraphysiologic PCV.4,27
An EDTA-anticoagulated equine whole blood sample with an ADVIA 120 RBC count of
6,220,000/µL was concentrated via centrifugation at 3500 rpm for 3 minutes. The packed RBCs
in the centrifuged sample were re-suspended in a small volume of autologous plasma, and
analyzed in duplicate using the ADVIA 120. This concentrated sample was then serially diluted
into four additional pools using increasing volumes of autologous plasma – 4:1, 3:2, 2:3, and 1:4
(packed RBCs to plasma). These four pools were measured in triplicate on the ADVIA 120, as
was a sample of autologous plasma. Measured RBC counts for each dilution level were
28
averaged, and linear regression analysis was used to assess the correlation of the measured and
expected values for each dilution.
Determination of appropriate RBC size thresholds – part I In order to determine which cell volume threshold would be most likely to provide accurate RBC
and platelet counts, camelid whole blood was analyzed using a Z2 Coulter particle counter
(Beckman Coulter Inc., Fullerton, CA). Compared to the ADVIA, which identifies and counts cells
based on their light scatter properties (volume and refractive index), the Z2 counts cells as
particles that cause a measurable change in electric resistance as they flow across an aperture
within the analyzer.42 Unlike the ADVIA and similar optical flow cytometry methodologies,
which require RBCs to be isovolumetrically sphered in order to be correctly sized and counted,
cell shape does not affect Z2 particle counts. Instead, lower and upper volume thresholds are
set by the operator, and all cells (particles) whose volumes fall between these thresholds are
counted. This “aperture-impedance principle” of cell counting has been identified as a
reference method for red and white blood cell counting and sizing in human hematology,43 as it
is both more precise and accurate than manual methods such as hemacytometer chamber
counting.
Venous whole blood was collected from a group of camelids (adult llamas and alpacas) in New
York State between November 2009 and October 2015. This group included both clinically
healthy animals, as well as those presenting for various disease conditions. Blood was collected
into K2EDTA tubes, and transported to the clinical pathology laboratory at Cornell University
College of Veterinary Medicine. Blood from healthy animals was collected with informed owner
29
consent according to approved IACUC protocols. Blood from ill animals was collected as part of
their clinical evaluation.
Samples were analyzed on the Z2 counter at various lower volume thresholds: 4 fL, 5 fL, 6 fL, 8
fL, 10 fL, and 12 fL. According to the International Council for Standardization in Hematology,
the ideal lower threshold for RBC counts should be set between the volumes of platelets and
red blood cells,43 so as to exclude as many platelets and include as many RBCs as possible in the
count. Since the exact volume of camelid RBCs is unknown and the degree of overlap with
platelet volume (if any) is uncertain, all samples were run using at least two of the size
thresholds listed above, in an attempt to identify the ideal RBC size threshold. All samples were
analyzed at the 8, 10, and 12 fL thresholds, and after preliminary analysis the data for the lower
thresholds (4, 5, and 6 fL) were excluded based on the apparent inclusion of two distinct cell
populations (RBCs and platelets) on the Z2 histograms.
Briefly, blood samples were prepared for analysis by creating two serial dilutions in an isotonic
electrolyte solution (Z Pak, Beckman Coulter Inc., Fullerton, CA). The first dilution was prepared
by pipetting 20 mL of solution into a cuvette (Accuvette, Beckman Coulter Inc., Fullerton, CA),
removing 40 µL of the solution and then adding 40 µL of well-mixed whole blood (1:500
dilution). 20 mL of electrolyte solution was added to a second cuvette, from which 200 µL was
removed and replaced with 200 µL of sample from the 1:500 dilution (final dilution: 1:50,000).
The 1:50,000 dilutions were used to perform RBC counts in duplicate at each lower volume
threshold. An upper volume threshold of 120 fL, an aperture diameter of 100 µm, and a
resolution of 256 nm were held constant for all Z2 counter analyses.
30
A CBC analysis was also performed on each sample using the ADVIA 2120 equine setting (20-70
fL RBC volume threshold), and the ADVIA’s playback feature was used to obtain results on the
bovine (5-65 fL) and goat (0-50 fL) settings.
A manual PCV was also measured on each sample, using a microhematocrit centrifuge for 10
minutes at 13,200 g.
Determination of appropriate RBC size thresholds – part II As described above, the cell counts obtained from the Z2 Coulter counter are a reflection of the
number of particles in a sample within a specified volume range, without providing any
additional information regarding the identity of the particles. In species with known RBC
volume, one can be reasonably confident that a whole blood sample analyzed with the
appropriate size thresholds will yield an accurate RBC count. However, given that normal RBC
volume is unknown in camelid species, it is also unknown how closely Z2 RBC counts reflect the
true RBC count in a given animal. For example, if the lower volume threshold is too high, a
proportion of smaller RBCs may be excluded from the total count. Additionally, if the lower
threshold is too low, platelets may be included, falsely increasing the RBC count. In order to
further validate the Z2 Coulter counter as a reference method for camelid RBC counts and size
determination, additional blood samples were obtained from four clinically healthy, non-anemic
llamas (PCV ≥ 22%, the lower limit of the camelid reference interval at Cornell CVM) and
separated into RBCs and platelet-rich plasma (PRP). Whole blood, RBCs and PRP from each
animal were analyzed on both the Z2 counter (at various lower thresholds) and the ADVIA 2120
(various species settings). The Z2 lower volume threshold yielding the highest count on the RBC
sample and the lowest count on the PRP sample would be expected to represent the most
accurate volume threshold for camelid RBCs.
31
Whole blood
Each whole blood sample (9 cc) was collected into a 20 cc plastic syringe containing 1 cc of acid
citrate dextrose (ACD) as an anticoagulant, as this is the recommended anticoagulant for use in
preparation of platelet-rich plasma.76 The sample was well-mixed by gentle inversion, and
transferred into a 15 cc polypropylene conical tube. CBC analysis was performed on each whole
blood sample using the ADVIA 2120. Each of the four samples was initially run on one of three
species settings: bovine, goat, and equine, and the instrument’s playback feature was used to
obtain results for the other two settings. The initial setting was determined randomly for each
sample. A blood smear was prepared from each sample, and a manual PCV was measured, as
described above. Based on preliminary results from part I of this portion of the study, each
whole blood sample was also analyzed on the Z2 Coulter counter at three lower volume
thresholds: 8 fL, 10 fL, and 12 fL. The upper volume threshold, resolution, and dilutions were
held constant across all lower threshold settings, as described above. Each sample was
measured 2-4 times each, depending on available sample volume, and the mean of the
measurements was calculated.
Platelet-rich plasma
Platelet-rich plasma (PRP) was prepared according to a previously described protocol.76 The
conical tube containing the remaining whole blood was centrifuged at 720 x g for 15 minutes at
21oC. The plasma was removed, leaving the buffy coat and RBCs at the bottom of the tube. The
plasma (PRP) was analyzed on the ADVIA 2120 using the same species setting as for the
patient’s whole blood sample, and a modified Wright’s stained direct smear was prepared to
verify the presence of platelets and relative absence of RBCs and WBCs. The PRP was also
32
analyzed on the Z2 counter as described above, at each of the three lower volume thresholds (8,
10, and 12 fL).
The remaining PRP sample from each animal was centrifuged a second time at 720 x g for 15
minutes. The supernatant was removed and centrifuged in an Eppendorf tube at 13,000 rpm for
5 minutes. The supernatant from this hard spin (platelet-poor plasma, PPP) was analyzed on the
ADVIA 2120 and at each of the lower volume thresholds on the Z2 counter.
Platelet-poor RBC suspension
The buffy coat and a small portion of the top of the RBC layer was removed from the remaining
RBCs in the conical tube, and discarded. In an Eppendorf tube, 650 µL of PPP and 260 µL of
concentrated RBCs were combined and gently mixed, in order to obtain a platelet-poor RBC
sample with a similar PCV to that of the original whole blood sample. A manual PCV was
performed. A blood smear was prepared from this reconstituted RBC sample, and stained with
modified Wright’s stain to microscopically verify the presence of RBCs and relative absence of
platelets and WBCs. The sample was also analyzed once on the ADVIA 2120 using the sample’s
original species setting, and on the Z2 counter at the 8, 10, and 12 fL lower volume thresholds.
Additionally, a portion of the reconstituted RBC sample was mixed with an equal volume of both
PRP and PPP (i.e. 200 µL of RBCs plus 200 µL of PRP or PPP). Each of these samples was also
analyzed on the ADVIA 2120 and the Z2 counter, and a manual PCV was performed as described
above. The sample types and analyses performed on each sample are summarized in Figure 1.
All tables and figures are located in the Appendix.
33
Patient selection and sample collection Venous whole blood was collected from clinically healthy adult (≥ 1-year-old) alpacas and llamas
from 12 farms in eastern Tennessee between July and October 2015. Health was defined as a
lack of significant abnormalities on physical examination as determined by an experienced
veterinarian, a FAMACHA score of 3/5 or lower,72 a body condition score (BCS) of 2.5/5 or
higher, and no history of illness or injury within the previous 3 months. All examinations and
sample collections took place on the farms, and informed client consent was obtained for all
procedures (approved UT IACUC protocol 2298-0914).
A maximum of 12 animals were collected per farm. Individual and herd histories were obtained,
including species, age, sex, pregnancy/breeding status, housing, diet, vaccines, and parasite
control practices. After examination of each animal, a maximum of 10 mL of blood was
collected by an experienced veterinarian from an external jugular vein using a 12 mL plastic
syringe (Covidien LLC, Mansfield, MA) attached to a 20 gauge, 1.5-inch needle (Covidien LLC,
Mansfield, MA). The blood was placed in a 4 mL K2EDTA tube (Becton Dickinson, Franklin Lakes,
NJ) and transported to the University of Tennessee clinical pathology laboratory in a cooler that
was maintained at 4oC until arrival. Samples were promptly analyzed by trained laboratory
personnel, with all analyses completed within 6 hours of sample collection. Samples were
evaluated for appropriate filling of the EDTA tube, and for clot formation and/or gross lipemia.
Underfilled, clotted, and lipemic samples were excluded. A CBC with reticulocyte count was
performed on each sample using the ADVIA 120 hematology instrument according to laboratory
standard operating procedures (SOP). One of three species settings was used:
34
Bovine: RBC volume threshold of 5-65 fL
Equine: RBC volume threshold of 20-70 fL
Modified equine (referred to hereafter as Camelid): RBC volume threshold of 5-70 fL
The true MCV of camelid RBCs in health is not known, although previous studies suggest a range
of 21-28 fL based on manual calculations.28 Although the camelid setting is not a manufacturer-
defined species setting on the ADVIA, it was created in the UT clinical pathology laboratory
because the lower end of the size threshold in the equine setting is very close to the expected
size of camelid RBCs. The lower size threshold of the camelid setting is hypothesized to allow
better enumeration of smaller camelid RBCs. This may become important if analyzing samples
from camelids with conditions known to cause microcytosis, e.g. iron deficiency, since these
small RBCs might be excluded from analysis on the equine setting. Although the size thresholds
for the camelid and bovine settings overlap substantially, pilot data for this study revealed
significant differences in the RBC values between these two settings (data not shown). This
suggests that RBC evaluation by the ADVIA is dependent on factors other than RBC volume
alone (i.e. hemoglobin concentration thresholds).
The patient samples were randomly and equally distributed among the three settings to
eliminate potential bias, and the playback feature of the ADVIA was used to adjust each animal’s
results for the other two settings. For example, if a sample was run on the equine setting,
playback was used to obtain CBC results for the bovine and camelid settings, so that each
physical sample was only measured once. After all samples had been collected and analyzed, a
subset of the samples was also randomly selected (using a random number generator) to be
analyzed on the ADVIA’s goat setting (RBC volume threshold of 0-50 fL) using the playback
35
feature. Manual PCVs were determined following one minute of centrifugation in a rapid fixed
angle head microhematocrit centrifuge (HemataStat II, EKF Diagnostics, Boerne, TX). The
centrifuge’s “read” function was used to determine the PCV; this function is calibrated for the
microhematocrit’s centrifuge speed to provide a PCV that is comparable to a traditional
microhematocrit centrifuge, but with results obtained more rapidly. Proper microhematocrit
centrifuge function was verified using an electronic tachometer prior to beginning the study,
and a series of test centrifugations of camelid blood (data not shown) confirmed there is no
significant difference in PCV with centrifugation times longer than one minute. ADVIA 120 and
manual PCV analyses were performed by a licensed medical technologist trained in instrument
use and following laboratory SOPs. The ADVIA 120 underwent daily quality control using 3-level
QCM (OPTIpoint, Siemens Healthcare Diagnostics, Tarrytown, NY).
A minimum of one blood smear was prepared from each sample, and reviewed by a medical
technologist according to laboratory SOP. Blood smear review included a leukocyte differential,
RBC morphology review, and a manual platelet estimate. Blood smears were also reviewed by a
board-certified veterinary clinical pathologist.
Additionally, venous whole blood samples were collected from camelid patients (alpacas and
llamas) presenting to the University of Tennessee Veterinary Medical Center’s large animal
hospital with various clinical complaints between January and May 2016, if a CBC was part of the
attending clinician’s diagnostic plan. For these animals, blood samples were collected,
transported to, and processed by laboratory personnel according to the large animal clinic and
clinical pathology laboratory SOPs. The CBC (and reticulocyte count, if requested by the
36
clinician) was run using the ADVIA 120 camelid setting, and a manual PCV and blood smear
review were performed. CBC results were also obtained on the bovine and goat settings using
the ADVIA’s playback feature.
Statistical analyses Statistical analysis was performed using commercial software (MedCalc Statistical Software
version 17.4 (MedCalc Software bvba, Ostend, Belgium; http://www.medcalc.org; 2017). The
distribution of RBC and PLT variables from all analyses was assessed for normality using the
D’Agostino-Pearson test. Repeated measures ANOVA with pairwise comparisons were
performed to compare the RBC counts obtained from the three Z2 lower volume thresholds and
from each of the ADVIA 2120 species settings (equine, bovine, and goat). Repeated measures
ANOVA with pairwise comparisons were also performed between the 8, 10, and 12 fL threshold
Z2 particle counts for platelet-poor RBC, PRP, and whole blood RBC counts to determine
whether the counts obtained at each threshold differed significantly from one another. The
lower Z2 threshold yielding the highest RBC counts while appearing to include the fewest
platelets was used as the reference method for all future comparisons to the ADVIA and manual
methods.
A manual mean cell hemoglobin concentration (MCHC) was calculated using the ADVIA’s
hemoglobin (HGB) measurement and the manual PCV for each EDTA whole blood sample.
Calculated MCV values were also determined, using the manual PCV and RBC counts obtained
from the Z2 counter. Mean and median differences between the ADVIA and manual methods
(Z2 RBC count, calculated MCHC, and calculated MCV) were determined, as well as the range of
differences, and the proportion of ADVIA values within the allowable total error (TEa) range of
37
the manual methods. The TEa ranges for the RBC values were based on the American Society for
Veterinary Clinical Pathology’s (ASVCP) guidelines for hematology measurands.77 Passing-Bablok
regression and Bland-Altman difference analysis were performed to assess for the presence of
bias between the ADVIA’s hematocrit value (HCT) and manual PCV, the ADVIA’s RBC count for
each species setting and the reference Z2 count, the ADVIA’s MCHC for each species setting and
the calculated MCHC, and the ADVIA’s MCV for each species setting and the calculated MCV.
Additionally, bias was calculated between the MCV calculated from the ADVIA’s equine RBC
count and the MCV calculated from the reference Z2 count. The ADVIA’s platelet count for each
species setting was compared to manual platelet estimates from blood smear review using the
Wilcoxon test for paired samples.
Results
RBC sphering Canine RBCs exhibit sphere formation when incubated with ADVIA RBC/PLT reagent, and retain
a biconcave disc shape when incubated with normal saline, as examined by light microscopy. In
contrast, alpaca RBCs maintain a flat ellipsoid shape in both RBC/PLT reagent and normal saline
(Figure 2), and do not exhibit sphere formation.
RBC linearity of the ADVIA The mean measured RBC count of the equine autologous plasma sample was 330,000/µL
(minimum), and the mean measured RBC count of the concentrated packed RBC sample was
14,115,000/µL (maximum). The maximum measured RBC count was within the laboratory
reference interval for camelids at the University of Tennessee (7,900,000-17,000,000/µL). The
serial plasma to packed RBC dilutions yielded measured RBC counts between these minimum
and maximum values (Table 1). Measured RBC counts were compared to expected RBC counts
38
(based on the sample dilution), and the coefficient of determination (R2) for the correlation of
measured RBC counts vs. expected RBC counts was 0.998 (p<0.0001) (Figure 3).
Determination of appropriate RBC size thresholds EDTA-anticoagulated whole blood was collected from 25 camelids, four of which were anemic
based on a laboratory PCV reference interval of 22-45% (Cornell University). All samples were
analyzed on the 8, 10, and 12 fL thresholds of the Coulter Z2 counter and on the equine, bovine,
and goat channels of the ADVIA 2120. The highest mean RBC counts were obtained with the 8
fL lower threshold of the Z2 counter, compared to the 10 and 12 fL thresholds. The mean RBC
counts were significantly different (p<0.0001) between the three lower Z2 thresholds, however
there was overlap between the 95% confidence intervals for all means (Figure 4). The highest
mean RBC count on the ADVIA was obtained on the equine channel, and the lowest mean RBC
count was obtained on the bovine channel. All ADVIA RBC counts were significantly different
from all lower Z2 threshold RBC counts, with the exception of the ADVIA equine RBC count and
the 12 fL Z2 count (p=0.785). However, there was overlap between the 95% confidence
intervals for all mean RBC counts (ADVIA and Z2) (Figure 4).
ACD-anticoagulated whole blood was collected from four llamas, and analyzed as summarized in
Figure 1. The ADVIA, Z2, and PCV results for the original whole blood, PRP, PPP, and platelet-
poor RBC samples are listed in Table 2. When the four platelet-poor RBC samples were analyzed
on the 8, 10, and 12 fL lower thresholds of the Z2 counter, the highest mean RBC count was
obtained with the 8 fL threshold, however there were no significant differences between the
three lower Z2 thresholds (p>0.05) (Figure 5).
39
When the PRP samples were analyzed on the 8, 10, and 12 fL lower thresholds of the Z2
counter, the lowest mean platelet count was obtained on the 12 fL threshold, and the highest
mean platelet count on the 8 fL threshold. Particle counts were significantly different between
the lower Z2 thresholds (p = 0.015), however all PRP Z2 counts were significantly lower than the
ADVIA platelet counts (all species settings) (p<0.0001) (Figure 6).
The 8 fL lower threshold of the Z2 counter yielded the highest RBC particle counts on the
platelet-poor RBC suspensions, however it is suspected that platelets may be included in these
counts based on the results from the PRP experiments. The 10 fL lower Z2 threshold yielded
slightly lower counts for the platelet-poor RBC suspensions, but also provided slightly lower
counts for the PRP samples, increasing confidence in the RBC count estimates. The 12 fL Z2
threshold provided the lowest RBC counts and the highest platelet counts, and was suspected to
underestimate the true RBC count. Since there was no significant difference between the Z2
RBC counts at the three lower thresholds, the 10 fL lower threshold was selected as the
reference method for RBC count, as it was suspected to include fewer platelets than the 8 fL
lower threshold. The reference method for MCV was a calculated value utilizing this RBC count.
RBC counts and MCV values obtained from the different ADVIA species settings (equine, bovine,
and goat) using the 25 EDTA-anticoagulated camelid whole blood samples were compared to
the results from these reference methods in order to identify the most accurate ADVIA setting.
Comparisons included the mean and median differences between the methods, the range of
differences, and the proportion of ADVIA results falling within the allowable total error (TEa)
range for the reference method. Passing-Bablok regression analysis and Bland-Altman
difference plots were also used to assess the bias of the ADVIA RBC and MCV measurements
40
compared to the reference methods. No differences were observed between the ADVIA equine
and camelid settings for any RBC or platelet values, and the equine setting results were used for
all comparisons.
Overall, the RBC counts on the ADVIA were lower than the 10 fL Z2 particle counts for whole
blood, regardless of the species setting used. However, the smallest mean and median
differences between the two analyzers were observed when the ADVIA equine setting was used
(-0.42 and -0.45 million/µL mean and median differences, respectively). The difference between
the equine and Z2 counts ranged from -1.39 to 0.63 million/µL. The mean differences between
the 10 fL Z2 count and the ADVIA bovine and goat channel counts were -2.46 and -1.41
million/µL, respectively. 88% of the RBC counts on the ADVIA equine setting were within the TEa
range for the reference method RBC count (i.e. within ±10% of the 10 fL count), while only 28%
of the goat setting RBC counts and 0% of the bovine RBC counts were within this TEa range. The
Spearman rank correlation coefficients for the RBC counts measured by the ADVIA were very
good (r≥0.92 for all three species settings), with no evidence of constant bias on any setting.
Proportional bias for RBC counts was observed with the ADVIA bovine setting (Table 3).
The reference method MCV was calculated based on a spun PCV and the RBC count from the 10
fL Z2 threshold. This calculated MCV was then compared to the MCV measured by each of the
ADVIA species settings. Overall, the MCV values measured by the ADVIA were higher than the
calculated MCV, regardless of the species setting used. However, similar to the results for the
RBC counts above, the smallest mean and median differences between the two methods were
observed with the ADVIA equine measurement (6.8 and 7.6 fL mean and median differences,
41
respectively). The mean differences between the bovine and goat MCVs and the calculated
MCV were 9.5 and 15.6 fL, respectively. The ADVIA measured MCVs were within the TEa range
of the calculated MCV (±7%) in 4% (equine) and 0% (bovine and goat) samples. The correlation
coefficients for the ADVIA MCV measurements were fair for the equine and bovine settings
(r=0.65 and 0.67, respectively), however there was poor correlation between the MCV on the
goat channel and the MCV calculated from the 10 fL Z2 RBC count (MCV=PCV/RBC x 10) (r=0.33).
There was no evidence of constant bias for any of the ADVIA settings, however proportional bias
was observed with all ADVIA MCV measurements.
It would be impractical to suggest that clinical pathology laboratories use the 10 fL Z2 RBC count
to calculate MCV on camelid samples, since a Z2 Coulter counter is not available in all labs.
Therefore, a comparison was made between MCV calculated using the Z2 RBC count and the
ADVIA equine RBC count. The MCV calculated with the ADVIA equine RBC count was within the
TEa range of the MCV calculated from the Z2 count 84% of the time, with a mean difference of
only 1.7 fL. Correlation between these values was good (r=0.70), with no evidence of constant
or proportional bias.
Assessment of bias between automated and manual methods In addition to the 25 EDTA-anticoagulated whole blood samples from the camelid population
described above, EDTA whole blood samples were collected from 132 alpacas and llamas in East
Tennessee for automated analysis on the ADVIA (equine, bovine, and goat settings), and manual
analysis (spun PCV and blood smear review). Results from this patient population were
combined with the 25 samples from the population above to assess bias between automated
and manual methods for hematocrit, MCHC, and platelet counts.
42
A spun PCV was considered the gold standard for measurement of volume of the percentage of
red cells in blood. Hct is related to PCV, but is determined by the ADVIA using a calculation
involving absolute RBC count and measured MCV (Hct = (RBC x MCV)/10). The correlation
between the ADVIA Hct and spun PCV was good for all species settings (r>0.89), however both
constant and proportional bias were observed with all settings. Overall, the ADVIA Hct
overestimated the manual PCV by a mean of 3.1% for the bovine setting, 6.5% for the equine
setting, and 13.1% for the goat setting (Table 4).
MCHC as reported by the ADVIA is also a calculated value: MCHC = (HGB/Hct) x 100. Since the
Hct is calculated by measurements likely to be inaccurate in camelids, and has already been
shown to exhibit bias when compared to a spun PCV, bias assessments were also performed
between the ADVIA MCHC values and an MCHC calculated using the spun PCV. Hemoglobin
concentration (HGB) is measured spectrophotometrically by a chemical reaction after RBC lysis
in the ADVIA, and the result was the same for all species settings. Correlation between the
ADVIA MCHC and a calculated MCHC was poor for all species settings (r<0.4). Constant and
proportional bias were observed for the equine and goat settings. Overall, the ADVIA’s MCHC
values were lower than the calculated MCHC, with the smallest mean difference observed with
the bovine setting and the largest difference with the goat setting.
Platelet count and platelet indices are measured by the ADVIA through a combination of size
and light scatter measurements. The RBC/PLT reagent forms platelets into “pseudospheres,”25
and there is no current evidence to suggest that camelid platelets would be resistant to this
reaction compared to other species. The platelet component distribution width (PCDW) was
43
also below 5.5 g/dL for a majority of the EDTA-anticoagulated samples from the first camelid
population in this study, regardless of species setting, which has been described as supportive of
adequate platelet sphering in dogs.78 Nonetheless, the ADVIA’s automated platelet counts were
compared to a manual platelet estimate from a blood smear (average platelets per 1000x field
multiplied by 20 = platelet estimate x103/µL), which was recorded for 62 of the camelids in the
East Tennessee population. When a range was reported for the platelet estimate, the mid-point
of the range was used for comparison analysis. There was no significant difference between the
ADVIA’s platelet count using the equine setting and a manual platelet estimate (p=0.152),
although a significant difference was observed between manual estimates and the automated
counts from the bovine setting (p<0.0001). Due to the low number of samples played back on
the goat setting for this population, only 5 paired samples were available for comparison. While
the p-value for this comparison was marginally insignificant (p=0.063), the lack of overlap in the
interquartile ranges for the two methods suggests that the difference in platelet counts
between the goat channel and manual estimate may be clinically significant (Figure 7).
No differences in any RBC or platelet values were observed between the ADVIA equine and
camelid settings.
Conclusion The results of this study demonstrate that camelid RBCs do not form isovolumetric spheres in
vitro when exposed to the ADVIA RBC/PLT reagent, as do RBCs from other domestic mammal
species such as the dog. As a consequence, the methodology used to measure cell volume,
identify cells as RBCs, and further characterize the RBCs based on hemoglobin concentration and
percentage of cells per volume of blood in automated optical hematology analyzers will likely
not provide accurate results for camelids. The differences in RBC counts and indices between
44
various species settings of the ADVIA, and between the ADVIA and an impedance counter
observed in this study support the hypothesis that accurate automated hematology analysis for
camelid species is lacking.
The Z2 Coulter counter uses an electrical impedance methodology which does not rely on cell
shape, and only counts cells (particles) which fall between user-defined lower and upper volume
thresholds. One of the goals of this study was to identify the lower volume threshold that would
provide the most accurate RBC counts in camelid blood – i.e. the threshold that includes the
most RBCs in its count while excluding the majority of smaller particles (platelets). Based on
preliminary research (data not shown), and as might be expected, the Z2 particle count is
highest with the lowest volume thresholds (4, 5, and 6 fL). However, examination of the
histograms provided by the Z2 counter at these thresholds suggested the possible inclusion of a
second cell population, most likely platelets, and therefore a falsely increased RBC count. RBC
counts for the 8, 10, and 12 fL thresholds appeared to provide the highest, most accurate cell
concentrations, and were therefore investigated further in the current study. Of these three
thresholds, the 8 fL threshold provided the highest RBC counts on whole blood and platelet-
poor RBC samples, as well as the highest platelet counts for PRP samples. The differences in
RBC and platelet counts between the different Z2 thresholds were statistically significant,
however evaluation of the overlapping 95% confidence intervals for the means of these counts
suggests that the differences may not be clinically significant (Figures 4-6). Use of the 12 fL
threshold resulted in the lowest platelet counts, however it was also the only evaluated
threshold to provide a lower RBC count than the ADVIA on whole blood samples, suggesting that
a proportion of camelid RBCs may be smaller than 12 fL, and be excluded from the total RBC
45
count. Additionally, when the PRP platelet counts from all three Z2 thresholds were compared
to the ADVIA platelet counts, statistically and clinically significant differences were observed,
which were greater than the differences between the Z2 thresholds. Given the relatively low
concentration of platelets measured by the Z2 counter (tens of thousands per microliter vs.
millions per microliter of RBCs), it was suspected that any interference by platelets in whole
blood samples at these thresholds would result in minimal artificial increases in the RBC count.
Since the Z2 counter is not a widely used hematology instrument in veterinary laboratories, a
second goal of this study was to utilize the results obtained from our Z2 threshold analyses to
inform accurate CBC methodology using more common instrumentation. The ADVIA 120/2120
optical hematology analyzers were designed for use with human blood and body fluids, but have
been adapted for use with blood and fluids from various domestic mammal species.23,25,27,31
ADVIA instruments are widely used by veterinary clinical pathology laboratories in both tertiary
referral hospitals and commercial laboratories, all of which have the potential to see a large
camelid caseload. There is no designated species setting for camelid, camel, alpaca, or llama on
the ADVIA, although anecdotal evidence suggests that the ADVIA’s equine setting provides the
most accurate CBC results for these animals.28,39 The results of the present study support this
claim with regards to the RBC count and thrombogram. When RBC counts from various ADVIA
species settings were compared to those measured by or derived from the 10 fL Z2 counts, the
ADVIA equine setting resulted in the smallest mean differences, the largest proportion of results
within the respective TEa guidelines, and often the strongest correlations. The ADVIA bovine
and goat settings were also included in this study based on the apparent correlation between
their RBC volume thresholds and the expected MCV for camelid RBCs, however both of these
46
settings markedly underestimated the absolute RBC count and overestimated the platelet
count. While there is normally some degree of overlap in the RBC and platelet volume ranges
regardless of species setting,25 the observed trends with the bovine and goat settings suggest
that a substantial proportion of RBCs may be counted as platelets on these settings. Given that
the RBC volume (and hemoglobin concentration) thresholds for all of these ADVIA settings
overlap substantially, it is suspected that the ADVIA uses additional criteria for identification and
enumeration of RBCs, however it is uncertain what these factors are, or whether they are
manageable at the user level.
The linearity of the ADVIA for RBC concentrations above the manufacturer’s specified
7,000,000/µL was also an initial concern, given that camelid species can have RBC counts
approaching 18,000,000/µL in health. However, the results of the dilution experiment with
equine blood in this study indicate that the reportable range of the ADVIA extends to at least
14,115,000 RBCs/µL. There is no evidence to suggest that the analyzer would provide falsely
decreased counts at higher RBC concentrations, although the possibility of a deviation from
linearity at concentrations higher than those measured here cannot be excluded.
Even with the ADVIA equine setting, there are still automated RBC values which will be
inaccurate for camelids as a consequence of their lack of RBC sphering, including MCV, MCHC,
and Hct. Therefore, these values should be replaced by calculated MCV, calculated MCHC, and
spun PCV. Based on the results of these combined methods and the degree of bias with strictly
automated methods (ADVIA), it appears that this combination is needed to provide the most
accurate hematology data for camelid species.
47
One important limitation to this study is that sample analysis was performed at two different
institutions, which utilize different instruments and methods to measure the same hematology
variables. A spun PCV on the samples from Cornell was measured manually against a standard
laminated reader card after centrifugation for 10 minutes in a high-speed microhematocrit
centrifuge. Meanwhile, the PCV values from the University of Tennessee were obtained using
the “read” function of a low-speed centrifuge after 1 minute of centrifugation. Analysis of the
same whole blood sample by both methods will result in slightly different results based on
preliminary data using canine blood (data not shown), however this is not expected to impact
the conclusions of this study. Additionally, the CBC results from the Cornell camelid population
were obtained on an ADVIA 2120, while the majority of the results from the East Tennessee
population were obtained on an ADVIA 120. However, there are only minimal differences in the
methodologies used by these analyzers to measure the RBC and platelet values of interest to
this study,25 and this would not be expected to significantly affect data interpretation.
Light microscopy was used in the current study to assess the ability of canine and camelid RBCs
to undergo a sphering reaction in the ADVIA’s RBC/PLT reagent, which was sufficient for support
of our hypothesis, but not ideal for truly evaluating three-dimensional sphere formation.
Attempts were made in the early stages of this study to obtain scanning electron microscopy
(SEM) images of the RBCs in both RBC/PLT reagent and normal saline, however the canine cells
had lost their spherical shape in the time between exposure to the reagent and access to the
SEM camera, appearing as biconcave discs. Previous work suggests that although the sphering
reaction in human RBCs takes place within 1 second with sodium dodecyl sulfate,75
experimentally sphered RBCs begin to revert to a biconcave disc shape after approximately 8
48
hours.79 Since the time between incubation with the sphering reagent and obtaining SEM
images in this study exceeded 8 hours, this most likely affected our ability to capture three-
dimensional evidence of canine RBC sphere formation. Although the same fixative type and
concentration were used in this study as had been previously described in a case of canine
elliptocytosis,8 it seems possible that the more permanent nature of the abnormal RBC shape in
that case allowed for retention of the shape for SEM image acquisition, compared to the
experimental induction of abnormal RBC shape in the current study.
Finally, although the results of this study show that current automated hematology analysis is
inaccurate in camelid species, and provide methodology for more accurate determination of
camelid RBC values in a clinical setting, the true values of many of these indices (i.e. MCV) are
still unknown. Additional research, potentially involving advanced imaging techniques, is
needed to more fully characterize camelid RBCs and our ability to assess them.

49
CHAPTER II ENDOPARASITES AND ERYTHROCYTE VALUES
50
Abstract
Background: Mycoplasma haemolamae and gastrointestinal nematodes can cause anemia in
camelids. Parasite control programs aim to suppress parasite loads to subclinical levels without
excessive deworming that promotes resistance, but there are few evidence-based guidelines for
acceptable parasite loads in camelids.
Objectives: In clinically healthy camelids: 1) Compare M. haemolamae PCR status and RBC
values. 2) Determine the fecal egg count (FEC) threshold above which RBC values are
consistently below the median of the reference interval.
Methods: EDTA-anticoagulated blood was collected from 118 clinically healthy, non-anemic
adult alpacas and llamas. PCV was measured by centrifugation, RBC and HGB were measured by
ADVIA, and Mycoplasma haemolamae was detected by real-time PCR. The number of
trichostrongyle eggs per gram (epg) was determined in a freshly collected fecal sample using the
Modified McMaster’s test. Significant differences in RBC values between M. haemolamae
positive and negative animals, and between various FEC thresholds, were assessed by
independent T-test or Mann-Whitney rank sum test.
Results: PCV, HGB, and RBC were not significantly different between M. haemolamae positive
(N=41) and negative animals (P>0.5). PCV, HGB, and RBC were significantly lower in animals
with FEC>600epg (P<0.05). For 10/10 animals with FEC>600epg, PCV, HGB, and RBC were below
the median of the respective reference interval.
Conclusions: Because positive M. haemolamae PCR is not associated with lower RBC values in
healthy camelids, treatment for M. haemolamae may not be necessary in those animals.
51
FEC>600epg has a negative effect on RBC values, so maintaining FEC below that level is
recommended in camelids.
Background
Mycoplasma haemolamae Mycoplasma haemolamae is a hemotropic bacterial organism (hemoplasma) that is known to
cause anemia of variable severity in alpacas and llamas. The mode of transmission of this
pathogen is uncertain, although vector-borne transmission is suspected based on studies of
similar hemoplasma organisms in other domestic mammals. Iatrogenic, direct horizontal, and
vertical modes of transmission have also been proposed.58,59 Many animals who test positive for
this organism never show clinical signs, and it has been suggested that a majority of infections
are subclinical, resulting in a carrier state that persists despite antibiotic treatment of infected
animals.62 Anemia is the result of hemolysis, which primarily occurs extravascularly as splenic
macrophages remove infected RBCs from circulation. Clinical anemia is reported most often in
infected animals who are immunosuppressed, stressed, debilitated, or suffering from a
concurrent illness, although organisms can be observed on peripheral blood smears from both ill
and clinically healthy animals as epicellular and extracellular ring-shaped structures.62
The gold standard test for diagnosis of M. haemolamae is a real-time PCR (polymerase chain
reaction) assay which is specific for detection of the organism’s 16S rRNA gene.53,54 However,
bacteremia in infected animals is transient and cyclical, and it can therefore be difficult to
identify M.haemolamae as an etiologic agent in cases of anemia.59 Previous studies have
reported that infection with M. haemolamae (based on positive real-time PCR results) is not
significantly associated with anemia (based on a PCV measurement below the lower reference
52
limit for the species);54,56 in one population the mean PCV of PCR-positive animals was higher
than that of PCR-negative animals, although this difference was not statistically significant.56 In
another study, one of two M. haemolamae positive alpacas was anemic based on PCV and
clinical signs, however this individual also had an FEC of 2800 epg, suggesting that the M.
haemolamae infection may not have been the only cause of anemia, if it was involved in the
pathogenesis at all.61
Given that PCV reference intervals for alpacas and llamas vary substantially between different
laboratories, and that PCV is only one index of RBC mass, one goal of this study was to perform a
more comprehensive assessment of the relationship between M. haemolamae PCR status and
RBC values (including PCV, RBC count and HGB concentration). The hypothesis was that clinically
healthy animals who are positive for M. haemolamae on real-time PCR would have significantly
lower RBC value(s) compared to clinically healthy animals with negative PCR results. If such a
relationship exists, it might indicate a negative impact of M. haemolamae infection despite the
lack of anemia or clinical illness, potentially explaining the increased susceptibility of infected
animals to the development of clinical anemia in the presence of concurrent illness (e.g. heavy
gastrointestinal nematode burdens) or immunosuppression.
Gastrointestinal nematodes Gastrointestinal nematode infections are also a common cause of anemia in New World
camelids. Haemonchus contortus, a trichostrongylid nematode residing in the third gastric
compartment (C3), is the most common and clinically significant endoparasite of alpacas and
llamas. H. contortus is also of clinical importance in small ruminants, in whom the parasite
resides in the abomasum.66 Anemia is the result of blood loss, both through direct feeding of
53
the adult worm on the host’s blood supply, as well as irritation of the gastric mucosa.66
Trichostrongylid infections can be diagnosed and semi-quantified with the fecal egg count test
(FEC), which measures the number of trichostrongyle eggs per gram (epg) of feces. However,
this test cannot differentiate H. contortus eggs from other trichostrongyle eggs of similar size
and morphology (e.g. Teladorsagia circumcincta, Trichostrongylus axei, etc).66 In addition, there
are no established thresholds for defining clinically significant FECs in alpacas and llamas. In one
study performed in the southeastern United States, a majority of camelids with clinical anemia
had an FEC >1000 epg,72 while a separate study in a population of alpacas from New Zealand
identified 250 epg as a “high and clinically significant” egg count.61 This wide range of
potentially significant values makes it difficult to base treatment decisions on FEC alone.
The FAMACHA system (Faffa Malan Chart, named for its inventor, Dr. Francois “Faffa” Malan)
has been validated as a clinical tool for assessing the degree of anemia due to H. contortus
infection in South American camelids.72 In this system, an animal’s conjunctival mucous
membrane color is evaluated side-by-side with a card showing varying shades of pink. A score
of 1 corresponds to bright pink/red membranes (normal, healthy) and a score of 5 corresponds
to white membranes (severe anemia). Deworming treatment is typically recommended for
animals with scores of 3 or higher.
FEC has been shown to be negatively correlated to PCV and other RBC values in clinically ill
alpacas and llamas, and in naturally and experimentally infected sheep. 66,73,74 Additionally,
experimental infection of sheep with Haemonchus sp. demonstrated a linear relationship
between adult worm numbers, fecal egg counts, and blood loss.70 However, there has been no
54
published documentation of any correlation between FEC and RBC values in clinically healthy
camelids. Additionally, currently available tools used by practitioners and owners to identify
animals in need of deworming treatment, such as the FAMACHA system, are only capable of
identifying animals who are already anemic, potentially missing animals with high nematode
burdens who are not yet clinically ill. Conversely, deworming all animals in a herd regardless of
their potential nematode burden is expensive and unnecessary, and promotes parasite
resistance to deworming medications. A second objective of this study was therefore to assess
the relationship between FEC and RBC values (PCV, RBC, and HGB) in a population of clinically
healthy (non-anemic) adult camelids, and to identify an FEC threshold above which RBC values
are consistently (>50% of the time) below the median of their respective reference intervals (i.e.
what is the FEC threshold at which a negative impact on RBC values is consistently observed?).
Identification of this FEC threshold would provide additional guidance to owners and
veterinarians in determining which animals could potentially benefit from deworming
treatment, prior to the development of clinical anemia.
Materials and Methods
Patient population and sample collection Venous whole blood was collected from clinically healthy adult (≥ 1-year-old) alpacas and llamas
from 12 farms in eastern Tennessee between July and October 2015. Health was defined as a
lack of significant abnormalities on physical examination as determined by an experienced
veterinarian, a FAMACHA score of 3/5 or lower,72 a body condition score (BCS) of 2.5/5 or
higher, and no history of illness or injury within the previous 3 months. All examinations and
55
sample collections took place on the farms, and informed client consent was obtained for all
procedures (approved UT IACUC protocol 2298-0914).
Samples from a maximum of 12 animals were collected per farm. Individual and herd histories
were obtained, including species, age, sex, pregnancy/breeding status, housing, diet, vaccines,
and parasite control practices. After examination of each animal, a maximum of 10 mL of blood
was collected by an experienced veterinarian from an external jugular vein using a 12 mL plastic
syringe (Covidien LLC, Mansfield, MA) attached to a 20 gauge, 1.5-inch needle (Covidien LLC,
Mansfield, MA). The blood was placed in a 4 mL K2EDTA tube (Becton Dickinson, Franklin Lakes,
NJ) and transported to the University of Tennessee clinical pathology laboratory in a cooler that
was maintained at 4oC until arrival. Blood samples were promptly analyzed (all analysis was
performed within 6 hours of sample collection) by trained laboratory personnel. Samples were
evaluated for appropriate filling of the EDTA tube, and for clot formation and/or gross lipemia.
Underfilled, clotted, and lipemic samples were excluded. A CBC with reticulocyte count was
performed on each sample using the equine setting of the ADVIA 120 hematology instrument
according to laboratory standard operating procedures (SOP).
Manual PCVs were determined following one minute of centrifugation in a rapid fixed angle
head microhematocrit centrifuge (HemataStat II, EKF Diagnostics, Boerne, TX). The centrifuge’s
“read” function was used to determine the PCV; this function is calibrated for the
microhematocrit’s centrifuge speed. Proper microhematocrit centrifuge function was verified
using an electronic tachometer prior to beginning the study, and a series of test centrifugations
of camelid blood (data not shown) confirmed there is no significant difference in PCV with
56
centrifugation times longer than one minute. ADVIA 120 and manual PCV analyses were
performed by a licensed medical technologist trained in instrument use and following laboratory
SOP. The ADVIA 120 underwent daily quality control using 3-level QCM (OPTIpoint, Siemens
Healthcare Diagnostics, Tarrytown, NY).
A minimum of one blood smear was prepared from each sample, and reviewed by a medical
technologist according to laboratory SOP. Blood smear review included a leukocyte differential,
RBC morphology review, and a manual platelet estimate. Blood smears were also reviewed by a
board-certified veterinary clinical pathologist.
A fresh fecal sample was also collected digitally from the rectum of each animal by trained
personnel, placed in an individual, clean plastic bag, and transported in a cooler to the UTVMC
parasitology laboratory.
M. haemolamae and FEC testing After CBC analysis, the remaining EDTA-anticoagulated whole blood from each animal was
stored at -20oC for up to 30 days. DNA extraction and real-time PCR for Mycoplasma
haemolamae were performed, using previously described methods54 (Applied Biosystems
StepOne™, ThermoFisher Scientific, Waltham, MA). Positive and negative control samples were
included in each run. Individual samples were classified as positive or negative based on their CT
(cycle threshold) value, with samples having a CT value less than or equal to 35.0 classified as
positive.
57
Fecal egg counts were performed on each fecal sample using the Modified McMaster’s test, as
has been previously described for alpacas and llamas.67 Briefly, 2 grams of feces were mixed
with 28 mL of a sodium nitrate flotation solution with a specific gravity of 1.200. The mixture
was loaded into a McMaster’s slide, and examined under light microscopy after 5 minutes of
flotation. The number of strongylid eggs in both chambers was counted at 100x total
magnification, and the total number counted in each sample was multiplied by 50 to obtain
results in eggs per gram of feces (epg). An egg count of 0 was reported as <50 epg. Since FECs
are based on visual identification of parasite eggs, it is not possible to distinguish between the
various species of strongylid eggs with this method. Therefore, nematode larval cultures were
also performed on a subset of the fecal samples in order to further classify the strongylid species
present.
Statistical analysis Statistical analysis was performed using commercial software (MedCalc Statistical Software
version 17.4 (MedCalc Software bvba, Ostend, Belgium; http://www.medcalc.org; 2017).
Animals were classified as anemic or non-anemic based on having a PCV, RBC count, or HGB
concentration below or above the lower limit, respectively, for the appropriate laboratory
reference interval. The sample population was also divided into two groups based on M.
haemolamae PCR status: M. haemolamae-positive (Mhl-positive) and M. haemolamae-negative
(Mhl-negative). The distributions of RBC values (PCV, RBC, HGB) in both groups were assessed
for normality using the D’Agostino-Pearson test. The means/medians of the two groups were
compared using the independent T-test or Mann-Whitney rank sum test. Significance was
based on a p-value <0.05 and lack of overlap in 95% confidence intervals for the mean/median.
The sample population was also stratified into groups based on FEC: animals with FEC<450 epg,
58
600<FEC<1000 epg, and FEC≥1000 epg. RBC values were compared between the different FEC
strata using a one-way ANOVA or Kruskal-Wallis test, and significance was based on a p-
value<0.05 and lack of overlap in 95% confidence intervals for the mean/median. Comparison
of RBC values was also performed between Mhl-positive and Mhl-negative animals in the
different FEC strata. Receiver operator characteristic (ROC) curves were used to identify an FEC
threshold with optimal sensitivity and specificity for predicting a negative effect on RBC values.
Results
Animals EDTA-anticoagulated whole blood and fecal samples were collected from 118 clinically healthy
adult New World camelids. There were 98 alpacas (55 females, 39 intact males, and 4 castrated
males) and 20 llamas (13 females, 1 intact male, and 6 castrated males) in the study population.
The alpacas ranged in age from 1-15 years (mean = 5.42 years), and the llamas ranged in age
from 3-16 years (mean = 11 years). There were 10 alpacas (3 females and 7 males) whose ages
were unknown or not recorded. Four animals were mildly anemic based on a PCV (n=2) or HGB
concentration (n=2) below the lower limit of the laboratory reference interval (20% and 7.5
g/dL, respectively); however, these animals were not clinically ill and had FAMACHA scores > 3
due to study inclusion criteria. RBC counts were within the reference interval for all animals,
and PCV and HGB concentration were within their respective reference intervals for the
remaining 114/118 animals. A total of 41/118 animals (37 alpacas and 4 llamas) in this study
population tested positive for M. haemolamae on real-time PCR, resulting in a 34.7%
prevalence. No Mycoplasma organisms were observed on blood smears from any animal. FECs
in this population ranged from <50 to 3200 epg, with a median and standard deviation of 100 ±
59
50 epg. In addition to strongylid eggs, other nematode eggs (Nematodirus spp., Aonchotheca
(Capillaria) spp.), coccidia (Eimeria spp.), and tapeworm eggs (Moniezia spp.) were noted in the
McMaster chamber after fecal flotation; their presence was described qualitatively. Larval
cultures were performed on 18/118 fecal samples, and the L3 stage of H. contortus grew in all
cultures. Additional culture findings included Trichostrongylus spp. (n=4) and Nematodirus spp.
(n=4).
M. haemolamae and RBC values RBC values for Mhl-positive animals were consistently lower than those for Mhl-negative
animals, however the differences between the group means for each value (PCV, RBC count, and
HGB concentration) were not statistically significant. The mean PCV of the Mhl-positive animals
(n=41) was 32.1%, and the mean PCV of the Mhl-negative group (n=77) was 32.8% (p=0.526).
The mean RBC count for the Mhl-positive group was 12.01 million/µL; the mean for the Mhl-
negative group was 12.02 million/µL (p=0.981). The mean HGB concentration for the Mhl-
positive group was 12.76 g/dL, and the mean concentration for the Mhl-negative group was
12.92 g/dL (p=0.725) (Figure 8). Mean RBC values (PCV, RBC count, HGB) between Mhl-positive
and Mhl-negative animals with an FEC>600 epg, and between Mhl-positive animals with CT
values less than 30.0 and Mhl-negative animals were also compared, with no statistically
significant differences observed (Figure 9).
Fecal egg count and RBC values RBC values for animals in different FEC strata (<450 epg, between 600 and 1000 epg, and ≥1000
epg) were compared. A one-way ANOVA was used to compare the RBC counts between the
strata. The distribution of PCV and HGB values in the various strata were non-parametric, and
the Kruskal-Wallis test was used for these comparisons. The mean RBC counts for the different
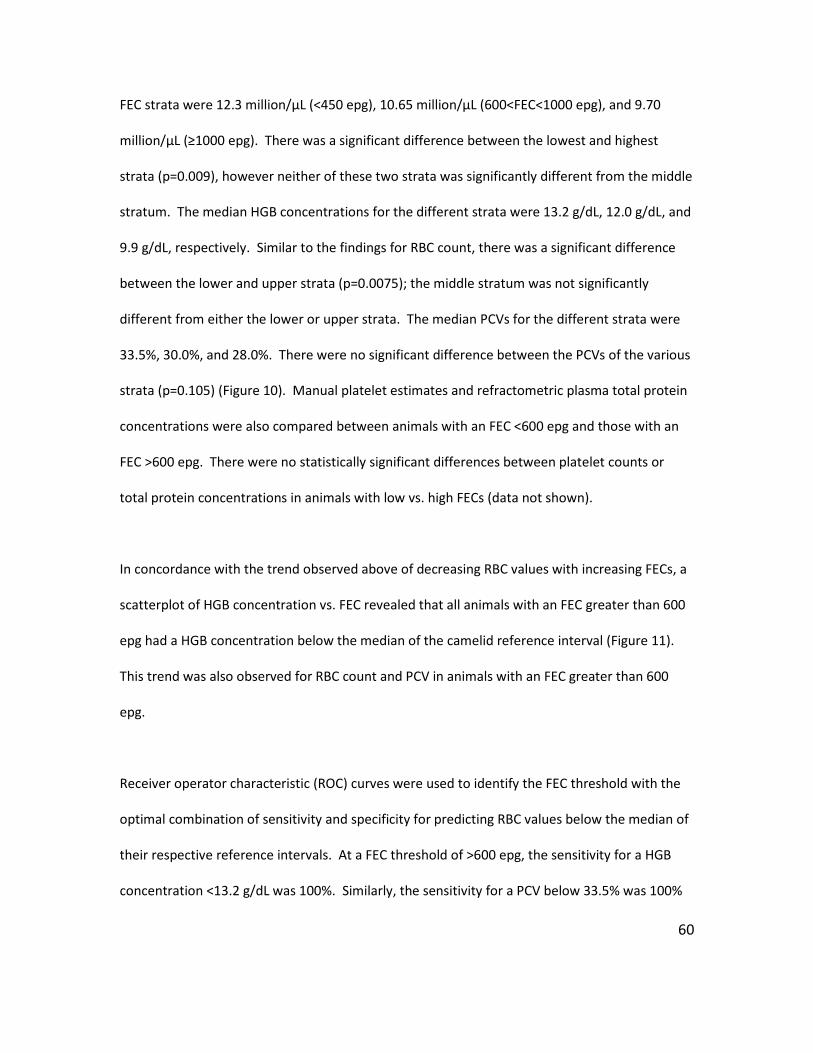
60
FEC strata were 12.3 million/µL (<450 epg), 10.65 million/µL (600<FEC<1000 epg), and 9.70
million/µL (≥1000 epg). There was a significant difference between the lowest and highest
strata (p=0.009), however neither of these two strata was significantly different from the middle
stratum. The median HGB concentrations for the different strata were 13.2 g/dL, 12.0 g/dL, and
9.9 g/dL, respectively. Similar to the findings for RBC count, there was a significant difference
between the lower and upper strata (p=0.0075); the middle stratum was not significantly
different from either the lower or upper strata. The median PCVs for the different strata were
33.5%, 30.0%, and 28.0%. There were no significant difference between the PCVs of the various
strata (p=0.105) (Figure 10). Manual platelet estimates and refractometric plasma total protein
concentrations were also compared between animals with an FEC <600 epg and those with an
FEC >600 epg. There were no statistically significant differences between platelet counts or
total protein concentrations in animals with low vs. high FECs (data not shown).
In concordance with the trend observed above of decreasing RBC values with increasing FECs, a
scatterplot of HGB concentration vs. FEC revealed that all animals with an FEC greater than 600
epg had a HGB concentration below the median of the camelid reference interval (Figure 11).
This trend was also observed for RBC count and PCV in animals with an FEC greater than 600
epg.
Receiver operator characteristic (ROC) curves were used to identify the FEC threshold with the
optimal combination of sensitivity and specificity for predicting RBC values below the median of
their respective reference intervals. At a FEC threshold of >600 epg, the sensitivity for a HGB
concentration <13.2 g/dL was 100%. Similarly, the sensitivity for a PCV below 33.5% was 100%
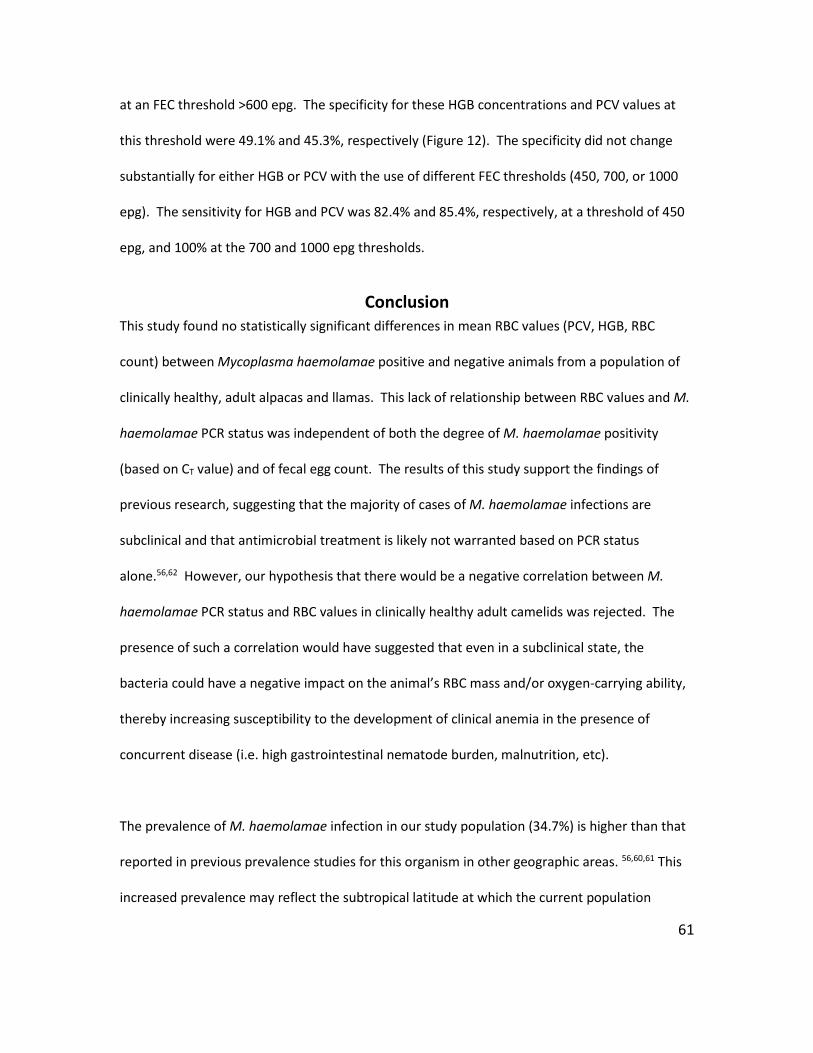
61
at an FEC threshold >600 epg. The specificity for these HGB concentrations and PCV values at
this threshold were 49.1% and 45.3%, respectively (Figure 12). The specificity did not change
substantially for either HGB or PCV with the use of different FEC thresholds (450, 700, or 1000
epg). The sensitivity for HGB and PCV was 82.4% and 85.4%, respectively, at a threshold of 450
epg, and 100% at the 700 and 1000 epg thresholds.
Conclusion This study found no statistically significant differences in mean RBC values (PCV, HGB, RBC
count) between Mycoplasma haemolamae positive and negative animals from a population of
clinically healthy, adult alpacas and llamas. This lack of relationship between RBC values and M.
haemolamae PCR status was independent of both the degree of M. haemolamae positivity
(based on CT value) and of fecal egg count. The results of this study support the findings of
previous research, suggesting that the majority of cases of M. haemolamae infections are
subclinical and that antimicrobial treatment is likely not warranted based on PCR status
alone.56,62 However, our hypothesis that there would be a negative correlation between M.
haemolamae PCR status and RBC values in clinically healthy adult camelids was rejected. The
presence of such a correlation would have suggested that even in a subclinical state, the
bacteria could have a negative impact on the animal’s RBC mass and/or oxygen-carrying ability,
thereby increasing susceptibility to the development of clinical anemia in the presence of
concurrent disease (i.e. high gastrointestinal nematode burden, malnutrition, etc).
The prevalence of M. haemolamae infection in our study population (34.7%) is higher than that
reported in previous prevalence studies for this organism in other geographic areas. 56,60,61 This
increased prevalence may reflect the subtropical latitude at which the current population
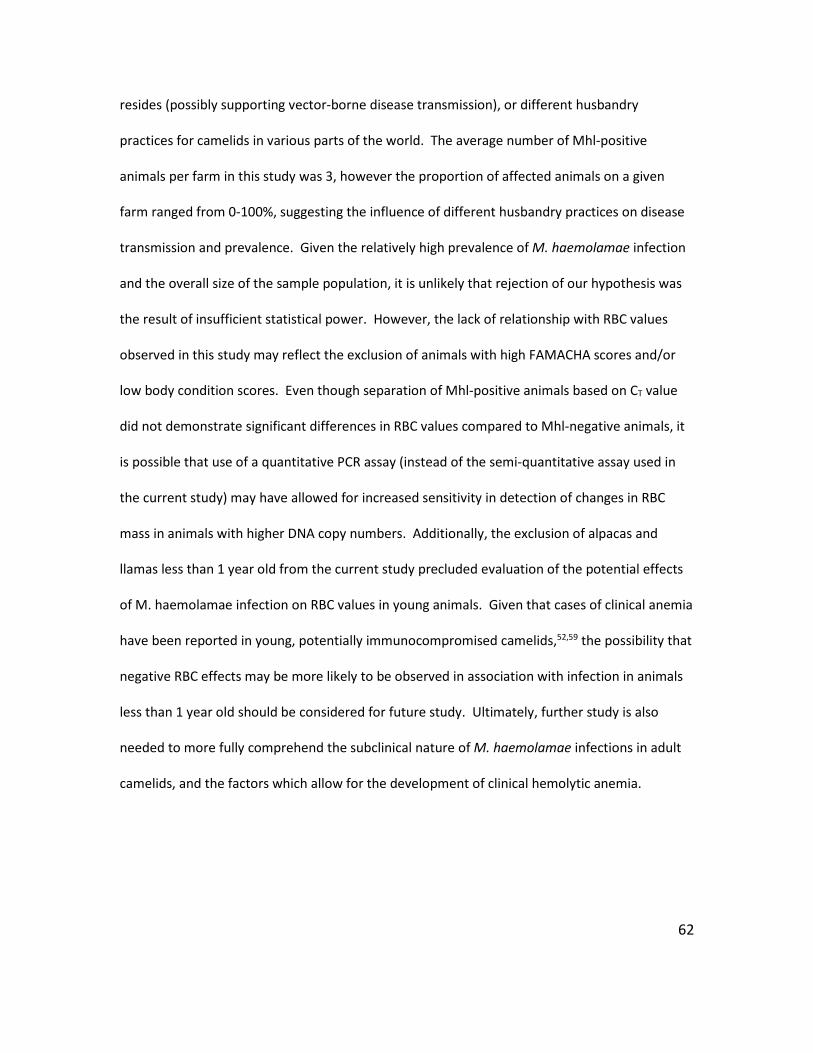
62
resides (possibly supporting vector-borne disease transmission), or different husbandry
practices for camelids in various parts of the world. The average number of Mhl-positive
animals per farm in this study was 3, however the proportion of affected animals on a given
farm ranged from 0-100%, suggesting the influence of different husbandry practices on disease
transmission and prevalence. Given the relatively high prevalence of M. haemolamae infection
and the overall size of the sample population, it is unlikely that rejection of our hypothesis was
the result of insufficient statistical power. However, the lack of relationship with RBC values
observed in this study may reflect the exclusion of animals with high FAMACHA scores and/or
low body condition scores. Even though separation of Mhl-positive animals based on CT value
did not demonstrate significant differences in RBC values compared to Mhl-negative animals, it
is possible that use of a quantitative PCR assay (instead of the semi-quantitative assay used in
the current study) may have allowed for increased sensitivity in detection of changes in RBC
mass in animals with higher DNA copy numbers. Additionally, the exclusion of alpacas and
llamas less than 1 year old from the current study precluded evaluation of the potential effects
of M. haemolamae infection on RBC values in young animals. Given that cases of clinical anemia
have been reported in young, potentially immunocompromised camelids,52,59 the possibility that
negative RBC effects may be more likely to be observed in association with infection in animals
less than 1 year old should be considered for future study. Ultimately, further study is also
needed to more fully comprehend the subclinical nature of M. haemolamae infections in adult
camelids, and the factors which allow for the development of clinical hemolytic anemia.
63
The results of the present study do demonstrate a trend of decreasing RBC values with
increasing FECs, and that clinically healthy animals with high FECs (>1000 epg) are statistically
more likely to have lower RBC counts and HGB concentration than animals with FECs <450 epg.
Additionally, an FEC threshold of 600 epg has excellent sensitivity and fair specificity, in this
population of clinically healthy camelids, for predicting a PCV and HGB concentration below the
median of the reference interval. Alpaca and llama owners and veterinarians currently have
limited tools available for assessing the clinical significance of gastrointestinal parasite burdens
and the need for parasite treatment. The goal of deworming is to prevent and/or treat the
effects of clinical blood loss anemia in at-risk animals, while avoiding the promotion of parasite
resistance to the anthelminthic medications. However, owners and veterinarians are often
faced with the limited options of either deworming clinically anemic animals (as identified by a
FAMACHA score),72 or prophylactically deworming all animals on the farm (or a random subset)
in hopes of reaching those animals who are most likely to develop clinical disease and/or shed
large numbers of eggs. The identification of a FEC threshold above which RBC values are likely
to be negatively affected should therefore aid substantially in making treatment decisions,
allowing for targeted deworming of those animals with clinically significant nematode burdens.
However, FEC testing via the Modified McMaster’s test is inherently of low analytical sensitivity,
as each strongylid egg counted is interpreted as representing 50 eggs. The lowest obtainable
FEC is therefore <50 epg, and all egg counts are expressed in intervals of 50; this test is
therefore only semi-quantitative. FEC testing is also relatively imprecise, since counts can vary
substantially between observers, between different portions of the same fecal sample, and with
variations in the concentration of the flotation solution, sample dilution, and volume of the
counting chamber.69 Additionally, the correlation between trichostrongylid egg numbers in
64
feces and adult worm burden of a particular species (i.e. Haemonchus spp.) in the GI tract is
uncertain. The FEC test as performed in this study is relatively simple in its methodology, and
has the potential to be replicated on-farm by alpaca and llama owners; however, additional
research assessing the precision and accuracy of owner-performed FECs compared to those
performed by diagnostic laboratory personnel would be required prior to implementation of the
use of these diagnostic guidelines for animal owners. Additionally, the present study only
allowed for assessment of the association between FEC and RBC values at a single point in time.
It would therefore be useful to perform a prospective cohort study in the future, in order to
determine whether an FEC over 600 epg is truly predictive for the development of anemia. The
inclusion of young camelids (less than 1 year old) in any future studies would also be helpful in
assessing the effects of gastrointestinal nematodes on RBC values in this age group.
An important limitation of both parts of this study is the inability to exclude the effects of other
factors (internal and external) on the measured RBC values. RBC values are analyzed as a
reflection of an animal’s overall RBC mass, which is affected by multiple factors including age,
hydration status, nutrient balance, and renal and bone marrow function. Despite the presence
of known causes of anemia (Mycoplasma spp., gastrointestinal nematodes), it is difficult to
attribute changes in RBC values (or lack thereof) solely to the presence or absence of these
organisms. For example, decreased RBC values may reflect iron deficiency, or the effects of
inflammation on erythropoiesis, rather than direct blood loss from endoparasites.
65
In conclusion, the results of the present study confirm the findings of previous studies which
demonstrate a lack of association between M. haemolamae infection and PCV in alpacas and
llamas, and expand these findings to also include a lack of association with HGB concentration or
RBC count. Overall, this suggests that treatment of clinically healthy M. haemolamae PCR-
positive animals is not warranted, although M. haemolamae infection cannot be ruled out as a
contributing cause to the development of clinical anemia in these camelids. Finally, with
additional research and method validation, the use of an FEC threshold of <600 epg in clinically
healthy alpacas and llamas may provide one component for guiding deworming strategies.
66
CONCLUSION The present studies provide, to the author’s knowledge, the first report of validated hematology
methods for camelid species, as well as the first set of evidence supporting the existence of an
acceptable endoparasite load in camelids. Camelid erythrocytes do not sphere when mixed with
ADVIA sphering reagent, making some RBC values inaccurate. Based on our results, the
recommended method for reporting the erythrogram and thrombogram from camelids using
the ADVIA 120 is as follows:
• RBC count: ADVIA equine setting
• HGB concentration: ADVIA equine setting
• Volume percentage of RBCs in whole blood: PCV
• MCV: Calculated (PCV divided by ADVIA equine setting RBC count multiplied by 10)
• MCHC: Calculated (ADVIA equine setting HGB divided by PCV multiplied by 100)
• Platelet count: ADVIA equine setting
RBC values are not significantly different between M. haemolamae positive and negative
animals, but are significantly lower in animals with FEC>600epg. For all animals with
FEC>600epg, RBC values are below the medians of the reference intervals. Positive M.
haemolamae PCR is not associated with lower RBC values in healthy camelids, consistent with
previous reports that most infections are subclinical. Maintaining FEC below 600 epg is
recommended in camelids.

67
REFERENCES
68
1. Tornquist SJ. Clinical pathology of llamas and alpacas. Vet Clin North Am Food Anim Pract. 2009;25(2):311-322.
2. Tornquist SJ, Cebra C. Clinical Pathology. In: Llama and Alpaca Care.2014:338-350. 3. Vap L, Bohn AA. Hematology of camelids. Vet Clin North Am Exot Anim Pract.
2015;18(1):41-49. 4. Raskin R, Wardrop K. Species specific hematology. In. Schalm’s Veterinary Hematology,
6th edition, Wiley-Blackwell, Iowa2010:797-1018. 5. Omorphos S, Hawkey CM, Rice-Evans C. The elliptocyte: a study of the relationship
between cell shape and membrane structure using the camelid erythrocyte as a model. Comparative Biochemistry and Physiology Part B: Comparative Biochemistry. 1989;94(4):789-795.
6. Harvey JW. Chapter 7 - The Erythrocyte: Physiology, Metabolism, and Biochemical Disorders. In: Clinical Biochemistry of Domestic Animals (Sixth Edition). San Diego: Academic Press; 2008:173-240.
7. Silveira P, Cynober T, Dhermy D, Mohandas N, Tchernia G. Red blood cell abnormalities in hereditary elliptocytosis and their relevance to variable clinical expression. American Journal of Clinical Pathology. 1997;108(4):391-399.
8. Di Terlizzi R, Gallagher PG, Mohandas N, et al. Canine elliptocytosis due to a mutant β-spectrin. Veterinary Clinical Pathology. 2009;38(1):52-58.
9. Gulliver G. Observations on the Sizes and Shapes of the Red Corpuscles of the Blood of Vertebrates. 1875.
10. Jain N, Keeton K. Morphology of camel and llama erythrocytes as viewed with the scanning electron microscope. British Veterinary Journal. 1974;130(3):288-291.
11. Rana J, Bhardwaj R, Singh R. Morphological studies of erythrocytes in different animal species. INDIAN VETERINARY JOURNAL. 1992;69(6):505-507.
12. Lewis JH. Comparative hematology—studies on camelidae. Comparative Biochemistry and Physiology Part A: Physiology. 1976;55(4):367-371.
13. Bogner P, Miseta A, Berente Z, Schwarcz A, Kotek G, Repa I. Osmotic and diffusive properties of intracellular water in camel erythrocytes: effect of hemoglobin crowdedness. Cell Biol Int. 2005;29(9):731-736.
14. Bogner P, Csutora P, Cameron IL, Wheatley DN, Miseta A. Augmented water binding and low cellular water content in erythrocytes of camel and camelids. Biophysical Journal. 1998;75(6):3085-3091.
15. Jain N. MEASUREMENT, INTERPRETATION, FACTORS INVOLVED, AND MECHANISM OF OSMOTIC FRAGILITY WITH OBSERVATIONS ON ANIMAL ERYTHROCYTES. Veterinary Clinical Pathology. 1972;1(3):3-24.
16. Schroter R, Filali RZ, Brain A, Jeffrey P, Robertshaw D. Influence of dehydration and watering on camel red cell size: a scanning electron microscopic study. Respiration Physiology. 1990;81(3):381-390.
17. Eitan A, Aloni B, Livne A. Unique properties of the camel erythrocyte membrane: II. Organization of membrane proteins. Biochimica et Biophysica Acta (BBA)-Biomembranes. 1976;426(4):647-658.
18. Smith JE, Mohandas N, Shohet SB. Variability in erythrocyte deformability among various mammals. American Journal of Physiology-Heart and Circulatory Physiology. 1979;236(5):H725-H730.
69
19. McPherson RA, Sawyer WH, Tilley L. Band 3 mobility in camelid elliptocytes: implications for erythrocyte shape. Biochemistry. 1993;32(26):6696-6702.
20. Khodadad JK, Weinstein RS. The band 3-rich membrane of llama erythrocytes: studies on cell shape and the organization of membrane proteins. Journal of Membrane Biology. 1983;72(3):161-171.
21. Poyart C, Wajcman H, Kister J. Molecular adaptation of hemoglobin function in mammals. Respiration Physiology. 1992;90(1):3-17.
22. Bartels H, Hilpert P, Barbey K, et al. Respiratory functions of blood of the yak, llama, camel, Dybowski deer, and African elephant. American Journal of Physiology--Legacy Content. 1963;205(2):331-336.
23. Moritz A, Becker M. Automated hematology systems. In. Schalm's Veterinary Hematology. 6th edn. Edited by Weiss DJ, Wardrop KJ: Ames, Iowa: Wiley-Blackwell2010:1054-1056.
24. Tycko D, Metz M, Epstein E, Grinbaum A. Flow-cytometric light scattering measurement of red blood cell volume and hemoglobin concentration. Applied Optics. 1985;24(9):1355-1365.
25. Harris N, Kunicka J, Kratz A. The ADVIA 2120 hematology system: flow cytometry-based analysis of blood and body fluids in the routine hematology laboratory. Laboratory Hematology: Official Publication of the International Society for Laboratory Hematology. 2005;11(1):47-61.
26. Perez-Ecija A, Gonzalez-De Cara CA, Aguilera-Aguilera R, Estepa JC, Rubio MD, Mendoza FJ. Comparison of donkey hemogram using the LaserCyte hematology analyzer, an impedance system, and a manual method. Vet Clin Pathol. 2014;43(4):525-537.
27. Giordano A, Rossi G, Pieralisi C, Paltrinieri S. Evaluation of equine hemograms using the ADVIA 120 as compared with an impedance counter and manual differential count. Veterinary Clinical Pathology. 2008;37(1):21-30.
28. Dawson DR, DeFrancisco RJ, Stokol T. Reference intervals for hematologic and coagulation tests in adult alpacas (Vicugna pacos). Vet Clin Pathol. 2011;40(4):504-512.
29. Weiser M, Fettman M, Van Houten D, Johnson L, Garry F. Characterization of erythrocytic indices and serum iron values in healthy llamas. American Journal of Veterinary Research. 1992;53(10):1776-1779.
30. Hajduk P. Haematological reference values for alpacas. Australian Veterinary Journal. 1992;69(4):89-90.
31. Siemens. Advia 120 Hematology System, Performance Specifications. https://www.healthcare.siemens.com/hematology/systems/advia-120-hematology-system/technical-specifications. Accessed January 3, 2018.
32. Siemens. Module 4: ADVIA 120 Methods. 33. Latimer P. Light scattering by ellipsoids. Journal of Colloid and Interface Science.
1975;53(1):102-109. 34. Kinnunen M, Kauppila A, Karmenyan A, Myllylä R. Effect of the size and shape of a red
blood cell on elastic light scattering properties at the single-cell level. Biomedical Optics Express. 2011;2(7):1803-1814.
35. Borovoi AG, Naats EI, Oppel UG. Scattering of light by a red blood cell. Journal of Biomedical Optics. 1998;3(3):364-373.
70
36. Mohandas N, Kim Y, Tycko D, Orlik J, Wyatt J, Groner W. Accurate and independent measurement of volume and hemoglobin concentration of individual red cells by laser light scattering. Blood. 1986;68(2):506-513.
37. Mohandas N, Clark MR, Kissinger S, Bayer C, Shohet SB. Inaccuracies associated with the automated measurement of mean cell hemoglobin concentration in dehydrated cells. Blood. 1980;56(1):125-128.
38. Rice-Evans C, Omorphos S, White JM. The effects of hydrazine on sickle cells. Biochimica et Biophysica Acta (BBA)-Biomembranes. 1982;691(2):367-371.
39. Dawson Soto DR, Stokol T, DeFrancisco R. Clarification of methods for hematologic reference intervals in adult alpacas. Veterinary Clinical Pathology. 2014;43(1):1-1.
40. Pan L-L, Chen C-M, Huang W-T, Sun C-K. Enhanced Accuracy of Optical Platelet Counts in Microcytic Anemia. Laboratory Medicine. 2014;45(1):32-36.
41. Grimes CN, Fry MM. Customization of Advia 120 thresholds for canine erythrocyte volume and hemoglobin concentration, and effects on morphology flagging results. The Canadian Veterinary Journal. 2014;55(12):1173.
42. Beckman Coulter, Inc. Z Series Coulter counter: cell counting and sizing. Fullerton, CA. 2004.
43. England JM. Reference method for the enumeration of erythrocytes and leucocytes. Clinical & Laboratory Haematology. 1994;16(2):131-138.
44. Chernyshev AV, Tarasov PA, Semianov KA, Nekrasov VM, Hoekstra AG, Maltsev VP. Erythrocyte lysis in isotonic solution of ammonium chloride: Theoretical modeling and experimental verification. Journal of Theoretical Biology. 2008;251(1):93-107.
45. Johnson J, Edmondson M, Walz P, Marley M, Givens M. Comparison of clinical, hematological, and virological findings in alpacas (Lama pacos) inoculated with bovine viral diarrhea virus isolates of alpaca or bovine origin. Small Ruminant Research. 2010;94(1):66-72.
46. Topliff CL, Smith DR, Clowser SL, et al. Prevalence of bovine viral diarrhea virus infections in alpacas in the United States. Journal of the American Veterinary Medical Association. 2009;234(4):519-529.
47. Abdurahman OAS, Saad AM. Characterization of camel leukocytes by flow cytometry and microscopic evaluation of granulocyte phagocytosis of fluorescent bacteria. Transboundary and Emerging Diseases. 1996;43(1-10):111-117.
48. Killeen AA, Long T, Souers R, Styer P, Ventura CB, Klee GG. Verifying performance characteristics of quantitative analytical systems: calibration verification, linearity, and analytical measurement range. Archives of Pathology & Laboratory Medicine. 2014;138(9):1173-1181.
49. Serebrennikova YM, Huffman DE, Garcia-Rubio LH. Characterization of red blood cells with multiwavelength transmission spectroscopy. Biomed Res Int. 2015;2015:382641.
50. Tomaiuolo G, Rossi D, Caserta S, Cesarelli M, Guido S. Comparison of two flow-based imaging methods to measure individual red blood cell area and volume. Cytometry A. 2012;81(12):1040-1047.
51. Messick JB. Hemotrophic mycoplasmas (hemoplasmas): a review and new insights into pathogenic potential. Veterinary Clinical Pathology. 2004;33(1):2-13.
52. Allison R, Meinkoth J. Anemia caused by rickettsia, mycoplasma, and protozoa. Schalm’s Veterinary Hematology 6th Ed Wiley-Blackwell. 2010.
71
53. Guimaraes AM, Toth B, Santos AP, do Nascimento NC, Kritchevsky JE, Messick JB. Genome sequence of “Candidatus Mycoplasma haemolamae” strain purdue, a red blood cell pathogen of alpacas (Vicugna pacos) and llamas (Lama glama). Journal of Bacteriology. 2012;194(22):6312-6313.
54. Meli ML, Kaufmann C, Zanolari P, et al. Development and application of a real-time TaqMan((R)) qPCR assay for detection and quantification of 'Candidatus Mycoplasma haemolamae' in South American camelids. Vet Microbiol. 2010;146(3-4):290-294.
55. Ghazisaeedi F, Atyabi N, Zahrai Salehi T, et al. A molecular study of hemotropic mycoplasmas (hemoplasmas) in cats in Iran. Vet Clin Pathol. 2014;43(3):381-386.
56. Tornquist SJ, Boeder L, Rios-Phillips C, Alarcon V. Prevalence of Mycoplasma haemolamae infection in Peruvian and Chilean llamas and alpacas. Journal of Veterinary Diagnostic Investigation. 2010;22(5):766-769.
57. Reagan W, Garry F, Thrall M, Colgan S, Hutchison J, Weiser M. The clinicopathologic, light, and scanning electron microscopic features of eperythrozoonosis in four naturally infected llamas. Veterinary Pathology. 1990;27(6):426-431.
58. Fisher DJ, Zinkl JG. Eperythrozoonosis in a One-Day-Old Llama. Veterinary Clinical Pathology. 1996;25(3):93-94.
59. Almy FS, Ladd SM, Sponenberg DP, Crisman MV, Messick JB. Mycoplasma haemolamae infection in a 4-day-old cria: support for in utero transmission by use of a polymerase chain reaction assay. The Canadian Veterinary Journal. 2006;47(3):229.
60. Crosse P, Ayling R, Whitehead C, et al. First detection of 'Candidatus Mycoplasma haemolamae' infection in alpacas in England. Vet Rec. 2012;171(3):71.
61. Dittmer KE, Hinkson JA, Dwyer C, Adlington B, van Andel M. Prevalence of Candidatus Mycoplasma haemolamae, bovine viral diarrhoea virus, and gastrointestinal parasitism in a sample of adult New Zealand alpaca (Vicugna pacos). N Z Vet J. 2018;66(1):9-15.
62. Tornquist SJ, Boeder LJ, Cebra CK, Messick J. Use of a polymerase chain reaction assay to study response to oxytetracycline treatment in experimental Candidatus Mycoplasma haemolamae infection in alpacas. American Journal of Veterinary Research. 2009;70(9):1102-1107.
63. Ballweber LR. Ecto- and endoparasites of new world camelids. Vet Clin North Am Food Anim Pract. 2009;25(2):295-310.
64. Cafrune MaM, Aguirre DH, Rickard LG. First report of Lamanema chavezi (Nematoda: Trichostrongyloidea) in llamas (Lama glama) from Argentina. Veterinary Parasitology. 2001;97(2):165-168.
65. Dargie J, Allonby E. Pathophysiology of single and challenge infections of Haemonchus contortus in Merino sheep: Studies on red cell kinetics and the “self-cure” phenomenon. International Journal for Parasitology. 1975;5(2):147-157.
66. Edwards EE, Garner BC, Williamson LH, Storey BE, Sakamoto K. Pathology of Haemonchus contortus in New World camelids in the southeastern United States: a retrospective review. J Vet Diagn Invest. 2016;28(2):105-109.
67. Cebra CK, Stang BV. Comparison of methods to detect gastrointestinal parasites in llamas and alpacas. Journal of the American Veterinary Medical Association. 2008;232(5):733-741.
68. Galvan N, Middleton JR, Nagy DW, Schultz LG, Schaeffer JW. Anthelmintic resistance in a herd of alpacas (Vicugna pacos). The Canadian Veterinary Journal. 2012;53(12):1310.
72
69. Cringoli G, Rinaldi L, Veneziano V, Capelli G, Scala A. The influence of flotation solution, sample dilution and the choice of McMaster slide area (volume) on the reliability of the McMaster technique in estimating the faecal egg counts of gastrointestinal strongyles and Dicrocoelium dendriticum in sheep. Vet Parasitol. 2004;123(1-2):121-131.
70. Le Jambre L. Relationship of blood loss to worm numbers, biomass and egg production in Haemonchus infected sheep. International Journal for Parasitology. 1995;25(3):269-273.
71. Burke JM, Kaplan RM, Miller JE, et al. Accuracy of the FAMACHA system for on-farm use by sheep and goat producers in the southeastern United States. Vet Parasitol. 2007;147(1-2):89-95.
72. Storey BE, Williamson LH, Howell SB, et al. Validation of the FAMACHA(c) system in South American camelids. Vet Parasitol. 2017;243:85-91.
73. Di Loria A, Veneziano V, Piantedosi D, et al. Evaluation of the FAMACHA system for detecting the severity of anaemia in sheep from southern Italy. Vet Parasitol. 2009;161(1-2):53-59.
74. Vanimisetti H, Andrew S, Zajac A, Notter D. Inheritance of fecal egg count and packed cell volume and their relationship with production traits in sheep infected with. Journal of Animal Science. 2004;82(6):1602-1611.
75. Kim YR, Ornstein L. Isovolumetric sphering of erythrocytes for more accurate and precise cell volume measurement by flow cytometry. Cytometry Part A. 1983;3(6):419-427.
76. Semevolos SA, Youngblood CD, Grissom SK, Gorman ME, Larson MK. Evaluation of two platelet-rich plasma processing methods and two platelet-activation techniques for use in llamas and alpacas. American Journal of Veterinary Research. 2016;77(11):1288-1294.
77. Nabity MB, Harr KE, Camus MS, Flatland B, Vap Linda M. ASVCP guidelines: Allowable total error hematology. Veterinary Clinical Pathology. 2018;47(1):9-21.
78. Stokol T, Erb HN. A comparison of platelet parameters in EDTA-and citrate-anticoagulated blood in dogs. Veterinary Clinical Pathology. 2007;36(2):148-154.
79. Rogausch H. Time-dependent reaction of human red cell deformability on sphering agents. Pflügers Archiv. 1976;362(2):121-126.

73
APPENDIX
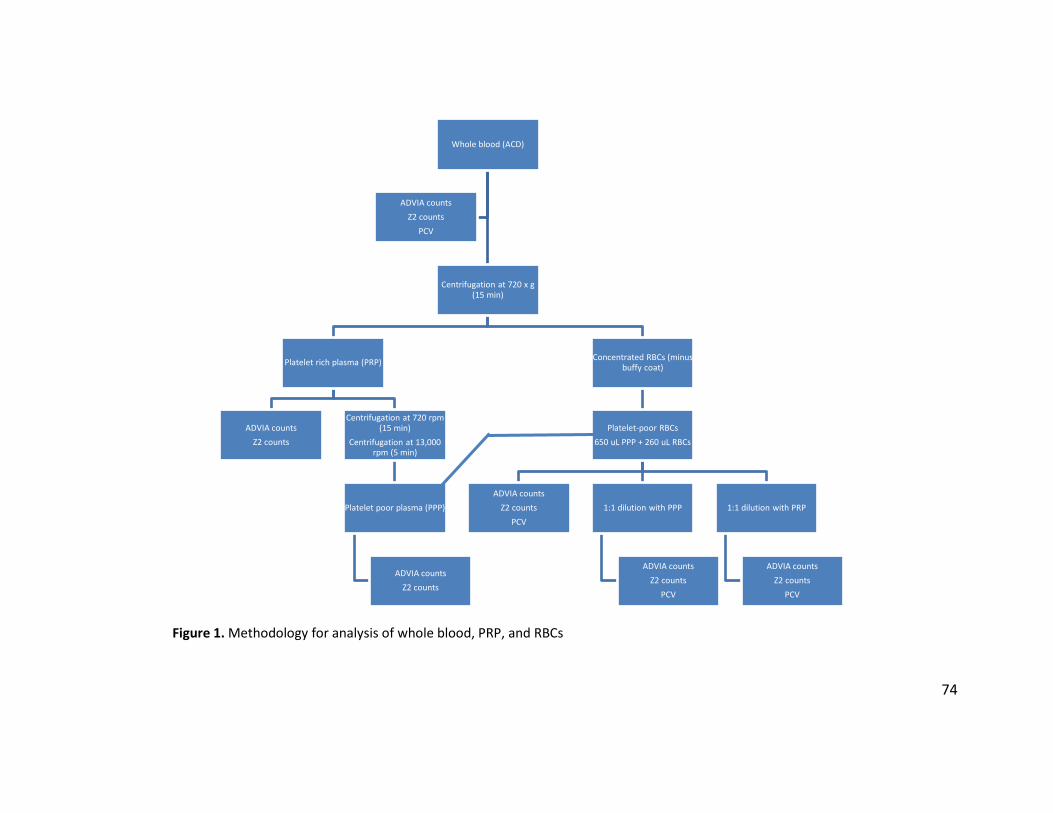
74
Figure 1. Methodology for analysis of whole blood, PRP, and RBCs
Whole blood (ACD)
Centrifugation at 720 x g (15 min)
Platelet rich plasma (PRP)
ADVIA countsZ2 counts
Centrifugation at 720 rpm (15 min)
Centrifugation at 13,000 rpm (5 min)
Platelet poor plasma (PPP)
ADVIA countsZ2 counts
Concentrated RBCs (minus buffy coat)
Platelet-poor RBCs650 uL PPP + 260 uL RBCs
ADVIA countsZ2 counts
PCV1:1 dilution with PPP
ADVIA countsZ2 counts
PCV
1:1 dilution with PRP
ADVIA countsZ2 counts
PCV
ADVIA countsZ2 counts
PCV
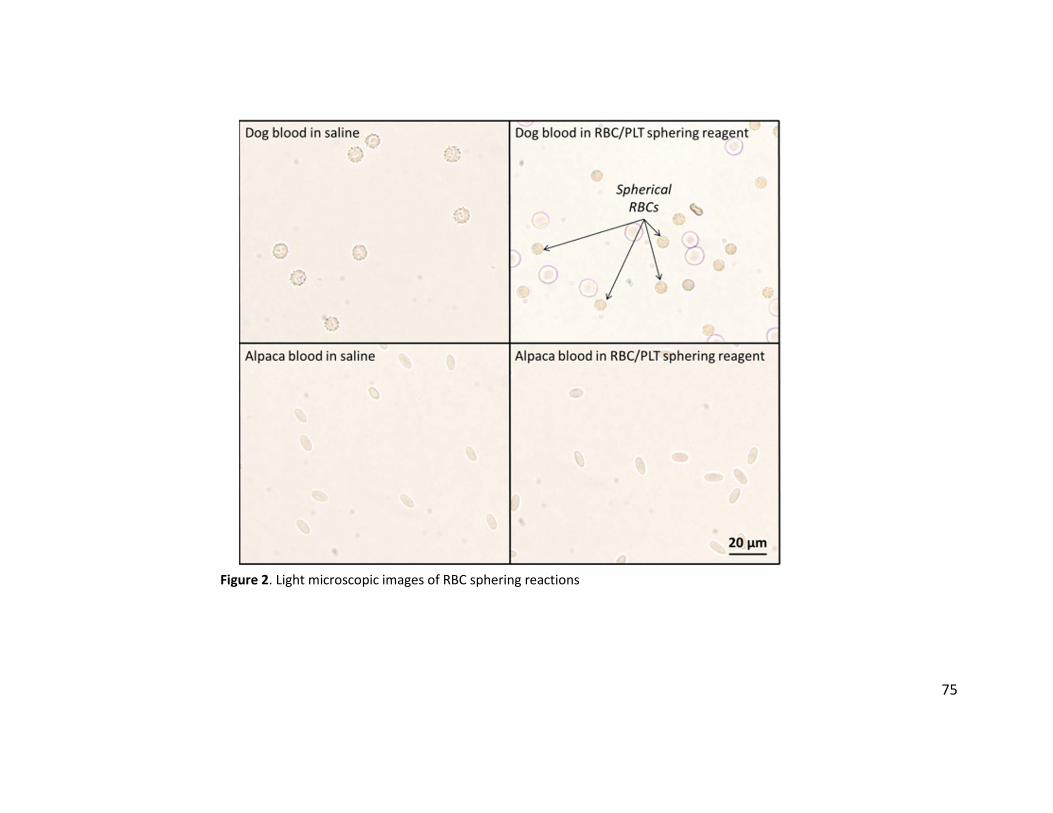
75
Figure 2. Light microscopic images of RBC sphering reactions
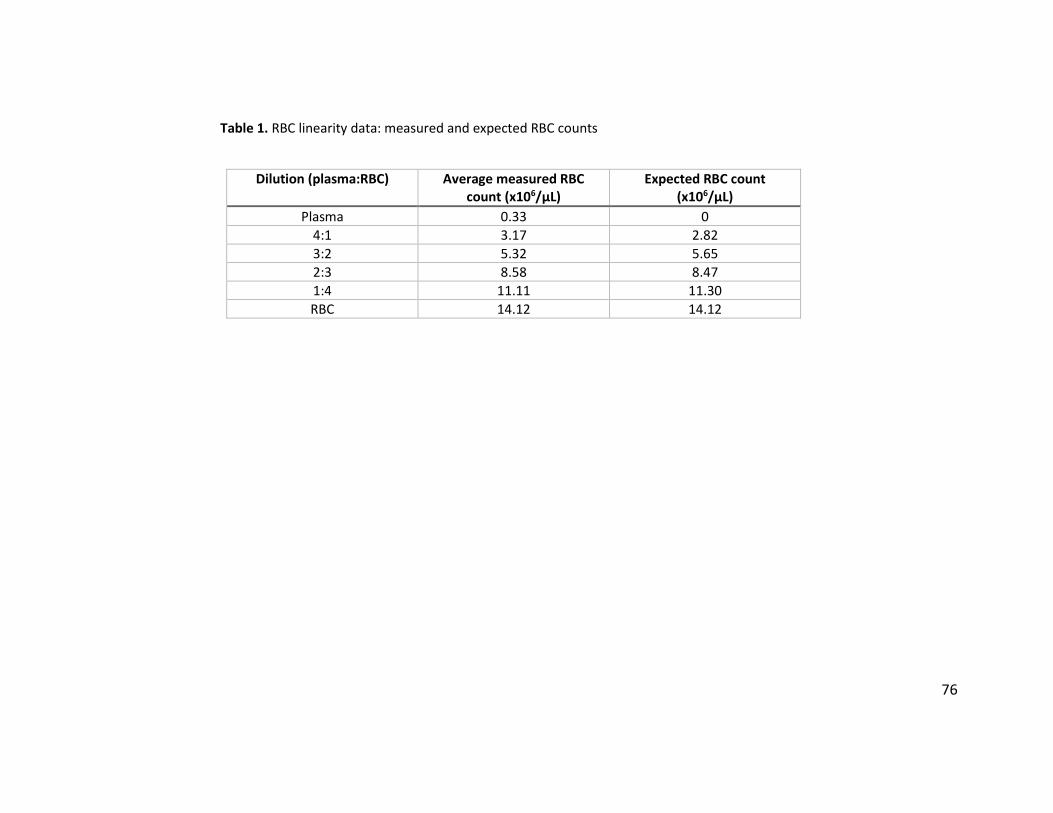
76
Table 1. RBC linearity data: measured and expected RBC counts
Dilution (plasma:RBC) Average measured RBC count (x106/µL)
Expected RBC count (x106/µL)
Plasma 0.33 0 4:1 3.17 2.82 3:2 5.32 5.65 2:3 8.58 8.47 1:4 11.11 11.30 RBC 14.12 14.12
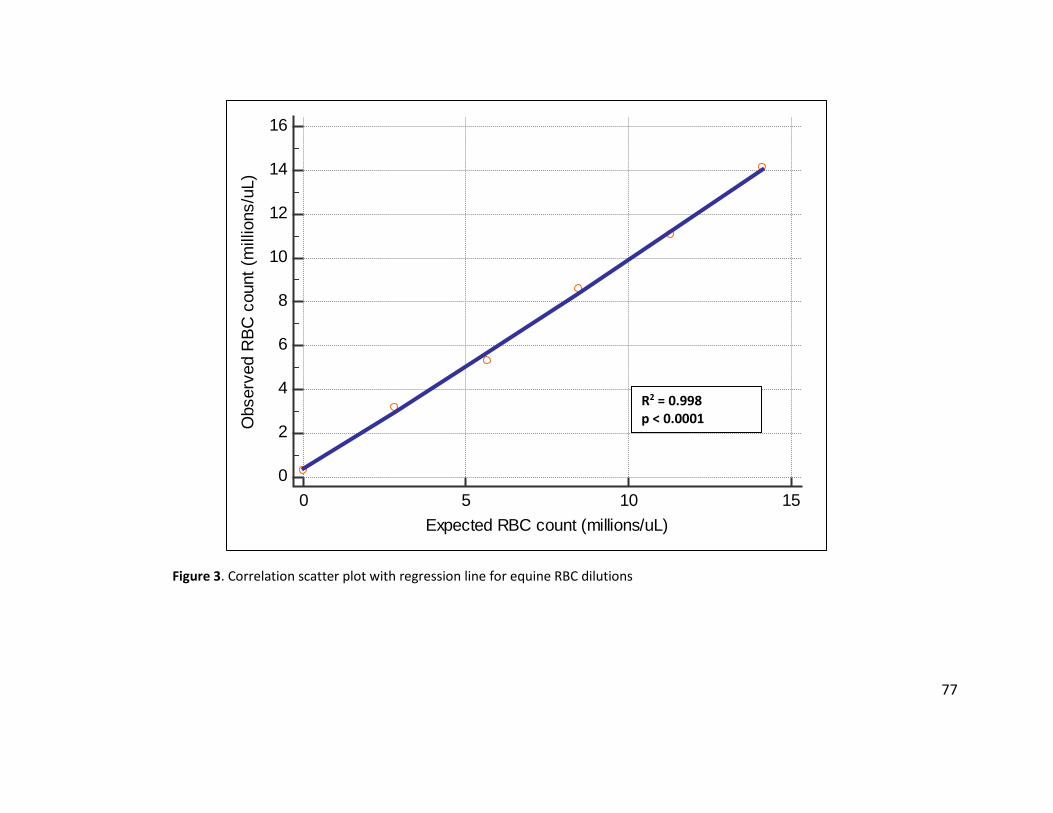
77
Figure 3. Correlation scatter plot with regression line for equine RBC dilutions
0
2
4
6
8
10
12
14
16
0 5 10 15Expected RBC count (millions/uL)
Obs
erve
d R
BC c
ount
(mill
ions
/uL)
R2 = 0.998 p < 0.0001
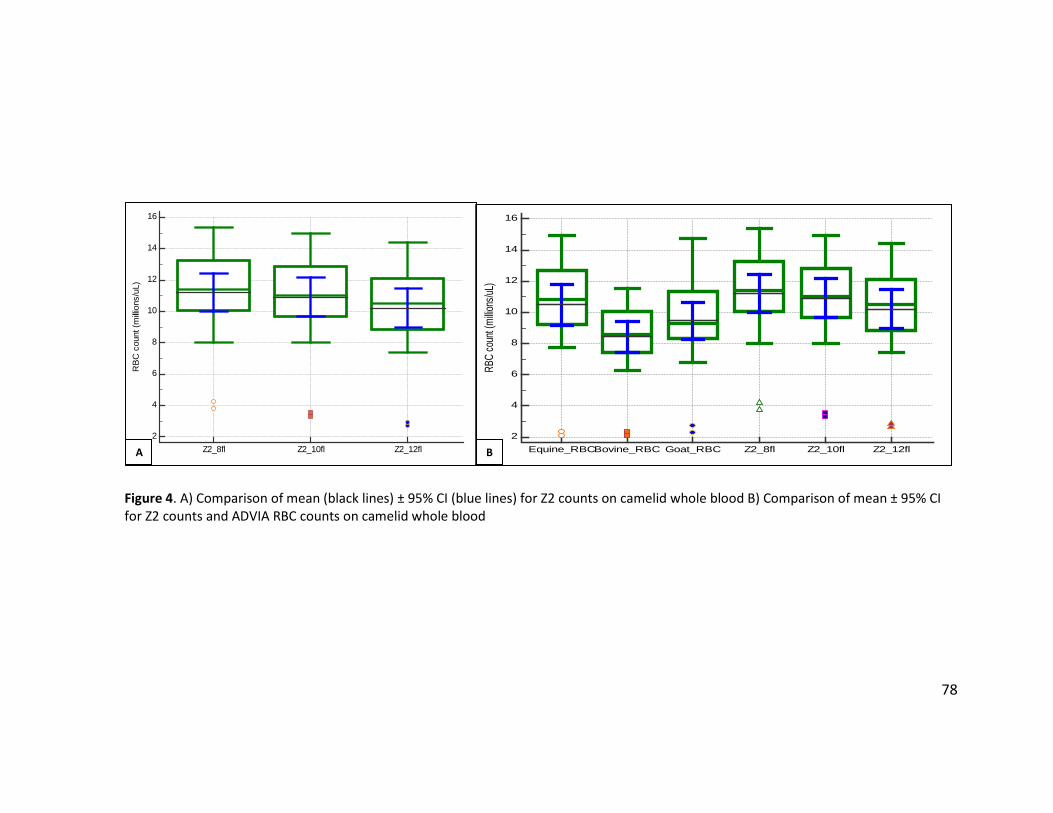
78
Figure 4. A) Comparison of mean (black lines) ± 95% CI (blue lines) for Z2 counts on camelid whole blood B) Comparison of mean ± 95% CI for Z2 counts and ADVIA RBC counts on camelid whole blood
2
4
6
8
10
12
14
16
RBC
coun
t (millio
ns/uL
)
Equine_RBCBovine_RBC Goat_RBC Z2_8fl Z2_10fl Z2_12fl2
4
6
8
10
12
14
16
RBC
cou
nt (m
illion
s/uL
)
Z2_8fl Z2_10fl Z2_12flA B
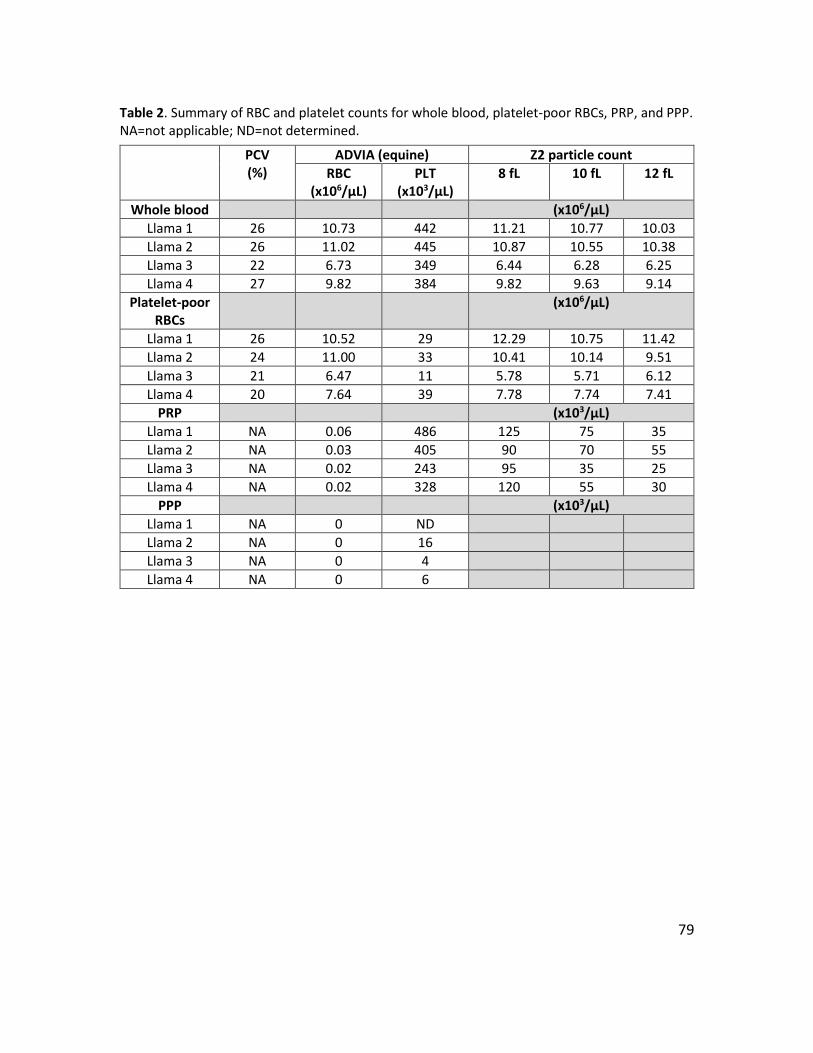
79
Table 2. Summary of RBC and platelet counts for whole blood, platelet-poor RBCs, PRP, and PPP. NA=not applicable; ND=not determined.
PCV (%)
ADVIA (equine) Z2 particle count RBC
(x106/µL) PLT
(x103/µL) 8 fL 10 fL 12 fL
Whole blood (x106/µL) Llama 1 26 10.73 442 11.21 10.77 10.03 Llama 2 26 11.02 445 10.87 10.55 10.38 Llama 3 22 6.73 349 6.44 6.28 6.25 Llama 4 27 9.82 384 9.82 9.63 9.14
Platelet-poor RBCs
(x106/µL)
Llama 1 26 10.52 29 12.29 10.75 11.42 Llama 2 24 11.00 33 10.41 10.14 9.51 Llama 3 21 6.47 11 5.78 5.71 6.12 Llama 4 20 7.64 39 7.78 7.74 7.41
PRP (x103/µL) Llama 1 NA 0.06 486 125 75 35 Llama 2 NA 0.03 405 90 70 55 Llama 3 NA 0.02 243 95 35 25 Llama 4 NA 0.02 328 120 55 30
PPP (x103/µL) Llama 1 NA 0 ND Llama 2 NA 0 16 Llama 3 NA 0 4 Llama 4 NA 0 6
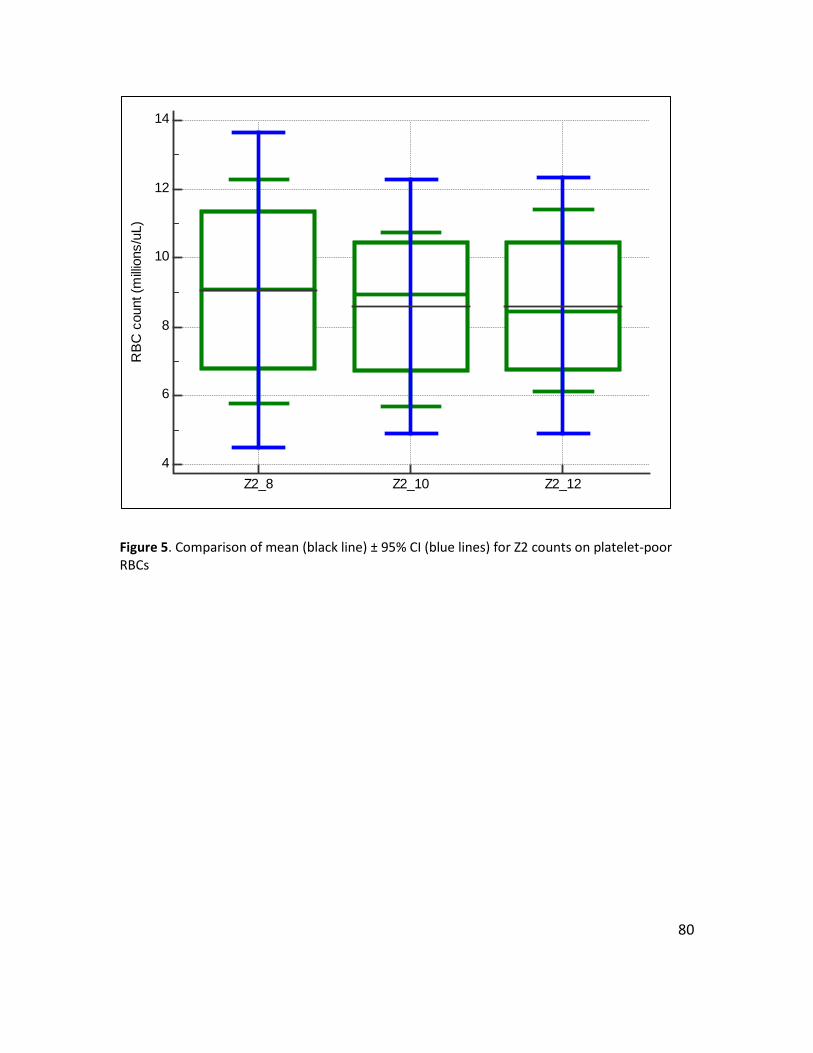
80
Figure 5. Comparison of mean (black line) ± 95% CI (blue lines) for Z2 counts on platelet-poor RBCs
4
6
8
10
12
14R
BC c
ount
(milli
ons/
uL)
Z2_8 Z2_10 Z2_12
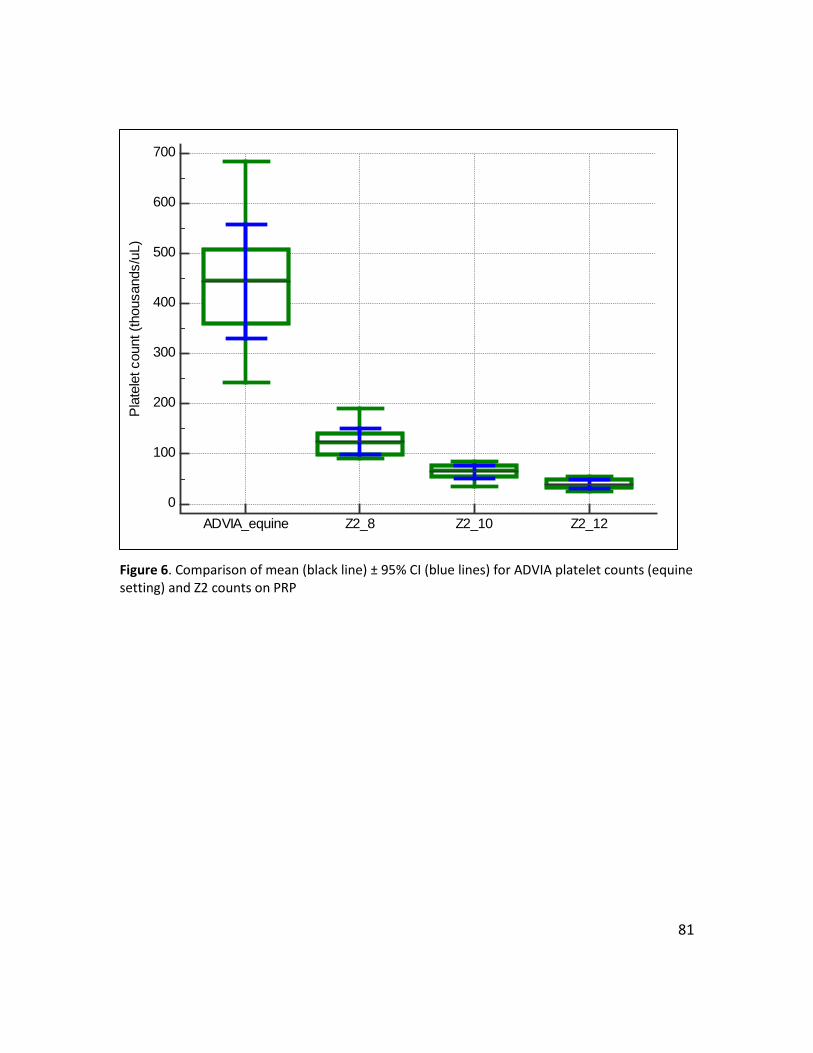
81
Figure 6. Comparison of mean (black line) ± 95% CI (blue lines) for ADVIA platelet counts (equine setting) and Z2 counts on PRP
0
100
200
300
400
500
600
700Pl
atel
et c
ount
(tho
usan
ds/u
L)
ADVIA_equine Z2_8 Z2_10 Z2_12
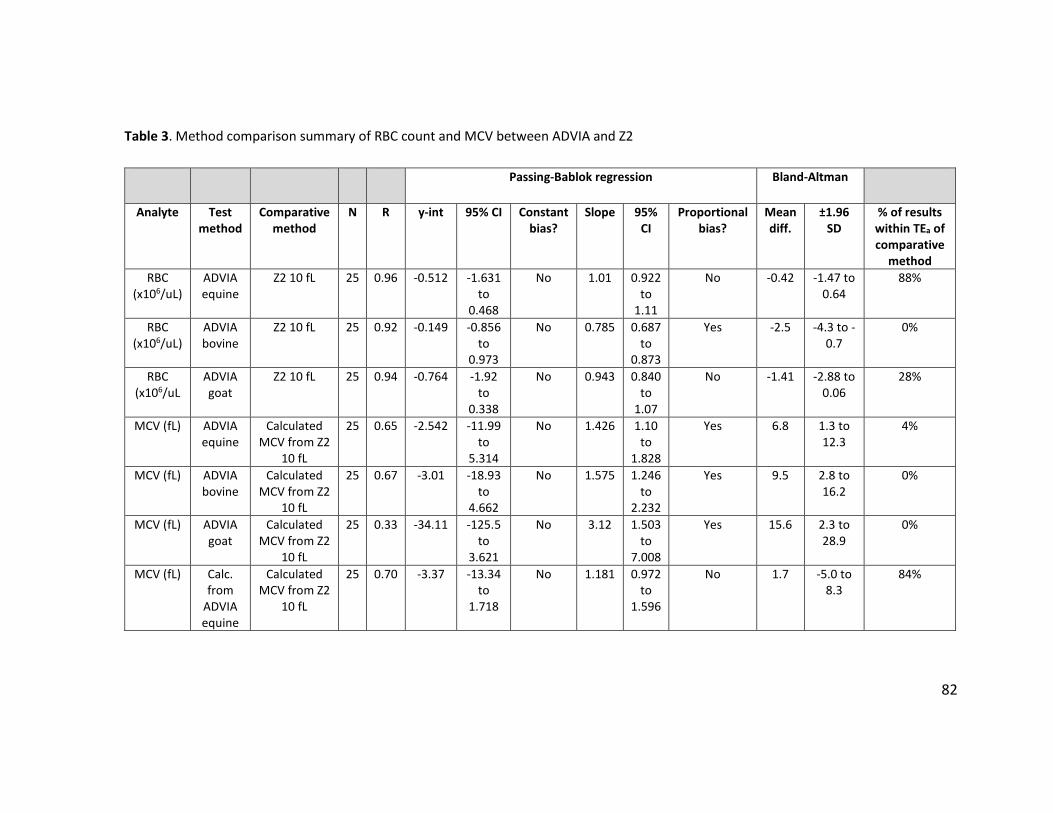
82
Table 3. Method comparison summary of RBC count and MCV between ADVIA and Z2
Passing-Bablok regression Bland-Altman
Analyte Test method
Comparative method
N R y-int 95% CI Constant bias?
Slope 95% CI
Proportional bias?
Mean diff.
±1.96 SD
% of results within TEa of comparative
method RBC
(x106/uL) ADVIA equine
Z2 10 fL 25 0.96 -0.512 -1.631 to
0.468
No 1.01 0.922 to
1.11
No -0.42 -1.47 to 0.64
88%
RBC (x106/uL)
ADVIA bovine
Z2 10 fL 25 0.92 -0.149 -0.856 to
0.973
No 0.785 0.687 to
0.873
Yes -2.5 -4.3 to -0.7
0%
RBC (x106/uL
ADVIA goat
Z2 10 fL 25 0.94 -0.764 -1.92 to
0.338
No 0.943 0.840 to
1.07
No -1.41 -2.88 to 0.06
28%
MCV (fL) ADVIA equine
Calculated MCV from Z2
10 fL
25 0.65 -2.542 -11.99 to
5.314
No 1.426 1.10 to
1.828
Yes 6.8 1.3 to 12.3
4%
MCV (fL) ADVIA bovine
Calculated MCV from Z2
10 fL
25 0.67 -3.01 -18.93 to
4.662
No 1.575 1.246 to
2.232
Yes 9.5 2.8 to 16.2
0%
MCV (fL) ADVIA goat
Calculated MCV from Z2
10 fL
25 0.33 -34.11 -125.5 to
3.621
No 3.12 1.503 to
7.008
Yes 15.6 2.3 to 28.9
0%
MCV (fL) Calc. from
ADVIA equine
Calculated MCV from Z2
10 fL
25 0.70 -3.37 -13.34 to
1.718
No 1.181 0.972 to
1.596
No 1.7 -5.0 to 8.3
84%
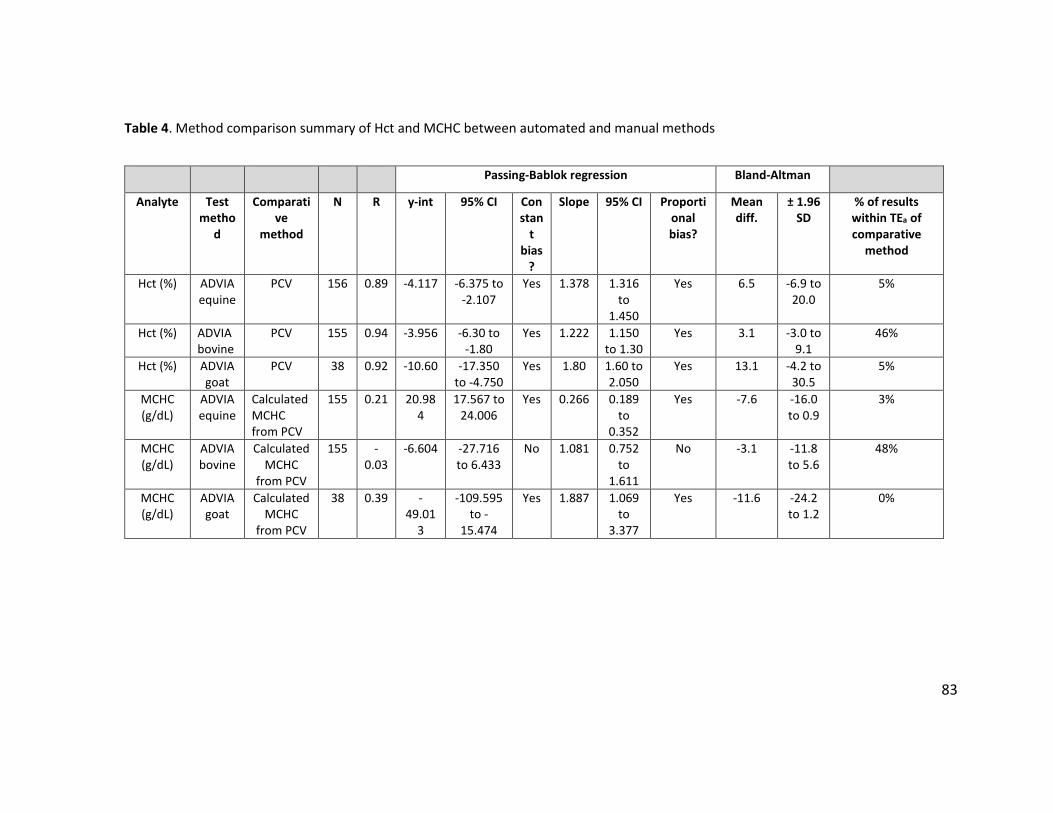
83
Table 4. Method comparison summary of Hct and MCHC between automated and manual methods
Passing-Bablok regression Bland-Altman
Analyte Test metho
d
Comparative
method
N R y-int 95% CI Constan
t bias
?
Slope 95% CI Proportional bias?
Mean diff.
± 1.96 SD
% of results within TEa of comparative
method
Hct (%) ADVIA equine
PCV 156 0.89 -4.117 -6.375 to -2.107
Yes 1.378 1.316 to
1.450
Yes 6.5 -6.9 to 20.0
5%
Hct (%) ADVIA bovine
PCV 155 0.94 -3.956 -6.30 to -1.80
Yes 1.222 1.150 to 1.30
Yes 3.1 -3.0 to 9.1
46%
Hct (%) ADVIA goat
PCV 38 0.92 -10.60 -17.350 to -4.750
Yes 1.80 1.60 to 2.050
Yes 13.1 -4.2 to 30.5
5%
MCHC (g/dL)
ADVIA equine
Calculated MCHC from PCV
155 0.21 20.984
17.567 to 24.006
Yes 0.266 0.189 to
0.352
Yes -7.6 -16.0 to 0.9
3%
MCHC (g/dL)
ADVIA bovine
Calculated MCHC
from PCV
155 -0.03
-6.604 -27.716 to 6.433
No 1.081 0.752 to
1.611
No -3.1 -11.8 to 5.6
48%
MCHC (g/dL)
ADVIA goat
Calculated MCHC
from PCV
38 0.39 -49.01
3
-109.595 to -
15.474
Yes 1.887 1.069 to
3.377
Yes -11.6 -24.2 to 1.2
0%
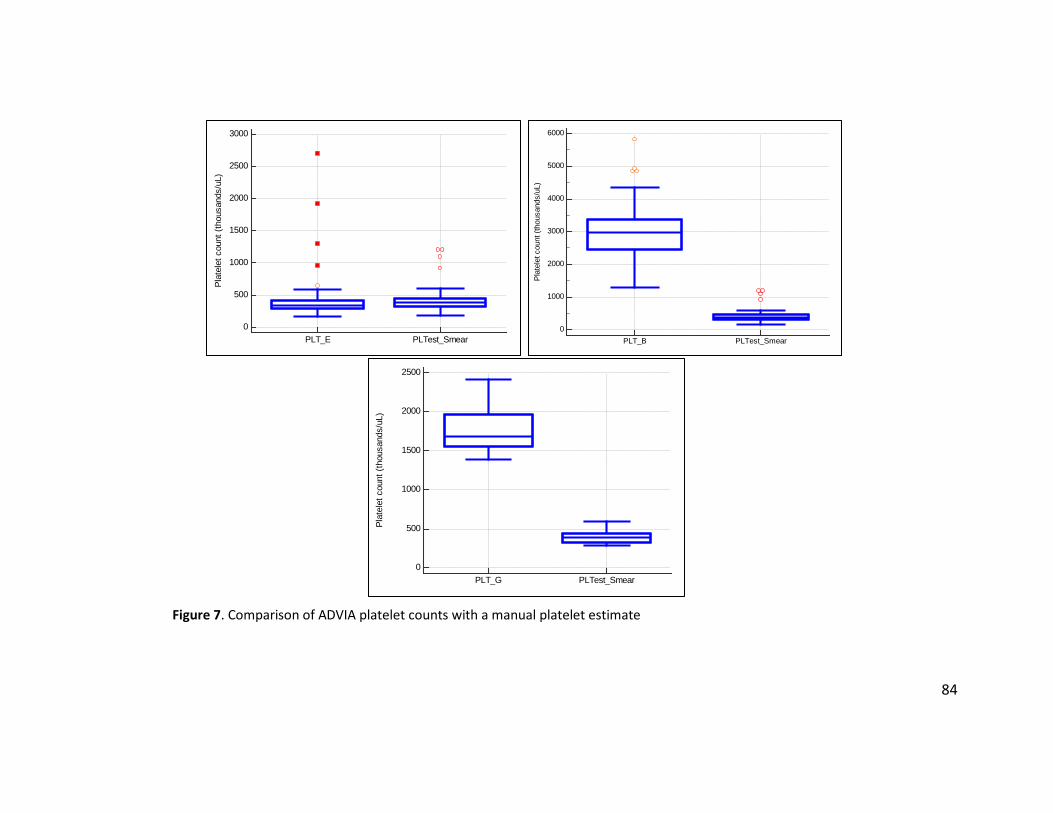
84
Figure 7. Comparison of ADVIA platelet counts with a manual platelet estimate
0
1000
2000
3000
4000
5000
6000
Plat
elet
cou
nt (t
hous
ands
/uL)
PLT_B PLTest_Smear
0
500
1000
1500
2000
2500
3000
Plat
elet
cou
nt (t
hous
ands
/uL)
PLT_E PLTest_Smear
0
500
1000
1500
2000
2500Pl
atel
et c
ount
(tho
usan
ds/u
L)
PLT_G PLTest_Smear
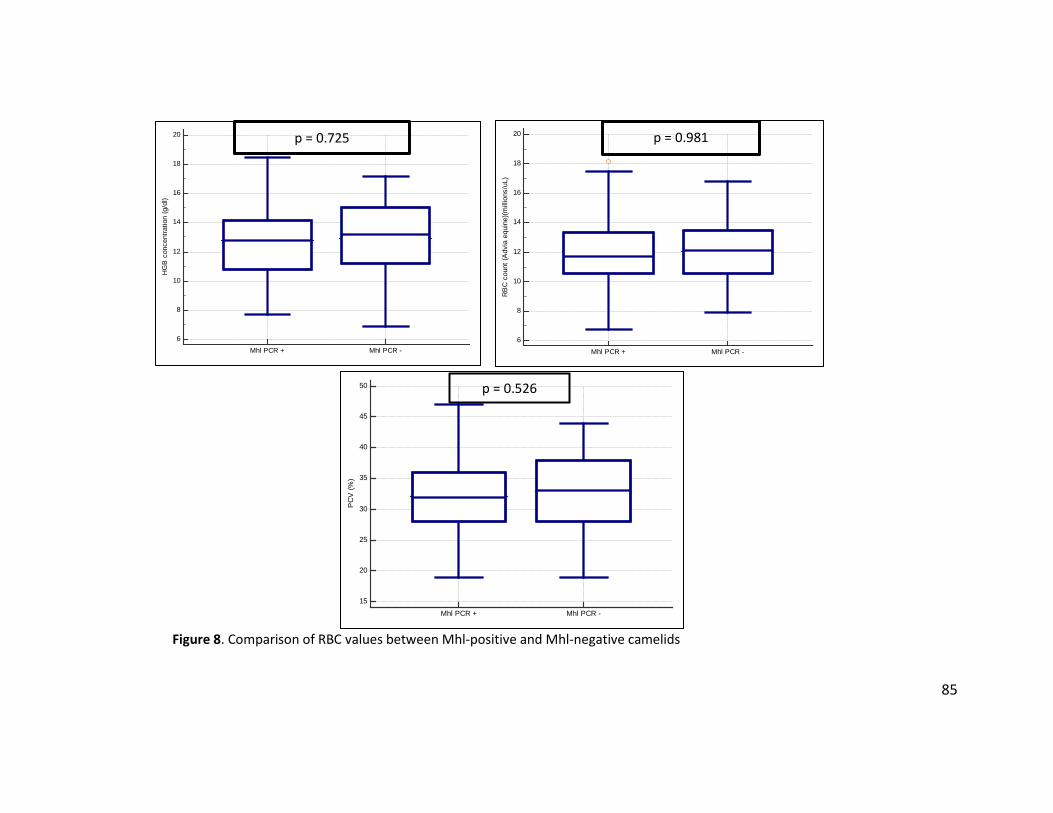
85
Figure 8. Comparison of RBC values between Mhl-positive and Mhl-negative camelids
15
20
25
30
35
40
45
50
PC
V (%
)
Mhl PCR + Mhl PCR -
6
8
10
12
14
16
18
20
RB
C c
ount
(Adv
ia e
quin
e)(m
illio
ns/u
L)
Mhl PCR + Mhl PCR -
6
8
10
12
14
16
18
20
HG
B c
once
ntra
tion
(g/d
l)
Mhl PCR + Mhl PCR -
p = 0.981 p = 0.725
p = 0.526
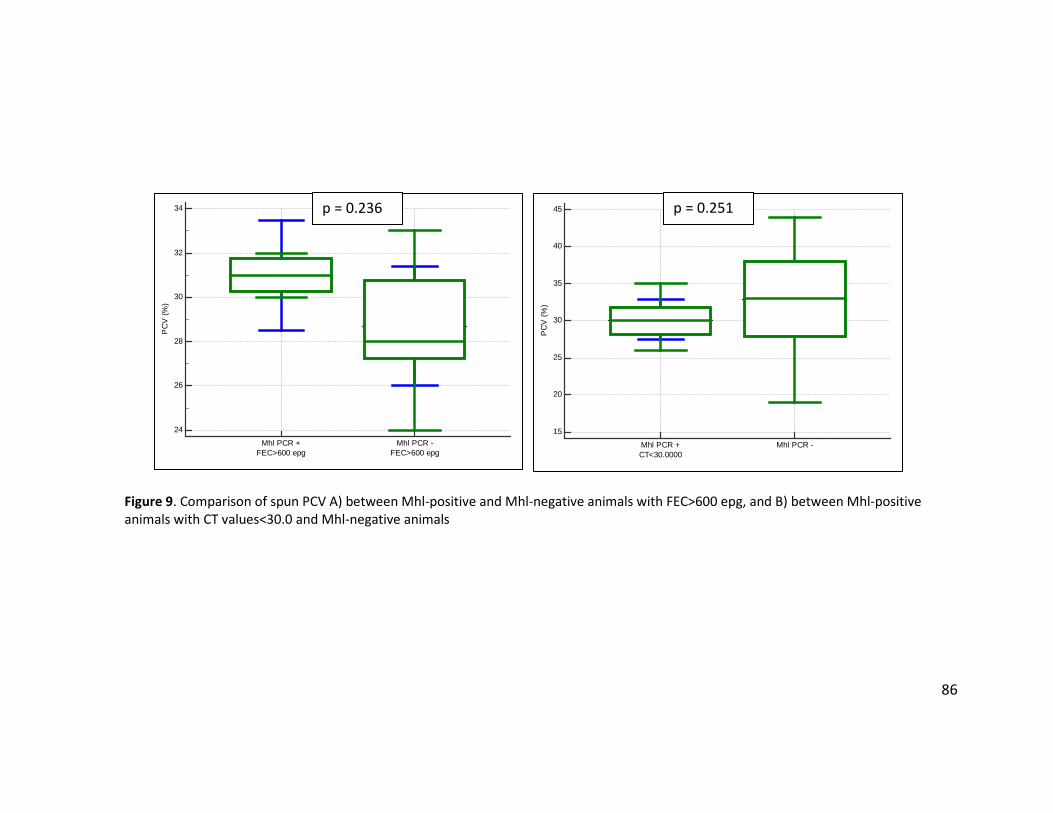
86
Figure 9. Comparison of spun PCV A) between Mhl-positive and Mhl-negative animals with FEC>600 epg, and B) between Mhl-positive animals with CT values<30.0 and Mhl-negative animals
15
20
25
30
35
40
45
PC
V (%
)
Mhl PCR +CT<30.0000
Mhl PCR -
24
26
28
30
32
34
PC
V (%
)
Mhl PCR +FEC>600 epg
Mhl PCR -FEC>600 epg
p = 0.236 p = 0.251
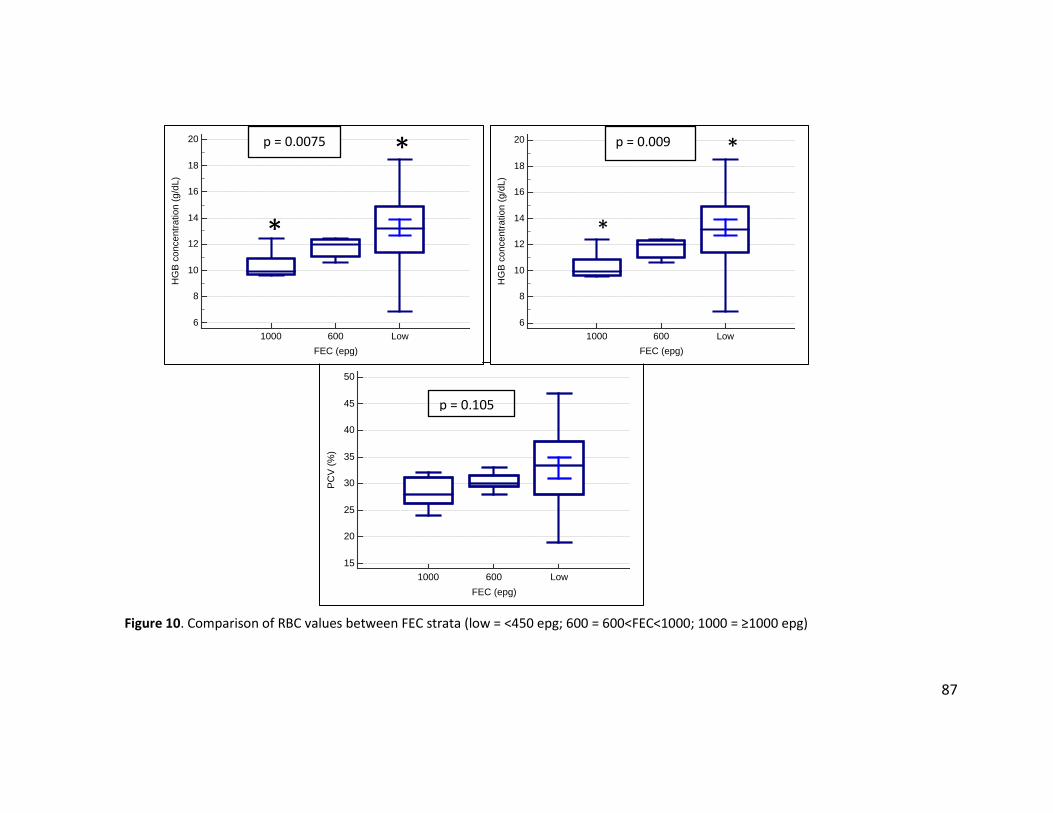
87
Figure 10. Comparison of RBC values between FEC strata (low = <450 epg; 600 = 600<FEC<1000; 1000 = ≥1000 epg)
15
20
25
30
35
40
45
50
FEC (epg)
PCV
(%)
1000 600 Low
6
8
10
12
14
16
18
20
FEC (epg)
HG
B co
ncen
tratio
n (g
/dL)
1000 600 Low6
8
10
12
14
16
18
20
FEC (epg)
HG
B co
ncen
tratio
n (g
/dL)
1000 600 Low
p = 0.009
*
* p = 0.0075
*
*
p = 0.105
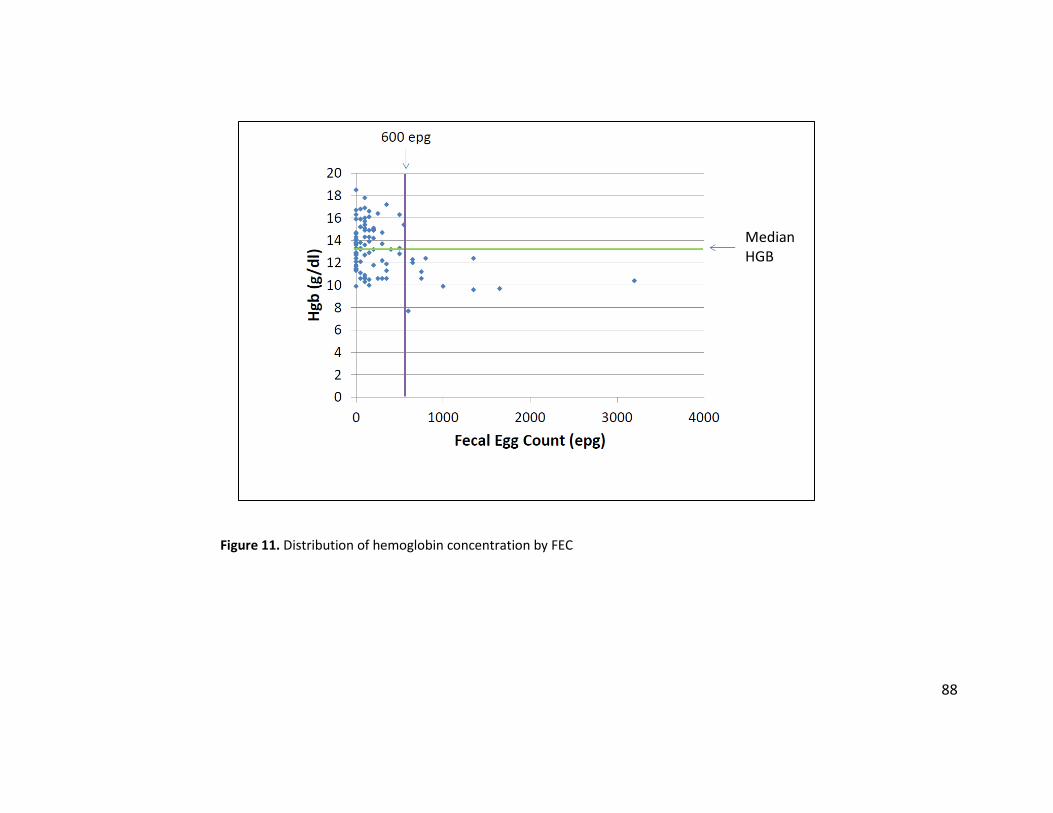
88
Figure 11. Distribution of hemoglobin concentration by FEC
Median HGB
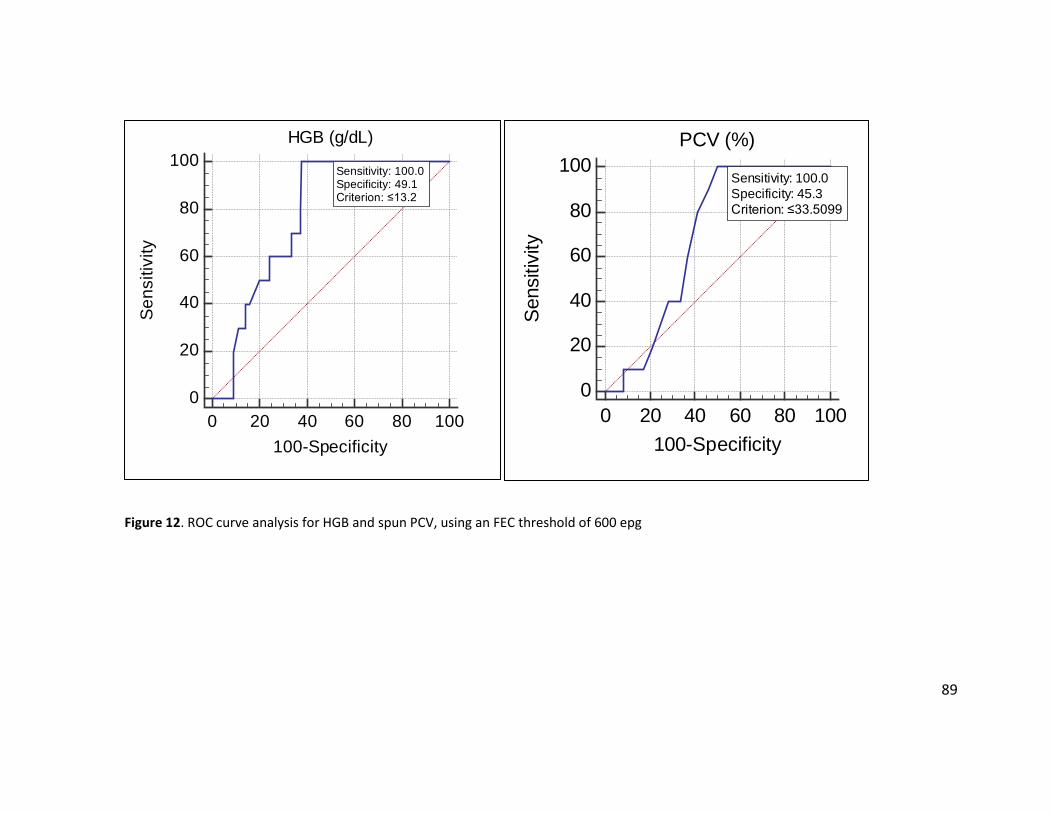
89
Figure 12. ROC curve analysis for HGB and spun PCV, using an FEC threshold of 600 epg
0
20
40
60
80
100HGB (g/dL)
0 20 40 60 80 100100-Specificity
Sens
itivi
ty Sensitivity: 100.0 Specificity: 49.1 Criterion: ≤13.2
0
20
40
60
80
100PCV (%)
0 20 40 60 80 100100-Specificity
Sens
itivi
ty
Sensitivity: 100.0 Specificity: 45.3 Criterion: ≤33.5099
90
VITA Lisa C. Viesselmann was born and raised in Wisconsin. She attended the University of Wisconsin-Madison, where she received a Bachelor of Science degree in Biology in 2006, and a Doctor of Veterinary Medicine degree in 2010. Upon graduation from veterinary medical school, she was commissioned as a Captain in the United States Army Veterinary Corps, where she served for 5 years. After separation from active duty in 2015, she started a clinical pathology residency at the University of Tennessee - College of Veterinary Medicine. She began a Master of Science degree in the Comparative and Experimental Medicine program at UT in 2016, and plans to graduate in May 2018. She will also complete the clinical pathology residency program in June 2018, and hopes to continue working in academia.
Related Documents