CHARLES UNIVERSITY FACULTY OF PHARMACY IN HRADEC KRÁLOVÉ DEPARTMENT OF PHARMACEUTICAL CHEMISTRY AND PHARMACEUTICAL ANALYSIS Validation of chromatographic methods in pharmaceutical analysis Diploma Thesis Iokasti Kegkeroglou Supervisor: doc. PharmDr. Radim Kučera, Ph.D. Athens, Greece, 2022

Welcome message from author
This document is posted to help you gain knowledge. Please leave a comment to let me know what you think about it! Share it to your friends and learn new things together.
Transcript
CHARLES UNIVERSITY
FACULTY OF PHARMACY IN HRADEC KRÁLOVÉ
DEPARTMENT OF PHARMACEUTICAL CHEMISTRY AND PHARMACEUTICAL ANALYSIS
Validation of chromatographic methods in pharmaceutical analysis
Diploma Thesis
Iokasti Kegkeroglou
Supervisor: doc. PharmDr. Radim Kučera, Ph.D.
Athens, Greece, 2022

“I declare that this thesis is my original author's work, which has been composed solely by myself (under the guidance of my consultant). All the literature and other resources from which I drew information are cited in the list of used literature and are quoted in the paper. The work has not been used to get another or the same title.”
Athens, 2022 Iokasti Kegkeroglou
[2]

Acknowledgement
First of all, I would like to thank my supervisor, doc. PharmDr., Radim Kučera, Ph.D., for his precious advice and the willingness to answer my numerous questions with patience as well as for guiding me throughout the Thesis. I would, also, like to thank my family, for providing everything to me during my 5-years studies and especially my mother, Maria Serapheimidou, for always being by my side and believing in me, even when I could not do it. Last but not least, special thanks to my friend, Nikolaos Daskalakis, for his support, encouragement, and companionship during these challenging years.
[3]
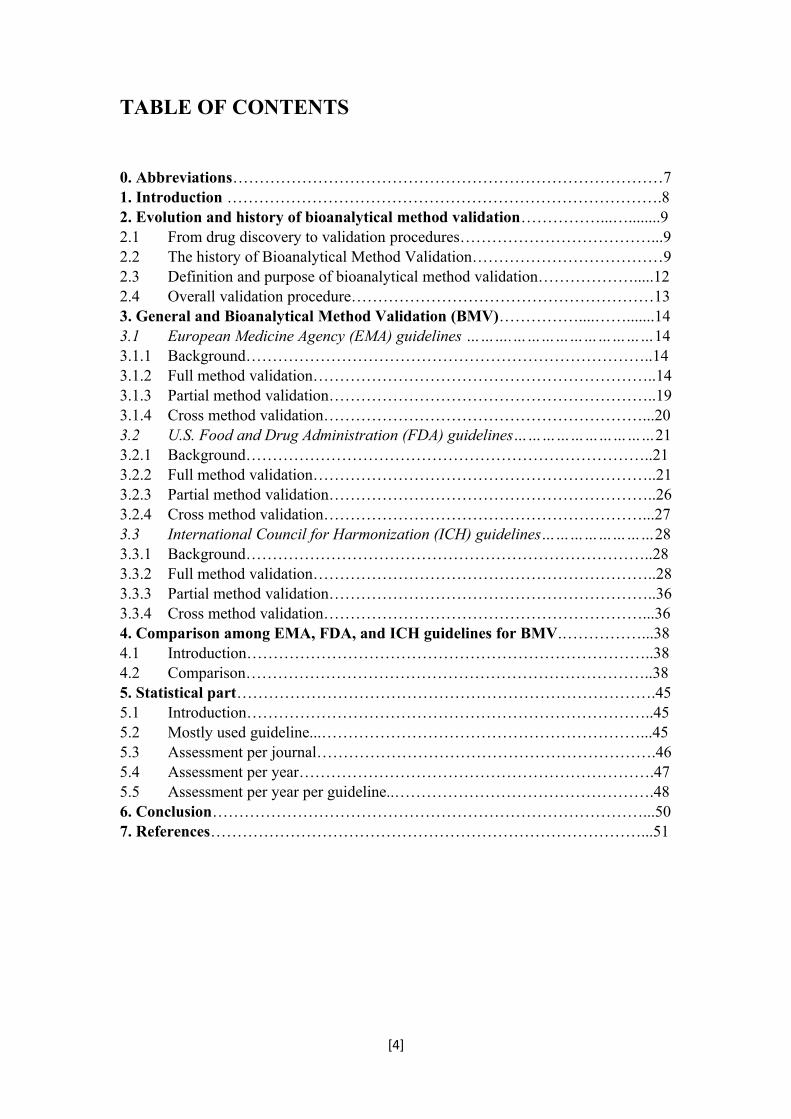
TABLE OF CONTENTS
0. Abbreviations………………………………………………………………………71. Introduction ……………………………………………………………………….82. Evolution and history of bioanalytical method validation……………...…........92.1 From drug discovery to validation procedures………………………………...92.2 The history of Bioanalytical Method Validation………………………………92.3 Definition and purpose of bioanalytical method validation……………….....122.4 Overall validation procedure…………………………………………………133. General and Bioanalytical Method Validation (BMV)……………....…….......143.1 European Medicine Agency (EMA) guidelines ……….…………………………143.1.1 Background…………………………………………………………………..143.1.2 Full method validation………………………………………………………..143.1.3 Partial method validation……………………………………………………..193.1.4 Cross method validation……………………………………………………...203.2 U.S. Food and Drug Administration (FDA) guidelines…………………………213.2.1 Background…………………………………………………………………..213.2.2 Full method validation………………………………………………………..213.2.3 Partial method validation……………………………………………………..263.2.4 Cross method validation……………………………………………………...273.3 International Council for Harmonization (ICH) guidelines……………………283.3.1 Background…………………………………………………………………..283.3.2 Full method validation………………………………………………………..283.3.3 Partial method validation……………………………………………………..363.3.4 Cross method validation……………………………………………………...364. Comparison among EMA, FDA, and ICH guidelines for BMV.……………...384.1 Introduction…………………………………………………………………..384.2 Comparison…………………………………………………………………..385. Statistical part…………………………………………………………………….455.1 Introduction…………………………………………………………………..455.2 Mostly used guideline...……………………………………………………...455.3 Assessment per journal……………………………………………………….465.4 Assessment per year………………………………………………………….475.5 Assessment per year per guideline..………………………………………….486. Conclusion………………………………………………………………………...507. References………………………………………………………………………...51
[4]
ABSTRACT
Charles UniversityFaculty of Pharmacy in Hradec Králové Department of Pharmaceutical Chemistry and Pharmaceutical Analysis Student: Iokasti KegkeroglouSupervisor: doc. PharmDr. Radim Kučera, Ph.D.Title of Thesis: Validation of chromatographic methods in pharmaceutical analysis
Validation is an integral part of every analytical method. Its aim is to demonstrate that the method is suitable for the intended use. This work provides an overview and comparison of documents related to the validation of bioanalytical methods. The work includes guidelines that are currently valid in Europe, the USA or have general validity. At first, attention is paid to the history and developments in this area. Subsequently, the parameters that need to be tested in the validation study are described and are divided according to the regulatory authorities. The following chapter compares the latest versions of the guidelines regarding the validation of separation bioanalytical methods issued by the EMA, FDA, and ICH. Although the individual methodologies are similar in many aspects, there are still differences among them. Hopefully, the differences will be eliminated in the framework of harmonization and only one methodological guideline could be used worldwide. Finally, it follows a detailed statistical evaluation of the use of the EMA and FDA guidelines for the validation of separation bioanalytical methods during the years 2016-2020 in four scientific journals. The obtained data show that the use of FDA guidelines is preferred over the use of both EMA and FDA, and subsequently also favored over the use of the EMA guidelines alone.
[5]
ABSTRAKT
Univerzita Karlova Farmaceutická fakulta Hradec Králové Katedra farmaceutické chemie a farmaceutické analýzyStudent: Iokasti KegkeroglouŠkolitel: doc. PharmDr. Radim Kučera, Ph.D. Název diplomové práce: Validace chromatografických metod ve farmaceutické analýze
Validace představuje nedílnou součást každé analytické metody. Jejím cílem je prokázat, že daná metoda je vhodná pro zamýšlené použití. Tato práce přináší přehled a porovnání dokumentů týkajících se validace bioanalytických metod. Do práce jsou zahrnuty pokyny, které jsou v současnosti platné v Evropě, v USA nebo mají obecnou platnost. Nejprve je pozornost věnována historii a vývoji v této oblasti. Následně jsou popsány parametry, které je nutné při validační studii testovat a jsou rozděleny podle regulačních orgánů. V následující kapitole je provedeno srovnání nejnovějších verzí pokynů vydaných EMA, FDA, a ICH týkajících se validace separačních bioanalytických metod. Ačkoliv v mnohém jsou si jednotlivé metodiky podobné, stále ještě existují mezi nimi rozdíly, které by mohly být v rámci harmonizace odstraněny a mohl by tak být využíván celosvětově jen jeden metodický pokyn. Na závěr následuje statistické vyhodnocení využití EMA a FDA doporučení pro validaci bioanalytických separačních metod v průběhu let 2016─2020 ve čtyřech vědeckých časopisech. Získaná data ukazují, že obecně je nejpoužívanější pro validaci bioanalytických metod norma vydaná FDA. Její využití převažuje také nad přístupem, kdy se kombinují normy FDA a EMA a také nad použitím evropské směrnice vydané EMA.
[6]
0. ABBREVIATIONS
AAPS: The American Association of Pharmaceutical Scientist
BMV: Bioanalytical Method Validation
CC: Chromatographic Assay
CoA: Certificate of Analysis
CV: Coefficient of Variation
EMA: The European Medicines Agency
FDA: U.S. Food and Drug Administration
GC: Gas Chromatography
GCP: Good Clinical Practice
GLP: Good Laboratory Practice
GMP: Good Manufacturing Practice
HPLC: High Performance Liquid Chromatography
ICH: The International Council for Harmonisation of Technical
Requirements for Pharmaceuticals for Human Use
IS: Internal Standard
ISR: Incurred Sample Reanalysis
LBA: Ligand-Binding Assays
LC/MS: Liquid Chromatography/Mass Spectrometry
LC: Liquid Chromatography
LLOQ: Lower Limit Of Quantification
MF: Matrix Factor
MS: Mass Spectrometry
QC: Quality Control
RSD: Relative Standard Deviation
SOP: Standard Operating Procedures
ULOQ: Upper Limit Of Quantification
USP: The Unite States Pharmacopoeia
[7]
1. INTRODUCTION
For almost 30 years the validation of bioanalytical methods has been considered as an enormously important process. The aim of this review diploma thesis is:
to present the history and the evolution of validation throughout the years, to explain the bioanalytical method validation guidelines for Chromatographic
assays (CCs) according to European Medicines Agency (EMA), U.S. Food and Drug Association (FDA), and International Council for Harmonization (ICH),
to compare the latest versions of EMA, FDA, and ICH guidelines, and finally, to statistically evaluate the use of EMA and FDA guidelines for
validation in articles published by researchers in Journal of Chromatography A, Journal of Chromatography B, Journal of Pharmaceutical and Biomedical Analysis, and Analytical and Bioanalytical Chemistry during 2016─2020.
[8]
2. EVOLUTION AND HISTORY OF BIOANALYTICAL METHOD VALIDATION
2.1 From drug discovery to validation proceduresThe discovery of new drugs and the subsequent development of them is a
procedure that takes from 101 to 20 years approximately. During this time, it is estimated that only 1 out of 200 thousand to 1 million screened compounds may finally come into the market.2 This is because of the necessity of protecting from harm and simultaneously in order to ensure the quality, safety and efficacy of the therapy. For this reason, every compound must be tested during its development in a strictly monitored environment by its manufacturer. In the beginning, there are pre-clinical and clinical trials, toxicological studies and in vitro laboratory experiments organized in accordance with regulatory authorities guidance, Standard Operating Procedures (SOP) and white paper recommendations.3 The authorities supervising the research are determined by the territory, and their guidelines should be followed, e.g. EMA in Europe, FDA in USA, ANVISA (Agência Nacional de Vigilância Sanitária – National Health Surveillance Agency) in Brazil, Health Canada in Canada, or even the Japanese or Chinese guidelines.
All studies which are included into the application file for a drug, should be done in accordance with the bioanalytical guidelines performed under Good Laboratory Practice (GLP), Good Clinical Practice (GCP) and GMP (Good Manufacturing Practice). However, these systems of quality, concerning the GLP, GCP and GMP do not offer the detailed instructions, which are necessary for the validation of bioanalytical methods. This is done exclusively by the regulatory bioanalytical guidelines. Throughout the last 30 years, bioanalytical methods and their requirements have developed and nowadays the science around these methods is covered by detailed regulations.1
2.2 The history of Bioanalytical Method ValidationJust like in any field of science that is in the beginning, when scientists
occupied with bioanalytical method validation for the first time, there were not definitions around the parameters that would be involved in. Each laboratory had its own mindset and proposed different ways. The only target was to find ways to bring scientifically correct results and provide valuable information. It was decided that the uniformly accepted definitions around bioanalytical method validation were necessary as the step to succeed in.4
Before the year 1990, there was no official recommendation on how to perform Bioanalytical Method Validation (BMV) by regulatory authorities or the responsible individuals.1 At the same time, there was a general absence of consistency for performing BMV. This situation changed, when the American Association of Pharmaceutical Scientists (AAPS), FDA, International Pharmaceutical Federation, Association of Analytical Chemists, and the Health Protection Branch arranged a workshop in 1990, which was the first one concerning BMV.5 This workshop was
[9]
intended to build the communication between the pharmaceutical industries and regulatory authorities, as it was committed to explore, inspect, and coordinate the processes needed in regulated bioanalysis.1,5 In 1992, the Health Canada also established these validation theories into its regulations. Nevertheless, the terminology, as far as the partial and cross-validation was concerned, was not unified at that time.4
This AAPS/FDA workshop determined the terms accuracy, precision, sensitivity, selectivity, lower limit of quantification (LLOQ), reproducibility, selectivity, and stability as the necessary criteria for performing BMV. Among the most significant results given by the workshop was the acceptance criteria for the validation parameters,1 since it addressed how to assess and establish or define these parameters. Moreover, the proper processes for method validation, as well as the definition of the standard curve, recovery, and replicate analysis were considered by the workshop. It was explained that it is not required to obtain 100% recovery, however, it is still significant that the recovery will be reproducible.
After the first workshop, it was clear that the BMV consists of two different phases. The first one is the analytical method development, or else, pre-study validation. During this phase, the method with its parameters is developed, and then the assay is described. The second phase concerns the application of the method to the examination and determination of the samples from studies regarding bioavailability, bioequivalence, and pharmacokinetics.5
Despite the importance of the results of the workshop for performing BMV and the fact that its conclusions were issued in scientific journals,1 the workshop report was not any official document.1,5 An example of a journal which occupied with this topic was the Pharmaceutical Research, in an attempt to better distribute the information obtained.5 It indeed provided an outline for the industry and a reference for the monitoring agencies all around the world. In addition, it informed and educated scientists regarding the significance of method validation. Another important issue was the distinction between Ligand-Binding Assays (LBAs) – which are considered as non-chromatographic methods – and CCs. As a result, the workshop and its follow-up report, improved the quality of the information provided to the regulatory authorities.5 This is the reason why the FDA took the decision to publish the Draft Guidelines in the end of 1998. With this approach, it also tried to emphasize the seriousness of BMV.1
During the January of 2000, the second workshop concerning BMV was arranged in Washington, DC. It was also called as Crystal City meeting due to its place of acting. Its main aim was the attention that should be paid to the knowledge obtained by BMV and the progress in this field during the 10-years period since 1990 workshop.1 A lot of scientists, academics and statisticians coming from all around the world took part in it.6 It gave to this forum the favorable circumstances especially for scientists to discuss and judge the draft guidelines.5 There were two different types of issues, which were necessary to be studied. The first one was the interference coming from substances which are naturally resembling the analyte. This type of substances which might be endogenous compounds, or even metabolites. The second one was the matrix effect. This is considered as the interference caused by components irrelevant with the analyte.5 In addition, the ligand binding assays were proposed as
[10]
bioanalytical tool,1,5 and their selectivity was described in details. Once more, the fact that recovery is not necessary to be 100% emphasized, and what is required is just to obtain reproducible and consistent recovery during the process of extraction.5 Throughout this meeting also the confusion concerning the partial and cross-validation was solved.4,5
This second workshop issued the report “A revisit with a decade of progress” and it was the base for the following publication.5 The first “FDA Guidance for Industry: Bioanalytical Method Validation” was published in May 2001.
The subsequent AAPS/FDA Crystal City meeting, which was the third one in series, took place in May 20061,5 and it gave as a consequence a white paper which was issued in 2007 by Viswanathans et al. (“Quantitative Bioanalytical Method Validation and Implementation: Best Practices for Chromatography and Ligand Binding Assays”) and this worked as an authentic guidance to the industry. It explained numerous questionable topics (e.g., metabolites, stability, matrix suppression)1 and considered a quantitative test for matrix factor (MF).1,5 The latter one, came in disagreement with 2001 guidance, during which the qualitative tests of interferences or matrix effect were preferred.1 Moreover, it included the conditions to search for reproducibility in samples that came from dosed subjects. These are called incurred samples.1,6
In February 2008, a new AAPS/FDA meeting took place, during which incurred sample reanalysis (ISR) was imposed as an in-study validation and at the same time as an unplanned procedure to test the method performance.1 ISR was suggested by the regulatory authorities in order to prove the reproducibility of validated methods and offer the assurance that methods used in pharmacokinetic and toxicokinetic evaluations will provide reproducible outcomes.7 This seemed to affect the bioanalytical societies and the corresponding literature since till that time no relevant guidance or recommendations have been made on this particular topic. In total, this addition caused approximately 5 to 10% increase in the analysis in bioanalytical laboratories. A lot of publications have proposed processes for ISR and nowadays there is a general agreement that ISR is of high importance, as it shows the way of testing the performance of the method.1
The European Medicines Agency (EMA) during September of 2009 issued its first draft concerning BMV, with the deadline for any comments to be the May of 2010. Despite the similarities that exist among all the international guidelines, in fact there are differences in the methodology and the acceptance criteria.6 Before this time, there was no other guideline across the whole Europe in order to control the bioanalytical method validation submitted to the responsible authorities.8 Ten years after the FDA’s first guidance, the EMA published its own guideline concerning BMV in 2011. It was mainly based on FDA 2001 guideline, and it also included the topics that were discussed during the AAPS/FDA Crystal City meetings.1,8 Some of these topics were MF and ISR, as well as the acceptance criteria issued at that time. Some extra conditions were issued in the use of EMA guideline. Specifically, there is the possibility of requesting a claim of GLP in validation studies and to examine the MF in hemolyzed and hypolipidemic samples. Specifics on numerous tests were also included in EMA guideline and generally the acceptance criteria are more definite and clearer than in case of FDA 2001 guidelines.1
[11]

In October 2011, the American Association of Pharmaceutical Scientists meeting took place in Washington DC. This was an annual conference which also introduced a roundtable named as “Update of the US FDA/European Medicines Agency (EMA) harmonization of their bioanalytical guidance – Global Bioanalytical Consortium activity and impact on small and large molecules”. Approximately 400 experts in this field from all around the world joined it. It provided information on the 2011 EMA guideline and updates on the FDA guideline. The FDA at this time had about 20 years of experience and communicating for topics relevant to the BMV, so it helped in this way to create discussions among the scientific population. Throughout this meeting, it was pointed out that the base of both agencies is very similar, however, still there are some general differences. This is the reason why they have already started an effort to globalize and harmonize them. The difficult part of the harmonization is the acceptance of the exact same terminology and methodology. This procedure will be for sure challenging, but it will finally lead to a single unified guidance.8
In September 2013, the FDA published a draft guideline which contained updated information for BMV, and it was very well-accepted by the bioanalytical society. According to Hansen et al., till 2014 the EMA guideline was considered as the most important one in the global bioanalytical community. Apart from Europe, the guidelines were also implemented in Canada1 in 2012 (Health Canada)4. However, China and Japan have their own guidelines, but it is probable that they will line up with the EMA guideline.1 ANVISA, the Brazilian authorities regarding health issues, has published the resolution No. 27 in May 2012 for method validation, after their first bioanalytical method validation guidelines issued in May 2003.9 This guidance is aligned with the EMA in many topics, but still, it differs in some others, for example, the ISR is not included.1
2.3 Definition and purpose of bioanalytical method validation
Validation of bioanalytical method comprises of all the processes that indicate that a specific method used for quantitative evaluation of analytes in a given biological matrix such as blood, serum, plasma, or even urine, is suitable for its intended use.4
In order to provide trustworthy and clear outcomes, we need to utilize well-described validation methods. The validation procedure should be done only after the method optimization,1 since the whole process takes a lot of time. Furthermore, all the experiments concerning validation must be appropriately recorded and executed on certified and calibrated apparatuses and instrumentation, since validation is regarded as a GMP activity.10
The main parameters used in validation processes are selectivity, sensitivity, accuracy, precision, stability, and reproducibility. Moreover, while before some years characteristics like linearity, IS normalized matrix factor, and recovery, were not referred, nowadays they are examined during validation process according to EMA guideline of 2011. However, scientists should keep in mind that validation requirements sometimes may be a little bit different, according to the regulatory organization’s requirements.4
[12]
Full validation is, according to Hansen et al., “an establishment of all validation parameters to apply to sample analysis for the bioanalytical method for each analyte”. Nevertheless, when there is a fully validated method that has undergone only some small changes, it is possible not to repeat a full validation, but to substitute it by a partial validation. A partial validation could vary from just the determination of with-in run accuracy till approximately whole full validation. Some examples for the latter case include the change in matrix, storage conditions, calibration concentration range etc. Cross-validation should be performed when transferring a method from another laboratory, when information concerning a study is acquired from different method or from the same, but it was executed in different laboratories. Moreover, changes in the equipment suggest the use of cross-validation.
The acceptance criteria, when validating a method, should always be fulfilled. On a regular base, during use of the method, its performance should be validated before the study conduct (pre-study validation). The pre-study validation is performed in order to assure that the method which is intended to be used for the quantitative measurement of the analytes is trustworthy and repeatable. As far as the terminology is concerned, for BMV, it has been changed during the evolution of validation process. One example is the term “selectivity” which is used nowadays, and it substituted the term “specificity”. This was done by EMA guidelines in 2011.1
Moreover, it is important to keep in mind that every guidance represents the current thinking of the corresponding agency, and that every few years, or generally when needed, revised guidelines will be published. Still, every guidance is not any binding document and alternative tactics and methodologies might be utilized, if they comply with the criteria of the supervisory agency.5
Finally, in 2019 the ICH published its draft guidelines in an attempt to bring a solution with the differences between EMA and FDA guidelines. This creates the hope that by using ICH guidelines as the harmonized guidance, the application for validating a drug in different parts of the word will be easier.11
2.4 Overall validation procedureThere are mainly four different categories that the overall validation procedure
can be divided into. Generally, the overall validation starts with software validation, which must be validated, and with instruments which are qualified. The method development should be performed on a qualified system and finished by its validation. In the end, the system suitability test parameters should be established based on the validation procedure.12
During this diploma thesis we will deal with bioanalytical method validation.
[13]

3. GENERAL AND BIOANALYTICAL METHOD VALIDATION (BMV)
General method validation confirms that a test method is suitable to fulfill its intended purpose. It usually offers documented evidence which confirm that the method satisfies the requirements set by the regulatory agencies. During 1987, the FDA released the specifications concerning this topic, and they were also included into the United States Pharmacopeia (USP). They were considered as those, which according to law, were in agreement with the Federal Food, Drug, and Cosmetic Act.12
A bioanalytical method is a set of processes which are involved in the collection, handling, storage, and assessment of a chemical compound in a biological matrix. The quantity of drugs and their metabolites are mainly measured in cerebrospinal fluid, urine, and plasma, serum, bile, feces, sweat, etc. The method validation should be performed for each biological matrix separately.13 The developments in this area have been summarized above.
However, the inclusions, and sometimes even also the definitions of terms are different among agencies. Therefore, it would be better to work each time in accordance with the guidelines from the specific regulatory authority that supervises the corresponding laboratory. Sometimes, a regulatory authority issues materials which are helpful in the understanding and analysis of the guidance. One example for this, is the “reviewer guidance” issued by the FDA. Its purpose was to help the users on how to work correctly and interpret the results, so as to ensure that their test methods will be accepted and pass the regulatory inspection.12
3.1 European Medicine Agency (EMA) guidelines
3.1.1 BackgroundDuring the development of new drugs and medicinal products, calculating the
quantity of drug concentrations in biological matrices is crucial. These matrices can be plasma, blood, serum, saliva, and urine. Therefore, to support the safety and efficacy of the currently developed products, the bioanalytical methods must always be fully validated with detailed procedures, and toxicokinetic studies and clinical trials outcomes are necessary to be examined. In this part, we will deal with the latest guidelines that the EMA issued in 2011 concerning bioanalytical method validation. We will focus only on the chromatographic assays (CCs). There is another category, called Ligand Binding Assays (LBA) or immunoassays, which is specifically used for macromolecules. Due to the complexity of their structure, the extraction procedure is challenging, so this is the reason why these assays work without separation of the analyte. Moreover, these assays do not immediately calculate the content of a macromolecule itself but indirectly measure a binding reaction with reagents employed in the assay. For these reasons, several issues need special attention.14
[14]

3.1.2 Full validation of an analytical methodAny analytical method, either if it is new or based on literature, requires a full
method validation. The main aim of the process is to prove the trustworthiness of a significant method, in order to define the concentration of an analyte in a particular biological matrix. Sometimes, it is difficult during the validation process to acquire a matrix that will be comparable to that of the study samples. So, another appropriate matrix might be used if it is needed. The main parameters that are required to be tested every time during a full method validation are: selectivity, lower limit of quantification, the response function and calibration range, accuracy, precision, matrix effects, stability of the analyte(s) in the matrix, as well as the stability of the internal standards, and the analyte(s) in the stock and working solutions, and in extracts under the whole time-period of storage and handling settings. The validation process should apply to all analytes of interest.14
Reference standardsIn order to prepare calibration standards, samples that control the quality and
stability samples are needed. A blank biological matrix will be spiked with the corresponding solutions of reference standard(s). Moreover, appropriate internal standard(s) (IS) can be also added during the sample treatment in chromatographic methods.
The quality and therefore the purity of the reference standard and IS is necessary to be ensured, since they may affect the result of the analysis and so, the result of the whole study information. For this reason, the reference standards should always be from an authentic and traceable source. Moreover, a certificate concerning the analysis is necessary to ensure the purity and to give information on the storage conditions, the date of expiration and the batch number of the reference standard. A Certificate of Analysis (CoA) is not necessary for the IS, but the prove of not containing impurities inside is needed.14
3.1.2.1 Selectivity The analytical method should be capable of distinguishing between the
analyte(s) of interest and IS from endogenous components inside the matrix or generally other components in the sample. The proof of selectivity is done by the use of at least six individual sources of the appropriate blank matrix, which all of them, should be investigated and evaluated for interference one by one. In the case that rare matrices are examined, it is possible to use fewer sources. “Normally, absence of interfering components is accepted where the response is less than 20% of the lower limit of quantification for the analyte and 5% for the internal standard.”
It might also be needed to search out the extent of any possible interference, produced by metabolites of different drug(s), or any interference caused from either degradation products, which occurred during sample preparation, or from co-administrated medicaments. During the analysis of a drug, there is also the likelihood of back-conversion of a metabolite into its parent compound. Its extent should be determined, and the effects of the study reviewed.14
3.1.2.2 Carry-over“During validation, carry-over should be assessed by injecting blank samples
after a high concentration sample or calibration standard at the upper limit of quantification. Carry-over should be calculated and diminished during the process of
[15]
method validation. Carry-over in the blank sample following the high concentration standard, should not be higher that 20% of the lower limit of quantification and 5% for the internal standard.” This limit seems to be similar with the above-mentioned limit concerning the selectivity. In other words, carry-over is defined as the presence of signal from a specific analyte in a blank sample, after the evaluation of samples with an analyte that has high concentration. Nevertheless, if it seems that the carry-over is inevitable, then the study samples should not be randomized at all. There are some measures that are needed to be taken and tested during the process of validation, and then applied during the evaluation of the samples, so as to be sure that it does not alter the accuracy and precision. These measures could involve the injection of samples with high concentration, and then the addition of blank sample. This should be done before the evaluation of, the subsequent, study sample starts.14
3.1.2.3 Lower limit of quantification (LLOQ)“The lower limit of quantification (LLOQ) is the lowest concentration of
analyte in a sample which can be quantified reliably, with an acceptable accuracy and precision.” It is respected as the lowest calibration standard. Moreover, the signal of the analyte from the LLOQ sample should be at least five times higher than the signal obtained from the blank sample. The LLOQ should be suited to the expected concentrations and to the purpose and goal of the study.14
3.1.2.4 Calibration curve“The response of the instrument with regard to the concentration of analyte
should be known and should be evaluated over a specified concentration range. The calibration standards should be prepared in the same matrix as the matrix of the intended study samples by spiking the blank matrix with known concentrations of the analyte.” For every analytical run and for every analyte, which is studied during the method validation process, there should be a single calibration curve.
If possible, the concentration range expected should be well-known, before the validation. This range should be characterized by the Upper Limit Of Quantification (ULOQ) as being the highest calibration standard and the LLOQ as being the lowest one. This means that the range should be enclosed by the calibration curve range.
The smallest quantity of calibration concentration levels that can be used is six, which, however, will be added to the blank sample and a zero sample. The zero sample is refined matrix with IS, while the blank sample is refined matrix without an analyte and simultaneously without IS. Every calibration standard should be examined and determined in replicate. Although, when estimating and analyzing the calibration curve parameters, the blank and zero samples should not be considered, still these parameters should be documented. All the appropriate curves acquired during the validation process, should also be reported. The smallest number that can be reported is three.
Concerning the back-calculated concentrations of the calibration standards, they should be displayed at the same time with the estimated mean accuracy values. These concentrations should be ± 15% of the theoretical value. However, there is the exception of the LLOQ, for which concentration should be within ± 20%. A minimum of 75% of the calibration standards, with at least six levels, must satisfy the criterion. The nominal value is determined as the theoretical or expected value. If a calibration standard is out of these limits, then it should be excluded and the whole calibration
[16]
curve should be re-assessed without it. In addition, only in the case that there are stability studies which are supporting the previously prepared and saved calibration samples, then they can also be used to prepare the calibration curve. In any other case, the calibration curve should be prepared by utilizing freshly spiked samples.14
3.1.2.5 Accuracy“The accuracy of an analytical procedure expresses the closeness of the
determined value to the value which is accepted either as a conventional true value or an accepted reference value.” Accuracy is defined as:
Accuracy=determined valuetrue value
×100% Eq. 1
It is expressed in percentage using quality control (QC) samples. These QC samples should be spiked autonomously from the calibration standards, using separately made stock solutions, unless the nominal concentration(s) of the stock solutions are established. The QC samples are examined against the calibration curve, and the gained concentrations are compared to the nominal value. The accuracy, then, should be reported as percent of the nominal value. The assessment of the accuracy concerning the values of the QC samples can be achieved in within run and in different runs, which are called within run and between-run accuracy, respectively. It is suggested to prove the accuracy and precision of QC samples over at least one of the runs, in a size which will be comparable to a potential analytical run of study samples. This is done, to facilitate the assessment of possible trends over the time within one run.
Within run accuracy should be done by examining and determining at least five samples per level, at least of four concentration levels covering the calibration curve in one single run. The levels should include: “the LLOQ, within three times the LLOQ (low QC), around 30-50% of the calibration curve range (medium QC), and at least at 75% of the upper calibration curve range (high QC).” The average concentration should be within 15% of the theoretical values for the QC samples and within 20% of the theoretical value for LLOQ.
Between-run accuracy should be validated by the evaluation of “LLOQ, low, medium and high QC samples from at least three runs analyzed on at least two different days”. The average concentration should be within 15% of the theoretical values for the QC samples and within 20% of the theoretical value for LLOQ.
The data report of bioanalytical method validation should include the determination of the accuracy and precision as well as all the results, apart from those which contain obvious and documented errors.14
3.1.2.6 Precision“The precision of an analytical procedure expresses the closeness of
agreement between a series of measurements obtained under the prescribed conditions.” It is stated as the coefficient of variation (CV) and characterized as the ratio of:
Precision=Standard deviationMean
(%) Eq. 2
Just like the accuracy, it should be proved for the LLOQ, low QC samples, medium QC samples and high QC samples, within one run and between some different runs.
During the validation of within-run precision, there is required at least five samples per every concentration level at: “LLOQ, low, medium and high QC samples
[17]

in a single run. The within-run CV value should not exceed 15% for the QC samples, except for the LLOQ which should not exceed 20%.”
During the validation of between-run precision, LLOQ, low, medium, and high QC samples from minimum three runs examined on minimum two different days should be assessed. “The between-run CV value should not exceed 15% for the QC samples, except for the LLOQ which should not exceed 20%.”14
3.1.2.7 Dilution IntegrityGenerally, the accuracy and precision should not be altered by the dilution of
the sample. The dilution integrity should be shown by spiking the matrix with an analyte concentration above the ULOQ and diluting the sample with blank matrix. A minimum of five determinations for every dilution factor are needed. The limit of ± 15% for accuracy as well as for precision must be fulfilled. Dilution integrity should cover the dilution which was employed by the study samples. Assessment of dilution integrity may be done also through partial validation. Provided that accuracy and precision will remain unaffected, the use of another matrix might be satisfactory.14 3.1.2.8 Matrix effect
Matrix effect is defined as: “the direct or indirect alteration or interference in response due to the presence of unintended analytes (for analysis) or other interfering substances in the sample”. During mass spectrometric methods, the matrix effects should be examined, employing a minimum of six different lots of a blank matrix from different donors. Pooled matrix may not be utilized.
For every analyte and for the IS, the matrix factor (MF) should be calculated for every batch of the matrix as the ratio of the peak area in the presence of matrix divided by the peak area in the absence of matrix.The numerator is quantified by examining blank matrix, which is spiked with the analyte after the extraction, while the denominator is just the pure solution of the analyte. The IS normalized matrix factor should be computed by the ratio of the matrix factor of the analyte divided by the matrix factor of the IS.The CV of the IS normalized MF computed from the six batches of matrix, should not be higher than 15%. This specification should be done at low and high concentrations. They should be 3 times the LLOQ for the low concentration and close to ULOQ for the high concentrations.
If this approach cannot be used, for instance in the case of on-line sample preparation, the variability of the response from batch to batch should be calculated by examining a minimum of six lots of matrices, spiked at a low and at a high concentration. The limits and the CV are the same, as above mentioned. Provided that the matrix is hard to achieve, then less than 6 different batches of matrix should be used, but it needs justification. Nevertheless, it is still necessary to study the matrix effects. Moreover, hemolyzed and hyperlipidemic matrices are also examined for their matrix effects, when samples from renally or hepatically impaired populations are intended to be measured.14
3.1.2.9 StabilityThe assessment should be done to reassure that each step during the sample
preparation and analysis, and also during the storage conditions, do not alter the concentration of the analyte. This means that all the conditions used in the stability tests, for example the storage conditions, the material of the container, the use of anticoagulant and others, should be comparable to that of the study samples. It is not
[18]
adequate just to citate to information from literature. The stability of the analyte in the examined matrix is assessed by using low and high QC samples, which are investigated just after preparation and storage conditions that are to be used. The average concentration at every level should be within ± 15% of the expected concentration. The stability of the working solutions as well as the stock solutions should be examined with a suitable dilution, while taking into account the linearity and measuring range of the detector.
Generally, the stability studies should examine the various possible storage conditions over time intervals that may equal or even exceed those employed by the actual study samples. Some examples of stability tests that should be examined are stability of stock and working solutions for the analyte and for the IS, freeze and thaw stability from freezing conditions of storage to room temperature, short-term and long-term stability studies.
Concerning the freeze-thaw stability, the QC samples are kept and subsequently frozen inside the freezer at the proposed temperature and then they are thawed either at room temperature, or the temperature used during processing. After the complete procedure of thawing, the samples should be refrozen, by utilizing the same conditions. During every cycle, the samples should be frozen for a minimum of 12 hours, and after that they should be thawed. The number of the cycles in the freeze-thaw stability should at least be equal or be superior to those of freeze-thaw of study samples.
Concerning the long-term stability of an analyte in the matrix, the QC samples should be kept inside the freezer, by utilizing the exact same storage conditions for a minimum of the same interval as for the study samples. Regarding small molecules, bracketing approach might be used. This means that if the stability has already been demonstrated for temperatures e.g., -60 °C and -10 °C, then it is not required to examine the stability in temperatures in between them. For large molecules, however, like peptide or proteins, this is not true. In these cases, the stability should be examined at every different temperature individually. Finally, it is necessary to have obtained the outcomes of the assessment from the long-term stability studies prior to the publication of the report.
For the stability of stock and working solutions, just like in case of the long-term for small molecules, it is not required to examine the stability at every concentration level. This is true because the bracketing approach can be utilized. Moreover, it is not needed to study the stability of stable-isotope labelled internal standards, if it is demonstrated that no isotope exchange reactions occur under the same conditions as the stability of the analyte was demonstrated.
Adequate attention should be paid to the stability of the analyte directly after sampling from blood and further processing before storage, so as to confirm that the acquired concentrations by the analytical method show the concentrations of the analyte at the time of sampling. A proof of this stability may be needed in some cases.14
3.1.3 Partial validationPartial validation is defined as “series of analytical experiments where only
relevant parts of the validation are repeated after modifications are made to the
[19]

validated bioanalytical methods”. In circumstances where slight modifications are made to an analytical method that has already been validated before, full validation usually is not needed, but it depends on the changes each time. Examples of changes, that partial validation would be necessary are storage conditions, transfer of the method to another laboratory, another matrix, change in the equipment, sample processing procedure and so on. All these adjustments must be stated, and the extent or possibility of revalidation or partial validation justified. Finally, the range of partial validation could be from only within-run accuracy and precision to approximately a full validation.14
3.1.4 Cross validation Cross validation is defined as “comparison of validation parameters of two
bioanalytical methods”. Cross validation should be implemented when data is gained from studies from different laboratories that have used the same method or where information was obtained from different methods from across and within investigations. Some possible variations in the preparation of the samples or the use of an additional analytical method might have as outcome the different results between studies. If it is possible, cross validation should be accomplished before the study samples will be examined. For this type of validation, the same set of QC samples or study samples should be examined by both analytical methods. Concerning the QC samples, the acquired mean accuracy by the various methods should be within 15% and in some justified cases, it may be even broader. Concerning the study samples, the difference between the two values acquired should be within 20% of the mean for a minimum of 67% of the repetitions. The outcome of the cross validation is critical in determining whether the obtained data are reliable and whether they can be compared and used.14
[20]

3.2 U.S. Food and Drug Administration (FDA) guidelines
3.2.1 BackgroundIn this part of the chapter, we will deal with the latest FDA guideline
concerning method validation of chromatographic assays. This guideline provides the information on how the bioanalytical processes like the CCs and LBAs will determine the concentration level of drugs, their metabolites, proteins, or even biomarkers inside the biological matrices, like blood, plasma, urine, and tissues like skin, and others.
This guidance includes the public notes and remarks to the reviewed draft of 2013 and offers suggestions on the development and validation of the bioanalytical methods. These suggestions, however, can be changed with the necessary explanation and reasoning, based on the type of the method. This guidance reflects advances in science and technology related to validating bioanalytical methods.
In general, FDA’s guidance documents do not establish legally enforceable responsibilities. Instead, guidances describe the Agency’s current thinking on a topic and should be viewed only as recommendations, unless specific regulatory or statutory requirements are cited. The use of the word “should” in Agency guidances means that something is suggested or recommended, but not required.
3.2.2 Full method validationThe aim of the bioanalytical methods development is to describe the design,
conditions of activity, restrictions, and aptness of method to fulfil its aim and reassure that it is optimized for validation. Prior to the development of the method, the analyte of interest should be known. The physical and chemical properties of this drug, its metabolism either in vitro or in vivo, as well as its protein binding, should be clear.
The development of the method includes improving the processes and requirements involved with obtaining and identifying the analyte. In order to make sure that a method is appropriate for validation, the subsequent parameters should be tested: reference standards, critical reagents, calibration curve, QC samples, selectivity and specificity, sensitivity, accuracy, precision, recovery, stability.
Extensive documentation during a bioanalytical method validation is not necessary, nevertheless any alterations in processes as well as the decisions taken during the whole validation should be noted. The full method validation should be performed when a new method is used for the assessment and evaluation of a new drug, or even its metabolites, or when an extra analyte is added. 15
3.2.2.1 Reference Standards Reference standard is defined as “a chemical substance of known purity and
identity which is used to prepare calibration standards and quality controls. Three types of reference standards are usually used: (1) certified (e.g., USP compendial standards), (2) commercially-supplied, and (3) custom-synthesized”. Its purity can influence the study data, and thus this reference standard should have known identity and purity, in order to formulate a solution of well-known concentration. In most of the cases, the reference standard should be indistinguishable with the analyte, but still, when this is not achievable, another recognized chemical structure, which should have
[21]

known purity, can be used. This chemical entity could be a free acid, a free base, or even a salt.
When commercially available reference standards are used, then it is necessary to supply the required CoA, which will contain the batch number, source, and expiration date. However, when internally or externally prepared reference standards are used, then they do not have any CoA. In this case, it is necessary to offer evidence of the standard’s identity and purity as well as the batch number and the source. Provided that expired reference standards are chosen to be used, then a revised CoA is necessary, or otherwise, re-establishment of the identity and purity of the standard is required. For internal standards, a CoA or evidence of purity is not necessary, if it is proven that the IS is suitable for its intended purpose.15
3.2.2.2 Calibration Curve“The calibration curve ─ also known as the standard curve ─ is the
relationship between the instrument response and the calibration standards within the intended quantitation range.” The chromatographic assays require a lower amount of calibration standards to describe the fit over the calibration curve range than for the LBAs. The plainest model that sufficiently expresses the concentration and response relationship, and as an addition to this, the correct approach of weighting and the regression equation should be utilized.
During the method validation, the calibration curve should be reproducible and continuous. The same biological matrix as the one of the samples should be employed in formulation of the calibration standards. However, inside the samples, more than one analyte may be incorporated. In this case, it is necessary to create a calibration curve for every different analyte included in the sample.
As far as the acceptance criteria are concerned, non-zero calibrators should be ± 15% of the theoretical concentration, apart from the LLOQ. In this case, the calibrator should be ± 20% of the theoretical concentration in every validation run. A 75%, and at the same time, at least six non-zero calibrator levels should comply with the limits. When there are points that fail to agree with the acceptance criteria, then only these points should be eliminated. However, this elimination should not alter the model that was used.15 3.2.2.3 Quality Control (QC) Samples
A QC sample is defined as “a biological matrix with a known quantity of analyte that is used to monitor the performance of a bioanalytical method and to assess the integrity and the validity of the results of study samples analyzed in an individual run”. QCs are employed in the evaluation of the accuracy and precision for a test method as well as the stability for a sample. The matrix of study samples of the assay should be used for the preparation of QCs. It is suggested that newly produced QCs will be used for accuracy and precision analyses throughout the development of the method, since the information concerning stability is not accessible at this moment.
During method validation, QCs evaluate the performance of a method and the stability of an analyte. Performance QCs are included in validation runs to determine the precision and accuracy of the method. Stability QCs evaluate the stability of an analyte under various stress conditions
[22]

The sponsor should prepare any calibration standards and QCs from separate stock solutions. However, if the sponsor can demonstrate the precision and accuracy in one validation run using calibrators and QCs prepared from separate stock solutions, then the sponsor can use calibrators and QCs prepared from the same stock solution in subsequent runs. The sponsor should make up calibrators and QCs in lots of blank matrix that is free of interference or matrix effects.15
3.2.2.4 Selectivity and Specificity“Selectivity is the extent to which the method can determine a particular
compound in the analyzed matrices without interference from matrix components”, while “specificity is the ability of the method to assess, unequivocally, the analyte in the presence of other components that are expected to be present (e.g., impurities, degradation products, matrix components, etc.”. Selectivity should be proved by examining blank samples of the necessary biological matrix, which can be blood, plasma, and others, from numerous sources.
Based on the specific purpose of the test method, the effect of lipidemic, hemolyzed samples, or those which come from particular people, should be involved in the evaluation of selectivity. When employing the Liquid Chromatography/Mass Spectrometry (LC/MS) methods, the effects of matrix on ion-suppression, ion enhancement, or extraction efficiency should be established. Internal standards should be evaluated to prevent any potential interference with the analyte. The possible interfering substances including endogenous matrix compounds, like metabolites, products of decomposition, xenobiotics or other concurrently used medications. Any possible interferences should be scientifically determined.
Provided that not only one, but more than that, analytes are involved into the sample under study, and these analytes are expected to be quantified by means of various methods, then every method should be examined for interference from the other analyte.
For selectivity and specificity, the acceptance criteria are the same and they are that the blank and zero calibrators should be without any interference during the retention times for the analyte(s) and the IS. It is necessary that the samples which are spiked are ± 20% of the LLOQ. Moreover, the IS in the blank sample should not be higher than 5% of the mean IS response of the QCs and the calibrators. The only particular for the specificity is that it should be examined for interference by some cross-reacting substances, co-medications or biologically changed species.
The blank samples of the suitable matrix (e.g., blood, plasma, serum, or urine) should come from a minimum of six different sources. It should be clear that there are no matrix effects during the use of the test method. Matrix effect is considered as a part of the endogenous interference, and it is defined as “a direct or indirect alteration or interference in response because of the presence of unintended analytes (for analysis) or other interfering substances in the sample”. Matrix effect follows the conditions and the criteria of selectivity and specificity.
“Carry-over is the appearance of an analyte in a sample from a preceding sample.” During the analytical methods, this carryover can sometimes appear between the samples. Throughout the process of development of a method, the carryover should be addressed and minimized. If it is not possible to happen, then it is necessary to consider the effect of any possible carryover on the accuracy of the method. For the
[23]
carry-over being accepted, it is necessary that it does not exceed the 20% of the LLOQ.15
3.2.2.5 Sensitivity“Sensitivity is defined as the lowest analyte concentration in the matrix that
can be measured with acceptable accuracy and precision (i.e., LLOQ).” The whole test method should be able to meet the criteria which are required for the specific study samples. The LLOQ estimation should be done either individually or as a part of the accuracy and the precision evaluation for the calibration range. As far as the acceptance criteria are concerned, for sensitivity the analyte reaction at the LLOQ should be higher or equal to five times the analyte reaction of the zero calibrator. The limits for the accuracy and the precision are that they should be ± 20% of the nominal concentration and the coefficient of variation, respectively. Both should be obtained from at least five replicates in a minimum of three runs.15
3.2.2.6 Accuracy, Precision, and Recovery“Accuracy is the degree of closeness of the determined value to the nominal or
known true value under prescribed conditions. Accuracy is also sometimes termed trueness.” Moreover, “precision is the closeness of agreement (i.e., degree of scatter) among a series of measurements obtained from multiple sampling of the same homogenous sample under the prescribed conditions”.
Evaluating the accuracy and precision across the quantitation range during method development is essential to determine whether the method is ready for validation and involves analyzing replicate QCs at multiple concentrations across the assayed range. Specifically, the sponsor should evaluate the performance at the LLOQ, low, mid and high QCs to determine if the method is suitable to analyze study samples.
The investigations for assessing the accuracy and precision should involve at least three separate runs for them performed over various days. Every accuracy and precision run should involve a calibration curve and multiple QC concentrations that are examined in replicates. The accuracy and the precision should be defined based on the performance of the QC samples in the precision and accuracy runs.
At least five replicates per QC level are needed. These runs should meet the calibration curve limits and involve inside the LLOQ calibrator, and they have no QC criteria in order to allow them. Both accuracy and precision can be subdivided into within-run and between run. “Within-run refers to the time period during a single analytical or validation run”, while “between run refers to the distinct period between or among several analytical or validation runs”. For the accuracy, for both within and between run types, the acceptance criteria are ± 15% of the nominal concentrations, with the only exception of ± 20% at the LLOQ. For the precision, for both within and between run types, the acceptance criteria are ± 15% the coefficient of variation, with the exception of ± 20% the coefficient of variation when at LLOQ.
The calibrators and the QCs during all the accuracy and precision runs should be freshly prepared. Nevertheless, if it is not achievable, then freshly prepared QCs should be used in one or more accuracy and precision run.
“Recovery refers to the extraction efficiency of an analytical process, reported as a percentage of the known amount of an analyte carried through the sample extraction and processing steps of the method.” The recovery of the analyte should be
[24]

improved so as to confirm that the extraction will be efficient and reproducible. The recovery might not be one hundred percent, but the range of it for an analyte and for an IS should be steady and able to be reproduced. The tests for the recovery should be accomplished by the comparison of the outcomes of the extracted samples with extracts of blank samples spiked with the analyte after the extraction at low, medium, and high QC concentrations.15
3.2.2.7 StabilityThroughout the development of a method, the stability of an analyte in a
particular matrix should be established. “Stability is a measure of the intactness an analyte (lack of degradation) in a given matrix under specific storage and use conditions relative to the starting material for given time intervals.” The different types of stability are autosampler stability, benchtop stability, processed or extracted samples stability, freeze-thaw, stock solution and long-term stability. Suitable substitutive matrices can be used, only in the condition that the initial matrix is uncommon. In any other case, it is necessary to evaluate the stability in the same matrix as that proposed for the in-study samples.
For drugs administered as fixed combinations, or part of a specific drug regimen, the stability of the analyte should be assessed in the presence of the other drug. The sponsor should also consider the stability of the analyte in the presence of other co-medications that are known to be regularly administered to patients for the indication of the drug under development. Depending on the analyte as well as the sample collection and assay conditions, evaluating the stability of the analyte in whole blood during method development can be useful. For example, a drug can be unstable in whole blood or adsorb to cellular components during collection.
Throughout the whole validation process, the requirements that will be evaluated to ensure the stability should be fulfilled before receipt at the analytical site and then also during the receipt and analysis at this analytical site. The validation procedure of a drug concerning its stability inside a fluid of biological origin should be as a function of the conditions of storage, the physicochemical properties of a drug, the matrix, and the container system. So, the stability of an analyte in a given matrix and container system is appropriate only to these specifically and should not be generalized to any others.
If the storage conditions are changed or the sample analysis occurred outside of the validated storage condition, the stability should be re-established under these new conditions. Stability testing of the analyte in whole blood should be revalidated, if necessary (e.g., in case the analytes are unstable during blood collection). For the acceptance criteria, a minimum of three replicates should be used at low and high QC concentrations. The accuracy should be ± 15% of the nominal concentration at every level.
The stability tests concerning the matrix should assess the stability of the QCs against freshly prepared calibration curves and QCs. Even though this is the preferred way, however under some circumstances, like for macromolecules, it might be essential to freeze them during the night. In these cases, it is necessary to provide reasoning and demonstrate the freeze-thaw stability. All the experiments about the stability should utilize a collection of samples made from newly prepared stock
[25]
solution of the analyte in the suitable biological matrix, which is necessary to have neither analyte nor interference inside.
The autosampler stability should be proved only in case that the storage conditions are not the same or in case that they are not included in the stability of processed sample.
Concerning the bench-top stability, it is required to establish the stability of the samples following the operating conditions of the laboratory that are anticipated for the study samples.
The extract stability is also called as processed sample stability. In this type of stability, the processed samples should be evaluated, involving the residence time in the autosampler, contrasted with newly produced calibrators.
The freeze-thaw stability is evaluated with at least three cycles. The QC samples should be firstly thawed and then examined following the same processes as that of the study samples. Among the cycles, the QCs should be frozen for a minimum of 12 hours. Moreover, the QCs should be contrasted with newly made calibration curves and QCs.
The long-term stability should be established for a time interval which will be the same or will be superior to the time between the initial samples collection date and the final samples examination date. The QCs should be compared to newly produced calibration curves and QCs. Determination of stability at minus 20ºC would cover stability at colder temperatures.
Stock solution stability: Stock solutions should not be made from reference materials that are about to expire unless the purity of the analyte in the stock solutions is reestablished. When the stock solution exists in a different state (e.g., solution versus solid) or in a different buffer composition (which is generally the case for macromolecules) from the certified reference standard, the sponsor should generate stability data on stock solutions to justify the duration of stock solution storage stability.15
3.2.2.8 Dilution effectsProvided that the method measures diluted samples, then “the integrity of the
dilution should be monitored during validation by diluting QC samples above the ULOQ with like matrix to bring to within quantitation range, and the accuracy and precision of these diluted QCs should be demonstrated”. Throughout the process of validation, whichever dilution is used should be close to the required dilutions in the study. Moreover, five replicates should be used per each dilution factor. For the acceptance criteria, the accuracy should be ± 15% of the nominal concentrations and the precision ± 15% of the CV.15
3.2.3 Partial validationWhen a bioanalytical method has already been validated, then each
modification that may happen must be assessed by partial validation. Partial validation can vary from small changes, as in case of intra-assay accuracy or precision, till even full validation. At the analytical site, raw data should be maintained in case that investigation is demanded. Some examples of changes that are included into the partial method validation, but are not restricted to them only, are transfers of the methods between different laboratories, changes in the methodology which is followed, changes in the volume of the sample, changes in matrix within
[26]
species or changes to species within the matrix, changes in the handling techniques, changes in the instruments used, changes to the matrices.15
3.2.4 Cross validationCross validation is a comparison of validation parameters of two or more
bioanalytical methods or techniques that are used to generate data within the same study or across different studies. Also, cross validation is necessary when sample analyses within a single study are conducted at more than one site or more than one laboratory. In such cases, cross validation with shared matrix QCs and non-pooled subject samples should be conducted at each site or laboratory to establish interlaboratory reliability. Pooled incurred samples can be used when insufficient volume exists. A SOP or validation plan should define the criteria a priori.15
[27]
3.3 International Council for Harmonization (ICH) guidelines
3.3.1 BackgroundIn this part, we will deal with the ICH guideline draft published in 2019. It has
been commented by public in Brazil, Europe, United States, Canada, Republic of Korea, Japan, China, Switzerland, and Chinese Taipei, by their corresponding regulatory authorities. Till September of 2019, it has undergone the processes of sign-off, endorsement, and public consultation. In 2022, some teleconferences as well as face-to-face meetings have been scheduled. During them, the guideline text will be revised, based on the comments made during the public consultation. Moreover, preparation and finalization of the training materials will take place. In the end, there is the step of sing-off, and then the adoption will follow.16
ICH guidelines are designed so as to offer suggestions on how to validate the bioanalytical test methods for quantitation of drugs and their subsequent application in the assessment of study samples. The quality and the continuity of the information obtained during method validation are ameliorated by the adherence to the principles and rules stated in the guidance.17 It is an effort to globally harmonize the BMV among the agencies as it aims to explain the updates and interpretations against its FDA and EMA equivalents.18
Data are provided for CCs as well as for LBAs. However, we will deal with the first category, which includes Liquid Chromatography (LC) or Gas Chromatography (GC), mainly used together with Mass Spectrometry (MS) detection, or even sometimes with different types of detectors.
The analyte of interest should be known before the beginning of development of a method. This means that its metabolism, either in vitro or in vivo, its physicochemical properties and its protein binding should be known. All the processes and the requirements which are involved into the method development, should be optimized. This involves the extraction and the detection of the analyte. The following parameters should be tested for the validation of a bioanalytical method: reference standards, critical reagents, calibration curve, QC samples, selectivity and specificity, sensitivity, accuracy, precision, recovery, stability of the analyte, minimum required dilution. Although extensive documentation is not necessary, however, alterations in the processes should be recorded. After the development of the method, validation demonstrates that it is appropriate for the evaluation of the samples under study.
3.3.2 Full method validation“A full method validation of a bioanalytical method should be performed
when establishing a bioanalytical method for the quantification of an analyte in clinical and in pivotal nonclinical studies.” Moreover, when employing a method that is already referred in the literature and when a commercial kit is reused for a new purpose in the development of a drug, full method validation is utilized. Frequently, there is only one analyte, however, there is still the possibility of measuring more than
[28]

one. Either two different drugs or a parent drug with its metabolites, enantiomers, or isomers might be present. All the analytes of interest should be examined and validated individually.
When for the CCs, a full method validation is required, then the parameters that should be tested are specificity, selectivity, matrix effects, calibration curve, range, accuracy, precision, carryover (if it is necessary), dilution linearity, parallelism, and stability. Sometimes, it might be difficult to achieve an identical matrix compared with the study samples. This happens when cerebrospinal fluid, tissues, or even bile are the matrices under investigation. In the above-mentioned cases, for the bioanalytical method validation surrogate matrices are used. Nevertheless, in order to be used, they should be scientifically justified. The method should be described in detail before the beginning. This description can have different forms. It might be as an individual study plan, report, protocol, or SOP. Standard Operating Procedure is characterized in the ICH guidelines as “detailed written instructions to achieve uniformity of the performance of a specific function”.17
Reference StandardsThroughout the process of validating a method and the subsequent
examination of the study samples, a blank matrix will be linked to the analyte(s) of interest by utilizing reference standard(s) solutions so as to formulate calibration standards, QCs and stability QCs. The formulation of calibration standards as well as the QCs should be done from individual stock solutions. Nevertheless, if the accuracy and the stability of the stock solution have been confirmed, then it is possible to prepare them from the same stock solution. Inside all the calibration standards, QCs and study samples throughout the sample proceedings, a suitable internal standard should be added. The absence of it should be always reasoned, because otherwise it is not acceptable.
It is necessary to use a reference standard that will be well described and its quality, it means concerning the purity, strength, and identity, as well as the suitability of the IS is reassured. This is done due to the fact that the quality will have an impact on the results of the examinations and the whole study information provided. The reference standard that will be used throughout the process of the validation and interpretation of the study sample should be acquired from an authentic and traceable source. The reference standard should be identical to the analyte. However, provided that this is not achievable, it might be used a salt or hydrate.
Appropriate reference standards include compendial, commercially available, or even sufficiently characterized standards that are prepared either in-house or by an external non-commercial association. A CoA or another comparable option is essential to certify quality and to give information on the purity, storage conditions, expiration date or date of retest and batch number of the reference standard. A CoA is not needed for the IS if the appropriateness for use is proved. This could be the case of absence of analytical interference, which is demonstrated for the substance itself or some impurities.
The usage of the stable isotope-labelled analyte as the IS is suggested whenever possible, if mass spectrometry detection is utilized. Nevertheless, it is important that the labelled standard will be of high isotope purity and that there will be no isotope exchange reaction. During method validation, the presence or absence
[29]

of the unlabeled analyte should be examined and provided that unlabeled analyte will be detected, then the probable impact should be assessed. In addition, the stock and working solutions can only be produced from reference standards that are inside the stability period as recorded in the CoA.17 3.3.2.1 Selectivity
Selectivity is defined as the “ability of an analytical method to differentiate and measure the analyte in the presence of potential interfering substances in the blank biological matrix (non-specific interference)”.
Selectivity is examined by utilizing blank samples acquired from a minimum of six different sources/batches, which should be non-lipemic and non-hemolyzed. The blank samples are those in which the matrix is handled without the supplementation of an analyte or IS. Usage of lower number of sources might be tolerable, but only for rare matrices. Selectivity for the IS should also be assessed.
The assessment of selectivity should prove that there is no significant response coming from interfering compounds that will be detected at the retention time(s) of the analyte or the IS in the blank samples. However, any possible responses that will be identified coming from the interfering substances should not be higher than 20% of the analyte response at the LLOQ. At the same time, it is necessary that the responses will, also, not be higher than 5% of the IS response in the LLOQ sample for every matrix.
In the case that selectivity should be examined in lipemic matrices, then a minimum of one source of matrix should be utilized. The matrix occupied should be representative of the expected study samples. A normally lipemic matrix with unusually high levels of triglycerides should be acquired from donors. Despite the fact that it is suggested to utilize a lipemic matrix from donors, however, if it is difficult to achieve, then it is tolerable to spike the matrix with triglycerides, even in the case that this might not be characteristic for the samples. Nevertheless, provided that the drug affects the lipid metabolism or the population that this drug is intended to be used is hyperlipidemic, then spiked samples should not be encouraged to be utilized.
In order to examine the selectivity in the hemolyzed matrices it is necessary that a minimum of one source of matrix should be utilized. These hemolyzed matrices will be acquired from linking the matrix with hemolyzed whole blood – which should be not lower than 2% V/V – in order to create a hemolyzed sample which is visually noticeable.17
3.3.2.2 SpecificitySpecificity is defined as the “ability of an analytical method to detect and
differentiate the analyte from other substances, including its related substances (e.g., substances that are structurally similar to the analyte, metabolites, isomers, impurities, or concomitant medications)”.
In case that related substances are expected in the biological matrix of interest, then the effect of these substances should be assessed throughout the validation process. If LC/MS methods are used, in order to evaluate the effect of these substances, the assessment might involve the comparison of molecular weight of a possible interfering substance with the analyte and the subsequent chromatographic separation of this specific substance from the analyte. Whichever response coming from interfering substances should be monitored. The acceptance criteria allow a
[30]
maximum of 20% of the analyte response at the LLOQ and at the same time a maximum of 5% of the IS response in the LLOQ sample.
Sometimes, it is possible to obtain a metabolite which will be back converted into the initial parent analyte, throughout the steps of the analysis. This should also be examined when there is possibility to happen. This could be the case of theoretically unstable metabolites, like lactone-ring structures, ester analytes leading to ester/acidic metabolites, or unstable glucuronide metabolites. When the metabolism is not yet examined, it means during the first stages of development of a drug, then it is not possible to make this assessment. Nevertheless, it is anticipated that this problem should be examined, and partial validation should be accomplished, if it is necessary. Finally, the amount of possible back-conversion should be determined and the effect that is caused on the outcomes of the study should be reviewed in the bioanalytical report.17
3.3.2.3 Matrix effectMatrix effect is “the direct or indirect alteration or interference in response due
to the presence of unintended analytes or other interfering substances in the sample”. At the time of validation, matrix effect should be assessed between different and individual sources/batches.
The matrix effect should be assessed by examining a minimum of three replicates, which will be of low and high QCs. Every one of them should be formulated by utilizing matrix from a minimum of six individual sources/batches. For the acceptance criteria, the accuracy should be within ± 15% of the theoretical concentration. In addition, concerning the precision – expressed as percent of CV – it should not be higher than 15% in all different sources/batches. The utilization of lower amount of sources or batches might be adequate, but only in the case that rare matrices are occupied.
The assessment of the matrix effect is necessary in cases of special populations, like renally or hepatically impaired patients. When there is the possibility of the hemolyzed or lipemic matrix samples to be used, then during method validation it is necessary to create an assessment for these terms.17
3.3.2.4 Calibration Curve and RangeCalibration curve is defined as “the relationship between the instrument
response and the concentration (amount) of analyte in the sample within a given range. Also referred to as Standard Curve.” Moreover, “the calibration range of an analytical procedure is the interval between the upper and lower concentration (amounts) of analyte in the sample (including these concentrations) for which it has been demonstrated that the analytical procedure meets the requirements for precision, accuracy and response function”.
When spiking the matrix with a known amount of analyte then the calibration standards are prepared. These calibration standards should cover the whole calibration range. Study samples and calibration standards should be made in an identical biological matrix. Moreover, there should be one calibration curve for every different analyte examined during validation process and for every analytical run, too.
The calibration curve should be prepared with a blank and a zero sample and, at the same time, a minimum of 6 concentration levels of calibration standards,
[31]
containing the LLOQ and the ULOQ. A zero sample is prepared by a blank sample spiked with the IS.
A simple regression model that sufficiently defines the concentration and response connection should be occupied. The choice of the regression model should be guided by written processes. However, the blank and zero samples should not be involved into the determination of the regression equation for the calibration curve. Every calibration standard might be assessed in replicate. During the phase of regression analysis, all the appropriate replicates should be utilized.
The parameters of the calibration curve should be stated. Specifically, for the linear model, the slope and the intercept are the ones that should be noted. The back-calculated concentrations of the calibration standards should be described simultaneously with the estimated average accuracy values. All the curves that satisfy the criteria acquired throughout validation, which are based on at least three individual runs on various days, should be stated. The acceptance criteria for the accuracy concerning these back-calculated concentrations for every calibration standard should be within ± 20% of the theoretical concentration at the LLOQ. At the same time, they should be within ± 15% at any other level. A minimum of 75% of the calibration standards with at least six calibration standard levels should comply with the above-mentioned standards.
If replicates are utilized, and not the original ones, then these criteria should also be complied with a minimum of 50% of the calibration standards tested in every concentration level. However, provided that these criteria are not fulfilled for a particular calibration standard, then this should be excluded and then, after its removal, the calibration curve should be examined again, also involving the regression analysis. Concerning the accuracy and the precision runs, if all the replicates of the LLOQ or the ULOQ calibration standard during a run are excluded, then also the whole run should be excluded, and the probable cause of the problem should be found. Finally, if it is necessary, the method should be reviewed. In case that the next validation run will also fail, then it is necessary to revise the whole method before the beginning of validation all over again.
Generally, the calibration curve should be prepared using freshly spiked calibration standards in at least one assessment. Subsequently, frozen calibration standards can be used within their defined period of stability.17
3.3.2.5 Accuracy and PrecisionBefore utilizing accuracy and precision, the preparation of QC samples is
important. QC sample is defined as “a sample spiked with a known quantity of analyte that is used to monitor the performance of a bioanalytical method and assess the integrity and validity of the results of the unknown samples analyzed in an individual batch or run”.
So as to prevent the subjective assessments which are unrelated to the analytical performance of the method, it is necessary to produce calibration standards and QCs from different stock solutions. Nevertheless, if the accuracy and stability of the stock solution have already been proved, then it is possible that the calibration standard and the QCs might be produced from the same stock solution. Moreover, only a single source of the blank matrix might be utilized. This source should be without any interference or matrix effects.
[32]

Throughout the method validation process, the QCs should be produced at least in four different concentration levels, which should be inside the calibration curve range. These levels should be the LLOQ, approximately 3 times the LLOQ (which means low QC), approximately 30-50% of the calibration curve range (which means medium QC) and finally a minimum of 75% of the ULOQ (which means high QC).
Accuracy is “the degree of closeness of the measured value to the nominal or known true value under prescribed conditions (or as measured by a particular method). It is expressed as percent relative error of the nominal value”.
Accuracy (% )=Measured value−Nominal valueNominal value
× 100 Eq. 3
Precision is “the closeness of agreement (i.e., degree of scatter) among a series of measurements. Precision is expressed as the coefficient of variation (CV), or the relative standard deviation (RSD) expressed as a percentage.”
Precision (% )=StandarddeviationMean
× 100 Eq. 4
The accuracy and precision should be defined by examining the QCs in two different categories. It should be either in within every run, which is called within-run accuracy or precision, and in between different runs, which is called between-run accuracy or precision. The accuracy and precision should be assessed by utilizing the same runs and data obtained.
The within-run accuracy and precision should be assessed by examining a minimum of five replicates at every QC concentration level in every analytical run. Concerning the between-run accuracy and precision, they should be assessed by examining every QC concentration level in a minimum of three analytical runs over a period of a minimum of two days. Depending on the size of the potential analytical run of study samples, is suggested to prove the accuracy and precision in a minimum of one run of this specific size. This is done in order to facilitate the assessment of any changes over time within one run. Apart from the cases when there are fails, which are apparent and reported, in any other case all the outcomes gained, involving the QCs which do not meet the acceptance criteria, should be involved in the designation of accuracy and precision. The between-run accuracy and precision should be calculated by connecting the information from all the runs.
Concerning the within-run accuracy and precision, any data should be documented for every run. In case that the requirements are not fulfilled in every run, it is possible to use a general evaluation of within-run accuracy and precision for every QC level. The calibration curves for these evaluations should be produced by utilizing newly spiked calibration standards in a minimum of one run. If freshly spiked calibration standards are not used in the other runs, stability of the frozen calibration standards should be demonstrated.
For the acceptance criteria, the total accuracy at every concentration level should be within ± 15% of the theoretical concentration. The only exception is at the LLOQ, where it should be within ± 20%. For the precision, which is expressed as percent of CV, of the concentrations decided at every level should not be superior to 15%. Once more, there is the exception at the LLOQ, where it should not be higher than 20%.17
[33]

3.3.2.6 Carry-overCarry-over is “the appearance of an analyte signal in a sample from a
preceding sample”. In the beginning, during the development of a method, the carry-over should be calculated and diminished. Then, during the validation of the method, the carry-over should be evaluated by examining the blank samples following the calibration standard at the ULOQ. The carry-over in the blank samples after the highest calibration standard should not be higher than 20% of the analyte response at the LLOQ and, at the same time, it should not be higher than 5% of the response for the IS.
However, if the carry-over seems to be unavoidable, then the study samples should not be randomized. In this case, there are particular measures that should be taken into consideration, and then examined during the process of validation and applied throughout the analysis of study samples, so as to prove that the carry-over does not affect the accuracy and precision. In order to do this, before the next study sample, it is possible to inject blank samples following samples with an estimated high concentration.17
3.3.2.7 Dilution IntegrityThe “assessment of the sample dilution procedure to confirm that the
procedure does not impact the measured concentration of the analyte” is defined as dilution integrity. The accuracy and precision of the calculated concentration of the analyte should remain the same. For the purposes of dilution, the same matrix from the same species occupied for preparation of the QCs, should be used.
When there are analyte concentrations in the matrix that are higher than the ULOQ and then they are diluted with blank matrix, the dilution QCs are produced. A minimum of five replicates per each dilution factor should be examined in only one run, so as to find out whether the concentrations are calculated inside the calibration range with accuracy and precision. During validation there is a range of dilution ratios assessed, inside which should be examined all the dilution ratios which were applied during sample analysis. The mean accuracy of the dilution QCs should be within ± 15% of the theoretical concentration and the precision, expressed as percent of CV, should not be higher than 15%.17
3.3.2.8 StabilityWith each action taken throughout the preparation, processing, and
investigation of the samples, or even during the storage environment, it should be reassured that the stability remains unaffected.
The conditions utilized during storage and analysis by the stability studies should resemble also those conditions utilized by the study samples. These conditions could be the sample matrix, storage temperature, anticoagulant, container materials or samples storage times and temperatures. Simply the reference to the available literature is not adequate. The validation of storage times should be done on stability QCs that have been collected for a period of time either equal or even longer than the storage periods of the study samples.
By occupying low and high concentration stability QCs, the assessment of the stability of an analyte in the given matrix is performed. Aliquots of these low and high stability QCs are then examined at the time considered as zero and after the utilized storage conditions that are to be assessed. At least three stability QCs should be
[34]

produced and examined for every either concentration level or storage condition or timepoint.
The stability QCs are examined against a calibration curve, which was obtained from newly spiked calibration standards in a run with its comparable newly produced QCs or QCs for which the stability has already been verified. The acceptance criteria concerning the average concentration at every QC level should be around ± 15% of the theoretical concentration. Provided that the concentrations of the study samples remain all the time above the ULOQ of the calibration range, then the concentration of the high stability QC should be modified to resemble these higher concentrations. However, this might not be possible when non-clinical studies are used, because of the solubility restrictions.
In case that the study sample examined contains more than one analyte, then the stability test for a specific analyte in the matrix should be performed with the matrix involving every analyte present. The ICH examines six different types of stability studies. These are stability of stock and working solution, freeze-thaw matrix, bench top matrix, processed sample, long-term matrix, and whole blood stability.
The stability of the working and stock solutions of an analyte and IS should be decided under the conditions of storage utilized in the examination of study samples by employing the lowest and the highest concentration of these solutions. They are examined by utilizing the response from the detector. However, the stability of the stock and working solutions should be examined with a suitable dilution, with respect to the linearity and range of the detector. In case that the stability is changing, depending on the concentration, then it is necessary to examine the stability in every concentration level of these stock and working solutions. Provided that the reference standard expires, or the retest date has passed, then the stability of these solutions prepared with this batch of reference standard are specified by the expiration or retest date determined for the stock solution. It is not accepted to prepare stock and working solutions from about to expire reference standard just to extend its due date.
During freeze-thaw stability, in order to evaluate the effect of constantly removing samples from frozen storage, the stability of the analyte should be evaluated following numerous cycles of freezing and then thawing. Low and high stability QCs should be thawed and examined following the same processes as those of study samples. Among the thawing cycles, the stability QCs should be maintained frozen for a minimum of 12 hours. Moreover, during the freeze-thaw stability, the stability of the QCs should be evaluated by occupying newly produced calibration standards and QCs or at least QCs for which the stability has already been verified. Finally, the validated cycles of freeze-thaw should be either equal or exceed the number of cycles undergone by the study samples. At least three cycles should be done in any case.
Bench top type of stability is also called as short-term. It should deal with the laboratory processing conditions for the study samples. Low and high stability QCs should be firstly thawed in the exact same way as the study samples and then also stored on the bench top at an identical temperature and at a minimum of the duration that the study samples have already been. This means that the total time on the bench top should be the same.
The stability of processed samples, involving the time which is needed to complete the whole analysis should be designated. Some examples could be the
[35]

stability of processed sample at the storage conditions utilized in the analysis of study samples or the “on-instrument/ autosampler stability of the processed sample at injector or autosampler temperature”.
During long-term matrix stability, low and high stability QCs should be stored in the freezer under identical storage conditions and for the same duration as the study samples at minimum. There are two categories of drugs occupied. Firstly, there are chemical drugs and then also biological drugs. As far as the former category is concerned, it is acceptable to consider that when stability is confirmed in one temperature (e.g., -10 °C), then the trend will also continue at lower temperatures (e.g., -60 °C), which means that the stability also in this temperature will be verified. For the latter category, bracketing approach is occupied. According to this, if stability has been proved at -60 °C and at -10 °C, then is not required to investigate the temperatures in between these two. Study samples stored at these temperatures are considered stable.
The test of whole blood stability is not performed all the time. If it is applicable, then it is used. In case that the sampled matrix is blood, then it is necessary to ensure the stability of the analyte. This should be done immediately following collection from subjects and before processed to storage, in order to reassure that the concentrations gained are the ones of the analyte in the subject’s blood at the time of sample collection. All the outcomes should be included into the validation report.17
3.3.2.9 Reinjection ReproducibilityReproducibility is “the extent to which consistent results are obtained when an
experiment is repeated”. A method should be tested for it and be evaluated by replicate measurements of the QCs and it is frequently involved into the evaluation of accuracy and precision. Nevertheless, if samples could be reinjected, then also the reinjection reproducibility should be assessed and involved in validation or bioanalytical report of the performed study, due to the possible instrument failure.17
3.3.3 Partial method validationPartial validations assess the changes that have been made to bioanalytical
methods which were previously fully validated. The partial validation can extend from just one within-run accuracy and precision determination till an almost full validation. Provided that the stability is determined at one facility, then it is not required to be replicated at another provision.
As far as the chromatographic methods are concerned, the alterations that are involved into partial method validation might be, but definitely are not restricted to the subsequent cases: bioanalytical transfer of a method between different laboratories, alterations in methodology or the processing actions, alterations in the volume of the sample, or even changes to the storage environments.17
3.3.4 Cross method validationCross validation is the “comparison of two bioanalytical methods or the same
bioanalytical method in different laboratories in order to demonstrate that the reported data are comparable”. If different laboratories utilized the same validated method at every point, then it is not necessary to perform cross validation to compare the
[36]

information gained. However, the validation should be accomplished before the study samples are examined, if it is feasible.
Cross validation happens in case that: information is gained from fully validated methods within only one or even more studies – which are combined or compared to support dosing, efficacy, or labelling – or when information was gained from different laboratories that utilized the same method.
Cross validation should be evaluated by calculating the same set of QCs, which means low, medium and high, in triplicate and at the same time the study samples that cover the whole concentration range with both assays or in both laboratories.17
[37]

4. COMPARISON among EMA, FDA and ICH GUIDELINES FOR BMV
4.1 IntroductionAfter the occupation with some of guidelines that are used worldwide, the
comparison of EMA’s 2011, FDA’s 2018 and ICH’s 2019 (draft) guidelines is the target of the present chapter. Despite their similarities in many points, still there are a lot of differences in the definitions, methodology, and acceptance criteria. The parameters used by them are going to be discussed in contrary. As it is normal, there is extremely small amount of such comparison published till this time (November of 2021), since the FDA’s as well as the ICH’s are considered as brand new, so we will use some articles performing comparison for previous versions of these guidelines, but every piece of information was thoroughly tested that it is valid for the currently issued guidelines that we mind about.
4.2 ComparisonBased on my comparison, there are some general variations. In the FDA’s
text, there is together the information concerning the CCs and the LBAs. On the contrary, the EMA and the ICH start with presenting the CCs and then in another chapter goes on with the presentation of the LBAs parameters. In addition, all the recommendations as well as the acceptance criteria of FDA are altogether in the tables, located in the part of the appendix. However, the EMA and the ICH contain the limits and acceptance criteria directly in every parameter inside their text. In my opinion, the way that the EMA and ICH introduce their limits is easier for the reader, to interpret without every time to have to search the acceptance criteria elsewhere in the document.
Another significant difference that I have noticed, is that the FDA continuously uses the terms “sponsor/applicant” when describing the steps that should be taken, while the EMA and ICH prefer to use the third person of passive voice, which creates some distance between the directions given and the reader. The EMA describes most of its definitions in the main body and there are only a few parts of definitions in the end of the document. Meanwhile, the FDA and the ICH have a full list of explanations of definitions and terms extensively described in the part of glossary, located in the end of its document.14,15,17
Regarding validation, the FDA, EMA, and ICH require partial validation every time that alteration occurs.9,17 However, for the reference standards, all three guidelines are treating the same way, as per the origin of the material and documentation conditions. These could be CoA, batch numbers, expiration date. Moreover, they also agree that provided the IS contains no impurities inside, then it is possible to not provide CoA for it.17,19 The FDA suggests that if the IS or the reference standard are expired, then the stock solution which has been produced by them should not be utilized if the purity has not been re-determined.9
[38]

Generally, SOPs are explained in an exact way in FDA and ICH guidelines,15,17
while at the same time the EMA prefers to give the possibility either to follow SOP or, in case of GLP-certified laboratories, to define their own fit-for purpose quality systems. Furthermore, the FDA contains solely the formula for calculation of ISR, although the EMA is interested in handling with formulas to find arithmetical values generally.9,20 Some examples could be the calculation of ISR, precision and accuracy.14 The ICH, on the other hand, contains the formulas for precision and accuracy only when giving their definitions in the part of glossary.17
4.2.1 Selectivity and SpecificityConcerning selectivity and specificity, while both these terms are used by the
FDA, the EMA occupies only the former one in CCs. The definitions for selectivity look alike, and both the EMA and the FDA require a minimum of six sources.14,15 In this case, the ICH deals with both terms, like the FDA.17 Moreover, both the EMA and ICH have described the procedure to assess the back-conversion of metabolites into their initial drug by spiking this metabolite in blank matrix. In addition, they describe the procedure to find out the amount of interferences that may be probably occurred by degradation products or concomitantly administered medicaments.6,9,17 Lastly, the limits for the acceptance criteria are that response coming from interfering compounds should be around 20% of the LLOQ, for the analyte, and 5% for the IS, for all the guidelines. However, the FDA requires that the zero and blank sample should be free from interference, which is not demanded in the EMA or ICH.14,15,17
Another difference between ICH and FDA is that in the former one the selectivity and specificity are explained as different subcategories, while in the latter one they are located together.15,17
4.2.2 Carry-overRegarding the carry-over, it is explained as part of selectivity and specificity
in the FDA, while the EMA and ICH include it as a separate parameter alone.14,15,17 All agencies suggest that it should be addressed and minimized.9,17 Specifically, the FDA recommends defining where the problem is and try to remove any possible influence,20 but there is no specific methodology for it9 and without to provide instructions on how to test it. The limit appears to be that the carry-over should not be greater than 20% of the LLOQ. However, the EMA and ICH characterize in greater detail the procedure and broadens the acceptance criteria for the IS.17,20 They refer that the assessment of carry-over should be done by examining series of blank samples after an ULOQ injection.6,17 They also give some recommendations on what to do in case that the carry-over is inevitable,17,19 since it is necessary not to influence the accuracy and precision.9,17 In this situation the randomization of the study samples should be avoided.17,19
4.2.3 Sensitivity and LLOQProblems exist when referring to the same parameter, but EMA and FDA use
different terminology and creates confusion for the user.20 Concerning sensitivity, in the FDA it is referred to as LLOQ. However, this is not the case of the EMA. The latter guideline occupies the term LLOQ and while it provides approximately the same definition with the sensitivity of the FDA, nowhere in the text is referred the term sensitivity.14,15 In the past there was also the confusion of quantification
[39]
mentioned as quantitation,19 but this has been changed and only the former term is used by both guidances.14,15
Another significant issue is that in the EMA is stated that the LLOQ should be adjusted to the nominal concentrations and to the purpose of the study.6 Regarding the acceptance criteria of the LLOQ, both agencies mention that the noise coming from the analyte should be minimum five times the signal coming from the blank sample and the accuracy should be within 80-120%, with precision around 20%.9 Concerning the ICH, it mentions that sensitivity is a critical parameter needed for method validation and in the part of glossary it provides its definition and accepts to be mentioned also as LLOQ. However, it is not explained in the text together with the other parameters.17
4.2.4 Calibration curveWith regards to the calibration curve, all three guidelines agree on the
requirement that at least six calibration concentration levels, in addition to the blank and zero sample, should be utilized.6,17 While EMA and ICH use zero sample and calibration standards, the FDA uses zero and non-zero calibrators respectively.17,20 For the acceptance criteria, the EMA and ICH mention that the back-calculated concentrations of calibration standards should be within ± 15% of the expected concentration, apart from the LLOQ which should be ± 20%. A minimum of 75% of calibration standards, with at least six levels must comply with this limit.14,17 On the other hand, the FDA uses exactly the same limits with the only change that it refers to non-zero calibrators instead of calibration standards, as also mentioned above.15,20
Furthermore, all guidelines state that there is the possibility to reject a calibration standard from the calibration curve, followed by re-assessment of the calibration curve.14,15,17
4.2.5 Accuracy and Precision The FDA, as far as the terminology is concerned, allows some changes, for
example it uses accuracy and trueness with the same meaning.20 The EMA and ICH accept only accuracy and at the same time, they give the specific formula for it. In addition, they also provide the formula for the precision. However, in all three guidelines distinguish between within and between run and their acceptance criteria are alike. In accuracy, all guidelines state that the average concentration should be 15% of the expected, apart from the LLOQ which should be 20%. For the precision, the EMA states that CV should not be higher than 15% for the QC samples, apart from LLOQ which should not be higher than 20%. The FDA and ICH, however, state that it is required to be plus minus around these limits.
Moreover, they suggest four concentration levels should be used to cover the whole calibration curve range. These should be the LLOQ, low, medium, and high QC samples. A minimum of three separate runs, with these four QC levels and with at least five samples per every QC level should be used. All agencies agree that these should be performed over some several days.14,15,17 The difference, however, is in the fact that the FDA and ICH suggest fresh calibrators during all the runs of both accuracy and precision.15,17 At the same time the EMA suggests the utilization of freshly prepared samples, while it admits that frozen ones are also possibly used, if stability is acceptable. The calibration curve should be better produced by newly
[40]

spiked samples, but if it is not possible, then previously prepared, and stored calibration samples that are stable should be utilized instead.9
4.2.6 QC samplesThe new FDA guidelines were published in 2018. One remarkable inclusion,
then, was regarding QC samples. It is recommended to control their drift and judge the significance of its effect on accuracy.20 Regarding QC samples, the definition for low QC is not unified and in the case of medium and high QC, unlike EMA and ICH, the FDA does not specify the numerical values needed.17,20 It only uses terms “mid-range” and “high range”, but what is considered as medium or high is not explained further.15
4.2.7 Dilution integrityThis parameter is mentioned as dilution integrity in EMA and ICH, while the
FDA uses dilution effects instead. Nevertheless, the way of evaluation of the dilution effects is similar among the agencies. All of them suggest that the number of replicates should be five per dilution factor. Their acceptance criteria are that the accuracy and precision should be according to their previously mentioned limits, which means around 15%.14,15,17
4.2.8 Matrix effectAll agencies suggest dealing with the matrix effect, however, the EMA and
ICH contain the process in more detailed prescription for CCs.6,17,20 On the contrary, the FDA contains detailed process for matrix effect more for the LBAs than CCs.15 This is understandable also from the fact that the matrix effect is presented as a separate parameter alone in EMA and ICH, while the FDA contains the matrix effect in the selectivity and specificity part.14,15,17 Another significant difference is the existence of the matrix factor and its way of calculation through the formula provided by the EMA, while the FDA and ICH do not even mention the matrix factor.17,18,20
Besides, all guidelines require the utilization of a minimum of six different batches of matrix obtained from different donors.17,18 This has been taken one step further by the EMA and ICH guidelines, since they, both, recommend if applicable, samples from particular groups of population like hepatically or renally impaired people, i.e. the use of hemolyzed and hyperlipidemic plasma samples..14,17 However, the EMA provides also the possibility of online preparation of samples.6,9 The acceptance criteria in EMA and ICH state that the CV should not be higher than 15%, while in the FDA should follow the criteria of selectivity and specificity.14,15,17
4.2.9 RecoveryIn the EMA guideline there is no referral to the parameter named recovery.9,14
The FDA is unequivocal on this matter and states clearly the existence of it. It is located in the subchapter where the accuracy and precision are mentioned. It is indicated that the recovery should be determined by the comparison of the outcomes for the extracted samples at three different levels, low, medium, and high QC. For the acceptance criteria, it is not required to have recovery 100%, but still the range of the recovery of an analyte and the IS should be able to be reproduced as well as stable.15
In the ICH guideline recovery is not mentioned in the chapter of CCs or LBAs validation. However, there are some additional considerations, inside which the recovery is mentioned and explained. It is stated that for the methods using sample extraction, the recovery should be evaluated and provides its definition. The
[41]
acceptance criteria are the same as in the FDA guideline and usually low, medium, and high concentrations are employed in the experiments.17
4.2.10 StabilityThe stability of the samples is a significant point that is discussed in a separate
subchapter by every agency and the determination of it, is generally of great importance.17,20 Despite the fact that the EMA is referring to most of the different types by their name, it is not explaining all of them. It mentions in detail only freeze and thaw, long-term and stability of stock and working solutions. On the other hand, apart from these the FDA also describes the autosampler, bench top (short-term), and extract (processed sample) types of stability.14,15 From the above-mentioned it is clear that while the EMA lacks some particular processes, the FDA has supplied a particular methodology.9
The ICH guideline takes this one step ahead. It refers to stock and working solution, freeze-thaw, long-term and bench top (short-term) types of stability, just like the FDA. Nevertheless, inside processed sample stability, the autosampler stability is also referred. Furthermore, the whole blood stability is mentioned separately.17
All three guidelines require the establishment of the stability in every different step during the BMV process. This means the conditions throughout handling, and storage as well as containers’ materials should be tested. EMA, FDA and ICH perform the assessment by utilizing low and high QC samples, by using a minimum of three replicates.14,15,17 Regarding the stock solution stability, while a few things are mentioned in the EMA, nevertheless, particular methodologies or processes for the evaluation of it are missing.14
Concerning freeze and thaw stability, all guidelines suggest frozen the QC samples for a minimum of 12 hours between cycles. Regarding the long-term stability, EMA and ICH mention that the QC samples should be kept inside the freezer, meeting similar conditions of storage, however, the requirements in all three guidelines are the same.14,15,17 In the long-term stability, the EMA also agrees to bracketing approach only when studying for small molecules.9,20 In case macromolecules are been examined, like peptides or proteins, then at every different temperature it is required to test the stability again.9 However, the ICH states that it is suitable for chemical drugs to extrapolate the stability from higher to lower temperatures, while for biological drugs the bracketing approach can be utilized.17 For the whole blood stability, the FDA mentions its importance and suggests evaluation, if it is required. While the EMA declares the need for careful obtaining of the concentrations in order to be representatives during sampling, still it is not referred to it by name.18 Only the ICH explains this type of stability together with any other type, performed only if it needed.17
4.2.11 Cross validationAll guidelines, FDA, EMA and ICH are referring to cross validation and they
have comparable suggestions. Nonetheless, the FDA recommends the use of shared matrix QCs and non-pooled subject samples, while the EMA and ICH accepts the testing of the same set of QC samples or study samples.17,20 The acceptance criteria in FDA and ICH guidelines are not mentioned,9,17,20 while in EMA, they are different for QCs and study samples.20 Another difference among them, is that the EMA and the ICH suggest the utilization of cross validation, provided that it is possible, before the
[42]
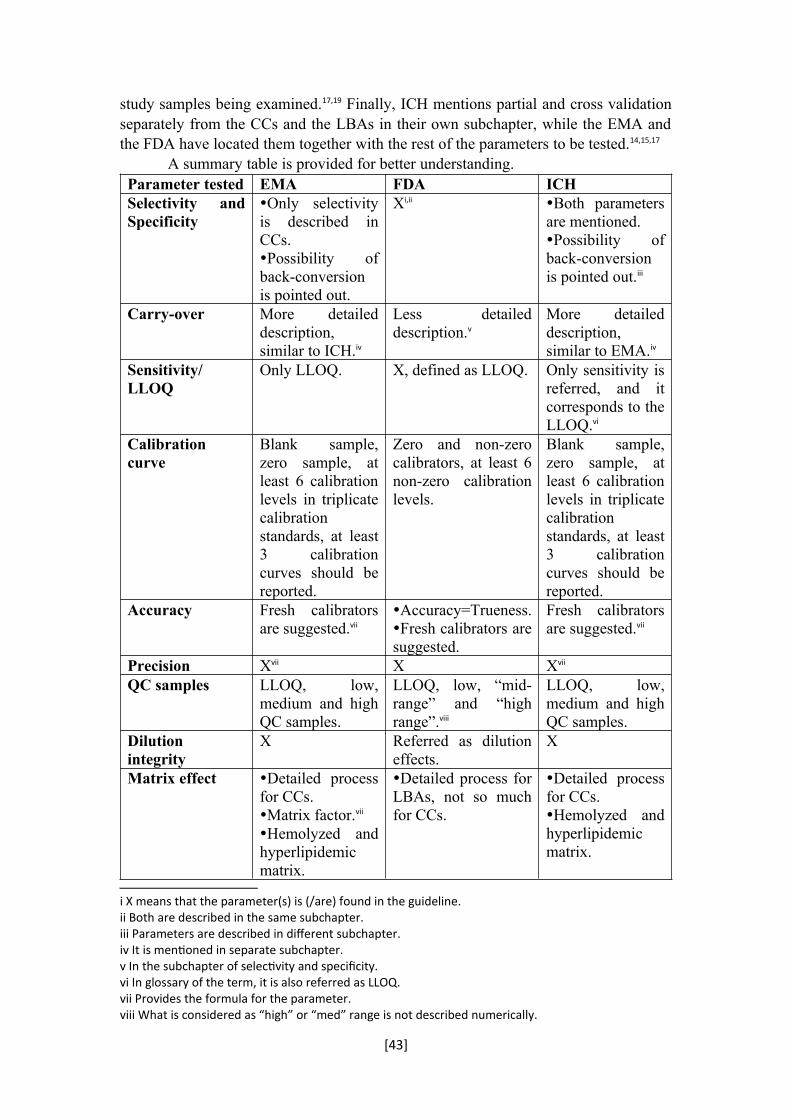
study samples being examined.17,19 Finally, ICH mentions partial and cross validation separately from the CCs and the LBAs in their own subchapter, while the EMA and the FDA have located them together with the rest of the parameters to be tested.14,15,17
A summary table is provided for better understanding.Parameter tested EMA FDA ICHSelectivity and Specificity
Only selectivity is described in CCs.Possibility of back-conversion is pointed out.
Xi,ii Both parameters are mentioned.Possibility of back-conversion is pointed out.iii
Carry-over More detailed description, similar to ICH.iv
Less detailed description.v
More detailed description, similar to EMA.iv
Sensitivity/ LLOQ
Only LLOQ. X, defined as LLOQ. Only sensitivity is referred, and it corresponds to the LLOQ.vi
Calibration curve
Blank sample, zero sample, at least 6 calibration levels in triplicate calibration standards, at least 3 calibration curves should be reported.
Zero and non-zero calibrators, at least 6 non-zero calibration levels.
Blank sample, zero sample, at least 6 calibration levels in triplicate calibration standards, at least 3 calibration curves should be reported.
Accuracy Fresh calibrators are suggested.vii
Accuracy=Trueness.Fresh calibrators are suggested.
Fresh calibrators are suggested.vii
Precision Xvii X Xvii
QC samples LLOQ, low, medium and high QC samples.
LLOQ, low, “mid-range” and “high range”.viii
LLOQ, low, medium and high QC samples.
Dilution integrity
X Referred as dilution effects.
X
Matrix effect Detailed process for CCs.Matrix factor.vii
Hemolyzed and hyperlipidemic matrix.
Detailed process for LBAs, not so much for CCs.
Detailed process for CCs.Hemolyzed and hyperlipidemic matrix.
i X means that the parameter(s) is (/are) found in the guideline.ii Both are described in the same subchapter.iii Parameters are described in different subchapter.iv It is mentioned in separate subchapter.v In the subchapter of selectivity and specificity.vi In glossary of the term, it is also referred as LLOQ.vii Provides the formula for the parameter.viii What is considered as “high” or “med” range is not described numerically.
[43]
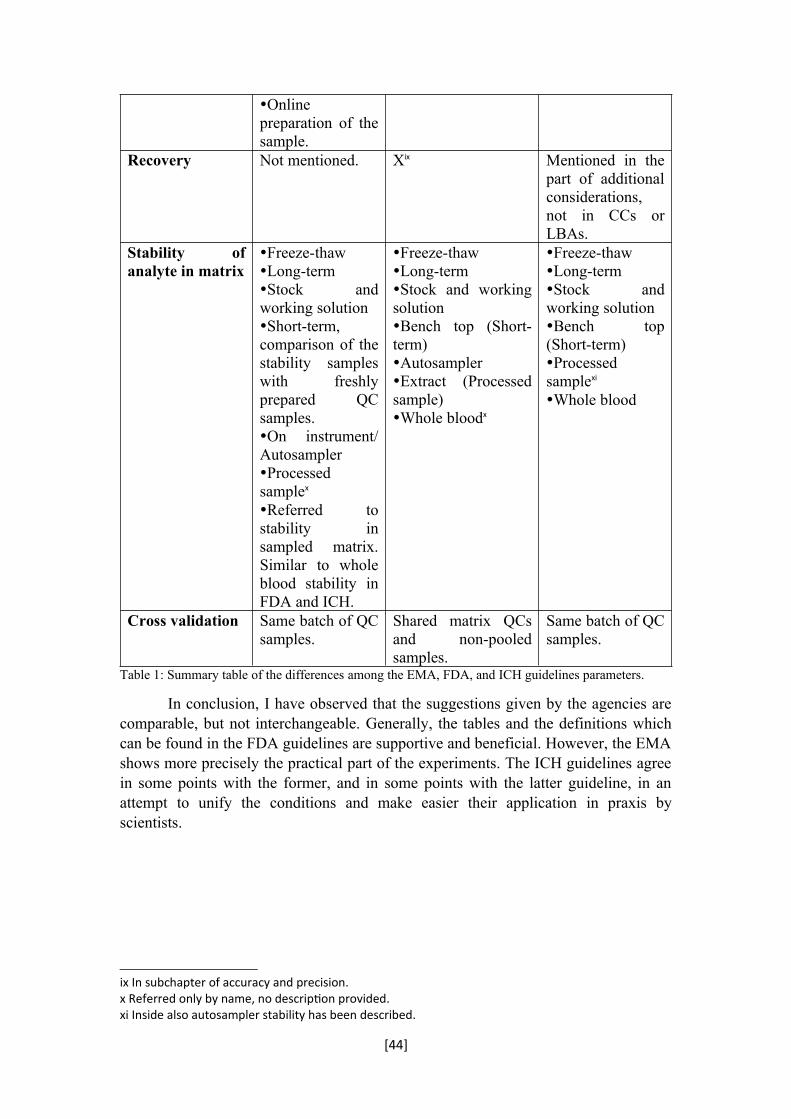
Online preparation of the sample.
Recovery Not mentioned. Xix Mentioned in the part of additional considerations, not in CCs or LBAs.
Stability of analyte in matrix
Freeze-thawLong-termStock and working solutionShort-term, comparison of the stability samples with freshly prepared QC samples.On instrument/ AutosamplerProcessed samplex
Referred to stability in sampled matrix. Similar to whole blood stability in FDA and ICH.
Freeze-thawLong-termStock and working solutionBench top (Short-term)AutosamplerExtract (Processed sample)Whole bloodx
Freeze-thawLong-termStock and working solutionBench top (Short-term)Processed samplexi
Whole blood
Cross validation Same batch of QC samples.
Shared matrix QCs and non-pooled samples.
Same batch of QC samples.
Table 1: Summary table of the differences among the EMA, FDA, and ICH guidelines parameters.
In conclusion, I have observed that the suggestions given by the agencies are comparable, but not interchangeable. Generally, the tables and the definitions which can be found in the FDA guidelines are supportive and beneficial. However, the EMA shows more precisely the practical part of the experiments. The ICH guidelines agree in some points with the former, and in some points with the latter guideline, in an attempt to unify the conditions and make easier their application in praxis by scientists.
ix In subchapter of accuracy and precision.x Referred only by name, no description provided.xi Inside also autosampler stability has been described.
[44]
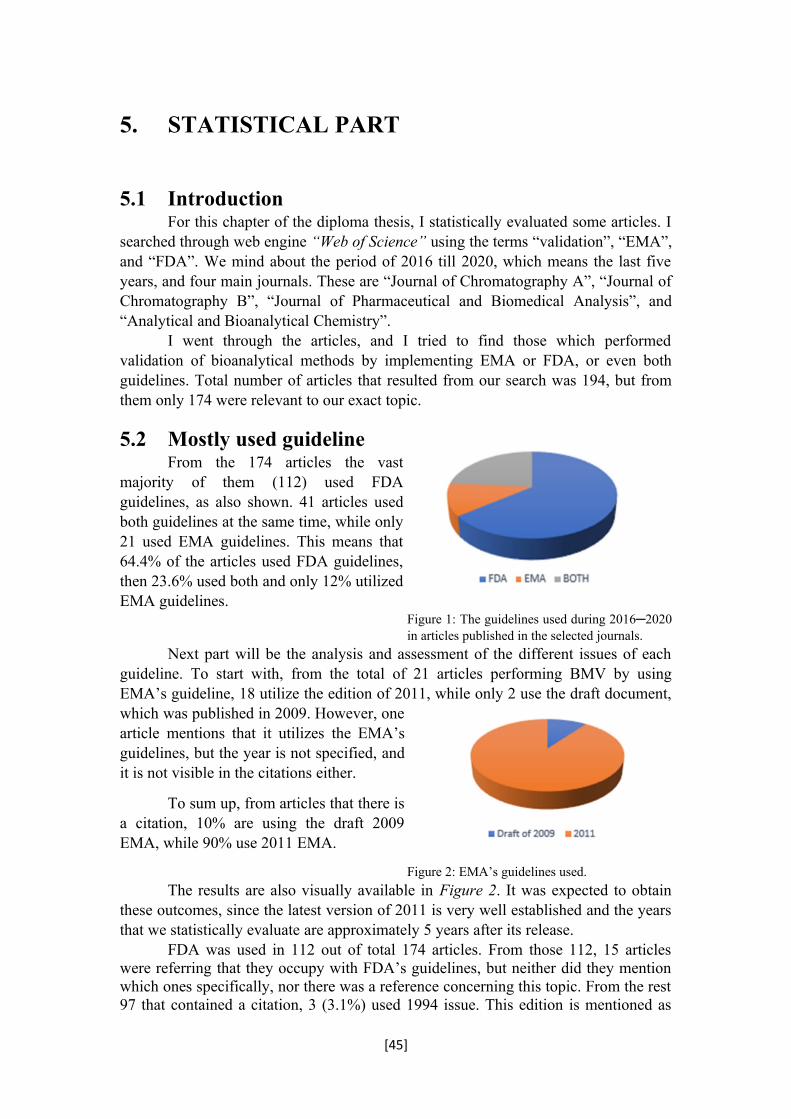
5. STATISTICAL PART
5.1 IntroductionFor this chapter of the diploma thesis, I statistically evaluated some articles. I
searched through web engine “Web of Science” using the terms “validation”, “EMA”, and “FDA”. We mind about the period of 2016 till 2020, which means the last five years, and four main journals. These are “Journal of Chromatography A”, “Journal of Chromatography B”, “Journal of Pharmaceutical and Biomedical Analysis”, and “Analytical and Bioanalytical Chemistry”.
I went through the articles, and I tried to find those which performed validation of bioanalytical methods by implementing EMA or FDA, or even both guidelines. Total number of articles that resulted from our search was 194, but from them only 174 were relevant to our exact topic.
5.2 Mostly used guidelineFrom the 174 articles the vast
majority of them (112) used FDAguidelines, as also shown. 41 articles usedboth guidelines at the same time, while only21 used EMA guidelines. This means that64.4% of the articles used FDA guidelines,then 23.6% used both and only 12% utilizedEMA guidelines.
Figure 1: The guidelines used during 2016─2020 in articles published in the selected journals.
Next part will be the analysis and assessment of the different issues of each guideline. To start with, from the total of 21 articles performing BMV by using EMA’s guideline, 18 utilize the edition of 2011, while only 2 use the draft document, which was published in 2009. However, onearticle mentions that it utilizes the EMA’sguidelines, but the year is not specified, andit is not visible in the citations either.
To sum up, from articles that there isa citation, 10% are using the draft 2009EMA, while 90% use 2011 EMA.
Figure 2: EMA’s guidelines used.
The results are also visually available in Figure 2. It was expected to obtain these outcomes, since the latest version of 2011 is very well established and the years that we statistically evaluate are approximately 5 years after its release.
FDA was used in 112 out of total 174 articles. From those 112, 15 articles were referring that they occupy with FDA’s guidelines, but neither did they mention which ones specifically, nor there was a reference concerning this topic. From the rest 97 that contained a citation, 3 (3.1%) used 1994 issue. This edition is mentioned as
[45]

“CDER Guideline on Validation of Chromatographic Methods, Reviewer Guidance of Chromatographic Methods, US FDA”. One article (1%) uses 1999 FDA guidelines, which are the draft published before the 2001. These 2001 guidelines were mostly used during these years, as also seen in Figure 3. 48 out of the 97 articles used them,
Figure 3: FDA’s guidelines used.
In total 41 articles used at the same time both guidelines. EMA’s 2009 and FDA’s 2001 were used together in one article (2.4%), while at the same time EMA’s 2009 and FDA’s 2013 guideline were used together also in one article (2.4%). Then EMA’s 2011 was used in all the other articles in combination with different editions of FDA guidelines. Together with FDA’s 2001 they were used in 18 articles (43.9%) and with FDA’s 2013 were used in 8 articles (19.5%). In addition, EMA’s 2011 together with FDA’s 2015 guidelines were used in one article (2.4%), as well as there
Figure 4: Articles that used both guidelines.
5.3 Assessment per journalIn Journal of Chromatography A (“J. Chromatogr. A”), during the period of
2016─2020, 10 articles were published. 6 of them (60%) used FDA, while 3 of them (30%) used EMA and the one remaining used both (10%).21,22,23,24,25,26,27,28,29,30
In Journal of Chromatography B (“J. Chromatogr. B”) totally 74 articles were issued. From them 51 (68.9%) used FDA, 15 (20.3%) used both, while 8 (10.8%) used EMA. 31,32,33,34,35,36,37,38,39,40,41,42,43,44,45,46,47,48,49,50,51,52,53,54,55,56,57,58,59,60,61,62,63,64,65,66,67,68,69,
70,71,72,73,74,75,76,77,78,79,80,81,82,83,84,85,86,87,88,89,90,91,92,93,94,95,96,97,98,99,100,101,102,103,104
In Journal of Pharmaceutical and Biomedical Analysis (“J. Pharm. Biomed. Anal.”) totally 83 articles were published. From them, 51 (61.4%) used FDA, 24 (28.9%) used both and 8 (9.6%) used EMA.105,106,107,108,109,110,111,112,113,114,115,116,117,118,119,120,
[46]
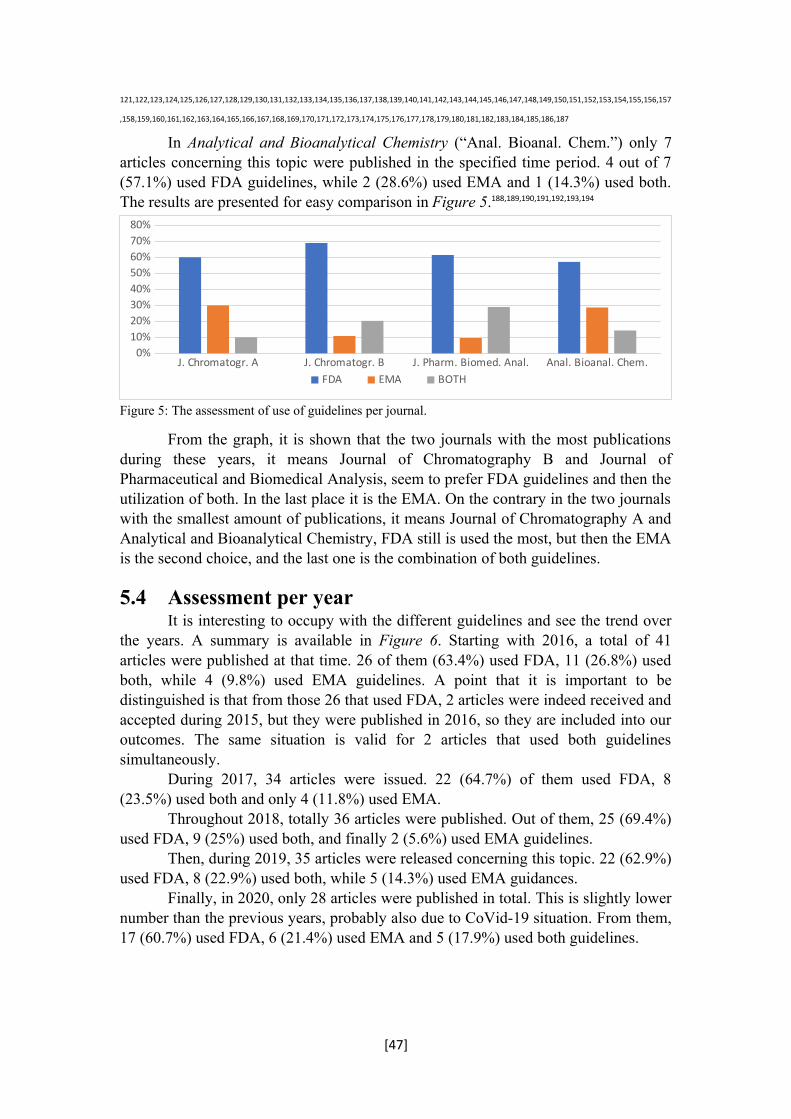
121,122,123,124,125,126,127,128,129,130,131,132,133,134,135,136,137,138,139,140,141,142,143,144,145,146,147,148,149,150,151,152,153,154,155,156,157
,158,159,160,161,162,163,164,165,166,167,168,169,170,171,172,173,174,175,176,177,178,179,180,181,182,183,184,185,186,187
In Analytical and Bioanalytical Chemistry (“Anal. Bioanal. Chem.”) only 7 articles concerning this topic were published in the specified time period. 4 out of 7 (57.1%) used FDA guidelines, while 2 (28.6%) used EMA and 1 (14.3%) used both. The results are presented for easy comparison in Figure 5.188,189,190,191,192,193,194
Figure 5: The assessment of use of guidelines per journal.
From the graph, it is shown that the two journals with the most publications during these years, it means Journal of Chromatography B and Journal of Pharmaceutical and Biomedical Analysis, seem to prefer FDA guidelines and then the utilization of both. In the last place it is the EMA. On the contrary in the two journals with the smallest amount of publications, it means Journal of Chromatography A and Analytical and Bioanalytical Chemistry, FDA still is used the most, but then the EMA is the second choice, and the last one is the combination of both guidelines.
5.4 Assessment per yearIt is interesting to occupy with the different guidelines and see the trend over
the years. A summary is available in Figure 6. Starting with 2016, a total of 41 articles were published at that time. 26 of them (63.4%) used FDA, 11 (26.8%) used both, while 4 (9.8%) used EMA guidelines. A point that it is important to be distinguished is that from those 26 that used FDA, 2 articles were indeed received and accepted during 2015, but they were published in 2016, so they are included into our outcomes. The same situation is valid for 2 articles that used both guidelines simultaneously.
During 2017, 34 articles were issued. 22 (64.7%) of them used FDA, 8 (23.5%) used both and only 4 (11.8%) used EMA.
Throughout 2018, totally 36 articles were published. Out of them, 25 (69.4%) used FDA, 9 (25%) used both, and finally 2 (5.6%) used EMA guidelines.
Then, during 2019, 35 articles were released concerning this topic. 22 (62.9%) used FDA, 8 (22.9%) used both, while 5 (14.3%) used EMA guidances.
Finally, in 2020, only 28 articles were published in total. This is slightly lower number than the previous years, probably also due to CoVid-19 situation. From them, 17 (60.7%) used FDA, 6 (21.4%) used EMA and 5 (17.9%) used both guidelines.
[47]
J. Chromatogr. A J. Chromatogr. B J. Pharm. Biomed. Anal. Anal. Bioanal. Chem.0%
10%20%30%40%50%60%70%80%
FDA EMA BOTH
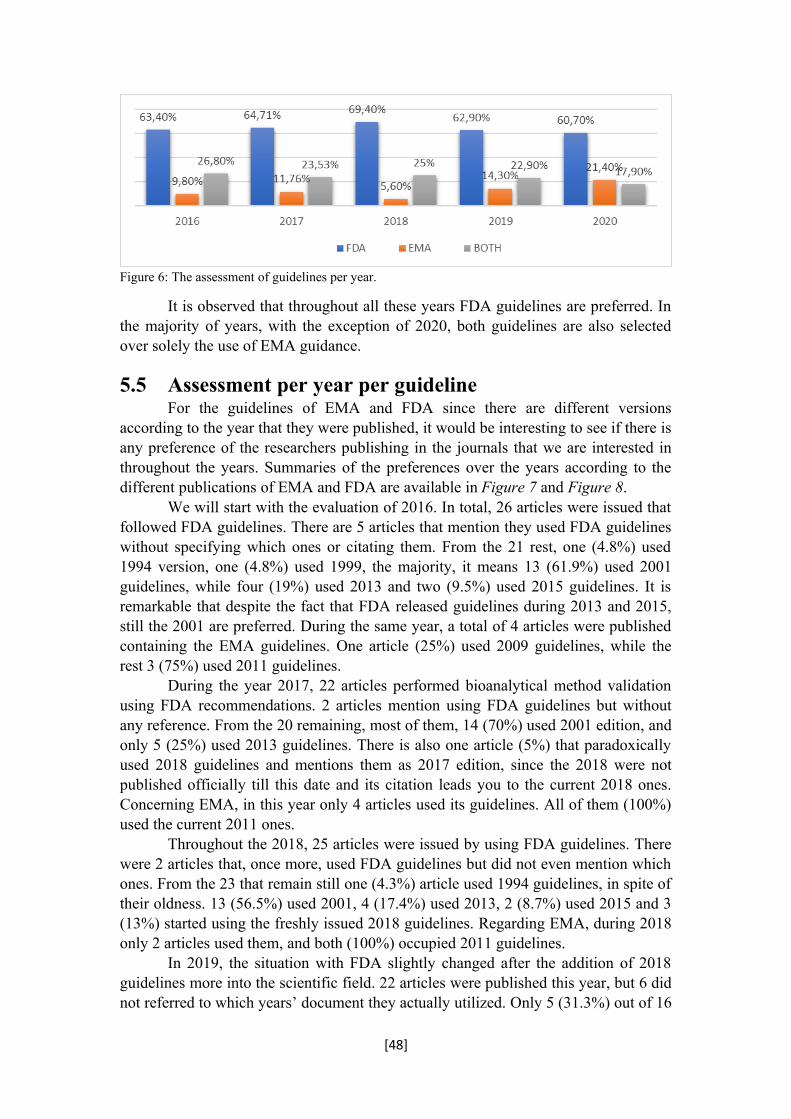
Figure 6: The assessment of guidelines per year.
It is observed that throughout all these years FDA guidelines are preferred. In the majority of years, with the exception of 2020, both guidelines are also selected over solely the use of EMA guidance.
5.5 Assessment per year per guidelineFor the guidelines of EMA and FDA since there are different versions
according to the year that they were published, it would be interesting to see if there is any preference of the researchers publishing in the journals that we are interested in throughout the years. Summaries of the preferences over the years according to the different publications of EMA and FDA are available in Figure 7 and Figure 8.
We will start with the evaluation of 2016. In total, 26 articles were issued that followed FDA guidelines. There are 5 articles that mention they used FDA guidelines without specifying which ones or citating them. From the 21 rest, one (4.8%) used 1994 version, one (4.8%) used 1999, the majority, it means 13 (61.9%) used 2001 guidelines, while four (19%) used 2013 and two (9.5%) used 2015 guidelines. It is remarkable that despite the fact that FDA released guidelines during 2013 and 2015, still the 2001 are preferred. During the same year, a total of 4 articles were published containing the EMA guidelines. One article (25%) used 2009 guidelines, while the rest 3 (75%) used 2011 guidelines.
During the year 2017, 22 articles performed bioanalytical method validation using FDA recommendations. 2 articles mention using FDA guidelines but without any reference. From the 20 remaining, most of them, 14 (70%) used 2001 edition, and only 5 (25%) used 2013 guidelines. There is also one article (5%) that paradoxically used 2018 guidelines and mentions them as 2017 edition, since the 2018 were not published officially till this date and its citation leads you to the current 2018 ones. Concerning EMA, in this year only 4 articles used its guidelines. All of them (100%) used the current 2011 ones.
Throughout the 2018, 25 articles were issued by using FDA guidelines. There were 2 articles that, once more, used FDA guidelines but did not even mention which ones. From the 23 that remain still one (4.3%) article used 1994 guidelines, in spite of their oldness. 13 (56.5%) used 2001, 4 (17.4%) used 2013, 2 (8.7%) used 2015 and 3 (13%) started using the freshly issued 2018 guidelines. Regarding EMA, during 2018 only 2 articles used them, and both (100%) occupied 2011 guidelines.
In 2019, the situation with FDA slightly changed after the addition of 2018 guidelines more into the scientific field. 22 articles were published this year, but 6 did not referred to which years’ document they actually utilized. Only 5 (31.3%) out of 16
[48]

used 2001 edition, 2 (12.5%) used 2013, while 9 (56.3%) chose to perform BMV with the newest guidelines. For the EMA, there was one article (20%) out of 5 that used 2009 guidelines, while the rest 4 (80%) used the 2011 ones.
During 2020, totally 17 articles were published by using FDA’s guidelines for BMV. One article (5.9%) used 1994 guidelines, 3 articles (17.6%) used 2001 guidelines, one article (5.9%) used 2013 and the majority, it means 12 articles (70.6%) used 2018 guidelines. For the EMA, totally 6 articles were published. One did not contain any reference, while from the rest 5 that did contain, all of them (100%) use 2011 guideline.
Figure 7: EMA’s guidelines and its versions (draft of 2009, and official guideline of 2011) over the years 2016-2020.
Figure 8: FDA’s guidelines and its versions (1994, 1999, 2001, 2013, 2015, 2018) over the years
2016─2020. So, from the FDA graph it is obvious that while 2001 guidelines were
generally preferred, after the publication of the 2018 ones they became dominant as guidelines.
The fact that generally the FDA guidelines are preferred over the EMA guidelines could possibly be because the FDA guidelines were the first ones to be published, and for approximately 17 years, the EMA has not published its official guideline for BMV. Another possible reason might be the understandable definitions which are provided for the user in the end of the document, in part of glossary of the FDA. The EMA has also a part for definitions in the end of its document, but not so many terms are mentioned, as in the case of the FDA. Finally, this preference towards FDA guidelines might be because of the big number of drug candidates that would like to apply for registration in the FDA, so they must fulfill its requirements.
[49]
2 0 1 6 2 0 1 7 2 0 1 8 2 0 1 9 2 0 2 0
0,04
8
0
0,04
3
0
0,05
9
0,04
8
0 0 0 0
61,9
0% 70,0
0%
56,5
0%
31,3
0%
17,6
0%
19,0
0%
25,0
0%
17,4
0%
12,5
0%
5,90
%
0,09
5
0
0,08
7
0 00,00
%
5,00
% 13,0
0%
56,3
0%
70,6
0%
1994 1999 2001 2013 2015 2018

6. CONCLUSION
On this basis, we conclude that until now the FDA guidelines do not contain the acceptance criteria which are needed for every parameter in the main body of the text. However, criteria are presented all together in a table. On the other hand, the EMA has a deficiency in some specific parameters, like recovery. Each time that validation of bioanalytical methods is performed, the latest version of guidelines should be used. However, the problem is that a unified and comprehensive guideline which will be adopted by every regulatory agency is not available. Nevertheless, it has already started a way of searching some common routes for communication and sharing ideas between the EMA and FDA, and this is the proof of the importance of harmonization of guidelines. This should be the target for the regulatory authorities, in order to help the companies, since most of them prefer to apply their drug candidates in many different authorities around the world and they should satisfy the necessary criteria. We should wish that the ICH will finally bring the globalization among the guidelines, so as to avoid all the misperceptions and uncertainties. This constitutes an interesting topic for future work.
As far as the statistical part is concerned, the present findings confirm that in Journals of Chromatography A and B, Journal of Pharmaceutical and Biomedical Analysis, and Analytical and Bioanalytical Chemistry, during the years 2016─2020 the FDA guidelines are preferred over the use of both or the single use of EMA guidelines.
[50]
7. REFERENCES
1 JORGENSEN, M.; KALL, M. A. Regulated bioanalysis and guidelines. In: HANSEN, S. H.; PEDERSEN-BJERGAARD S. Bioanalysis of Pharmaceuticals: Sample Preparation, Separation Techniques, and Mass Spectrometry, 1st Ed., John Wiley & Sons, Ltd, Oslo and Copenhagen, 2015, 283─287. ISBN 97811187168162 HUGHES, J.; REES, S.; KALINDJIAN, S.; PHILPOTT, K. Principles of early drug discovery. Br. J. Pharmacol., 2011, 162(6), 1239–1249.3 MENG, M.; BENNETT, P. K. Method development, validation, and sample analysis for regulated quantitative bioanalysis using LC-MS/MS. In: XU, Q. A.; MADDEN, T. L. LC-MS in Drug Bioanalysis, 1st Ed., Springer Science+Business Media, LLC, Houston, 2012, 34. ISBN 978-1-4614-3827-44 ARNOLD, M. E., et al. Current regulations for bioanalytical method validations. In: LI, W.; ZHANG, J.; TSE, F. L. S. Handbook of LC-MS Bioanalysis. Best Practices, Experimental Protocols, and Regulations, 1st Ed., John Wiley & Sons, Inc., New Jersey, 2013, 39─41. ISBN 97811181592485 SHAH, V. P.; ROCCI JR., M. L.; ROSE, M. J.; SAILSTAD, J. M. The history of Bioanalytical Method Validation and Regulation: Evolution of a Guidance Document on Bioanalytical Methods Validation. AAPS J., 2007, 9(1), E43─E47.6 KOLLIPARA, S.; BENDE, G.; AGARWAL, N.; VARSHNEY, B.; PALIWAL, J. International Guidelines for Bioanalytical Method Validation: A Comparison and Discussion on Current Scenario. Chromatographia, 2011, 73, 201─217.7 THWAY, T. M.; ESCHENBERG, M.; CALAMBA, D.; MACARAEG, C.; MA, M.; DESILVA, B. Assessment of Incurred Sample Reanalysis for Macromolecules to Evaluate Bioanalytical Method Robustness: Effects from Imprecision. AAPS J., 2011, 13(2), 291─298.8 GAROFOLO, F.; MICHON, J.; LECLAIRE, V.; BOOTH, B.; LOWES, S.; VISWANATHAN, Ct.; WELINK, J.; HAIDAR, S.; TEIXEIRA, L. D. S.; TANG, D.; DESILVA, B. Conference Report: US FDA/EMA harmonization of their bioanalytical guidance/guideline and activities of Global Bioanalytical Consortium. Bioanalysis, 2012, 4(3), 231─236.9 KADIAN, N.; RAJU, K. S. R.; RASHID, M.; MALIK, M. Y.; TANEJA, I.; WAHAJUDDIN, M. Comparative assessment of bioanalytical method validation guidelines for pharmaceutical industry. J. Pharm. Biomed. Anal., 2016, 126, 83─97.10 CROWTHER, J. B. Validation of pharmaceutical test methods. In: AHUJA, S.; SCYPINSKI, S. Handbook of Modern Pharmaceutical Analysis, Vol. 3. 1st Ed., Academic Press, San Diego, 2001, 415─416. ISBN 978012045555311 ERIC, J. W. Perspectives on the draft ICH-M10 guidance: an interview with Eric J Woolf. Bioanalysis, 2019, 11(15), 1387–1388.12 SWARTZ, M. Method validation. In: SNYDER, L. R.; KIRKLAND, J. J.; DOLAN J. W. Introduction to Modern Liquid Chromatography, 3rd Ed., John Wiley & Sons, Inc., New Jersey, 2010, 532─542. ISBN 978-0-470-16754-013 SOP 12: Validation of Bioanalytical Methods. Oncol. Res. Treat., 2003, 26(6), 52–55.14 European Medicines Agency, Guideline on bioanalytical method validation, 2011. Available at: https://www.ema.europa.eu/en/documents/scientific-guideline/guideline-bioanalytical-method-validation_en.pdf :Accessed at 02/09/2021.15 U.S. Food and Drug Administration, Bioanalytical Method Validation, Guidance for Industry, 2018. Available at: https://www.fda.gov/files/drugs/published/Bioanalytical-Method-Validation-Guidance-for-Industry.pdf :Accessed at 02/09/2021.16 International Council for Harmonisation, Bioanalytical Method Validation M10, Work Plan, 2022. Available at: https://database.ich.org/sites/default/files/M10_EWG%20WorkPlan_2022_0205.pdf :Accessed at 03/05/2022. 17 International Council for Harmonisation, Bioanalytical Method Validation M10, Draft Guideline, 2019. Available at: https://database.ich.org/sites/default/files/M10_EWG_Draft_Guideline.pdf :Accessed at 02/09/2021.18 KING, K.; LI, P.; PIETRASIEWICZ, A.; GOLDSTEIN, S. Perspectives on updates, clarifications and controversies in chromatographic assay guidance for bioanalytical method validation from major regulatory agencies and organizations. Biomed. Chromatogr., 2021, 35, 1─8.19 SMITH, G. Bioanalytical method validation: notable points in the 2009 draft EMA Guideline and differences with the 2001 FDA Guidance. Bioanalysis, 2010, 2(5), 929─935.20 KAZA, M.; KARAŹNIEWICZ-ŁADA, M.; KOSICKA, K.; SIEMIĄTKOWSKA, A.; RUDZKI, P. J. Bioanalytical method validation: new FDA guidance vs. EMA guideline. Better or worse? J. Pharm. Biomed. Anal., 2019, 165, 381─385.21 HOFSTETTER, R. K.; HASAN, M.; FASSAUER, G. M.; BOCK, C.; SURUR, A. S.; BEHNISCH, S.; GRATHWOL, C. W.; POTLITZ, F.; OERGEL, T.; SIEGMUND, W.; LINK, A. Simultaneous quantification of acidic and basic flupirtine metabolites by supercritical fluid chromatography according to European Medicines Agency validation. J. Chromatogr. A, 2019, 1603, 338–347.
22 ANDRI, B.; DISPAS, A.; KLINKENBERG, R.; STREEL, B.; MARINI, R. D.; ZIÉMONS, E.; HUBERT, P. Is supercritical fluid chromatography hyphenated to mass spectrometry suitable for the quality control of vitamin D3 oily formulations? J. Chromatogr. A, 2017, 1515, 209–217.23 FOROUGH, M.; FARHADI, K.; EYSHI, A.; MOLAEI, R.; KHALILI, H.; JAVAN KOUZEGARAN, V.; MATIN, A. A. Rapid ionic liquid-supported nano-hybrid composite reinforced hollow-fiber electromembrane extraction followed by field-amplified sample injection-capillary electrophoresis: An effective approach for extraction and quantification of Imatinib mesylate in h. J. Chromatogr. A, 2017, 1516, 21–34.24 MATYSIK, S.; LIEBISCH, G. Quantification of steroid hormones in human serum by liquid chromatography-high resolution tandem mass spectrometry. J. Chromatogr. A, 2017, 1526, 112–118.
25 SLOBODCHIKOVA, I.; VUCKOVIC, D. Liquid chromatography – high resolution mass spectrometry method for monitoring of 17 mycotoxins in human plasma for exposure studies. J. Chromatogr. A, 2018, 1548, 51–63.

26 GODAGE, N. H.; CUDJOE, E.; NEUPANE, R.; BODDU, S. H.; BOLLA, P. K.; RENUKUNTLA, J.; GIONFRIDDO, E. Biocompatible SPME fibers for direct monitoring of nicotine and its metabolites at ultra trace concentration in rabbit plasma following the application of smoking cessation formulations. J. Chromatogr. A, 2020, 1626.
27 RAMEZANI, A. M.; AHMADI, R.; ABSALAN, G. Designing a sustainable mobile phase composition for melamine monitoring in milk samples based on micellar liquid chromatography and natural deep eutectic solvent. J. Chromatogr. A, 2020, 1610.
28 EL AMRANI, M.; VAN DEN BROEK, M. P. H.; GÖBEL, C.; VAN MAARSEVEEN, E. M. Quantification of active infliximab in human serum with liquid chromatography–tandem mass spectrometry using a tumor necrosis factor alpha -based pre-analytical sample purification and a stable isotopic labeled infliximab bio-similar as internal standard. J. Chromatogr. A, 2016, 1454, 42–48.
29 TOMAI, P.; MARTINELLI, A.; GASPERI, T.; BIANCHI, M.; PURCARO, V.; TEOFILI, L.; PAPACCI, P.; CORI, M. S.; VENTO, G.; CURINI, R.; FANALI, S.; GENTILI, A. Rotating-disc micro-solid phase extraction of F2-isoprostanes from maternal and cord plasma by using oxidized buckypaper as sorbent membrane. J. Chromatogr. A, 2019, 1586, 30–39.
30 RAGEH, A. H.; ABDEL-AAL, F. A. M.; PYELL, U. Optimization of a sensitive and robust strategy for micellar electrokinetic chromatographic analysis of sofosbuvir in combination with its co-formulated hepatitis C antiviral drugs. J. Chromatogr. A, 2020, 1616.
31 BRUIN, M.A.C.; DE VRIES, N.; LUCAS, L.; ROSING, H.; HUITEMA, A. D. R.; BEIJNEN, J. H. Development and validation of an integrated LC-MS/MS assay for therapeutic drug monitoring of five PARP-inhibitors. J. Chromatogr. B: Anal. Technol. Biomed. Life Sci., 2020, 1138.32 SHAIK, A. N.; ALTOMARE, D. A.; LESKO, L. J.; TRAME, M. N. Development and validation of a LC–MS/MS assay for quantification of cisplatin in rat plasma and urine. J. Chromatogr. B: Anal. Technol. Biomed. Life Sci., 2017, 1046, 243–249.
33 GU, G.; BLACK, M.; COOKSON, C.; FIORELLA, A.; LI, Y.; GORMAN, S. H.; BAKHTIAR, R. Validation of an LC-MS/MS method for simultaneous quantification of venlafaxine and its five metabolites in rat plasma and its application in a pharmacokinetic study. J. Chromatogr. B: Anal. Technol. Biomed. Life Sci., 2018, 1087-1088, 29–35.
34 ILLAMOLA, S. M.; ECHAABI, A. K.; MAZERON, C.; DESHAYES, S.; LORIOT, M. A.; PALLET, N. Development and validation of a UPLC-UV method for the quantification of thiopurine methyltransferase enzyme activity in human erythrocytes. J. Chromatogr. B: Anal. Technol. Biomed. Life Sci., 2019, 1113, 91–97.
35 ROOSENDAAL, J.; WANG, K.; ROSING, H.; LUCAS, L.; GEBRETENSAE, A.; OGANESIAN, A.; SCHELLENS, J. H. M.; BEIJNEN, J. H.; LIN, Z. Development and validation of LC-MS/MS methods for the quantification of the novel anticancer agent guadecitabine and its active metabolite β-decitabine in human plasma, whole blood and urine. J. Chromatogr. B: Anal. Technol. Biomed. Life Sci., 2019, 1109, 132–141.
36 BRUIN, M. A. C.; ROSING, H.; LUCAS, L.; WANG, J.; HUITEMA, A. D. R.; SCHINKEL, A. H.; BEIJNEN, J. H. Development and validation of an LC-MS/MS method with a broad linear dynamic range for the quantification of tivozanib in human and mouse plasma, mouse tissue homogenates, and culture medium. J. Chromatogr. B: Anal. Technol. Biomed. Life Sci., 2019, 1125.
37 MAGOTRA, A.; SHARMA, A.; GUPTA, A. P.; WAZIR, P.; SHARMA, S.; SINGH, P. P.; TIKOO, M. K.; VISHWAKARMA, R. A.; SINGH, G. NANDI, U. Development and validation of a highly sensitive LC-ESI-MS/MS method for estimation of IIIM-MCD-211, a novel nitrofuranyl methyl piperazine derivative with potential activity against tuberculosis: Application to drug development. J. Chromatogr. B: Anal. Technol. Biomed. Life Sci., 2017, 1060, 200–206.
38 ANDRIES, A.; DE RECHTER, S.; JANSSENS, P.; MEKAHLI, D.; VAN SCHEPDAEL, A. Simultaneous determination of allantoin and adenosine in human urine using liquid chromatography – UV detection. J. Chromatogr. B: Anal. Technol. Biomed. Life Sci., 2018, 1096, 201–207.
39 LEONOV, K. A.; VISHENKOVA, D. A.; LIPSKIKH, O. I.; PUSTOVOYTOV, A. V.; BAKIBAEV, A. A. Development and validation of HPLC-UV method for quantitation of a new antithrombotic drug in rat plasma and its application to pharmacokinetic studies. J. Chromatogr. B: Anal. Technol. Biomed. Life Sci., 2020, 1160.
40 TSIKAS, D. Bioanalytical method validation of endogenous substances according to guidelines by the FDA and other organizations: Basic need to specify concentration ranges. J. Chromatogr. B: Anal. Technol. Biomed. Life Sci., 2018, 1093-1094, 80–81.
41 ROGACHEV, A. D.; YAROVAYA, O. I.; ANKOV, S. V.; KHVOSTOV, M. V.; TOLSTIKOVA, T. G.; POKROVSKY, A. G.; SALAKHUTDINOV, N. F. Development and validation of ultrafast LC–MS/MS method for quantification of anti-influenza agent camphecene in whole rat blood using dried blood spots and its application to pharmacokinetic studies. J. Chromatogr. B: Anal. Technol. Biomed. Life Sci., 2016, 1036-1037, 136–141.
42 MOLINARO, M.; PELLEGRINI, C.; CATTADORI, B.; DE GREGORI, S. Development and validation of a combined enzymatic-digestion/mass spectrometry assay for Tacrolimus quantitation in cardiac biopsies. J. Chromatogr. B: Anal. Technol. Biomed. Life Sci., 2020, 1152.
43 MILLER, J. H.; DANIELSON, T.; PITHAWALLA, Y. B.; BROWN, A. P.; WILKINSON, C.; WAGNER, K.; ALDEEK, F. Method development and validation of dissolution testing for nicotine release from smokeless tobacco products using flow-through cell apparatus and UPLC-PDA. J. Chromatogr. B: Anal. Technol. Biomed. Life Sci., 2020, 1141.
44 REZK, M. R.; BENDAS, E. R.; BASALIOUS, E. B.; KARIM, I. A. Quantification of sofosbuvir and ledipasvir in human plasma by UPLC–MS/MS method: Application to fasting and fed bioequivalence studies. J. Chromatogr. B: Anal. Technol. Biomed. Life Sci., 2016, 1028, 63–70.
45 RAĆKOWSKA, E.; BOBROWSKA-KORCZAK, B.; GIEBUŁTOWICZ, J. Development and validation of a rapid LC–MS/MS method for determination of methylated nucleosides and nucleobases in urine. J. Chromatogr. B: Anal. Technol. Biomed. Life Sci., 2019, 1128.
46 MANGLA, B.; ALAM, O.; RUB, R. A.; IQBAL, M.; SINGH, A.; PATEL, K. S.; KOHLI, K. Development and validation of a high throughput bioanalytical UPLC-MS/MS method for simultaneous determination of tamoxifen and sulphoraphane in rat plasma: Application to an oral pharmacokinetic study. J. Chromatogr. B: Anal. Technol. Biomed. Life Sci., 2020, 1152.
47 BOBRICH, M.; SCHWARZ, R.; RAMER, R.; BORCHERT, P.; HINZ, B. A simple LC-MS/MS method for the simultaneous quantification of endocannabinoids in biological samples. J. Chromatogr. B: Anal. Technol. Biomed. Life Sci., 2020, 1161.
48 ZHENG, X.; JONGEDIJK, E. M.; HU, Y.; KUHLIN, J.; ZHENG, R.; NIWARD, K.; PAUES, J.; XU, B.; DAVIES FORSMAN, L.; SCHÖN, T.; BRUCHFELD, J.; ALFFENAAR, J. C. Development and validation of a simple LC-MS/MS method for simultaneous determination of moxifloxacin, levofloxacin, prothionamide, pyrazinamide and ethambutol in human plasma. J. Chromatogr. B: Anal. Technol. Biomed. Life Sci., 2020, 1158.
49 EL YAZBI, F. A.; HASSAN, E. M.; KHAMIS, E. F.; RAGAB, M. A. A.; HAMDY, M. M. A. Stability indicating HPLC-DAD method for analysis of Ketorolac binary and ternary mixtures in eye drops: Quantitative analysis in rabbit aqueous humor. J. Chromatogr. B: Anal. Technol. Biomed. Life Sci., 2017, 1068–1069, 218–225.
50 MARTIAL, L. C.; VAN DEN HOMBERGH, E.; TUMP, C.; HALMINGH, O.; BURGER, D. M.; VAN MAARSEVEEN, E. M.; BRÜGGEMANN, R. J.; AARNOUTSE, R. E. Manual punch versus automated flow-through sample desorption for dried blood spot LC-MS/MS analysis of voriconazole. J. Chromatogr. B: Anal. Technol. Biomed. Life Sci., 2018, 1089, 16–23.
51 . AL-GHOBASHY, M. A.; HASSAN, S. A.; ABDELAZIZ, D. H.; ELHOSSEINY, N. M.; SABRY, N. A.; ATTIA, A. S.; EL-SAYED, M. H. Development and validation of LC–MS/MS assay for the simultaneous determination of methotrexate, 6-mercaptopurine and its active metabolite 6-thioguanine in plasma of children with acute lymphoblastic leukemia: Correlation with genetic polymorphism. J. Chromatogr. B: Anal. Technol. Biomed. Life Sci., 2016, 1038, 88–94.
52 FAQUETI, L. G.; DA SILVA, L. A. L.; MOREIRA, G. S. G.; HONORATO, L. A.; DOS SANTOS, A. R. S.; DALLA COSTA, T.; BIAVATTI, M. W. Simple and fast UPLC-MS method for quantifying the anti-inflammatory candidate 5′-methoxynobiletin in rat plasma: Validation and application in a preliminary pharmacokinetic study. J. Chromatogr. B: Anal. Technol. Biomed. Life Sci., 2020, 1158.53 SUHR, A. C.; BRUEGEL, M.; MAIER, B.; HOLDT, L. M.; KLEINHEMPEL, A.; TEUPSER, D.; GRIMM, S. H.; VOGESER, M. Ferromagnetic particles as a rapid and robust sample preparation for the absolute quantification of seven eicosanoids in human plasma by UHPLC–MS/MS. J. Chromatogr. B: Anal. Technol. Biomed. Life Sci., 2016, 1022, 173–182.54 LIU, L.; CUI, Z.; DENG, Y.; DEAN, B.; HOP, C. E. C. A.; LIANG, X. Surrogate analyte approach for quantitation of endogenous NAD+ in human acidified blood samples using liquid chromatography coupled with electrospray ionization tandem mass spectrometry. J. Chromatogr. B: Anal. Technol. Biomed. Life Sci., 2016, 1011, 69–76.
55 HASSIB, S. T.; ELKADY, E. F.; SAYED, R. M. Simultaneous determination of timolol maleate in combination with some other anti-glaucoma drugs in rabbit aqueous humor by high performance liquid chromatography–tandem mass spectroscopy. J. Chromatogr. B: Anal. Technol. Biomed. Life Sci., 2016, 1022, 109–117.
56 CANZI, E. F.; LOPES, B. R.; ROBELDO, T.; BORRA, R.; DA SILVA, M. F. G. F.; OLIVEIRA, R. V.; MAIA, B. H. N. S.; CASS, Q. B. Prostaglandins E2 and F2α levels in human menstrual fluid by online Solid Phase Extraction coupled to Liquid Chromatography tandem Mass Spectrometry (SPE-LC-MS/MS). J. Chromatogr. B: Anal. Technol. Biomed. Life Sci., 2019, 1109, 60–66.
57 LIANG, X.; VAN PARYS, M.; DING, X.; ZENG, N.; BI, L.; DORSHORT, D.; MCKNIGHT, J.; MILANOWSKI, D.; MAO, J.; CHEN, Y.; WARE, J. A.; DEAN, B.; HOP, C. E. C. A.; DENG, Y. Simultaneous determination of itraconazole, hydroxy itraconazole, keto itraconazole and N-desalkyl itraconazole concentration in human plasma using liquid chromatography with tandem mass spectrometry. J. Chromatogr. B: Anal. Technol. Biomed. Life Sci., 2016, 1020, 111–119.
58 LI, T.; HUANG, B.; LI, D.; ZHU, Y.; DING, L.; SHU, C. Development and validation of a specific and sensitive LC–MS/MS method for determination of eslicarbazepine in human plasma and its clinical pharmacokinetic study. J. Chromatogr. B: Anal. Technol. Biomed. Life Sci., 2019, 1112, 61–66.
59 PENCHALA, S. D.; FAWCETT, S.; ELSE, L.; EGAN, D.; AMARA, A.; ELLIOT, E.; CHALLENGER, E.; BACK, D.; BOFFITO, M.; KHOO, S. The development and application of a novel LC–MS/MS method for the measurement of Dolutegravir, Elvitegravir and Cobicistat in human plasma. J. Chromatogr. B: Anal. Technol. Biomed. Life Sci., 2016, 1027, 174–180.
60 NARAYANASAMY, S.; PILLI, N. R.; XU, L.; CHOCKALINGAM, A.; SHEA, K. I.; STEWART, S.; PATEL, V.; ROUSE, R.; MATTA, M. K. An alternating polarity switching assay for quantification of oxycodone and topiramate: An application of LC-MS/MS method in support to PK/PD study in rodents. J. Chromatogr. B: Anal. Technol. Biomed. Life Sci., 2019, 1118-1119, 93–100.
61 ZHAO, Y.; COUCHMAN, L.; KIPPER, K.; ARYA, R.; PATEL, J. P. A UHPLC-MS/MS method to simultaneously quantify apixaban, edoxaban and rivaroxaban in human plasma and breast milk: For emerging lactation studies. J. Chromatogr. B: Anal. Technol. Biomed. Life Sci., 2020, 1144.

62 ZHANG, Y.; WANG, Y.; ZHANG, K.; LEI, H.; TANG, Y.; ZHU, L. Development and validation of a rapid, robust and sensitive UPLC-QQQ-MS/MS method for simultaneous quantification of GSH metabolism in lung cancer cells. J. Chromatogr. B: Anal. Technol. Biomed. Life Sci., 2020, 1148.
63 MIRAGHAEI, S.; MOHAMMADI, B.; BABAEI, A.; KESHAVARZ, S.; BAHRAMI, G. Development and validation of a new HPLC-DAD method for quantification of sofosbuvir in human serum and its comparison with LC–MS/MS technique: Application to a bioequivalence study. J. Chromatogr. B: Anal. Technol. Biomed. Life Sci., 2017, 1063, 118–122.
64 YUN, C.; YIN, T.; SHATZER, K.; BURRIN, D. G.; CUI, L.; TU, Y.; HU, M. Determination of 7α-OH cholesterol by LC–MS/MS: Application in assessing the activity of CYP7A1 in cholestatic minipigs. J. Chromatogr. B: Anal. Technol. Biomed. Life Sci., 2016, 1025, 76–82.
65 ELKADY, E. F.; ABOELWAFA, A. A. Rapid bioanalytical LC-MS/MS method for the simultaneous determination of sofosbuvir and velpatasvir in human plasma-application to a pharmacokinetic study in Egyptian volunteers. J. Chromatogr. B: Anal. Technol. Biomed. Life Sci., 2018, 1102-1103, 116–124.
66 DECOSTERD, L. A.; MERCIER, T.; TERNON, B.; CRUCHON, S.; GUIGNARD, N.; LAHRICHI, S.; PESSE, B.; ROCHAT, B.; BURGER, R.; LAMOTH, F.; PAGANI, J.-L.; EGGIMANN, P.; CSAJKA, C.; CHOONG, E.; BUCLIN, T.; WIDMER, N.; ANDRÉ, P.; MARCHETTI, O. Validation and clinical application of a multiplex high performance liquid chromatography – tandem mass spectrometry assay for the monitoring of plasma concentrations of 12 antibiotics in patients with severe bacterial infections. J. Chromatogr. B: Anal. Technol. Biomed. Life Sci., 2020, 1157.
67 ELKINS, A. C.; DESEO, M. A.; ROCHFORT, S.; EZERNIEKS, V.; SPANGENBERG, G. Development of a validated method for the qualitative and quantitative analysis of cannabinoids in plant biomass and medicinal cannabis resin extracts obtained by super-critical fluid extraction. J. Chromatogr. B: Anal. Technol. Biomed. Life Sci., 2019, 1109, 76–83.
68 PETTERSSON BERGSTRAND, M.; HELANDER, A.; BECK, O. Development and application of a multi-component LC–MS/MS method for determination of designer benzodiazepines in urine. J. Chromatogr. B: Anal. Technol. Biomed. Life Sci., 2016, 1035, 104–110.
69 VAN SEYEN, M.; DE GRAAFF TEULEN, M. J. A.; VAN ERP, N. P.; BURGER, D. M. Quantification of second generation direct-acting antivirals daclatasvir, elbasvir, grazoprevir, ledipasvir, simeprevir, sofosbuvir and velpatasvir in human plasma by UPLC-MS/MS. J. Chromatogr. B: Anal. Technol. Biomed. Life Sci., 2019, 1110-1111, 15–24.
70 INDAPURKAR, A.; HARTMAN, N.; PATEL, V.; MATTA, M. K. Simultaneous UHPLC-MS/MS method of estradiol metabolites to support the evaluation of Phase-2 metabolic activity of induced pluripotent stem cell derived hepatocytes. J. Chromatogr. B: Anal. Technol. Biomed. Life Sci., 2019, 1126-1127.
71 NAKHLA, D. S.; HUSSEIN, L. A.; MAGDY, N.; ABDALLAH, I. A.; HASSAN, H. E. Precise simultaneous quantification of methadone and cocaine in rat serum and brain tissue samples following their successive i.p. administration. J. Chromatogr. B: Anal. Technol. Biomed. Life Sci., 2017, 1048, 19–29.
72 RATNATILAKA NA BHUKET, P.; NIWATTISAIWONG, N.; LIMPIKIRATI, P.; KHEMAWOOT, P.; TOWIWAT, P.; ONGPIPATTANAKUL, B.; ROJSITTHISAK, P. Simultaneous determination of curcumin diethyl disuccinate and its active metabolite curcumin in rat plasma by LC–MS/MS: Application of esterase inhibitors in the stabilization of an ester-containing prodrug. J. Chromatogr. B: Anal. Technol. Biomed. Life Sci., 2016, 1033-1034, 301–310.
73 BUSSY, U.; CHUNG-DAVIDSON, Y.-W.; LI, K.; FISSETTE, S. D.; BUCHINGER, E. G.; LI, W. A validated LC–MS/MS method for thyroid hormone determination in sea lamprey (Petromyzon marinus) plasma, gill, kidney and liver. J. Chromatogr. B: Anal. Technol. Biomed. Life Sci., 2017, 1041-1042, 77–84.
74 YI, Y.; REN, G.; ZHENG, M.; ZHAO, D.; LI, N.; CHEN, X.; LU, Y. Simultaneous determination of deuterated vortioxetine and its major metabolite in human plasma by UPLC-MS/MS and application to a pharmacokinetic study in healthy volunteers. J. Chromatogr. B: Anal. Technol. Biomed. Life Sci., 2020, 1138.75 RUB, R. A.; BEG, S.; KAZMI, I.; AFZAL, O.; ALMALKI, W. H.; ALGHAMDI, S.; AKHTER, S.; ALI, A.; AHMED, F. J. Systematic development of a bioanalytical UPLC-MS/MS method for estimation of risperidone and its active metabolite in long-acting microsphere formulation in rat plasma. J. Chromatogr. B: Anal. Technol. Biomed. Life Sci., 2020, 1160.76 YANG, B.; XU, Y.; WU, Y.; WU, H.; WANG, Y.; YUAN, L.; XIE, J.; LI, Y.; ZHANG, Y. Simultaneous determination of ten Aconitum alkaloids in rat tissues by UHPLCMS/MS and its application to a tissue distribution study on the compatibility of Heishunpian and Fritillariae thunbergii Bulbus. J. Chromatogr. B: Anal. Technol. Biomed. Life Sci., 2016, 1033-1034, 242–249.
77 XU, X.-M.; ZHANG, J.-S.; HUANG, B.-F.; HAN, J.-L.; CHEN, Q. Determination of ibotenic acid and muscimol in plasma by liquid chromatography-triple quadrupole mass spectrometry with bimolecular dansylation. J. Chromatogr. B: Anal. Technol. Biomed. Life Sci., 2020, 1146.
78 MIAO, Q.; BAI, Y.-J.; ZHANG, J.-L.; LI, Y.; SU, Z.-Z.; YAN, L.; WANG, L.-L.; ZOU, Y.-G. Highly sensitive and rapid determination of azathioprine metabolites in whole blood lysate by liquid chromatography–tandem mass spectrometry. J. Chromatogr. B: Anal. Technol. Biomed. Life Sci., 2020, 1136.
79 EL-KIMARY, E. I.; KHAMIS, E. F.; BELAL, S. F.; ABDEL MONEIM, M. M. Sensitive inexpensive chromatographic determination of an antimicrobial combination in human plasma and its pharmacokinetic application. J. Chromatogr. B: Anal. Technol. Biomed. Life Sci., 2018, 1097-1098, 94–100.
80 SONG, S.; ZHAO, D.; SUN, J.; MIAO, Q.; LIU, X.; WANG, Y.; ZHONG, L.; XU, M.; ZHANG, P. Development of a UPLC–MS/MS method for the determination of lomefloxacin in rabbit aqueous humor and its application to a pharmacokinetic study. J. Chromatogr. B: Anal. Technol. Biomed. Life Sci., 2016, 1033-1034, 187–192.
81 VAN DYK, M.; MINERS, J. O.; KICHENADASSE, G.; MCKINNON, R. A.; ROWLAND, A. A novel approach for the simultaneous quantification of 18 small molecule kinase inhibitors in human plasma: A platform for optimised KI dosing. J. Chromatogr. B: Anal. Technol. Biomed. Life Sci., 2016, 1033-1034, 17–26.
82 VÅRDAL, L.; ASKILDSEN, H.-M.; GJELSTAD, A.; ØIESTAD, E. L.; EDVARDSEN, H. M. E.; PEDERSEN-BJERGAARD, S. Parallel artificial liquid membrane extraction of new psychoactive substances in plasma and whole blood. J. Chromatogr. B: Anal. Technol. Biomed. Life Sci., 2017, 1048, 77–84.
83 KORANY, M. A.; MAHGOUB, H.; HAGGAG, R. S.; RAGAB, M. A. A.; ELMALLAH, O. A. Green gas chromatographic stability-indicating method for the determination of Lacosamide in tablets. Application to in-vivo human urine profiling. J. Chromatogr. B: Anal. Technol. Biomed. Life Sci., 2018, 1083, 75–85.
84 ABDALLAH, I. A.; HAMMELL, D. C.; STINCHCOMB, A. L.; HASSAN, H. E. A fully validated LC–MS/MS method for simultaneous determination of nicotine and its metabolite cotinine in human serum and its application to a pharmacokinetic study after using nicotine transdermal delivery systems with standard heat application in adult smokers. J. Chromatogr. B: Anal. Technol. Biomed. Life Sci., 2016, 1020, 67–77.
85 HOU, X.; DAI, X.; YANG, Y.; ZHANG, Y.; ZHONG, D.; CHEN, X. Simultaneous determination of imrecoxib and its two active metabolites in plasma of hepatic impairment patients by liquid chromatography-tandem mass spectrometry. J. Chromatogr. B: Anal. Technol. Biomed. Life Sci., 2019, 1122-1123, 58–63.
86 CARON, P.; TURCOTTE, V.; LÉVESQUE, E.; GUILLEMETTE, C. An LC-MS/MS method for quantification of abiraterone, its active metabolites D(4)-abiraterone (D4A) and 5α-abiraterone, and their inactive glucuronide derivatives. J. Chromatogr. B: Anal. Technol. Biomed. Life Sci., 2019, 1104. 249–255.
87 RASHID, M. M.; LEE, H.; JUNG, B. H. Metabolite identification and pharmacokinetic profiling of PP242, an ATP-competitive inhibitor of mTOR using ultra high-performance liquid chromatography and mass spectrometry. J. Chromatogr. B: Anal. Technol. Biomed. Life Sci., 2018, 1072, 244–251.
88 GEISSLER, M.; OELLIG, C.; MOSS, K.; SCHWACK, W.; HENKEL, M.; HAUSMANN, R. High-performance thin-layer chromatography (HPTLC) for the simultaneous quantification of the cyclic lipopeptides Surfactin, Iturin A and Fengycin in culture samples of Bacillus species. J. Chromatogr. B: Anal. Technol. Biomed. Life Sci., 2017, 1044-1045, 214–224.
89 POPOWICZ, N. D.; O'HALLORAN, S. J.; FITZGERALD, D.; LEE, Y. C. G.; JOYCE, D. A. A rapid, LC-MS/MS assay for quantification of piperacillin and tazobactam in human plasma and pleural fluid; application to a clinical pharmacokinetic study. J. Chromatogr. B: Anal. Technol. Biomed. Life Sci., 2018, 1081-1082, 58–66.
90 YOUNIS, S. E.; EL-NAHASS, S. A.; ELKHATIB, M. A. W.; SOLIMAN, S. A.; YOUSSEF, R. M. Gradient HPLC-DAD method for quantification of novel oral anticoagulant “Edoxaban” in plasma: Its selective determination in presence of sixteen co-administered drugs. J. Chromatogr. B: Anal. Technol. Biomed. Life Sci., 2020, 1160.
91 ZHENG, H.; QIU, F.; ZHAO, H.; CHEN, J.; WANG, L.; ZOU, H. Simultaneous determination of six bioactive saponins from Rhizoma Panacis Japonici in rat plasma by UHPLC-MS/MS: Application to a pharmacokinetic study. J. Chromatogr. B: Anal. Technol. Biomed. Life Sci., 2018, 1092, 199–206.
92 JI, B.; ZHAO, X.; YU, P.; MENG, L.; ZHAO, Y.; YU, Z. Simultaneous determination and pharmacokinetics of fourteen bioactive compounds in rat plasma by LC-ESI-MS/MS following intravenous injection of Gegen-Sanqi compatibility solution. J. Chromatogr. B: Anal. Technol. Biomed. Life Sci., 2017, 1068-1069, 164–172.
93 AHMED, S.; ATIA, N. N.; BAKR ALI, M. F. Ultrasound assisted dispersive liquid-liquid microextraction coupled with high performance liquid chromatography designated for bioavailability studies of felodipine combinations in rat plasma. J. Chromatogr. B: Anal. Technol. Biomed. Life Sci., 2017, 1046, 200–210.
94 WIJMA, R. A.; BAHMANY, S.; WILMS, E. B.; VAN GELDER, T.; MOUTON, J. W.; KOCH, B. C. P. A fast and sensitive LC–MS/MS method for the quantification of Fosfomycin in human urine and plasma using one sample preparation method and HILIC chromatography. J. Chromatogr. B: Anal. Technol. Biomed. Life Sci., 2017, 1061-1062, 263–269.
95 WANG, H.; BUSSY, U.; CHUNG-DAVIDSON, Y.-W.; LI, W. Ultra-performance liquid chromatography tandem mass spectrometry for simultaneous determination of natural steroid hormones in sea lamprey (Petromyzon marinus) plasma and tissues. J. Chromatogr. B: Anal. Technol. Biomed. Life Sci., 2016, 1009-1010, 170–178.
96 CHEN, G.; JIRJEES, F.; AL BAWAB, A.; MCELNAY, J. C. Quantification of amlodipine in dried blood spot samples by high performance liquid chromatography tandem mass spectrometry. J. Chromatogr. B: Anal. Technol. Biomed. Life Sci., 2018, 1072,
252–258.
97 VAN OVERMEIRE, I.; VRIJENS, K.; NAWROT, T.; VAN NIEUWENHUYSE, A.; VAN LOCO, J.; REYNS, T. Simultaneous determination of parabens, bisphenols and alkylphenols in human placenta by ultra-high performance liquid chromatography-tandem mass spectrometry. J. Chromatogr. B: Anal. Technol. Biomed. Life Sci., 2019, 1121, 96–102.
98 ROBIN, T.; SAINT-MARCOUX, F.; TOINON, D.; TAFZI, N.; MARQUET, P.; EL BALKHI, S. Automatic quantification of uracil and dihydrouracil in plasma. J. Chromatogr. B: Anal. Technol. Biomed. Life Sci., 2020, 1142.
99 CHHONKER, Y. S.; SLEIGHTHOLM, R. L.; LI, J.; OUPICKÝ, D.; MURRY, D. J. Simultaneous quantitation of hydroxychloroquine and its metabolites in mouse blood and tissues using LC–ESI–MS/MS: An application for pharmacokinetic studies. J. Chromatogr. B: Anal. Technol. Biomed. Life Sci., 2018, 1072, 320–327.
100 SHU, C.; ZENG, T.; GAO, S.; XIA, T.; HUANG, L.; ZHANG, F.; CHEN, W. LC–MS/MS method for simultaneous determination of thalidomide, lenalidomide, cyclophosphamide, bortezomib, dexamethasone and adriamycin in serum of multiple myeloma patients. J. Chromatogr. B: Anal. Technol. Biomed. Life Sci., 2016, 1028, 111–119.
101 PAN, L.-Y.; WANG, Y.-S.; LIU, X.-H.; WANG, N.; XU, W.; XIU, Y.-F. Pharmacokinetic comparison of five xanthones in rat plasma after oral administration of crude and processed Garcinia hanburyi extracts. J. Chromatogr. B: Anal. Technol. Biomed. Life Sci., 2019, 1126-1127.
102 WANG, Z.; ZHU, W.; GAO, M.; WU, C.; YANG, C.; YANG, J.; WU, G.; YANG, B.; KUANG, H. Simultaneous determination of cucurbitacin B and cucurbitacin E in rat plasma by UHPLC-MS/MS: A pharmacokinetics study after oral administration of cucurbitacin tablets. J. Chromatogr. B: Anal. Technol. Biomed. Life Sci., 2017, 1065-1066, 63–69.
103 ANDERSON, S. C.; SUBBIAH, S.; GENTLES, A.; AUSTIN, G.; STONUM, P.; BROOKS, T. A.; BROOKS, C.; SMITH, E. E. Qualitative and Quantitative Drug residue analyses: Florfenicol in white-tailed deer (Odocoileus virginianus) and supermarket meat by liquid chromatography tandem-mass spectrometry. J. Chromatogr. B: Anal. Technol. Biomed. Life Sci., 2016, 1033-1034, 73–79.
104 ELGAWISH, M. S.; NASSER, S.; SALAMA, I.; ABBAS, A. M.; MOSTAFA, S. M. Liquid chromatography tandem mass spectrometry for the simultaneous determination of metformin and pioglitazone in rat plasma: Application to pharmacokinetic and drug-drug interaction studies. J. Chromatogr. B: Anal. Technol. Biomed. Life Sci., 2019, 1124, 47–57.
105 HERBRINK, M.; THIJSSEN, B.; HILLEBRAND, M. J. X.; ROSING, H.; SCHELLENS, J. H. M.; NUIJEN, B.; BEIJNEN, J. H. Development and validation of a high-performance liquid chromatography-tandem mass spectrometry assay for the quantification of Dexamphetamine in human plasma. J. Pharm. Biomed. Anal., 2018, 148, 259–264.106 COUSSOT, G.; LE POSTOLLEC, A.; FAYE, C.; DOBRIJEVIC, M. A gold standard method for the evaluation of antibody-based materials functionality: Approach to forced degradation studies. J. Pharm. Biomed. Anal., 2018, 152, 17–24.107 PARSONS, T. L.; MARZINKE, M. A. Development and validation of a liquid chromatographic-tandem mass spectrometric method for the multiplexed quantification of etravirine, maraviroc, raltegravir, and rilpivirine in human plasma and tissue. J. Pharm. Biomed. Anal., 2016, 131, 333–344.108 REZK, M. R.; BENDAS, E. R.; BASALIOUS, E. B.; KARIM, I. A. Development and validation of sensitive and rapid UPLC–MS/MS method for quantitative determination of daclatasvir in human plasma: Application to a bioequivalence study. J. Pharm. Biomed. Anal., 2016, 128, 61–66.109 VAN NULAND, M.; HILLEBRAND, M. J. X.; ROSING, H.; BURGERS, J. A.; SCHELLENS, J. H. M.; BEIJNEN, J. H. Ultra-sensitive LC–MS/MS method for the quantification of gemcitabine and its metabolite 2′,2′-difluorodeoxyuridine in human plasma for a microdose clinical trial. J. Pharm. Biomed. Anal., 2018, 151, 25–31.110 EL MUBARAK, M. A.; STYLOS, E. K.; CHATZIATHANASIADOU, M. V.; DANIKA, C.; ALEXIOU, G. A.; TSEKERIS, P.; RENZIEHAUSEN, A.; CROOK, T.; SYED, N.; SIVOLAPENKO, G. B.; TZAKOS, A. G. Development and validation of simple step protein precipitation UHPLC-MS/MS methods for quantitation of temozolomide in cancer patient plasma samples. J. Pharm. Biomed. Anal., 2019, 162, 164–170.111 WEBER, J.; OBERFELD, S.; BONSE, A.; TELGER, K.; LINGG, R.; HEMPEL, G. Validation of a dried blood spot method for therapeutic drug monitoring of citalopram, mirtazapine and risperidone and its active metabolite 9-hydroxyrisperidone using HPLC–MS. J. Pharm. Biomed. Anal., 2017, 140, 347–354.112 HUMMERT, P.; PARSONS, T. L.; ENSIGN, L. M.; HOANG, T.; MARZINKE, M. A. Validation and implementation of liquid chromatographic-mass spectrometric (LC–MS) methods for the quantification of tenofovir prodrugs. J. Pharm. Biomed. Anal., 2018, 152, 248–256.113 ROOSENDAAL, J.; ROSING, H.; LUCAS, L.; OGANESIAN, A.; SCHELLENS, J. H. M.; BEIJNEN, J. H. Development, validation, and clinical application of a high-performance liquid chromatography-tandem mass spectrometry assay for the quantification of total intracellular β-decitabine nucleotides and genomic DNA incorporated β-decitabine and 5-methyl-2′-d. J. Pharm. Biomed. Anal., 2019, 164, 16–26.114 ANGEMI, G.; BARCO, S.; CASTAGNOLA, E.; TRIPODI, G.; FAVATA, F.; D’AVOLIO, A. Development and validation of UHPLC–MS/MS methods for the quantification of colistin in plasma and dried plasma spots. J. Pharm. Biomed. Anal., 2016, 129, 551–557.
115 PÉREZ-ROBLES, R.; CUADROS-RODRÍGUEZ, L.; SALMERÓN-GARCÍA, A.; NAVAS, N.; Development and validation of a (RP)UHPLC-UV-(HESI/Orbitrap)MS method for the identification and quantification of mixtures of intact therapeutical monoclonal antibodies using a monolithic column. J. Pharm. Biomed. Anal., 2018, 159, 437–448.116 FERREIRA, N. N.; BONI, F. I.; BALTAZAR, F.; GREMIÃO, M. P. D. Validation of an innovative analytical method for simultaneous quantification of alpha-cyano-4-hydroxycinnamic acid and the monoclonal antibody cetuximab using HPLC from PLGA-based nanoparticles. J. Pharm. Biomed. Anal., 2020, 190.117 TARTAGGIA, S.; ALVAU, M. D.; MENEGHELLO, A.; CASETTA, B.; POLO, F.; TOFFOLI, G. Practical fluorimetric assay for the detection of anticancer drug SN-38 in human plasma. J. Pharm. Biomed. Anal., 2018, 159, 73–81.118 SOHN, A.; KIM, H.; YEO, I.; KIM, Y.; SON, M.; YU, S. J.; YOON, J.; KIM, Y. Fully validated SRM-MS-based method for absolute quantification of PIVKA-II in human serum: Clinical applications for patients with HCC. J. Pharm. Biomed. Anal., 2018, 156, 142–146.119 MATSUMOTO, J.; KIESEL, B. F.; PARISE, R. A.; GUO, J.; TAYLOR, S.; HUANG, M.; EISEMAN, J. L.; IVY, S. P.; KUNOS, C.; CHU, E.; BEUMER, J. H. LC–MS/MS assay for the quantitation of the ribonucleotide reductase inhibitor triapine in human plasma. J. Pharm. Biomed. Anal., 2017, 146, 154–160.120 KIESEL, B. F.; SHOGAN, J. C.; RACHID, M.; PARISE, R. A.; VENDETTI, F. P.; BAKKENIST, C. J.; BEUMER, J. H. LC–MS/MS assay for the simultaneous quantitation of the ATM inhibitor AZ31 and the ATR inhibitor AZD6738 in mouse plasma. J. Pharm. Biomed. Anal., 2017, 138, 158–165.121 KIM, K.; PARISE, R. A.; HOLLERAN, J. L.; LEWIS, L. D.; APPLEMAN, L.; VAN ERP, N.; MORRIS, M. J.; BEUMER, J. H. Simultaneous quantitation of abiraterone, enzalutamide, N-desmethyl enzalutamide, and bicalutamide in human plasma by LC–MS/MS. J. Pharm. Biomed. Anal., 2017, 138, 197–205.
122 KIESEL, B. F.; PARISE, R. A.; WONG, A.; KEYVANJAH, K.; JACOBS, S.; BEUMER, J. H. LC–MS/MS assay for the quantitation of the tyrosine kinase inhibitor neratinib in human plasma. J. Pharm. Biomed. Anal., 2017, 134, 130–136.
123 WIJMA, R. A.; HOOGTANDERS, K. E. J.; CROES, S.; MOUTON, J. W.; BRÜGGEMANN, R. J. M. Development and validation of a fast and sensitive UHPLC-DAD assay for the quantification of nitrofurantoin in plasma and urine. J. Pharm. Biomed. Anal., 2019, 174, 161–167.
124 MARTÍNEZ-CHÁVEZ, A.; TIBBEN, M. M.; BROEDERS, J.; ROSING, H.; SCHINKEL, A. H.; BEIJNEN, J. H. Development and validation of an LC-MS/MS method for the quantitative analysis of milciclib in human and mouse plasma, mouse tissue homogenates and tissue culture medium. J. Pharm. Biomed. Anal., 2020, 190.
125 OKHINA, A. A.; ROGACHEV, A. D.; YAROVAYA, O. I.; KHVOSTOV, M. V.; TOLSTIKOVA, T. G.; POKROVSKY, A. G.; KHAZANOV, V. A; SALAKHUTDINOV, N. F. Development and validation of an LC-MS/MS method for the quantitative analysis of the anti-influenza agent camphecene in rat plasma and its application to study the blood-to-plasma distribution of the agent. J. Pharm. Biomed. Anal., 2020, 180.
126 HOLLERAN, J. L.; PARISE, R. A.; GUO, J.; KIESEL, B. F.; TAYLOR, S. E.; IVY, S. P.; CHU, E.; BEUMER, J. H. Quantitation of iohexol, a glomerular filtration marker, in human plasma by LC–MS/MS. J. Pharm. Biomed. Anal., 2020, 189.
127 KNAPEN, L. M.; BEER, Y. D.; BRÜGGEMANN, R. J. M.; STOLK, L. M.; VRIES, F. D.; TJAN-HEIJNEN, V. C. G.; ERP, N. P. V.; CROES, S. Development and validation of an analytical method using UPLC–MS/MS to quantify everolimus in dried blood spots in the oncology setting. J. Pharm. Biomed. Anal., 2018, 149, 106–113.
128 FOERSTER, K. I.; HUPPERTZ, A.; MÜLLER, O. J.; RIZOS, T.; TILEMANN, L.; HAEFELI, W. E.; BURHENNE, J. Simultaneous quantification of direct oral anticoagulants currently used in anticoagulation therapy. J. Pharm. Biomed. Anal., 2018, 148, 238–244.
129 KOUR, G.; CHANDAN, B. K.; KHULLAR, M.; MUNAGALA, G.; SINGH, P. P.; BHAGAT, A.; GUPTA, A. P.; VISHWAKARMA, R. A.; AHMED, Z. Development and validation of a highly sensitive LC–MS/MS-ESI method for quantification of IIIM-019—A novel nitroimidazole derivative with promising action against Tuberculosis: Application to drug development. J. Pharm. Biomed. Anal., 2016, 124, 26–33.
130 MARANGON, E.; BUZZO, M.; POSOCCO, B.; GAGNO, S.; ZANCHETTA, M.; IACUZZI, V.; POETTO, A. S.; GUARDASCIONE, M.; GIODINI, L.; TOFFOLI, G. A new high-performance liquid chromatography–tandem mass spectrometry method for the determination of sunitinib and N-desethyl sunitinib in human plasma: Light-induced isomerism overtaking towards therapeutic drug monitoring in clinical routine. J. Pharm. Biomed. Anal., 2020, 179.
131 LEE, M.; KIM, D.; SHIN, J.; LEE, H.; PARK, S.; LEE, H.; KANG, J.; CHUNG, S. Quantification of IDP-73152, a novel antibiotic, in plasma from mice, rats and humans using an ultra-high performance liquid chromatography/tandem mass spectrometry method for use in pharmacokinetic studies. J. Pharm. Biomed. Anal., 2017, 145, 364–371.
132 HOLLERAN, J. L.; EISEMAN, J. L.; PARISE, R. A.; KUMMAR, S.; BEUMER, J. H. LC–MS/MS assay for the quantitation of FdCyd and its metabolites FdUrd and FU in human plasma. J. Pharm. Biomed. Anal., 2016, 129, 359–366.
133 PAPPULA, N.; KODALI, B.; DATLA, P. V.; Selective and rapid determination of tadalafil and finasteride using solid phase extraction by high performance liquid chromatography and tandem mass spectrometry. J. Pharm. Biomed. Anal., 2018, 152, 215–223.

134 SUZUKI, Y.; WITT, L.; MIER, W.; MIKUS, G.; MARKERT, C.; HAEFELI, W. E.; BURHENNE, J. Ultra-sensitive and selective quantification of endothelin-1 in human plasma using ultra-performance liquid chromatography coupled to tandem mass spectrometry. J. Pharm. Biomed. Anal., 2017, 142, 84–90.
135 HU, Z.; ZHANG, M.; HE, M.; FANG, B.; BAO, X.; YAN, X.; LIANG, H.; WANG, H. Determination of fascaplysin in rat plasma with ultra-performance liquid chromatography-tandem mass spectrometry (UPLC–MS/MS): application to a pharmacokinetic study. J. Pharm. Biomed. Anal., 2019, 171, 126–131.
136 PROKOPIENKO, A. J.; WEST, R. E.; STUBBS, J. R.; NOLIN, T. D. Development and validation of a UHPLC-MS/MS method for measurement of a gut-derived uremic toxin panel in human serum: An application in patients with kidney disease. J. Pharm. Biomed. Anal., 2019, 174, 618–624.
137 XU, G.; LIU, X.; SHU, Y.; PILLAI, J. A.; XU, Y. A rapid and sensitive LC–MS/MS method for quantitative analysis of cardiolipin (18:2)4 in human leukocytes and mouse skeletal muscles. J. Pharm. Biomed. Anal., 2018, 158, 386–394.
138 FATIGUSO, G.; FAVATA, F.; ZEDDA, I.; DE NICOLÒ, A.; CUSATO, J.; AVATANEO, V.; DI PERRI, G.; D’AVOLIO, A. A simple high performance liquid chromatography–mass spectrometry method for Therapeutic Drug Monitoring of isavuconazole and four other antifungal drugs in human plasma samples. J. Pharm. Biomed. Anal., 2017, 145, 718–724.139 KUNATI, S. R.; YANG, S.; WILLIAM, B. M.; XU, Y. An LC–MS/MS method for simultaneous determination of curcumin, curcumin glucuronide and curcumin sulfate in a phase II clinical trial. J. Pharm. Biomed. Anal., 2018, 156, 189–198.140 CHRISTNER, S.; GUO, J.; PARISE, R. A.; RINGEVAL, M.; HOYE, A. T.; WIPF, P.; EPPERLY, M. W.; GREENBERGER, J. S.; BEUMER, J. H.; EISEMAN, J. L. Liquid chromatography–tandem mass spectrometric assay for the quantitation of the novel radiation protective agent and radiation mitigator JP4-039 in murine plasma. J. Pharm. Biomed. Anal., 2018, 150, 169–175.
141 NIJENHUIS, C. M.; HAVERKATE, H.; ROSING, H.; SCHELLENS, J. H. M.; BEIJNEN, J. H. Simultaneous quantification of dabrafenib and trametinib in human plasma using high-performance liquid chromatography–tandem mass spectrometry. J. Pharm. Biomed. Anal., 2016, 125, 270–279.
142 TÖMÖSI, F.; KECSKEMÉTI, G.; CSEH, E. K.; SZABÓ, E.; RAJDA, C.; KORMÁNY, R.; SZABÓ, Z.; VÉCSEI, L.; JANÁKY, T. A validated UHPLC-MS method for tryptophan metabolites: Application in the diagnosis of multiple sclerosis. J. Pharm. Biomed. Anal., 2020, 185.
143 TCHOUMTCHOUA, J.; HALABALAKI, M.; GIKAS, E.; TSARBOPOULOS, A.; FOTAKI, N.; LIU, L.; NAM, S.; JOVE, R.; SKALTSOUNIS, L. A. Preliminary pharmacokinetic study of the anticancer 6BIO in mice using an UHPLC-MS/MS approach. J. Pharm. Biomed. Anal., 2019, 164, 317–325.
144 VAN DEN BERGHE, N.; TRUFFOT, A.; PEETERS, M.; COMPERNOLLE, G.; BROUWERS, E.; SOENEN, R.; GRINE, L.; GILS, A.; IMBRECHTS, M. Development and validation of immunoassays for monitoring of guselkumab and anti-guselkumab antibodies in patients with moderate-to-severe psoriasis. J. Pharm. Biomed. Anal., 2020, 189.
145 GAO, Y.; ZHANG, D.; YANG, C.; DUAN, X.; LI, X.; ZHONG, D. Two validated liquid chromatography–mass spectrometry methods with different pretreatments for the quantification of an anti-CD47 monoclonal antibody in rat and cynomolgus monkey serum compared with an electrochemiluminescence method. J. Pharm. Biomed. Anal., 2019, 175.
146 LINDNER, J. M.; VOGESER, M.; GRIMM, S. H. Biphenyl based stationary phases for improved selectivity in complex steroid assays. J. Pharm. Biomed. Anal., 2017, 142, 66–73.
147 IACUZZI, V.; ZANCHETTA, M.; GAGNO, S.; POETTO, A. S.; ORLENI, M.; MARANGON, E.; GUARDASCIONE, M.; FOLTRAN, L.; POSOCCO, B.; TOFFOLI, G. A LC–MS/MS method for therapeutic drug monitoring of sorafenib, regorafenib and their active metabolites in patients with hepatocellular carcinoma. J. Pharm. Biomed. Anal., 2020, 187.
148 KIJ, A.; MATEUSZUK, L.; SITEK, B.; PRZYBOROWSKI, K.; ZAKRZEWSKA, A.; WANDZEL, K.; WALCZAK, M.; CHLOPICKI, S. Simultaneous quantification of PGI 2 and TXA 2 metabolites in plasma and urine in NO-deficient mice by a novel UHPLC/MS/MS method. J. Pharm. Biomed. Anal., 2016, 129, 148–154.
149 KUL, A.; OZDEMIR, M.; SAGIRLI, O. Determination of pethidine of abuse and relevant metabolite norpethidine in urine by ultra-performance liquid chromatography-tandem mass spectrometry. J. Pharm. Biomed. Anal., 2020, 186.
150 SOTTANI, C.; GRIGNANI, E.; MAZZUCCHELLI, S.; BONIZZI, A.; CORSI, F.; NEGRI, S.; PRATI, F.; CALLERI, E.; COTTICA, D. Development and validation of a simple and versatile method for the quantification of everolimus loaded in H-ferritin nanocages using UHPLC-MS/MS. J. Pharm. Biomed. Anal., 2020, 191.
151 CLEMENTINO, A.; SONVICO, F. Development and validation of a RP-HPLC method for the simultaneous detection and quantification of simvastatin’s isoforms and coenzyme Q10 in lecithin/chitosan nanoparticles. J. Pharm. Biomed. Anal., 2018, 155, 33–41.
152 DAHSHAN, H. E.; HELAL, M. A.; MOSTAFA, S. M.; ELGAWISH, M. S. Development and validation of an HPLC-UV method for simultaneous determination of sildenafil and tramadol in biological fluids: Application to drug-drug interaction study. J. Pharm. Biomed. Anal., 2019, 168, 201–208.

153 ABBAS MOUSSA, B.; MAHROUSE, M. A.; FAWZY, M. G. A validated LC-MS/MS method for simultaneous determination of linagliptin and metformin in spiked human plasma coupled with solid phase extraction: Application to a pharmacokinetic study in healthy volunteers. J. Pharm. Biomed. Anal., 2019, 163, 153–161.
154 CHOUCHOU, A.; MARION, B.; ENJALBAL, C.; ROQUES, C.; CUQ, P.; BONNET, P.; BRESSOLLE-GOMENI, F. M. M.; DELEUZE-MASQUÉFA, C. Liquid chromatography-electrospray ionization-tandem mass spectrometry method for quantitative estimation of new imiqualine leads with potent anticancer activities in rat and mouse plasma. Application to a pharmacokinetic study in mice. J. Pharm. Biomed. Anal., 2018, 148, 369–379.
155 PUTTREVU, S. K.; LAXMAN, T. S.; TRIPATHI, A. K.; YADAV, A. K.; VERMA, S. K.; MISHRA, A.; PRADHAN, R.; VERMA, N. K.; GHOSH, J. K.; BHATTA, R. S. Liquid chromatography–tandem mass spectrometry-based method development and validation of S016-1271 (LR8P), a novel cationic antimicrobial peptide for its application to pharmacokinetic studies. J. Pharm. Biomed. Anal., 2019, 169, 116–126.
156 KIM, E.; NOH, K.; LEE, S. J.; SHIN, B.; HWANG, J. T.; LEE, S. W.; RHO, M.-C.; KANG, W. Simultaneous determination of 3- O -acetyloleanolic acid and oleanolic acid in rat plasma using liquid chromatography coupled to tandem mass spectrometry. J. Pharm. Biomed. Anal., 2016, 118, 96–100.
157 DAI, X.; PANG, L.; ZHANG, Z.; YANG, C.; LI, Y. Development of a sensitive LC–MS/MS method for quantification of coniferyl ferulate and its metabolite coniferyl alcohol in rat plasma: Application to a pharmacokinetic study. J. Pharm. Biomed. Anal., 2017, 146, 201–205.
158 KIM, M.; CHOI, S.; NOH, K.; KIM, C.; KIM, E.; HWANG, J.-K.; KANG, W. Determination of panduratin A in rat plasma by HPLC–MS/MS and its application to a pharmacokinetic study. J. Pharm. Biomed. Anal., 2017, 137, 151–154.
159 CHOI, S.; KIM, M.; KIM, C.; HWANG, J.-K.; KANG, W. Quantitative determination of xanthorrhizol in rat plasma by HPLC–MS/MS and its application to a pharmacokinetic study. J. Pharm. Biomed. Anal., 2017, 132, 56–59.
160 PARK, C.; HA, J. G.; CHOI, S.; KIM, E.; NOH, K.; SHIN, B. S.; KANG, W. HPLC–MS/MS analysis of mesupron and its application to a pharmacokinetic study in rats. J. Pharm. Biomed. Anal., 2018, 150, 39–42.
161 XIE, L.; LIU, X.; ZHU, X.; XU, Y.; PENG, S.; SUN, K.; CAI, H.; DAI, Q.; WANG, C.; ZHOU, Q.; CAI, B. Development of an UHPLC-MS/MS method for comparative pharmacokinetics of nine anthraquinones in rats and application to dosage conversion between different Semen Cassiae forms. J. Pharm. Biomed. Anal., 2019, 174, 696–706.
162 ABO-ZEID, M. N.; EL-GIZAWY, S. M.; ATIA, N. N.; EL-SHABOURY, S. R. Efficient HPTLC-dual wavelength spectrodensitometric method for simultaneous determination of sofosbuvir and daclatasvir: Biological and pharmaceutical analysis. J. Pharm. Biomed. Anal., 2018, 156, 358–365.
163 CHENG, Y.-Y.; TSAI, T.-H. A validated LC–MS/MS determination method for the illegal food additive rhodamine B: Applications of a pharmacokinetic study in rats. J. Pharm. Biomed. Anal., 2016, 125, 394–399.164 SCHUSTER, C.; PAAL, M.; LINDNER, J.; ZOLLER, M.; LIEBCHEN, U.; SCHARF, C.; VOGESER, M. Isotope dilution LC-orbitrap-HRMS with automated sample preparation for the simultaneous quantification of 11 antimycotics in human serum. J. Pharm. Biomed. Anal., 2019, 166, 398–405.165 THAKARE, R.; CHHONKER, Y. S.; GAUTAM, N.; ALAMOUDI, J. A.; ALNOUTI, Y. Quantitative analysis of endogenous compounds. J. Pharm. Biomed. Anal., 2016, 128, 426–437.
166 SEO, S.-Y.; KANG, W. Quantitative determination of a synthetic amide derivative of gallic acid, SG-HQ2, using liquid chromatography tandem mass spectrometry, and its pharmacokinetics in rats. J. Pharm. Biomed. Anal., 2016, 131, 103–106.
167 SEO, S.-Y.; KANG, W. Quantitative determination of a synthetic amide derivative of gallic acid, SG-HQ2, using liquid chromatography tandem mass spectrometry, and its pharmacokinetics in rats. J. Pharm. Biomed. Anal., 2016, 131, 103–106.
168 FOIVAS, A.; MALENOVIĆ, A.; KOSTIĆ, N.; BOŽIĆ, M.; KNEŽEVIĆ, M.; LOUKAS, Y. L.; DOTSIKAS, Y. Quantitation of brinzolamide in dried blood spots by a novel LC-QTOF-MS/MS method. J. Pharm. Biomed. Anal., 2016, 119, 84–90.
169 NIU, C.; YE, W.; CUI, X.; SUN, J.; XIAO, S.; CHEN, G.; BAO, S.; CHEN, R. UHPLC-MS/MS method for the quantification of aloin-A in rat plasma and its application to a pharmacokinetic study. J. Pharm. Biomed. Anal., 2020, 178.
170 GADGIL, P.; IBRAHIM, F.; CHOW, D. S.-L. UPLC–MS/MS assay of 21-aminosteroid (lazaroid U74389G) for application in pharmacokinetic study. J. Pharm. Biomed. Anal., 2016, 122, 90–97.
171 KIESEL, B F.; SCEMAMA, J.; PARISE, R. A.; VILLARUZ, L.; IFFLAND, A.; DOYLE, A.; IVY, P.; CHU, E.; BAKKENIST, C. J.; BEUMER, J. H. LC–MS/MS assay for the quantitation of the ATR kinase inhibitor VX-970 in human plasma. J. Pharm. Biomed. Anal., 2017, 146, 244–250.
172 BARCO, S.; MESINI, A.; BARBAGALLO, L.; MAFFIA, A.; TRIPODI, G.; PEA, F.; SAFFIOTI, C.; CASTAGNOLA, E.; CANGEMI, G. A liquid chromatography-tandem mass spectrometry platform for the routine therapeutic drug monitoring of 14 antibiotics: Application to critically ill pediatric patients. J. Pharm. Biomed. Anal., 2020, 186.
173 DE NICOLÒ, A.; AVATANEO, V.; RABBIA, F.; BONIFACIO, G.; CUSATO, J.; TOMASELLO, C.; PERLO, E.; MULATERO, P.; VEGLIO, F.; DI PERRI, G.; D’AVOLIO, A. UHPLC–MS/MS method with protein precipitation extraction for the simultaneous quantification of ten

antihypertensive drugs in human plasma from resistant hypertensive patients. J. Pharm. Biomed. Anal., 2016, 129, 535–541.
174 KOSSAKOWSKA, N.; OLĘDZKA, I.; KOWALIK, A.; MIĘKUS, N.; KOWALSKI, P.; PLENIS, A.; BIEŃ, E.; KACZOROWSKA, A.; KRAWCZYK, M. A.; ADAMKIEWICZ-DROŻYŃSKA, E.; BĄCZEK, T. Application of SPME supported by ionic liquids for the determination of biogenic amines by MEKC in clinical practice. J. Pharm. Biomed. Anal., 2019, 173, 24–30.
175 XU, R.-A.; LIN, Q.; QIU, X.; CHEN, J.; SHAO, Y.; HU, G.; LIN, G. UPLC-MS/MS method for the simultaneous determination of imatinib, voriconazole and their metabolites concentrations in rat plasma. J. Pharm. Biomed. Anal., 2019, 166, 6–12.
176 UZUKI, Y.; SASAMOTO, Y.; YOSHIJIMA, C.; TANAKA, R.; ONO, H.; ANDO, T.; SHIN, T.; MIMATA, H.; ITOH, H.; OHNO, K. Simultaneous quantification of coproporphyrin-I and 3-carboxy-4-methyl-5-propyl-2-furanpropanoic acid in human plasma using ultra-high performance liquid chromatography coupled to tandem mass spectrometry. J. Pharm. Biomed. Anal., 2020, 184, 113202.
177 GORYŃSKI, K.; KIEDROWICZ, A.; BOJKO, B. Development of SPME-LC–MS method for screening of eight beta-blockers and bronchodilators in plasma and urine samples. J. Pharm. Biomed. Anal., 2016, 127, 147–155.
178 LI, W.; YANG, H.; BUCKLEY, B.; WANG, L.; KONG, A.-N. A Novel Triple Stage Ion Trap MS method validated for curcumin pharmacokinetics application: A comparison summary of the latest validated curcumin LC/MS methods. J. Pharm. Biomed. Anal., 2018, 156, 116–124.
179 RAMADON, D.; COURTENAY, A. J.; PERMANA, A. D.; TEKKO, I. A.; MCALISTER, E.; MCCRUDDEN, M. T. C.; MCCARTHY, H. O.; DONNELLY, R. F. A sensitive HPLC-UV method for quantifying vancomycin in biological matrices: Application to pharmacokinetic and biodistribution studies in rat plasma, skin and lymph nodes. J. Pharm. Biomed. Anal., 2020, 189.
180 RAVULA, A.; CHANDASANA, H.; SETLOW, B.; FEBO, M.; BRUIJNZEEL, A. W.; DERENDORF, H. Simultaneous quantification of cannabinoids tetrahydrocannabinol, cannabidiol and CB1 receptor antagonist in rat plasma: An application to characterize pharmacokinetics after passive cannabis smoke inhalation and co-administration of rimonabant. J. Pharm. Biomed. Anal., 2018, 160, 119–125.
181 LIN, Q.; PU, H.; GUAN, H.; MA, C.; ZHANG, Y.; DING, W.; CHENG, X.; JI, L.; WANG, Z.; WANG, C. Rapid identification and pharmacokinetic studies of multiple active alkaloids in rat plasma through UPLC-Q-TOF-MS and UPLC-MS/MS after the oral administration of Zanthoxylum nitidum extract. J. Pharm. Biomed. Anal., 2020, 186, 113232.
182 AHMED, S.; ABDALLAH, N. A. Dansyl azide as a selective fluorescence tagging probe for click chemistry reactions and its application to monitor rasagiline in pharmacokinetic studies. J. Pharm. Biomed. Anal., 2019, 165, 357–365.
183 QU, Y.; BRADY, K.; APILADO, R.; O’MALLEY, T.; REDDY, S.; CHITKARA, P.; IBARRA, C.; ALEXANDER, R. V.; DERVIEUX, T. Capillary blood collected on volumetric absorptive microsampling (VAMS) device for monitoring hydroxychloroquine in rheumatoid arthritis patients. J. Pharm. Biomed. Anal., 2017, 140, 334–341.
184 CHEN, X.; ZHU, P.; LIU, B.; WEI, L.; XU, Y. Simultaneous determination of fourteen compounds of Hedyotis diffusa Willd extract in rats by UHPLC–MS/MS method: Application to pharmacokinetics and tissue distribution study. J. Pharm. Biomed. Anal., 2018, 159, 490–512.
185 LE, J.; LIN, Z.; SONG, L.; WANG, H.; HONG, Z.; LC-MS/MS combined with in vivo microdialysis sampling from conscious rat striatum for simultaneous determination of active constituents of Yuanhu- Baizhi herb pair and endogenous neurotransmitters: Application to pharmacokinetic and pharmacodynamic study. J. Pharm. Biomed. Anal., 2019, 176.
186 ABO-ZEID, M. N.; ATIA, N. N.; EL-GIZAWY, S. M.; EL-SHABOURY, S. R. Ultrasensitive spectrofluorimetric method for rapid determination of daclatasvir and ledipasvir in human plasma and pharmaceutical formulations. J. Pharm. Biomed. Anal., 2018, 152, 155–164.
187 BHATNAGAR, A.; MCKAY, M. J.; CRUMBAKER, M.; AHIRE, K.; KARUSO, P.; GURNEY, H.; MOLLOY, M. P. Quantitation of the anticancer drug abiraterone and its metabolite Δ(4)-abiraterone in human plasma using high-resolution mass spectrometry. J. Pharm. Biomed. Anal., 2018, 154, 66–74.
188 EIGENMANN, D. E.; JÄHNE, E. A.; SMIEŠKO, M.; HAMBURGER, M.; OUFIR, M. Validation of an immortalized human (hBMEC) in vitro blood-brain barrier model. Anal. Bioanal. Chem., 2016, 408(8), 2095–2107.189 LIU, T.; LIU, R.; ZHU, L.; ZOU, X.; GUAN, H.; XU, Z. Development of a UHPLC-MS method for inhibitor screening against α-L-1,3-fucosidase. Anal. Bioanal. Chem., 2019, 411(7), 1467–1477.190 EGELAND, S. V.; REUBSAET, L.; PAUS, E.; HALVORSEN, T. G. Dual-immuno-MS technique for improved differentiation power in heterodimeric protein biomarker analysis: determination and differentiation of human chorionic gonadotropin variants in serum. Anal. Bioanal. Chem., 2016, 408(26), 7379–7391.191 LANDMESSER, A.; SCHERER, G.; PLUYM, N.; NIESSNER, R.; SCHERER, M. A novel quantification method for sulfur-containing biomarkers of formaldehyde and acetaldehyde exposure in human urine and plasma samples. Anal. Bioanal. Chem., 2020, 412(27), 7535–7546.192 EL AMRANI, M.; SZANTO, C. L.; HACK, C. E.; HUITEMA, A. D. R.; NIERKENS, S.; VAN MAARSEVEEN, E. M. Quantification of total dinutuximab concentrations in neuroblastoma patients with liquid chromatography tandem mass spectrometry. Anal. Bioanal. Chem., 2018, 410(23), 5849–5858.

193 SOARES, S.; CASTRO, T.; ROSADO, T.; FERNÁNDEZ, N.; BARROSO, M.; GALLARDO, E. New analytical approach to determine organophosphorus insecticides in blood by dried matrix spots sampling and GC-MS/MS. Anal. Bioanal. Chem., 2018, 410(30), 7955–7964.194 CHEN, G.-Y.; ZHANG, Q. Comprehensive analysis of oxylipins in human plasma using reversed-phase liquid chromatography-triple quadrupole mass spectrometry with heatmap-assisted selection of transitions. Anal. Bioanal. Chem., 2019, 411(2), 367–385.
Related Documents