Atmos. Chem. Phys., 8, 2421–2435, 2008 www.atmos-chem-phys.net/8/2421/2008/ © Author(s) 2008. This work is distributed under the Creative Commons Attribution 3.0 License. Atmospheric Chemistry and Physics Validation of ACE-FTS v2.2 methane profiles from the upper troposphere to the lower mesosphere M. De Mazi` ere 1 , C. Vigouroux 1 , P. F. Bernath 2,14 , P. Baron 3 , T. Blumenstock 4 , C. Boone 2 , C. Brogniez 5 , V. Catoire 6 , M. Coffey 7 , P. Duchatelet 8 , D. Griffith 9 , J. Hannigan 7 , Y. Kasai 3 , I. Kramer 4 , N. Jones 9 , E. Mahieu 8 , G. L. Manney 10,15 , C. Piccolo 11 , C. Randall 16 , C. Robert 6 , C. Senten 1 , K. Strong 12 , J. Taylor 12 , C. T´ etard 5 , K. A. Walker 2,12 , and S. Wood 13 1 Belgian Institute for Space Aeronomy (BIRA-IASB), Brussels, Belgium 2 Department of Chemistry, University of Waterloo, Waterloo, Ontario, Canada 3 National Institute of Information and Communications Technology (NICT), Tokyo, Japan 4 IMK-ASF, Forschungszentrum Karlsruhe and University Karlsruhe, Karlsruhe, Germany 5 Laboratoire d’Optique Atmosph´ erique, Universit´ e des sciences et technologies de Lille, Lille, France 6 Laboratoire de Physique et Chimie de l’Environnement, CNRS – Universit´ e d’Orl´ eans, Orl´ eans, France 7 National Center for Atmospheric Research (NCAR), Boulder, CO, USA 8 Institut d’Astrophysique et de G´ eophysique, Universit´ e de Li` ege, Li` ege, Belgium 9 School of Chemistry, University of Wollongong, Wollongong, Australia 10 Jet Propulsion Laboratory, California Institute of Technology, Pasadena, CA, USA 11 Atmospheric, Oceanic and Planetary Physics, University of Oxford, Oxford, UK 12 Department of Physics, University of Toronto, Toronto, Ontario, Canada 13 National Institute of Water and Atmospheric Research (NIWA), Lauder, New-Zealand 14 Department of Chemistry, University of York, Heslington, York, UK 15 New Mexico Institute of Mining and Technology, Socorro, NM, USA 16 Laboratory for Atmospheric and Space Physics and Department of Atmospheric and Oceanic Sciences, University of Colorado, Boulder, CO, USA Abstract. The ACE-FTS (Atmospheric Chemistry Experi- ment – Fourier Transform Spectrometer) solar occultation in- strument that was launched onboard the Canadian SCISAT-1 satellite in August 2003 is measuring vertical profiles from the upper troposphere to the lower mesosphere for a large number of atmospheric constituents. Methane is one of the key species. The version v2.2 data of the ACE-FTS CH 4 data have been compared to correlative satellite, balloon- borne and ground-based Fourier transform infrared remote sensing data to assess their quality. The comparison results indicate that the accuracy of the data is within 10% in the up- per troposphere – lower stratosphere, and within 25% in the middle and higher stratosphere up to the lower mesosphere (<60 km). The observed differences are generally consis- tent with reported systematic uncertainties. ACE-FTS is also shown to reproduce the variability of methane in the strato- sphere and lower mesosphere. Correspondence to: M. De Mazi` ere ([email protected]) 1 Introduction Methane (CH 4 ) is the most abundant organic trace gas in the atmosphere. It is the only atmospheric organic compound that has a sufficiently long lifetime (of the order of 8 to 10 years) to be transported from the troposphere to the strato- sphere. A discussion of the global cycle of methane can be found, e.g., in Wahlen (1993) and Brasseur et al. (1999). In the troposphere, the volume mixing ratio (VMR) of methane is quite uniform. Yet there is a clear interhemispheric gra- dient, with present-day VMR values of about 1.7 ppmv in the Southern Hemisphere (SH) and about 1.85 ppmv in the Northern Hemisphere (NH) (GLOBALVIEW-CH4, 2005). This gradient reflects the larger sources of methane in the NH. Thus air entering the stratosphere contains approxi- mately these amounts of methane. The methane abundance also shows a distinct seasonal variation: the net effect of larger sources and stronger chemical losses (see further be- low) in warmer months gives rise to the largest concentra- tions in local winter and the lowest concentrations in local summer. The amplitude of the seasonal cycle is largest in the Published by Copernicus Publications on behalf of the European Geosciences Union.

Welcome message from author
This document is posted to help you gain knowledge. Please leave a comment to let me know what you think about it! Share it to your friends and learn new things together.
Transcript

Atmos. Chem. Phys., 8, 2421–2435, 2008www.atmos-chem-phys.net/8/2421/2008/© Author(s) 2008. This work is distributed underthe Creative Commons Attribution 3.0 License.
AtmosphericChemistry
and Physics
Validation of ACE-FTS v2.2 methane profiles from the uppertroposphere to the lower mesosphere
M. De Maziere1, C. Vigouroux1, P. F. Bernath2,14, P. Baron3, T. Blumenstock4, C. Boone2, C. Brogniez5, V. Catoire6,M. Coffey7, P. Duchatelet8, D. Griffith 9, J. Hannigan7, Y. Kasai3, I. Kramer 4, N. Jones9, E. Mahieu8,G. L. Manney10,15, C. Piccolo11, C. Randall16, C. Robert6, C. Senten1, K. Strong12, J. Taylor12, C. Tetard5,K. A. Walker 2,12, and S. Wood13
1Belgian Institute for Space Aeronomy (BIRA-IASB), Brussels, Belgium2Department of Chemistry, University of Waterloo, Waterloo, Ontario, Canada3National Institute of Information and Communications Technology (NICT), Tokyo, Japan4IMK-ASF, Forschungszentrum Karlsruhe and University Karlsruhe, Karlsruhe, Germany5Laboratoire d’Optique Atmospherique, Universite des sciences et technologies de Lille, Lille, France6Laboratoire de Physique et Chimie de l’Environnement, CNRS – Universite d’Orleans, Orleans, France7National Center for Atmospheric Research (NCAR), Boulder, CO, USA8Institut d’Astrophysique et de Geophysique, Universite de Liege, Liege, Belgium9School of Chemistry, University of Wollongong, Wollongong, Australia10Jet Propulsion Laboratory, California Institute of Technology, Pasadena, CA, USA11Atmospheric, Oceanic and Planetary Physics, University of Oxford, Oxford, UK12Department of Physics, University of Toronto, Toronto, Ontario, Canada13National Institute of Water and Atmospheric Research (NIWA), Lauder, New-Zealand14Department of Chemistry, University of York, Heslington, York, UK15New Mexico Institute of Mining and Technology, Socorro, NM, USA16Laboratory for Atmospheric and Space Physics and Department of Atmospheric and Oceanic Sciences, University ofColorado, Boulder, CO, USA
Abstract. The ACE-FTS (Atmospheric Chemistry Experi-ment – Fourier Transform Spectrometer) solar occultation in-strument that was launched onboard the Canadian SCISAT-1satellite in August 2003 is measuring vertical profiles fromthe upper troposphere to the lower mesosphere for a largenumber of atmospheric constituents. Methane is one of thekey species. The version v2.2 data of the ACE-FTS CH4data have been compared to correlative satellite, balloon-borne and ground-based Fourier transform infrared remotesensing data to assess their quality. The comparison resultsindicate that the accuracy of the data is within 10% in the up-per troposphere – lower stratosphere, and within 25% in themiddle and higher stratosphere up to the lower mesosphere(<60 km). The observed differences are generally consis-tent with reported systematic uncertainties. ACE-FTS is alsoshown to reproduce the variability of methane in the strato-sphere and lower mesosphere.
Correspondence to:M. De Maziere([email protected])
1 Introduction
Methane (CH4) is the most abundant organic trace gas in theatmosphere. It is the only atmospheric organic compoundthat has a sufficiently long lifetime (of the order of 8 to 10years) to be transported from the troposphere to the strato-sphere. A discussion of the global cycle of methane can befound, e.g., in Wahlen (1993) and Brasseur et al. (1999). Inthe troposphere, the volume mixing ratio (VMR) of methaneis quite uniform. Yet there is a clear interhemispheric gra-dient, with present-day VMR values of about 1.7 ppmv inthe Southern Hemisphere (SH) and about 1.85 ppmv in theNorthern Hemisphere (NH) (GLOBALVIEW-CH4, 2005).This gradient reflects the larger sources of methane in theNH. Thus air entering the stratosphere contains approxi-mately these amounts of methane. The methane abundancealso shows a distinct seasonal variation: the net effect oflarger sources and stronger chemical losses (see further be-low) in warmer months gives rise to the largest concentra-tions in local winter and the lowest concentrations in localsummer. The amplitude of the seasonal cycle is largest in the
Published by Copernicus Publications on behalf of the European Geosciences Union.

2422 M. De Maziere et al.: Validation of ACE-FTS v2.2 methane profiles
northern high latitudes (30–40 ppb) and diminishes towardsthe equator. It is smaller in the SH (10–20 ppb) where it isquite constant with latitude (Wahlen, 1993).
A common destruction mechanism for methane in thestratosphere and the troposphere is reaction with OH, form-ing the methyl radical CH3 and water vapour (H2O). Addi-tional sinks in the stratosphere are the reactions with O(1D)or Cl atoms, forming CH3 and OH or HCl, respectively.Methane is therefore a sink for chlorine atoms in the strato-sphere, hence its importance in stratospheric ozone chem-istry, and a source of stratospheric water vapour. Chemicaldestruction of methane in the lower stratosphere is quite slow,because of the low abundances of O(1D) and Cl atoms, andbecause of the strong temperature dependence of the reactionwith OH. Therefore in the low stratosphere, the CH4 VMRcan be used as a tracer of dynamical processes.
In the troposphere, methane is of great importance in tro-pospheric chemistry, as it usually is the most abundant andcertainly the most ubiquitous hydrocarbon. Its oxidationscheme, starting with the reaction with OH, ultimately pro-duces CO2. A major intermediate in the degradation of CH4is formaldehyde (H2CO). Other oxidation products are car-bon monoxide (CO), and, in the presence of elevated NOxconcentrations, ozone.
Sources of methane are oxygen-deficient wetland habitatssuch as swamps, lakes, tundra, and boreal marshes. Methaneis also produced in soils and oceans, as an end product ofthe decomposition of organic material. The rate of methaneproduction is highest in tropical wetlands. Methane is alsoreleased by anaerobic microbial activity in the stomachs ofcattle, termites, and perhaps other insects. Important anthro-pogenic sources are coal mining, biomass burning, naturalgas losses and solid waste burning, as well as cultivation ofrice paddies.
Among the most important reasons to measure the con-centration of methane is the fact that it is the third most im-portant greenhouse gas in the atmosphere (after water vapourand CO2) and that its concentration has almost doubled sincepreindustrial times, from 0.975 ppmv to 1.85 ppmv (NorthernHemisphere).
On a per molecule basis, methane has a much greater cli-mate warming potential than CO2.
Methane is one of the key target species for the Atmo-spheric Chemistry Experiment-Fourier Transform Spectrom-eter (ACE-FTS) instrument that was launched in August2003. CH4 vertical profiles covering the upper troposphereto mesosphere have been retrieved from the ACE-FTS mea-surements and need to be validated using independent cor-relative data, which is the subject of the present paper. Moreinformation about the ACE mission and the CH4 retrievalsis given in Sect. 2. What we call validation of the ACE-FTSmeasurements is their comparison with independent data setsthat have been characterised earlier and that can therefore beconsidered reference data sets. The result of such a validationis a characterisation of this new data set relative to known
data sets. Similarly, when we use the word bias in the paper,we are talking about a systematic deviation of the ACE-FTSdata set relative to the known reference data set.
Available observations of CH4 include the in situ sur-face networks, in particular, the NOAA/ESRL Global Mon-itoring Network (http://www.esrl.noaa.gov/gmd/), and theground-based infrared remote sensing instruments, e.g., inthe framework of the Network for Detection of AtmosphericComposition Change (NDACC,http://www.ndacc.org; for-merly called NDSC, for Network for the Detection of Strato-spheric Change), that have provided long-term systematichigh-quality measurements since the early eighties. The for-mer ones provide only local surface data. The latter providelow-resolution vertical profile information and are thereforeuseful for comparison to the ACE-FTS data, as will be fur-ther discussed in Sect. 3.
High vertical resolution profile measurements in thestratosphere and mesosphere, sometimes down to the uppertroposphere, have been obtained using satellite-borne limbsounding infrared spectral instruments. Among such ear-lier satellite experiments is the Atmospheric Trace MoleculeSpectroscopy experiment (ATMOS). It is a Fourier-transformsolar occultation infrared spectrometer (http://remus.jpl.nasa.gov/atmos) that was deployed four times on the SpaceShuttle (April, 1985, March, 1992, April, 1993 and Novem-ber, 1994), and that can be considered a predecessor ofthe ACE-FTS instrument (Gunson et al., 1990 and 1996;Abrams et al., 1996). Following ATMOS, observationsof CH4 vertical profiles in the stratosphere and uppertroposphere have been carried out by the ISAMS (Im-proved Stratospheric and Mesospheric Sounder) (Reme-dios et al., 1996), CLAES (Cryogenic Limb Array EtalonSpectrometer) (Roche et al., 1996) and HALOE (Halo-gen Occultation Experiment) (Russell et al., 1993; Park etal., 1996) instruments onboard UARS, the Upper Atmo-sphere Research Satellite (http://uars.gsfc.nasa.gov/wwwroot/homepage/uars-science.html; Reber et al., 1993), thatoperated between mid-September 1991 and mid-December2005. ISAMS and CLAES stopped observations in July1992, and May 1993, respectively. HALOE (http://haloedata.larc.nasa.gov) provides the longest data set, cov-ering the period 11 October 1991 to 21 November 2005, in-cluding a significant period of overlap with the ACE mis-sion. HALOE measurements of CH4 have been validated byPark et al. (1996). More information about the quality of theHALOE CH4 data and the comparisons with the ACE-FTSdata are given in Sect. 6.
More recently, other interesting global data sets for CH4are being provided by the SCIAMACHY (SCanning Imag-ing Absorption spectroMeter for Atmospheric CHartogra-phY) and MIPAS (Michelson Interferometer for Passive At-mospheric Sounding) instruments onboard Envisat (Environ-mental Satellite) launched on 1 March 2002 (e.g., Franken-berg et al., 2005, and Raspollini, et al., 2006, respectively).However, the actual SCIAMACHY data sets for CH4 provide
Atmos. Chem. Phys., 8, 2421–2435, 2008 www.atmos-chem-phys.net/8/2421/2008/

M. De Maziere et al.: Validation of ACE-FTS v2.2 methane profiles 2423
only total column information and therefore this data setis not useful for validation of the ACE-FTS vertical profilemeasurements. The MIPAS data set and its comparison withACE-FTS are discussed in Sect. 5.
Presently, observations of tropospheric CH4 are also car-ried out by AIRS (Atmospheric Infrared Sounder;http://www-airs.jpl.nasa.gov/; Barnet et al., 2003) onboard Aqua,launched on 4 May 2002, and by TES (TroposphericEmission Spectrometer;http://tes.jpl.nasa.gov) onboard theAURA satellite, launched on 15 July 2004. At present, TESprovides nadir data for CH4 that are not validated yet forgeophysical use. The AIRS nadir data for CH4 provideessentially tropospheric column data (up to about 100 hPa)and therefore are not really suitable for comparison with theACE-FTS vertical profile data. They provide however a veryinteresting complementary data set.
Measurements by balloon- and aircraft-borne remote- orin situ-sensing instruments provide information complemen-tary to the satellite and ground-based instruments: in Sect. 4of the present paper, we show data from the SPIRALE instru-ment and discuss their agreement with coincident ACE-FTSprofiles.
A summary of the above mentioned individual validationefforts is discussed in Sect. 7, in which we also draw clearconclusions regarding the quality of the ACE-FTS CH4 pro-file data. Once validated, the ACE-FTS CH4 data set willconstitute a very valuable extension of the time series madeup of the ATMOS, HALOE and MIPAS data, starting in1985, now covering more than 20 years of high vertical res-olution methane distributions from the upper troposphere tothe mesosphere on a global scale.
2 ACE-FTS measurements of CH4
The ACE-FTS instrument was launched onboard theSCISAT-1 satellite of the Canadian Space Agency, on 13 Au-gust 2003. The satellite is in a high-inclination (74◦) cir-cular low-earth orbit (650 km from the surface). The ACE-FTS operates in solar occultation mode; the orbit providesa latitudinal coverage from 85◦ S to 85◦ N for these mea-surements. The instrument operates at a high spectral res-olution of 0.02 cm−1 in the range of 2.2 to 13.3µm (750–4400 cm−1). It provides measurements from the upper tropo-sphere to about 150 km altitude, of temperature and pressure,of the atmospheric extinction, and of the concentrations of alarge number of atmospheric species, with a vertical resolu-tion of the order of 4 km. A description of the ACE missioncan be found in Bernath et al. (2005).
Methane (CH4) is one of the routinely retrieved targetspecies of ACE-FTS. The retrieval algorithm has been de-scribed by Boone et al. (2005). The retrieval process startswith the derivation of pressure and temperature profileswhich are then used in the retrieval of the VMR profiles ofthe atmospheric constituents. The VMR profile above the
Table 1. Microwindows used for the retrieval of CH4 from theACE-FTS spectra, as a function of retrieval altitude.
Center Microwindow Lower UpperWavenumber Width Altitude Altitude
(cm−1) (cm−1) (km) (km)
1245.14 0.30 39 501267.78 0.30 45 601270.73 0.30 40 601283.43 0.30 50 701287.80 0.30 55 701299.89 0.30 40 551302.07 0.30 45 701302.74 0.30 55 701303.63 0.35 45 701304.25 0.30 40 601311.50 0.30 50 601322.08 0.30 38 701327.23 0.60 35 701332.08 0.30 55 701332.48 0.30 40 701332.75 0.30 55 701337.55 0.30 40 601341.68 0.35 35 701342.65 0.30 55 701346.65 0.40 32 571348.00 0.35 32 571350.95 0.30 30 551351.74 0.30 35 551353.10 0.40 33 601356.00 0.35 35 551407.60 0.30 15 301427.60 0.35 9 201439.43 0.35 10 251463.00 0.35 12 252610.20 0.35 10 272613.98 0.35 20 302614.73 0.30 20 332618.27 0.35 25 372622.58 0.30 20 332636.30 0.30 5 202644.72 0.35 12 282650.70 0.35 5 202658.08 0.35 12 282658.60 0.35 5 252664.50 0.35 17 302667.19 0.30 20 302667.47 0.35 10 272667.85 0.40 5 252669.65 0.30 5 202671.30 0.30 15 302671.66 0.45 5 252674.15 0.35 20 322675.62 0.30 12 272691.25 0.30 25 352805.97 0.30 23 332809.02 0.30 27 372820.82 0.30 25 402822.68 0.30 28 432825.05 0.30 28 402828.17 0.40 30 452835.61 0.35 18 312839.48 0.50 8 222841.22 0.35 15 302847.72 0.35 27 432849.25 0.30 25 362857.50 0.35 10 252867.10 0.30 30 402869.53 0.30 5 202888.48 0.28 25 39
www.atmos-chem-phys.net/8/2421/2008/ Atmos. Chem. Phys., 8, 2421–2435, 2008

2424 M. De Maziere et al.: Validation of ACE-FTS v2.2 methane profiles
Table 2. Identification of contributing ground-based FTIR stations.
Site Latitude Longitude ResponsibleNorth (◦) East (◦) Institution
Thule 77 −69 NCARKiruna 68 20 IMK-KarlsruhePoker Flat 65 −147 NICTJungfraujoch 47 8 Univ. LiegeToronto 44 −79 Univ. TorontoIzana 28 −16 IMK-KarlsruheSt. Denis at Ile de LaReunion
−21 55 BIRA-IASB
Wollongong −34 151 Univ. WollongongLauder −45 170 NIWAArrival Heights −78 167 NIWA
highest analyzed measurement is taken as a constant timesthe first-guess profile. First-guess profiles for the VMR re-trievals are taken from the results of the ATMOS missions(Gunson et al., 1996). It is important to note that ACE-FTSretrievals are not sensitive to a priori information except forthe shape of the first-guess profile above the highest analyzedmeasurement. ACE-FTS forward model calculations employthe HITRAN 2004 line list and cross sections (Rothman etal., 2005). For the retrieval of methane, in the ACE-FTSv2.2 processing, different microwindows have been used, asa function of altitude. They are listed in Table 1. Between 10and 20 microwindows are used simultaneously at each alti-tude. The lower altitude limit of a microwindow is chosen toavoid saturation and, in some cases, interferences from othermolecules. The upper altitude limit is where the depths ofthe target absorptions approach the measurement noise. Fora molecule like methane it is impossible to use a single set ofmicrowindows over the whole altitude range. In the chosenset of microwindows, there are no strong interferences. Mi-nor interferences from CH4 and CO2 isotopologues (13CH4,13CO2, CO18O), and from HDO (for occultations where at-mospheric water levels are high) are included in the spectralsimulations, but they are so small that there is little benefit infitting them.
The ACE-FTS retrieved methane VMR profiles extendfrom the upper troposphere to the lower mesosphere (67 to70 km altitude); the reported inversion errors in this altituderange are of the order of a few percent (2 to 3%), except atthe lowest and highest altitude limits of the retrieval wherethey may rise to more than 10%.
It is worth noticing that in the microwindows used at lowaltitude, the CH4 lines are affected by line mixing effectsand deviate from the Voigt line shape due to collisional ef-fects (Mondelain et al., 2007). These effects are not includedin the ACE-FTS forward spectral model, and therefore maycontribute to the errors in the retrievals at these altitudes.
3 Comparisons of ACE-FTS data with FTIR ground-based measurements of CH4
3.1 Characteristics of the ground-based FTIR data set
Ground-based (g-b) data for methane have been derived fromregularly performed solar absorption observations by high-spectral-resolution Fourier transform infrared (FTIR) spec-trometers, in the framework of NDACC. The names and co-ordinates of the g-b NDACC stations that have contributeddata for the validation of the ACE-FTS methane profiles arelisted in Table 2. Good latitudinal coverage is obtained, go-ing from the high Arctic to the Antarctic, including the sub-tropics. The FTIR data products are profiles with a lowvertical resolution, of the order of 10 km, from the sur-face to an altitude of about 30 km. They are obtained froma spectral fitting procedure using the Optimal Estimationmethod (Rodgers, 2000), which uses a statistical weightingbetween a priori information and measurements. More infor-mation about the retrieval algorithms can be found in Haseet al. (2004) and references therein. The spectral microwin-dows, the a priori information and additional retrieval pa-rameters have been optimised at each site as a function ofthe local conditions (altitude and latitude of the site, spec-tral data quality, etc.). All microwindows used are situatedin the range of 2610 to 2925 cm−1, which coincides with therange in which the microwindows for the ACE-FTS uppertroposphere to middle stratosphere (30 km) retrievals are lo-cated – see Table 1. Consistently at all sites, HITRAN2004spectroscopic parameters and Voigt lineshape functions havebeen used in the forward line-by-line spectra calculations, aswas done for ACE-FTS retrievals. It is important to note thatthe uncertainties on the spectroscopic parameters of CH4 arerather large, namely of the order of 20%. These uncertain-ties are a dominant source of systematic uncertainties in theretrieved profiles.
3.2 Comparison methodology
For the comparisons, we have required a temporal coin-cidence within ±24 h, and a spatial coincidence within±1000 km. These criteria are quite relaxed, but acceptablefor a species like CH4 that has a long lifetime and is ratherwell mixed in the atmosphere. At the polar sites however, thecriteria have been more severe. At Arrival Heights, we haveused the additional requirement that the difference in poten-tial vorticity (PV) between the observed airmasses (definedat the location of the station and the 30 km tangent point ofthe satellite profile) are smaller than 15%. At Kiruna, Thuleand Poker Flat, we have required a temporal coincidencewithin ±12 h, and a spatial coincidence within±500 km (forKiruna and Thule) and within±600 km at Poker Flat (withthe±500 km criterion, we had only 2 coincidences left).
The altitude range in which both instruments have goodsensitivity is limited at the lower boundary by the ACE-FTS
Atmos. Chem. Phys., 8, 2421–2435, 2008 www.atmos-chem-phys.net/8/2421/2008/

M. De Maziere et al.: Validation of ACE-FTS v2.2 methane profiles 2425
Table 3. Comparisons between ACE-FTS and g-b FTIR partial columns (PC) in the upper troposphere-middle stratosphere at all contributingsites. N is the number of coincidences (for description of criteria: see text). DOF is the number of Degrees of Freedom for Signal. M isthe mean of the differences between the ACE-FTS and g-b FTIR partial columns, in percentage, relative to the mean of the FTIR partialcolumns; STD is the 1σ standard deviation associated with the ensemble of comparisons, and SEM is the associated standard error on themean, as explained in Sect. 3.2. Err is the combined random error on the difference between the ACE-FTS and FTIR partial columns, inpercentage, relative to the mean of the FTIR profiles.
Site ACE-FTS PC N DOF for M±SEM (%) STD Errlower limits PC (%) (%)
altitude (km)(km)
Thule 7.7±2.4 12–33 13 1.5±0.0 0.3±1.5 5.4 3.1Kiruna 8.9±1.9 13–26 12 1.0±0.2 3.0±1.6 5.6 2.5Poker Flat 7.0±1.4 11–25 4 1.4±0.2 9.8±3.5 7.0 2.2Jungfraujoch 10.1±3.0 13–25 26 0.9±0.1 0.6±0.7 3.4 2.5Toronto 8.2±2.1 12–32 8 1.9±0.1 −12.1±2.2 6.0 2.5Izana 12.1±4.1 15–28 5 1.1±0.1 −6.2±2.9 6.7 2.3St-Denis 6.8±1.5 12–29 4 0.9±0.0 −6.1±1.6 3.3 2.6Wollongong 6.8±1.0 12–32 6 1.6±0.1 −4.4±3.6 8.9 3.0Lauder 8.1±2.1 12–30 21 1.4±0.1 −7.8±1.1 4.7 2.6Arrival Heights 7.7±2.0 12–30 19 1.3±0.1 −4.6±1.1 4.9 2.5
3 3.5 4 4.5 5 5.5 6 6.5 7 7.5 8
x 1018
3
4
5
6
7
8
9x 10
18
FTIR partial columns (molec/cm2)
AC
E p
artia
l col
umns
(m
olec
/cm
2 )
ThuleKirunaPoker FlatTorontoJungfraujochIzanaStDenisWollongongLauderArrival Heights
Fig. 1. Correlation plot of the ACE-FTS versus ground-based FTIRpartial column amounts of methane considered in the comparisonssummarized in Table 3, for all contributing stations. Different sym-bols refer to different stations, as indicated in the legend.
data and at the upper boundary by the g-b data. We have setthe upper altitude as the one for which the g-b data sensitiv-ity reaches 50%. In other words, above that altitude, morethan 50% of the information in the retrieved profiles comesfrom the a priori information, whereas below that altitude, atleast 50% of the information comes from the FTIR measure-ment itself. This altitude is close to 30 km. The lowermostaltitudes reached by the ACE-FTS profiles vary between 8
and 12 km above the sites concerned. In this range between8 to 12 km and 30 km, the Degrees of Freedom for Signal(DOF) of the g-b FTIR profiles is close to 1. Therefore wewill limit the comparisons to partial columns in the chosenaltitude range, and not consider profiles.
Choosing the lower altitude for the partial columns is anexercise in compromise because the lower you fix the partialcolumn lower boundary, the fewer ACE profiles you find thatgo down to this altitude. We have finally chosen the lowerboundary at each site close to 12 km because this gives usthe best compromise between (1) a sufficient number of co-incident ACE-FTS in order to have more reliable statistics,and (2), a DOF of the g-b FTIR partial columns in the rangeabove that boundary up to the 50% sensitivity limit that isclose to 1, and (3), an altitude that is similar at all sites. Izanawas the only site where we had to raise the lower boundaryto 14.8 km, because there are only a few coincident profiles(ACE makes fewer observations in the tropics and extratrop-ics than in the polar regions) and only two ACE-FTS profilesthat go as low as 12 km. The finally chosen limits are listedin Table 3.
For each ACE-FTS profile, the partial column in the con-sidered altitude range has been compared to the mean of thecorresponding ones from the g-b FTIR profiles satisfyingthe coincidence criteria. To minimize the smoothing error(Rodgers and Connor, 2003), the ACE-FTS profile has firstbeen smoothed with the g-b FTIR averaging kernel (after ex-trapolating the profile down to the surface using the a prioriprofile from the g-b FTIR retrieval). Figure 1 shows a corre-lation plot of the considered ACE-FTS versus ground-basedFTIR partial column amounts for each contributing station.
www.atmos-chem-phys.net/8/2421/2008/ Atmos. Chem. Phys., 8, 2421–2435, 2008

2426 M. De Maziere et al.: Validation of ACE-FTS v2.2 methane profiles
Notice that the variation of the partial column amounts fromone station to another is not a pure latitudinal variation: it isalso linked to the fact that the altitude limits for the partialcolumns are not identical for all stations (see Table 3), andthat the tropopause heights depend on latitude. In the end, thestatistics of the partial column comparisons have been madefor each site. These results are given in Table 3, together withsome associated relevant information. The mean relative dif-ference between the FTIR and ACE-FTS partial columns hasbeen calculated as<ACE-FTS−FTIR>/<FTIR>. In Ta-ble 3, the standard error on the mean relative difference be-tween the FTIR and ACE-FTS partial column (SEM, in per-cent) has been evaluated as STD/
√N, in which STD is the
statistical 1-sigma (1σ ) standard deviation of the observeddifferences, and N is the number of coincidences. We willuse SEM as a measure of the significance of an observedbias. The combined random error refers to the random erroron the difference between the ACE-FTS and g-b FTIR partialcolumns, derived from the g-b FTIR random error covariancematrix and the ACE-FTS 1-sigma retrieval error providedwith each profile (the ACE-FTS error covariance matrix isconsidered to be diagonal). The combined random error isexpressed in percent, relative to the mean of the FTIR partialcolumns. The g-b FTIR random error covariance matrix hasbeen evaluated for a typical FTIR measurement at Kiruna andhas been adopted for all g-b FTIR profiles (F. Hase, privatecommunication). More details about this latter evaluationand the procedure to calculate the random error on the partialcolumn differences can be found in Vigouroux et al. (2007).
3.3 Comparison results
Inspection of Table 3 shows that, in the NH, there is a zero orsmall positive bias of the ACE-FTS partial columns betweenapproximately 12 and 30 km compared to the g-b FTIR ones,except at Toronto. At the latter station, we see a negative biasof ACE-FTS of the order of (−12.1±2.2)%; but the numberof coincidences, 8, is rather poor and the g-b FTIR profilesseem to be less constrained (the DOF of the partial columnsat Toronto is larger than it is at the other stations). Also atthe northern subtropical station of Izana, we observe a nega-tive bias of ACE-FTS in the lower stratosphere of (−6±3)%.In the SH, negative biases of ACE-FTS show up at all sta-tions: they are of the order of−5% to−8%. At all sites, wesee that the random error on the relative difference is smallerthan the observed 1-sigma standard deviation, probably in-dicating that the coincidence criteria are too weak, and thatwe are still confronted with the variability in the actual CH4fields. However, taking into account, on average, the verylow number of ACE-FTS overpasses, we have preferred notto strengthen the coincidence criteria.
From the limited number of coincidences, it is not possiblegiven the statistics to draw any conclusion about any seasonaldependence in the differences between the ACE-FTS and g-bFTIR partial columns.
4 Comparison of ACE-FTS and SPIRALE profiles ofCH4
SPIRALE (French acronym for Spectroscopie Infra-Rouged’Absorption par Lasers Embarques) is a balloon-borne in-strument operated by LPCE (CNRS-Universite d’Orleans)and routinely used at all latitudes, in particular as part ofEuropean satellite validation campaigns for Odin and En-visat. The six tunable diode lasers absorption spectrometer(TDLAS) has been described in detail previously (Moreau etal., 2005). In brief it can perform simultaneous in situ mea-surements of about ten different long-lived and short-livedchemical species from about 10 to 35 km height, with a highfrequency sampling (∼1 Hz), thus enabling a vertical reso-lution of a few meters depending on the ascent rate of theballoon. The diode lasers emit in the mid-infrared domain(from 3 to 8µm) with beams injected into a multipass Heri-ott cell located under the gondola and largely exposed to am-bient air. The 3.5 m long cell is deployed during the ascentwhen the pressure is lower than 300 hPa. The multiple reflec-tions obtained between the two cell mirrors give a total op-tical path of 430.78 m. Species concentrations are retrievedfrom direct infrared absorption, by fitting experimental spec-tra with spectra calculated using the HITRAN 2004 database(Rothman et al., 2005). Specifically, the ro-vibrational line at1275.3868 cm−1 was used for CH4 (a line not used by ACE-FTS). Measurements of pressure (using two calibrated andtemperature-regulated capacitance manometers) and temper-ature (using two probes made of resistive platinum wire)aboard the gondola allow the conversion of the species con-centrations into VMRs. Uncertainties in these parametershave been evaluated to be negligible regarding the other un-certainties discussed below. The global uncertainties in theVMRs have been assessed by taking into account the randomerrors and the systematic errors, and combining them as thesquare root of their quadratic sum. The random errors (fluc-tuations of the laser background emission signal and signal-to-noise ratio) and the systematic errors (laser line width andnon-linearity of the detector) are very low, resulting in an es-timated global uncertainty of 5% for CH4, over the wholealtitude range.
The SPIRALE measurements occurred on 20 January2006, between 17:46 UT and 19:47 UT, with vertical profilesobtained during ascent, between 13.2 and 27.3 km height.The measurement position remained rather constant, at theballoon mean location of 67.6±0.2◦ N and 21.55±0.20◦ E.The comparison is made with the v2.2 data from the ACE-FTS sunrise sr13151 occultation that occurred 13 h later (on21 January 2006 at 08:00 UT) and was located at 64.28◦ N,21.56◦ E, i.e., 413 km away from the SPIRALE position. Us-ing the MIMOSA contour advection model (Hauchecorne etal., 2002), PV maps in the region of both measurements havebeen calculated for each hour between 17:00 UT on 20 Jan-uary and 08:00 UT on 21 January on isentropic surfaces, ev-ery 50 K from 400 K to 800 K (corresponding to 16–30 km
Atmos. Chem. Phys., 8, 2421–2435, 2008 www.atmos-chem-phys.net/8/2421/2008/

M. De Maziere et al.: Validation of ACE-FTS v2.2 methane profiles 2427
height). From these it was concluded that SPIRALE andACE-FTS sounded similar air masses in the well-establishedpolar vortex for the whole range of altitudes. The dynami-cal situation was very stable with a PV agreement better than10%. So the geophysical situation was suitable for directcomparisons. In order to compare ACE-FTS and SPIRALEthe difference in the vertical resolution of these two instru-ments had to be taken into account. Indeed, ACE-FTS has avertical resolution of 3–4 km and that of SPIRALE is on theorder of meters. A triangular convolution function of 3 kmat the base (corresponding to the ACE-FTS vertical resolu-tion) has been applied to the SPIRALE data. Consequently,the bottom and the top of SPIRALE profile have been trun-cated by 1.5 km. Then an interpolation onto the ACE-FTS 1km-grid was performed.
Figure 2 shows that the ACE-FTS and SPIRALE CH4 pro-files are in good agreement below 24 km even if error bars donot overlap at the lowest altitudes (below 19 km). The ob-served relative differences over the altitude range of 15 to24 km are smaller than 10%, with ACE-FTS values largerthan SPIRALE except at 22.5 km. Above 24 km the relativedifferences increase, reaching 37% at 25.5 km, with ACE-FTS giving larger values than SPIRALE.
5 Comparisons between ACE-FTS and correlative MI-PAS CH4 profiles
The Michelson Interferometer for Passive AtmosphericSounding (MIPAS) is an infrared limb-sounding Fouriertransform interferometer on board the Envisat satellite,launched in March 2002 (Fischer et al., 2007). It acquiresspectra over the range 685–2410 cm−1 (14.5–4.1µm), whichincludes the vibration-rotation bands of many molecules ofinterest. It is capable of measuring continuously around eachorbit during both day and night, and complete global cover-age is obtained within 24 h.
From July 2002 until March 2004, MIPAS was oper-ated at full spectral resolution (0.025 cm−1) with a nominallimb-scanning sequence of 17 steps from 68 to 6 km with3 km tangent height spacing in the troposphere and strato-sphere, generating complete profiles spaced approximatelyevery 500 km along the orbit. However, in March 2004 oper-ations were suspended following problems with the interfer-ometer slide mechanism. Operations were resumed in Jan-uary 2005 with a 35% duty cycle and reduced spectral reso-lution (0.0625 cm−1).
For the high-resolution part of the mission ESA hasprocessed PT (pressure-temperature) and six “key species”(H2O, O3, HNO3, CH4, N2O and NO2). The algorithmused for the Level 2 analysis is based on the Optimised Re-trieval Model (ORM) (Raspollini et al., 2006; Ridolfi et al.,2000). The spectroscopic database used in this retrieval isthe so-called mipaspf3.1 database (Flaud et al., 2003) whichcontains the same CH4 line parameters as HITRAN 2004
Fig. 2. Left plot: Methane vertical profiles obtained by ACE-FTSsr13151 (in red) and SPIRALE (in black and blue). The solid blueline corresponds to the SPIRALE measurements (very fine reso-lution) and the black diamonds correspond to the SPIRALE profilesmoothed with a triangular convolution function (see Sect. 4). Errorbars are reported on both profiles but, at several altitudes, they areso small that they are indiscernible. Right plot: The relative differ-ences between the two profiles in percent, calculated as (200*(ACE-SPIRALE)/(ACE + SPIRALE)) and the corresponding error bars.
in the microwindows used by MIPAS. These windows are1227.1750–1230.1750 cm−1 in the 6 to 60 km altitude range,and 1350.8750–1353.8750 cm−1 in the 12 to 68 km altituderange. The validation of the MIPAS operational v4.62 dataprocessed by ESA is near completion (Espy and Hartogh,2006; Piccolo and Dudhia, 2007), including a paper describ-ing validation of CH4 (Payan et al., 2007). The latter pa-per concludes, in part from comparisons with g-b FTIR dataand HALOE profiles, that MIPAS overestimates the methaneconcentrations in the pressure range of 140 to 0.3 hPa (∼15to 58 km): on the global scale, the bias is of the order of 5to 20%. The comparisons with HALOE show that the bias islargest at the upper and lower ends of the profiles. The ob-served biases with HALOE are however within the estimatedcombined systematic uncertainties, except at the highest alti-tudes (pressure<0.5 hPa).
In the present paper, MIPAS methane data v4.62 are com-pared with ACE-FTS version 2.2 data for the period from21 February 2004 to 26 March 2004. During the first fivemonths of the ACE mission, only sunsets were measured be-cause of problems with spacecraft pointing at sunrise; there-fore only NH data are available. The selected coincidencecriteria were a maximum spatial and temporal difference of300 km and 6 h, respectively. This slightly relaxed tempo-ral mismatch (6 h) has been chosen in order to increase thestatistics of the comparison, knowing that the species vari-ability does not vary significantly when going from 3 to 6 hmismatch. So finally, the latitudinal coverage of the compar-isons turns out to be limited to 70◦ N –80◦ N.
The comparison has been done including all the match-ing pairs (131) of measurements available in the considered
www.atmos-chem-phys.net/8/2421/2008/ Atmos. Chem. Phys., 8, 2421–2435, 2008
2428 M. De Maziere et al.: Validation of ACE-FTS v2.2 methane profiles
MIPAS&ACE CH4 MEAN
Solid=MIPAS, Open=ACE
0.0 0.5 1.0 1.5 2.0 2.5Volume Mixing Ratio [ppmv]
0
10
20
30
40
50
60
70
Alti
tude
[km
]
70N-80N
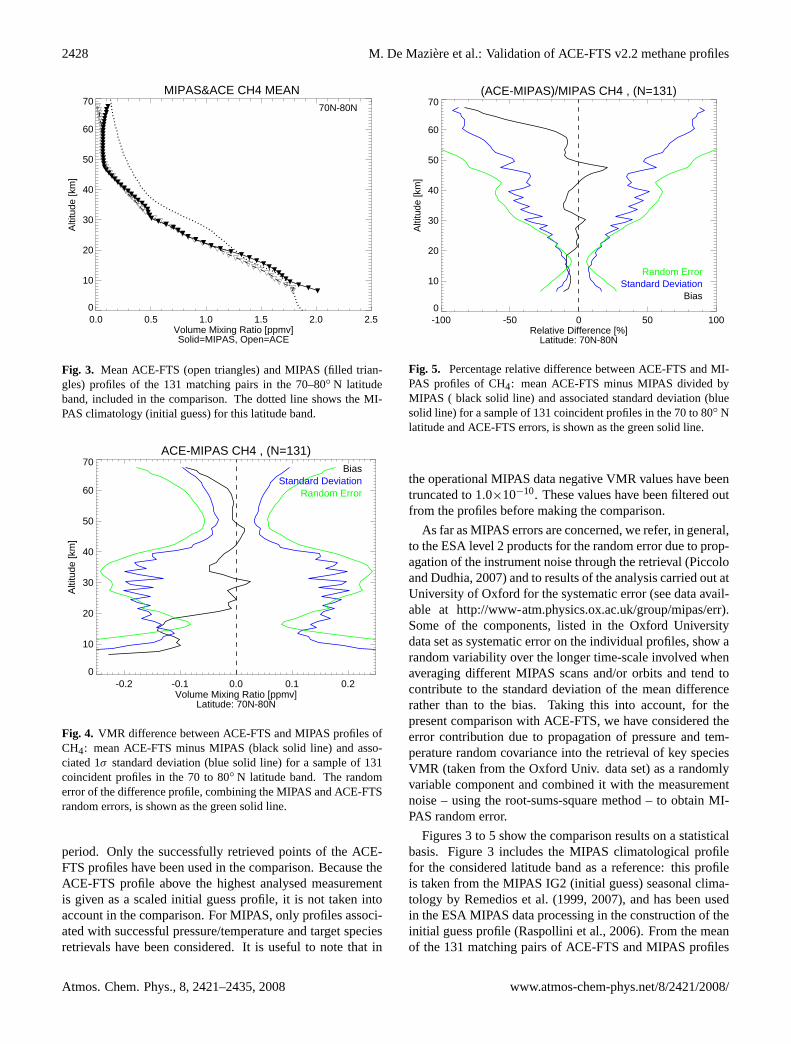
Fig. 3. Mean ACE-FTS (open triangles) and MIPAS (filled trian-gles) profiles of the 131 matching pairs in the 70–80◦ N latitudeband, included in the comparison. The dotted line shows the MI-PAS climatology (initial guess) for this latitude band.
ACE-MIPAS CH4 , (N=131)
Latitude: 70N-80N
-0.2 -0.1 0.0 0.1 0.2Volume Mixing Ratio [ppmv]
0
10
20
30
40
50
60
70
Alti
tude
[km
]
BiasStandard Deviation
Random Error
Fig. 4. VMR difference between ACE-FTS and MIPAS profiles ofCH4: mean ACE-FTS minus MIPAS (black solid line) and asso-ciated 1σ standard deviation (blue solid line) for a sample of 131coincident profiles in the 70 to 80◦ N latitude band. The randomerror of the difference profile, combining the MIPAS and ACE-FTSrandom errors, is shown as the green solid line.
period. Only the successfully retrieved points of the ACE-FTS profiles have been used in the comparison. Because theACE-FTS profile above the highest analysed measurementis given as a scaled initial guess profile, it is not taken intoaccount in the comparison. For MIPAS, only profiles associ-ated with successful pressure/temperature and target speciesretrievals have been considered. It is useful to note that in
(ACE-MIPAS)/MIPAS CH4 , (N=131)
Latitude: 70N-80N
-100 -50 0 50 100Relative Difference [%]
0
10
20
30
40
50
60
70
Alti
tude
[km
]
BiasStandard Deviation
Random Error
Fig. 5. Percentage relative difference between ACE-FTS and MI-PAS profiles of CH4: mean ACE-FTS minus MIPAS divided byMIPAS ( black solid line) and associated standard deviation (bluesolid line) for a sample of 131 coincident profiles in the 70 to 80◦ Nlatitude and ACE-FTS errors, is shown as the green solid line.
the operational MIPAS data negative VMR values have beentruncated to 1.0×10⁻¹⁰. These values have been filtered outfrom the profiles before making the comparison.
As far as MIPAS errors are concerned, we refer, in general,to the ESA level 2 products for the random error due to prop-agation of the instrument noise through the retrieval (Piccoloand Dudhia, 2007) and to results of the analysis carried out atUniversity of Oxford for the systematic error (see data avail-able at http://www-atm.physics.ox.ac.uk/group/mipas/err).Some of the components, listed in the Oxford Universitydata set as systematic error on the individual profiles, show arandom variability over the longer time-scale involved whenaveraging different MIPAS scans and/or orbits and tend tocontribute to the standard deviation of the mean differencerather than to the bias. Taking this into account, for thepresent comparison with ACE-FTS, we have considered theerror contribution due to propagation of pressure and tem-perature random covariance into the retrieval of key speciesVMR (taken from the Oxford Univ. data set) as a randomlyvariable component and combined it with the measurementnoise – using the root-sums-square method – to obtain MI-PAS random error.
Figures 3 to 5 show the comparison results on a statisticalbasis. Figure 3 includes the MIPAS climatological profilefor the considered latitude band as a reference: this profileis taken from the MIPAS IG2 (initial guess) seasonal clima-tology by Remedios et al. (1999, 2007), and has been usedin the ESA MIPAS data processing in the construction of theinitial guess profile (Raspollini et al., 2006). From the meanof the 131 matching pairs of ACE-FTS and MIPAS profiles
Atmos. Chem. Phys., 8, 2421–2435, 2008 www.atmos-chem-phys.net/8/2421/2008/

M. De Maziere et al.: Validation of ACE-FTS v2.2 methane profiles 2429
between 10 and 70 km altitude shown in Fig. 3, one sees im-mediately a very good agreement at all altitudes, except be-low 21 km, between 32 and 40 km, and above 60 km. The dif-ferences ACE-FTS minus MIPAS are shown quantitativelyin Figs. 4 and 5, in absolute units and percentages relative toMIPAS, respectively. Up to 60 km, the agreement looks verygood, with relative differences that are within±12% exceptaround 47 km where it rises to about 20%. If we considerthe standard errors on the mean, defined asσ /
√N with σ the
standard deviation and N the number of coincidences (131),as a measure of the significance of the bias, we find statisti-cally significant negative biases between 8 and 20 km, of theorder of−10%±1.5%, and between 32 and 40 km, of the or-der of−10%±5%. We find a statistically significant positivebias of about 19%±5% around 46–47 km. Above 50 km thebias becomes negative again, of order−10%±6%, and risesdrastically above 60 km, up to−80%±8%. It has been veri-fied that this large bias above 60 km is not due to the differentsensitivity of MIPAS and ACE-FTS to non-local thermody-namic equilibrium (NLTE) conditions. Indeed, the emissionsused in the MIPAS retrievals in theν4 band near 7.6µm arein NLTE conditions during daytime above 50 km, reachinglimb radiance deviations larger than 20% at 60 km and upto 60% at 70 km (Lopez-Puertas et al., 2005), whereas theACE-FTS absorptions are free of NLTE. But separate day-and nighttime comparisons show no significant differencesas to the observed bias above 60 km. Above 60 km however,the random error on the MIPAS CH4 profiles grows verylarge (from 10 to 60%) (Fig. 5 in Raspollini et al., 2006).The biases look compatible with the systematic uncertaintyon the MIPAS profiles due to spectral database errors (Fig. 5in Raspollini et al., 2006) that is of the same order of magni-tude. Another reason for the high bias might be the trunca-tion of negative VMR values in the operational MIPAS datathat was mentioned above.
We also see that the standard deviation of the compari-son is always smaller than the combined random error, as itshould be, except in the range of 15 to 22 km altitude. Thismay be an indication of the fact that the variability in this al-titude range in the dataset corresponds to high latitude north-ern winter-spring conditions, and is therefore too large withinthe chosen coincidence criteria.
6 Comparisons between ACE-FTS and correlativeHALOE CH 4 profiles
6.1 Statistical analyses
A statistical analysis was performed to compare v2.2 CH4profiles from the ACE-FTS to v19 retrievals from HALOEonboard UARS. Like the ACE-FTS, HALOE is a solar oc-cultation instrument, but the inclination of its orbit is 57◦.Unlike ACE-FTS, HALOE is a filter channel spectrometer,that uses a gas filter correlation technique in the 3.3µm re-
0.0 0.5 1.0 1.5CH4 (ppmv)
20
30
40
50
60
70
Alt
itud
e (k
m)
FTSHALOE
Fig. 6. Average profiles (thick lines) for all coincident measure-ments between ACE-FTS (black) and HALOE (gray). Thin linesare the profiles of standard deviations (1σ ) of the distributions,while error bars (often too small to be seen) represent the uncer-tainty in the mean (σ divided by the square root of the number ofcomparisons).
gion (Russell et al., 1993). HALOE ceased operations inNovember 2005, so it operated throughout most of the firsttwo years of the ACE mission. Version 17 HALOE CH4 datawere found to agree with correlative measurements to withinabout 15% in the stratosphere (Park et al., 1996). Compar-isons between v19 HALOE and v1.0 ACE-FTS data weredescribed by McHugh et al. (2005), who found that ACE-FTS CH4 was about 10% higher than HALOE in the 18 to55 km altitude range.
The HALOE and ACE-FTS v2.2 data sets were searchedfor coincident measurements, defined as occurring within 2 hin time and 500 km. ACE-FTS profiles with error bars largerthan 100% have been discarded. A total of 36 coincidenceswere found; 5 of these corresponded to satellite sunrise (SR)occultations in both instruments, while the other 31 corre-sponded to satellite sunset (SS) occultations in both instru-ments. Opening up the time criterion to one day did not resultin any new coincidences. The SS coincidences occurred from4–10 July 2004 (29 coincidences, average latitude 66◦ N) and15 August 2005 (2 coincidences, average latitude 49◦ S); theSR coincidences occurred on 6–7 September 2004 (5 coin-cidences, average latitude 60◦ N). Thus the majority of thecomparisons correspond to polar summer conditions in theNH.
Figure 6 shows the average CH4 profiles measured byboth instruments for all coincidences. Although the analysiswas performed separately for sunrise and sunset occultations,there were too few sunrise coincidences to obtain statisticallysignificant results. Thus, only results for averages over all ofthe coincidences are reported here. Both instruments showvery similar profile shapes, with the ACE-FTS mixing ratios
www.atmos-chem-phys.net/8/2421/2008/ Atmos. Chem. Phys., 8, 2421–2435, 2008

2430 M. De Maziere et al.: Validation of ACE-FTS v2.2 methane profiles
0 10 20 30 40Std Deviation (%)
20
30
40
50
60
70A
ltit
ude
(km
)
FTSHALOE
Fig. 7. Standard deviations of the distributions, 1σ , relative to themean CH4 mixing ratio at each altitude, for all coincident events,for ACE-FTS (black) and HALOE (gray).
biased slightly high compared to HALOE, particularly above35 km and below 25 km. At many altitudes the differencesare accompanied by nearly overlapping error bars, suggest-ing that the differences are insignificant. Thin lines in Fig. 6represent the standard deviations of the distribution of pro-files measured by each instrument. Qualitatively, it is clearthat both instruments measure similar variability.
Measurement variability is quantified more clearly inFig. 7, which shows the standard deviations of the distribu-tions relative to the mean mixing ratios. There is excellentagreement between ACE-FTS and HALOE at all altitudes,with both instruments capturing the local minimum in vari-ability near 35 km, and maxima near 30 and 60 km. Hoppelet al. (1999) have shown evidence for summertime longitu-dinal variations in ozone from 21–28 km, at latitudes simi-lar to those of the coincidences analyzed here. These vari-ations arise from differential meridional transport caused bybreaking of westward-propagating waves that are evanescentin the summer easterly flow. It is likely that this transportwould also result in longitudinal variations in CH4, therebyexplaining the 30-km maximum in variability measured byboth HALOE and ACE-FTS. A similar increase in vari-ability is seen in the ACE-FTS HF and H2O comparisonswith HALOE (E. Mahieu and M. Carleer, respectively, pri-vate communication). Another contribution to the high vari-ability at 30 km may be the chemical conversion betweenH2O and CH4: Nassar et al. (2005) noted that the variabil-ity in either CH4 or H2O was higher than the variability in[H2O]+2[CH4].
Figure 8 shows the percent differences between the instru-ments, plotted as ACE-FTS minus HALOE relative to theaverage of the two instruments. As noted above, measure-ments from ACE-FTS are biased high compared to HALOE,with largest differences above 35 km. The overall agreement,
-10 0 10 20 30 40FTS-HALOE (%)
20
30
40
50
60
70
Alt
itud
e (k
m)
Fig. 8. Average percent differences (solid) between ACE-FTS andHALOE relative to the average of the two instruments, for all co-incidences. Dashed lines represent the 1σ standard deviation of thedistribution of differences while the error bars represent the uncer-tainty in the mean difference, i.e.,σ /
√N where N is the number of
coincidences.
however, is excellent, with differences between the two in-struments on the order of only 5% below 35 km, increasingto about 10–15% from 40–60 km. Overall, these results con-firm that the ACE-FTS CH4 measurements are on a par withthe HALOE data, which have been used extensively for sci-entific analyses.
6.2 Comparisons in equivalent latitude/potential tempera-ture space
ACE-FTS and HALOE CH4 are compared here by mappingboth fields in equivalent latitude (EqL)/potential temperature(θ ) coordinates. The ACE and HALOE “Derived Meteoro-logical Products” (DMPs) from the Met Office assimilatedmeteorological analyses are used to provide EqL/θ ; these,and the mapping versus EqL, are described in detail by Man-ney et al. (2007). The mapping in EqL/θ is done as describedby Manney et al. (1999, 2001) by taking weighted averagesof the measurements around each EqL/θ gridpoint; in addi-tion to being weighted by the “distance” (in EqL,θ ) from thegridpoint, the average is weighted by the uncertainty valueassociated with the measurement point. The EqL grid spac-ing used is 5◦, and theθ grid spacing corresponds to a 3-km grid, comparable to the vertical resolution of ACE-FTSand HALOE CH4 profiles. EqL/time plots are produced inthe same way, but gridding in time instead ofθ . Time gridpoints are at 12:00 UT each day. The use of EqL as a coordi-nate allows us to compare measurements that are not spatiallycoincident, but were measured in the same air mass. Man-ney et al. (2007) showed that using EqL mapping to comparelong-lived trace gases (such as CH4) minimizes most biases
Atmos. Chem. Phys., 8, 2421–2435, 2008 www.atmos-chem-phys.net/8/2421/2008/

M. De Maziere et al.: Validation of ACE-FTS v2.2 methane profiles 2431
related to sampling differences in the EqL regions that arecovered by both instruments.
Figure 9 shows the time evolution of ACE-FTS andHALOE CH4 at 850 K (∼10 hPa or 30 km) in the middlestratosphere from November 2004 through October 2005.The overlaid PV contours show the evolution of the polarvortices (solid contours are in vortex edge region). Becauseof the asymmetry and variability of the winter polar vortices,ACE-FTS measurements provide extensive coverage of con-ditions in and around the polar vortices. Very low CH4 val-ues in the vortices and very strong gradients across the vortexedge are the signature of strong, confined descent in the vor-tex (Schoeberl, et al., 1992 and references therein; Schoeberlet al., 1995; Manney et al., 1999); the close correspondenceof the strong CH4 gradient region in ACE-FTS with the evo-lution and position of the vortex-edge PV contours indicatesgood consistency of the ACE-FTS data with the meteorolog-ical fields.
ACE-FTS and HALOE measurements are rarely closelycoincident in space and time. The general features of theevolution shown in Fig. 9 do, however, suggest good agree-ment in the overall time evolution of CH4 from the two in-struments, for example, the consistency in values, gradientsand time changes along the Arctic vortex edge in Novem-ber through March, similar high latitude values in summerin both hemispheres and in the equatorial regions. Whileclose physical coincidences are few, during a typical month,HALOE and ACE-FTS cover many of the same EqL regions,indicating sampling of similar air masses. Figure 10 takesadvantage of this for a more detailed comparison of ACE-FTS and HALOE, showing EqL/θ plots gridded as describedabove using all data from a month for November 2004, Jan-uary 2005, June 2005, and September 2005. The signature ofstrong descent in the polar vortex is again apparent in ACE-FTS data for September in the SH, and in January in the NH;the NH November ACE-FTS fields show that much of the de-scent in the vortex region has already occurred by then, con-sistent with, e.g., Manney, et al. (2000). In November, the SHsignature of strong descent is still apparent, but in the mid-dle to upper stratosphere, strong mixing as the vortex breaksup has transported high CH4 to high SH latitudes, whilethe lower stratospheric vortex is still strong; this pattern isconsistent with that seen in MLS observations of N2O andH2O at this time (Manney et al., 2005). Differences betweenHALOE and ACE-FTS in regions of common coverage showgood agreement in all periods shown. In November 2004and January 2005, maximum differences are∼0.2 ppmv, andprimarily localized, with no clear evidence of a consistentbias, other than a possible high bias of ACE-FTS with re-spect to HALOE of up to about 15% in January in the SHabove∼1000 K (∼35 km), and a slight low bias of ACE-FTSwith respect to HALOE near 60◦ EqL above 700K (∼30 km).Results for June are similar, except for a larger high ACE-FTS bias in the small EqL-coincident region in the NH upperstratosphere. There is also a slight low bias of ACE-FTS
-80
-40
0
40
80
AC
E-F
TS
v2.
2
1 Nov 1 Jan 1 Mar 1 May 1 Jul 1 Sep
-80
-40
0
40
80
HA
LOE
v19
0.25 0.49 0.73 0.97 1.21 1.45 850K CH4 / ppmv
Equ
ival
ent L
atitu
de (
degr
ees)
Fig. 9. ACE-FTS (top) and HALOE (bottom) CH4 VMR (ppmv)on the 850 K potential temperature surface as a function of equiva-lent latitude and time (see text) for November 2004 through October2005. Overlaid contours are scaled PV from the Met Office meteo-rological analyses, with solid line showing contours demarking thepolar vortex edge region.
with respect to HALOE above 700 K near−60◦ EqL, similarto that seen in the NH in January. These slight low ACE-FTSbiases are along the vortex edge, and may thus be relatedto sampling effects, since in that region of very strong gra-dients, non-uniform sampling at different geographical lati-tudes may still affect EqL/θ results (Manney et al, 2007). TheSeptember results show slightly larger differences, with up toan∼25% high bias (still only∼0.2 ppmv) in much of the up-per stratosphere, especially in the SH equatorward of−40◦
EqL. A slight high bias in the NH upper stratosphere is con-sistent with the analysis shown above in Sect. 6.1 of spatiallycoincident ACE-FTS and HALOE measurements. None ofthose coincidences were in the NH fall and winter periodsrepresented by the November and January plots shown here,and the lack of a clear bias in these plots suggests that theHALOE/ACE-FTS differences may be seasonally-dependentand thus possibly related to atmospheric variability.
6.3 Consistency between both approaches
As pointed out above, one sees similar biases in summer highNH latitudes in both the (EqL/θ ) (Sect. 6.2) and the statisticalapproach based on geographical coincidences (Sect. 6.1). Ithas been verified that the results of the statistical approachare robust with respect to EqL criteria.
The (EqL/θ ) approach has a better global coverage inspace and time, but it has the disadvantage that it is very diffi-cult to identify whether an observed difference is statisticallysignificant or not. The reason is that the value in a gridbox isderived from a different number of observations, and each of
www.atmos-chem-phys.net/8/2421/2008/ Atmos. Chem. Phys., 8, 2421–2435, 2008

2432 M. De Maziere et al.: Validation of ACE-FTS v2.2 methane profiles
500
700
1100
1700
2300
Nov 2004
25
35
45
500
700
1100
1700
2300
Jan 2005
25
35
45
500
700
1100
1700
2300
Jun 2005
25
35
45
-80 -40 0 40 80
500
700
1100
1700
2300
Sep 2005
-80 -40 0 40 80
-80 -40 0 40 80
-80 -40 0 40 80
25
35
45
0.50 0.75 1.00 1.25 1.50 ACE CH4 / ppmv
0.75 1.00 1.25 1.50 HALOE CH4 / ppmv
-0.25 0.00 0.25 0.50 ACE-HALOE CH4 / ppmv
-25 0 25 50 ACE-HALOE CH4 / %
Equivalent Latitude / degrees
Pot
entia
l Tem
pera
ture
/ K
App
roxi
mat
e A
ltitu
de /
km
Fig. 10. Equivalent latitude/potential temperature (see text) sections of (left to right) ACE-FTS CH4, HALOE CH4, ACE-FTS−HALOECH4 in ppmv, and ACE-FTS−HALOE CH4 in percent, for the months (from top to bottom) November 2004, January, June and September2005. Vertical range is 400 K to 2500 K (15 to 50 km).
those is weighted differently according to its distance fromthe center of the gridbox and according to the uncertaintiesreported in the data files. So it is almost impossible to givea value above which the differences are significant. Becauseof this, (EqL/θ ) mapping never provides a fully quantitativecomparison.
Nevertheless, in the present study, it provides an indicationof an ACE-FTS bias that has a latitudinal and seasonal de-pendence, and shows that in almost all cases, biases relativeto HALOE are smaller than 25% in absolute value, leadingto the conclusion that ACE-FTS and HALOE measurementsof methane in the stratosphere-lower mesosphere are in goodagreement.
7 Conclusions
7.1 Northern Hemisphere (NH)
In the high latitude NH, we have many comparisons inwinter–spring namely one with a single SPIRALE profilein polar vortex conditions (67◦ N, January 2006), a statisti-cal set of 131 MIPAS and ACE-FTS matched profiles in the70–80◦ N latitude range between 21 February and 26 March2004, and HALOE comparisons in (EqL/θ) space. We alsohave year-round comparisons with three ground-based sta-tions. The results of these comparisons indicate that theACE-FTS CH4 VMR profiles are biased negative (of theorder of −10%) with respect to MIPAS in the 8 to 20 km
Atmos. Chem. Phys., 8, 2421–2435, 2008 www.atmos-chem-phys.net/8/2421/2008/

M. De Maziere et al.: Validation of ACE-FTS v2.2 methane profiles 2433
altitude range, but positive (+10%) with respect to SPIRALEin a similar (15 to 20 km) altitude range. The comparisonsof partial columns in the 12 to 25 km altitude range at thethree high latitude ground-based stations also show a zero orslightly positive bias of the same order of magnitude. Thecomparisons with MIPAS and g-b FTIR seem to be consis-tent with the observation from Payan et al. (2007), mentionedin Sect. 5, that MIPAS has a high bias in this altitude rangeof the order of 5 to 20%.
At higher altitudes (stratosphere and lower mesosphere,up to 60 km), ACE-FTS CH4VMR profiles are in very goodagreement with MIPAS. Above 60 km, the negative bias ofACE-FTS relative to MIPAS grows to−20%, but the errorson the individual MIPAS and ACE-FTS profiles become veryhigh (larger than 30% for MIPAS).
The comparisons with HALOE do not cover the lowestaltitude range, nor do they cover well the NH winter high lat-itude regions. But in NH high latitude summer conditions,comparisons with HALOE indicate that ACE-FTS has a pos-itive bias of the order of 5 to 15% in the stratosphere, be-low and above 35 km, respectively. The bias rises to +30%above 65 km. If we presume that there is no seasonal varia-tion in the bias in the high latitude NH, then this is consistentwith the good agreement observed between ACE-FTS andMIPAS in this latitude and altitude range and the knowledgethat MIPAS overestimates the methane compared to HALOE(Sect. 5, Payan et al., 2007).
Comparisons with HALOE do cover the NH winter mid-latitude regions, in which we observe a negative bias of ACE-FTS versus HALOE of the order of−5 to−25% in the strato-sphere (>700 K or above∼25 km). The comparisons withthe NH mid-latitude and subtropical g-b FTIR stations (threestations in total) indicate a zero or negative bias of ACE-FTSof similar order of magnitude (−6 to −12%) in the lowerstratosphere (<30 km).
7.2 Southern Hemisphere (SH)
The only comparisons in the SH consist of the comparisonswith HALOE in (EqL/θ ) space, and with ground-based FTIRstations. The former comparisons point to a slightly positivebias of ACE-FTS versus HALOE, of the order of 15% above1000 K (∼35 km) in local summer high latitudes. The neg-ative bias observed in NH mid-latitude in winter may alsoexist in SH mid-latitude winter.
In the lower stratosphere (12–30 km), the most reliable,from a statistical point of view, comparisons with g-b FTIRdata indicate a slightly negative bias of ACE-FTS (of the or-der of−5 to−8%) at southern mid-latitudes.
7.3 General conclusions
Overall one can say from the analyses of ACE-FTS CH4VMR profiles in (EqL/θ ) space and their comparisons withHALOE, that the ACE-FTS data in the stratosphere are con-
sistent with the meteorological fields. They also reproducethe variability of atmospheric methane very well. Based onthe available comparisons with independent correlative data,we can also say that the ACE-FTS CH4 data have an over-all accuracy that is within 10% in the upper troposphere –lower stratosphere, and within 25% in the middle and higherstratosphere up to the lower mesosphere (<60 km). The ob-served biases are small and consistent with reported system-atic uncertainties, to which the spectroscopic uncertaintiesare a large contribution. There are also indications for someseasonal and latitudinal dependence in the differences be-tween ACE-FTS and correlative data.
Acknowledgements.The Atmospheric Chemistry Experiment(ACE), also known as SCISAT, is a Canadian-led mission mainlysupported by the Canadian Space Agency and the Natural Sciencesand Engineering Research Council of Canada. The SPIRALEballoon measurements could only be performed thanks to thetechnical team (L. Pomathiod, B. Gaubicher, G. Jannet); theflight was funded by ESA and the French space agency CNESfor the ENVISAT validation project; the CNES balloon launch-ing team is greatly acknowledged for successful operations.A. Hauchecorne is acknowledged for making available theMIMOSA advection model and F. Coquelet for useful help in thePV calculations and ACE data formatting. The g-b FTIR dataproviders are grateful to their national authorities for financialsupport; in Europe, additional support has come from the EUprojects HYMN (http://www.knmi.nl/samenw/hymn) and UFTIR(http://www.nilu.no/uftir). Work at the Toronto AtmosphericObservatory was supported by NSERC, CFCAS, ABB Bomem,ORDCF, PREA, the University of Toronto, and a grant from theCanadian Space Agency. The National Center for Atmospheric Re-search is supported by the National Sience Foundation. The NCARFTIR observation program at Thule is supported under contractby the National Aeronautics and Space Administration (NASA).Work at the Jet Propulsion Laboratory, California Institute ofTechnology was done under contract with the National Aeronauticsand Space Administration (NASA). NASA grant NNG04GF39Gand L. Harvey have supported the comparisons between HALOEand ACE-FTS. Thanks are due to William Daffer for his role inproduction of ACE and MLS Derived Meteorological Products.
Edited by: T. Wagner
References
Abrams, M. C., Chang, A. Y., Gunson, M. R., Abbas, M. M., Gold-man, A., Irion, F. W., Michelsen, H. A., Newchurch, M. J., Rins-land, C. P., Stiller, G. P., and Zander, R.: On the assessment anduncertainty of atmospheric trace gas burden measurements withhigh-resolution infrared solar occultation spectra from space bythe ATMOS experiment, Geophys. Res. Lett., 23, 2337–2340,1996.
Barnet, C., Datta, S., and Strow, L.: Trace gas measurements fromthe Atmospheric Infrared Sounder (AIRS), in Optical RemoteSensing (Trends in Optics and Photonics Series Vol. 85), 89–92,2003.
www.atmos-chem-phys.net/8/2421/2008/ Atmos. Chem. Phys., 8, 2421–2435, 2008

2434 M. De Maziere et al.: Validation of ACE-FTS v2.2 methane profiles
Bernath, P. F., McElroy, C. T., Abrams, M. C., et al.: AtmosphericChemistry Experiment (ACE): Mission overview, Geophys. Res.Lett., 32, L15S01, doi:10.1029/2005GL022386, 2005.
Boone, C. D., R. Nassar, K. A. Walker, Y. Rochon, S. D. McLeod,C. P. Rinsland, and Bernath, P. F. : Retrievals for the atmosphericchemistry experiment Fourier-transform spectrometer, Appl. Op-tics, 44 (33), 7218–7231, 2005.
Brasseur, G. P., Orlando, J. J., and Tyndall, G. S.: AtmosphericChemistry and Global Change, Oxford University Press (NewYork, Oxford), 1999.
Espy, P. J. and Hartogh, P.: MIPAS: Potential of the experiment,data processing and validation of results, Special Issue in Atmos.Chem. Phys., 2006.
Fischer, H., Birk, M., Blom, C., Carli, B., Carlotti, M., von Clar-mann, T., Delbouille, L., Dudhia, A., Ehhalt, D., Endemann, M.,Flaud, J. M., Gessner, R., Kleinert, A., Koopman, R., Langen, J.,Lpez-Puertas, M., Mosner, P., Nett, H., Oelhaf, H., Perron, G.,Remedios, J., Ridolfi, M., Stiller, G., and Zander, R.: MIPAS: aninstrument for atmospheric and climate research, Atmos. Chem.Phys., 8, 2151–2188, 2008,http://www.atmos-chem-phys.net/8/2151/2008/.
Frankenberg, C., Meirink, J. F., van Weele, M., Platt,U., and Wagner, T.: Assessing methane emissions fromglobal space-borne observations: Science, 308, 1010–1014,doi:10.1126/science.1106644, 2005.
GLOBALVIEW-CH4: Cooperative Atmospheric Data IntegrationProject – Methane. CD-ROM, NOAA ESRL, Boulder, Colorado;also available on Internet athttp://www.esrl.noaa.gov/gmd/ccgg/globalview/ch4/ch4intro.html, 2005.
Gunson, M. R., Farmer, C. B., Norton, R. H., Zander, R., Rinsland,C. P., Shaw, J. H., and Gao, B. C.: Measurements of CH4, N2O,CO, H2O, and O3 in the middle atmosphere by the ATMOS ex-periment on Spacelab 3, J. Geophys. Res., 95, 13 867–13 882,1990.
Gunson, M. R., Abbas, M. M., Abrams, M. C., et al.: The At-mospheric Trace Molecule Spectroscopy (ATMOS) experiment:Deployment on the ATLAS Space Shuttle missions, Geophys.Res. Lett., 23, 2333–2336, 1996.
Hase, F., Hannigan, J. W., Coffey, M. T., Goldman, A., Hopfner,M., Jones, N. B., Rinsland, C. P., and Wood, S. W.: Inter-comparison of retrieval codes used for the analysis of high-resolution, ground-based FTIR measurements, J. Quant. Spec-trosc. Ra. Trans., 87, 25–52, 2004.
Hauchecorne, A., Godin, S., Marchand, M., Heese, B., andSouprayen, C.: Quantification of the transport of chemical con-stituents from the polar vortex to midlatitudes in the lowerstratosphere using the high-resolution advection model MI-MOSA and effective diffusivity, J. Geophys. Res., 107, 8289,doi:10.1029/2001JD000491, 2002.
Hoppel, K. W., Bowman, K. P., and Bevilacqua, R. M.: NorthernHemisphere summer ozone variability observed by POAM II,Geophys. Res. Lett., 26, 827–830, 1999.
Lopez-Puertas, M., Funke, B., Gil-Lopez, S., Lopez-Valverde, M.A., von Clarmann, T., Fischer, H., Oelhaf, H., Stiller, G., Kauf-mann, M., Koukouli, M. E., and Flaud, J.-M.: Atmosphericnon-local thermodynamic equilibrium emissions as observed bythe Michelson Interferometer for Passive Atmospheric Sounding(MIPAS), C.R. Physique, Elsevier SAS, 6, 848–862, 2005.
Manney, G. L., Michelsen, H. A., Santee, M. L., Gunson, M. R.,
Irion, F. W., Roche, A. E., and Livesey, N. J.: Polar vortex dy-namics during spring and fall diagnosed using trace gas obser-vations from the Atmospheric Trace Molecule Spectroscopy in-strument, J. Geophys. Res., 104, 18 841–18 866, 1999.
Manney, G. L., Michelsen, H. A., Irion, F. W., Gunson, M. R., Toon,G. C., and Roche, A. E.: Lamination and polar vortex develop-ment in fall from ATMOS long-lived trace gases observed duringNovember 1994, J. Geophys. Res., 105, 29 023–29 038, 2000.
Manney, G. L., Michelsen, H. A., Bevilacqua, R. M., Gunson, M.R., Irion, F. W. Livesey, N. J., Oberheide, J., Riese, M., Rus-sell III, J. M., Toon, G. C., and Zawodny, J. M.: Comparisonof satellite ozone observations in coincident air masses in earlyNovember 1994, J. Geophys. Res., 106, 9923–9944, 2001.
Manney, G. L., Santee, M. L., Livesey, N. J., Froidevaux, L.,Read, W. G., Pumphrey, H. C., Waters, J. W., and Pawson, S.:EOS Microwave Limb Sounder observations of the Antarctic po-lar vortex breakup in 2004, Geophys. Res. Lett., 32, L12811,doi:10.1029/2005GL022823, 2005.
Manney, G. L., Daffer, W. H., Zawodny, J. M., Bernath, P. F., Hop-pel, K. W., Walker, K. A., Knosp, B. W., Boone, C., Remsberg,E. E., Santee, M. L., Lynn Harvey, V., Pawson, S., Jackson, D. R.,Deaver, L., McElroy, C. T., McLinden, C. A., Drummond, J. A.,Pumphrey, H. C., Lambert, A., Schwartz, M. J., Froidevaux, L.,McLeod, S., Takacs, L. L., Suarez, M. J., Trepte, C. R., Cuddy,D. T., Livesey, N. J., Harwood, R. S., and Waters, J. W.: SolarOccultation Satellite Data and Derived Meteorological Products:Sampling Issues and Comparisons with Aura MLS, J. Geophys.Res., 112, D24S50, doi:10.1029/2007JD008709, 2007.
McHugh, M., Magill, B., Walker, K. A., Boone, C. D., Bernath,P. F., and Russell, III, J. M.: Comparison of atmospheric re-trievals from ACE and HALOE, Geophys. Res. Lett. 32, L15S10,doi:10.1029/2005GL022403, 2005.
Mondelain, D., Payan, S., Deng, W., Camy-Peyret, C., Hurtmans,D., and Mantz, A. W.: Measurement of the temperature depen-dence of line mixing and pressure broadening parameters be-tween 296 and 90 K in theν3 band of12CH4 and their influenceon atmospheric methane retrievals, J. Mol. Spectrosc., 244, 130–137, 2007.
Moreau, G., Robert, C., Catoire, V., Chartier, M., Camy-Peyret,C., Huret, N., Pirre, M., Pomathiod, L., and Chalumeau, G.:SPIRALE: a multispecies in situ balloon-borne instrument withsix tunable diode laser spectrometers, Appl. Opt., 44(28), 5972–5989, 2005.
Nassar, R., Bernath, P. F., Boone, C. D., Manney, G. L.,McLeod, S. D., Rinsland, C. P., Skelton, R., and Walker, K.A.: Stratospheric abundances of water and methane based onACE-FTS measurements, Geophys. Res. Lett., 32, L15S04,doi:10.1029/2005GL022383, 2005.
Park, J. H., Russell III, J. M., Gordley, L. L., Drayson, S. R., Benner,D. C., McInerney, J. M., Gunson, M. R., Toon, G. C., Sen, B.,Blavier, J.-F., Webster, C. R., Zipf, E. C., Erdman, P., Schmidt,U., and Schiller, C.: Validation of Halogen Occultation Exper-iment CH4 measurements from the UARS, J. Geophys. Res.,101(D6), 10 183–10 203, 1996.
Payan, S., Camy-Peyret, C., Oelhaf, H., Wetzel, G., Maucher, G.,Kleim, C., Pirre, M., Huret, N., Engel, A., Volk, M. C., Kuell-mann,H., Kuttippurath, J., Cortesi, U., Bianchini, G., Mencar-aglia, F., Raspollini, P., Redaelli, G., Vigouroux, C., De Mazire,Mikuteit, S., Blumenstock, T., Velazco, V., Notholt, J., Mahieu,
Atmos. Chem. Phys., 8, 2421–2435, 2008 www.atmos-chem-phys.net/8/2421/2008/

M. De Maziere et al.: Validation of ACE-FTS v2.2 methane profiles 2435
M., Duchatelet, P., Smale, D., Wood, S., Jones, N., M., Piccolo,C., Payne, V., Bracher, A., Glatthor, N., Stiller, G., Grunow, K.,Jeseck, P., Ye, T., Pfeilsticker, K., and Butz, A.: Validation anddata characteristics of methane and nitrous oxide profiles ob-served by MIPAS and processed with Version 4.61 algorithm,Atmos. Chem. Phys. Discuss., 7, 18043–18111, 2007,http://www.atmos-chem-phys-discuss.net/7/18043/2007/.
Piccolo, C. and Dudhia, A.: Precision validation of MIPAS-Envisatproducts, Atmos. Chem. Phys., 7, 1915–1923, 2007,http://www.atmos-chem-phys.net/7/1915/2007/.
Raspollini, P., Belotti, C., Burgess, A., Carli, B., Carlotti, M., Cec-cherini, S., Dinelli, B. M., Dudhia, A., Flaud, J.-M., Funke, B.,Hopfner, Lopez-Puertas, M., Payne, V., Piccolo, C., Remedios,J. J., Ridolfi, M., and Spang, R.: MIPAS level 2 operational anal-ysis, Special Issue MIPAS: Potential of the experiment, data pro-cessing and validation of results, edited by: Espy, P. J. and Har-togh, P., Atmos. Chem. Phys., 6, 5605–5630, 2006,http://www.atmos-chem-phys.net/6/5605/2006/.
Reber, C. A., Trevathan, C. E., McNeal, R. J., and Luther, M.R.: The Upper Atmosphere Research Satellite (UARS) mission,J. Geophys. Res., 98, 10 643–10 647, doi:10.1029/92JD02828,1993.
Remedios, J. J., Ruth, S. L., Rodgers, C. D., Taylor, F. W., Roche, A.E., Gille, J. C., Gunson, M. R., Russell III, J. M., Park, J., Zipf, E.C., and Erdman, P. W.: Measurements of methane and nitrous ox-ide distributions by the improved stratospheric and mesosphericsounder: Retrieval and validation, J. Geophys. Res., 101, 9843–9871, 1996.
Remedios, J. J.: Extreme Atmospheric Constituent Profiles for MI-PAS, Proceedings of the European symposium on atmosphericmeasurements from space, ESTEC, Netherlands, 20–22 January,2, 779–783, 1999.
Remedios, J. J., Leigh, R. J., Waterfall, A. M., Moore, D. P., Sem-bhi, H., Parkes, I., Greenhough, J., Chipperfield, M. P., andHauglustaine, D.: MIPAS reference atmospheres and compar-isons to V4.61/V4.62 MIPAS level 2 geophysical data sets, Spe-cial Issue “MIPAS: Potential of the experiment, data processingand validation of results”, edited by: Espy, P. J. and Hartogh, P.,Atmos. Chem. Phys. Discuss., 7, 9973–10017, 2007,http://www.atmos-chem-phys-discuss.net/7/9973/2007/.
Ridolfi, M., Carli, B., Carlotti, M., von Clarmann, T., Dinelli, B. M.,Dudhia, A., Flaud, J.-M., Hopfner, M., Morris, P. E., Raspollini,P., Stiller, G., and Wells, R. J.: Optimized forward model and re-trieval scheme for MIPAS near-real-time data processing, Appl.Opt., 39, 1323–1340, 2000.
Roche, A. E.,Kumer, J. B., Nightingale, R. W., Mergenthaler, J. L.,Ely, G. A., Bailey, P. L., Massie, S. T., Gille, J. C., Edwards,D. P., Gunson, M. R., Abrams, M. C., Toon, G. C., Webster, C.R., Traub, W. A., Jucks, K. W., Johnson, D. G., Murcray, D. G.,Murcray, F. H., Goldman, A., and Zipf, E. C.: Validation of CH4and N2O measurements by the CLAES instrument on the UpperAtmospheric Research Satellite, J. Geophys. Res., 101, 9679–9710, 1996.
Rodgers, C. D.: Inverse methods for atmospheric sounding: The-ory and Practice, Series on Atmospheric, Oceanic and PlanetaryPhysics, 2, World Scientific Publishing Co., Singapore, 2000.
Rodgers, C. D. and Connor, B. J.: Intercomparison of remote sound-ing instruments, J. Geophys. Res., 108, 4116–4129, 2003.
Rothman, L. S., Jacquemart, D., Barbe, A., Chris Bennerc, D., Birk,M., Brown, L. R., Carleer, M. R., Chackerian Jr., C., Chance, K.,Coudert, L. H., Dana, V., Devi, V .M., Flaud, J.-M., 30 Gamache,R. R., Goldman, A., Hartmann, J.-M., Jucks, K. W., Maki, A. G.,Mandin, J.-Y., Massie, S. T., Orphal, J., Perrin, A., Rinsland, C.P., Smith, M. A. H., Tennyson, J., Tolchenov, R. N., Toth, R. A.,Vander Auwera, J., Varanasi, P., and Wagner, G.: The HITRAN2004 molecular spectroscopic database, J. Quant. Spectrosc. Ra.Trans., 96, 139–204, 2005.
Russell, J. M., III, Gordley, L. L., Park, J. H., Drayson, S. R., Tuck,A. F., Harries, J. E., Cicerone, R. J., Crutzen, P. J., and Frederick,J. E.: The Halogen Occultation Experiment, J. Geophys. Res.,98, 10 777–10 797, 1993.
Schoeberl, M. R., Lait, L. R., Newman, P. A., and Rosenfield, J. E.:The structure of the polar vortex, J. Geophys. Res., 97, 7859–7882, 1992.
Schoeberl, M. R., Luo, M., and Rosenfield, J. E.: An analysis ofthe Antarctic Halogen Occultation Experiment trace gas obser-vations, J. Geophys. Res., 100, 5159–5172, 1995.
Vigouroux, C., De Maziere, M., Errera, Q., Mahieu, E., Duchatelet,P., Wood, S., Smale, D., Mikuteit, S., Blumenstock, T., Hase,F., and Jones, N.: Comparisons between ground-based FTIR andMIPAS N2O and HNO3 profiles before and after assimilation inBASCOE, Atmos. Chem. Phys., 7, 377–396, 2007,http://www.atmos-chem-phys.net/7/377/2007/.
Wahlen, M.: The Global Methane Cycle, Annu. Rev. Earth Pl. Sc.,21, 407–426, 1993.
www.atmos-chem-phys.net/8/2421/2008/ Atmos. Chem. Phys., 8, 2421–2435, 2008
Related Documents