Validation of a Method for the Detection of Cocoa Butter Equivalents in Cocoa Butter and Plain Chocolate Report on the Validation Study Manuela Buchgraber, Elke Anklam 2003 EUR 20685 EN EUROPEAN COMMISSION JOINT RESEARCH CENTRE Institute for Reference Materials and Measurements Food Safety and Quality Unit B-2440 Geel (Belgium)

Welcome message from author
This document is posted to help you gain knowledge. Please leave a comment to let me know what you think about it! Share it to your friends and learn new things together.
Transcript
Validation of a Method for the Detection ofCocoa Butter Equivalents in Cocoa Butter and
Plain Chocolate
Report on the Validation Study
Manuela Buchgraber, Elke Anklam
2003 EUR 20685 EN
EUROPEAN COMMISSIONJOINT RESEARCH CENTRE
Institute for Reference Materials and MeasurementsFood Safety and Quality UnitB-2440 Geel (Belgium)
- 2 -
Abstract
A European collaborative study has been conducted to validate an analytical procedure for
the detection of cocoa butter equivalents in cocoa butter and plain chocolate. In principle
the fat is separated by high-resolution gas chromatography into triglyceride fractions
according to their acyl-C-numbers, and within a given number, also according to
unsaturation. The presence of CBE is detected by linear regression analysis applied to
individual triglyceride fractions of the fat analysed. 15 laboratories participated in the
validation study. The results of the ring test clearly demonstrated that the applied method
performs well with a detection limit of at least 2 % cocoa butter equivalent admixture to
cocoa butter corresponding to 0.4 % in chocolate (assumed fat content of chocolate 20 %).
Keywords: Cocoa butter, Cocoa butter equivalents, HR-GC, triglyceride profile, regression
analysis, validation
- 3 -
CONTENTS
ABSTRACT 2CONTENTS 3LIST OF ABBREVIATIONS 41 RATIONALE - BACKGROUND 52 OBJECTIVE 63 METHOD DESCRIPTION 64 PARTICIPANTS 84.1 Co-ordination of the validation study 84.2 Preparation and distributing of the test samples 84.3 Homogeneity tests 84.4 Measurements 84.5 Collation and statistical evaluation of results 9
5 TEST SAMPLES 95.1 Homogeneity study 10
6 THE VALIDATION STUDY 116.1 Design of the validation study 116.2 Analysis of test samples 126.3 Technical evaluation of the results submitted 126.4 Methods employed in the validation study 156.5 Statistical evaluation of the results submitted 16
7 RESULTS 178 CONCLUSIONS 189 LITERATURE 18ANNEX A 19ANNEX B 22ANNEX C 31
- 4 -
LIST OF ABBREVIATIONS
ANOVA analysis of variance
C correct classification
CB cocoa butter
CBE cocoa butter equivalent
CRM certified reference material
FN false negative classification
FP false positive classification
HR-GC high-resolution gas chromatography
H2 Hydrogen
He Helium
IRMM Institute for Reference Materials and Measurements
JRC Joint Research Centre
N2 Nitrogen
OCI on-column injection
PMF palm mid fraction
POO 1,2-dioleoyl-3-palmitoyl-rac-glycerol
POP 1,3-dipalmitoyl-2-oleoylglycerol
POS 1-palmitoyl-2-oleoyl-3-stearoylglycerol
PTV programmed temperature vaporizer
r repeatability
R reproducibility
Rs resolution
RSDr repeatability relative standard deviation
RSDR reproducibility relative standard deviation
SOO 1,2-dioleoyl-3-stearoyl-rac-glycerol
SOP standard operation procedure
SOS 1,3-distearoyl-2-oleoylglycerol
sr repeatability standard deviation
sR reproducibility standard deviation
TG triglyceride

- 5 -
1 RATIONALE - BACKGROUND
According to the Directive 2000/36/EC of the European Parliament and the Council [1]
vegetable fats other than cocoa butter (CB) may be added to chocolate products up to a
level of 5 % of the finished product, without reducing the minimum content of CB or total
dry cocoa solids. If such fats are added, consumers have to be guaranteed correct, neutral
and objective information by indicating in a conspicuous and clearly legible way that
vegetable fats other than CB are present in the product. Member States’ laws, regulations
and administrative provisions need to comply with the new Chocolate Directive before
August 2003.
Only vegetable fats fulfilling the technical and scientific criteria as specified in Annex II of
the Directive, so called cocoa butter equivalents (CBE), may be used besides CB for the
manufacture of chocolate products. In conformity with the above criteria, the following
vegetable fats, obtained from the plants listed below, may be used singly or in blends:
- Illipé, Borneo tallow or Tengkawang (Shorea spp.)
- Palm oil (Elaeis guineensis, Elaeis olifera)
- Sal (Shorea robusta)
- Shea (Butyrospermum parkii)
- Kokum gurgi (Garcinia indica)
- Mango kernel (Mangifera indica)
CBEs resemble the chemical composition and physical properties of CB very closely,
making them therefore extremely difficult to quantify and even in some cases to detect
(especially at very low levels).
As the statement on the package label indicating that vegetable fats other than CB have
not been added to chocolate products is not precluded in the new Chocolate Directive, very
sensitive methods for detection are needed to assess compliance with labelling. A specific
and reliable analytical method for the detection and quantification of these CBEs is not
prescribed, however, the Statement of the Council’s Reasons refers to the final report of
the European Commission’s Joint Research Centre (JRC) devising analytical methods for
the determination of cocoa butter and other vegetable fats in chocolate [2].
Separation of triglycerides (TGs) by high-resolution gas chromatography (HR-GC) in
combination with statistical evaluation of the results proved to be the most accurate

- 6 -
technique for the detection and quantification of CBEs in genuine CB. Furthermore, the
necessity for a certified cocoa butter reference material (CB-CRM) in order to facilitate the
work of the analytical chemists was recognised. The latter has been prepared and will be
available to the public by the JRC’s Institute for Reference Materials and Measurements
(IRMM).
The CB-CRM (IRMM 801) was used as a calibrant for TG profiling by HR-GC to create a
standardised database containing data from more than 74 different CBs and 94 CBEs. This
data base was established by the JRC. An algorithm, based on a modified method
proposed by Padley and Timms [3], for the interpretation of TG data obtained by HR-GC
was also elaborated by the JRC to be used for the detection of CBEs in cocoa butter and
plain chocolate [4].
2 OBJECTIVE
� To conduct an international collaborative study in order to validate a gas
chromatography-based method combined with an algorithm to detect CBEs in genuine
CB and plain chocolate.
� To use a matrix material of genuine CB with a certified TG profile as an aid to ensure
high comparability of the results.
3 METHOD DESCRIPTION
Cocoa butter, or the fat obtained by solvent extraction from plain chocolate, has to be
separated by HR-GC into TG fractions according to their molecular weight and degree of
unsaturation. For the interpretation of TG data obtained by HR-GC an algorithm as
originally proposed by Padley and Timms [3], who used TGs of the same carbon number
instead of individual TGs, is used [4]. The content of SOS is linearly related to POP when
the content of the three major TGs is normalised so that %-POP + %-POS + %-SOS
equals 100 % (Figure 1).
- 7 -
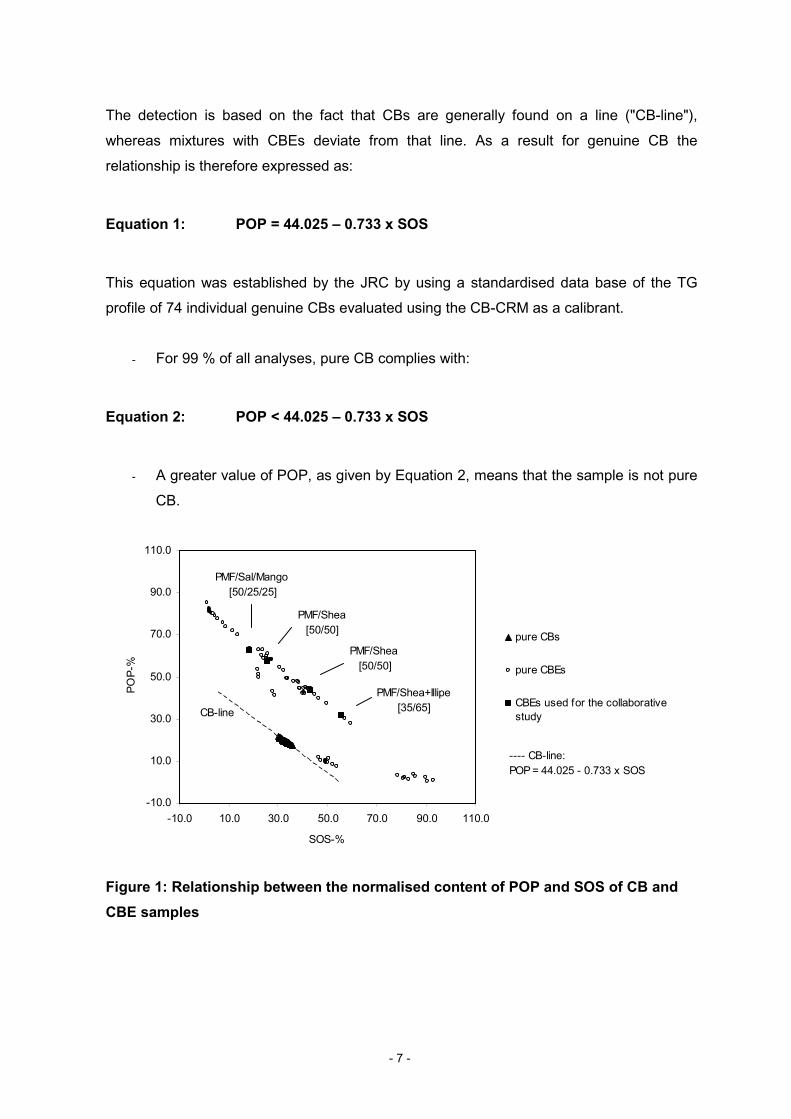
The detection is based on the fact that CBs are generally found on a line ("CB-line"),
whereas mixtures with CBEs deviate from that line. As a result for genuine CB the
relationship is therefore expressed as:
Equation 1: POP = 44.025 – 0.733 x SOS
This equation was established by the JRC by using a standardised data base of the TG
profile of 74 individual genuine CBs evaluated using the CB-CRM as a calibrant.
- For 99 % of all analyses, pure CB complies with:
Equation 2: POP < 44.025 – 0.733 x SOS
- A greater value of POP, as given by Equation 2, means that the sample is not pure
CB.
Figure 1: Relationship between the normalised content of POP and SOS of CB andCBE samples
-10.0
10.0
30.0
50.0
70.0
90.0
110.0
-10.0 10.0 30.0 50.0 70.0 90.0 110.0
SOS-%
POP-
%
pure CBs
pure CBEs
CBEs used for the collaborativestudy
PMF/Sal/Mango [50/25/25]
PMF/Shea[50/50]
PMF/Shea+Illipe [35/65]
PMF/Shea [50/50]
CB-line
---- CB-line:POP = 44.025 - 0.733 x SOS

- 8 -
Individual testing laboratories do not need to establish a "CB line". Comparability of results
between various laboratories is maintained through calibration of the measurements
against the commercially available CB-CRM (IRMM 801).
4 PARTICIPANTS
4.1 Co-ordination of the validation study
European Commission, Joint Research Centre, Institute for Reference Materials and
Measurements, Geel (B)
4.2 Preparation and distributing of the test samples
European Commission, Joint Research Centre, Institute for Reference Materials and
Measurements, Geel (B)
4.3 Homogeneity tests
European Commission, Joint Research Centre, Institute for Reference Materials and
Measurements, Geel (B)
4.4 Measurements
ADM Noble & Thörl GmbH, Hamburg (D)
Barry Callebaut B.V., Bussum (B)
Britannia Food Ingredients Ltd., Goole (UK)
Department of Dairy Research and Bacteriology, University of Agricultural Sciences,
Vienna (A)
DGCCRF Laboratoire de Paris-Massy, Massy (F)
DGCCRF Laboratoire Interrégional Talence, Talence (F)
Dipartimento di Scienze degli Alimenti, Università degli Studi, Bologna (I)
Eurofins Scientific Analytics, Nantes (F)
European Commission, Joint Research Centre, Institute for Health and Consumer
Protection, Ispra (I)
- 9 -
Fuji Oil Europe, Gent (B)
Gerkens Kakao B.V., Wormer (NL)
Karlshamns Sweden AB, Division Edible Oils, Karlshamn (S)
Laboratoire Chimie Analytique et Science de l’Aliment, Illkirch-Graffenstaden (F)
Lebensmittelchemisches Institut des Bundesverbandes der Deutschen Süßwarenindustrie,
Köln (D)
WEJ GmbH, Hamburg (DE)
4.5 Collation and statistical evaluation of results
European Commission, Joint Research Centre, Institute for Reference Materials and
Measurements, Geel (B)
5 TEST SAMPLES
Samples of CBs and CBEs (Table 1) were obtained from the cocoa processing industry
and other vegetable fat producers and chocolate samples (Table 3) in retail stores. The
CBEs used for preparing the CB/CBE blends are indicated in Table 1 and Figure 1. The
selected CBEs included in this study consisted of a variety of industrially used fats,
including Illipé-containing fats in combination with other CBEs.
Eleven fat samples, representing three pure CBs, four samples of 2 % and four samples of
4 % CBE admixture to CB, dissolved in iso-octane, were sent to the participating
laboratories (Table 2). The CBE admixtures correspond to 0.4 % and 0.8 % in chocolate
(assumed fat content of chocolate 20 %). Furthermore, two chocolate samples, one with
the addition of CBE and one without had to be measured (Table 3). The samples were
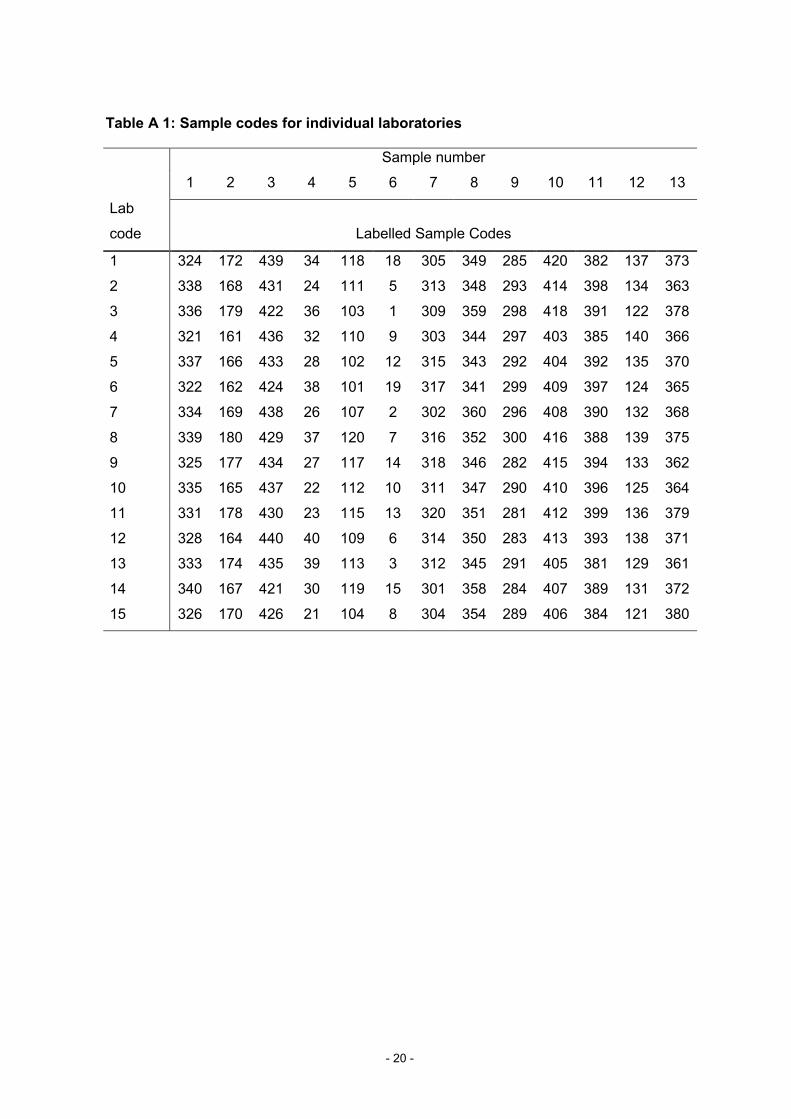
labelled randomly (Table A 1, Annex A). Additionally, one ampoule of the CB-CRM (IRMM
801) was provided for calibration purposes and system suitability check.
Table 1: Genuine CBs and CBEs used in the study and for the preparation of CB/CBEmixtures
CB No. Country Origin CBE No. Type [composition; %]I Grenada I PMF/Sal/Mango [50/25/25]II Ghana II PMF/Shea [50/50]III Ivory Coast/Nigeria/Cameroon’ III PMF/(Shea + Illipe) [35/65]
IV PMF/Shea/Illipe [50/25/25]
- 10 -
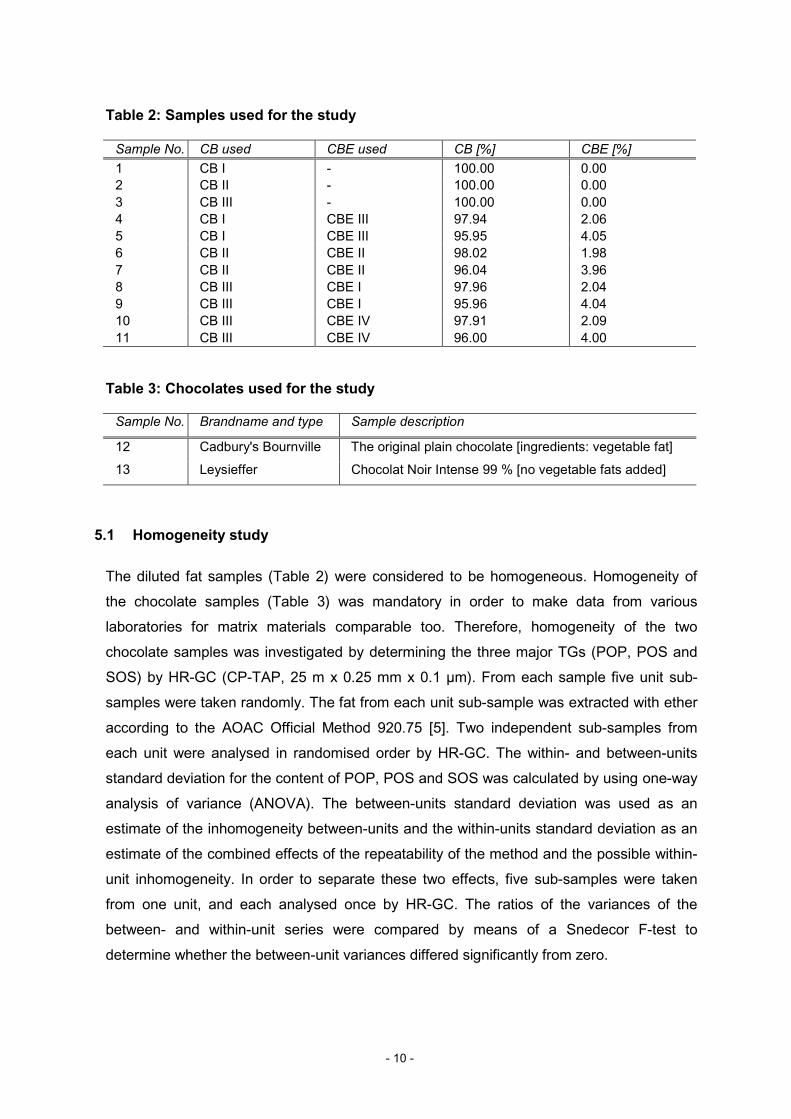
Table 2: Samples used for the study
Sample No. CB used CBE used CB [%] CBE [%]1 CB I - 100.00 0.002 CB II - 100.00 0.003 CB III - 100.00 0.004 CB I CBE III 97.94 2.065 CB I CBE III 95.95 4.056 CB II CBE II 98.02 1.987 CB II CBE II 96.04 3.968 CB III CBE I 97.96 2.049 CB III CBE I 95.96 4.0410 CB III CBE IV 97.91 2.0911 CB III CBE IV 96.00 4.00
Table 3: Chocolates used for the study
Sample No. Brandname and type Sample description
12 Cadbury's Bournville The original plain chocolate [ingredients: vegetable fat]
13 Leysieffer Chocolat Noir Intense 99 % [no vegetable fats added]
5.1 Homogeneity study
The diluted fat samples (Table 2) were considered to be homogeneous. Homogeneity of
the chocolate samples (Table 3) was mandatory in order to make data from various
laboratories for matrix materials comparable too. Therefore, homogeneity of the two
chocolate samples was investigated by determining the three major TGs (POP, POS and
SOS) by HR-GC (CP-TAP, 25 m x 0.25 mm x 0.1 µm). From each sample five unit sub-
samples were taken randomly. The fat from each unit sub-sample was extracted with ether
according to the AOAC Official Method 920.75 [5]. Two independent sub-samples from
each unit were analysed in randomised order by HR-GC. The within- and between-units
standard deviation for the content of POP, POS and SOS was calculated by using one-way
analysis of variance (ANOVA). The between-units standard deviation was used as an
estimate of the inhomogeneity between-units and the within-units standard deviation as an
estimate of the combined effects of the repeatability of the method and the possible within-
unit inhomogeneity. In order to separate these two effects, five sub-samples were taken
from one unit, and each analysed once by HR-GC. The ratios of the variances of the
between- and within-unit series were compared by means of a Snedecor F-test to
determine whether the between-unit variances differed significantly from zero.
- 11 -
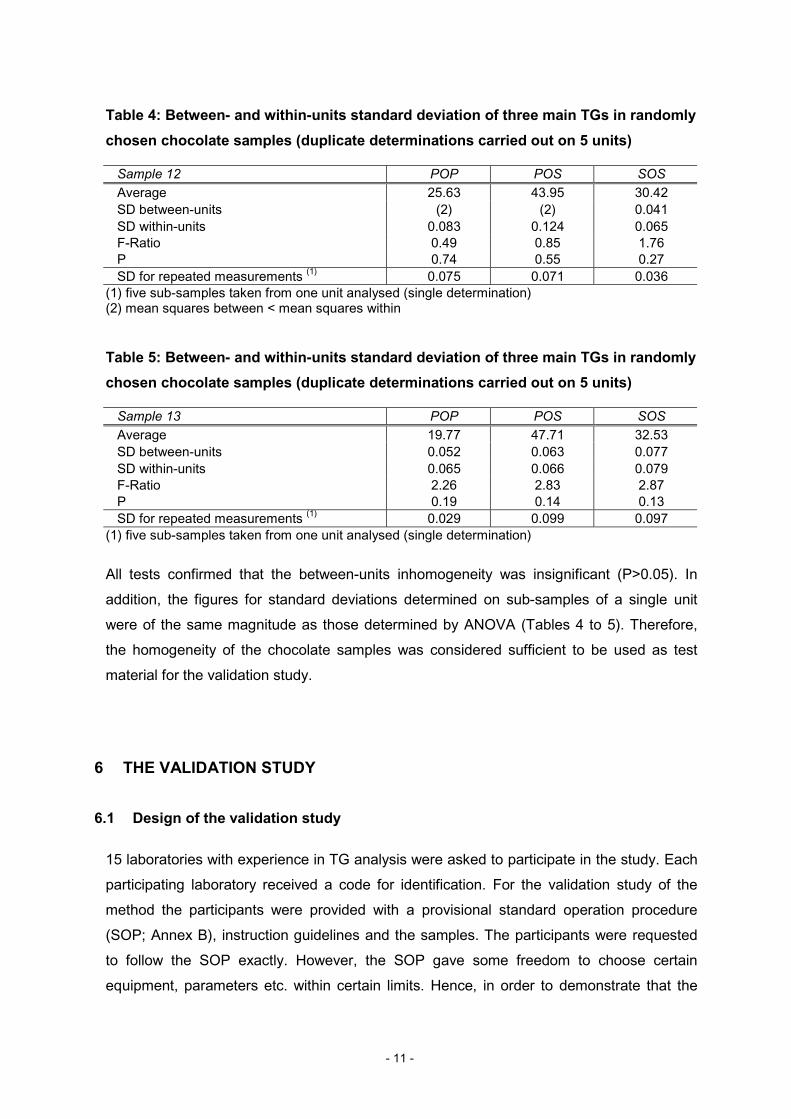
Table 4: Between- and within-units standard deviation of three main TGs in randomlychosen chocolate samples (duplicate determinations carried out on 5 units)
Sample 12 POP POS SOSAverage 25.63 43.95 30.42SD between-units (2) (2) 0.041SD within-units 0.083 0.124 0.065F-Ratio 0.49 0.85 1.76P 0.74 0.55 0.27SD for repeated measurements (1) 0.075 0.071 0.036
(1) five sub-samples taken from one unit analysed (single determination)(2) mean squares between < mean squares within
Table 5: Between- and within-units standard deviation of three main TGs in randomlychosen chocolate samples (duplicate determinations carried out on 5 units)
Sample 13 POP POS SOSAverage 19.77 47.71 32.53SD between-units 0.052 0.063 0.077SD within-units 0.065 0.066 0.079F-Ratio 2.26 2.83 2.87P 0.19 0.14 0.13SD for repeated measurements (1) 0.029 0.099 0.097
(1) five sub-samples taken from one unit analysed (single determination)
All tests confirmed that the between-units inhomogeneity was insignificant (P>0.05). In
addition, the figures for standard deviations determined on sub-samples of a single unit
were of the same magnitude as those determined by ANOVA (Tables 4 to 5). Therefore,
the homogeneity of the chocolate samples was considered sufficient to be used as test
material for the validation study.
6 THE VALIDATION STUDY
6.1 Design of the validation study
15 laboratories with experience in TG analysis were asked to participate in the study. Each
participating laboratory received a code for identification. For the validation study of the
method the participants were provided with a provisional standard operation procedure
(SOP; Annex B), instruction guidelines and the samples. The participants were requested
to follow the SOP exactly. However, the SOP gave some freedom to choose certain
equipment, parameters etc. within certain limits. Hence, in order to demonstrate that the

- 12 -
HR-GC method applied was fit-for-purpose participants had to meet predefined
performance criteria:
- Separation of critical pairs of components POS/POO and SOS/SOO with a
chromatographic resolution of at least 1.0.
- Detector response factors determined for the five main TGs (POP, POS, POO,
SOS, SOO) should vary within a range of 0.80 – 1.20.
Both criteria had to be demonstrated by analysing the provided CB-CRM (IRMM 801).
6.2 Analysis of test samples
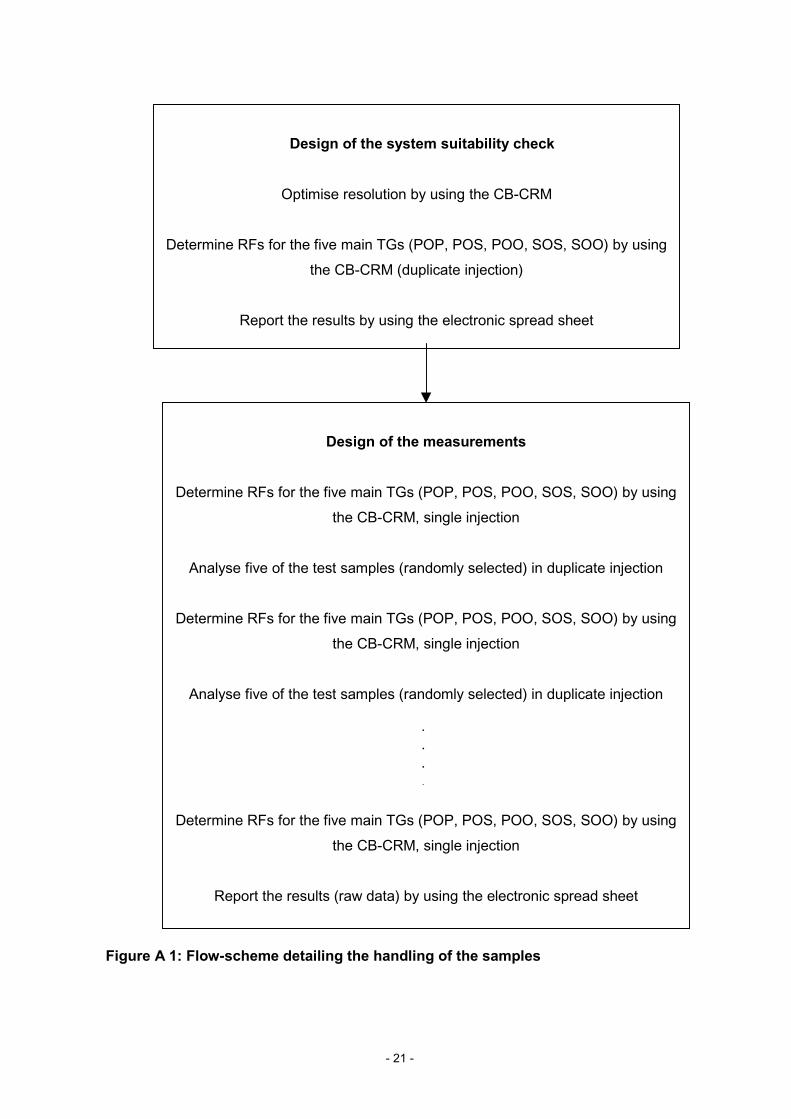
Before analysing the test samples the participants had to check the system suitability. The
test samples had to be analysed in random order. Response factors for the five main TGs
(POP, POO, POS, SOS, SOO) had to be determined before analysing the first test sample
and after every 10th analyses by using the CB-CRM. A flow scheme of the sample handling
is given in Annex A in Figure A 1. The sample number, retention time and the area counts
of individual TG fractions had to be reported in an electronic spreadsheet provided by the
co-ordinator. By using the electronic spreadsheet the raw data were automatically applied
to the proposed algorithm (Equation 1 and 2).
6.3 Technical evaluation of the results submitted
The results of the individual laboratories were examined along with the submitted raw data
and chromatograms. Two laboratories (14 and 15) out of the 15 participants were rejected
in advance from the validation study since they did not follow the SOP and consequently
not fulfilled the performance criteria as laid down in the SOP.
Laboratory 14 applied a capillary column of 10 m length with an apolar stationary phase
(DB1; J&W Scientific) instead of a fused silica column of 25 to 30 m length, coated with
medium-polarity stationary phase. Thus, the samples were only separated according to
their molecular weight and not as requested in the SOP according to their molecular weight
and degree of unsaturation. Laboratory 15 employed a fused silica column of the type CP-
SIL 24 CB/MS. In addition N2 instead of He or H2 was used as carrier gas. Though the
resolution of the critical pairs was almost fulfilled (Table 6) the figures of the determined
- 13 -
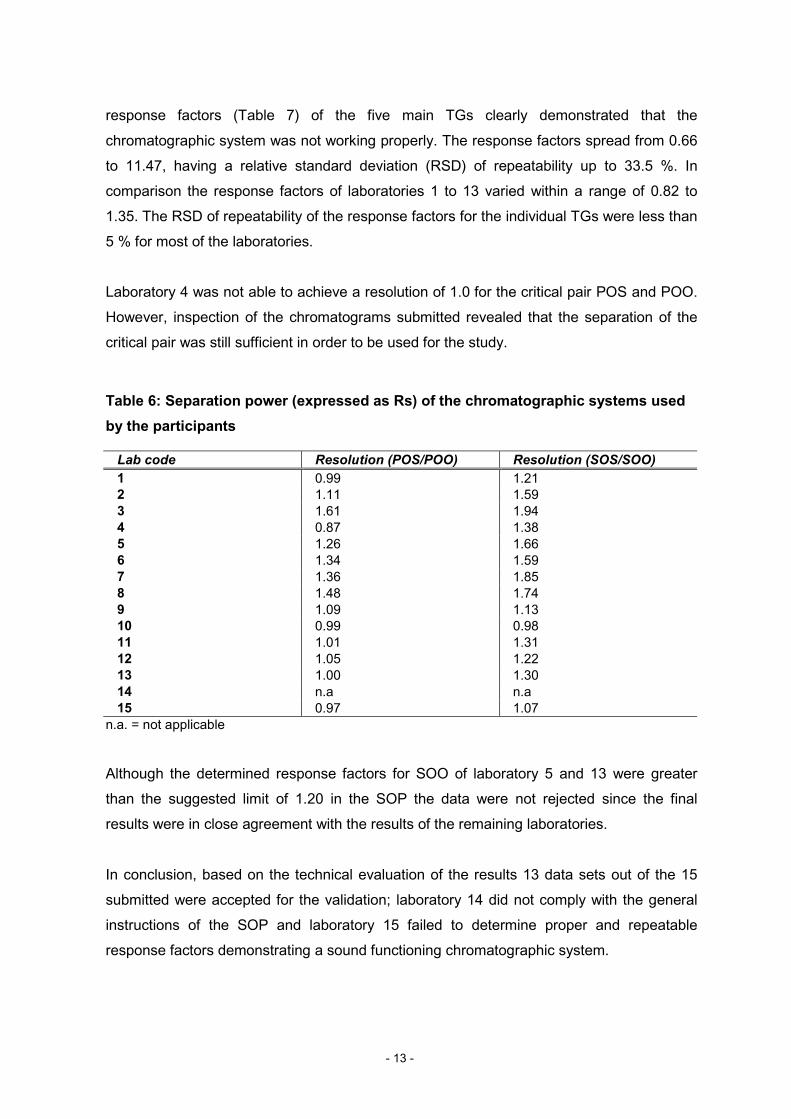
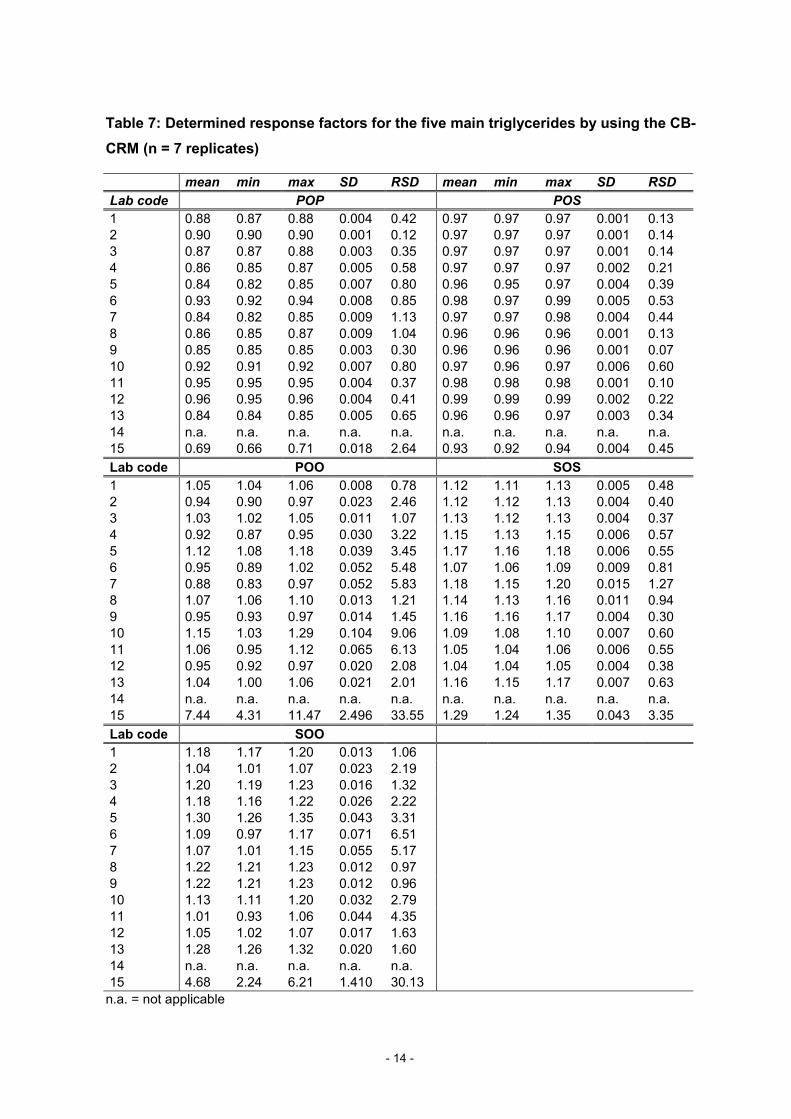
response factors (Table 7) of the five main TGs clearly demonstrated that the
chromatographic system was not working properly. The response factors spread from 0.66
to 11.47, having a relative standard deviation (RSD) of repeatability up to 33.5 %. In
comparison the response factors of laboratories 1 to 13 varied within a range of 0.82 to
1.35. The RSD of repeatability of the response factors for the individual TGs were less than
5 % for most of the laboratories.
Laboratory 4 was not able to achieve a resolution of 1.0 for the critical pair POS and POO.
However, inspection of the chromatograms submitted revealed that the separation of the
critical pair was still sufficient in order to be used for the study.
Table 6: Separation power (expressed as Rs) of the chromatographic systems usedby the participants
Lab code Resolution (POS/POO) Resolution (SOS/SOO)1 0.99 1.212 1.11 1.593 1.61 1.944 0.87 1.385 1.26 1.666 1.34 1.597 1.36 1.858 1.48 1.749 1.09 1.1310 0.99 0.9811 1.01 1.3112 1.05 1.2213 1.00 1.3014 n.a n.a15 0.97 1.07
n.a. = not applicable
Although the determined response factors for SOO of laboratory 5 and 13 were greater
than the suggested limit of 1.20 in the SOP the data were not rejected since the final
results were in close agreement with the results of the remaining laboratories.
In conclusion, based on the technical evaluation of the results 13 data sets out of the 15
submitted were accepted for the validation; laboratory 14 did not comply with the general
instructions of the SOP and laboratory 15 failed to determine proper and repeatable
response factors demonstrating a sound functioning chromatographic system.
- 14 -
Table 7: Determined response factors for the five main triglycerides by using the CB-CRM (n = 7 replicates)
mean min max SD RSD mean min max SD RSDLab code POP POS1 0.88 0.87 0.88 0.004 0.42 0.97 0.97 0.97 0.001 0.132 0.90 0.90 0.90 0.001 0.12 0.97 0.97 0.97 0.001 0.143 0.87 0.87 0.88 0.003 0.35 0.97 0.97 0.97 0.001 0.144 0.86 0.85 0.87 0.005 0.58 0.97 0.97 0.97 0.002 0.215 0.84 0.82 0.85 0.007 0.80 0.96 0.95 0.97 0.004 0.396 0.93 0.92 0.94 0.008 0.85 0.98 0.97 0.99 0.005 0.537 0.84 0.82 0.85 0.009 1.13 0.97 0.97 0.98 0.004 0.448 0.86 0.85 0.87 0.009 1.04 0.96 0.96 0.96 0.001 0.139 0.85 0.85 0.85 0.003 0.30 0.96 0.96 0.96 0.001 0.0710 0.92 0.91 0.92 0.007 0.80 0.97 0.96 0.97 0.006 0.6011 0.95 0.95 0.95 0.004 0.37 0.98 0.98 0.98 0.001 0.1012 0.96 0.95 0.96 0.004 0.41 0.99 0.99 0.99 0.002 0.2213 0.84 0.84 0.85 0.005 0.65 0.96 0.96 0.97 0.003 0.3414 n.a. n.a. n.a. n.a. n.a. n.a. n.a. n.a. n.a. n.a.15 0.69 0.66 0.71 0.018 2.64 0.93 0.92 0.94 0.004 0.45Lab code POO SOS1 1.05 1.04 1.06 0.008 0.78 1.12 1.11 1.13 0.005 0.482 0.94 0.90 0.97 0.023 2.46 1.12 1.12 1.13 0.004 0.403 1.03 1.02 1.05 0.011 1.07 1.13 1.12 1.13 0.004 0.374 0.92 0.87 0.95 0.030 3.22 1.15 1.13 1.15 0.006 0.575 1.12 1.08 1.18 0.039 3.45 1.17 1.16 1.18 0.006 0.556 0.95 0.89 1.02 0.052 5.48 1.07 1.06 1.09 0.009 0.817 0.88 0.83 0.97 0.052 5.83 1.18 1.15 1.20 0.015 1.278 1.07 1.06 1.10 0.013 1.21 1.14 1.13 1.16 0.011 0.949 0.95 0.93 0.97 0.014 1.45 1.16 1.16 1.17 0.004 0.3010 1.15 1.03 1.29 0.104 9.06 1.09 1.08 1.10 0.007 0.6011 1.06 0.95 1.12 0.065 6.13 1.05 1.04 1.06 0.006 0.5512 0.95 0.92 0.97 0.020 2.08 1.04 1.04 1.05 0.004 0.3813 1.04 1.00 1.06 0.021 2.01 1.16 1.15 1.17 0.007 0.6314 n.a. n.a. n.a. n.a. n.a. n.a. n.a. n.a. n.a. n.a.15 7.44 4.31 11.47 2.496 33.55 1.29 1.24 1.35 0.043 3.35Lab code SOO1 1.18 1.17 1.20 0.013 1.062 1.04 1.01 1.07 0.023 2.193 1.20 1.19 1.23 0.016 1.324 1.18 1.16 1.22 0.026 2.225 1.30 1.26 1.35 0.043 3.316 1.09 0.97 1.17 0.071 6.517 1.07 1.01 1.15 0.055 5.178 1.22 1.21 1.23 0.012 0.979 1.22 1.21 1.23 0.012 0.9610 1.13 1.11 1.20 0.032 2.7911 1.01 0.93 1.06 0.044 4.3512 1.05 1.02 1.07 0.017 1.6313 1.28 1.26 1.32 0.020 1.6014 n.a. n.a. n.a. n.a. n.a.15 4.68 2.24 6.21 1.410 30.13
n.a. = not applicable

- 15 -
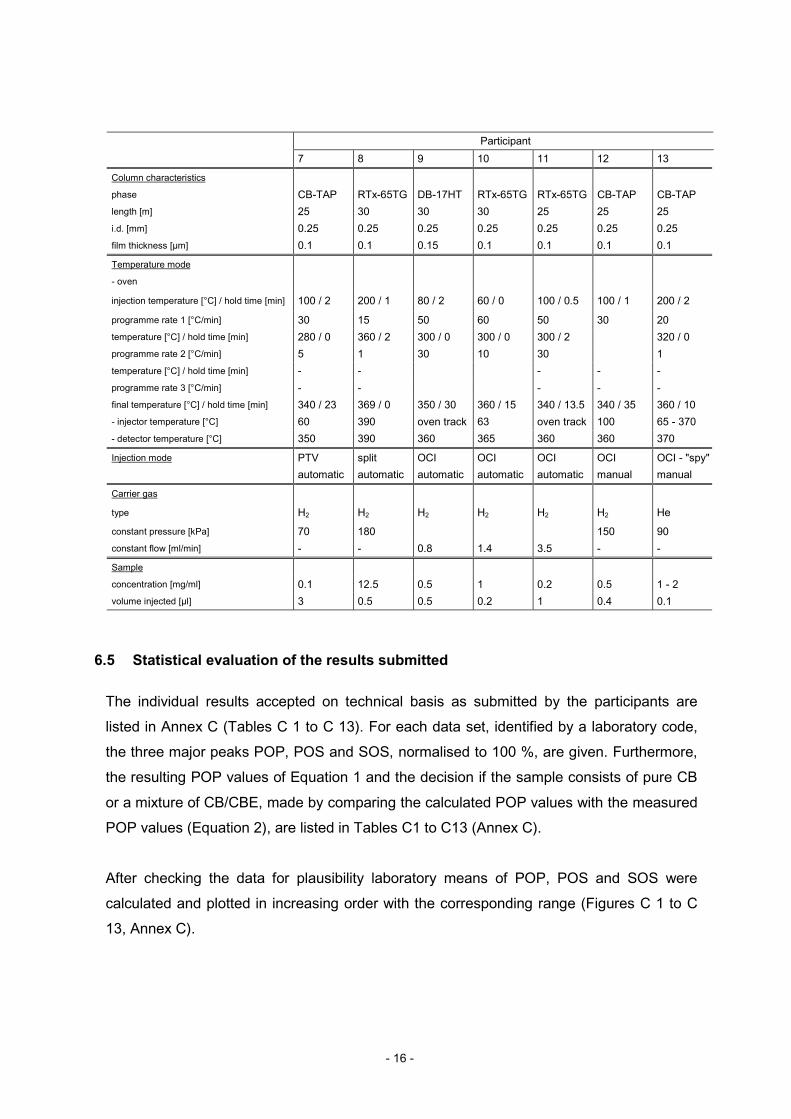
6.4 Methods employed in the validation study
13 laboratories performed the analysis according to the preliminary SOP distributed. A brief
outline of the HR-GC methods used by the participants accepted on technical grounds is
given in Table 8.
In order to obtain the fat from the chocolate samples the AOAC Official Method 920.75 [5]
was recommended by the SOP. However, participants were allowed to use alternative
extraction procedures provided that the same results were obtained. Five laboratories
applied the AOAC method, four laboratories extracted the fat by the Soxhlet extraction
procedure and the rest of the laboratories obtained the fat by using solvents such as
hexane or a mixture of chloroform/hexane.
Table 8: HR-GC conditions employed for the validation study
Participant1 2 3 4 5 6
Column characteristics
phase CB-TAP ultimetal CB-TAP ultimetal CB-TAP RTx-65TG RTx-65TG CB-TAPlength [m] 25 25 25 30 30 25i.d. [mm] 0.25 0.25 0.25 0.25 0.25 0.25film thickness [µm] 0.1 0.1 0.1 0.1 0.1 0.1
Temperature mode
- oven
injection temperature [°C] / hold time [min] 100 / 0.1 100 / 0.1 340 / 0 340 / 1 100 / 0.5 200 / 2programme rate 1 [°C/min] 50 35 1 1 50 12temperature [°C] / hold time [min] 330 / 0 - 330 / 1 272 / 0programme rate 2 [°C/min] 1 - 5 4temperature [°C] / hold time [min] - - - - - -programme rate 3 [°C/min] - - - - - -final temperature [°C] / hold time [min] 350 / 10 350 / 15 360 / 10 360 / 3 350 / 30 340 / 15- injector temperature [°C] oven track 103 360 399 80-355 oven track- detector temperature [°C] 360 360 360 370 360 360
Injection mode OCI OCI split split OCI "SPI" OCIautomatic manual manual automatic manual
Carrier gas
type He H2 He H2 He H2
constant pressure [kPa] - 250 120 190 120constant flow [ml/min] 2 1.5 - - -
Sample
concentration [mg/ml] 0.5 2.5 4.5 50 0.5 0.25volume injected [µl] 0.5 0.5 1 0.18 0.5 1
- 16 -
Participant7 8 9 10 11 12 13
Column characteristics
phase CB-TAP RTx-65TG DB-17HT RTx-65TG RTx-65TG CB-TAP CB-TAPlength [m] 25 30 30 30 25 25 25i.d. [mm] 0.25 0.25 0.25 0.25 0.25 0.25 0.25film thickness [µm] 0.1 0.1 0.15 0.1 0.1 0.1 0.1
Temperature mode
- oven
injection temperature [°C] / hold time [min] 100 / 2 200 / 1 80 / 2 60 / 0 100 / 0.5 100 / 1 200 / 2
programme rate 1 [°C/min] 30 15 50 60 50 30 20temperature [°C] / hold time [min] 280 / 0 360 / 2 300 / 0 300 / 0 300 / 2 320 / 0programme rate 2 [°C/min] 5 1 30 10 30 1temperature [°C] / hold time [min] - - - - -programme rate 3 [°C/min] - - - - -final temperature [°C] / hold time [min] 340 / 23 369 / 0 350 / 30 360 / 15 340 / 13.5 340 / 35 360 / 10- injector temperature [°C] 60 390 oven track 63 oven track 100 65 - 370- detector temperature [°C] 350 390 360 365 360 360 370
Injection mode PTV split OCI OCI OCI OCI OCI - "spy"automatic automatic automatic automatic automatic manual manual
Carrier gas
type H2 H2 H2 H2 H2 H2 He
constant pressure [kPa] 70 180 150 90constant flow [ml/min] - - 0.8 1.4 3.5 - -
Sample
concentration [mg/ml] 0.1 12.5 0.5 1 0.2 0.5 1 - 2volume injected [µl] 3 0.5 0.5 0.2 1 0.4 0.1
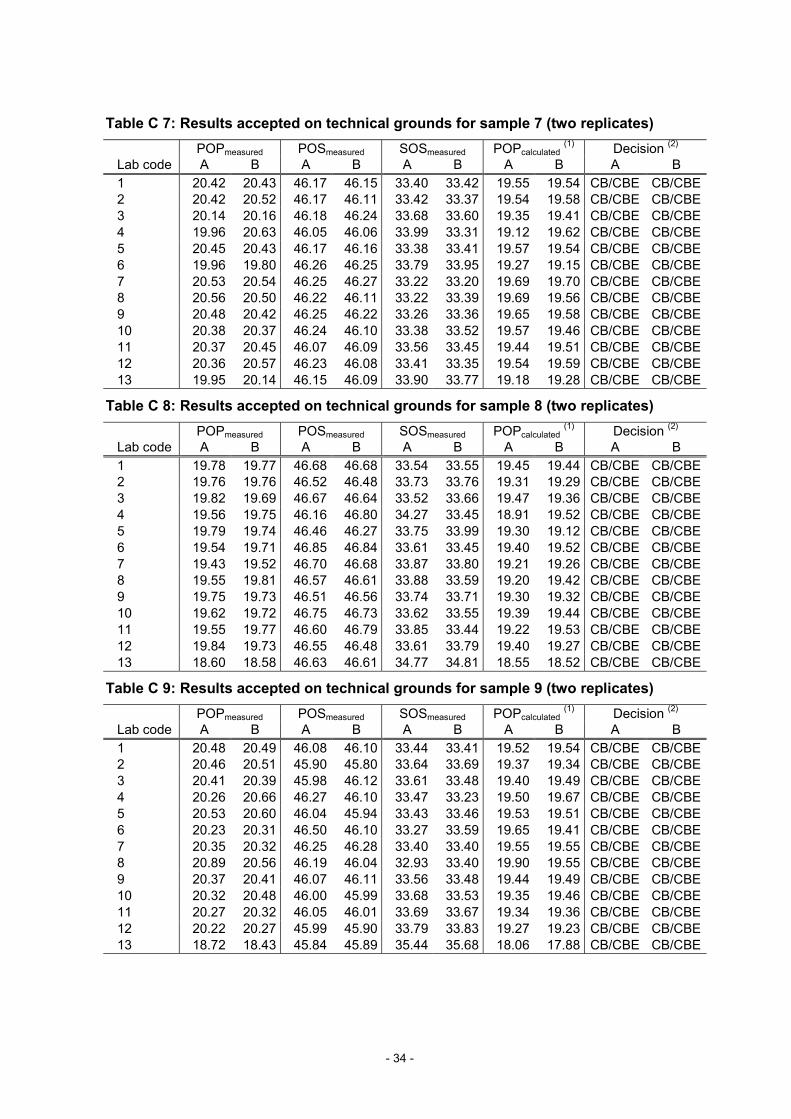
6.5 Statistical evaluation of the results submitted
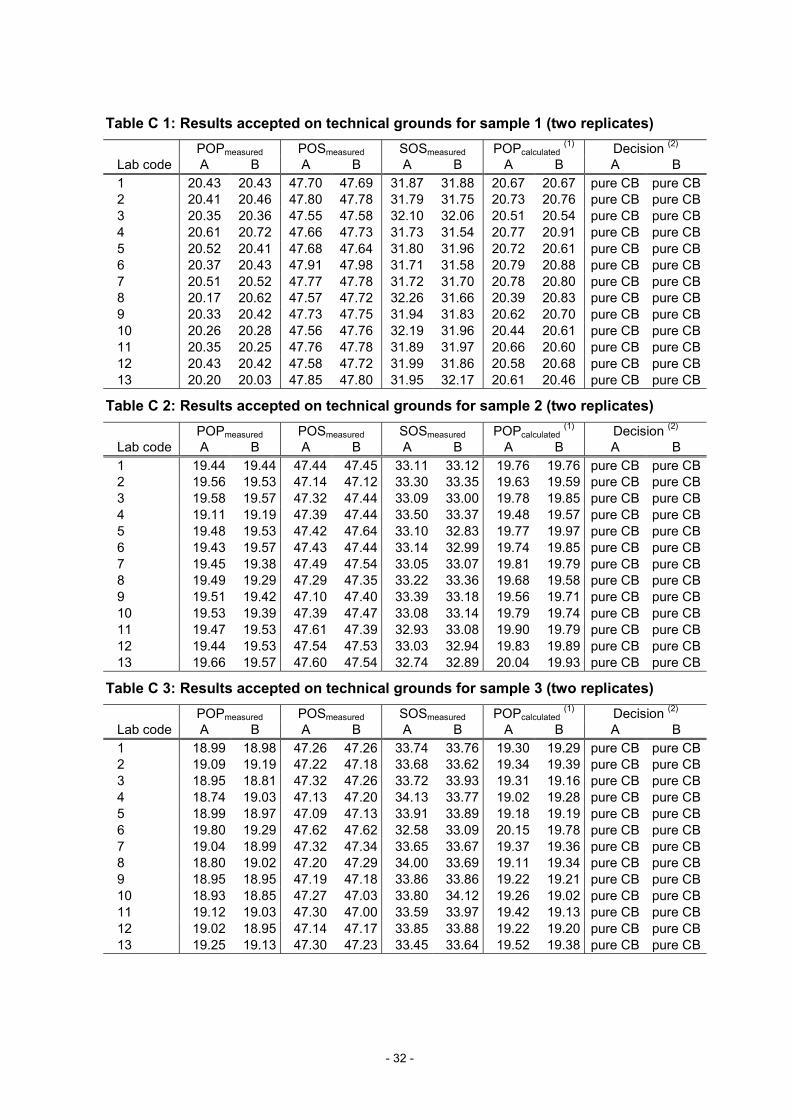
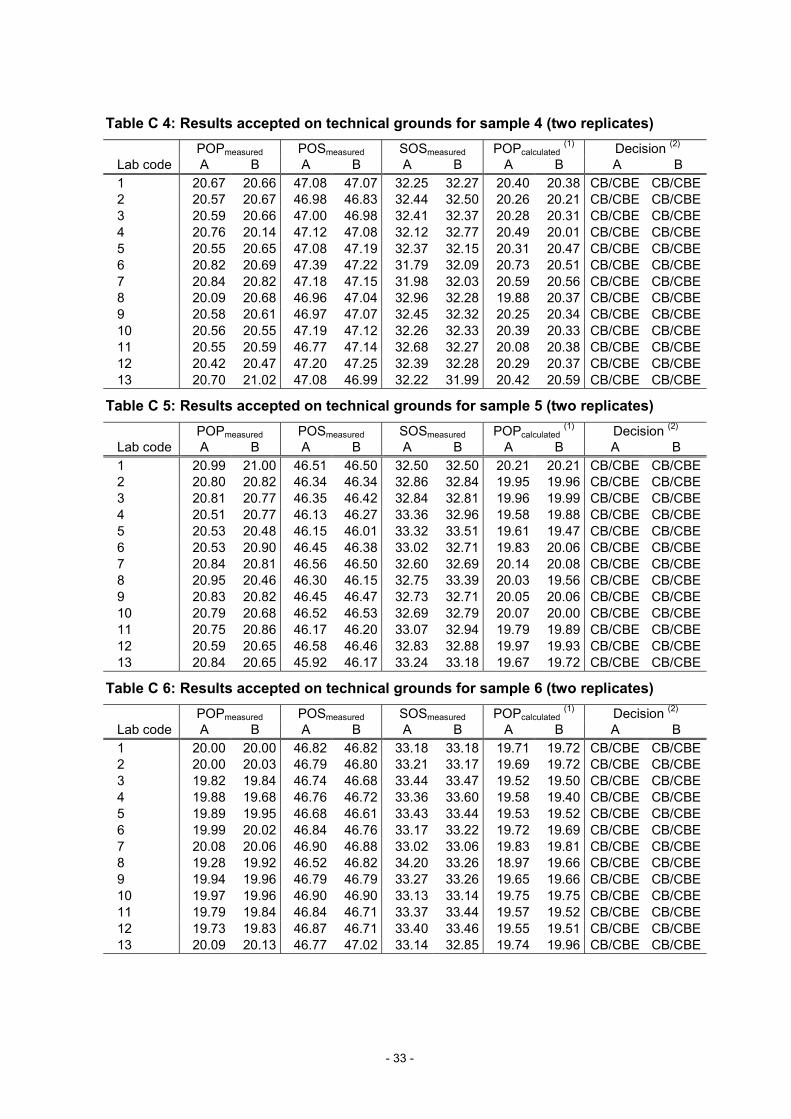
The individual results accepted on technical basis as submitted by the participants are
listed in Annex C (Tables C 1 to C 13). For each data set, identified by a laboratory code,
the three major peaks POP, POS and SOS, normalised to 100 %, are given. Furthermore,
the resulting POP values of Equation 1 and the decision if the sample consists of pure CB
or a mixture of CB/CBE, made by comparing the calculated POP values with the measured
POP values (Equation 2), are listed in Tables C1 to C13 (Annex C).
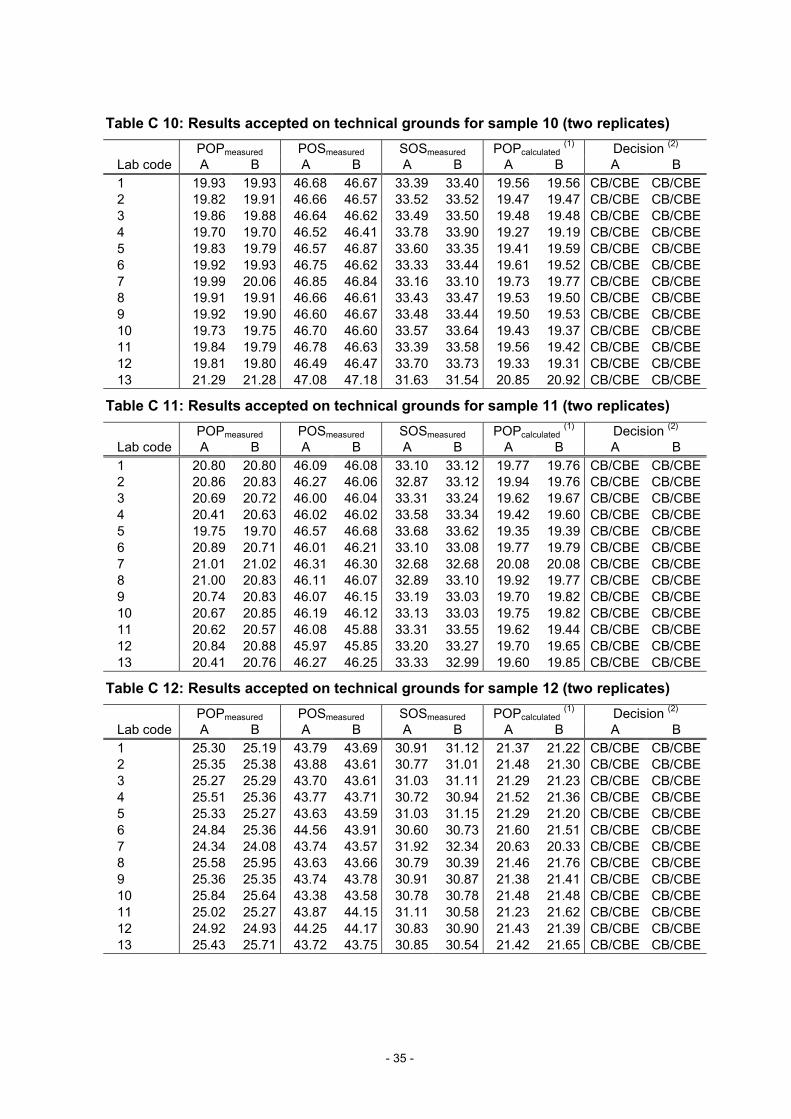
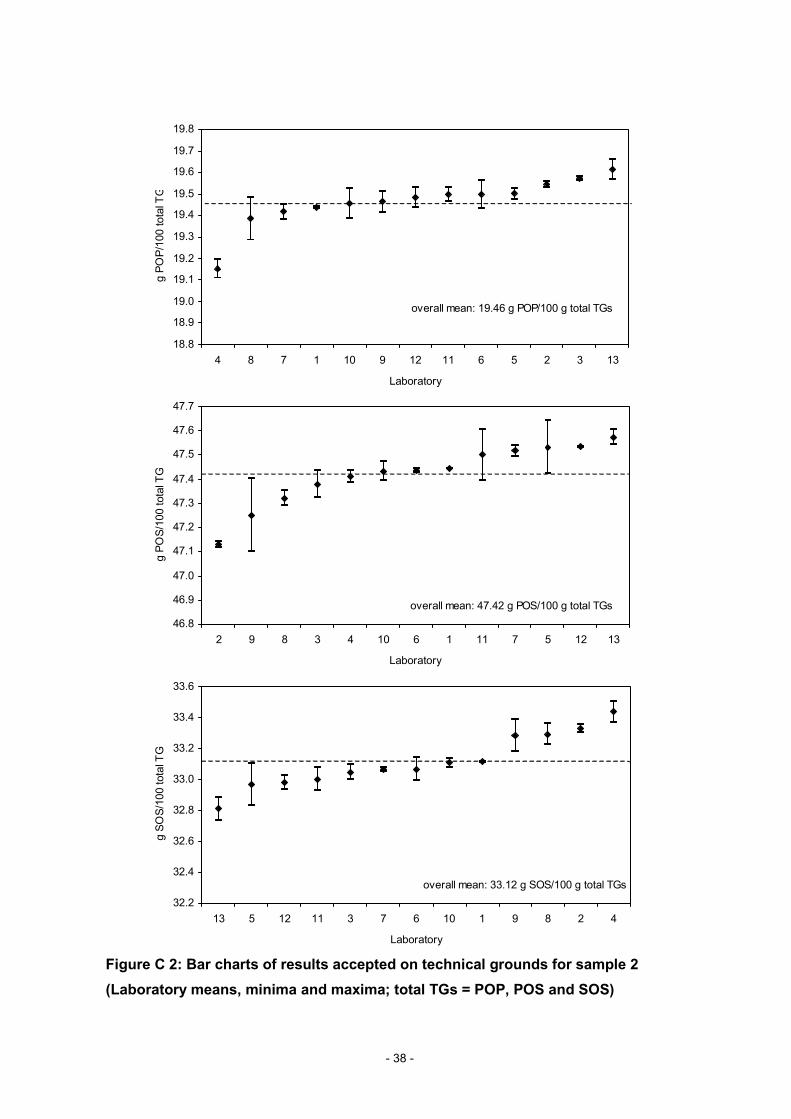
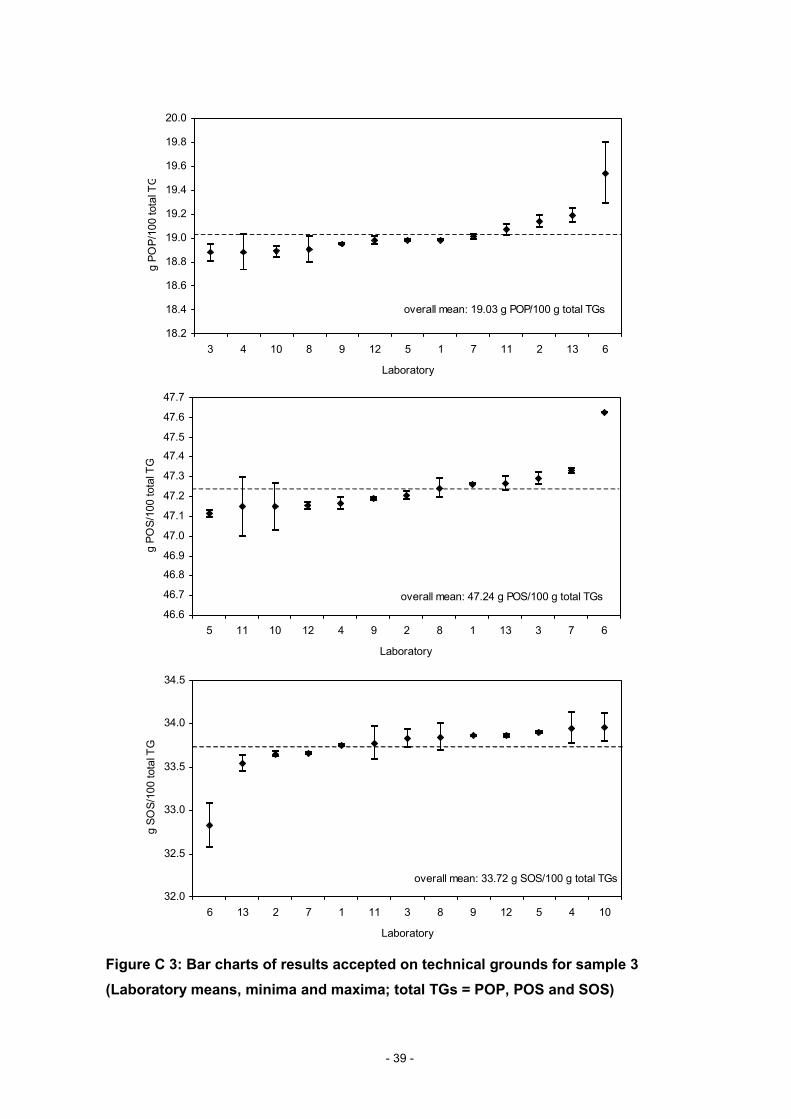
After checking the data for plausibility laboratory means of POP, POS and SOS were
calculated and plotted in increasing order with the corresponding range (Figures C 1 to C
13, Annex C).
- 17 -
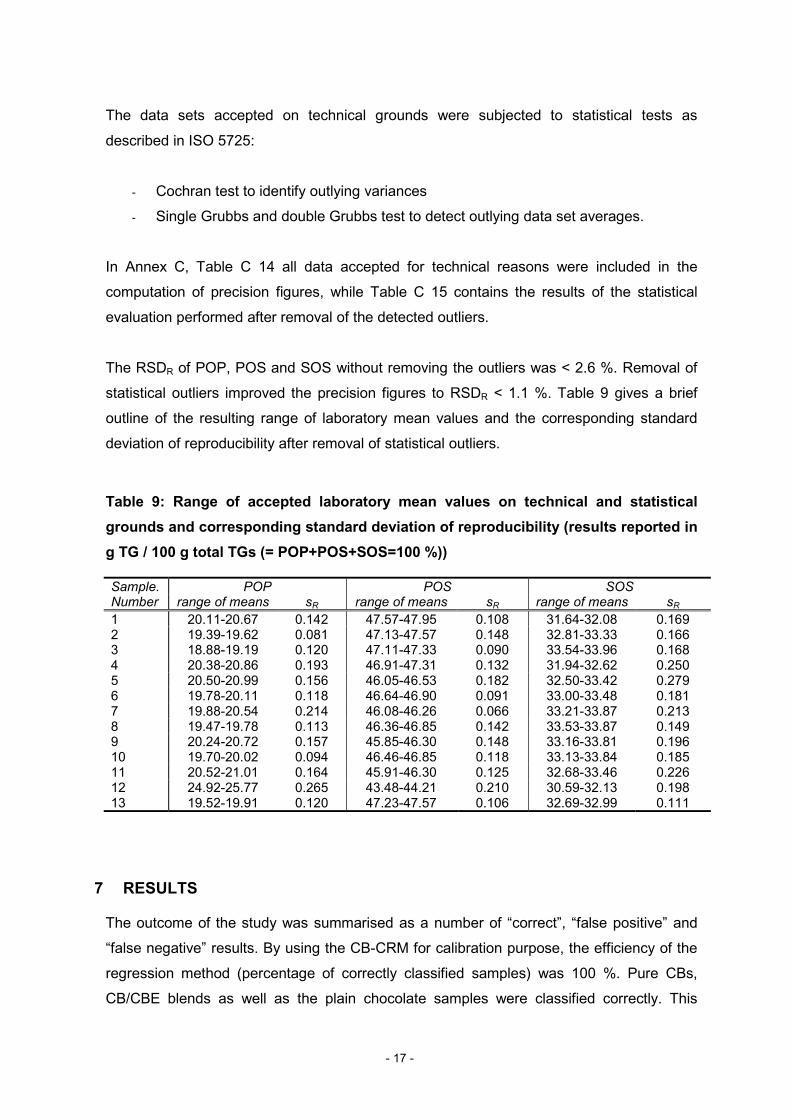
The data sets accepted on technical grounds were subjected to statistical tests as
described in ISO 5725:
- Cochran test to identify outlying variances
- Single Grubbs and double Grubbs test to detect outlying data set averages.
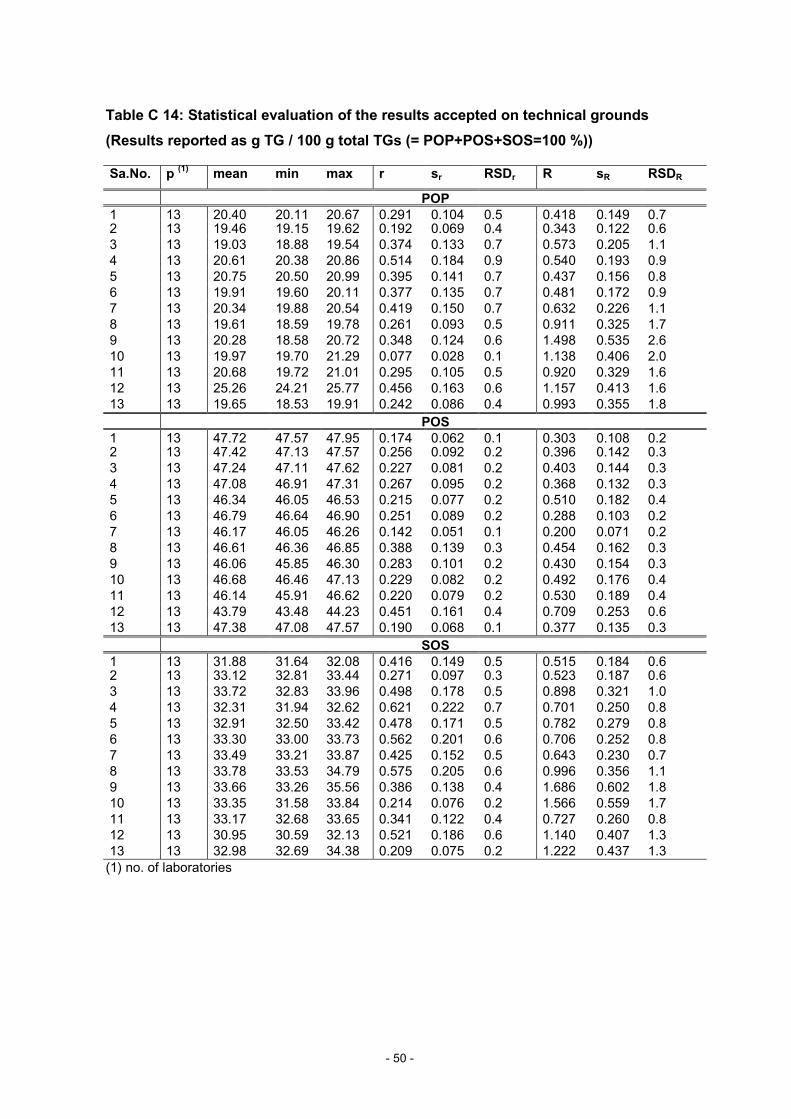
In Annex C, Table C 14 all data accepted for technical reasons were included in the
computation of precision figures, while Table C 15 contains the results of the statistical
evaluation performed after removal of the detected outliers.
The RSDR of POP, POS and SOS without removing the outliers was < 2.6 %. Removal of
statistical outliers improved the precision figures to RSDR < 1.1 %. Table 9 gives a brief
outline of the resulting range of laboratory mean values and the corresponding standard
deviation of reproducibility after removal of statistical outliers.
Table 9: Range of accepted laboratory mean values on technical and statisticalgrounds and corresponding standard deviation of reproducibility (results reported ing TG / 100 g total TGs (= POP+POS+SOS=100 %))
Sample. POP POS SOSNumber range of means sR range of means sR range of means sR
1 20.11-20.67 0.142 47.57-47.95 0.108 31.64-32.08 0.1692 19.39-19.62 0.081 47.13-47.57 0.148 32.81-33.33 0.1663 18.88-19.19 0.120 47.11-47.33 0.090 33.54-33.96 0.1684 20.38-20.86 0.193 46.91-47.31 0.132 31.94-32.62 0.2505 20.50-20.99 0.156 46.05-46.53 0.182 32.50-33.42 0.2796 19.78-20.11 0.118 46.64-46.90 0.091 33.00-33.48 0.1817 19.88-20.54 0.214 46.08-46.26 0.066 33.21-33.87 0.2138 19.47-19.78 0.113 46.36-46.85 0.142 33.53-33.87 0.1499 20.24-20.72 0.157 45.85-46.30 0.148 33.16-33.81 0.19610 19.70-20.02 0.094 46.46-46.85 0.118 33.13-33.84 0.18511 20.52-21.01 0.164 45.91-46.30 0.125 32.68-33.46 0.22612 24.92-25.77 0.265 43.48-44.21 0.210 30.59-32.13 0.19813 19.52-19.91 0.120 47.23-47.57 0.106 32.69-32.99 0.111
7 RESULTS
The outcome of the study was summarised as a number of “correct”, “false positive” and
“false negative” results. By using the CB-CRM for calibration purpose, the efficiency of the
regression method (percentage of correctly classified samples) was 100 %. Pure CBs,
CB/CBE blends as well as the plain chocolate samples were classified correctly. This

- 18 -
suggests a detection limit of 2 % CBE in CB, resulting in 0.4 % CBE in chocolate (assumed
fat content of chocolate 20 %).
8 CONCLUSIONS
The results of the collaborative study showed that the analytical approach (= TG profiling
by HR-GC + simple regression) can be applied for the detection of 2 % CBE in CB covering
a broad range of commercially available CBEs. However, a thorough in-house investigation
by the JRC of arithmetically prepared CBE/CB mixtures by using the standardised data
base covering the full range of available CBEs suggested for some CBEs a detection limit
of 3 %. Illipé was included in the study only in combination with other CBEs since pure Illipé
is according to chocolate manufacturers of no practical importance as an admixture to
chocolate. Taking in account the results of the in-house investigation and validation study
the analytical procedure can detect at least 0.4 to 0.6 % CBEs in the final product
(assumed fat content of chocolate 20 %).
The main advantage of the tested methodological approach is that individual testing
laboratories do not need to establish a "CB line". The end user of the described approach
has just to calibrate the gas chromatographic separation system using the certified
reference material, separate the sample in question and use the mathematical equations
for subsequent data treatment in order to detect CBEs. The method offers an important
measure to assess compliance with labelling provisions and is suitable for a rapid
screening of large numbers of samples to detect foreign fats in CB and plain chocolate.
9 LITERATURE
[1] Directive 2000/36/EC of the European Parliament and the Council of 23 June 2000
relating to cocoa and chocolate products intended for human consumption. OJ L197, 19-
25.
[2] M. Lipp, C. Simoneau, F. Ulberth, E. Anklam. (1999) EUR 18992 EN.
[3] F.B. Padley & R.E. Timms (1980) J. Am. Oil Chem. Soc. 57, 286-293.
[4] M. Buchgraber & E. Anklam (2003) publication in preparation.
[5] Official Methods of Analysis of AOAC International (1995) 16th Edition. Volume II.
Chapter 31. AOAC Official Method 920.75.
- 19 -
ANNEX A
Table A 1: Sample codes for individual laboratories
Figure A 1: Sample handling
- 20 -
Table A 1: Sample codes for individual laboratories
Sample number
1 2 3 4 5 6 7 8 9 10 11 12 13
Lab
code Labelled Sample Codes
1 324 172 439 34 118 18 305 349 285 420 382 137 373
2 338 168 431 24 111 5 313 348 293 414 398 134 363
3 336 179 422 36 103 1 309 359 298 418 391 122 378
4 321 161 436 32 110 9 303 344 297 403 385 140 366
5 337 166 433 28 102 12 315 343 292 404 392 135 370
6 322 162 424 38 101 19 317 341 299 409 397 124 365
7 334 169 438 26 107 2 302 360 296 408 390 132 368
8 339 180 429 37 120 7 316 352 300 416 388 139 375
9 325 177 434 27 117 14 318 346 282 415 394 133 362
10 335 165 437 22 112 10 311 347 290 410 396 125 364
11 331 178 430 23 115 13 320 351 281 412 399 136 379
12 328 164 440 40 109 6 314 350 283 413 393 138 371
13 333 174 435 39 113 3 312 345 291 405 381 129 361
14 340 167 421 30 119 15 301 358 284 407 389 131 372
15 326 170 426 21 104 8 304 354 289 406 384 121 380
- 21 -
Figure A 1: Flow-scheme detailing the handling of the samples
Design of the measurements
Determine RFs for the five main TGs (POP, POS, POO, SOS, SOO) by using
the CB-CRM, single injection
Analyse five of the test samples (randomly selected) in duplicate injection
Determine RFs for the five main TGs (POP, POS, POO, SOS, SOO) by using
the CB-CRM, single injection
Analyse five of the test samples (randomly selected) in duplicate injection
Determine RFs for the five main TGs (POP, POS, POO, SOS, SOO) by using
the CB-CRM, single injection
Report the results (raw data) by using the electronic spread sheet
Design of the system suitability check
Optimise resolution by using the CB-CRM
Determine RFs for the five main TGs (POP, POS, POO, SOS, SOO) by using
the CB-CRM (duplicate injection)
Report the results by using the electronic spread sheet
.
.
.
.
- 22 -
ANNEX B
Standard operation procedure used for the study
- 23 -
Standard operation procedurefor the detection of cocoa butter equivalents in
cocoa butter and plain chocolate
- 24 -
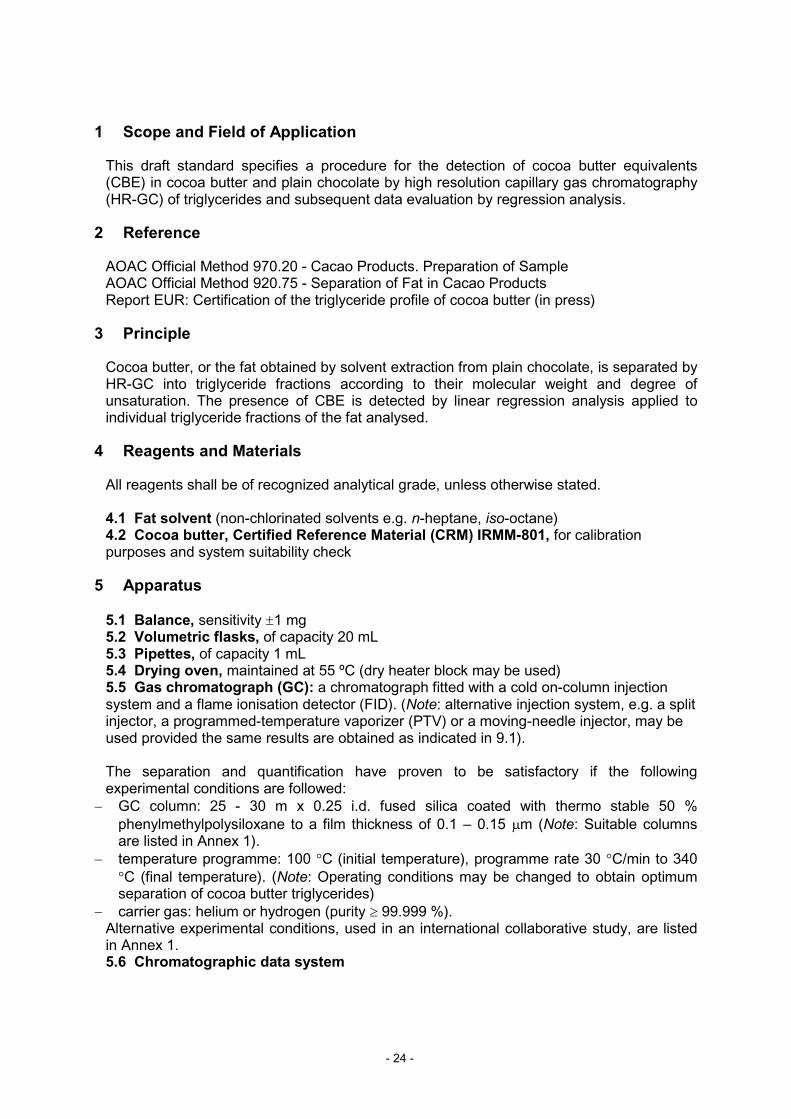
1 Scope and Field of Application
This draft standard specifies a procedure for the detection of cocoa butter equivalents(CBE) in cocoa butter and plain chocolate by high resolution capillary gas chromatography(HR-GC) of triglycerides and subsequent data evaluation by regression analysis.
2 Reference
AOAC Official Method 970.20 - Cacao Products. Preparation of SampleAOAC Official Method 920.75 - Separation of Fat in Cacao ProductsReport EUR: Certification of the triglyceride profile of cocoa butter (in press)
3 Principle
Cocoa butter, or the fat obtained by solvent extraction from plain chocolate, is separated byHR-GC into triglyceride fractions according to their molecular weight and degree ofunsaturation. The presence of CBE is detected by linear regression analysis applied toindividual triglyceride fractions of the fat analysed.
4 Reagents and Materials
All reagents shall be of recognized analytical grade, unless otherwise stated.
4.1 Fat solvent (non-chlorinated solvents e.g. n-heptane, iso-octane)4.2 Cocoa butter, Certified Reference Material (CRM) IRMM-801, for calibrationpurposes and system suitability check
5 Apparatus
5.1 Balance, sensitivity �1 mg5.2 Volumetric flasks, of capacity 20 mL5.3 Pipettes, of capacity 1 mL5.4 Drying oven, maintained at 55 ºC (dry heater block may be used)5.5 Gas chromatograph (GC): a chromatograph fitted with a cold on-column injectionsystem and a flame ionisation detector (FID). (Note: alternative injection system, e.g. a splitinjector, a programmed-temperature vaporizer (PTV) or a moving-needle injector, may beused provided the same results are obtained as indicated in 9.1).
The separation and quantification have proven to be satisfactory if the followingexperimental conditions are followed:
� GC column: 25 - 30 m x 0.25 i.d. fused silica coated with thermo stable 50 %phenylmethylpolysiloxane to a film thickness of 0.1 – 0.15 �m (Note: Suitable columnsare listed in Annex 1).
� temperature programme: 100 �C (initial temperature), programme rate 30 �C/min to 340�C (final temperature). (Note: Operating conditions may be changed to obtain optimumseparation of cocoa butter triglycerides)
� carrier gas: helium or hydrogen (purity � 99.999 %).Alternative experimental conditions, used in an international collaborative study, are listedin Annex 1.5.6 Chromatographic data system
- 25 -
5.7 Micro syringe: maximum volume 10 �l, graduated to 0.1 �l. (Note: an automaticsampler may be used).5.8 Food grater: a kitchen blender with a design featuring the motor above the receivingcontainer to avoid melting the samples (e.g. Philips HR2833)
6 Preparation of cocoa butter CRM for calibration purposes and systemsuitability check
Before opening and using the cocoa butter CRM (4.2), the ampoule has to be warmed in adrying oven (5.4) until the contents have melted. When a clear solution is obtained, mix thecontents by repeated inversion for not less than 20 sec., open and transfer the contents toa clean vial, which can be tightly sealed and preserved in a cool place for future usage.
7 Preparation of the test sample
Chill ca 200 g chocolate until hard, and grate to fine granular condition using a mechanicaldevice (5.8). Mix thoroughly and preserve in tightly stoppered bottle in a cool place.
8 Procedure
8.1 Fat extraction
Obtain the fat as described in AOAC Official Method 920.75. That is to say, fat is separatedfrom 10 – 40 g grated chocolate by extracting with two or three 100 mL portions of ether.(Note: alternative extraction procedures may be used, e.g. by Soxhlet, by supercriticalcarbon dioxide or by using microwaves, provided that the same results are obtained).
8.2 Separation of individual triglycerides by HR-GC
The test samples (cocoa butter, fat extracted from chocolate, cocoa butter CRM (4.2)) haveto be warmed in a drying oven (5.4) until completely melted. If the liquid sample containssediment, filter the sample inside the oven to obtain a clear filtrate. Pipettes (or similarequipment) used for transferring the sample during weighing operations should be broughtto a temperature of ca. 50 °C in a drying oven in order to avoid partial fat fractionation.
Weigh ca 0.2 g test sample in a 20 mL volumetric flask (5.2) and bring to volume with asuitable fat solvent (4.1). Pipette 1 mL of the resulting solution in another 20 mL volumetricflask and bring to volume with the same solvent.Inject 0.5-1.0 �l of the final test solution (0.5 mg fat/mL) into the HR-GC system using thecold on-column injection system. (Note: alternative sample amounts and injectors may beused provided that the detection system employed gives a linear response and the systemsuitability criteria (9.1) are met).
8.3 Identification
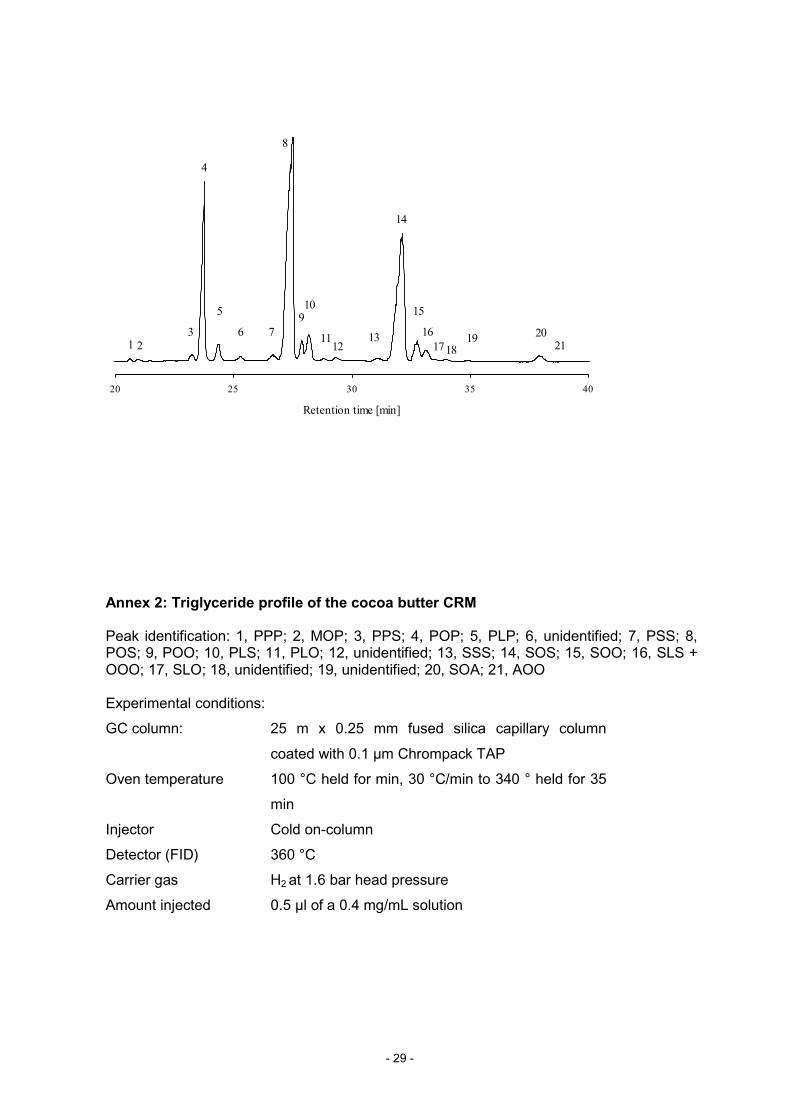
Identification of the five major triglyceride fractions 1,3-dipalmitoyl-2-oleoylglycerol (POP),1-palmitoyl-2-oleoyl-3-stearoylglycerol (POS), 1-palmitoyl-2,3-dioleoyl-glycerol (POO), 1,3-distearoyl-2-oleoylglycerol (SOS), and 1-stearoyl-2,3-dioleoyl-glycerol (SOO) is made bycomparison of the retention times of the test samples with those of the cocoa butter CRM(4.2). The elution order of the triglycerides of the cocoa butter CRM is given in the examplechromatogram (Annex 2).
- 26 -
8.4 Calculations
8.4.1 Determination of response factors
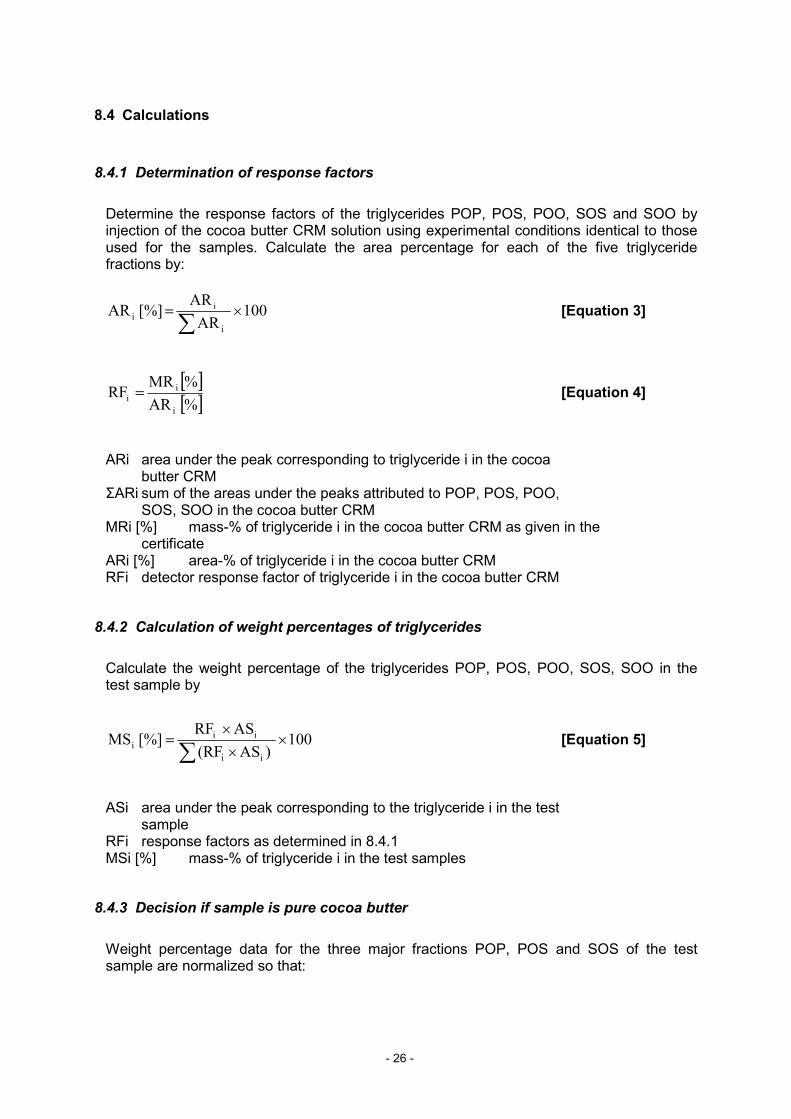
Determine the response factors of the triglycerides POP, POS, POO, SOS and SOO byinjection of the cocoa butter CRM solution using experimental conditions identical to thoseused for the samples. Calculate the area percentage for each of the five triglyceridefractions by:
100 AR
AR [%] AR
i
ii ��
�[Equation 3]
� �� �% AR%MR
RFi
ii � [Equation 4]
ARi area under the peak corresponding to triglyceride i in the cocoabutter CRM
ΣARi sum of the areas under the peaks attributed to POP, POS, POO,SOS, SOO in the cocoa butter CRM
MRi [%] mass-% of triglyceride i in the cocoa butter CRM as given in thecertificate
ARi [%] area-% of triglyceride i in the cocoa butter CRMRFi detector response factor of triglyceride i in the cocoa butter CRM
8.4.2 Calculation of weight percentages of triglycerides
Calculate the weight percentage of the triglycerides POP, POS, POO, SOS, SOO in thetest sample by
100 )AS (RF
ASRF [%] MS
ii
i ii �
�
�
�
�[Equation 5]
ASi area under the peak corresponding to the triglyceride i in the testsample
RFi response factors as determined in 8.4.1MSi [%] mass-% of triglyceride i in the test samples
8.4.3 Decision if sample is pure cocoa butter
Weight percentage data for the three major fractions POP, POS and SOS of the testsample are normalized so that:
- 27 -
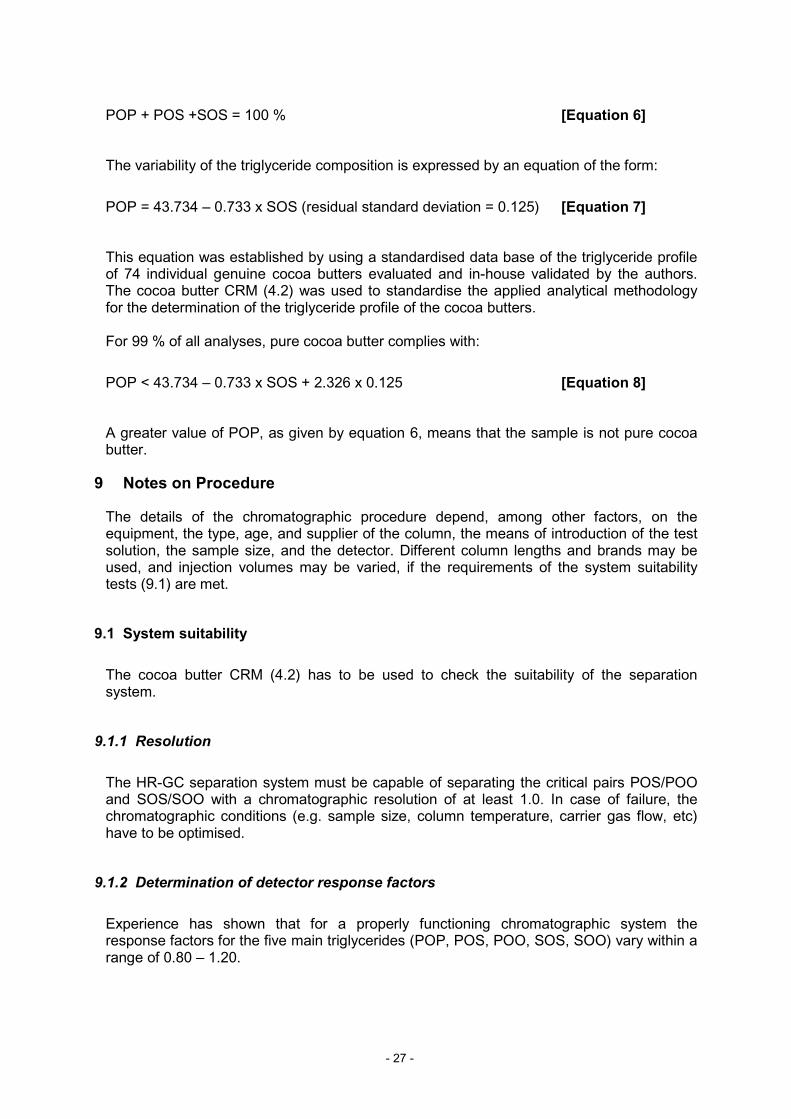
POP + POS +SOS = 100 % [Equation 6]
The variability of the triglyceride composition is expressed by an equation of the form:
POP = 43.734 – 0.733 x SOS (residual standard deviation = 0.125) [Equation 7]
This equation was established by using a standardised data base of the triglyceride profileof 74 individual genuine cocoa butters evaluated and in-house validated by the authors.The cocoa butter CRM (4.2) was used to standardise the applied analytical methodologyfor the determination of the triglyceride profile of the cocoa butters.
For 99 % of all analyses, pure cocoa butter complies with:
POP < 43.734 – 0.733 x SOS + 2.326 x 0.125 [Equation 8]
A greater value of POP, as given by equation 6, means that the sample is not pure cocoabutter.
9 Notes on Procedure
The details of the chromatographic procedure depend, among other factors, on theequipment, the type, age, and supplier of the column, the means of introduction of the testsolution, the sample size, and the detector. Different column lengths and brands may beused, and injection volumes may be varied, if the requirements of the system suitabilitytests (9.1) are met.
9.1 System suitability
The cocoa butter CRM (4.2) has to be used to check the suitability of the separationsystem.
9.1.1 Resolution
The HR-GC separation system must be capable of separating the critical pairs POS/POOand SOS/SOO with a chromatographic resolution of at least 1.0. In case of failure, thechromatographic conditions (e.g. sample size, column temperature, carrier gas flow, etc)have to be optimised.
9.1.2 Determination of detector response factors
Experience has shown that for a properly functioning chromatographic system theresponse factors for the five main triglycerides (POP, POS, POO, SOS, SOO) vary within arange of 0.80 – 1.20.
- 28 -
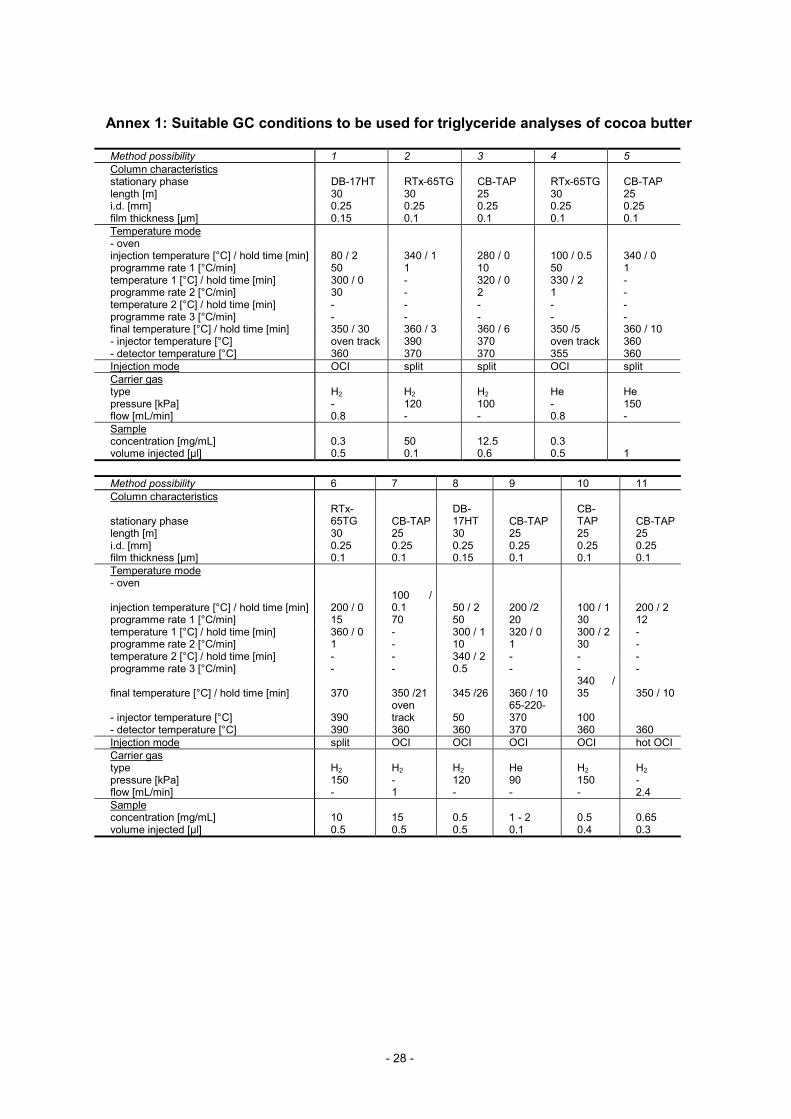
Annex 1: Suitable GC conditions to be used for triglyceride analyses of cocoa butter
Method possibility 1 2 3 4 5Column characteristicsstationary phase DB-17HT RTx-65TG CB-TAP RTx-65TG CB-TAPlength [m] 30 30 25 30 25i.d. [mm] 0.25 0.25 0.25 0.25 0.25film thickness [µm] 0.15 0.1 0.1 0.1 0.1Temperature mode- oveninjection temperature [°C] / hold time [min] 80 / 2 340 / 1 280 / 0 100 / 0.5 340 / 0programme rate 1 [°C/min] 50 1 10 50 1temperature 1 [°C] / hold time [min] 300 / 0 - 320 / 0 330 / 2 -programme rate 2 [°C/min] 30 - 2 1 -temperature 2 [°C] / hold time [min] - - - - -programme rate 3 [°C/min] - - - - -final temperature [°C] / hold time [min] 350 / 30 360 / 3 360 / 6 350 /5 360 / 10- injector temperature [°C] oven track 390 370 oven track 360- detector temperature [°C] 360 370 370 355 360Injection mode OCI split split OCI splitCarrier gastype H2 H2 H2 He Hepressure [kPa] - 120 100 - 150flow [mL/min] 0.8 - - 0.8 -Sampleconcentration [mg/mL] 0.3 50 12.5 0.3volume injected [µl] 0.5 0.1 0.6 0.5 1
Method possibility 6 7 8 9 10 11Column characteristics
stationary phaseRTx-65TG CB-TAP
DB-17HT CB-TAP
CB-TAP CB-TAP
length [m] 30 25 30 25 25 25i.d. [mm] 0.25 0.25 0.25 0.25 0.25 0.25film thickness [µm] 0.1 0.1 0.15 0.1 0.1 0.1Temperature mode- oven
injection temperature [°C] / hold time [min] 200 / 0100 /0.1 50 / 2 200 /2 100 / 1 200 / 2
programme rate 1 [°C/min] 15 70 50 20 30 12temperature 1 [°C] / hold time [min] 360 / 0 - 300 / 1 320 / 0 300 / 2 -programme rate 2 [°C/min] 1 - 10 1 30 -temperature 2 [°C] / hold time [min] - - 340 / 2 - - -programme rate 3 [°C/min] - - 0.5 - - -
final temperature [°C] / hold time [min] 370 350 /21 345 /26 360 / 10340 /35 350 / 10
- injector temperature [°C] 390oventrack 50
65-220-370 100
- detector temperature [°C] 390 360 360 370 360 360Injection mode split OCI OCI OCI OCI hot OCICarrier gastype H2 H2 H2 He H2 H2pressure [kPa] 150 - 120 90 150 -flow [mL/min] - 1 - - - 2.4Sampleconcentration [mg/mL] 10 15 0.5 1 - 2 0.5 0.65volume injected [µl] 0.5 0.5 0.5 0.1 0.4 0.3
- 29 -
Annex 2: Triglyceride profile of the cocoa butter CRM
Peak identification: 1, PPP; 2, MOP; 3, PPS; 4, POP; 5, PLP; 6, unidentified; 7, PSS; 8,POS; 9, POO; 10, PLS; 11, PLO; 12, unidentified; 13, SSS; 14, SOS; 15, SOO; 16, SLS +OOO; 17, SLO; 18, unidentified; 19, unidentified; 20, SOA; 21, AOO
Experimental conditions:
GC column: 25 m x 0.25 mm fused silica capillary column
coated with 0.1 µm Chrompack TAP
Oven temperature 100 °C held for min, 30 °C/min to 340 ° held for 35
min
Injector Cold on-column
Detector (FID) 360 °C
Carrier gas H2 at 1.6 bar head pressure
Amount injected 0.5 µl of a 0.4 mg/mL solution
20 25 30 35 40
Retention time [min]
8
4
14
1 23 76
5
1716
15
1312
11
109
1819 20
21
- 30 -
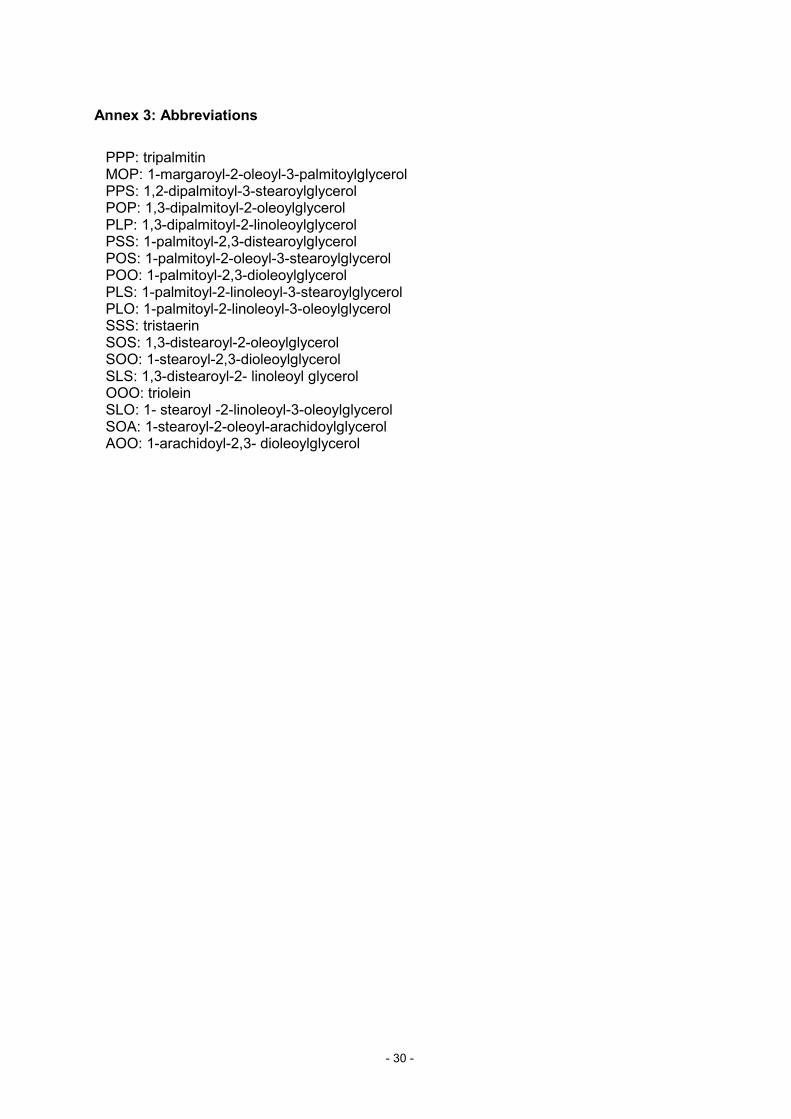
Annex 3: Abbreviations
PPP: tripalmitinMOP: 1-margaroyl-2-oleoyl-3-palmitoylglycerolPPS: 1,2-dipalmitoyl-3-stearoylglycerolPOP: 1,3-dipalmitoyl-2-oleoylglycerolPLP: 1,3-dipalmitoyl-2-linoleoylglycerolPSS: 1-palmitoyl-2,3-distearoylglycerolPOS: 1-palmitoyl-2-oleoyl-3-stearoylglycerolPOO: 1-palmitoyl-2,3-dioleoylglycerolPLS: 1-palmitoyl-2-linoleoyl-3-stearoylglycerolPLO: 1-palmitoyl-2-linoleoyl-3-oleoylglycerolSSS: tristaerinSOS: 1,3-distearoyl-2-oleoylglycerolSOO: 1-stearoyl-2,3-dioleoylglycerolSLS: 1,3-distearoyl-2- linoleoyl glycerolOOO: trioleinSLO: 1- stearoyl -2-linoleoyl-3-oleoylglycerolSOA: 1-stearoyl-2-oleoyl-arachidoylglycerolAOO: 1-arachidoyl-2,3- dioleoylglycerol

- 31 -
ANNEX C
Tables C 1 – C 13: Results accepted on technical grounds
Figures C 1 – C 13: Bar-charts of results accepted on technical grounds
Table C14: Statistical evaluation of results accepted on technical grounds
Table C15: Statistical evaluation of results accepted on technical and statisticalgrounds
- 32 -
Table C 1: Results accepted on technical grounds for sample 1 (two replicates)POPmeasured POSmeasured SOSmeasured POPcalculated (1) Decision (2)
Lab code A B A B A B A B A B1 20.43 20.43 47.70 47.69 31.87 31.88 20.67 20.67 pure CB pure CB2 20.41 20.46 47.80 47.78 31.79 31.75 20.73 20.76 pure CB pure CB3 20.35 20.36 47.55 47.58 32.10 32.06 20.51 20.54 pure CB pure CB4 20.61 20.72 47.66 47.73 31.73 31.54 20.77 20.91 pure CB pure CB5 20.52 20.41 47.68 47.64 31.80 31.96 20.72 20.61 pure CB pure CB6 20.37 20.43 47.91 47.98 31.71 31.58 20.79 20.88 pure CB pure CB7 20.51 20.52 47.77 47.78 31.72 31.70 20.78 20.80 pure CB pure CB8 20.17 20.62 47.57 47.72 32.26 31.66 20.39 20.83 pure CB pure CB9 20.33 20.42 47.73 47.75 31.94 31.83 20.62 20.70 pure CB pure CB10 20.26 20.28 47.56 47.76 32.19 31.96 20.44 20.61 pure CB pure CB11 20.35 20.25 47.76 47.78 31.89 31.97 20.66 20.60 pure CB pure CB12 20.43 20.42 47.58 47.72 31.99 31.86 20.58 20.68 pure CB pure CB13 20.20 20.03 47.85 47.80 31.95 32.17 20.61 20.46 pure CB pure CB
Table C 2: Results accepted on technical grounds for sample 2 (two replicates)POPmeasured POSmeasured SOSmeasured POPcalculated (1) Decision (2)
Lab code A B A B A B A B A B1 19.44 19.44 47.44 47.45 33.11 33.12 19.76 19.76 pure CB pure CB2 19.56 19.53 47.14 47.12 33.30 33.35 19.63 19.59 pure CB pure CB3 19.58 19.57 47.32 47.44 33.09 33.00 19.78 19.85 pure CB pure CB4 19.11 19.19 47.39 47.44 33.50 33.37 19.48 19.57 pure CB pure CB5 19.48 19.53 47.42 47.64 33.10 32.83 19.77 19.97 pure CB pure CB6 19.43 19.57 47.43 47.44 33.14 32.99 19.74 19.85 pure CB pure CB7 19.45 19.38 47.49 47.54 33.05 33.07 19.81 19.79 pure CB pure CB8 19.49 19.29 47.29 47.35 33.22 33.36 19.68 19.58 pure CB pure CB9 19.51 19.42 47.10 47.40 33.39 33.18 19.56 19.71 pure CB pure CB10 19.53 19.39 47.39 47.47 33.08 33.14 19.79 19.74 pure CB pure CB11 19.47 19.53 47.61 47.39 32.93 33.08 19.90 19.79 pure CB pure CB12 19.44 19.53 47.54 47.53 33.03 32.94 19.83 19.89 pure CB pure CB13 19.66 19.57 47.60 47.54 32.74 32.89 20.04 19.93 pure CB pure CB
Table C 3: Results accepted on technical grounds for sample 3 (two replicates)POPmeasured POSmeasured SOSmeasured POPcalculated (1) Decision (2)
Lab code A B A B A B A B A B1 18.99 18.98 47.26 47.26 33.74 33.76 19.30 19.29 pure CB pure CB2 19.09 19.19 47.22 47.18 33.68 33.62 19.34 19.39 pure CB pure CB3 18.95 18.81 47.32 47.26 33.72 33.93 19.31 19.16 pure CB pure CB4 18.74 19.03 47.13 47.20 34.13 33.77 19.02 19.28 pure CB pure CB5 18.99 18.97 47.09 47.13 33.91 33.89 19.18 19.19 pure CB pure CB6 19.80 19.29 47.62 47.62 32.58 33.09 20.15 19.78 pure CB pure CB7 19.04 18.99 47.32 47.34 33.65 33.67 19.37 19.36 pure CB pure CB8 18.80 19.02 47.20 47.29 34.00 33.69 19.11 19.34 pure CB pure CB9 18.95 18.95 47.19 47.18 33.86 33.86 19.22 19.21 pure CB pure CB10 18.93 18.85 47.27 47.03 33.80 34.12 19.26 19.02 pure CB pure CB11 19.12 19.03 47.30 47.00 33.59 33.97 19.42 19.13 pure CB pure CB12 19.02 18.95 47.14 47.17 33.85 33.88 19.22 19.20 pure CB pure CB13 19.25 19.13 47.30 47.23 33.45 33.64 19.52 19.38 pure CB pure CB
- 33 -
Table C 4: Results accepted on technical grounds for sample 4 (two replicates)POPmeasured POSmeasured SOSmeasured POPcalculated (1) Decision (2)
Lab code A B A B A B A B A B1 20.67 20.66 47.08 47.07 32.25 32.27 20.40 20.38 CB/CBE CB/CBE2 20.57 20.67 46.98 46.83 32.44 32.50 20.26 20.21 CB/CBE CB/CBE3 20.59 20.66 47.00 46.98 32.41 32.37 20.28 20.31 CB/CBE CB/CBE4 20.76 20.14 47.12 47.08 32.12 32.77 20.49 20.01 CB/CBE CB/CBE5 20.55 20.65 47.08 47.19 32.37 32.15 20.31 20.47 CB/CBE CB/CBE6 20.82 20.69 47.39 47.22 31.79 32.09 20.73 20.51 CB/CBE CB/CBE7 20.84 20.82 47.18 47.15 31.98 32.03 20.59 20.56 CB/CBE CB/CBE8 20.09 20.68 46.96 47.04 32.96 32.28 19.88 20.37 CB/CBE CB/CBE9 20.58 20.61 46.97 47.07 32.45 32.32 20.25 20.34 CB/CBE CB/CBE10 20.56 20.55 47.19 47.12 32.26 32.33 20.39 20.33 CB/CBE CB/CBE11 20.55 20.59 46.77 47.14 32.68 32.27 20.08 20.38 CB/CBE CB/CBE12 20.42 20.47 47.20 47.25 32.39 32.28 20.29 20.37 CB/CBE CB/CBE13 20.70 21.02 47.08 46.99 32.22 31.99 20.42 20.59 CB/CBE CB/CBE
Table C 5: Results accepted on technical grounds for sample 5 (two replicates)POPmeasured POSmeasured SOSmeasured POPcalculated (1) Decision (2)
Lab code A B A B A B A B A B1 20.99 21.00 46.51 46.50 32.50 32.50 20.21 20.21 CB/CBE CB/CBE2 20.80 20.82 46.34 46.34 32.86 32.84 19.95 19.96 CB/CBE CB/CBE3 20.81 20.77 46.35 46.42 32.84 32.81 19.96 19.99 CB/CBE CB/CBE4 20.51 20.77 46.13 46.27 33.36 32.96 19.58 19.88 CB/CBE CB/CBE5 20.53 20.48 46.15 46.01 33.32 33.51 19.61 19.47 CB/CBE CB/CBE6 20.53 20.90 46.45 46.38 33.02 32.71 19.83 20.06 CB/CBE CB/CBE7 20.84 20.81 46.56 46.50 32.60 32.69 20.14 20.08 CB/CBE CB/CBE8 20.95 20.46 46.30 46.15 32.75 33.39 20.03 19.56 CB/CBE CB/CBE9 20.83 20.82 46.45 46.47 32.73 32.71 20.05 20.06 CB/CBE CB/CBE10 20.79 20.68 46.52 46.53 32.69 32.79 20.07 20.00 CB/CBE CB/CBE11 20.75 20.86 46.17 46.20 33.07 32.94 19.79 19.89 CB/CBE CB/CBE12 20.59 20.65 46.58 46.46 32.83 32.88 19.97 19.93 CB/CBE CB/CBE13 20.84 20.65 45.92 46.17 33.24 33.18 19.67 19.72 CB/CBE CB/CBE
Table C 6: Results accepted on technical grounds for sample 6 (two replicates)POPmeasured POSmeasured SOSmeasured POPcalculated (1) Decision (2)
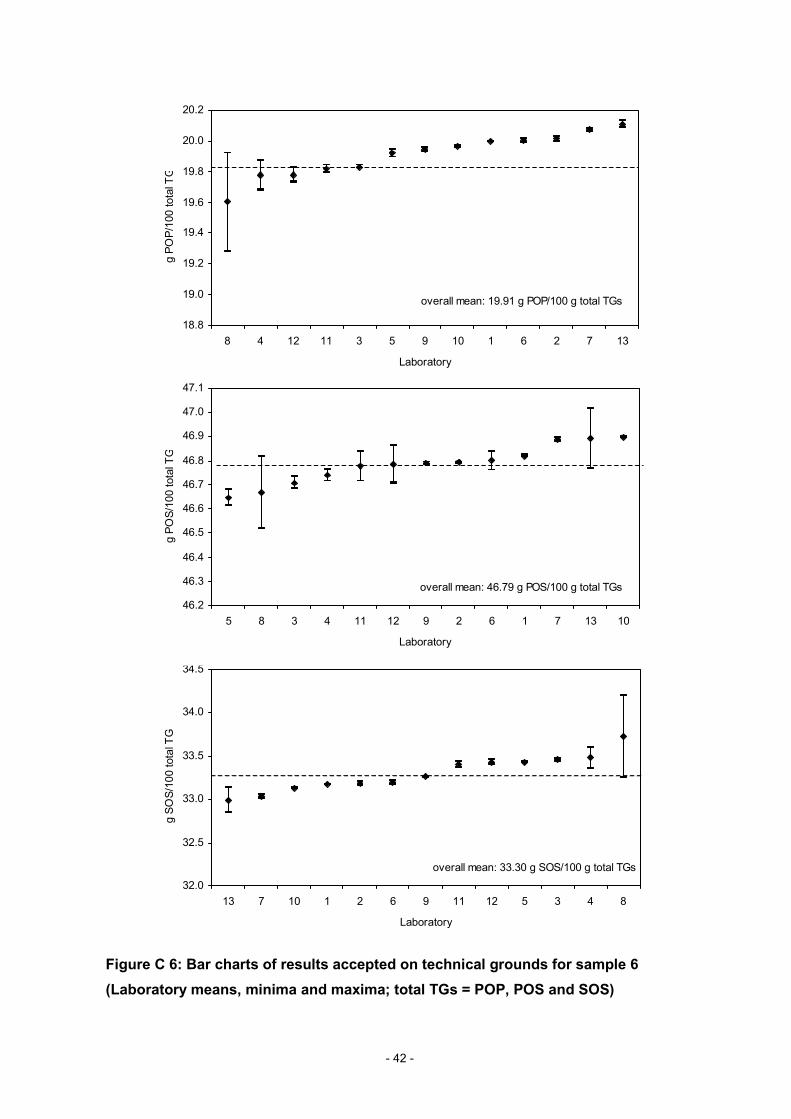
Lab code A B A B A B A B A B1 20.00 20.00 46.82 46.82 33.18 33.18 19.71 19.72 CB/CBE CB/CBE2 20.00 20.03 46.79 46.80 33.21 33.17 19.69 19.72 CB/CBE CB/CBE3 19.82 19.84 46.74 46.68 33.44 33.47 19.52 19.50 CB/CBE CB/CBE4 19.88 19.68 46.76 46.72 33.36 33.60 19.58 19.40 CB/CBE CB/CBE5 19.89 19.95 46.68 46.61 33.43 33.44 19.53 19.52 CB/CBE CB/CBE6 19.99 20.02 46.84 46.76 33.17 33.22 19.72 19.69 CB/CBE CB/CBE7 20.08 20.06 46.90 46.88 33.02 33.06 19.83 19.81 CB/CBE CB/CBE8 19.28 19.92 46.52 46.82 34.20 33.26 18.97 19.66 CB/CBE CB/CBE9 19.94 19.96 46.79 46.79 33.27 33.26 19.65 19.66 CB/CBE CB/CBE10 19.97 19.96 46.90 46.90 33.13 33.14 19.75 19.75 CB/CBE CB/CBE11 19.79 19.84 46.84 46.71 33.37 33.44 19.57 19.52 CB/CBE CB/CBE12 19.73 19.83 46.87 46.71 33.40 33.46 19.55 19.51 CB/CBE CB/CBE13 20.09 20.13 46.77 47.02 33.14 32.85 19.74 19.96 CB/CBE CB/CBE
- 34 -
Table C 7: Results accepted on technical grounds for sample 7 (two replicates)POPmeasured POSmeasured SOSmeasured POPcalculated (1) Decision (2)
Lab code A B A B A B A B A B1 20.42 20.43 46.17 46.15 33.40 33.42 19.55 19.54 CB/CBE CB/CBE2 20.42 20.52 46.17 46.11 33.42 33.37 19.54 19.58 CB/CBE CB/CBE3 20.14 20.16 46.18 46.24 33.68 33.60 19.35 19.41 CB/CBE CB/CBE4 19.96 20.63 46.05 46.06 33.99 33.31 19.12 19.62 CB/CBE CB/CBE5 20.45 20.43 46.17 46.16 33.38 33.41 19.57 19.54 CB/CBE CB/CBE6 19.96 19.80 46.26 46.25 33.79 33.95 19.27 19.15 CB/CBE CB/CBE7 20.53 20.54 46.25 46.27 33.22 33.20 19.69 19.70 CB/CBE CB/CBE8 20.56 20.50 46.22 46.11 33.22 33.39 19.69 19.56 CB/CBE CB/CBE9 20.48 20.42 46.25 46.22 33.26 33.36 19.65 19.58 CB/CBE CB/CBE10 20.38 20.37 46.24 46.10 33.38 33.52 19.57 19.46 CB/CBE CB/CBE11 20.37 20.45 46.07 46.09 33.56 33.45 19.44 19.51 CB/CBE CB/CBE12 20.36 20.57 46.23 46.08 33.41 33.35 19.54 19.59 CB/CBE CB/CBE13 19.95 20.14 46.15 46.09 33.90 33.77 19.18 19.28 CB/CBE CB/CBE
Table C 8: Results accepted on technical grounds for sample 8 (two replicates)POPmeasured POSmeasured SOSmeasured POPcalculated (1) Decision (2)
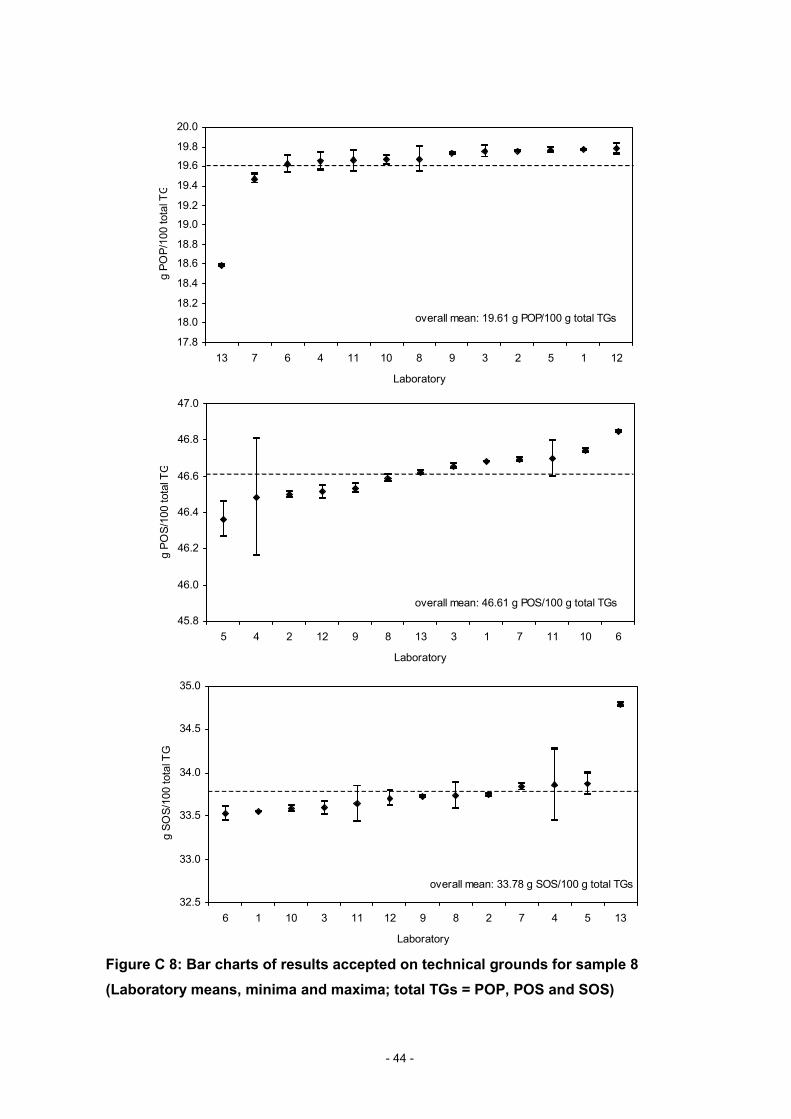
Lab code A B A B A B A B A B1 19.78 19.77 46.68 46.68 33.54 33.55 19.45 19.44 CB/CBE CB/CBE2 19.76 19.76 46.52 46.48 33.73 33.76 19.31 19.29 CB/CBE CB/CBE3 19.82 19.69 46.67 46.64 33.52 33.66 19.47 19.36 CB/CBE CB/CBE4 19.56 19.75 46.16 46.80 34.27 33.45 18.91 19.52 CB/CBE CB/CBE5 19.79 19.74 46.46 46.27 33.75 33.99 19.30 19.12 CB/CBE CB/CBE6 19.54 19.71 46.85 46.84 33.61 33.45 19.40 19.52 CB/CBE CB/CBE7 19.43 19.52 46.70 46.68 33.87 33.80 19.21 19.26 CB/CBE CB/CBE8 19.55 19.81 46.57 46.61 33.88 33.59 19.20 19.42 CB/CBE CB/CBE9 19.75 19.73 46.51 46.56 33.74 33.71 19.30 19.32 CB/CBE CB/CBE10 19.62 19.72 46.75 46.73 33.62 33.55 19.39 19.44 CB/CBE CB/CBE11 19.55 19.77 46.60 46.79 33.85 33.44 19.22 19.53 CB/CBE CB/CBE12 19.84 19.73 46.55 46.48 33.61 33.79 19.40 19.27 CB/CBE CB/CBE13 18.60 18.58 46.63 46.61 34.77 34.81 18.55 18.52 CB/CBE CB/CBE
Table C 9: Results accepted on technical grounds for sample 9 (two replicates)POPmeasured POSmeasured SOSmeasured POPcalculated (1) Decision (2)
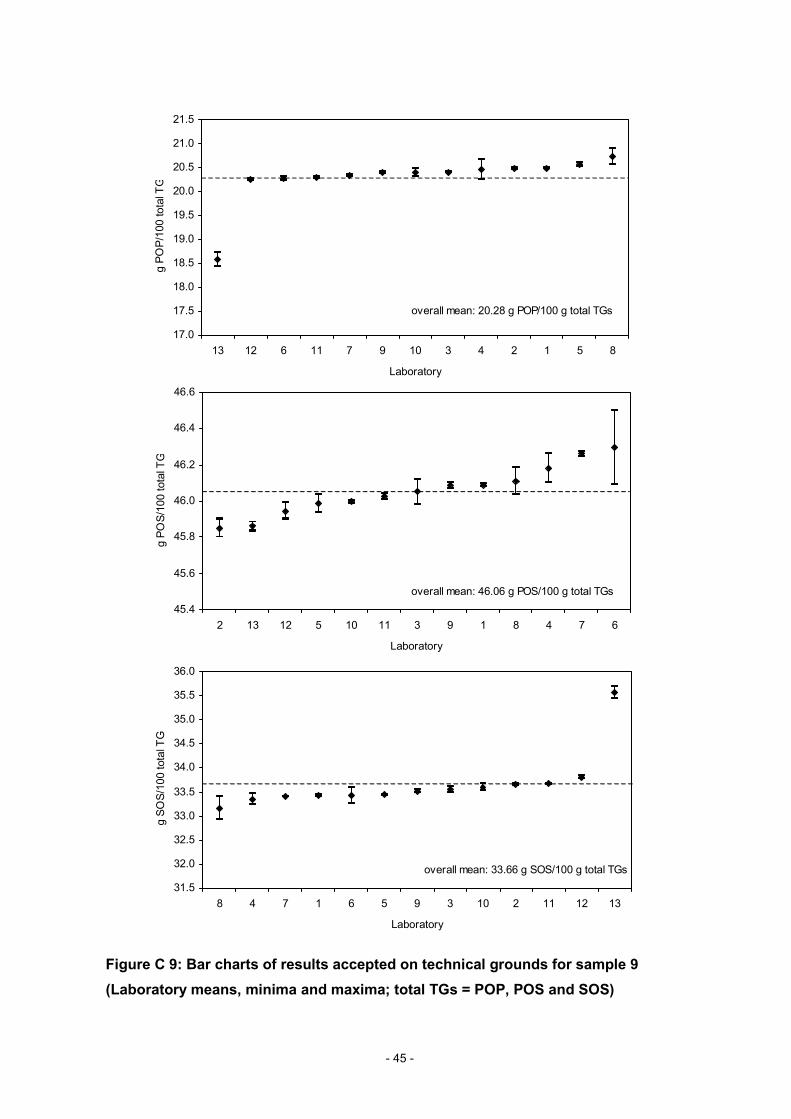
Lab code A B A B A B A B A B1 20.48 20.49 46.08 46.10 33.44 33.41 19.52 19.54 CB/CBE CB/CBE2 20.46 20.51 45.90 45.80 33.64 33.69 19.37 19.34 CB/CBE CB/CBE3 20.41 20.39 45.98 46.12 33.61 33.48 19.40 19.49 CB/CBE CB/CBE4 20.26 20.66 46.27 46.10 33.47 33.23 19.50 19.67 CB/CBE CB/CBE5 20.53 20.60 46.04 45.94 33.43 33.46 19.53 19.51 CB/CBE CB/CBE6 20.23 20.31 46.50 46.10 33.27 33.59 19.65 19.41 CB/CBE CB/CBE7 20.35 20.32 46.25 46.28 33.40 33.40 19.55 19.55 CB/CBE CB/CBE8 20.89 20.56 46.19 46.04 32.93 33.40 19.90 19.55 CB/CBE CB/CBE9 20.37 20.41 46.07 46.11 33.56 33.48 19.44 19.49 CB/CBE CB/CBE10 20.32 20.48 46.00 45.99 33.68 33.53 19.35 19.46 CB/CBE CB/CBE11 20.27 20.32 46.05 46.01 33.69 33.67 19.34 19.36 CB/CBE CB/CBE12 20.22 20.27 45.99 45.90 33.79 33.83 19.27 19.23 CB/CBE CB/CBE13 18.72 18.43 45.84 45.89 35.44 35.68 18.06 17.88 CB/CBE CB/CBE
- 35 -
Table C 10: Results accepted on technical grounds for sample 10 (two replicates)POPmeasured POSmeasured SOSmeasured POPcalculated (1) Decision (2)
Lab code A B A B A B A B A B1 19.93 19.93 46.68 46.67 33.39 33.40 19.56 19.56 CB/CBE CB/CBE2 19.82 19.91 46.66 46.57 33.52 33.52 19.47 19.47 CB/CBE CB/CBE3 19.86 19.88 46.64 46.62 33.49 33.50 19.48 19.48 CB/CBE CB/CBE4 19.70 19.70 46.52 46.41 33.78 33.90 19.27 19.19 CB/CBE CB/CBE5 19.83 19.79 46.57 46.87 33.60 33.35 19.41 19.59 CB/CBE CB/CBE6 19.92 19.93 46.75 46.62 33.33 33.44 19.61 19.52 CB/CBE CB/CBE7 19.99 20.06 46.85 46.84 33.16 33.10 19.73 19.77 CB/CBE CB/CBE8 19.91 19.91 46.66 46.61 33.43 33.47 19.53 19.50 CB/CBE CB/CBE9 19.92 19.90 46.60 46.67 33.48 33.44 19.50 19.53 CB/CBE CB/CBE10 19.73 19.75 46.70 46.60 33.57 33.64 19.43 19.37 CB/CBE CB/CBE11 19.84 19.79 46.78 46.63 33.39 33.58 19.56 19.42 CB/CBE CB/CBE12 19.81 19.80 46.49 46.47 33.70 33.73 19.33 19.31 CB/CBE CB/CBE13 21.29 21.28 47.08 47.18 31.63 31.54 20.85 20.92 CB/CBE CB/CBE
Table C 11: Results accepted on technical grounds for sample 11 (two replicates)POPmeasured POSmeasured SOSmeasured POPcalculated (1) Decision (2)
Lab code A B A B A B A B A B1 20.80 20.80 46.09 46.08 33.10 33.12 19.77 19.76 CB/CBE CB/CBE2 20.86 20.83 46.27 46.06 32.87 33.12 19.94 19.76 CB/CBE CB/CBE3 20.69 20.72 46.00 46.04 33.31 33.24 19.62 19.67 CB/CBE CB/CBE4 20.41 20.63 46.02 46.02 33.58 33.34 19.42 19.60 CB/CBE CB/CBE5 19.75 19.70 46.57 46.68 33.68 33.62 19.35 19.39 CB/CBE CB/CBE6 20.89 20.71 46.01 46.21 33.10 33.08 19.77 19.79 CB/CBE CB/CBE7 21.01 21.02 46.31 46.30 32.68 32.68 20.08 20.08 CB/CBE CB/CBE8 21.00 20.83 46.11 46.07 32.89 33.10 19.92 19.77 CB/CBE CB/CBE9 20.74 20.83 46.07 46.15 33.19 33.03 19.70 19.82 CB/CBE CB/CBE10 20.67 20.85 46.19 46.12 33.13 33.03 19.75 19.82 CB/CBE CB/CBE11 20.62 20.57 46.08 45.88 33.31 33.55 19.62 19.44 CB/CBE CB/CBE12 20.84 20.88 45.97 45.85 33.20 33.27 19.70 19.65 CB/CBE CB/CBE13 20.41 20.76 46.27 46.25 33.33 32.99 19.60 19.85 CB/CBE CB/CBE
Table C 12: Results accepted on technical grounds for sample 12 (two replicates)POPmeasured POSmeasured SOSmeasured POPcalculated (1) Decision (2)
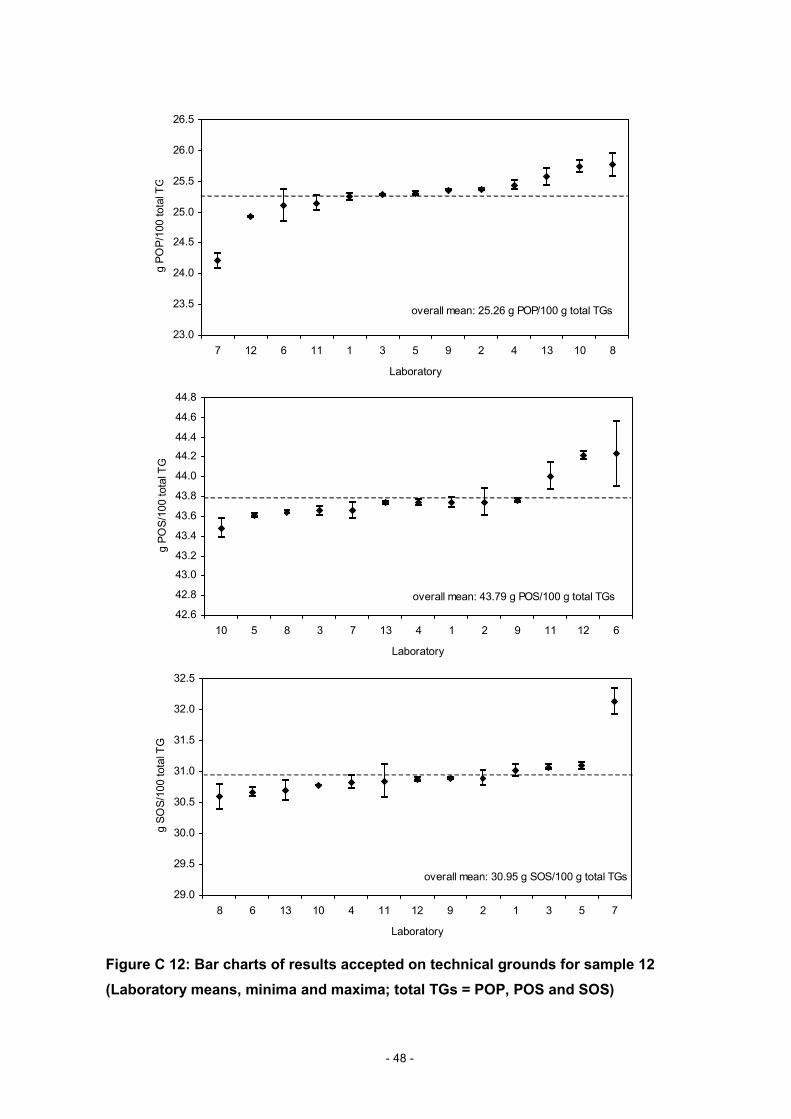
Lab code A B A B A B A B A B1 25.30 25.19 43.79 43.69 30.91 31.12 21.37 21.22 CB/CBE CB/CBE2 25.35 25.38 43.88 43.61 30.77 31.01 21.48 21.30 CB/CBE CB/CBE3 25.27 25.29 43.70 43.61 31.03 31.11 21.29 21.23 CB/CBE CB/CBE4 25.51 25.36 43.77 43.71 30.72 30.94 21.52 21.36 CB/CBE CB/CBE5 25.33 25.27 43.63 43.59 31.03 31.15 21.29 21.20 CB/CBE CB/CBE6 24.84 25.36 44.56 43.91 30.60 30.73 21.60 21.51 CB/CBE CB/CBE7 24.34 24.08 43.74 43.57 31.92 32.34 20.63 20.33 CB/CBE CB/CBE8 25.58 25.95 43.63 43.66 30.79 30.39 21.46 21.76 CB/CBE CB/CBE9 25.36 25.35 43.74 43.78 30.91 30.87 21.38 21.41 CB/CBE CB/CBE10 25.84 25.64 43.38 43.58 30.78 30.78 21.48 21.48 CB/CBE CB/CBE11 25.02 25.27 43.87 44.15 31.11 30.58 21.23 21.62 CB/CBE CB/CBE12 24.92 24.93 44.25 44.17 30.83 30.90 21.43 21.39 CB/CBE CB/CBE13 25.43 25.71 43.72 43.75 30.85 30.54 21.42 21.65 CB/CBE CB/CBE

- 36 -
Table C 13: Results accepted on technical grounds for sample 13 (two replicates)
POPmeasured POSmeasured SOSmeasured POPcalculated (1) Decision (2)
Lab code A B A B A B A B A B1 19.67 19.66 47.39 47.42 32.94 32.92 19.89 19.90 pure CB pure CB2 19.77 19.79 47.13 47.32 33.09 32.89 19.78 19.93 pure CB pure CB3 19.78 19.80 47.36 47.32 32.86 32.87 19.95 19.94 pure CB pure CB4 19.68 19.57 47.35 47.52 32.97 32.91 19.87 19.91 pure CB pure CB5 19.67 19.80 47.55 47.47 32.77 32.73 20.01 20.04 pure CB pure CB6 19.38 19.67 47.66 47.47 32.96 32.86 19.87 19.95 pure CB pure CB7 18.56 18.50 47.11 47.06 34.33 34.44 18.87 18.79 pure CB pure CB8 19.84 19.79 47.40 47.45 32.76 32.76 20.02 20.02 pure CB pure CB9 19.77 19.74 47.42 47.41 32.81 32.85 19.99 19.96 pure CB pure CB10 19.61 19.77 47.38 47.35 33.01 32.88 19.84 19.93 pure CB pure CB11 19.92 19.90 47.39 47.40 32.68 32.70 20.08 20.07 pure CB pure CB12 19.86 19.71 47.48 47.42 32.66 32.87 20.09 19.94 pure CB pure CB13 19.88 19.72 47.24 47.30 32.88 32.98 19.93 19.86 pure CB pure CB
(1) Results based on equation 1 (see page 7)
(2) Decision based on equation 2 (see page 7) (CB/CBE = CBE admixture to CB)

- 37 -
Figure C 1: Bar charts of results accepted on technical grounds for sample 1(Laboratory means, minima and maxima; total TGs = POP, POS and SOS)
19.6
19.8
20.0
20.2
20.4
20.6
20.8
13 10 11 3 9 8 6 12 1 2 5 7 4
Laboratory
g PO
P/10
0 to
tal T
G
overall mean: 20.40 g POP/100 g total TGs
47.3
47.4
47.5
47.6
47.7
47.8
47.9
48.0
48.1
3 8 12 5 10 1 4 9 11 7 2 13 6
Laboratory
g PO
S/10
0 to
tal T
G
overall mean: 47.72 g POS/100 g total TGs
31.0
31.2
31.4
31.6
31.8
32.0
32.2
32.4
4 6 7 2 1 5 9 12 11 8 13 10 3
Laboratory
g SO
S/10
0 to
tal T
G
overall mean: 31.88 g SOS/100 g total TGs
- 38 -
Figure C 2: Bar charts of results accepted on technical grounds for sample 2(Laboratory means, minima and maxima; total TGs = POP, POS and SOS)
18.8
18.9
19.0
19.1
19.2
19.3
19.4
19.5
19.6
19.7
19.8
4 8 7 1 10 9 12 11 6 5 2 3 13
Laboratory
g PO
P/10
0 to
tal T
G
overall mean: 19.46 g POP/100 g total TGs
46.8
46.9
47.0
47.1
47.2
47.3
47.4
47.5
47.6
47.7
2 9 8 3 4 10 6 1 11 7 5 12 13
Laboratory
g PO
S/10
0 to
tal T
G
overall mean: 47.42 g POS/100 g total TGs
32.2
32.4
32.6
32.8
33.0
33.2
33.4
33.6
13 5 12 11 3 7 6 10 1 9 8 2 4
Laboratory
g SO
S/10
0 to
tal T
G
overall mean: 33.12 g SOS/100 g total TGs
- 39 -
Figure C 3: Bar charts of results accepted on technical grounds for sample 3(Laboratory means, minima and maxima; total TGs = POP, POS and SOS)
18.2
18.4
18.6
18.8
19.0
19.2
19.4
19.6
19.8
20.0
3 4 10 8 9 12 5 1 7 11 2 13 6
Laboratory
g PO
P/10
0 to
tal T
G
overall mean: 19.03 g POP/100 g total TGs
46.6
46.7
46.8
46.9
47.0
47.1
47.2
47.3
47.4
47.5
47.6
47.7
5 11 10 12 4 9 2 8 1 13 3 7 6
Laboratory
g PO
S/10
0 to
tal T
G
overall mean: 47.24 g POS/100 g total TGs
32.0
32.5
33.0
33.5
34.0
34.5
6 13 2 7 1 11 3 8 9 12 5 4 10
Laboratory
g SO
S/10
0 to
tal T
G
overall mean: 33.72 g SOS/100 g total TGs

- 40 -
Figure C 4: Bar charts of results accepted on technical grounds for sample 4(Laboratory means, minima and maxima; total TGs = POP, POS and SOS)
19.6
19.8
20.0
20.2
20.4
20.6
20.8
21.0
21.2
8 12 4 10 11 9 5 2 3 1 6 7 13
Laboratory
g PO
P/10
0 to
tal T
G
overall mean: 20.61 g POP/100 g total TGs
46.4
46.5
46.6
46.7
46.8
46.9
47.0
47.1
47.2
47.3
47.4
47.5
2 11 3 8 9 13 1 4 5 10 7 12 6
Laboratory
g PO
S/10
0 to
tal T
G
overall mean: 47.08 g POS/100 g total TGs
31.2
31.4
31.6
31.8
32.0
32.2
32.4
32.6
32.8
33.0
33.2
6 7 13 1 5 10 12 9 3 4 2 11 8
Laboratory
g SO
S/10
0 to
tal T
G
overall mean: 32.31 g SOS/100 g total TGs

- 41 -
Figure C 5: Bar charts of results accepted on technical grounds for sample 5(Laboratory means, minima and maxima; total TGs = POP, POS and SOS)
20.1
20.2
20.3
20.4
20.5
20.6
20.7
20.8
20.9
21.0
21.1
5 12 4 8 6 10 13 3 11 2 7 9 1
Laboratory
g PO
P/10
0 to
tal T
G
overall mean: 20.75 g POP/100 g total TGs
45.4
45.6
45.8
46.0
46.2
46.4
46.6
46.8
13 5 11 4 8 2 3 6 9 1 12 10 7
Laboratory
g PO
S/10
0 to
tal T
G
overall mean: 46.34 g POS/100 g total TGs
31.8
32.0
32.2
32.4
32.6
32.8
33.0
33.2
33.4
33.6
1 7 9 10 3 2 12 6 11 8 4 13 5
Laboratory
g SO
S/10
0 to
tal T
G
overall mean: 32.91 g SOS/100 g total TGs
- 42 -
Figure C 6: Bar charts of results accepted on technical grounds for sample 6(Laboratory means, minima and maxima; total TGs = POP, POS and SOS)
32.0
32.5
33.0
33.5
34.0
34.5
13 7 10 1 2 6 9 11 12 5 3 4 8
Laboratory
g SO
S/10
0 to
tal T
G
overall mean: 33.30 g SOS/100 g total TGs
18.8
19.0
19.2
19.4
19.6
19.8
20.0
20.2
8 4 12 11 3 5 9 10 1 6 2 7 13
Laboratory
g PO
P/10
0 to
tal T
G
overall mean: 19.91 g POP/100 g total TGs
46.2
46.3
46.4
46.5
46.6
46.7
46.8
46.9
47.0
47.1
5 8 3 4 11 12 9 2 6 1 7 13 10
Laboratory
g PO
S/10
0 to
tal T
G
overall mean: 46.79 g POS/100 g total TGs

- 43 -
Figure C 7: Bar charts of results accepted on technical grounds for sample 7(Laboratory means, minima and maxima; total TGs = POP, POS and SOS)
19.2
19.4
19.6
19.8
20.0
20.2
20.4
20.6
20.8
6 13 3 4 10 11 1 5 9 12 2 8 7
Laboratory
g PO
P/10
0 to
tal T
G
overall mean: 20.34 g POP/100 g total TGs
45.90
45.95
46.00
46.05
46.10
46.15
46.20
46.25
46.30
4 11 13 2 12 5 1 8 10 3 9 6 7
Laboratory
g PO
S/10
0 to
tal T
G
overall mean: 46.17 g POS/100 g total TGs
32.6
32.8
33.0
33.2
33.4
33.6
33.8
34.0
34.2
7 8 9 12 2 5 1 10 11 3 4 13 6
Laboratory
g SO
S/10
0 to
tal T
G
overall mean: 33.49 g SOS/100 g total TGs
- 44 -
Figure C 8: Bar charts of results accepted on technical grounds for sample 8(Laboratory means, minima and maxima; total TGs = POP, POS and SOS)
17.8
18.0
18.2
18.4
18.6
18.8
19.0
19.2
19.4
19.6
19.8
20.0
13 7 6 4 11 10 8 9 3 2 5 1 12
Laboratory
g PO
P/10
0 to
tal T
G
overall mean: 19.61 g POP/100 g total TGs
45.8
46.0
46.2
46.4
46.6
46.8
47.0
5 4 2 12 9 8 13 3 1 7 11 10 6
Laboratory
g PO
S/10
0 to
tal T
G
overall mean: 46.61 g POS/100 g total TGs
32.5
33.0
33.5
34.0
34.5
35.0
6 1 10 3 11 12 9 8 2 7 4 5 13
Laboratory
g SO
S/10
0 to
tal T
G
overall mean: 33.78 g SOS/100 g total TGs
- 45 -
Figure C 9: Bar charts of results accepted on technical grounds for sample 9(Laboratory means, minima and maxima; total TGs = POP, POS and SOS)
17.0
17.5
18.0
18.5
19.0
19.5
20.0
20.5
21.0
21.5
13 12 6 11 7 9 10 3 4 2 1 5 8
Laboratory
g PO
P/10
0 to
tal T
G
overall mean: 20.28 g POP/100 g total TGs
45.4
45.6
45.8
46.0
46.2
46.4
46.6
2 13 12 5 10 11 3 9 1 8 4 7 6
Laboratory
g PO
S/10
0 to
tal T
G
overall mean: 46.06 g POS/100 g total TGs
31.5
32.0
32.5
33.0
33.5
34.0
34.5
35.0
35.5
36.0
8 4 7 1 6 5 9 3 10 2 11 12 13
Laboratory
g SO
S/10
0 to
tal T
G
overall mean: 33.66 g SOS/100 g total TGs

- 46 -
Figure C 10: Bar charts of results accepted on technical grounds for sample 10(Laboratory means, minima and maxima; total TGs = POP, POS and SOS)
18.5
19.0
19.5
20.0
20.5
21.0
21.5
4 10 12 5 11 2 3 9 8 6 1 7 13
Laboratory
g PO
P/10
0 to
tal T
G
overall mean: 19.97 g POP/100 g total TGs
46.0
46.2
46.4
46.6
46.8
47.0
47.2
47.4
4 12 2 3 9 8 10 1 6 11 5 7 13
Laboratory
g PO
S/10
0 to
tal T
G
overall mean: 46.68 g POS/100 g total TGs
30.0
30.5
31.0
31.5
32.0
32.5
33.0
33.5
34.0
34.5
13 7 6 1 8 9 5 11 3 2 10 12 4
Laboratory
g SO
S/10
0 to
tal T
G
overall mean: 33.35 g SOS/100 g total TGs

- 47 -
Figure C 11: Bar charts of results accepted on technical grounds for sample 11(Laboratory means, minima and maxima; total TGs = POP, POS and SOS)
19.0
19.5
20.0
20.5
21.0
21.5
5 4 13 11 3 10 9 6 1 2 12 8 7
Laboratory
g PO
P/10
0 to
tal T
G
overall mean: 20.68 g POP/100 g total TGs
45.4
45.6
45.8
46.0
46.2
46.4
46.6
46.8
12 11 4 3 1 8 9 6 10 2 13 7 5
Laboratory
g PO
S/10
0 to
tal T
G
overall mean: 46.14 g POS/100 g total TGs
32.0
32.2
32.4
32.6
32.8
33.0
33.2
33.4
33.6
33.8
7 2 8 10 6 1 9 13 12 3 11 4 5
Laboratory
g SO
S/10
0 to
tal T
G
overall mean: 33.17 g SOS/100 g total TGs
- 48 -
Figure C 12: Bar charts of results accepted on technical grounds for sample 12(Laboratory means, minima and maxima; total TGs = POP, POS and SOS)
23.0
23.5
24.0
24.5
25.0
25.5
26.0
26.5
7 12 6 11 1 3 5 9 2 4 13 10 8
Laboratory
g PO
P/10
0 to
tal T
G
overall mean: 25.26 g POP/100 g total TGs
42.6
42.8
43.0
43.2
43.4
43.6
43.8
44.0
44.2
44.4
44.6
44.8
10 5 8 3 7 13 4 1 2 9 11 12 6
Laboratory
g PO
S/10
0 to
tal T
G
overall mean: 43.79 g POS/100 g total TGs
29.0
29.5
30.0
30.5
31.0
31.5
32.0
32.5
8 6 13 10 4 11 12 9 2 1 3 5 7
Laboratory
g SO
S/10
0 to
tal T
G
overall mean: 30.95 g SOS/100 g total TGs

- 49 -
Figure C 13: Bar charts of results accepted on technical grounds for sample 13(Laboratory means, minima and maxima; total TGs = POP, POS and SOS)
17.5
18.0
18.5
19.0
19.5
20.0
20.5
7 6 4 1 10 5 9 2 12 3 13 8 11
Laboratory
g PO
P/10
0 to
tal T
G
overall mean: 19.65 g POP/100 g total TGs
46.7
46.8
46.9
47.0
47.1
47.2
47.3
47.4
47.5
47.6
47.7
47.8
7 2 13 3 10 11 1 9 8 4 12 5 6
Laboratory
g PO
S/10
0 to
tal T
G
overall mean: 47.38 g POS/100 g total TGs
31.5
32.0
32.5
33.0
33.5
34.0
34.5
35.0
11 5 8 12 9 3 6 1 13 4 10 2 7
Laboratory
g SO
S/10
0 to
tal T
G
overall mean: 32.98 g SOS/100 g total TGs
- 50 -
Table C 14: Statistical evaluation of the results accepted on technical grounds(Results reported as g TG / 100 g total TGs (= POP+POS+SOS=100 %))
Sa.No. p (1) mean min max r sr RSDr R sR RSDR
POP1 13 20.40 20.11 20.67 0.291 0.104 0.5 0.418 0.149 0.72 13 19.46 19.15 19.62 0.192 0.069 0.4 0.343 0.122 0.63 13 19.03 18.88 19.54 0.374 0.133 0.7 0.573 0.205 1.14 13 20.61 20.38 20.86 0.514 0.184 0.9 0.540 0.193 0.95 13 20.75 20.50 20.99 0.395 0.141 0.7 0.437 0.156 0.86 13 19.91 19.60 20.11 0.377 0.135 0.7 0.481 0.172 0.97 13 20.34 19.88 20.54 0.419 0.150 0.7 0.632 0.226 1.18 13 19.61 18.59 19.78 0.261 0.093 0.5 0.911 0.325 1.79 13 20.28 18.58 20.72 0.348 0.124 0.6 1.498 0.535 2.610 13 19.97 19.70 21.29 0.077 0.028 0.1 1.138 0.406 2.011 13 20.68 19.72 21.01 0.295 0.105 0.5 0.920 0.329 1.612 13 25.26 24.21 25.77 0.456 0.163 0.6 1.157 0.413 1.613 13 19.65 18.53 19.91 0.242 0.086 0.4 0.993 0.355 1.8
POS1 13 47.72 47.57 47.95 0.174 0.062 0.1 0.303 0.108 0.22 13 47.42 47.13 47.57 0.256 0.092 0.2 0.396 0.142 0.33 13 47.24 47.11 47.62 0.227 0.081 0.2 0.403 0.144 0.34 13 47.08 46.91 47.31 0.267 0.095 0.2 0.368 0.132 0.35 13 46.34 46.05 46.53 0.215 0.077 0.2 0.510 0.182 0.46 13 46.79 46.64 46.90 0.251 0.089 0.2 0.288 0.103 0.27 13 46.17 46.05 46.26 0.142 0.051 0.1 0.200 0.071 0.28 13 46.61 46.36 46.85 0.388 0.139 0.3 0.454 0.162 0.39 13 46.06 45.85 46.30 0.283 0.101 0.2 0.430 0.154 0.310 13 46.68 46.46 47.13 0.229 0.082 0.2 0.492 0.176 0.411 13 46.14 45.91 46.62 0.220 0.079 0.2 0.530 0.189 0.412 13 43.79 43.48 44.23 0.451 0.161 0.4 0.709 0.253 0.613 13 47.38 47.08 47.57 0.190 0.068 0.1 0.377 0.135 0.3
SOS1 13 31.88 31.64 32.08 0.416 0.149 0.5 0.515 0.184 0.62 13 33.12 32.81 33.44 0.271 0.097 0.3 0.523 0.187 0.63 13 33.72 32.83 33.96 0.498 0.178 0.5 0.898 0.321 1.04 13 32.31 31.94 32.62 0.621 0.222 0.7 0.701 0.250 0.85 13 32.91 32.50 33.42 0.478 0.171 0.5 0.782 0.279 0.86 13 33.30 33.00 33.73 0.562 0.201 0.6 0.706 0.252 0.87 13 33.49 33.21 33.87 0.425 0.152 0.5 0.643 0.230 0.78 13 33.78 33.53 34.79 0.575 0.205 0.6 0.996 0.356 1.19 13 33.66 33.26 35.56 0.386 0.138 0.4 1.686 0.602 1.810 13 33.35 31.58 33.84 0.214 0.076 0.2 1.566 0.559 1.711 13 33.17 32.68 33.65 0.341 0.122 0.4 0.727 0.260 0.812 13 30.95 30.59 32.13 0.521 0.186 0.6 1.140 0.407 1.313 13 32.98 32.69 34.38 0.209 0.075 0.2 1.222 0.437 1.3
(1) no. of laboratories

- 51 -
Table C 15: Statistical evaluation of the results accepted on technical and statisticalgrounds (Results reported as g TG / 100 g total TGs (= POP+POS+SOS=100 %))
Sa.no. p (1) (2) (3) (4) mean r sr RSDr R sR RSDR
POP1 12 1 8 C 20.40 0.160 0.057 0.3 0.397 0.142 0.72 12 1 4 SG 19.49 0.194 0.069 0.4 0.227 0.081 0.43 12 1 6 SG 18.99 0.258 0.092 0.5 0.337 0.120 0.64 13 0 20.61 0.514 0.184 0.9 0.540 0.193 0.95 13 0 20.75 0.395 0.141 0.7 0.437 0.156 0.86 12 1 8 C 19.94 0.140 0.050 0.3 0.331 0.118 0.67 12 1 4 C 20.35 0.209 0.075 0.4 0.601 0.214 1.18 11 2 13; 4 SG; C 19.70 0.261 0.093 0.5 0.317 0.113 0.69 12 1 13 SG 20.42 0.322 0.115 0.6 0.441 0.157 0.810 12 1 13 SG 19.86 0.080 0.029 0.1 0.262 0.094 0.511 12 1 5 SG 20.76 0.306 0.109 0.5 0.459 0.164 0.812 11 2 7; 6 SG; C 25.37 0.358 0.128 0.5 0.741 0.265 1.013 12 1 7 SG 19.74 0.250 0.089 0.5 0.335 0.120 0.6
POS1 12 1 8 C 47.73 0.157 0.056 0.1 0.302 0.108 0.22 12 1 4 SG 47.42 0.265 0.095 0.2 0.413 0.148 0.33 12 1 6 SG 47.21 0.236 0.084 0.2 0.253 0.090 0.24 13 0 47.08 0.267 0.095 0.2 0.368 0.132 0.35 13 0 46.34 0.215 0.077 0.2 0.510 0.182 0.46 12 1 8 C 46.80 0.196 0.070 0.1 0.254 0.091 0.27 12 1 4 C 46.18 0.148 0.053 0.1 0.183 0.066 0.18 11 2 13; 4 SG; C 46.62 0.177 0.063 0.1 0.399 0.142 0.39 12 1 13 SG 46.08 0.293 0.105 0.2 0.414 0.148 0.310 12 1 13 SG 46.65 0.233 0.083 0.2 0.330 0.118 0.311 12 1 5 SG 46.10 0.221 0.079 0.2 0.351 0.125 0.312 11 2 7; 6 SG; C 43.76 0.282 0.101 0.2 0.588 0.210 0.513 12 1 7 SG 47.40 0.195 0.070 0.1 0.298 0.106 0.2
SOS1 12 1 8 C 31.87 0.261 0.093 0.3 0.473 0.169 0.52 12 1 4 SG 33.09 0.271 0.097 0.3 0.464 0.166 0.53 12 1 6 SG 33.80 0.430 0.154 0.5 0.471 0.168 0.54 13 0 32.31 0.621 0.222 0.7 0.701 0.250 0.85 13 0 32.91 0.478 0.171 0.5 0.782 0.279 0.86 12 1 8 C 33.27 0.230 0.082 0.2 0.506 0.181 0.57 12 1 4 C 33.48 0.209 0.075 0.2 0.596 0.213 0.68 11 2 13; 4 SG; C 33.68 0.383 0.137 0.4 0.417 0.149 0.49 12 1 13 SG 33.50 0.377 0.134 0.4 0.549 0.196 0.610 12 1 13 SG 33.50 0.217 0.077 0.2 0.517 0.185 0.611 12 1 5 SG 33.14 0.354 0.126 0.4 0.633 0.226 0.712 11 2 7; 6 SG; C 30.87 0.503 0.180 0.6 0.553 0.198 0.613 12 1 7 SG 32.86 0.208 0.074 0.2 0.310 0.111 0.3(1) no. of accepted laboratories
(2) no. of outliers removed
(3) Identity of outlying laboratories
(4) Reason for removal (C = Cochran, SG = Single Grubbs)
Related Documents