Validation and Refinement of Survival Models for Liver Retransplantation Hugo R. Rosen, 1 Martin Prieto, 2 Teresa Casanovas-Taltavull, 3 Valentin Cuervas-Mons, 4 Olaf Guckelberger, 5 Paolo Muiesan, 6 Russell W. Strong, 7 Wolf O. Bechstein, 5 John O’Grady, 6 Atif Zaman, 1 Benjamin Chan, 9 Joaquin Berenguer, 2 Roger Williams, 8 Nigel Heaton, 6 and Peter Neuhaus 5 Orthotopic liver retransplantation (re-OLT) is highly controversial. The objectives of this study were to determine the validity of a recently developed United Network for Organ Sharing (UNOS) multivariate model using an independent cohort of patients undergoing re-OLT outside the United States, to determine whether incorporation of other variables that were incomplete in the UNOS registry would provide additional prognostic informa- tion, to develop new models combining data sets from both cohorts, and to evaluate the validity of the model for end-stage liver disease (MELD) in patients undergoing re-OLT. Two hundred eighty-one adult patients undergoing re-OLT (between 1986 and 1999) at 6 foreign transplant centers comprised the validation cohort. We found good agreement between actual survival and predicted survival in the validation cohort; 1-year patient sur- vival rates in the low-, intermediate-, and high-risk groups (as assigned by the original UNOS model) were 72%, 68%, and 36%, respectively (P < .0001). In the patients for whom the international normalized ratio (INR) of prothrombin time was available, MELD corre- lated with outcome following re-OLT; the median MELD scores for patients surviving at least 90 days compared with those dying within 90 days were 20.75 versus 25.9, respectively (P .004). Utilizing both patient cohorts (n 979), a new model, based on recipient age, total serum bilirubin, creatinine, and interval to re-OLT, was constructed (whole model 2 105, P < .0001). Using the c-statistic with 30-day, 90-day, 1-year, and 3-year mortality as the end points, the area under the receiver operating characteristic (ROC) curves for 4 different models were compared. In conclusion, prospective validation and use of these models as adjuncts to clinical decision making in the management of patients being consid- ered for re-OLT are warranted. (HEPATOLOGY 2003;38:460-469.) T he growing discrepancy between the static number of donor organs and the growing number of poten- tial orthotopic liver transplantation (OLT) recipi- ents has led to dramatic increases in the number of patients waiting for OLT, as well as deaths while on the waiting list. 1 Advances in surgical and medical care of recipients have sig- nificantly improved patient and graft survival. 2 However, despite such progress, recurrence of liver disease can occur for virtually all primary indications of OLT, and a subset of these patients develop allograft failure. 3 A steady increase in the number of OLT patients surviving long term has resulted in an increasing population of primary OLT patients who may ultimately require additional grafts. Therefore, al- though orthotopic liver retransplantation (re-OLT) cur- rently accounts for approximately 10% of all liver transplantations, 4 the proportion of patients requiring re- OLT is expected to grow as primary transplant patients sur- vive long enough to develop graft failure caused by recurrent disease. Indeed, one model has predicted that the number of re-OLT candidates may eventually outstrip the number of potential donor livers. 5 Abbreviations: OLT, orthotopic liver transplantation; re-OLT, orthotopic liver retransplantation; UNOS, United Network for Organ Sharing; INR, international normalized ratio; MELD, model for end-stage liver disease; ROC, receiver operat- ing characteristic. From the 1 Portland VAMC and Oregon Health and Science University, Port- land, OR; 2 Hospital La Fe, Valencia, Spain; 3 Unidad de Trasplante Hepa ´tico, Ciudad Sanitaria y Universitaria de Bellvitge, Barcelona, Spain; 4 Hospital Puerta de Hierro, Universidad Autonoma de Madrid, Spain; 5 Virchow Klinikum, Berlin, Germany; 6 King’s College, London, United Kingdom; 7 Royal Brisbane Hospital, Queensland, Australia; 8 University College, London, United Kingdom; and 9 Bio- statistics, Clinical Information Analysis and Decision Support Center, Oregon Health and Science University, Portland, OR. Received December 18, 2002; accepted May 12, 2003. Supported by the American College of Gastroenterology Clinical Research Award and a VA merit review grant, Washington, DC (to H.R.R.). Presented in part at the Plenary Session, American Association for the Study of Liver Diseases, Boston, November 2002. Address reprint requests to: Hugo R. Rosen, M.D., Division of Gastroenterology/ Hepatology, Portland Veterans Affairs Medical Center, 3710 SW U. S. Veterans Hospital, P3-GI, Portland, OR 97207. E-mail: [email protected]; fax: 503-273-5348. Copyright © 2003 by the American Association for the Study of Liver Diseases. 0270-9139/03/3802-0024$30.00/0 doi:10.1053/jhep.2003.50328 460

Welcome message from author
This document is posted to help you gain knowledge. Please leave a comment to let me know what you think about it! Share it to your friends and learn new things together.
Transcript
Validation and Refinement of Survival Modelsfor Liver Retransplantation
Hugo R. Rosen,1 Martin Prieto,2 Teresa Casanovas-Taltavull,3 Valentin Cuervas-Mons,4 Olaf Guckelberger,5
Paolo Muiesan,6 Russell W. Strong,7 Wolf O. Bechstein,5 John O’Grady,6 Atif Zaman,1 Benjamin Chan,9
Joaquin Berenguer,2 Roger Williams,8 Nigel Heaton,6 and Peter Neuhaus5
Orthotopic liver retransplantation (re-OLT) is highly controversial. The objectives of thisstudy were to determine the validity of a recently developed United Network for OrganSharing (UNOS) multivariate model using an independent cohort of patients undergoingre-OLT outside the United States, to determine whether incorporation of other variablesthat were incomplete in the UNOS registry would provide additional prognostic informa-tion, to develop new models combining data sets from both cohorts, and to evaluate thevalidity of the model for end-stage liver disease (MELD) in patients undergoing re-OLT.Two hundred eighty-one adult patients undergoing re-OLT (between 1986 and 1999) at 6foreign transplant centers comprised the validation cohort. We found good agreementbetween actual survival and predicted survival in the validation cohort; 1-year patient sur-vival rates in the low-, intermediate-, and high-risk groups (as assigned by the originalUNOS model) were 72%, 68%, and 36%, respectively (P < .0001). In the patients for whomthe international normalized ratio (INR) of prothrombin time was available, MELD corre-lated with outcome following re-OLT; the median MELD scores for patients surviving atleast 90 days compared with those dying within 90 days were 20.75 versus 25.9, respectively(P � .004). Utilizing both patient cohorts (n � 979), a new model, based on recipient age,total serum bilirubin, creatinine, and interval to re-OLT, was constructed (whole model�2 � 105, P < .0001). Using the c-statistic with 30-day, 90-day, 1-year, and 3-year mortalityas the end points, the area under the receiver operating characteristic (ROC) curves for 4different models were compared. In conclusion, prospective validation and use of thesemodels as adjuncts to clinical decision making in the management of patients being consid-ered for re-OLT are warranted. (HEPATOLOGY 2003;38:460-469.)
The growing discrepancy between the static numberof donor organs and the growing number of poten-tial orthotopic liver transplantation (OLT) recipi-
ents has led to dramatic increases in the number of patientswaiting for OLT, as well as deaths while on the waiting list.1
Advances in surgical and medical care of recipients have sig-nificantly improved patient and graft survival.2 However,despite such progress, recurrence of liver disease can occur forvirtually all primary indications of OLT, and a subset ofthese patients develop allograft failure.3 A steady increase inthe number of OLT patients surviving long term has resultedin an increasing population of primary OLT patients whomay ultimately require additional grafts. Therefore, al-though orthotopic liver retransplantation (re-OLT) cur-rently accounts for approximately 10% of all livertransplantations,4 the proportion of patients requiring re-OLT is expected to grow as primary transplant patients sur-vive long enough to develop graft failure caused by recurrentdisease. Indeed, one model has predicted that the number ofre-OLT candidates may eventually outstrip the number ofpotential donor livers.5
Abbreviations: OLT, orthotopic liver transplantation; re-OLT, orthotopic liverretransplantation; UNOS, United Network for Organ Sharing; INR, internationalnormalized ratio; MELD, model for end-stage liver disease; ROC, receiver operat-ing characteristic.
From the 1Portland VAMC and Oregon Health and Science University, Port-land, OR; 2Hospital La Fe, Valencia, Spain; 3Unidad de Trasplante Hepatico,Ciudad Sanitaria y Universitaria de Bellvitge, Barcelona, Spain; 4Hospital Puertade Hierro, Universidad Autonoma de Madrid, Spain; 5Virchow Klinikum, Berlin,Germany; 6King’s College, London, United Kingdom; 7Royal Brisbane Hospital,Queensland, Australia; 8University College, London, United Kingdom; and 9Bio-statistics, Clinical Information Analysis and Decision Support Center, OregonHealth and Science University, Portland, OR.
Received December 18, 2002; accepted May 12, 2003.Supported by the American College of Gastroenterology Clinical Research Award
and a VA merit review grant, Washington, DC (to H.R.R.).Presented in part at the Plenary Session, American Association for the Study of
Liver Diseases, Boston, November 2002.Address reprint requests to: Hugo R. Rosen, M.D., Division of Gastroenterology/
Hepatology, Portland Veterans Affairs Medical Center, 3710 SW U. S. VeteransHospital, P3-GI, Portland, OR 97207. E-mail: [email protected]; fax:503-273-5348.
Copyright © 2003 by the American Association for the Study of Liver Diseases.0270-9139/03/3802-0024$30.00/0doi:10.1053/jhep.2003.50328
460
We recently developed a prognostic model based ondata collected from the United Network for Organ Shar-ing (UNOS) registry to predict survival following re-OLT.6 Following analysis of 16 donor and recipientfactors, a 5-variable model with specific risk scores forindividual patients was derived. However, we recognizethe inherent limitations of registry data, e.g., missing, in-complete, or inaccurate data. The goals of the currentanalysis were to determine the applicability of this UNOSmodel on an independent, heterogeneous cohort of pa-tients, i.e., patients undergoing re-OLT at transplantationprograms outside the United States. We also sought todetermine whether other variables that were incompletein the UNOS registry database (e.g., specific etiologies ofgraft failure) might contribute to the estimation of prog-nosis. Moreover, in the patients undergoing re-OLT forwhom the international normalized ratio (INR) of pro-thrombin time was available, we tested the predictive abil-ity of the model for end-stage liver disease (MELD),7
originally developed to assess the short-term prognosis ofpatients with cirrhosis. Finally, because of the recentadoption of a new system to allocate livers and because ofthe ethical obligation to offer re-OLT to patients withearly graft failure (within 2 weeks of primary transplanta-tion), we developed new models based on these consider-ations and combining data from the UNOS andinternational cohorts. Using the c-statistic with 30-day,90-day, 1-year, and 3-year mortality as end points, thearea under the receiver operating characteristic (ROC)curve for 4 different survival models were compared.
Patients and Methods
Patient Population and Data Collection. The studypopulation consisted of 281 patients who underwent re-OLT for hepatic allograft failure between April 4, 1986, andJanuary 22, 1999, at 6 centers. The centers included Vir-chow Klinikum, Berlin, Germany (n � 74); King’s CollegeHospital, London, United Kingdom (n � 74); Hospital LaFe, Valencia, Spain (n � 22); Unidad de Trasplante He-patico, Ciudad Sanitaria y Universitaria de Bellvitge, Barce-lona, Spain (n � 58); Hospital Puerta de Hierro,Universidad Autonoma, Madrid, Spain (n � 30); and Uni-versity of Queensland Hospital, Brisbane, Australia (n �23). Each liver transplantation program contributed demo-graphic, clinical, histologic, and survival data on consecutivepatients undergoing liver retransplantation at their centers.
The UNOS cohort has been described previously in de-tail.6 Briefly, this cohort was comprised of 1,356 patientswho had undergone re-OLT in the United States between1990 and 1996. UNOS status (as used between 1990 and
November 1994) had been designated as follows: 1 (inten-sive care unit bound with a life expectancy of less than 7 dayswithout transplant), 2 (continuous hospitalization of at least5 days), and 3 (continuous medical care).
Statistical Methodology. As previously described indetail,6 the starting time for all survival analyses was thedate of re-OLT, and death from any cause was treated asa failure for survival analyses. Data for each patient wereentered into the Cox proportional hazards regressionmodel8,9 in which each patient is assigned a risk score (R):
R��1X1��2X2��3X3� . . . . . ��kXk
in which X1, X2, X3, . . . . . Xk are the levels of k prognosticvariables (risk factors) and �1, �2, �3, . . . . . �k are regres-sion coefficients. The regression coefficients are estimatedby the method of maximum likelihood estimation appliedto the Cox partial likelihood.
For time-dependent analysis, the Kaplan-Meier prod-uct-limit estimate was used with comparison between riskgroups performed via the log-rank test. Data from bothUNOS and international cohorts were combined to gen-erate a new model using Cox proportional hazards fortime-dependent analysis and logistic regression analysisfor binary outcomes.
The JMP 4.04 and SAS 6.12 (SAS Institute Inc, Cary,NC) statistical packages were used. Unpaired t test (forcomparison of 2 groups) and 1-way analysis of variance(for comparison of more than 2 groups) were used forparametric data, and Wilcoxon rank sum and Kruskall-Wallis test were used for nonparametric data. For categor-ical data, the Mantel-Haenszel �2 test was used forstatistical comparison of means (�SEM) and proportionsbetween groups, respectively. A P value less than .05 wasconsidered significant for all situations. To assess the abil-ity of the mathematic models to correctly stratify patientsaccording to risk of death at different time points, theconcordance (c-statistic) equivalent to the area under the(ROC) curve was measured.10 By convention, a c-statisticof 0.7 or greater is considered to be clinically useful.
Results
International Patients. Table 1 shows the baselinedemographic, clinical, and biochemical characteristics ofthe patients undergoing re-OLT at the 6 non-U.S. trans-plantation programs and from the UNOS registry thatcontributed data to this analysis. The average age was 43.5years, the median interval to re-OLT following primaryOLT was 121 days, and the median length of follow-up todate of death or last follow-up was 1.5 years (longest, 11.8years); 144 (51.2%) patients received tacrolimus as their
HEPATOLOGY, Vol. 38, No. 2, 2003 ROSEN ET AL. 461
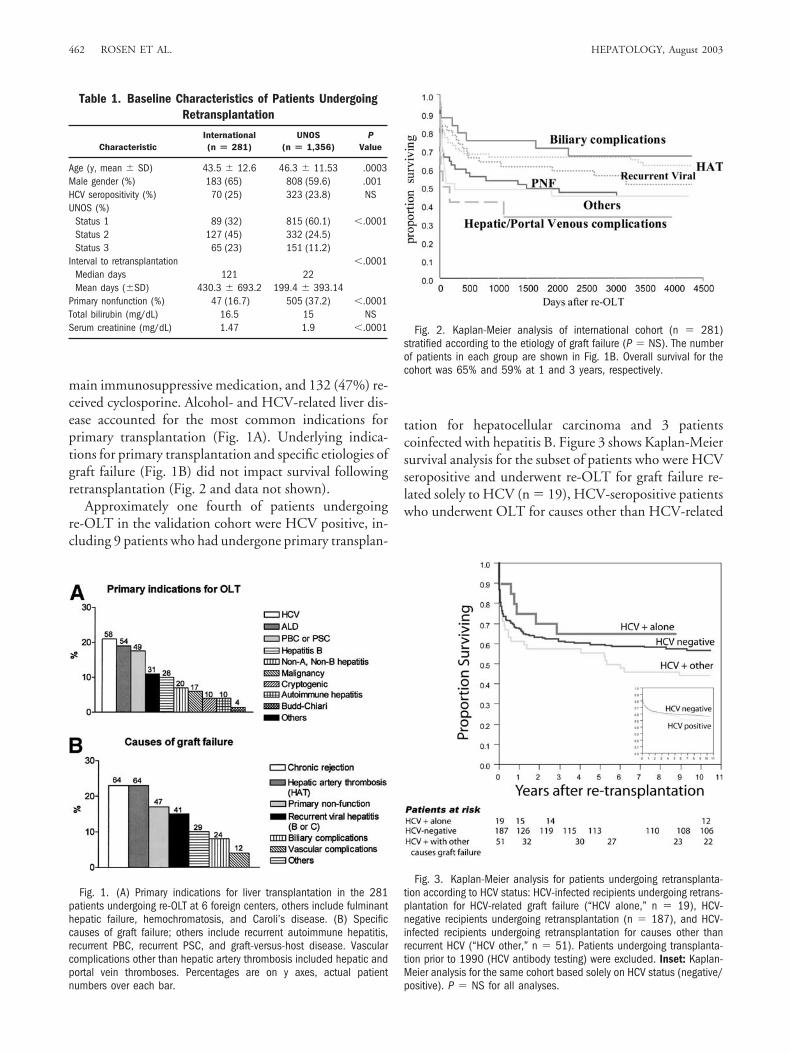
main immunosuppressive medication, and 132 (47%) re-ceived cyclosporine. Alcohol- and HCV-related liver dis-ease accounted for the most common indications forprimary transplantation (Fig. 1A). Underlying indica-tions for primary transplantation and specific etiologies ofgraft failure (Fig. 1B) did not impact survival followingretransplantation (Fig. 2 and data not shown).
Approximately one fourth of patients undergoingre-OLT in the validation cohort were HCV positive, in-cluding 9 patients who had undergone primary transplan-
tation for hepatocellular carcinoma and 3 patientscoinfected with hepatitis B. Figure 3 shows Kaplan-Meiersurvival analysis for the subset of patients who were HCVseropositive and underwent re-OLT for graft failure re-lated solely to HCV (n � 19), HCV-seropositive patientswho underwent OLT for causes other than HCV-related
Table 1. Baseline Characteristics of Patients UndergoingRetransplantation
CharacteristicInternational(n � 281)
UNOS(n � 1,356)
PValue
Age (y, mean � SD) 43.5 � 12.6 46.3 � 11.53 .0003Male gender (%) 183 (65) 808 (59.6) .001HCV seropositivity (%) 70 (25) 323 (23.8) NSUNOS (%)
Status 1 89 (32) 815 (60.1) �.0001Status 2 127 (45) 332 (24.5)Status 3 65 (23) 151 (11.2)
Interval to retransplantation �.0001Median days 121 22Mean days (�SD) 430.3 � 693.2 199.4 � 393.14
Primary nonfunction (%) 47 (16.7) 505 (37.2) �.0001Total bilirubin (mg/dL) 16.5 15 NSSerum creatinine (mg/dL) 1.47 1.9 �.0001
Fig. 1. (A) Primary indications for liver transplantation in the 281patients undergoing re-OLT at 6 foreign centers, others include fulminanthepatic failure, hemochromatosis, and Caroli’s disease. (B) Specificcauses of graft failure; others include recurrent autoimmune hepatitis,recurrent PBC, recurrent PSC, and graft-versus-host disease. Vascularcomplications other than hepatic artery thrombosis included hepatic andportal vein thromboses. Percentages are on y axes, actual patientnumbers over each bar.
Fig. 2. Kaplan-Meier analysis of international cohort (n � 281)stratified according to the etiology of graft failure (P � NS). The numberof patients in each group are shown in Fig. 1B. Overall survival for thecohort was 65% and 59% at 1 and 3 years, respectively.
Fig. 3. Kaplan-Meier analysis for patients undergoing retransplanta-tion according to HCV status: HCV-infected recipients undergoing retrans-plantation for HCV-related graft failure (“HCV alone,” n � 19), HCV-negative recipients undergoing retransplantation (n � 187), and HCV-infected recipients undergoing retransplantation for causes other thanrecurrent HCV (“HCV other,” n � 51). Patients undergoing transplanta-tion prior to 1990 (HCV antibody testing) were excluded. Inset: Kaplan-Meier analysis for the same cohort based solely on HCV status (negative/positive). P � NS for all analyses.
462 ROSEN ET AL. HEPATOLOGY, August 2003
graft failure (n � 51; including 16 patients with hepaticartery thrombosis, 17 with primary nonfunction (PNF)and 7 with chronic rejection), and the HCV-seronegativegroup (n � 187; patients undergoing transplantationprior to the availability of HCV antibody testing in 1990were excluded). There were no statistically significant dif-ferences among the 3 groups with regard to gender, serumbilirubin, serum creatinine, original UNOS model riskscore (mean 0.89, 0.90, and 0.91, respectively), or MELDscore (mean 21, 24, 24.6, respectively). However, patientsundergoing retransplantation for HCV alone were signif-icantly older (mean age, 50.6 years vs. 48.3 years in theHCV with other causes of graft failure group and 42.3years in the HCV-negative group, P � .0003) and under-went retransplantation at a significantly greater time in-terval (1,079.5 days after primary transplant vs. 182 and411 days, respectively, P � .0001). These results are inaccord with recent studies demonstrating that cumulativepatient survival after re-OLT is not significantly affectedby HCV status11; moreover, inclusion of HCV status didnot increase the predictive value of the original UNOSmodel.6
Validation of Original UNOS Model With Inter-national Cohort. The cohort of patients undergoingretransplantation at non-U.S. programs differed signifi-cantly from the UNOS cohort previously used to developthe original survival model (Table 1). Specifically, theUNOS patients were older (mean, 46.3 vs. 43.5 years, re-spectively; P � .0003), had higher median serum creatininelevels (1.9 vs. 1.47 mg/dL, respectively; P � .0001), and amuch greater proportion were listed as UNOS status 1 at thetime of regrafting (60.1% vs. 32%, respectively; P � .0001).We tested the validity of the original UNOS model in this
independent population of patients by combining the valuesof the 5 prognostic variables as follows:
R�.024 (recipient age in years)
�.112(�bilirubin in mg/dL)
�.230(logecreatinine mg/dL)
�.974 (cause of graft failure)�UNOS coefficient,
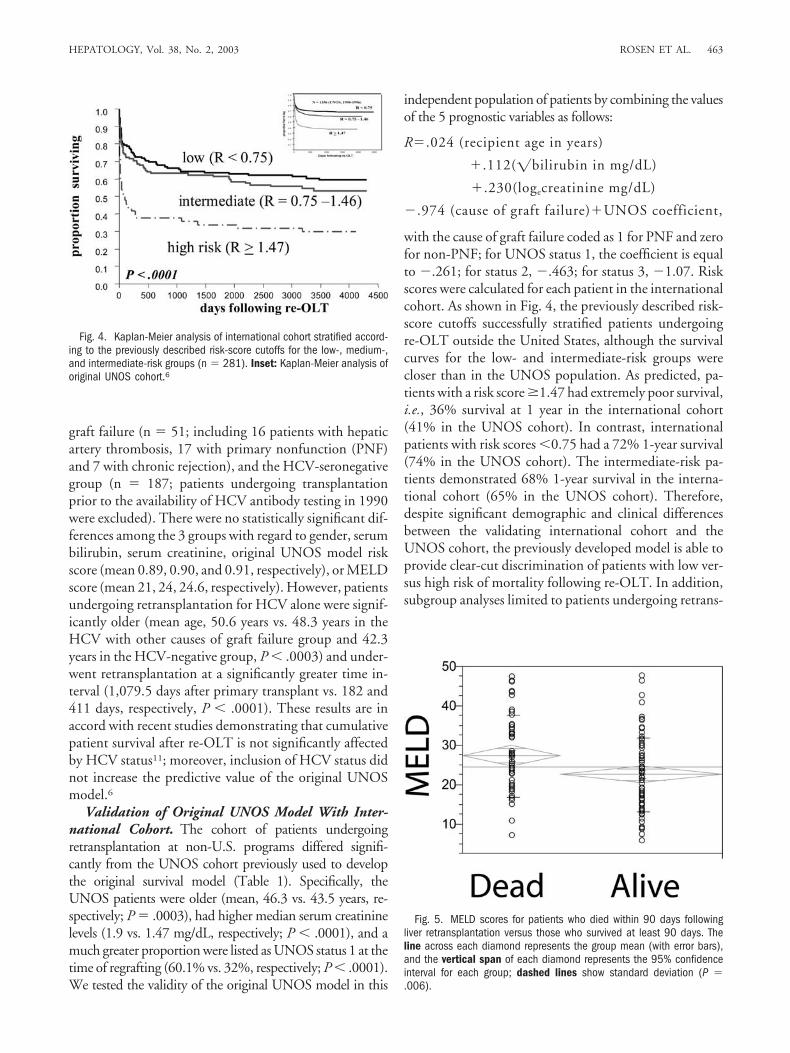
with the cause of graft failure coded as 1 for PNF and zerofor non-PNF; for UNOS status 1, the coefficient is equalto �.261; for status 2, �.463; for status 3, �1.07. Riskscores were calculated for each patient in the internationalcohort. As shown in Fig. 4, the previously described risk-score cutoffs successfully stratified patients undergoingre-OLT outside the United States, although the survivalcurves for the low- and intermediate-risk groups werecloser than in the UNOS population. As predicted, pa-tients with a risk score �1.47 had extremely poor survival,i.e., 36% survival at 1 year in the international cohort(41% in the UNOS cohort). In contrast, internationalpatients with risk scores �0.75 had a 72% 1-year survival(74% in the UNOS cohort). The intermediate-risk pa-tients demonstrated 68% 1-year survival in the interna-tional cohort (65% in the UNOS cohort). Therefore,despite significant demographic and clinical differencesbetween the validating international cohort and theUNOS cohort, the previously developed model is able toprovide clear-cut discrimination of patients with low ver-sus high risk of mortality following re-OLT. In addition,subgroup analyses limited to patients undergoing retrans-
Fig. 4. Kaplan-Meier analysis of international cohort stratified accord-ing to the previously described risk-score cutoffs for the low-, medium-,and intermediate-risk groups (n � 281). Inset: Kaplan-Meier analysis oforiginal UNOS cohort.6
Fig. 5. MELD scores for patients who died within 90 days followingliver retransplantation versus those who survived at least 90 days. Theline across each diamond represents the group mean (with error bars),and the vertical span of each diamond represents the 95% confidenceinterval for each group; dashed lines show standard deviation (P �.006).
HEPATOLOGY, Vol. 38, No. 2, 2003 ROSEN ET AL. 463
plantation in the past decade (since 1992) demonstratedcomparable sensitivity (data not shown).
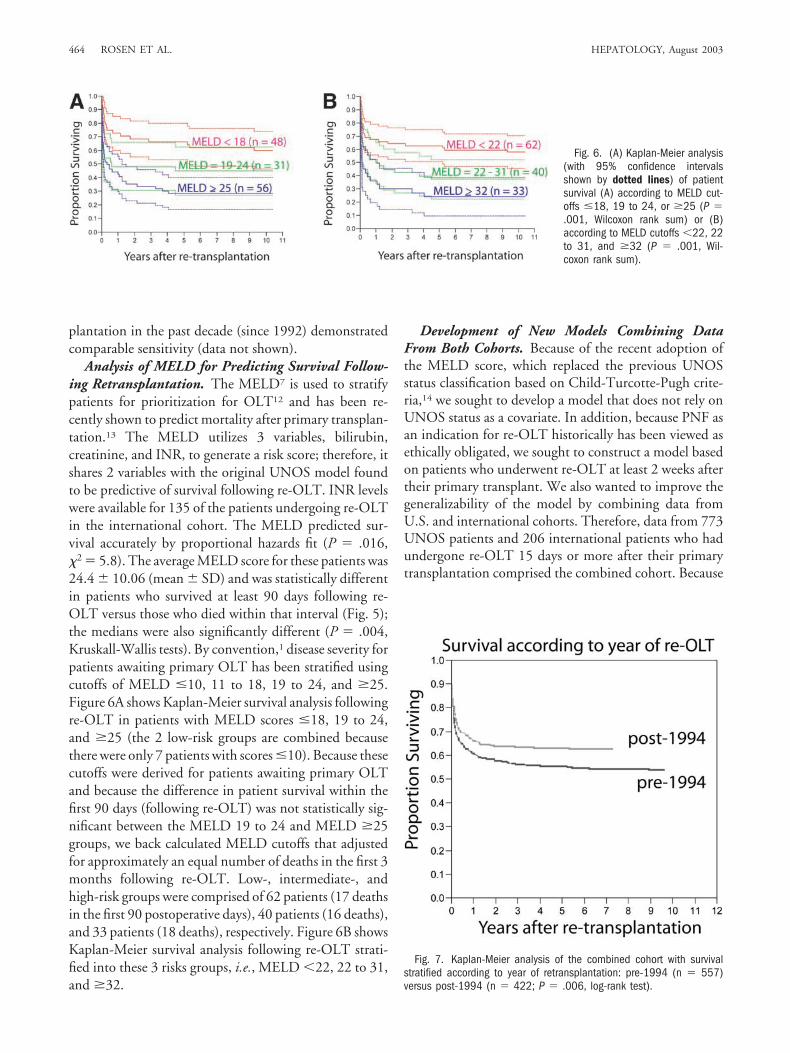
Analysis of MELD for Predicting Survival Follow-ing Retransplantation. The MELD7 is used to stratifypatients for prioritization for OLT12 and has been re-cently shown to predict mortality after primary transplan-tation.13 The MELD utilizes 3 variables, bilirubin,creatinine, and INR, to generate a risk score; therefore, itshares 2 variables with the original UNOS model foundto be predictive of survival following re-OLT. INR levelswere available for 135 of the patients undergoing re-OLTin the international cohort. The MELD predicted sur-vival accurately by proportional hazards fit (P � .016,�2 � 5.8). The average MELD score for these patients was24.4 � 10.06 (mean � SD) and was statistically differentin patients who survived at least 90 days following re-OLT versus those who died within that interval (Fig. 5);the medians were also significantly different (P � .004,Kruskall-Wallis tests). By convention,1 disease severity forpatients awaiting primary OLT has been stratified usingcutoffs of MELD �10, 11 to 18, 19 to 24, and �25.Figure 6A shows Kaplan-Meier survival analysis followingre-OLT in patients with MELD scores �18, 19 to 24,and �25 (the 2 low-risk groups are combined becausethere were only 7 patients with scores �10). Because thesecutoffs were derived for patients awaiting primary OLTand because the difference in patient survival within thefirst 90 days (following re-OLT) was not statistically sig-nificant between the MELD 19 to 24 and MELD �25groups, we back calculated MELD cutoffs that adjustedfor approximately an equal number of deaths in the first 3months following re-OLT. Low-, intermediate-, andhigh-risk groups were comprised of 62 patients (17 deathsin the first 90 postoperative days), 40 patients (16 deaths),and 33 patients (18 deaths), respectively. Figure 6B showsKaplan-Meier survival analysis following re-OLT strati-fied into these 3 risks groups, i.e., MELD �22, 22 to 31,and �32.
Development of New Models Combining DataFrom Both Cohorts. Because of the recent adoption ofthe MELD score, which replaced the previous UNOSstatus classification based on Child-Turcotte-Pugh crite-ria,14 we sought to develop a model that does not rely onUNOS status as a covariate. In addition, because PNF asan indication for re-OLT historically has been viewed asethically obligated, we sought to construct a model basedon patients who underwent re-OLT at least 2 weeks aftertheir primary transplant. We also wanted to improve thegeneralizability of the model by combining data fromU.S. and international cohorts. Therefore, data from 773UNOS patients and 206 international patients who hadundergone re-OLT 15 days or more after their primarytransplantation comprised the combined cohort. Because
Fig. 7. Kaplan-Meier analysis of the combined cohort with survivalstratified according to year of retransplantation: pre-1994 (n � 557)versus post-1994 (n � 422; P � .006, log-rank test).
Fig. 6. (A) Kaplan-Meier analysis(with 95% confidence intervalsshown by dotted lines) of patientsurvival (A) according to MELD cut-offs �18, 19 to 24, or �25 (P �.001, Wilcoxon rank sum) or (B)according to MELD cutoffs �22, 22to 31, and �32 (P � .001, Wil-coxon rank sum).
464 ROSEN ET AL. HEPATOLOGY, August 2003
these procedures were performed over a 12-year span, weanalyzed whether the year of surgery affected survival. Asshown in Fig. 7, the 557 (57%) patients who underwentregrafting prior to 1994 had significantly diminished sur-vival as compared with those patients undergoing retrans-plantation after January 1994: at 90 days and 1 year, 69%and 60% versus 74% and 66%, respectively. Further-more, Cox multivariate hazards modeling confirmed theimportance of year of re-OLT as an independent predic-tor of survival (risk ratio 0.73 for re-OLT after 1994 vs.before 1994, P � .0005). However, because the ultimategoal was to develop a model to be used prospectively, wedeveloped models that adjusted for the date of re-OLT asa covariate.
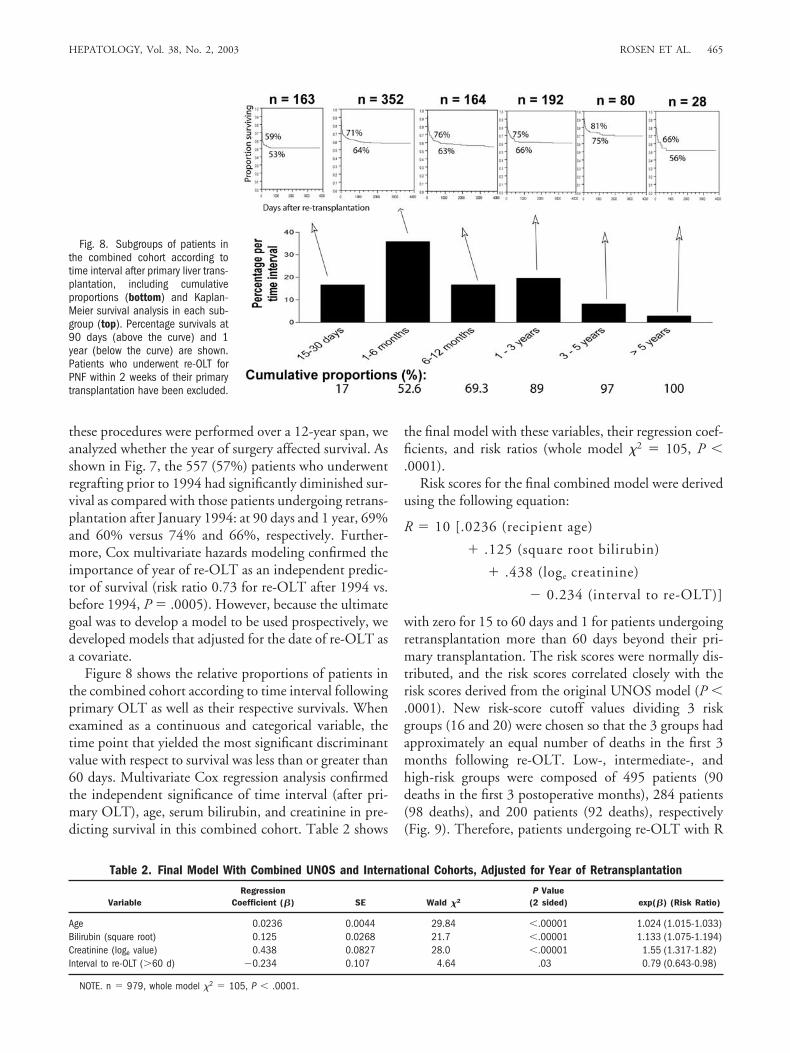
Figure 8 shows the relative proportions of patients inthe combined cohort according to time interval followingprimary OLT as well as their respective survivals. Whenexamined as a continuous and categorical variable, thetime point that yielded the most significant discriminantvalue with respect to survival was less than or greater than60 days. Multivariate Cox regression analysis confirmedthe independent significance of time interval (after pri-mary OLT), age, serum bilirubin, and creatinine in pre-dicting survival in this combined cohort. Table 2 shows
the final model with these variables, their regression coef-ficients, and risk ratios (whole model �2 � 105, P �.0001).
Risk scores for the final combined model were derivedusing the following equation:
R � 10 [.0236 (recipient age)
� .125 (square root bilirubin)
� .438 (loge creatinine)
� 0.234 (interval to re-OLT)]
with zero for 15 to 60 days and 1 for patients undergoingretransplantation more than 60 days beyond their pri-mary transplantation. The risk scores were normally dis-tributed, and the risk scores correlated closely with therisk scores derived from the original UNOS model (P �.0001). New risk-score cutoff values dividing 3 riskgroups (16 and 20) were chosen so that the 3 groups hadapproximately an equal number of deaths in the first 3months following re-OLT. Low-, intermediate-, andhigh-risk groups were composed of 495 patients (90deaths in the first 3 postoperative months), 284 patients(98 deaths), and 200 patients (92 deaths), respectively(Fig. 9). Therefore, patients undergoing re-OLT with R
Fig. 8. Subgroups of patients inthe combined cohort according totime interval after primary liver trans-plantation, including cumulativeproportions (bottom) and Kaplan-Meier survival analysis in each sub-group (top). Percentage survivals at90 days (above the curve) and 1year (below the curve) are shown.Patients who underwent re-OLT forPNF within 2 weeks of their primarytransplantation have been excluded.
Table 2. Final Model With Combined UNOS and International Cohorts, Adjusted for Year of Retransplantation
VariableRegression
Coefficient (�) SE Wald �2
P Value(2 sided) exp(�) (Risk Ratio)
Age 0.0236 0.0044 29.84 �.00001 1.024 (1.015-1.033)Bilirubin (square root) 0.125 0.0268 21.7 �.00001 1.133 (1.075-1.194)Creatinine (loge value) 0.438 0.0827 28.0 �.00001 1.55 (1.317-1.82)Interval to re-OLT (�60 d) �0.234 0.107 4.64 .03 0.79 (0.643-0.98)
NOTE. n � 979, whole model �2 � 105, P � .0001.
HEPATOLOGY, Vol. 38, No. 2, 2003 ROSEN ET AL. 465
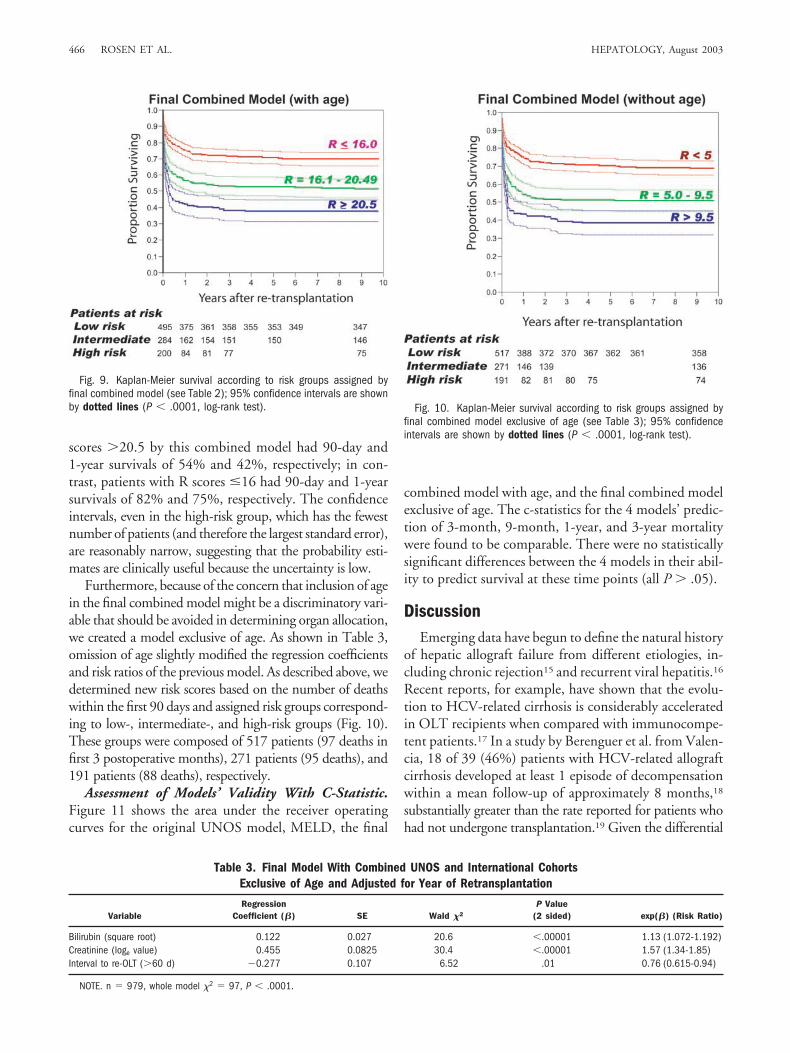
scores �20.5 by this combined model had 90-day and1-year survivals of 54% and 42%, respectively; in con-trast, patients with R scores �16 had 90-day and 1-yearsurvivals of 82% and 75%, respectively. The confidenceintervals, even in the high-risk group, which has the fewestnumber of patients (and therefore the largest standard error),are reasonably narrow, suggesting that the probability esti-mates are clinically useful because the uncertainty is low.
Furthermore, because of the concern that inclusion of agein the final combined model might be a discriminatory vari-able that should be avoided in determining organ allocation,we created a model exclusive of age. As shown in Table 3,omission of age slightly modified the regression coefficientsand risk ratios of the previous model. As described above, wedetermined new risk scores based on the number of deathswithin the first 90 days and assigned risk groups correspond-ing to low-, intermediate-, and high-risk groups (Fig. 10).These groups were composed of 517 patients (97 deaths infirst 3 postoperative months), 271 patients (95 deaths), and191 patients (88 deaths), respectively.
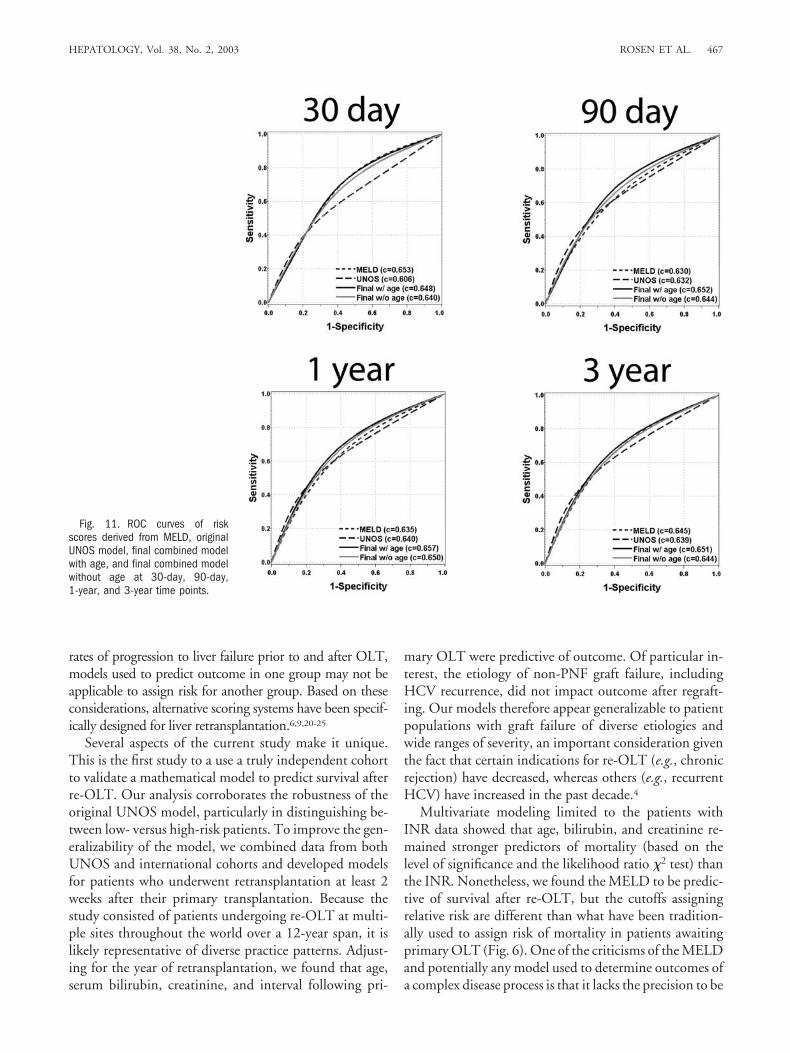
Assessment of Models’ Validity With C-Statistic.Figure 11 shows the area under the receiver operatingcurves for the original UNOS model, MELD, the final
combined model with age, and the final combined modelexclusive of age. The c-statistics for the 4 models’ predic-tion of 3-month, 9-month, 1-year, and 3-year mortalitywere found to be comparable. There were no statisticallysignificant differences between the 4 models in their abil-ity to predict survival at these time points (all P � .05).
DiscussionEmerging data have begun to define the natural history
of hepatic allograft failure from different etiologies, in-cluding chronic rejection15 and recurrent viral hepatitis.16
Recent reports, for example, have shown that the evolu-tion to HCV-related cirrhosis is considerably acceleratedin OLT recipients when compared with immunocompe-tent patients.17 In a study by Berenguer et al. from Valen-cia, 18 of 39 (46%) patients with HCV-related allograftcirrhosis developed at least 1 episode of decompensationwithin a mean follow-up of approximately 8 months,18
substantially greater than the rate reported for patients whohad not undergone transplantation.19 Given the differential
Fig. 9. Kaplan-Meier survival according to risk groups assigned byfinal combined model (see Table 2); 95% confidence intervals are shownby dotted lines (P � .0001, log-rank test).
Table 3. Final Model With Combined UNOS and International CohortsExclusive of Age and Adjusted for Year of Retransplantation
VariableRegression
Coefficient (�) SE Wald �2
P Value(2 sided) exp(�) (Risk Ratio)
Bilirubin (square root) 0.122 0.027 20.6 �.00001 1.13 (1.072-1.192)Creatinine (loge value) 0.455 0.0825 30.4 �.00001 1.57 (1.34-1.85)Interval to re-OLT (�60 d) �0.277 0.107 6.52 .01 0.76 (0.615-0.94)
NOTE. n � 979, whole model �2 � 97, P � .0001.
Fig. 10. Kaplan-Meier survival according to risk groups assigned byfinal combined model exclusive of age (see Table 3); 95% confidenceintervals are shown by dotted lines (P � .0001, log-rank test).
466 ROSEN ET AL. HEPATOLOGY, August 2003
rates of progression to liver failure prior to and after OLT,models used to predict outcome in one group may not beapplicable to assign risk for another group. Based on theseconsiderations, alternative scoring systems have been specif-ically designed for liver retransplantation.6,9,20-25
Several aspects of the current study make it unique.This is the first study to a use a truly independent cohortto validate a mathematical model to predict survival afterre-OLT. Our analysis corroborates the robustness of theoriginal UNOS model, particularly in distinguishing be-tween low- versus high-risk patients. To improve the gen-eralizability of the model, we combined data from bothUNOS and international cohorts and developed modelsfor patients who underwent retransplantation at least 2weeks after their primary transplantation. Because thestudy consisted of patients undergoing re-OLT at multi-ple sites throughout the world over a 12-year span, it islikely representative of diverse practice patterns. Adjust-ing for the year of retransplantation, we found that age,serum bilirubin, creatinine, and interval following pri-
mary OLT were predictive of outcome. Of particular in-terest, the etiology of non-PNF graft failure, includingHCV recurrence, did not impact outcome after regraft-ing. Our models therefore appear generalizable to patientpopulations with graft failure of diverse etiologies andwide ranges of severity, an important consideration giventhe fact that certain indications for re-OLT (e.g., chronicrejection) have decreased, whereas others (e.g., recurrentHCV) have increased in the past decade.4
Multivariate modeling limited to the patients withINR data showed that age, bilirubin, and creatinine re-mained stronger predictors of mortality (based on thelevel of significance and the likelihood ratio �2 test) thanthe INR. Nonetheless, we found the MELD to be predic-tive of survival after re-OLT, but the cutoffs assigningrelative risk are different than what have been tradition-ally used to assign risk of mortality in patients awaitingprimary OLT (Fig. 6). One of the criticisms of the MELDand potentially any model used to determine outcomes ofa complex disease process is that it lacks the precision to be
Fig. 11. ROC curves of riskscores derived from MELD, originalUNOS model, final combined modelwith age, and final combined modelwithout age at 30-day, 90-day,1-year, and 3-year time points.
HEPATOLOGY, Vol. 38, No. 2, 2003 ROSEN ET AL. 467
a valid predictor of an individual patient’s true risk ofdeath.26 In this regard, we found wide variations in con-fidence limits for the projected survival with a given rangeof MELD scores (Fig. 6A and 6B). Whether this largestandard error is a reflection of the relatively small numberof patients for whom INR was available (n � 135) orwhether the MELD needs further refinement for patientsundergoing re-OLT requires investigation. By analyzingdata from almost 1,000 patients undergoing re-OLT, wederived new models (exclusive of INR) and defined rela-tively tight confidence limits (Figs. 9 and 10).
Survival following primary or secondary transplantationhas been shown to diminish as level of urgency increases.4,23
Numerous authors have argued that, in the face of pooroutcome and limited resources, the duty to manage the mosturgently ill patients should be balanced against the duty toallocate scarce resources to those who are most likely to ben-efit from them.27 Thus, an allocation system attuned to effi-cacy concerns might give priority to a transplantationcandidate who has a high posttransplantation survival rate(less urgency) as opposed to a higher pretransplantation mor-tality.4 Citing these efficacy concerns, the curtailment of re-OLT has been recommended. Specifically, it has beenproposed that an expected 1-year survival rate of less than40% in a re-OLT patient would be an unreasonable use of adonor organ when a primary OLT recipient would be antic-ipated to have at least double the survival rate.4 These argu-ments are further supported by cost-effectiveness data thatindicate re-OLT recipients incur significantly higher costsand have longer hospital stays when compared with primarygraft recipients.24,28 We recognize that limiting re-OLT tothe subset of patients expected to have survival outcomesmore comparable with primary OLT and precluding re-OLT for patients with high-risk scores (and higher predictedmortality) would represent shifting to an outcomes-basedallocation scheme. Because the pace of liver decompensationand risk of death are considerably greater in patients whohave received transplants as compared with patients awaitingprimary transplantation, it may be necessary to modify thecurrent system so that patients with allograft failure wouldreceive additional priority points within the current MELDschema, akin to patients with hepatocellular carcinoma.29
In summary, we have validated and refined models topredict survival following re-OLT. The usefulness of theoriginal UNOS model was confirmed with an interna-tional cohort that, in terms of demographic and clinicalfeatures, differed significantly from the original cohort.Combined data sets were used to generate new models fornon-PNF graft failure that do not rely on UNOS status.Although the ethical and practical implications of differ-ent liver allocation schemes are complex and rapidlyevolving, we feel that these models can be used as objec-
tive adjuncts to clinical judgment. Prospective applicationof these models seems warranted.
References1. www.Unos.org. Accessed: June 1, 2001.2. Keeffe EB. Liver transplantation: current status and novel approaches to
liver replacement. Gastroenterology 2001;120:749-762.3. Rosen HR. Disease recurrence following liver transplantation. Clin Liver
Dis 2000;4:675-689.4. Biggins SW, Beldecos A, Rabkin JM, Rosen HR. Retransplantation for
hepatic allograft failure: prognostic modeling and ethical considerations.Liver Transpl 2002;8:313-322.
5. Wall WJ. Recurrent disease after liver transplantation, implications for thefuture. Liver Transplant Surg 1997;6:362-367.
6. Rosen HR, Madden JP, Martin P. A model to predict survival followinghepatic retransplantation. HEPATOLOGY 1999;29:365-370.
7. Kamath PS, Wiesner RH, Malinchoc M, Kremers W, Therneau TM,Kosberg CL, D’Amico G, et al. A model to predict survival in patients withend-stage liver disease. HEPATOLOGY 2001;33:464-470.
8. Cox DR. Regression models and life-tables. J R Stat [B] 1972;34:187-202.9. Dickson ER, Murtaugh PA, Wiesner RH, Grambsch PM, Fleming TR,
Ludwig J, La Russo NF, et al. Primary sclerosing cholangitis: refinementand validation of survival models. Gastroenterology 1992;103:1893-1901.
10. Hanley JA, McNeil BJ. The meaning and use of the area under a receiveroperating characteristic (ROC) curve. Radiology 1982;143:29-36.
11. Berenguer M, Prieto M, Palau A, Rayon JM, Carraasco D, Juan SJ, Lopez-Labrado FX, et al. Severe recurrent hepatitis C after liver retransplantationfor hepatitis C virus-related graft cirrhosis. Liver Transpl 2003;9:228-235.
12. Brown RS Jr, Kumar KS, Russo MW, Kinkhabwala M, Rudow DL, Har-ren P, Lobritto S, et al. Model for end-stage liver disease and Child-Turcotte-Pugh score as predictors of pretransplantation disease severity,posttransplantation outcome, and resource utilization in United Networkfor Organ Sharing status 2A patients. Liver Transpl 2002;8:278-284.
13. Onaca NN, Levy MF, Sanchez EQ, Chinnakotla S, Fasola CG, ThomasMJ, Weinstein JS, et al. A correlation between pretransplantation MELDscore and mortality in the first two years after liver transplantation [Com-ments]. Liver Transpl 2003;9:117-123.
14. Forman LM, Lucey MR. Predicting the prognosis of chronic liver disease:an evolution from child to MELD. HEPATOLOGY 2001;33:473-475.
15. Neil DAH, Hubscher SG. Histologic and biochemical changes during the evolu-tion of chronic rejection of liver allografts. HEPATOLOGY 2002;35:639-651.
16. Reuss ML, Paneth N, Pinto-Martin JA, Lorenz JM, Susser M. The relationof transient hypothyroxinemia in preterm infants to neurologic develop-ment at two years of age. N Engl J Med 1996;334:821-827.
17. Berenguer M, Ferrell L, Watson J, Prieto M, Kim M, Rayon M, CordobaJ, et al. HCV-related fibrosis progression following liver transplantation:increase in recent years. J Hepatol 2000;32:673-684.
18. Berenguer M, Prieto M, Rayon JM, Mora J, Pastor M, Ortiz V, CarrascoD, et al. Natural history of clinically compensated hepatitis C virus-relatedgraft cirhosis after liver transplantation. HEPATOLOGY 2000;32:852-858.
19. Fattovich G, Giustina G, Degos F, Tremolada F, Diodati G, Almasio P,Nevens F, et al. Morrbidity and mortality in compensated cirrhosis type C:a retrospective follow-up study of 384 patients. Gastroenterology 1997;112:463-472.
20. Kim WR, Wiesner RH, Poterrucha JJ, Therneau TM, Malinchoc M,Benson JT, Crippin JS, et al. Hepatic retransplantation in cholestatic liverdisease: impact of the interval to retransplantation on survival and resourceutilization. HEPATOLOGY 1999;30:395-400.
21. Wong T, Devlin J, Rolando N, Heaton N, Williams R. Clinical charac-teristics affecting the outcomes of liver retransplantation. Transplantation1997;4:878-882.
22. Doyle HR, Morelli F, McMichael J, Doria C, Aldrighetti L, Starzl TE,Marino IR. Hepatic retransplantation: an analysis of risk factors associatedwith outcome. Transplantation 1996;61:1499-1505.
23. Markman JF, Gornbein J, Morkowitz JS, Levy MF, Klintmalm GB, Yersiz H,
468 ROSEN ET AL. HEPATOLOGY, August 2003
Morrisey M, et al. A simple model to estimate survival after retransplantationof liver. Transplantation 1999;647:422-430.
24. Azoulay D, Linhares MM, Huguet E, Delvart V, Castain D, Adam R, IchaiP, et al. Decision for retransplantation of the liver: an experience- andcost-based analysis. Ann Surg 2002;236:713-721.
25. Adam R, Cailliez V, Manjo P, Karam V, McMaster P, Calne RY, O’GradyJ, et al. Normalized intrinsic mortality risk in liver transplantation: Euro-pean Liver Transplant Registry study. Lancet 2000;356:621-627.
26. Everson G. MELD: the answer or just more questions? Gastroenterology2003;124:251-254.
27. Ubel PA, Arnold RM, Caplan AL. Rationing failure: the ethical lessons ofthe retransplantation of scarce vital organs. JAMA 1993;270:2469-2474.
28. Evans RW, Manninen DL, Dong FB, McLynne DA. Is retransplantationcost effective? Transplant Proc 1993;25:1694-1697.
29. Roberts JP. Prioritization of patients with liver cancer within the MELDsystem. Liver Transpl 2002;9:329-330.
HEPATOLOGY, Vol. 38, No. 2, 2003 ROSEN ET AL. 469
Related Documents