VALIDATION AND DETERMINATION OF CLARITHROMYCIN AND METRONIDAZOLE IN RAT PLASMA BY USING HIGH PERFORMANCE LIQUID CHROMATOGRAPHY/MASS SPECTROMETRY (HPLC/MS) IN PRESENCE OF POMEGRANATE JUICE By Haifa Tawfeeq Abu Tbeekh Supervisor Dr. Eyad Mallah Co-Supervisor Dr. Wael Abu Dayyih A Thesis Submitted in Partial Fulfillment of the Requirements for the Degree of Master of Science in Pharmaceutical Sciences at University of Petra Faculty of Pharmacy and Medical Sciences Amman-Jordan October 2013

Welcome message from author
This document is posted to help you gain knowledge. Please leave a comment to let me know what you think about it! Share it to your friends and learn new things together.
Transcript

VALIDATION AND DETERMINATION OF
CLARITHROMYCIN AND METRONIDAZOLE IN RAT
PLASMA BY USING HIGH PERFORMANCE LIQUID
CHROMATOGRAPHY/MASS SPECTROMETRY (HPLC/MS)
IN PRESENCE OF POMEGRANATE JUICE
By
Haifa Tawfeeq Abu Tbeekh
Supervisor
Dr. Eyad Mallah
Co-Supervisor
Dr. Wael Abu Dayyih
A Thesis Submitted in Partial Fulfillment of the Requirements for the
Degree of Master of Science in Pharmaceutical Sciences at
University of Petra
Faculty of Pharmacy and Medical Sciences
Amman-Jordan
October 2013


i
ii
VALIDATION AND DETERMINATION OF
CLARITHROMYCIN AND METRONIDAZOLE IN RAT
PLASMA BY USING HIGH PERFORMANCE LIQUID
CHROMATOGRAPHY/MASS SPECTROMETRY
(HPLC/MS) IN PRESENCE OF POMEGRANATE JUICE
By
Haifa Tawfeeq Abu Tbeekh
A Thesis Submitted in Partial Fulfillment of the Requirements for the
Degree of Master of Science in Pharmaceutical Sciences at
University of Petra
Faculty of Pharmacy and Medical Sciences
Amman-Jordan
October 2013
Supervisor Signature
Dr. Eyad Mallah
Co-Supervisor Signature
Dr. Wael Abu Dayyih
Examination Committee Signature
1. Prof. Tawfiq Arafat
2. Dr. Nidal Qinna
3. Dr. Kamal Sweidan

iii
Abstract
VALIDATION AND DETERMINATION OF
CLARITHROMYCIN AND METRONIDAZOLE IN RAT
PLASMA BY USING HIGH PERFORMANCE LIQUID
CHROMATOGRAPHY/MASS SPECTROMETRY
(HPLC/MS) IN PRESENCE OF POMEGRANATE JUICE
By
Haifa Tawfeeq Abu Tbeekh
University of Petra, 2013
Supervisor Co-Supervisor
Dr. Eyad Mallah Dr. Wael Abu Dayyih
Pomegranate juice has been widely consumed around the world especially in the
Middle Eastern countries from the standpoint of its prevention and treatment of common
diseases. Clarithromycin and Metronidazole are widely and concomitantly used drugs. In
addition, both of them are considered as CYP3A4 metabolic enzyme substrates and
inhibitors.
A simple, reproducible and rapid analytical method by using high performance
liquid chromatography-mass spectrometry (HPLC/MS) with high resolution and
sensitivity for simultaneous quantification of Clarithromycin and Metronidazole in
presence of pomegranate juice was validated. A gradient mobile phase system consisting
of methanol and 0.1% of formic acid and ACE 5 C18 column (50 X 2.1 mm, 5µ) were used
with a flow rate of 1.0 ml/ min.

iv
An acceptable recovery was achieved (97.75%) and (96.0%) for Clarithromycin
and Metronidazole, respectively, with good accuracy and precision. Coefficient of
determination (R²) of the standard curves for both drugs ranged between 0.9986 and
0.9998.
According to results obtained, there was no significant effect on pharmacokinetic
parameters of Clarithromycin after pretreatment with single and multiple doses of
pomegranate fresh juice. However, there was two hours-long delay on Tmax after the
single dose of juice which is possibly with no clinically significant. Furthermore, the
changing in t½ and the elimination rate constant of Clarithromycin after single and
multiple pomegranate juice administration give an expectation that pomegranate juice
could affect the hepatic-mediated metabolism of Clarithromycin but with insignificant
manner.
Pharmacokinetic parameters of Metronidazole was not affected by single dose
administration of juice, on the other hand, multiple dose pretreatment with juice
significantly elevating the maximum plasma concentration (Cmax) (P˂0.05) and the area
under the curve (AUC) of Metronidazole (P=0.001). Since there was a very slight
changing on the t½ and the elimination rate constant, the hepatic enzymes could not be
affected. In contrast, concomitant administration of Metronidazole and Clarithromycin
showed no significant interaction.
Since there are different enteric metabolic enzymes involved in the orally
administered drug metabolism, further in vitro and in vivo investigations to study the
mechanism of the pomegranate juice effect on the pharmacokinetic parameters of these
drugs should be established.

v
DEDICATIONS
To my parents, my husband, and my wonderful children.
You are my family which I always proud of. I hope you are proud of me as
well by this work.

vi
ACKNOWLEDGMENTS
First, a great thankful to Allah for helping me without waiting for giving back and all of
people assistances are the grace of him.
I would like to acknowledge my supervisor Dr. Eyad Mallah and co-supervisor Dr. wael
Abu Dayyih for helping me to overcome a lot of difficulties that I faced and urging me to
complete this work.
Special thanks to Prof. Tawfiq Arafat for his keen interest to help all students, without
exception.
Special thanks to Dr. Nidal Qinna for all of his help.
Special thanks to Prof. Khalid Matalka for all of his help.
This acknowledgment will be not complete if I don’t give thanks with respect to Prof.
Tawfiq Al hussainy for his wisdom and for giving me hope and confidence.
I am indebted to Jordan Center for Pharmaceutical Research, special thanks to Ahmad
Abu Awad and Hamza Al Horoub for their assistance.
I would like to thank all members of committee for their time to evaluate this work.
Finally, special thanks to my wonderful husband Dr. Eng Qahtan Abu Tbeekh for his
encouragement and trusting in my successes.

vii
Table of Contents
No. Subject Page
No.
Committee Decision ii
Abstract iii
Dedications v
Acknowledgments vi
Table of Contents vii
List of Tables xi
List of Figures xvii
List of Abbreviations xix
Chapter 1: Introduction 1
1 Introduction 2
1.1 Clarithromycin (CAM) 2
1.1.1 Chemical structure of Clarithromycin 2
1.1.2 Mechanism of action of Clarithromycin 3
1.1.3 Side effects of Clarithromycin 3
1.1.4 Pharmacokinetics of Clarithromycin 3
1.1.5 Metabolism of Clarithromycin 4
1.1.6 Drug interactions of Clarithromycin 4
1.2 Metronidazole (MTZ) 6
1.2.1 Mechanism of action of Metronidazole 6
1.2.2 Side effects of Metronidazole 6
1.2.3 Pharmacokinetics of Metronidazole 7
1.2.4 Metabolism of Metronidazole 7
1.2.5 Drug interactions of Metronidazole 7
1.3 Drug interactions 9
1.3.1 Factors affecting drug interactions 9
1.3.2 Mechanisms involved in pharmacokinetic drug interactions 9
1.3.2.1 Alterations in absorption 9
1.3.2.2 Alteration of distribution 11
1.3.2.3 Affecting of drug metabolism 11
1.4 Drug-food interactions 13

viii
1.4.1 Mechanisms of drug-food interactions 13
1.4.1.1 Physiologic and physicochemical mechanisms 13
1.4.1.2 Biochemical mechanisms 14
1.5 Inhibition of intestinal biochemical processes 14
1.5.1 Intestinal enzymes and transporters involved in drug disposition
that can be affected by certain beverages 15
1.5.1.1 Enzymes 15
1.5.1.2 Transporter-mediated efflux and uptake 15
1.6 Pomegranate juice (PJ) 16
1.7 Grapefruit juice (GFJ) 17
1.8 Seville orange juice 17
1.9 Tea 18
1.10 Chromatography 18
1.10.1 Definition 18
1.10.2 Types of chromatography 18
1.10.3 High performance liquid chromatography (HPLC) advantages 20
1.10.4 High performance liquid chromatography (HPLC) limitations 20
1.10.5 Types of chromatography detectors 21
1.10.6 High performance liquid chromatography/Mass spectrometry 22
1.10.7 Method validation 22
1.10.7.1 Standard calibration curve 22
1.10.7.2 Linearity and range 23
1.10.7.3 Precision 23
1.10.7.4 Accuracy 24
1.10.7.5 Lower limit of detection 24
1.10.7.6 Lower limit of quantification 25
1.10.7.7 Selectivity 25
1.10.7.8 Specificity 25
1.10.7.9 Recovery 25
1.11 Previous analytical studies for quantification of Clarithromycin in
plasma 26

ix
1.12 Previous analytical studies for quantification of Metronidazole in
plasma 29
1.13 Preclinical studies 30
1.14 Objectives of the current study 32
Chapter 2: Materials and Methods 33
2 Materials and Methods 34
2.1 Reagents 34
2.2 Instrumentation 34
2.3 Animals 35
2.4 Preparation of Clarithromycin solution to be injected orally to rats 35
2.5 Preparation of Metronidazole solution to be injected orally to rats 35
2.6 Preparation of pomegranate juice to be injected orally to rats 35
2.7 Preparation of stock solutions for the method validation 35
2.7.1 Preparation of stock solution for Clindamycin as an internal standard
(IS) 35
2.7.2 Preparation of 2 µg/ml Clindamycin IS in methanol (Precipitating
agent) 35
2.7.3 Preparation of stock solutions of Clarithromycin and Metronidazole 36
2.7.4 Preparation of working solution for Clarithromycin and
Metronidazole 36
2.7.5 Preparation of the mobile phase 36
2.7.6 Preparation of Clarithromycin and Metronidazole SCC serial
dilution and spiked serum 36
2.7.7 Preparation of Clarithromycin and Metronidazole QC serial dilution
and spiked serum 36
2.7.8 Method of extraction 38
2.8 Analytical method validation 40
2.8.1 Standard calibration curve and linearity 40
2.8.2 Intra-day accuracy and precision 40
2.8.3 Inter-day accuracy and precision 40

x
2.8.4 Sensitivity 41
2.8.5 Recovery 41
2.9 Preclinical study design 41
Chapter 3: Results and Discussion 43
3 Results and Discussion 44
3.1 HPLC/MS analytical method 44
3.2 Validation 45
3.2.1 Validation of day one, two, and three on linearity, accuracy, and
precision data for Clarithromycin quantification 45
3.2.2 Recovery data for Clarithromycin quantification 63
3.2.3 Validation of day one, two, and three, linearity, accuracy, and
precision data for Metronidazole quantification 65
3.2.4 Recovery data for Metronidazole quantification 82
3.3 The modifying effect of pomegranate fresh juice on Clarithromycin
and Metronidazole pharmacokinetic profile 84
3.3.1 Effect of a single and multiple dose of pomegranate juice on
Clarithromycin 87
3.3.2 Effect of a single and multiple dose of pomegranate juice on
Metronidazole 93
3.4 The modifying effect of concomitantly administered Clarithromycin
and Metronidazole on their pharmacokinetic profiles 99
3.4.1 Effect of combination on Clarithromycin 100
3.4.2 Effect of combination on Metronidazole 103
4 Conclusion 107
5 References 109
6 Appendix (A): HPLC Chromatograms 124
7 Appendix (B): Preclinical Data 135
8 Abstract (In Arabic) 140

xi
List of Tables
Table No.
Caption Page No.
Table 1 Physical and chemical properties of Clarithromycin (CAM) 5
Table 2 Physical and chemical properties of Metronidazole(MTZ) 8
Table 3 Preparation of Clarithromycin & Metronidazole SCC serial
dilution and spiked serum 37
Table 4 Preparation of Clarithromycin & Metronidazole QC serial
dilution and spiked serum 38
Table 5 chromatographic and mass spectrometric conditions 39
Table 6 Standard calibration curve of the first day of validation, intraday
accuracy data for Clarithromycin 46
Table 7 Data of the standard curve with regards to correlation, slope, R²,
and intercept on the first day for Clarithromycin 46
Table 8 Standard calibration curve of the second day of validation,
intraday accuracy data for Clarithromycin 48
Table 9 Data of the standard curve with regards to correlation, slope, R²,
and intercept on the second day for Clarithromycin 48
Table 10 Standard calibration curve of the third day of validation, intraday
accuracy data for Clarithromycin 50
Table 11 Data of the standard curve with regards to correlation, slope, R²,
and intercept on the third day for Clarithromycin 50
Table 12 Linearity and linear working range of three standard curves of
Clarithromycin data based on the calculated area ratio 52
Table 13 Linearity and linear working range of three standard curves of
Clarithromycin data based on the measured concentrations 52
Table 14 Data of three standard curves with regards to correlation, slope,
R², and intercept for Clarithromycin 52
Table 15 Intra-day precision and accuracy data for QC low samples of
Clarithromycin based on the standard calibration curve of the 54
xii
first day of validation
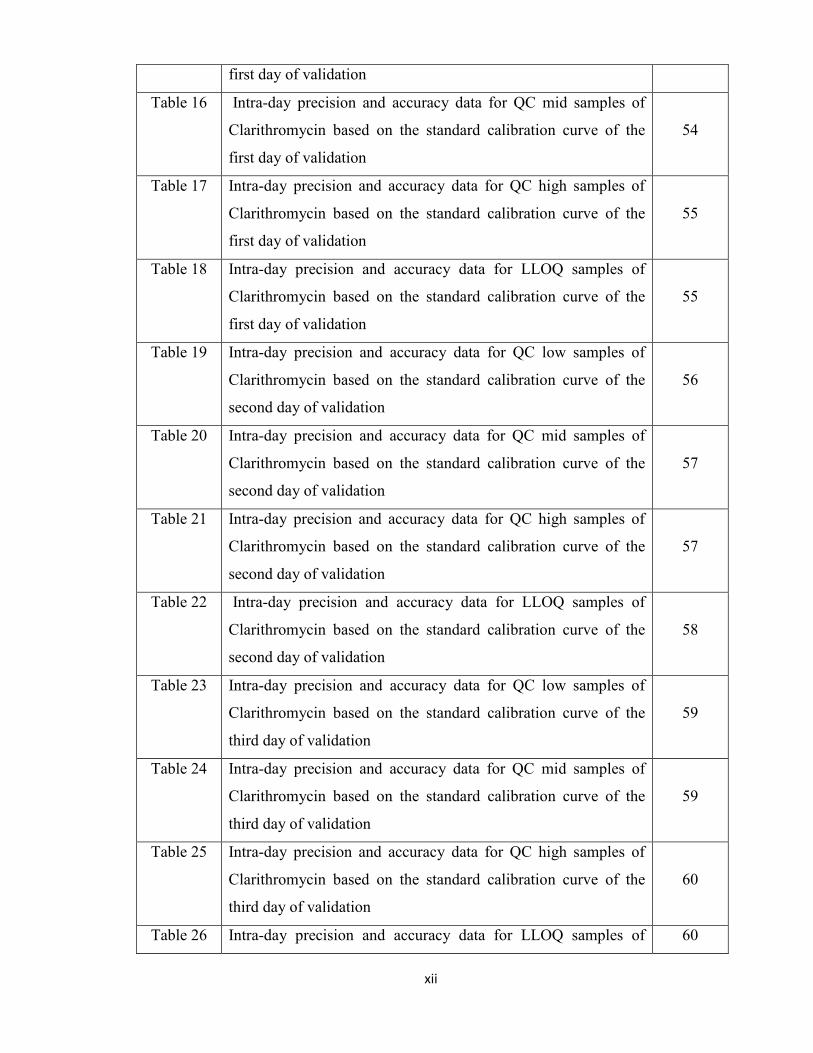
Table 16 Intra-day precision and accuracy data for QC mid samples of
Clarithromycin based on the standard calibration curve of the
first day of validation
54
Table 17 Intra-day precision and accuracy data for QC high samples of
Clarithromycin based on the standard calibration curve of the
first day of validation
55
Table 18 Intra-day precision and accuracy data for LLOQ samples of
Clarithromycin based on the standard calibration curve of the
first day of validation
55
Table 19 Intra-day precision and accuracy data for QC low samples of
Clarithromycin based on the standard calibration curve of the
second day of validation
56
Table 20 Intra-day precision and accuracy data for QC mid samples of
Clarithromycin based on the standard calibration curve of the
second day of validation
57
Table 21 Intra-day precision and accuracy data for QC high samples of
Clarithromycin based on the standard calibration curve of the
second day of validation
57
Table 22 Intra-day precision and accuracy data for LLOQ samples of
Clarithromycin based on the standard calibration curve of the
second day of validation
58
Table 23 Intra-day precision and accuracy data for QC low samples of
Clarithromycin based on the standard calibration curve of the
third day of validation
59
Table 24 Intra-day precision and accuracy data for QC mid samples of
Clarithromycin based on the standard calibration curve of the
third day of validation
59
Table 25 Intra-day precision and accuracy data for QC high samples of
Clarithromycin based on the standard calibration curve of the
third day of validation
60
Table 26 Intra-day precision and accuracy data for LLOQ samples of 60

xiii
Clarithromycin based on the standard calibration curve of the
third day of validation
Table 27 Inter-day accuracy and precision for the quality control samples
of Clarithromycin in the three days of validation 62
Table 28 Data of Clarithromycin and IS in the mobile phase for the
quality control samples 63
Table 29 Data of Clarithromycin and IS in serum for the quality control
samples 64
Table 30 Recovery % for Clarithromycin 64
Table 31 Recovery % for Clindamycin (IS) 64
Table 32 Standard calibration curve of the first day of validation, intraday
accuracy data for Metronidazole 65
Table 33 Data of the standard curve with regards to correlation, slope, R²,
and intercept on the first day for Metronidazole 66
Table 34 Standard calibration curve of the second day of validation,
intraday accuracy data for Metronidazole 67
Table 35 Data of the standard curve with regards to correlation, slope, R²,
and intercept on the second day for Metronidazole 67
Table 36 Standard calibration curve of the third day of validation, intraday
accuracy data for Metronidazole 69
Table 37 Data of the standard curve with regards to correlation, slope, R²,
and intercept on the third day for Metronidazole 69
Table 38 Linearity and linear working range of three standard curves of
Metronidazole data based on the calculated area ratio 71
Table 39 linearity and linear working range of three standard curves of
Metronidazole data based on the measured concentrations 71
Table 40 Data of three standard curves with regards to correlation, slope,
R², and intercept for Metronidazole 71
Table 41 Intra-day precision and accuracy data for QC low samples of
Metronidazole based on the standard calibration curve of the
first day of validation
73
Table 42 Intra-day precision and accuracy data for QC mid samples of 73

xiv
Metronidazole based on the standard calibration curve of the
first day of validation
Table 43 Intra-day precision and accuracy data for QC high samples of
Metronidazole based on the standard calibration curve of the
first day of validation
74
Table 44 Intra-day precision and accuracy data for LLOQ samples of
Metronidazole based on the standard calibration curve of the
first day of validation
74
Table 45 Intra-day precision and accuracy data for QC low samples of
Metronidazole based on the standard calibration curve of the
second day of validation
75
Table 46 Intra-day precision and accuracy data for QC mid samples of
Metronidazole based on the standard calibration curve of the
second day of validation
76
Table 47 Intra-day precision and accuracy data for QC high samples of
Metronidazole based on the standard calibration curve of the
second day of validation
76
Table 48 Intra-day precision and accuracy data for LLOQ samples of
Metronidazole based on the standard calibration curve of the
second day of validation
77
Table 49 Intra-day precision and accuracy data for QC low samples of
Metronidazole based on the standard calibration curve of the
third day of validation
78
Table 50 Intra-day precision and accuracy data for QC mid samples of
Metronidazole based on the standard calibration curve of the
third day of validation
78
Table 51 Intra-day precision and accuracy data for QC high samples of
Metronidazole based on the standard calibration curve of the
third day of validation
79
Table 52 Intra-day precision and accuracy data for LLOQ samples of
Metronidazole based on the standard calibration curve of the
third day of validation
79

xv
Table 53 Inter-day accuracy and precision for the quality control samples
of Metronidazole in the three days of validation 81
Table 54 Data of Metronidazole in the mobile phase for the quality
control samples 82
Table 55 Data of Metronidazole in the serum for the quality control
samples 83
Table 56 Recovery % for Metronidazole 83
Table 57 Recovery % for Clindamycin (IS) 83
Table 58 Results of Clarithromycin with DW (n=4) 89
Table 59 Results of Clarithromycin with a single dose of pomegranate
juice with a comparison to a Clarithromycin with DW
administration (n=6)
89
Table 60 Comparing Cmax, Tmax, AUC, T½, and the elimination rate
constant between: Clarithromycin + DW and (Clarithromycin +
single dose of juice)
90
Table 61 Results of Clarithromycin with a multiple dose of pomegranate
juice with a comparison to a Clarithromycin with DW
administration (n=6)
90
Table 62 Comparing Cmax, Tmax, AUC, T½, and the elimination rate
constant between Clarithromycin with DW and (Clarithromycin
+ multiple dose of juice)
91
Table 63 Comparison between single and multiple dose effect of PJ on
Clarithromycin 91
Table 64 Results of Metronidazole with DW (n=2) 94
Table 65 Results of Metronidazole with a single dose of pomegranate
juice with a comparison to a Metronidazole with DW
administration (n=4)
95
Table 66 Comparing Cmax, Tmax, AUC, T½, and the elimination rate
constant between: Metronidazole with DW and (Metronidazole
+ single dose of juice)
95
Table 67 Results of Metronidazole with a multiple dose of pomegranate
juice with a comparison to a Metronidazole with DW 96

xvi
administration (n=4)
Table 68 Comparing Cmax, Tmax, AUC, T½, and the elimination rate
constant between: Metronidazole with DW and (Metronidazole
+ multiple dose of juice)
97
Table 69 Comparison between single and multiple dose effect of PJ on
Metronidazole 97
Table 70 Results of Clarithromycin alone (n=7) 101
Table 71 Results of Clarithromycin after combination with Metronidazole
with a comparison to a lone Clarithromycin administration (n=5) 101
Table 72 Comparing Cmax, Tmax, AUC, T½, and the elimination rate
constant between: Clarithromycin alone and Clarithromycin
after combination with Metronidazole
102
Table 73 Results of Metronidazole alone (n=6) 114
Table 74 Results of Metronidazole after combination with Clarithromycin
with a comparison to a lone Metronidazole administration (n=5) 114
Table 75 Comparing Cmax, Tmax, AUC, T½, and the elimination rate
constant between: Metronidazole alone and (Metronidazole
after combination with Clarithromycin)
115
Table 76 Data measured for Clarithromycin experiments after
administration with DW, single dose of PJ, and multiple dose of
PJ
136
Table 77 Data measured for Metronidazole experiments after
administration with DW, single dose of PJ, and multiple dose of
PJ
137
Table 78 Data measured for Clarithromycin experiments alone and after
concomitant administration with Metronidazole 138
Table 79 Data measured for Metronidazole experiments alone and after
concomitant administration with Clarithromycin 139

xvii
List of Figures
Figure No. Caption Page No.
Figure 1 Chemical structure of Clarithromycin 2
Figure 2 Chemical structure of Metronidazole 6
Figure 3 Plot of calibration curve levels against their analytical response
and regression linear equation on the first day of validation for
Clarithromycin
47
Figure 4 Plot of calibration curve levels against their analytical response
and regression linear equation on the second day of validation
for Clarithromycin
49
Figure 5 Plot of calibration curve levels against their analytical response
and regression linear equation on the third day of validation for
Clarithromycin
51
Figure 6 Plot of linearity of calibration curve levels for Clarithromycin
quantification against their analytical response and regression
linear equation
53
Figure 7 Plot of calibration curve levels against their analytical response
and regression linear equation on the first day of validation for
Metronidazole
66
Figure 8 Plot of calibration curve levels against their analytical response
and regression linear equation on the second day of validation
for Metronidazole
68
Figure 9 Plot of calibration curve levels against their analytical response
and regression linear equation on the third day of validation for
Metronidazole
70
Figure 10 Plot of linearity of calibration curve levels for Metronidazole
quantification against their analytical response and regression
linear equation
72
Figure 11 Line chart showing the changes in mean plasma
Clarithromycin concentration with time after drug
administration with DW, with single dose of juice, and with
92

xviii
multiple dose of juice
Figure 12 Line chart showing the changes in mean plasma Metronidazole
concentration with time after drug administration with DW,
with single dose of juice, and with multiple dose of juice
98
Figure 13 Line chart showing the changes in mean plasma
Clarithromycin concentration with time after separately drug
administration and in combination with Metronidazole
102
Figure 14 Line chart showing the changes in mean plasma Metronidazole
concentration with time after separately drug administration
and in combination with Clarithromycin
115
Figure 15 Clarithromycin blank chromatogram 125
Figure 16 Clarithromycin zero chromatogram 126
Figure 17 Clarithromycin LLOQ chromatogram 127
Figure 18 Clarithromycin SCC7 chromatogram 128
Figure 19 Clarithromycin rat unknown sample chromatogram at 4.00 hr
measured as 0.878 µg/ml 129
Figure 21 Metronidazole blank chromatogram 130
Figure 21 Metronidazole zero chromatogram 131
Figure 22 Metronidazole LLOQ chromatogram 132
Figure 23 Metronidazole SCC7 chromatogram 133
Figure 24 Metronidazole rat unknown sample chromatogram at 4.00 hr
measured as 7.83 µg/ml 134

xix
List of Abbreviations
API Atmospheric-pressure ionization
AUC Area Under the Curve
CAD Collision Gas
CAM Clarithromycin
CE Collision Energy
CEP Collision Empotance Potential
Cmax Mean Maximum concentration
Conc. Concentration
CUR Curtain Gas
CV Coefficient of Variation
CXP Collision cell Exiting Potential
CYP Cytochrome P
DW Distilled Water
DP Declustering Potential
EMA European Medicines Agency
EP Entrance Potential
FA Formic Acid
FDA Food and Drug Administration
fg Femtogram (1/1000000 ng)
GC Gas Chromatography
GIT Gastro-Intestinal Tract
GS1 Ion Source Gas 1
GS2 Ion Source Gas 2
HCL Hydrochloric Acid
HPLC High Performance Liquid Chromatography
H.pylori Helicobacter pylori
hr Hour
IS Internal Standard

xx
ISV Ion Spray Voltage
JCPR Jordan Center for Pharmaceutical Research
Ke Rate of Elimination Constant
LLOQ Lower Limit Of Quantification
M.P.C Mean Plasma Concentrations
µg Microgram
µl Microliter
mM Millimole
µmol Micromole
MRM Multiple Reaction Monitoring
MS Mass Spectrometry
MTZ Metronidazole
n Samples number
ng Nanogram
NEB Nebulizer Gas
PD Pharmacodynamic
PJ Pomegranate Juice
PK Pharmacokinetic
PPIs Proton Pump Inhibitors
Q1 Quadrupole mass analyzer 1
Q3 Quadrupole mass analyzer 2
QC Quality Control
QC samples Low, mid, high
R Correlation Coefficient
R² Coefficient of Determination
r.p.m Rotation per minute
SE Standard Error
Sol. Solution
SRM Single Reaction Monitoring
SCC Standard Calibration Curve

xxi
STDV Standard Deviation
T½ Half Time
TEM Temperature
Tmax Median time to Maximum Plasma Concentration
USFDA United states Food and Drug Administration
USP United State Pharmacopeia
UV Ultraviolet
V/V Volume by Volume
Vol. Volume
Zero-sample Blank with internal standard

xxii

1
Chapter 1
Introduction

2
1. Introduction
1.1 Clarithromycin (CAM)
It is a macrolide antibiotic derived from erythromycin, with an improved side
effect profile, dosing schedule, and microbiological activity relative to its parent
compound, erythromycin (Kanatani M.S. and Guglielmo B.J., 1994). It is 6-o-
methylerythromycin, this chemical modification in erythromycin is responsible for CAM
acid stability, wider spectrum of activity, better pharmacokinetic properties and fewer
gastrointestinal adverse effects than erythromycin (Amsden G.W., 1996). CAM is active
(in vitro) against aerobic and anaerobic Gram-positive and Gram-negative bacteria. It is
used for treatment of Pharyngitis/Tonsillitis, Acute bacterial exacerbation, Acute
Maxillary sinusitis, Skin infections, Pneumonia, and with other drugs (Proton pump
inhibitors and Metronidazole) as a triple therapy for treatment of Helicobacter pylori
infection (Katzung B.G., 2012).
1.1.1 Chemical structure of Clarithromycin
CAM has a 14-membered macrocyclic lactone ring attached to two sugar moieties
a neutral sugar cladinose and amino sugar desosamine and has substituted an O-methyl
group at position C6 with resultant acid stability and improved antimicrobial and
pharmacokinetic properties ( Peters D.H and Clissold S.P., 1992; Zuckerman J.M., 2000).
The chemical structure of CAM is illustrated in (Figure 1) while its physical and
chemical properties are listed in (Table 1).
Figure 1: Chemical structure of Clarithromycin.
O
O
O
O
CH3
OHOH
CH3
H5C
2
O
CH3
CH3
O
CH3
CH3
OMe
O
OHN
CH3
CH3
OHCH
3
CH3
OMe
CH3

3
1.1.2 Mechanism of action of Clarithromycin
CAM is first metabolized to 14-OH CAM, which is active and works
synergistically with its parent compound. Like other macrolides, it then penetrates
bacteria cell wall and reversibly binds to domain V of the 23S ribosomal RNA of the 50S
subunit of the bacterial ribosome. Binding inhibits peptidyl transferase activity and
interferes with amino acid translocation during the translation and protein assembly
process (Katzung B.G., 2012; Zuckerman J.M., 2000). CAM may be bacteriostatic or
bactericidal depending on the species of organism, inoculums size, growth phase, and
drug concentration (Peters D.H and Clissold S.P, 1992; Peters D.H et al., 1992).
1.1.3 Side effects of Clarithromycin
Adverse events that have been reported with CAM are of variable rates of (4–
30%). The most frequently reported events in adults were diarrhea , nausea , abnormal
taste, dyspepsia, abdominal pain/discomfort , and headache. Adverse effects of CAM in
central nervous system (CNS) include CNS depression (confusion and obtundation) or
excitation (agitation, insomnia, delirium and psychosis) (Wallace R.J. et al., 1993).
Patients are at a higher risk of developing neurotoxicity if they are co-prescribed CAM
and other drugs metabolized by cytochrome P450 isoenzymes of the CYP3A family
(Yasui N. et al., 1997; Gelisse P. et al., 2007). In addition, CAM may be associated with
potentially life-threatening cardiac adverse effects (Kamochi H. et al., 1999).
1.1.4 Pharmacokinetics of Clarithromycin
CAM is well-absorbed from GIT (50%± 50), acid stable and may be taken with
food. The mean maximum drug plasma concentrations (Cmax) of CAM after oral
administration of single and multiple 500mg doses ranged from 1.65 to 2.12 mg/L and
2.41 to 2.85 mg/L, respectively (Davey P.G., 1991; Hardy D.G. et al., 1992; Chu S.Y. et
al., 1993). The meal does not have any significant changes in the CAM mean time to
maximum concentration (tmax) or the area under the concentration-time curve (AUC)
values (Peters D.H. and Clissold S.P. 1992; Chu S. et al., 1992). The bioavailability of
CAM 250 mg tablets is 52 to 55% (Chu S.Y et al., 1992). Bioavailability is slightly
increased when CAM tablets are taken with food (Chu S. et al., 1992). As with other

4
macrolide antibiotics, CAM and its metabolites have exceptional tissue penetration and
accumulation within cells. Concentration of CAM within alveolar cells were 1,700-fold
greater than those in plasma (Chu S. et al., 1992; Fraschini F. et al., 1991). After a 250
mg tablet every 12 hours, approximately 20% of the dose is excreted in the urine as
CAM, while after a 500 mg tablet every 12 hours, the urinary excretion of CAM is
slightly increased, approximately 30%. Half-life is approximately 3 to 4 h (250 mg) and 5
to 7 h (500 mg) (Chu S.Y. et al., 1992).
1.1.5 Metabolism of Clarithromycin
CAM is metabolized in the liver by CYP3A4 and has an active metabolite, 14-
hydroxyclarithromycin which works synergistically with its parent compound. It is
known as a potent inhibitor of CYP3A4. Moreover, it has been suggested that CAM
inhibits the CYP2C19 activity to some extent (Rodrigues A.D. et al., 1997).
1.1.6 Drug interactions of Clarithromycin
Most of CAM interactions are due to its strong CYP3A4 inhibitory effect. For
example: it may interact with tiniposide, tamsulosin, sildenafil, warfarin, rifampicin, and
vinblastine (Recker M.W. et al., 1997; Dresser G.K. et al., 2000; Riss J. et al., 2008.).

5
Table 1: Physical and chemical properties of Clarithromycin.
Chemical formula
C38H69NO13
Molecular weight
747.96 g/mol
Solubility
Soluble in acetone, slightly soluble in
methanol, ethanol, and acetonitrile, and
practically insoluble in water
Appearance
White to off-white crystalline powder
Melting point
220° C
Storage
Store in a well closed container, below 40°
C, protect from sunlight and moisture.

6
1.2 Metronidazole (MTZ)
It is a nitroimidazole (Reynolds J.E.F. 1993), antiprotozoal antibacterial drug
especially against anaerobic bacteria. Metronidazole (MTZ) is the drug of choice for the
treatment of amebiasis (liver or colon), giariasis (small intestine), trichomoniasis (vaginal
infection), and in the treatment of peptic ulcer diseases (PUD) caused by Helicobacter
pylori (H.pylori) when combined with proton pump inhibitors (PPIs) and CAM (Katzung
B.G., 2012). The chemical structure of MTZ is illustrated in (Figure 2) while its physical
and chemical properties are listed in (Table 2).
Figure 2: Chemical structure of Metronidazole.
1.2.1 Mechanism of action of Metronidazole
The antimicrobial activity of MTZ is due to presence of the nitro group which
chemically reduced by anaerobic bacteria and protozoans. The product that results from
this reduction is responsible for MTZ antimicrobial activity (Ewan J. et al., 1980;
Katzung B.G., 2012) and/or to the interaction of MTZ with the DNA of parasite
(Samuelson J., 1999).
1.2.2 Side effects of Metronidazole
Nauses, vomiting, metallic taste in the mouth, diarrhea insomnia, weakness, and
dizziness. Pancreatitis and sever central nervous system toxicity may occur.
Metronidazole is somewhat well tolerated, but it can produce a number of adverse
neurologic effects as peripheral neuropathy, encephalopathy (Kim D.W. et al., 2004),
cerebellopathy, and seizure (Kuriyama A. et al., 2011). Nausea and vomiting can occur if
N
N CH3
O2N
CH2CH
2OH

7
alcohol is ingested with MTZ therapy. MTZ is considered as an animal carcinogen, and
listed as a possible carcinogen for humans (IARC, 2010).
1.2.3 Pharmacokinetics of Metronidazole
MTZ well absorbed from GIT (at least 80%) and extensively distributed in
tissues. Its oral bioavailability is more than 90% and the maximal plasma concentration
(Cmax) is 45-75 µmol/L after an oral dose of 500mg and with multiple doses it could
reach 240 µmol/L. Peak plasma concentrations are achieved after 1-3 hours. It has a low
protein binding (<20%), the unchanged drug half-life is 7.5 hours and excreted mostly in
the urine (McEvoy G.K., 1995).
1.2.4 Metabolism of Metronidazole
MTZ is metabolized in the liver by the cytochrome P450 (CYP) enzymes family.
The biotransformation of MTZ gives two metabolites: a hydroxylated metabolite (40%)
and an acetilated metabolite (15%). CYP2E1 might be involved in the metabolism of
MTZ from the fact that when it was ingested with ethanol (CYP2E1inducer) leading to a
higher hydroxylation of MTZ. CYP 2B, 2C, and 3A may also involved since
phenobarbital (an inducer of these CYP) when administered with MTZ, its metabolism
was elevated (Loft S. et al., 1991, 1990). On the other hand, they found that MTZ is an in
vitro substrate of CYP1A1 and CYP2E1. However, the distinctiveness of the participant
CYPS has not been determined until now. MTZ is considered as a substrate and an
inhibitor to CYP2C9 and CYP3A4 enzymes and as an inhibitor to CYP2C8 enzyme
(Preissner S. et al., 2010).
1.2.5 Drug interactions of Metronidazole
MTZ has reported interactions with coumarin-type anticoagulants, phenytion,
phenobarbital, cimetidine, ethanol, mebendazole, ciprofloxacin, omeprazole, and lithium
(Cina S.J. et al., 1996; Humphries T.J. et al., 1999; Chen K.T. et al., 2003; Juurlink D.N.
et al., 2007).

8
Table 2: Physical and chemical properties of Metronidazole.
Chemical formula
C6H9N3O3
Molecular weight
171.16 g/mol
Solubility
Slightly soluble in alcohol and has a
solubility in water of 10mg/ml at 20°C
Appearance
White to pale yellow crystalline powder
Melting point
161°C
Storage
Store below 40°C and protect from
sunlight

9
1.3 Drug interactions
Interactions may occur between drug-drug, drug-food, and drug-herbs which may
cause increase or decrease the effect of agents, or a production of a new effect that is not
related to any of the interacting entities on its own (Corrie K., 2011). Other than these
interactions, drugs may interact with drinks, minerals and vitamins, excipients in drug
formulations, and laboratory tests (Kays M.B., 2012).
Drug-drug interactions occur by one therapeutic agent either by altering the
concentration (pharmacokinetic interactions) or the biological effect of another agent
synergistically or antagonistically (pharmacodynamic interactions). Pharmacokinetic
drug-drug interactions involve effecting on absorption, distribution by displacement of
drug from protein binding sites, induction or inhibition of the metabolizing enzymes,
and/or clearance of the affected agent through competition for renal excretion
(Venkatakrishnan K. et al., 2001; Wynn G.H., 2009).
1.3.1 Factors affecting drug interactions
There are many factors affecting drug interactions. These factors either drug-
related or patient-related factors. Drug-related factors as drug potency, duration of
treatment, drug dosage, blood and tissue drug concentration, route of administration,
extent and rate of drug metabolism, degree of protein binding, and others. Patient-related
factors as body weight, genetic polymorphism (quantity and activity of specific drug-
metabolizing enzymes, age, gender, diet, smoking, alcohol use (acutely or chronically),
underlying disease (liver, kidney), and polypharmacy (with enzyme inhibitors or
inducers) (Wynn G.H., 2009).
1.3.2 Mechanisms involved in pharmacokinetic drug interactions
1.3.2.1 Alterations in absorption
a. Alteration in gastro intestinal pH: - PPIs elevate gastric pH ≥ 5 for up to 19 hours.
H2-blockers raise gastric pH ≥ 5 for many hours. Antacids transiently increase
gastric pH by 1-2 units. Ketoconazole absorption is decreased when co-

10
administrated with PPIs or H2-blockers or antacids (Chin T.W., 1995 ; Cŕdoba-
Diaz D.et al., 2001).
b. By adsorption of compounds: - It is an ion-binding or hydrogen-binding may
occur between drug and adsorbent. Example, decreasing of drugs absorption by
adsorbing them on Kaoline surface.
c. By chelating of compounds: - A decrease in drug absorption due to the formation
of insoluble compound that is unable to penetrate the intestinal mucosa. Example,
complexation of tetracycline with of calicium, aluminium and zinc in antacids
(Kwon Y., 2001).
d. Alteration of gastric emptying intestinal motility: - drug absorption is affected due
to change in gastric emptying that caused by some drugs as metoclopramide.
e. Effects of intestinal blood flow: - Intestinal blood flow can affect the absorption
of lipophilic compounds, for example: - by vasoactive agents.
f. Alteration of active and passive intestinal transport.
g. Alteration of intestinal cytochrome P450 isozyme activity: - CYP3A4 and
CYP3A5 represent 70% of total intestinal P450 isozymes which are responsible
for phase I oxidative metabolism of orally administered drug and considered the
major determinant of their systemic bioavailability. For example, Grapefruit juice
can increase the maximum concentration (Cmax), area under the curve (AUC),
and bioavailability of some orally administered medications that are metabolized
by cytochrome P-450 3A4 (Honig P.K. et al.,1996; Hukkinen S.K. et al., 1995).
h. Alteration of intestinal P-glycoprotein activity: - P-glycoprotein is an efflux pump
found in many human tissues including the luminal surface of the intestinal
epithelium which has an important role in drug absorption. Therefore, induction
or inhibition of P- glycoprotein activity can lead to significant drug exposure
alterations. Example: - Verapamil is a P-glycoprotein inhibitor.
i. Other mechanisms can enhance drug absorption either by mucoadhesive
properties through ionic interaction with negative charges of the mucus like
chitosan (water soluble polymers) that enhance the absorption of proteins (Thanou
M. et al., 2001), or by hydrophilic property that cause changing the solid surface
property and effecting the tight junction by adsorption on the drug surface,

11
example: sodium lauryl sulphate can enhance the absorption of Cyclosporine (Lee
E. et al., 2001).
1.3.2.2 Alteration of distribution
The distribution of the drug may be affected by plasma protein binding.
Competition for the protein binding sites cause displacement of drugs to each other from
these sites depending on their affinity which result in an increase in free or unbound
fraction of the displaced drug, volume of distribution and the drug clearance which alters
its therapeutic effect. Since the pharmacological activity is related to only the unbound
drug fraction, therefore, such interactions are considered to be of clinical importance
especially when the displaced drug is highly protein bound, so that a small decrease in its
bound fraction cause a large increase in its unbound fraction. Example: - erythromycin
can increase warfarin concentration by this mechanism (Corrie K., 2011).
1.3.2.3 Affecting of drug metabolism
Drug metabolism generally is converting lipophilic compounds to ionized one to
be excreted through kidney. The mechanism of drug metabolism can be classified to
phase I reactions and phase II reactions. Phase I include oxidation, reduction, and
hydrolysis which occur in the membrane of hepatocyte while phase II is a conjugation
reaction that occur in the cytosol of the hepatocyte. The majority of Phase I oxidative
reactions are result from the action of mono-oxygenases called cytochrome P450
enzymes system in liver. There are different types CYP450 enzymes. However, CYP1, 2
and 3 represent 70% of total hepatic CYP450 (Wynn G.H., 2009).
The metabolizing enzymes can be either induced or inhibited by some agents.
Enzyme inducers induce drug metabolism and decrease its effect through decreasing its
plasma concentration and duration of action. On the other hand, enzyme inhibitors inhibit
drug metabolism and increase its effect and/or adverse effect through increasing its
plasma concentration (Wynn G.H., 2009). Induction of the metabolic enzymes occurs
through synthesis of new enzyme protein or decreasing enzyme degradation (Craig C.R.
and Stitzel R.E., 2004). This enzyme induction results in either a loss in the therapeutic
efficacy or increasing the side effects by production of toxic metabolite. On the other

12
hand, enzyme inhibition is due to decreasing of enzyme synthesis or increasing of
enzyme destruction (Corina I. and Mino C., 2005). The co-administered drugs are
competitively inhibiting the metabolic enzymes depending on their affinities. For
example, CAM and lansoprazole compete on CYP450.
The mechanism of metabolic enzyme inhibition can be classified to competitive,
non-competitive, un-competitive and mechanism-based inhibition. Competitive inhibition
between drugs of similar structure and affinity to the metabolic enzymes is dependent on
their concentrations (Coleman M.D., 2005). Example, omeprazole compete with oltipraz
on CYP1A1 & CYP3A2 (Lee D.Y. et al., 2007). In Non-competitive inhibition, the
inhibitor can change the conformation of the enzyme active site and make it unsuitable
for drug binding by its binding to other site on the enzyme which is called the allosteric
site, example, omeprazole and lansoprazole are considered as a non-competitive CYP3A4
inhibitors in different binding sites (Coleman M.D., 2010). Un-competitive inhibition is
performed through the formation of enzyme-substrate complex. This complex is
functionless with a higher affinity to the binding site. Mechanism-based inhibitor can
cause either destruction of the active site or form a covalent bond that delay product
release, example, drug-food interaction as grape fruit juice with many drugs can affect
their bioavailability through CYP3A4 inhibition(Coleman M.D., 2005).
The mechanism of metabolic enzyme inhibition also can be classified into reversible and
irreversible inhibition.
The reversible inhibition occurs by the formation of weak bonds between the
compound and CYP isozymes which can occur competitively and non-competitively.
This type of inhibition depends both on the affinity of substrate and inhibitor of the
enzyme, and on the concentration of the inhibitor at the site of enzyme (Berg J. et al.,
2002).
The irreversible inhibition occurs due to the formation of irreversible covalent
bond by the inhibitor that causes enzyme inactivation. This reaction depends on the total
amount of CYP isozyme, the total amount of inhibitor, and the rate of new enzyme

13
synthesis. For example:- inhibition of Choline esterase (ChE) enzyme by
organophosphorous compounds (Brenner G.M., 2000).
1.4 Drug-food interactions
A food–drug interaction is the outcome of a physical, chemical, or physiologic
relationship between a drug and a product consumed as food or a botanically-derived
nutrient (Santos C.A. and Boullata J.I., 2005; Genser D., 2008). Such an interaction may
affect health status due to altered Pharmacokinetic (PK) and/or pharmacodynamic (PD)
of the drug or dietary substance. A dietary substance can increase the AUC of the drug
increasing the risk of adverse events and toxicity, or decrease its AUC, leading to
therapeutic failure (Santos C.A. and Boullata J.I., 2005). The mechanisms of such effects
generally include physiologic, physicochemical, and/or biochemical processes (Fleisher
D. et al., 1999).
Interactions between medications and dietary substances, as foods or supplements,
remain a relatively understudied and misunderstood area of pharmacotherapy.
1.4.1 Mechanisms of drug-food interactions
1.4.1.1 Physiologic and physicochemical mechanisms
Physiologic and physicochemical mechanisms include altering of drug absorption,
distribution, metabolism, and/or excretion (ADME) by dietary substances.
a. Physiologic (mechanical) mechanisms:
Alterations of some processes can lead to reduced absorption of some drugs (e.g.,
penicillins, angiotensin-converting enzyme inhibitors) (Singh B.N., 1999). Such
processes include delayed gastric emptying, increased bile or splanchnic blood flow, and
changing of GI pH.
b. Physicochemical mechanisms:
By binding of the drug to the food substances. For example, reducing of
phenytoin absorption via it’s binding to proteins and salts in enteral formulations,
(Lourenço R., 2001). Absorption of some tetracyclines and fluoroquinolones can be
reduced through their binding to divalent cation-containing products (e.g., calcium) (Polk

14
R.E., 1989; Jung et al., 2007) and potential therapeutic failure. High fat meals can
increase drug absorption (e.g., antiretroviral protease inhibitors as saquinavir, atazanavir)
by improving their solubility (Plosker G.L. and Scott L.G., 2003; Le Tiec C. et al., 2005).
1.4.1.2 Biochemical mechanisms
Biochemical mechanisms include:
a. Interference with co-factor formation or function. For example, vitamin K-rich
foods interfere with co-factor function. They can increase risk of bleeding when
consumed with the anticoagulant, warfarin by disrupting vitamin K metabolism
(Holbrook A.M. et al., 2005).
b. Potentiation of drug pharmacodynamic. For example, tyramine-rich diet can
potentiate a hypertensive crisis whene consumed with Isoniazid (To treat
tuberculosis) or monoamine oxidase inhibitors (For depression) by inhibition of
the endogenous and dietary amines breakdown (Brown C. et al., 1989; Self T.H.
et al., 1999).
c. Modification of drug metabolizing enzyme/transporter function (Jiang X.L. et al.,
2011).
d. Some beverages contain substances that can influence drug disposition by means
of modulation of drug metabolizing enzymes and transporters in the intestine
(Jang G. and Harris R., 2007; Sergent T. et al., 2009; Nirmala K. et al., 2010).
1.5 Inhibition of intestinal biochemical processes
Many of in vitro and in vivo studies have established inhibitory effects on enzymes
and transporters involved in drug disposition, particularly those in the intestine (Huang
S.M. et al., 2008).

15
1.5.1 Intestinal enzymes and transporters involved in drug disposition that can be
affected by certain beverages
1.5.1.1 Enzymes
a. Cytochrome P450 3A:
The cytochromes P450 are the predominant enzymes involved in phase I
drug metabolism (Shen D.D. et al., 1997). The enteric CYP3A subfamily is the
most common one that has been established to influence drug disposition in vivo
(Lin J.H. and Lu A.Y., 2001; Paine M.F.et al., 2006) and responsible for the
oxidative metabolism of more than half of pharmaceutical agents on the market
(Gibbs M.A. and Hosea N.A., 2003). It is mainly composed of CYP3A4 and
CYP3A5 in adults.
b. Esterase:
Esterases are necessary for prodrugs (e.g., enalapril, lovastatin) to form the
active species through hydrolytic cleavage of the ester bond (Patchett A.A., 1984;
Sabra R., 1988).
Inhibition of enteric esterase activity increase stability of the ester which
leads to higher absorption of the prodrug and higher exposure to active metabolite
due to rapid hydrolysis in plasma (Liederer B.M. and Borchardt R.T., 2006). The
clinical significance of esterase inhibition by GFJ is under investigation.
There are other enteric enzymes may be involved in beverage-drug interaction but
they are still under investigation. Example:
c. Uridine diphosphate glucuronosyltransferase.
d. Sulfotransferase.
1.5.1.2 Transporter-mediated efflux and uptake
a. P-glycoprotein:
The efflux transporter P-glycoprotein (P-gp) located on the apical luminal
membrane of enterocytes is another factor that may alter systemic drug

16
concentrations. Through inhibition of this transporter the substrates are returned
back to the intestinal lumen, as a result, lowering systemic drug concentrations
(Huang S.M. et al., 2010). Therefore, as with CYP3A, enteric P-gp inhibition
thought to increase systemic drug exposure.
b. Organic anion transporting polypeptide:
Organic anion transporting polypeptides (OATPs) are transmembrane
transport proteins that facilitate uptake of a number of endogenous compounds
(e.g., bile acids, hormones) and drugs (Hagenbuch B. and GUI C., 2008). Of the
11 human OATP family members, OATP1A2 and OATP2B1 have been reported
to be expressed on apical membranes of enterocytes (Kim R.B., 2003). For
example: GFJ significantly reduced mean aliskiren AUC by 61% with no change
in half-life, reliable with inhibition of intestinal but not hepatic OATPs
(Tapaninen T. et al., 2010).
1.6 Pomegranate juice (PJ)
The pomegranate (Punica granatum L.) is considered as a popular ‘superfood’
since it has high antioxidant content and disease prevention properties (Tzulker R. et al.,
2007).
Most phytochemicals found in pomegrante juice are ellagitannins, pelargonidin,
punicalin, punicalagin, anthocyanins,cyanidin, and ellagic acid (Nawwar A.M. et al.,
1994; El-Toumy A.A. et al., 2002).The PJ’s therapeutic and prevention activity on many
diseases could be due to the presence of these phytochemicals (Gil M.I. et al., 2000;
Machado T.B. et al., 2002; Aviram M. et al., 2004; Seeram N.P. et al., 2005).
The effect of pomegranate juice on carbamazepine metabolism was studied in
human’s liver (in vitro) and on carbamazepine pharmacokinetic in rats; in the results,
pomegranate juice inhibited hepatic CYP3A-mediated metabolism of carbamazepine in
vitro study and inhibited intestinal CYP3A4 activity after single of pomegranate juice
(Hidaka M. et al., 2005). Another clinical study suggested lack of clinical significance of
the effect of pomegranate juice when it is given with a single oral dose of midazolam
(Farkas D. et al., 2007). A more recent study evaluated the effect of repeated
commercially available pomegranate juice consumption on the CYP3A-mediated
17
metabolism of midazolam (Misaka S. et al., 2011). Pomegranate juice did not
significantly alter midazolam PK. Repeated consumption of pomegranate juice may not
cause a clinically relevant interaction with midazolam. Since there was no information
provided about the composition of the test juice, the enteric CYP3A inhibition potential
of pomegranate juice is not fully addressed yet.
1.7 Grapefruit juice (GFJ)
Grapefruit Juice (GFJ) is one of the most known dietary substances that shown to
inhibit many enteric CYP3A substrates metabolism (Mertens-Talcott S. U. et al., 2006;
Seden K. et al., 2010; Hanley M.J et al., 2011).
GFJ can inhibit CYP3A in the intestine, the pre-systemic (first-pass) drug
metabolism, and increase systemic drug exposure (Paine M.F. and Oberlies N.H., 2007).
It is proved that the Inhibition is in the gut, as there is no effect on the elimination half-
life of orally adminisftered substrates and on the PK of intravenously administered
substrates (Kupferschmidt H.H. et al., 1995). However, some cases are reliable with
inhibition of hepatic CYP3A by GFJ when consumed regularly in abundant uncommon
volumes (Lilja J.J. et al., 2000). For example, GFJ when is consumed with docetaxel
(Valenzuela B. et al., 2011), also intravenous amiodarone administration after regular
GFJ consumption (≥1–1.5 L/day) (Agosti S. et al., 2012).
The enhancement of the systemic drug exposure by GFJ can be sufficient to
produce adverse events (Saito M. et al., 2005). For example, GFJ with some statins can
cause muscle pain and severe hypotension when consumed with some calcium channel
blockers.
The mechanism of intestinal CYP3A inhibition include reversible, mechanism-
based (Schmiedlin-Ren P. et al., 1997; Paine M.F. et al., 2004, 2005), and degradation of
the protein (Lown K.S. et al., 1997).
1.8 Seville orange juice
Seville orange juice has been shown to inhibit enteric CYP3A4 in vitro and in
healthy subjects (Edwards D.J. et al., 1999; Guo L.Q. et al., 2000; Malhotra S. et al.,
2001; Penzak S.R. et al., 2002; Mouly S.J. et al., 2005).For example, Seville orange juice

18
decreased unexpectedly mean AUC of colchicine by 20% and delayed tmax by one hour
(Wason S. et al., 2011).
1.9 Tea
Tea is the most widely consumed beverage in the world, second only to water
(Dreosti I.E., 1996; Vinson J.A. et al., 2004). The majority of controlled clinical studies
to date evaluating the effect of repeated green tea administration (given as extract) on
CYP activity have not demonstrated clinically significant interactions (Donovan J.L. et
al., 2004; Chow et al., 2006). However, a two-fold increase in tacrolimus levels observed
while consuming of green tea (Vischini G. et al., 2011). Another study showed an
increase in the AUC of 5-fluorouracil by ~425% while green tea consumption (Qiao J. et
al., 2011).
1.10 Chromatography
1.10.1 Definition
Chromatography is a physical separation process in which the sample mixture is
distributed between two phases in the chromatographic bed (column or plane). One phase
is stationary whilst the other passes through the chromatographic bed which is the mobile
phase. The separation occurs because of difference in affinity between analytes and
stationary phase (James M.M., 2009; Meyer V., 2010). The stationary phase is either a
solid, porous, surface-active material in small-particle form or a thin film of liquid coated
on a solid support or column wall. The mobile phase is a gas or liquid. If gas is used, the
process is known as gas chromatography; the mobile phase is always liquid in all types of
liquid chromatography (James M.M., 2009).
1.10.2 Types of chromatography
There are different types of chromatography. Gas chromatography (GC), in which
the mobile phase is gas, while in high performance liquid chromatography (HPLC), thin-
layer chromatography, and paper chromatography (PC), the mobile phase is liquid. GC
and HPLC are the most widely used now a day due to their advanced development
(James M.M., 2009).

19
A. Gas chromatography (GC)
(GC) is a more advanced and popular chromatography technique as well as
(HPLC). It is consist of a gas as a mobile phase and non-volatile liquid or solid particles
as a stationary phase. GC is premier technique for analysis of volatile and thermally un-
labile compounds. (GC) is fast analysis, highly accurate quantification (1-5% RSD)
technique with Small samples (µl or µg needed) and relatively simple and cheap (Skoog
D.A., 2007; McNair H.M. and Miller J.M., 1998). (LC) and (HPLC) are not limited to
sample volatility or thermal stability as in (GS). Furthermore, there are two phases
(mobile and stationary) to compete for the analyte not only one phase (stationary) as in
(GC) (Dennis J.R., 1981).
B. liquid chromatography (LC)
Liquid-solid column chromatography is a chromatography technique in which a
liquid mobile phase filters down slowly through the solid stationary phase, bringing
the separated components with it.
Chromatography is effective because different components within a mixture are
attracted to the adsorbent surface of the stationary phase with varying degrees depending
on each components polarity and its unique structural characteristics, and also its
interaction with the mobile phase. The separation that is achieved using column
chromatography is based on factors that are associated with the sample. So, a component
that is more attracted to the stationary phase will migrate down the separating column at a
slower rate than a component that has a higher affinity for the mobile phase. In addition,
the efficacy of the separation is dependent on the nature of the adsorbent solid used and
the polarity of the mobile phase solvent (Skoog D.A. et al., 2007).
C. High performance liquid chromatography (HPLC)
High performance liquid chromatography is a powerful tool in quantitative
analysis (Karen and Liyuan, 2005). It is basically a highly improved form of column
chromatography. Instead of a solvent being allowed to drip through a column under

20
gravity, it is forced through under high pressures of up to 400 atmospheres that makes it
much faster (Drenthe, 2010).
It also allows using a very much smaller particle size for the column packing
material which gives a much greater surface area for interactions between the stationary
phase and the molecules flowing past it. This allows a much better separation of the
components of the mixture (Drenthe, 2010). The other major improvement over column
chromatography concerns the detection methods which can be used. These methods are
highly automated and extremely sensitive. Liquid chromatography inlets are used to
introduce thermally labile compounds not easily separated by gas chromatography.
Because these inlets are used for temperature sensitive compounds, the sample is ionized
directly from the condensed phase.
1.10.3 HPLC advantages
i. Speed of analysis (minutes) with higher resolution (column packing material with
very much smaller particle size gives a much greater surface area for interactions
between the stationary phase and the analyte which means better separation).
ii. Columns can be reused without regeneration or repacking.
iii. Higher sensitivity (ng to fg).
iv. Greater reproducibility (less dependent on the operator proficiency).
v. Automated, precise, and accurate.
vi. Used for various sample types (labile compounds, ions, and biomolecules)
(Hamilton R.J. and Sewell P.A., 1982; Marvin C. 2007; Snyder L. et al., 2011).
1.10.4 HPLC limitations
1- Complexity.
2- Irreversibly adsorbed compounds cannot be detected.
3- Low sensitivity for some compounds.
4- Costly (Marvin C. 2007).

21
1.10.5 Types of chromatography detectors
The chromatographic detector is able to establish both the identity and
concentration of eluting components in the mobile phase. There are different types of
detectors available to meet different sample necessities (Meyer V., 2010) these are some
of them:
1- Ultraviolet (UV) detector: is the most commonly used. Its principle of work depends
on the light absorbing property of the functional groups that are present in the eluting
molecules.
2- Fluorescence detector: Is more sensitive than (UV) detector but it is less universal
since the naturally fluorescent compounds are fewer compared to light absorbing
compounds.
3- Photo Diode Array (PDA) detector: In this detector, a large number of diodes are
incorporated to serve as detector elements so can monitor more than one absorbing
component at different wavelengths. This save time and cost on expensive solvents.
4- Electrochemical detector: This detector depends on the electrochemical oxidation or
reduction of sample on the surface of the electrode. However, it is sensitive for the
mobile phase composition or flow rate (higher possibility of interference) and need
longer time of analysis.
5- Mass spectrometry: In this type the detection is based on three principles:
a- The fragmentation of molecules: This means the conversion of the gaseous
molecules to ions by an ion source.
b- Separation of ions according to their mass to charge ratio by mass analyzer which
is the heart of the mass spectrometer in presence of electromagnetic field.
Finally, after the ions are separated, they are detected.
c- Mass spectrometers should have a vacuum system to keep the low pressure which
necessary to reduce ion-molecule reactions, scattering, and neutralization of the ions.
(Gross J.H., 2004).

22
1.10.6 High performance liquid chromatography/Mass spectrometry
The direct coupling of liquid chromatography with mass spectrometry (LC–MS)
is a technique that was described in 1973 by Baldwin and McLafferty. With The
development of electrospray ionization (ESI) in 1989 this technique becomes the most
powerful analysis tool to analyze large, polar, heat-sensitive molecules (Fenn J.B. et al.,
1989). The power of LC–MS over other techniques revert to its high specificity,
sensitivity, and ability to concurrently measure several analytes in a single assay,
moreover, performing fast, easy and precise assays through a short time (Arpino P.,
1992). Now a day it is used in variable clinical laboratory analysis (Vogeser M., 2003;
Vogeser M. and Seger C., 2008) and in many pharmaceutical, environmental, and
biochemical applications (Niessen W.M.A., 1999).
1.10.7 Method validation
The results obtained from animal toxicokinetic studies and clinical trials support
the safety and efficacy of a medicinal drug substance. Therefore, the bioanalytical
methods used to establish drug pharmacokinetics should be well characterized and
validated in order to give reliable results. According to Guideline on bioanalytical
method validation (EMA, 2011), (USP 29), and (FDA, 2001) the parameters used in the
validation of the analytical HPLC method are:
1.10.7.1 Standard calibration curve
Standard Calibration curve is the response of the instrument with regard to the
concentration of analyte wich should be evaluated over a specified concentration range.
Therefore, the concentration range that expected should be known. This range should be
covered by the calibration curve range, represented by a minimum of six calibration
concentration levels includes the LLOQ and ULOQ in addition to the blank sample
(processed matrix sample without analyte and without IS (internal standard) ) and a zero
sample (processed matrix with IS). A relationship between the response of the instrument
and the concentration of analyte should be applied. The blank and zero samples should
not be taken into consideration to calculate the calibration curve parameters. A minimum
23
of 3 standard calibration curves should be reported. The back calculated concentrations of
the calibration standards should be within ±15% of the supposed value, except for the
LLOQ for which it should be within ±20% (EMA, 2011).
1.10.7.2 Linearity and range
The linearity of an analytical procedure is its ability to elicit test results that are
directly, or by a well-defined mathematical transformation, proportional to the
concentrations of analyte in samples within a given range. It should be established
initially by visual examination of plot of signals as a function of analyte concentration of
content. If there appears to be a linear relationship, test result should be established by
appropriate statistical methods (e.g., by calculation of regression line by the method of
least squares).
Linearity is usually expressed in terms of variance around the slope of the
regression line calculated according to an established mathematical relationship from test
result obtained by the analysis of samples with varying concentrations of analyte.
The range of an analytical method is the interval between the upper and lower
levels of analyte in which it is found to be accurate, precise and linear (USP29).
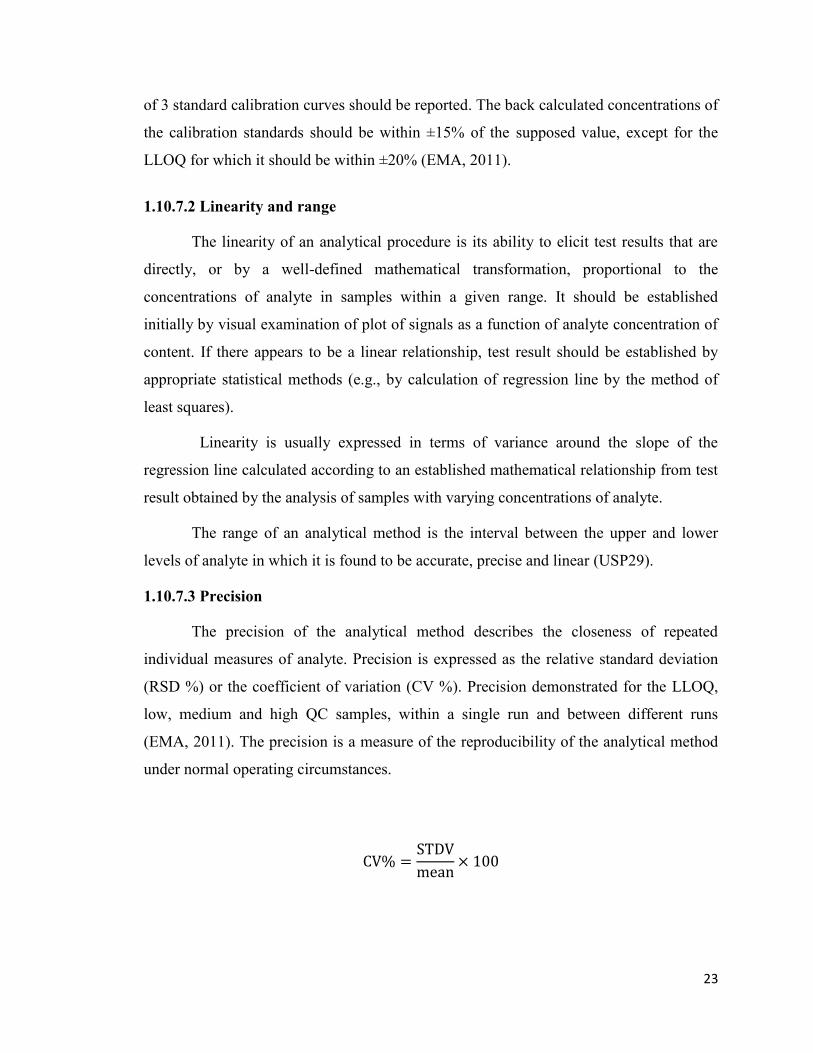
1.10.7.3 Precision
The precision of the analytical method describes the closeness of repeated
individual measures of analyte. Precision is expressed as the relative standard deviation
(RSD %) or the coefficient of variation (CV %). Precision demonstrated for the LLOQ,
low, medium and high QC samples, within a single run and between different runs
(EMA, 2011). The precision is a measure of the reproducibility of the analytical method
under normal operating circumstances.
CV% =STDV
mean× 100

24
A- Within-run precision
There should be a minimum of five samples per concentration level for the
validation of within-run precision includes LLOQ, low, medium and high QC samples in
the same run. The within-run CV value should not exceed 15% for the QC samples,
except for the LLOQ which should not exceed 20% (EMA, 2011).
B- Between –run precision
LLOQ, low, medium and high QC samples from at least three runs analyzed on at
least two different days should be evaluated for the validation of the between-run
precision. The between-run CV value should not exceed 15% for the QC samples, except
for the LLOQ which should not exceed 20% (EMA, 2011).
1.10.7.4 Accuracy
The accuracy of an analytical method describes the nearness of the determined
value obtained by the method to the nominal concentration of the analyte (expressed in
percentage). Accuracy should be assessed on samples spiked with known amounts of the
analyte (EMA, 2011). It is the measure of exactness of analytical procedure and it is
defined as (determined value/true value) x100%.
Accuracy should be evaluated for the values of the QC samples obtained within
the same run (the within run accuracy) and in different runs (the between-run accuracy)
(EMA, 2011).
1.10.7.5 Lower limit of detection
The lower limit of Detection (LLOD) is the lowest concentration of analyte in a
sample which can be detected, but not necessarily quantitated, under the stated
experimental conditions (USP 29).

25
1.10.7.6 Lower limit of quantification
The lower limit of quantification (LLOQ) is the lowest concentration of analyte in
a sample which can be quantified consistently, with an acceptable accuracy and precision.
Moreover, the analyte signal of the LLOQ sample should be at least 5 times the signal of
a blank sample (EMA, 2011).
1.10.7.7 Selectivity
It is the ability of the analytical method to differentiate the analyte(s) of interest
and IS from endogenous components in the matrix or other components in the sample.
Selectivity should be proved using at least 6 individual sources of the appropriate blank
matrix, which are individually analysed and evaluated for interference. Normally,
absence of interfering components is accepted where the response is less than 20% of the
lower limit of quantification for the analyte and 5% for the internal standard (EMA,
2011).
1.10.7.8 Specificity
Specificity is done to indicate that there is no interference from excipient,
degradation products, and/or impurities (USP 29). It is examined by analyzing blank and
standard zero samples of the biological matrix that obtained from at least six different
sources. Each of the blank and zero standards are tested for interference (FDA, 2001).
1.10.7.9 Recovery
The recovery of an analyte in an assay is the response obtained from the extracted
amount of the analyte from the biological matrix, compared to the response obtained
from the true concentration prepared in mobile phase (out of the extraction method).
Recovery relate to the extraction efficiency of an analytical method. Recovery of the
analyte and the internal standard should be consistent, precise, and reproducible.
Recovery experiments should be performed at three concentrations (low, medium, and
high) (FDA, 2001).

26
1.11 Previous analytical studies for quantification of Clarithromycin in plasma
There are many reported methods for the quantification of CAM in plasma. These are
some examples:
A high-performance liquid chromatographic method was developed for the
quantitative determination of CAM in rat plasma with amperometric detection by
utilizing Roxithromycin as an internal standard. The separation was performed on a
reversed-phase column (YMC-Pack ODS-AP of 25036.0 mm I.D, 5 µm). The mobile
phase consisted of acetonitrile and 0.05 M phosphate buffer (pH 7.2) (43:57, v/v). The
drug was extracted from 150 ml, the linearity of the calibration curves were preserved
over the concentration ranges of 0.03–3.0 mg/ml. Coefficients of variation and relative
error were less than 9% and 67%, respectively (Taninaka C. et al., 2000). Comparing
with the current method, this method has lower sensitivity with greater plasma sample.
Moreover, the detection method has disadvantages of lower specificity and longer time of
analysis.
By Van Rooyen G.F. and others (2002), a sensitive method for the determination
of CAM in plasma is described, using high-performance liquid chromatographic
separation with tandem mass spectrometric detection. Samples were prepared using
liquid-liquid extraction and separated on a C18 column with a mobile phase consisting of
acetonitrile, methanol and acetic acid. Detection was performed by a mass spectrometer
in the multiple reaction monitoring (MRM) mode (LC-MS-MS) using Spray ionization.
The mean recovery of CAM was 87.3%, with a lower limit of quantification of 2.95
ng/ml when using 0.3 ml plasma (van Rooyen G.F. et al., 2002). This method has more
sensitivity but with greater plasma sample size and complicated extraction method
comparing with the protein precipitation method.
In 2003 an analytical method was developed for the simultaneous analysis of
CAM and its 14-hydroxy-clarithromycin metabolite in rat plasma. Samples were
extracted with n-hexane/2-butanol (4:1) and the internal standard was roxithromycin. A
Kromasil ODS 5 mm (7534.6 mm I.D.) column was used with a mobile phase consisting
of acetonitrile/ (aqueous phosphate buffer pH 7, 0.086 M) (45:55 v/v). The analysis time

27
was less than 8 min. The limits of quantitation for CAM were 0.15 µg/ml (Wibawa J.I.D.
et al., 2003). This method has a disadvantage of using phosphate buffer which has
negative effects on HPLC column on the long period run. The analysis time (8 min) is
twicly greater than that for the current method. Moreover, the limit of quantitation for
CAM was higher (0.15µg/ml).
In 2007, by Li W. et al., a novel HPLC method using pre-column derivatization
and UV detection at 275nm for the determination of CAM in rat plasma has been
validated. CAM was extracted from plasma sample spiked with internal standard
(erythromycin) under alkaline condition with ethyl ether and derivatizated with
trimethylbromosilane. The analyses were run on a C18column, maintained at 40◦C during
elution, using a mobile phase comprised of potassium dihydrogen phosphate (50mM, pH
6.8, contained 0.7% triethylamine), acetonitrile, and methanol (30:45:25, v/v/v). The
standard calibration curve for CAM was linear (R²=0.9998) over the concentration range
of 0.1–10µg/ml in rat plasma. The limit of detection (LOD) and limit of quantitation
(LOQ) was 30ng/ml and 0.1µg/ml respectively. The intra- and inter-day assay variability
range was 2.6–7.4% and 3.3–8.5%, respectively. This method has been successfully
applied to a pharmacokinetic study of CAM in rats (Li W. et al., 2007). They used 150 µl
volume of plasma sample with LLOQ of 0.1 µg/ml which means a disadvantage of lower
sensitivity. Moreover, their method has to complete a pre-step of derivatization procedure
which is need 10 min. (longer analysis time) with a retention time of 20 min.
By Jiang Y. et al. (2007), a method has been developed for the determination of
CAM in human plasma with liquid chromatography-tandem mass spectrometry. CAM
and the internal standard, telmisartan were precipitated from the matrix (50 µl) with 200
µl acetonitrile and separated by HPLC using formic acid: 10 mM ammonium acetate:
methanol (1:99:400, v/v/v) as the mobile phase. The assay based on detection by
electrospray positive ionization mass spectrometry in the multiple-reaction monitoring
mode was finished within 2.4 min. Linearity was over the concentration range 10-5000
ng/ml with a limit of detection of 0.50 ng/ml. Intra- and inter-day precision measured as
relative standard deviation were 3.73% and 9.93%, respectively (Jiang Y. et al., 2007).

28
Another method for determination of CAM concentrations in human plasma using
protein precipitation and liquid chromatography-tandem mass spectrometry was
developed and validated by Shin J. et al. (2008). Plasma proteins were precipitated with
acetonitrile and roxithromycin was used as the internal standard. The mobile phase
consisted of water and methanol (30:70 v/v) containing 0.1% formic acid and 5mM
ammonium acetate. The flow rate was 0.22 mL/min and the total run time (injection to
injection) was less than 3 min. Detection of the analytes was achieved using positive ion
electrospray tandem mass spectrometry in selected reaction monitoring (SRM) mode.
The linear standard curve ranged from 100 to 5000 ng/mL and the precision and accuracy
(inter- and intra-run) were within 7.9% and 4.9%, respectively (Shin J. et al., 2008).
In 2009, a method developed is based on the precipitation of proteins in human
serum with precipitation reagent containing the internal standard (cyanoimipramine) and
subsequently high-performance liquid chromatography (HPLC) analysis and tandem
mass spectrometry (MS/MS) detection in an electron positive mode. The mobile phase is
consisted from an aqueous buffer (containing ammonium acetate 10 g/L, acetic acid
35mg/L and trifluoroacetic anhydride 2 mL/L water), water and acetonitrile. The analyses
were run on a C18, 50mm, 2.1 mm, 5 µm). The method validation included selectivity,
linearity, accuracy, precision, dilution integrity, recovery and stability. The calibration
curves were linear in the range of 0.10–10.0 mg/L for CAM and 14-hydroxy CAM and
0.20–5.0 mg/L for rifampicin and 25-desacetylrifampicin (Velde F. et al., 2009). This
method has a disadvantage of lower sensitivity.
Oswald S. et al. (2011) developed a method to measure concentrations
of CAM, rifampicin and their main metabolites in horse plasma. Drugs were measured
after extraction with methyl tert-butyl ether using roxithromycin as internal standard and
liquid chromatography coupled with tandem mass spectrometry (LC-MS/MS) for
detection. The chromatography was done isocratically using 25 mM ammonium acetate
buffer (pH 4)/acetonitrile (45%/55%, flow rate 200 μl/min). The column used was (C18,
100 mm, 2.1 mm, 3.0 µm). The MS/MS analysis was performed in the positive ion mode.
The method was validated according to selectivity, linearity, accuracy, precision,

29
recovery, matrix effects and stability. The validation ranges for all substances were 2.5-
25 for the low and 25-250 ng/ml for the high validation range (Oswald S.et al., 2011).
CAM quantification has been previously determined by ultra-performance liquid
chromatography–tandem mass spectrometry (UPLC–MS/MS) for determination of nano
formulated drug in rat plasma. This method presented satisfactory results in terms of
sensitivity, precision, accuracy, and recovery, for the first time, of quantitatively
analyzing CAM in rat plasma (Wang Y.J. et al., 2012).
1.12 Previous analytical studies for quantification of Metronidazole in plasma
Relatively few reported methods for the determination of MTZ in plasma, examples are:
HPLC-UV method has been developed for the separation and quantitation of
metronidazole and its hydroxylated metabolite in human plasma, saliva and gastric juice.
The limits of quantitation (0.5-ml sample) were at least 0.25µg/ml for metronidazole and
0.20/µg/ml for its hydroxy metabolite. A Hypersil ODS 5 µm (150×4.6 mm I.D.) column
was used with a mobile phase of acetonitrile-aqueous 0.05 M potassium phosphate buffer
(pH 7) containing 0.1% triethylamine (10:90) with a flow-rate of 1.0 ml/min (Jessa M.J.
et al., 1996).
Galmier M.J. et al., developed HPLC method for determination of metronidazole
in human plasma. The separation of compounds was performed on a RP 18 column with
acetonitrile–aqueous 0.01 M phosphate solution (15:85, v/v) as mobile phase. Detection
was performed by UV absorbance at 318 nm. The concentration range was 0.01 to 10 µg/
ml. Within-day and between-day precision and accuracy 4% between 1 and 10 µg ml and
8.3 and 7.2% respectively for the limit of quantitation (Galmier M.J. et al., 1998).
High performance liquid chromatography (HPLC) assay was developed to
quantitate metronidazole, and omeprazole in plasma and gastric fluid. The HPLC system
consisted of a multi-phase column combining anion exchange and reversed phase
separation, and a variable wavelength UV detector set at 254 nm. The mobile phase was a

30
mixture of 0.1 M sodium phosphate buffer: methanol: acetonitrile (60:20:20) with final
pH adjusted to approximately 7.0. Metronidazole and omeprazole were extracted by
adsorption onto a C2-bonded silica gel solid phase extraction column, and eluted with
methanol. The extract was dried, reconstituted in a solution of acetyl salicylic acid
(ASA), and then injected into the HPLC system. Using 0.3 ml of sample, the assay
sensitivity was less than 0.1 µg/ ml and linear up to 10 µg/ ml. Both intra- and inter-assay
CV were greater than 15% (Yeung P.K. et al., 1998).
Liquid chromatographic–mass spectrometric (LC–MS/MS) method for
simultaneous determination of metronidazole and spiramycin I concentrations in human
plasma, saliva and gingival crevicular fluid (GCF) was developed by Sagan C. and
others. Ornidazole was used as an internal standard, and sample pre-treatment consisted
of a liquid–liquid extraction. A 5 µm Kromasil C18 column (150 mm×4.6 mm i.d.,
particle size 5 µm) was used with acetonitrile, water and formic acid gradient at a flow
rate of 0.9 ml/min (Sagan C. et al., 2005).
Tavakoli N. and others developed and validated reversed phase-HPLC method to
measure simultaneously the amount of amoxicillin and metronidazole at single
wavelength (254nm). C18 column with buffered mobile phase (pH 4.0) and UV detection
at 254 nm was made. The linearity for concentrations between 0.13 and 300 µg/ml for
metronidazole were established. Intra and inter-day precision were less than 2.5%. The
limits of detection (LOD) and quantification were 0.10 and 0.13 µg/ml for metronidazole
(Tavakoli N. et al., 2007).
Most of the analytical methods that were previously used for MTZ quantification
(by Jessa M.J. et al.(1996), Galmier M.J. et al., 1998, Yeung P.K. et al., 1998, and by
Tavakoli N. et al., 2007) based on phosphate buffer solution as a mobile phase with UV
detection. On the other hand, one method was used for MTZ quantification (by Sagan C.
et al., 2005) by using LC-MS/MS method simultaneously with spiramycin but with
liquid-liquid extraction method.

31
According to our knowledge, this is the first time that a single and simple
analytical method by HPLC/MS was used for quantification of both CAM and MTZ
present in the same biological fluid (rat plasma) with a single extraction method using
protein precipitation.
1.13 Preclinical studies
Preclinical studies can be defined under many names, such as nonclinical studies
and preclinical development. A preclinical study is a stage of study that done before
testing on humans or what is called the clinical trials. Most preclinical studies carried out
through using of animals such as mice, chicken, monkeys, and guinea pigs. The
preclinical studies are passed if there is no effect on animal in a dangerous manner and
this gives proof to be tested on humans.
The objectives of the preclinical studies are to identify pharmacological and
toxicological effects not only before doing experiments on human but also for clinical
development. Biopharmaceuticals that are structurally and pharmacologically similar to a
product for which there is broad experience in clinical practice may need less extensive
testing for toxicity. Preclinical safety testing should consider, selection of the applicable
animal species, age, physiological state, the method of delivery, including dose, route of
administration, treatment regimen, and stability of the materials used. (Guidance for
Industry, 1997).

32
1.14 Objectives of the current study
1. To validate a simple and simultaneous analytical HPLC/MS method for
quantification of Clarithromycin and Metronidazole in plasma.
2. To study the effect of Pomegranate fresh juice on the pharmacokinetic profile of
Clarithromycin and Metronidazole.

33
Chapter 2
Materials and Methods

34
2. Materials and Methods
2.1 Reagents
a. Deionized Water, Nanopure (Fisher Sientific).
b. Rats Serum, (harvested from Rats).
c. Methanol advanced gradient grade (Fisher scientific).
d. Formic acid advanced gradient grade (Acros).
e. Hydrochloric acid (12 M) (Fisher scientific).
f. Clarithromycin and Metronidazole (was a kind gift from Hikma pharma).
g. Clindamycin (JCPR).
h. Pomegranate fruit (purchased from local supermarket).
2.2 Instrumentation
An API Mass spectrometer was used and consisted from the following:
a. Degasser (Agilent 1260).
b. Solvent delivery systems pump (Agilent 1200).
c. Autosampler (Agilent 1200).
d. Thermostat column compartment (Agilent 1200).
e. API 3200 Mass Spectrometer.
f. ACE 5, C18 (50 x 2.1 mm), 5µm.
g. Computer System, Windows XP, SP3, Data Management Software.
Other instruments
Bath Sonicator Elmasonic PH500EL.
Sartorius pH meter.
Sartorius Balance.
Sartorius Centrifuge.

35
2.3 Animals
Spargue Dawley (S.D) adult male rats supplied by the animal house of University of
Petra with a weigh range between 200 and 250 g were used in the experiments. They
were placed in air-conditioned environment (20-25 C°) and exposed to a photoperiod
cycle (12 hours light / 12 hours dark) daily. The study protocol was approved by the
ethical committee of Graduate Studies at Faculty of Pharmacy and Medical Sciences
(March, 2012).
2.4 Preparation of Clarithromycin solution to be injected orally to rats
0.18 g of CAM raw material was dissolved in 2.0 ml (0.1M HCL), vortex to complete
dissolving then complete the volume to 50.0 ml by DW to give a concentration of 3.6
mg/ml.
2.5 Preparation of Metronidazole solution to be injected orally to rats
0.18 g of MTZ raw material was dissolved in DW to give a total volume of 50.0 ml and a
concentration of 3.6 mg/ml.
2.6 Preparation of pomegranate juice to be injected orally to rats
Pomegranate fruit was cut into two pieces, squeezed by orange squeezer, then filtered to
get clear juice and freshly used.
2.7 Preparation of stock solutions for the method validation
2.7.1 Preparation of stock solution for Clindamycin as an internal standard (IS)
10 mg of Clindamycin working standard was dissolved in 10.0 ml methanol to get
concentration 1.0 mg/ml stock solution.
2.7.2 Preparation of 2 µg/ml Clindamycin IS in methanol (Precipitating agent)
1000.0 µl was taken from Clindamycin 1.0 mg/ml stock solution and complete to 500.0 ml
of methanol in dispenser bottle to obtain 2.0 µg/ml Clindamycin.

36
2.7.3 Preparation of stock solutions of Clarithromycin and Metronidazole
10 mg of CAM working standard was dissolved in 10.0 ml by methanol (100%) to get
concentration of 1.0 mg/ml as stock solution.
60 mg of MTZ working standard was dissolved in 10.0 ml by methanol (100%) to get
concentration of 6.0 mg/ml as stock solution.
2.7.4 Preparation of working solution for Clarithromycin and Metronidazole
0.50 ml was taken from each of CAM and MTZ stock solutions and diluted to 10.0 ml by
50% methanol to obtain a concentration of 50.0 µg/ml for CAM and 300.0 µg/ml for MTZ
as working solution.
2.7.5 Preparation of the mobile phase
The mobile phase consisted from aqueous solvent which was formic acid as buffer and
organic solvent which was absolute methanol. Preparation of 0.1% formic acid by taking
2.50 ml from 100% formic acid completed to 2.50 L deionized water, mixing then
sonicaton for 10 min.
2.7.6 Preparation of Clarithromycin and Metronidazole SCC serial dilution and
spiked serum.
Samples of standard curve in serum were prepared by spiking 500.0 µl from serial solution
into 4.50 ml of serum, using seven concentrations, not including zero to attain SCC
concentrations of: 0.050, 0.100, 0.200, 0.400, 1.000, 2.000 and 3.000 µg /ml for
Clarithromycin in serum and 0.300, 0.600, 1.200, 2.400, 6.000, 12.000, and 18.000 µg /ml
for Metronidazole in serum. Each concentration of the serum sample was divided to 50.0 µl
in 1.50 ml eppendorf tube and kept at (-30°C). Standard samples were given daily together
with the quality control samples. As showed in (Table 3).
2.7.7 Preparation of Clarithromycin and Metronidazole QC serial dilution and spiked
serum.
QC samples in serum were prepared by spiking 500.0 µl from serial solution into 4.50 ml of
serum to attain QC concentrations of: 0.15, 1.50 and 2.40 µg /ml for Clarithromycin in

37
serum and 0.9, 9.0, and 14.4 µg /ml for Metronidazole. Each concentration of the QC serum
sample was divided to 50.0 µl in 1.50 ml eppendorf tube and kept at (-30°C). Quality control
samples were given daily together with the standard samples. As showed in (Table 4).
Table 3: Preparation of Clarithromycin & Metronidazole SCC serial dilution and
spiked serum.
Serial solution of CAM& MTZ from working solution of 50 & 300 µg/mL,
respectively.
Sol. No:
Vol.
taken
(ml)
from
working
sol.
Total
vol.
(ml)
Conc.
of CAM
serial sol.
(µg /ml)
Conc. of
MTZ
serial sol.
(µg /ml)
Conc.
of CAM in
serum (µg
/ml)
Conc.
of MTZ
in serum
(µg /ml)
S1 0.01 1.0 5.0 3.0 0.050 0.300
S2 0.02 1.0 1.0 6.0 0.100 0.600
S3 0.04 1.0 2.5 12.0 0.200 1.200
S4 0.08 1.0 0.5 24.0 0.400 2.400
S5 0.20 1.0 05.5 60.0 1.000 6.000
S6 0.40 1.0 25.5 120.0 2.000 12.000
S7 0.60 1.0 05.5 180.0 3.000 18.000
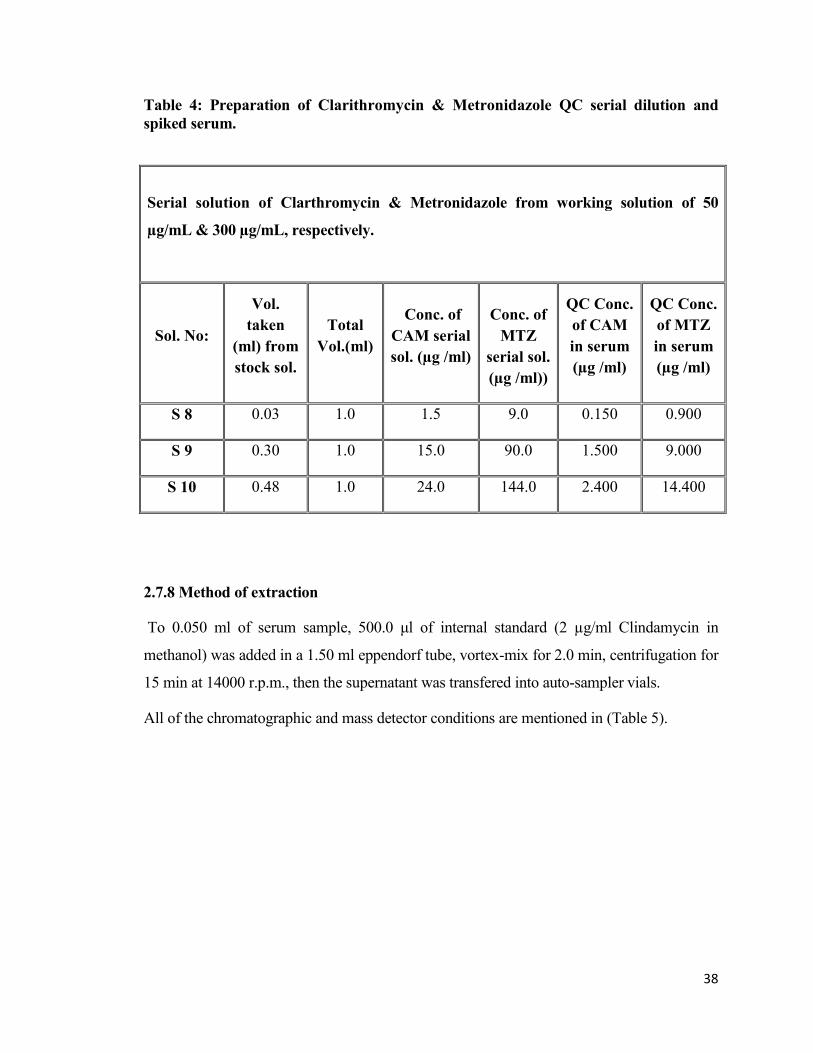
38
Table 4: Preparation of Clarithromycin & Metronidazole QC serial dilution and
spiked serum.
Serial solution of Clarthromycin & Metronidazole from working solution of 50
µg/mL & 300 µg/mL, respectively.
Sol. No:
Vol.
taken
(ml) from
stock sol.
Total
Vol.(ml)
Conc. of
CAM serial
sol. (µg /ml)
Conc. of
MTZ
serial sol.
(µg /ml))
QC Conc.
of CAM
in serum
(µg /ml)
QC Conc.
of MTZ
in serum
(µg /ml)
S 8 0.03 1.0 1.0 9.0 0.150 0.900
S 9 0.30 1.0 00.5 90.0 1.500 9.000
S 10 0.48 1.0 20.0 144.0 2.400 14.400
2.7.8 Method of extraction
To 0.050 ml of serum sample, 500.0 μl of internal standard (2 µg/ml Clindamycin in
methanol) was added in a 1.50 ml eppendorf tube, vortex-mix for 2.0 min, centrifugation for
15 min at 14000 r.p.m., then the supernatant was transfered into auto-sampler vials.
All of the chromatographic and mass detector conditions are mentioned in (Table 5).

39
Table 5: Chromatographic and mass spectrometric conditions.
Column oven
temp/˚C
Auto-sampler
temp/˚C
Auto sampler
injection volume/
µl
Pump flow rate
mL/ min HPLC
conditions
45 4 5 1.0
Total
Time
FA 0.1% Methanol
Min. A% B%
0.00 100 0
0.50 100 0
0.51 0 100
1.50 0 100
1.51 100 0
3.00 100 0
Mobile phase
Chro
mat
ogra
phy
ACE C18 column (50 X 2.1 mm), 5µ Column type
Clindamycin (IS) MTZ CAM Retention times
(minutes)
1.62 0.27 1.69
CXP CE CEP EP DP Q3 Mass Q1 Mass Analytes MRM
detection
conditions
using
positive ion
mode
5 5 01 61 61 158.2 748.46 CAM
8 8 16 46 46 128.1 172.10 MTZ
5 5 30 71 71 126.3 425.2 Clindamycin
(IS)
TEM IS V GS 2 GS 1 CUR
MS conditions
550.0 5500.0 85 35 45

40
2.8 Analytical method validation
The validation of the method was performed in three separate days. In each day,
seven standard calibration levels (not including zero) was prepared. Serum samples of
method validation represented blank, zero, standard calibration curve, six replicates of
Quality Control (QC) samples (Q.C. Low, Q.C. Mid, and Q.C. High). The validation
parameters should not exceed the limits by the FDA Guidance for Industry.
2.8.1 Standard calibration curve and linearity
The linearity was measured by plotting the peak area ratio (analyte peak area/IS
peak area) versus nominal concentrations. The concentrations of all samples were
measured by fitting the obtained data (area ratio data) to a straight line equation. Three
calibration curves consisting of a blank, zero and seven non-zero standards prepared in
rat serum for each analyte were prepared.
The concentrations of calibration standards cover the range from LLOQ to the
highest expected concentration. The linearity was evaluated by the linear regression
(correlation coefficient, R²).
2.8.2 Intra-day accuracy and precision
Intra-day accuracy and precision was measured by analyzing six replicates for
each of QC level (Low, Mid and High) within the batch for both analytes (CAM and
MTZ).
2.8.3 Inter-day accuracy and precision
Six replicates for each QC levels (Low, Mid and High) in the batch of CAM and
MTZ were analyzed in three different days. Peak areas of all replicates of each
concentration were measured and concentrations were calculated by utilizing the
regression equation established on the corresponding day.

41
2.8.4 Sensitivity
The chromatografic response of LLOQ must be ≥ 5 times that of blank response
with accuracy 80-120% and precision ≤ 20%. Six replicates of LLOQ serum samples
were prepared along with the calibration curve.
2.8.5 Recovery
Serum samples containing concentration of QC Low, QC Mid and QC High
analytes were prepared in triplicate. The absolute peak areas obtained from injections of
the prepared serum standards were compared to the absolute peak areas of equivalent
mobile phase standards, which were prepared to contain a concentration of analytes
standard assuring 100% recovery, and same treatment for the IS. The recovery extent of
analytes and IS should be consistent, precise, and reproducible.
Recovery was performed by preparing triplicates from each QC level of serum
and triplicates from each QC level prepared in the mobile phase (FDA, 2001).
2.9 Preclinical study design
To find out the effect of PJ on CAM, six groups of twelve hour fasted- rats (six
rats for each) were administered by a single dose of PJ (5ml/kg) and other four were
administered with DW as a control, 30 min before CAM administration for both.
In case of multiple dose PJ administration, the same group numbers of rats were
administered with PJ twice daily for two days then treated as well as the single dose
administration at the third day (i.e. day of the experiment). The same thing was carried
out to study the effect of single and multiple dose administration of PJ on MTZ. Four
groups for each study were treated at the same manner with two groups administered with
DW as controls.
To study the effect of CAM-MTZ combination on the pharmacokinetic profile of
each drug, the solutions of the drugs were prepared and mixed to be administered orally
in a single dose.

42
The blood sampling was pooled from the rat’s tails along the experiment at a
specific time intervals (0, 0.50, 1.0, 2.0, 3.0, 4.0, and 6.0 hours). The blood samples were
centrifuged for 5 minutes to obtain the serum (100-125 µl) which was placed in labeled
eppendorf tubes and stored in freezer at (-30C°) until the time of analysis.

43
Chapter 3
Results and Discussion

44
3. Results and Discussion
3.1 HPLC/MS analytical method
The analytical method is one or even the most critical step in the pharmaceutical
research for determination of the drug plasma concentration and identifying its
pharmacokinetic profile (Karen and Liyuan, 2005).
HPLC has a number of advantages over other types of chromatography. Therefore,
almost all class of organic compounds can be separated by HPLC (Dennis J.R., 1981;
Hamilton R.J. and Sewell P.A., 1982) with a better separation (greater resolution) of the
substances in a mixture and much shorter analytical time (much faster) (Hamilton R.J. and
Sewell P.A., 1982).
The other thing that should be mentioned is the detection method. The method
used in this study for the detection of CAM and MTZ is the mass spectrometry which is a
greatly automated and a highly sensitive method of detection.
As a result, the combination between the separation capacity of HPLC along with
the sensitivity and specificity of MS is considered one of the most powerful technologies
for identification and quantification of drug substances (Baldwin M.A. and Mclafferty
F.W., 1973).
In the current study, the analytical method used was validated partially depending
on other previously worked methods (By Jiang Y. and others in 2007, Shin J. et al., 2008,
and Sagan C. et al., 2005). According to our knowledge, this is the first time that a single
and simple analytical method by HPLC/MS was used for quantification of both CAM and
MTZ present in the same biological fluid (rat plasma) with a single extraction method
using protein precipitation, It is sensitive with small plasma sample volume since most of
the published methods used 0.3-1 ml of human plasma and are not verified for preclinical
animal study with rat or mice where less than 0.3 ml is usually obtainable for each
plasma sample. Furthermore, the method has relatively less overall time of analysis and it
passed the validation process according to the European Medicines Agency guideline
2011 and USFDA.

45
3.2 Validation
Validation of this analytical HPLC-MS method was performed in order to be
evaluated in terms of recovery, linearity of response, precision, accuracy, and sensitivity
for quantification of CAM and MTZ.
3.2.1 Validation of day one, two, and three on linearity, accuracy, and precision data
for Clarithromycin quantification
According to USFDA, the coefficient of determination (R²) should be equal or more than
0.98 and for accuracy are 85.00-115.00% except for the LLOQ is 80.00-120% to be
within the accepted criteria
Inter and intraday accuracy, precision and linear response for standard calibration curve
and QC samples of the three days validation are explained in the following tables and
figures:
First day of validation: (Table 6) represents the standard calibration curve and intra-day
accuracy data, shows an accuracy range of 97.8% - 114.0%.
As shown in (Figure 3), R² is 0.998, which represents the strength of the correlation;
therefore, the correlation coefficient of standard calibration curve was consistently
greater than 0.99 during the validation course. Data of the standard curve with regards to
correlation, slope, R², and intercept for day one are showed in (Table 7).
Therefore, first day of validation results passed the required criteria in terms of linearity
and accuracy.

46
Table 6: Standard calibration curve of the first day of validation, intraday accuracy
data for Clarithromycin.
Theoretical Conc.
(µg/ml)
AUC
Drug AUC IS
AUC
Ratio*
Measured**
Conc. Accuracy%
0.050 17215 5897684 0.0029 0.056 112.0
0.100 37167 6267839 0.0059 0.114 114.0
0.200 74329 6347561 0.0117 0.227 113.5
0.400 140263 6195427 0.0226 0.440 110.0
1.000 351102 6179643 0.0568 1.106 110.6
2.000 647036 6415592 0.1009 1.966 98.3
3.000 964257 6406864 0.1505 2.933 97.8
*AUC Ratio=AUC Drug/AUC IS.
**Measured concentration= (AUC Ratio/0.0513) - (+ 0.000939).
Table 7: Data of the standard curve with regards to correlation, slope, R², and
intercept on the first day for Clarithromycin.
Correlation (R) Slope R² Intercept
0.9990 0.0513 0.998 + 0.000939

47
Figure 3: Plot of calibration curve levels against their analytical response and
regression linear equation on the first day of validation for Clarithromycin.
Second day of validation: (Table 8) represents the standard calibration curve and intra-
day accuracy data, shows an accuracy range of 99.6% - 114.0%.
As shown in (Figure 4), R² is 0.9994. Therefore, the correlation coefficient of standard
calibration curve was consistently greater than 0.99 during the validation course. Data of
the standard curve with regards to correlation, slope, R², and intercept for day two are
showed in (Table 8). Therefore, second day of validation results passed the required
criteria in terms of linearity and accuracy.
Untitled 1 (Clarthromycin): "Linear" Regression ("1 / x" weighting): y = 0.0513 x + 0.000939 (r = 0.9990)
0.2 0.4 0.6 0.8 1.0 1.2 1.4 1.6 1.8 2.0 2.2 2.4 2.6 2.8 3.0Analyte Conc. / IS Conc.
0.00
0.01
0.02
0.03
0.04
0.05
0.06
0.07
0.08
0.09
0.10
0.11
0.12
0.13
0.14
0.15
An
aly
te
A
re
a / IS
A
re
a
Y= 0.0513 X + 0.000939
R² = 0.998

48
Table 8: Standard calibration curve of the second day of validation, intraday
accuracy data for Clarithromycin.
Theoretical Conc.
(µg/ml)
AUC
Drug AUC IS
AUC
Ratio*
Measured
Conc.** Accuracy%
0.050 15966 5503867 0.0029 0.057 114.0
0.100 36677 6570848 0.0056 0.110 110.0
0.200 74011 6428513 0.0115 0.227 113.5
0.400 131290 6245771 0.0210 0.416 104.0
1.000 316003 6245756 0.0506 1.003 100.3
2.000 646257 6315327 0.1023 2.030 101.5
3.000 963145 6396975 0.1506 2.987 99.6
*AUC Ratio=AUC Drug/AUC IS.
**Measured concentration= (AUC Ratio/0.0504) - (+ 0.000723).
Table 9: Data of the standard curve with regards to correlation, slope, R², and
intercept on the second day for Clarithromycin.
Correlation (R) Slope R² Intercept
0.9997 0.0504 0.9994 + 0.000723

49
Figure 4: Plot of calibration curve levels against their analytical response and
regression linear equation on the second of validation for Clarithromycin.
Third day of validation: As seen in (Table 10) which represents the standard calibration
curve and intra-day accuracy data, shows an accuracy range of 97.4% - 114.0%.
As shown in (Figure 5), R² is 0.9986. The correlation coefficient of standard calibration
curve was consistently greater than 0.99 during the validation course. Data of the
standard curve with regards to correlation, slope, R², and intercept for day three are
showed in (Table 11).
Therefore, third day of validation results passed the required criteria in terms of linearity
and accuracy.
Untitled 1 (Clarthromycin): "Linear" Regression ("1 / x" weighting): y = 0.0504 x + 0.000723 (r = 0.9997)
0.2 0.4 0.6 0.8 1.0 1.2 1.4 1.6 1.8 2.0 2.2 2.4 2.6 2.8 3.0Analyte Conc. / IS Conc.
0.00
0.01
0.02
0.03
0.04
0.05
0.06
0.07
0.08
0.09
0.10
0.11
0.12
0.13
0.14
0.15
An
aly
te
A
re
a / IS
A
re
a
Y= 0.0504X + 0.000723
R² = 0.9994

50
Table 10: Standard calibration curve of the third day of validation, intraday
accuracy data for Clarithromycin.
Theoretical Conc.
(µg/ml)
AUC
Drug AUC IS
AUC
Ratio*
Measured
Conc.** Accuracy%
0.050 16791 5661449 0.0030 0.057 114.0
0.100 35950 6516796 0.0055 0.105 105.0
0.200 65591 5697514 0.0115 0.221 110.5
0.400 132613 5646446 0.0235 0.454 113.5
1.000 320902 5983464 0.0536 1.036 103.6
2.000 646257 6072650 0.1064 2.057 102.9
3.000 931803 6168402 0.1511 2.922 97.4
*AUC Ratio=AUC Drug/AUC IS.
**Measured concentration= (AUC Ratio/0.0517) - (+ 0.000959).
Table 11: Data of the standard curve with regards to correlation, slope, R², and
intercept on the third day for Clarithromycin.
Correlation (R) Slope R² Intercept
0.9993 0.0517 0.9986 + 0.000959

51
Figure 5: Plot of calibration curve levels against their analytical response and
regression linear equation on the third day of validation for Clarithromycin.
The linearity and linear working range of three standard curves of CAM data based on
the calculated area ratio (obtained from three days of validation) are showed in (Table
12).
The linearity and linear working range of three standard curves of CAM data based on
the measured concentrations (obtained from three days of validation) are showed in
(Table 13). Data of three standard curves with regards to correlation, slope, R², and
intercept are showed in (Table 14).
The plot of linearity of calibration curve levels for CAM quantification against their
analytical response and regression linear equation that represents the all three days of
validation was done by plotting the calculated mean of the measured concentrations
Untitled 1 (Clarthromycin): "Linear" Regression ("1 / x" weighting): y = 0.0517 x + 0.000959 (r = 0.9993)
0.2 0.4 0.6 0.8 1.0 1.2 1.4 1.6 1.8 2.0 2.2 2.4 2.6 2.8 3.0Analyte Conc. / IS Conc.
0.00
0.01
0.02
0.03
0.04
0.05
0.06
0.07
0.08
0.09
0.10
0.11
0.12
0.13
0.14
0.150.15
An
aly
te
A
re
a / IS
A
re
a
Y= 0.0517X + 0.000959
R² = 0.9986

52
versus the calculated mean of the AUC ratio for each standard point showed in (Figure
6).
Table 12: Linearity and linear working range of three standard curves of
Clarithromycin data based on the calculated area ratio.
Calibration
curve
AUC Ratio for each Standard Point
0.050 0.100 0.200 0.400 1.000 2.000 3.000
1 0.0029 0.0059 0.0117 0.0226 0.0568 0.1009 0.1505
2 0.0029 0.0056 0.0115 0.021 0.0506 0.1023 0.1506
3 0.003 0.0055 0.0115 0.0235 0.0536 0.1064 0.1511
Mean 0.00293 0.00567 0.01157 0.02237 0.05367 0.10320 0.15073
STDV 0.00005 0.0002 0.00011 0.0012 0.0031 0.0028 0.0003
CV% 1.97 3.67 1.00 5.66 5.78 2.77 0.21
Min 0.0029 0.0055 0.0115 0.021 0.0506 0.1023 0.1505
Max 0.0033 0.0059 0.0117 0.0235 0.0568 0.1064 0.1511
Table 13: Linearity and linear working range of three standard curves of
Clarithromycin data based on the measured concentrations.
Calibration
curve Measured Concentrations for each Standard Point (µg/ml)
0.050 0.100 0.200 0.400 1.000 2.000 3.000
1 0.056 0.114 0.227 0.440 1.106 1.966 2.933
2 0.057 0.110 0.227 0.416 1.003 2.030 2.987
3 0.057 0.105 0.221 0.454 1.036 2.057 2.922
Mean 0.057 0.110 0.225 0.437 1.048 2.018 2.947
STDV 0.002 0.0043 0.003 0.018 0.052 0.047 0.035
CV% 3.61 3.95 1.45 4.31 5.05 2.34 1.19
Min 0.056 0.105 0.221 0.416 1.003 1.966 2.922
Max 0.057 0.114 0.227 0.454 1.106 2.057 2.987
Table 14: Data of three standard curves with regards to correlation, slope, R², and
intercept for Clarithromycin.
Correlation (R) Slope R² Intercept
0.9993 0.0511 0.9986 + 0.0000234

53
Figure 6: Plot of linearity of calibration curve levels for Clarithromycin
quantification against their analytical response and regression linear equation.
(Table 15) represents intra-day precision and accuracy data for QC low samples based on
the standard calibration curve of the first day of validation. Accuracy range and precision
(CV %) for the six replicates of QC low samples was (93.3-112.6%) and (6.96%),
respectively. Six replicates QC mid samples of the first day of validation with accuracy
range and precision (97.5-108.3%) and (3.99%), respectively, are represented in (Table
16), while six replicates QC high samples of the same day with accuracy range and
precision (100.7-111.8%) and (4.31%), respectively, are represented in (Table 17). (Table
18) represents intra-day precision and accuracy data for LLOQ samples based on the
standard calibration curve of the first day of validation which shows accuracy range and
precision of (92.0-112.0%) and (7.23%), respectively.
0
0.02
0.04
0.06
0.08
0.1
0.12
0.14
0.16
0 0.5 1 1.5 2 2.5 3 3.5
AU
C m
ean
rati
o
Measured mean conc. µg/ml
Y= 0.0511X + 0.0000234
R² = 0.9986

54
Table 15: Intra-day precision and accuracy data for QC low samples of
Clarithromycin based on the standard calibration curve of the first
day of validation.
QC Low
Concentration
(µg/ml)
AUC
Drug AUC IS
AUC
Ratio*
Measured
Conc.** Accuracy%
0.150
51764 6220184 0.008322 0.161 107.3
53783 6340189 0.008483 0.164 109.3
46329 6401632 0.007237 0.140 93.3
50328 6534218 0.007702 0.149 99.3
56382 6455893 0.008733 0.169 112.6
47915 6137849 0.007806 0.151 100.6
Mean 51083.5 6348328 0.008047 0.156 103.7
STDV 3715.90 148159 0.00056 0.0108 7.22
CV% 7.27 2.33 6.96 6.96 6.96
*AUC Ratio=AUC Drug/AUC IS.
**Measured concentration= (AUC Ratio/0.0513) - (+ 0.000939).
Table 16: Intra-day precision and accuracy data for QC mid samples of
Clarithromycin based on the standard calibration curve of the first
day of validation.
QC Mid
Concentration
(µg/ml)
AUC
Drug AUC IS
AUC
Ratio*
Measured
Conc.** Accuracy%
1.500
476454 5824335 0.0818 1.593 106.2
485998 5830321 0.0834 1.624 108.3
482907 6278512 0.0769 1.498 99.9
381437 5081599 0.0751 1.462 97.5
428523 5483770 0.0781 1.521 101.4
457033 5888404 0.0776 1.511 100.7
Mean 452058 5731157 0.0788 1.535 102.3
STDV 40656 406440 0.0031 0.0612 4.08
CV% 8.99 7.09 3.98 3.99 3.99
*AUC Ratio=AUC Drug/AUC IS.
**Measured concentration= (AUC Ratio/0.0513) - (+ 0.000939).

55
Table 17: Intra-day precision and accuracy data for QC high samples of
Clarithromycin based on the standard calibration curve of the first day
of validation.
QC High
Concentration
(µg/ml)
AUC
Drug AUC IS
AUC
Ratio*
Measured
Conc.** Accuracy%
2.400
758735 5750984 0.13193 2.570 107.1
855695 6216832 0.13764 2.682 111.8
874297 6415503 0.13628 2.656 110.6
735505 5929764 0.12404 2.416 100.7
743441 5772968 0.12878 2.509 104.5
772850 6166853 0.12532 2.441 101.7
Mean 790087 6042151 0.1307 2.546 106.1
STDV 54514 266580 0.0081 0.1098 4.58
CV% 6.90 4.41 6.20 4.31 4.32
*AUC Ratio=AUC Drug/AUC IS.
**Measured concentration= (AUC Ratio/0.0513) - (+ 0.000939).
Table 18: Intra-day precision and accuracy data for LLOQ samples of
Clarithromycin based on the standard calibration curve of the first
day of validation.
LLOQ
Concentration
(µg/ml)
AUC
Drug AUC IS
AUC
Ratio*
Measured
Conc.** Accuracy%
0.050
17215 5897684 0.0029 0.056 112.0
18867 6684532 0.0028 0.054 108.0
16668 6998547 0.0024 0.046 92.0
19885 6794469 0.0029 0.056 112.0
20331 6898665 0.0029 0.056 112.0
17955 6442379 0.0028 0.054 108.0
Mean 18932 6765522 0.0028 0.054 107.3
STDV 1404.3 191795.6 0.0002 0.0039 7.76
CV% 7.42 2.83 7.69 7.23 7.23
*AUC Ratio=AUC Drug/AUC IS.
**Measured concentration= (AUC Ratio/0.0513) - (+ 0.000939).

56
Intra-day precision and accuracy data for QC low samples based on the standard
calibration curve of the second day of validation are represented in (Table 19). Accuracy
range and precision (CV %) for the six replicates of QC low samples was (94.7-106.7%)
and (4.54%), respectively. Six replicates QC mid samples of the second day of validation
with accuracy range and precision (92.0-111.3%) and (7.56%), respectively, are
represented in (Table 20), while six replicates QC high samples of the same day with
accuracy range and precision (100.5-108.8%) and (2.84%), respectively, are represented
in (Table 21). (Table 22) shows intra-day precision and accuracy data for LLOQ samples
based on the standard calibration curve of the second day of validation which shows
accuracy range and precision of (86.0-114.0%) and (12.24%), respectively.
Table 19: Intra-day precision and accuracy data for QC low samples of
Clarithromycin based on the standard calibration curve of the second
day of validation.
QC Low
Concentration
(µg/ml)
AUC
Drug AUC IS
AUC
Ratio*
Measured
Conc.** Accuracy%
0.150
53287 6577321 0.00810 0.160 106.7
52246 6578894 0.00794 0.157 104.7
50955 6643784 0.00767 0.151 100.7
52214 6996458 0.00746 0.147 98.0
50334 6988646 0.00720 0.142 94.7
51134 6445994 0.00793 0.157 104.7
Mean 51695 6705183 0.00772 0.152 101.6
STDV 1079.08 231706 0.000340 0.0069 4.62
CV% 2.09 3.46 4.40 4.54 4.55
*AUC Ratio=AUC Drug/AUC IS.
**Measured concentration= (AUC Ratio/0.0504) - (+ 0.000723).

57
Table 20: Intra-day precision and accuracy data for QC mid samples of
Clarithromycin based on the standard calibration curve of the second
day of validation.
QC Mid
Concentration
(µg/ml)
AUC
Drug AUC IS
AUC
Ratio*
Measured
Conc.** Accuracy%
1.500
486322 5965362 0.08152 1.627 108.5
452371 6364186 0.07108 1.415 94.3
399786 5283746 0.07566 1.500 100.0
432873 5477542 0.07903 1.567 104.5
389659 5598234 0.06960 1.380 92.0
457985 5443276 0.08414 1.669 111.3
Mean 436499 5688724 0.07684 1.526 101.8
STDV 36744.7 402446.4 0.00578 0.1154 7.72
CV% 8.42 7.07 7.52 7.56 7.59
*AUC Ratio=AUC Drug/AUC IS.
**Measured concentration= (AUC Ratio/0.0504) - (+ 0.000723).
Table 21: Intra-day precision and accuracy data for QC high samples of
Clarithromycin based on the standard calibration curve of the second
day of validation.
QC High
Concentration
(µg/ml)
AUC
Drug AUC IS
AUC
Ratio*
Measured
Conc.** Accuracy%
2.400
835469 6387239 0.1308 2.594 108.1
834592 6488693 0.1286 2.550 106.3
789215 5994768 0.1317 2.612 108.8
823954 6772398 0.1217 2.413 100.5
788239 6233975 0.1264 2.507 104.5
774853 5993475 0.1293 2.564 106.8
Mean 807720 6311758 0.1281 2.54 105.8
STDV 26675 302334 0.0036 0.0721 3.01
CV% 3.30 4.79 2.83 2.84 2.84
*AUC Ratio=AUC Drug/AUC IS.
**Measured concentration= (AUC Ratio/0.0504) - (+ 0.000723).

58
Table 22: Intra-day precision and accuracy data for LLOQ samples of
Clarithromycin based on the standard calibration curve of the second
day of validation.
LLOQ
Concentration
(µg/ml)
AUC
Drug AUC IS
AUC
Ratio*
Measured
Conc.** Accuracy%
0.050
15966 5503867 0.0029 0.057 114.0
17885 8005683 0.00223 0.044 88.0
16657 6774352 0.00246 0.048 96.0
19976 7055211 0.00283 0.055 110.0
17334 7556894 0.00229 0.045 90.0
17722 7999542 0.00222 0.043 86.0
Mean 18242 7398212 0.00248 0.049 97.3
STDV 1372.2 533507 0.00029 0.0060 11.91
CV% 7.52 7.21 11.68 12.24 12.24
*AUC Ratio=AUC Drug/AUC IS.
**Measured concentration= (AUC Ratio/0.0504) - (+ 0.000723).
(Table 23) represents intra-day precision and accuracy data for QC low samples based on
the standard calibration curve of the third day of validation. Accuracy range and precision
for the six replicates of QC low samples was (95.3-110.7%) and (5.72%), respectively.
(Table 24) shows six replicates QC mid samples of the third day of validation with
accuracy range and precision (91.7-111.9%) and (7.55%), respectively, while six
replicates QC high samples of the same day with accuracy range and precision (96.5-
107.6%) and (4.12%), respectively showed in (Table 25). (Table 26) represents intra-day
precision and accuracy data for LLOQ samples based on the standard calibration curve of
the third day of validation which shows accuracy range and precision of (89.3-112.82%)
and (8.75%), respectively.

59
Table 23: Intra-day precision and accuracy data for QC low samples of
Clarithromycin based on the standard calibration curve of the third day of
validation.
QC Low
Concentration
(µg/ml)
AUC
Drug AUC IS
AUC
Ratio*
Measured
Conc.** Accuracy%
0.150
56437 6557349 0.0086 0.166 110.7
54332 6653412 0.0082 0.157 104.7
51124 6778431 0.0075 0.145 96.7
50441 6788423 0.0074 0.143 95.3
51784 6577433 0.0079 0.151 100.7
50889 6645986 0.0077 0.147 98.0
Mean 52501.17 6666839 0.0079 0.152 101.0
STDV 2370.53 97808.05 0.00044 0.0087 5.79
CV% 4.52 1.47 5.61 5.72 5.74
*AUC Ratio=AUC Drug/AUC IS.
**Measured concentration= (AUC Ratio/0.0517) - (+ 0.000959).
Table 24: Intra-day precision and accuracy data for QC mid samples of
Clarithromycin based on the standard calibration curve of the third
day of validation.
QC Mid
Concentration
(µg/ml)
AUC
Drug AUC IS
AUC
Ratio*
Measured
Conc.** Accuracy%
1.500
486579 6439865 0.07555 1.460 97.3
496647 5779834 0.08592 1.661 110.7
482245 5553783 0.0868 1.678 111.9
459482 6457738 0.07115 1.375 91.7
473387 5985634 0.07908 1.529 101.9
497834 6125655 0.08127 1.571 104.7
Mean 482696 6057085 0.0800 1.546 103.0
STDV 14591.90 359730 0.0060 0.117 7.78
CV% 3.02 5.94 7.55 7.55 7.55
*AUC Ratio=AUC Drug/AUC IS.
**Measured concentration= (AUC Ratio/0.0517) - (+ 0.000959).

60
Table 25: Intra-day precision and accuracy data for QC high samples of
Clarithromycin based on the standard calibration curve of the third
day of validation.
QC High
Concentration
(µg/ml)
AUC
Drug AUC IS
AUC
Ratio*
Measured
Conc.** Accuracy%
2.400
865398 6478397 0.13358 2.583 107.6
794468 6164853 0.12887 2.492 103.8
803894 6048216 0.13291 2.578 107.4
759278 6338941 0.11978 2.316 96.5
783291 6049352 0.12948 2.503 104.3
769935 6166853 0.12485 2.414 100.6
Mean 796044 6207769 0.1282 2.50 103.4
STDV 37604 170009 0.0052 0.100 4.24
CV% 4.72 2.74 4.06 4.12 4.11
*AUC Ratio=AUC Drug/AUC IS.
**Measured concentration= (AUC Ratio/0.0517) - (+ 0.000959).
Table 26: Intra-day precision and accuracy data for LLOQ samples of
Clarithromycin based on the standard calibration curve of the third day of
validation.
LLOQ
Concentration
(µg/ml)
AUC
Drug AUC IS
AUC
Ratio*
Measured
Conc.** Accuracy%
0.050
16791 5661449 0.003 0.056 112.0
20563 6974459 0.0029 0.056 112.0
18995 7056942 0.0027 0.051 102.0
16943 6743285 0.0025 0.048 96.0
17056 6630893 0.0026 0.049 98.0
16799 7122894 0.0024 0.045 90.0
Mean 18377 6862394 0.0027 0.051 101.7
STDV 1660 215833 0.0003 0.0044 8.89
CV% 9.04 3.15 9.36 8.75 8.75
*AUC Ratio=AUC Drug/AUC IS.
**Measured concentration= (AUC Ratio/0.0517) - (+ 0.000959).

61
Comparing with the accepted criteria for QC levels which is 85.0-115% and for LLOQ
range which should be 80-120%, the accuracy and LLOQ range data obtained from the
first, second, and third day of validation for quantification of Clarithromycin are within
the required range. In addition, precision (CV%) is not exceed 20% for LLOQ, and 15%
for the other concentrations which prove the closeness of the measurements when
repeatedly applied the method of analysis to multiple aliquots of a single homogenous
volume of the serum.
(Table 27) represents Inter-day accuracy and precision for the quality control samples of
CAM in the three days of validation. All of the obtained accuracy and precision data are
within the required range.

62
2.4
00 µ
g/m
l Q
C h
igh
Day t
hre
e
2.5
83
2.4
92
2.5
78
2.3
16
2.5
03
2.4
14
2.5
22
0.0
944
3.7
4
105.1
Day t
wo
2.5
94
2.5
50
2.6
12
2.4
13
2.5
07
2.5
64
Day o
ne
2.5
70
2.6
82
2.6
55
2.4
16
2.5
09
2.4
41
1.5
00 µ
g/m
l Q
C m
id
Day t
hre
e
1.4
60
1.6
61
1.6
78
1.3
75
1.5
29
1.5
71
1.5
40
0.0
951
6.2
0
102.7
Day t
wo
1.6
27
1.4
15
1.5
00
1.5
67
1.3
80
1.6
69
Day o
ne
1.5
93
1.6
24
1.4
98
1.4
62
1.5
21
1.5
11
0.1
50 µ
g/m
l Q
C l
ow
Day t
hre
e
0.1
66
0.1
57
0.1
45
0.1
43
0.1
51
0.1
47
0.1
53
0.0
086
5.6
2
102.0
Day t
wo
0.1
6
0.1
57
0.1
51
0.1
47
0.1
42
0.1
57
Day o
ne
0.1
61
0.1
64
0.1
4
0.1
49
0.1
69
0.1
51
Mea
sure
d
con
c.
Mea
n
ST
DV
CV
%
Acc
ura
cy
%
Tab
le 2
7:
Inte
r-d
ay a
ccu
racy
an
d p
reci
sion
for
the
qu
ali
ty c
on
trol
sam
ple
s of
Cla
rith
rom
yci
n i
n t
he
thre
e d
ays
of
vali
dati
on

63
3.2.2 Recovery data for Clarithromycin quantification
The recovery of CAM from its biological matrix in this analytical method showed a high
value and good result.
(Table 28) shows data of triplicate quality control samples of CAM in the mobile phase
while (Table 29) shows data of triplicate quality control samples of CAM in the serum.
Absolute recoveries for CAM and IS were calculated by dividing average peak area of
triplicate from each QC level of serum samples (Table 29) over the same set of QC
samples that were prepared in mobile phase (Table 28) multiplied by 100%.
(Table 30) shows recovery % of CAM and (Table 31) shows recovery % of IS which
shows a high recovery % and acceptable at the studied concentration.
Table 28: Data of Clarithromycin and IS in the mobile phase for the quality
control samples.
concentration
µg/ml
AUC
CAM AUC IS
Mean
CAM
CAM
C.V.% Mean IS
IS
C.V.%
0.150
QC low
51784 6577433
51491
0.84
6587065
0.17
51693 6598835
50997 6584926
1.500
QC mid
398239 5182495
388828
2.37
5171893
1.31
379854 5099386
388392 5233798
2.400
QC high
833528 6966834
839876
0.78
6929894
1.01
846623 6849264
839476 6973584

64
Table 29: Data of Clarithromycin and IS in serum for the quality control
samples.
concentration
µg/ml
AUC
CAM AUC IS
Mean
CAM
CAM
CV% Mean IS
IS
CV%
0.150
QC low
50945 6498694
52563
2.82
6607380
1.80
52889 6589452
53856 6733994
1.500
QC mid
379436 5094758
392445
2.98
5533726
12.23
402116 5193485
395783 6312935
2.400
QC mid
819574 6719845
820975
1.50
6782286
2.00
833964 6692378
809387 6934635
Table 30: Recovery % for Clarithromycin.
concentration
µg/ml Mean serum
Mean mobile
phase
Recovery
%
0.150 QC low 52563 51491 102.1
1.500 QC mid 392445 388828 100.9
2.400 QC high 820975 839876 97.8
Table 31: Recovery % for Clindamycin (IS).
concentration
µg/ml Mean serum
Mean mobile
phase
Recovery
%
0.150 QC low 6607380 6587065 100.3
1.500 QC mid 5533726 5171893 107.0
2.400 QC high 6782286 6929894 97.9

65
3.2.3 Validation of day one, two, and three on linearity, accuracy, and precision data
for Metronidazole quantification
Inter and intraday accuracy, precision and linear response for standard calibration curve
and QC samples of the three days validation are explained in the following tables and
figures:
The first day of validation: (Table 32), which represents the standard calibration curve
and intra-day accuracy data, shows an accuracy range of 91.4% - 113.2%.
As shown in (Figure 7), R² is 0.998 which represents the strength of the correlation;
therefore, the correlation coefficient of standard calibration curve was consistently
greater than 0.99 during the validation course. Data of the standard curve with regards to
correlation, slope, R², and intercept for day one are showed in (Table 33).
Therefore, first day of validation results passed the required criteria in terms of linearity
and accuracy.
Table 32: Standard calibration curve of the first day of validation, intraday
accuracy data for Metronidazole.
Theoretical
Concentration(µg/ml)
AUC
Drug AUC IS
AUC
Ratio*
Measured
Conc.** Accuracy%
0.300 10078 6734583 0.0015 0.327 109.0
0.600 19655 6409582 0.0031 0.679 113.2
1.200 31563 6255687 0.0050 1.097 91.4
2.400 75348 6537849 0.0115 2.525 105.2
6.000 185674 6249211 0.0297 6.525 108.8
12.000 361388 6317961 0.0572 12.569 104.7
18.000 534114 6400159 0.0835 18.349 101.9
*AUC Ratio=AUC Drug/AUC IS.
**Measured concentration= (AUC Ratio/0.00455)-(+ 0.00223).

66
Table 33: Data of the standard curve with regards to correlation, slope, R², and
intercept on the first day for Metronidazole.
Correlation (R) Slope R² Intercept
0.9997 0.00455 0.9994 + 0.00223
Figure 7: Plot of calibration curve levels against their analytical response and
regression linear equation on the first day of validation for Metronidazole.
Second day of validation: (Table 34), which represents the standard calibration curve
and intra-day accuracy data, shows an accuracy range of 95.3% - 111.8%.
As shown in (Figure 8), R² is 0.9994 which represents the strength of the correlation;
therefore, the correlation coefficient of standard calibration curve was consistently
greater than 0.99 during the validation course. Data of the standard curve with regards to
correlation, slope, R², and intercept for day two are showed in (Table 35).
Therefore, second day of validation results passed the required criteria in terms of
linearity and accuracy.
Metro.rdb (Metronidazole): "Linear" Regression ("1 / x" weighting): y = 0.00455 x + 0.00223 (r = 0.9997)
1.0 2.0 3.0 4.0 5.0 6.0 7.0 8.0 9.0 10.0 11.0 12.0 13.0 14.0 15.0 16.0 17.0 18.0Analyte Conc. / IS Conc.
0.000
5.000e-3
0.010
0.015
0.020
0.025
0.030
0.035
0.040
0.045
0.050
0.055
0.060
0.065
0.070
0.075
0.080
0.085
An
aly
te
A
re
a / IS
A
re
a
Y= 0.00455X + 0.00223
R² = 0.9994

67
Table 34: Standard calibration curve of the second day of validation, intraday
accuracy data for Metronidazole.
Theoretical
Concentration(µg/ml)
AUC
Drug AUC IS
AUC
Ratio*
Measured
Conc.** Accuracy%
0.300 7994 6165389 0.0013 0.286 95.3
0.600 16593 6001875 0.0028 0.616 102.7
1.200 36784 6073088 0.0061 1.341 111.8
2.400 64678 5902473 0.0110 2.418 100.8
6.000 199657 6886542 0.0290 6.374 106.2
12.000 344482 6086392 0.0566 12.440 103.7
18.000 516278 6123078 0.0843 18.528 102.9
*AUC Ratio=AUC Drug/AUC IS.
**Measured concentration= (AUC Ratio/0.00455)-(-0.000722).
Table 35: Data of the standard curve with regards to correlation, slope, R², and
intercept on the second day for Metronidazole.
Correlation (R) Slope R² Intercept
0.9997 0.00479 0.9994 -0.000722

68
Figure 8: Plot of calibration curve levels against their analytical response and
regression linear equation on the second day of validation for Metronidazole.
Third day of validation: (Table 36) represents the standard calibration curve and intra-
day accuracy data with accuracy range of 82.0% - 106.0%.
As shown in (Figure 9), R² is 0.9994 which represents the strength of the correlation;
therefore, the correlation coefficient of standard calibration curve was consistently
greater than 0.99 during the validation course. Data of the standard curve with regards to
correlation, slope, R², and intercept for the third day are showed in (Table 37).
Therefore, third day of validation results passed the required criteria in terms of linearity
and accuracy.
Metro.rdb (Metronidazole): "Linear" Regression ("1 / x" weighting): y = 0.00479 x + -0.000722 (r = 0.9997)
1.0 2.0 3.0 4.0 5.0 6.0 7.0 8.0 9.0 10.0 11.0 12.0 13.0 14.0 15.0 16.0 17.0 18.0Analyte Conc. / IS Conc.
0.000
5.000e-3
0.010
0.015
0.020
0.025
0.030
0.035
0.040
0.045
0.050
0.055
0.060
0.065
0.070
0.075
0.080
0.085
An
aly
te
A
re
a / IS
A
re
a
Y= 0.00479X -0.000722
R² = 0.9994

69
Table 36: Standard calibration curve of the third day of validation, intraday
accuracy data for Metronidazole.
Theoretical
Concentration(µg/ml)
AUC
Drug AUC IS
AUC
Ratio*
Measured
Conc.** Accuracy%
0.300 8657 5443797 0.0016 0.318 106.0
0.600 16578 5673489 0.0029 0.576 96.0
1.200 29975 5376784 0.0056 1.112 92.7
2.400 63831 5512811 0.0116 2.302 95.9
6.000 161734 5686025 0.0284 4.921 82.0
12.000 351187 5802255 0.0605 12.004 100.0
18.000 520368 5794392 0.0898 17.818 99.0
*AUC Ratio=AUC Drug/AUC IS.
**Measured concentration= (AUC Ratio/0.00504)-(-0.000761).
Table 37: Data of the standard curve with regards to correlation, slope, R², and
intercept on the third day for Metronidazole.
Correlation (R) Slope R² Intercept
0.9998 0.00504 0.9996 -0.000761

70
Figure 9: Plot of calibration curve levels against their analytical response and
regression linear equation on the third day of validation for Metronidazole.
The linearity and linear working range of three standard curves of MTZ data based on the
calculated mean area ratio are showed in (Table 38).
The linearity and linear working range of three standard curves of MTZ data based on the
measured mean concentrations are showed in (Table 39).
Data of three standard curves with regards to correlation, slope, R², and intercept are
showed in (Table 40).
The plot of linearity of calibration curve levels for MTZ quantification against their
analytical response and regression linear equation that represents the all three days of
validation was done by plotting the calculated mean of the measured concentrations
versus the calculated mean of the AUC ratio for each standard point showed in (Figure
10).
Metro.rdb (Metronidazole): "Linear" Regression ("1 / x" weighting): y = 0.00504 x + -0.000761 (r = 0.9998)
1.0 2.0 3.0 4.0 5.0 6.0 7.0 8.0 9.0 10.0 11.0 12.0 13.0 14.0 15.0 16.0 17.0 18.0Analyte Conc. / IS Conc.
0.000
5.000e-3
0.010
0.015
0.020
0.025
0.030
0.035
0.040
0.045
0.050
0.055
0.060
0.065
0.070
0.075
0.080
0.085
0.090
An
aly
te
A
re
a / IS
A
re
a
Y= 0.00504 X -0.000761
R² = 0.9996

71
Table 38: Linearity and linear working range of three standard curves of
Metronidazole data based on the calculated area ratio.
Calibration
curve
AUC Ratio for each Standard Point
0.300 0.600 1.200 2.400 6.000 12.000 18.000
1 0.0015 0.0031 0.005 0.0115 0.0297 0.0572 0.0835
2 0.0013 0.0028 0.0061 0.011 0.029 0.0566 0.0843
3 0.0016 0.0029 0.0056 0.0116 0.0284 0.0605 0.0898
Mean 0.00147 0.00293 0.00557 0.0113 0.02903 0.05810 0.08587
STDV 0.000153 0.000153 0.000551 0.0003 0.000651 0.0021 0.00343
CV% 10.41 5.21 9.89 2.83 2.24 3.61 3.99
Min 0.0013 0.0028 0.005 0.011 0.0284 0.0566 0.0835
Max 0.0016 0.0031 0.0061 0.0116 0.0297 0.0605 0.0898
Table 39: Linearity and linear working range of three standard curves of
Metronidazole data based on the measured concentrations.
Calibration
curve Measured Concentrations for each Standard Point (µg/ml)
0.300 0.600 1.200 2.400 6.000 12.000 18.000
1 0.327 0.679 1.097 2.525 6.525 12.569 18.349
2 0.286 0.616 1.341 2.418 6.374 12.440 18.528
3 0.318 0.576 1.112 2.302 4.921 12.004 17.818
Mean 0.310 0.624 1.183 2.415 5.940 12.338 18.232
STDV 0.0215 0.0519 0.1367 0.1115 0.8857 0.2961 0.3693
CV% 6.94 8.33 11.56 4.62 14.91 2.40 2.03
Min 0.286 0.576 1.097 2.302 4.921 12.004 17.818
Max 0.327 0.679 1.341 2.525 6.525 12.569 18.528
Table 40: Data of three standard curves with regards to correlation, slope, R², and
intercept for Metronidazole.
Correlation (R) Slope R² Intercept
0.9999 0.00479 0.9998 -0.0000262

72
Figure 10: Plot of linearity of calibration curve levels for Metronidazole
quantification against their analytical response and regression linear equation.
(Table 41) represents intra-day precision and accuracy data for QC low samples based on
the standard calibration curve of the first day of validation. Accuracy range and precision
for the six replicates of QC low samples was (87.7-114.4%) and (9.99%), respectively.
Six replicates QC mid samples of the first day of validation with accuracy range and
precision (100.6-113.3%) and (4.71%), respectively, are represented in (Table 42), while
six replicates QC high samples of the same day with accuracy range and precision
(101.0-113.7%) and (4.96%), respectively, are showed in (Table 43). (Table 44)
represents intra-day precision and accuracy data for LLOQ samples based on the standard
calibration curve of the first day of validation which shows accuracy range and precision
of (94.3-116.3%) and (8.33%), respectively.
0
0.01
0.02
0.03
0.04
0.05
0.06
0.07
0.08
0.09
0.1
0 2 4 6 8 10 12 14 16 18 20
AU
C m
ean
rati
o
Measured mean conc. µg/ml
Y= 0.00479X - 0.0000262
R² = 0.9998

73
Table 41: Intra-day precision and accuracy data for QC low samples of
Metronidazole based on the standard calibration curve of the first day
of validation.
QC Low
Concentration
(µg/ml)
AUC
Drug AUC IS
AUC
Ratio
Measured
Conc. Accuracy%
0.900
28942 6220408 0.0047 1.030 114.4
26841 6340504 0.0042 0.920 102.2
23951 6396856 0.0037 0.811 90.1
21779 6008885 0.0036 0.789 87.7
22795 6115044 0.0037 0.811 90.1
23889 6148965 0.0039 0.855 95.0
Mean 24700 6205110 0.0040 0.872 96.6
STDV 2682 144983 0.0004 0.0863 10.1413
CV% 10.86 2.34 9.88 9.99 10.50
*AUC Ratio=AUC Drug/AUC IS.
**Measured concentration= (AUC Ratio/0.00455)-(+ 0.00223).
Table 42: Intra-day precision and accuracy data for QC mid samples of
Metronidazole based on the standard calibration curve of the first day
of validation.
QC Mid
Concentration
(µg/ml)
AUC
Drug AUC IS
AUC
Ratio
Measured
Conc. Accuracy%
9.000
279052 6112169 0.0457 10.041 111.6
256425 6231150 0.0412 9.053 100.6
273837 6448959 0.0425 9.338 103.8
289898 6245967 0.0464 10.196 113.3
268894 6077803 0.0442 9.712 107.9
265766 6289319 0.0423 9.294 103.2
Mean 272312 6234228 0.0437 9.600 106.7
STDV 11523 133161 0.00208 0.4500 5.0442
CV% 4.23 2.14 4.76 4.71 4.72
*AUC Ratio=AUC Drug/AUC IS.
**Measured concentration= (AUC Ratio/0.00455)-(+ 0.00223).

74
Table 43: Intra-day precision and accuracy data for QC high samples of
Metronidazole based on the standard calibration curve of the first day
of validation.
QC High
Concentration
(µg/ml)
AUC
Drug AUC IS
AUC
Ratio
Measured
Conc. Accuracy%
14.400
449307 6266837 0.0717 15.756 109.4
459834 6253008 0.0735 16.152 112.2
483341 6486358 0.0745 16.371 113.7
430349 6471578 0.0665 14.613 101.5
430080 6491858 0.0662 14.547 101.0
466339 6652938 0.0701 15.404 107.0
Mean 453208 6437096 0.0704 15.474 107.5
STDV 20962 152367 0.0035 0.768 5.3321
CV% 4.63 2.37 4.96 4.96 4.96
*AUC Ratio=AUC Drug/AUC IS.
**Measured concentration= (AUC Ratio/0.00455)-(+ 0.00223).
Table 44: Intra-day precision and accuracy data for LLOQ samples of
Metronidazole based on the standard calibration curve of the first day
of validation.
LLOQ
Concentration
(µg/ml)
AUC
Drug AUC IS
AUC
Ratio
Measured
Conc. Accuracy%
0.300
8657 5443797 0.0016 0.349 116.3
9077 6285827 0.0014 0.305 101.7
9174 6422908 0.0014 0.305 101.7
7893 5929929 0.0013 0.283 94.3
8435 6401245 0.0013 0.283 94.3
9163 6219142 0.0015 0.327 109.0
Mean 8866 6239309 0.0014 0.309 102.9
STDV 584 180069 0.0001 0.0257 8.5740
CV% 6.59 2.89 5.82 8.33 8.33
*AUC Ratio=AUC Drug/AUC IS.
**Measured concentration= (AUC Ratio/0.00455)-(+ 0.00223).
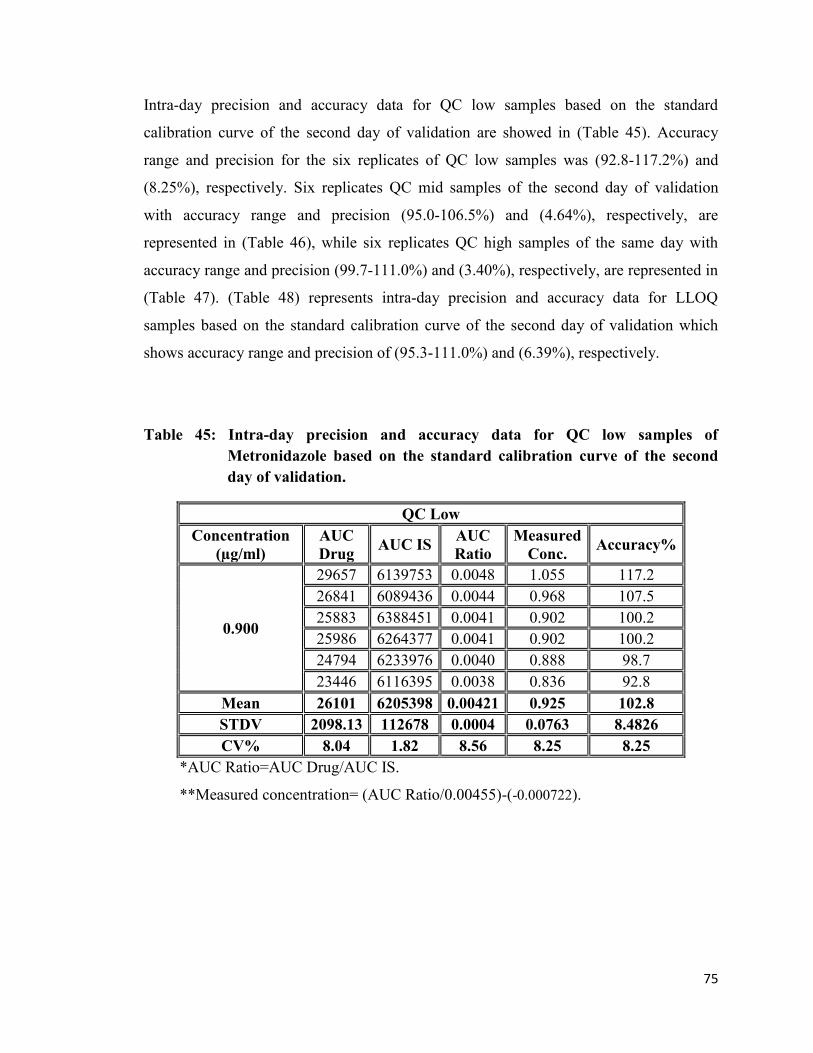
75
Intra-day precision and accuracy data for QC low samples based on the standard
calibration curve of the second day of validation are showed in (Table 45). Accuracy
range and precision for the six replicates of QC low samples was (92.8-117.2%) and
(8.25%), respectively. Six replicates QC mid samples of the second day of validation
with accuracy range and precision (95.0-106.5%) and (4.64%), respectively, are
represented in (Table 46), while six replicates QC high samples of the same day with
accuracy range and precision (99.7-111.0%) and (3.40%), respectively, are represented in
(Table 47). (Table 48) represents intra-day precision and accuracy data for LLOQ
samples based on the standard calibration curve of the second day of validation which
shows accuracy range and precision of (95.3-111.0%) and (6.39%), respectively.
Table 45: Intra-day precision and accuracy data for QC low samples of
Metronidazole based on the standard calibration curve of the second
day of validation.
QC Low
Concentration
(µg/ml)
AUC
Drug AUC IS
AUC
Ratio
Measured
Conc. Accuracy%
0.900
29657 6139753 0.0048 1.055 117.2
26841 6089436 0.0044 0.968 107.5
25883 6388451 0.0041 0.902 100.2
25986 6264377 0.0041 0.902 100.2
24794 6233976 0.0040 0.888 98.7
23446 6116395 0.0038 0.836 92.8
Mean 26101 6205398 0.00421 0.925 102.8
STDV 2098.13 112678 0.0004 0.0763 8.4826
CV% 8.04 1.82 8.56 8.25 8.25
*AUC Ratio=AUC Drug/AUC IS.
**Measured concentration= (AUC Ratio/0.00455)-(-0.000722).
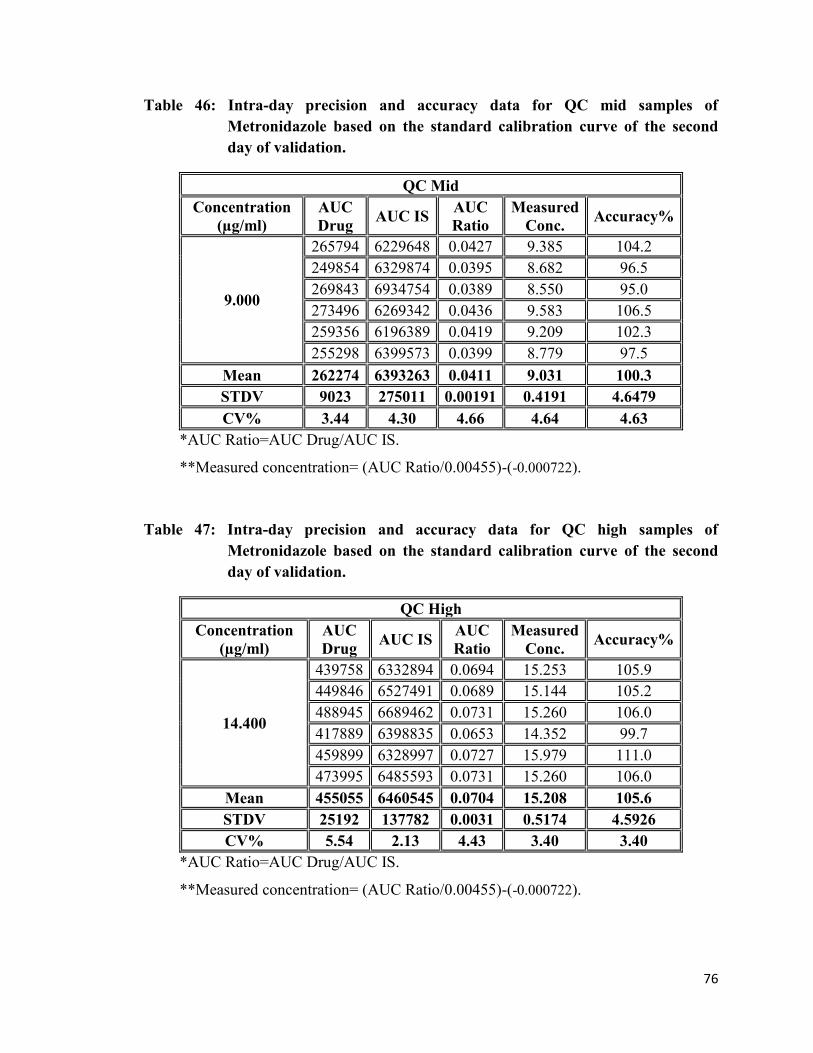
76
Table 46: Intra-day precision and accuracy data for QC mid samples of
Metronidazole based on the standard calibration curve of the second
day of validation.
QC Mid
Concentration
(µg/ml)
AUC
Drug AUC IS
AUC
Ratio
Measured
Conc. Accuracy%
9.000
265794 6229648 0.0427 9.385 104.2
249854 6329874 0.0395 8.682 96.5
269843 6934754 0.0389 8.550 95.0
273496 6269342 0.0436 9.583 106.5
259356 6196389 0.0419 9.209 102.3
255298 6399573 0.0399 8.779 97.5
Mean 262274 6393263 0.0411 9.031 100.3
STDV 9023 275011 0.00191 0.4191 4.6479
CV% 3.44 4.30 4.66 4.64 4.63
*AUC Ratio=AUC Drug/AUC IS.
**Measured concentration= (AUC Ratio/0.00455)-(-0.000722).
Table 47: Intra-day precision and accuracy data for QC high samples of
Metronidazole based on the standard calibration curve of the second
day of validation.
QC High
Concentration
(µg/ml)
AUC
Drug AUC IS
AUC
Ratio
Measured
Conc. Accuracy%
14.400
439758 6332894 0.0694 15.253 105.9
449846 6527491 0.0689 15.144 105.2
488945 6689462 0.0731 15.260 106.0
417889 6398835 0.0653 14.352 99.7
459899 6328997 0.0727 15.979 111.0
473995 6485593 0.0731 15.260 106.0
Mean 455055 6460545 0.0704 15.208 105.6
STDV 25192 137782 0.0031 0.5174 4.5926
CV% 5.54 2.13 4.43 3.40 3.40
*AUC Ratio=AUC Drug/AUC IS.
**Measured concentration= (AUC Ratio/0.00455)-(-0.000722).

77
Table 48: Intra-day precision and accuracy data for LLOQ samples of
Metronidazole based on the standard calibration curve of the second
day of validation.
LLOQ
Concentration
(µg/ml)
AUC
Drug AUC IS
AUC
Ratio
Measured
Conc. Accuracy%
0.300
7994 6165389 0.0013 0.286 95.3
9335 6678943 0.0014 0.308 102.7
9276 6331289 0.0015 0.330 110.0
8903 6756643 0.0013 0.286 95.3
8856 6448957 0.0014 0.308 102.7
9211 6343559 0.0015 0.330 110.0
Mean 9135 6439541 0.0014 0.308 102.7
STDV 203 248879 0.0001 0.0197 6.5741
CV% 2.22 3.86 5.06 6.39 6.40
*AUC Ratio=AUC Drug/AUC IS.
**Measured concentration= (AUC Ratio/0.00455)-(-0.000722).
(Table 49) represents intra-day precision and accuracy data for QC low samples based on
the standard calibration curve of the third day of validation. Accuracy range and precision
for the six replicates of QC low samples was (88.2-105.8%) and (6.58%), respectively.
Six replicates QC mid samples of the third day of validation with accuracy range and
precision (91.1-97.4%) and (2.84%), respectively, are represented in (Table 50), while six
replicates QC high samples of the same day with accuracy range and precision (96.9-
107.3%) and (4.09%), respectively, are represented in (Table 51). (Table 52) shows the
intra-day precision and accuracy data for LLOQ samples based on the standard
calibration curve of the third day of validation which shows accuracy range and precision
of (86.3-106.0%) and (8.13%), respectively.

78
Table 49: Intra-day precision and accuracy data for QC low samples of
Metronidazole based on the standard calibration curve of the third day
of validation.
QC Low
Concentration
(µg/ml)
AUC
Drug AUC IS
AUC
Ratio
Measured
Conc. Accuracy%
0.900
27954 6155874 0.0045 0.893 99.2
28342 6334875 0.0045 0.893 99.2
25934 6118942 0.0042 0.834 92.7
24477 6138749 0.0040 0.794 88.2
30215 6288469 0.0048 0.953 105.8
25279 6089462 0.0042 0.834 92.7
Mean 27033.50 6187729 0.0044 0.867 96.34
STDV 2168.15 99602 0.0003 0.0570 6.3024
CV% 8.02 1.61 6.80 6.58 6.54
*AUC Ratio=AUC Drug/AUC IS.
**Measured concentration= (AUC Ratio/0.00504)-(-0.000761).
Table 50: Intra-day precision and accuracy data for QC mid samples of
Metronidazole based on the standard calibration curve of the third day
of validation.
QC Mid
Concentration
(µg/ml)
AUC
Drug AUC IS
AUC
Ratio
Measured
Conc. Accuracy%
9.000
269834 6103296 0.0442 8.770 97.4
268349 6132784 0.0438 8.691 96.6
266398 6394412 0.0417 8.274 91.9
280673 6398416 0.0439 8.711 96.8
259782 6283395 0.0413 8.195 91.1
279022 6481936 0.0430 8.533 94.8
Mean 270676 6299040 0.0430 8.529 94.8
STDV 7908 154028 0.00121 0.2425 2.6868
CV% 2.92 2.45 2.82 2.84 2.84
*AUC Ratio=AUC Drug/AUC IS.
**Measured concentration= (AUC Ratio/0.00504)-(-0.000761).

79
Table 51: Intra-day precision and accuracy data for QC high samples of
Metronidazole based on the standard calibration curve of the third day
of validation.
QC High
Concentration
(µg/ml)
AUC
Drug AUC IS
AUC
Ratio
Measured
Conc. Accuracy%
14.400
439351 6152879 0.0714 14.167 98.4
448926 6386934 0.0703 13.949 96.9
490558 6298498 0.0779 15.457 107.3
470378 6339817 0.0742 14.723 102.2
463396 6487936 0.0714 14.167 98.4
480327 6833951 0.0703 13.949 96.9
Mean 465489 6416669 0.0726 14.40 100.0
STDV 19154 232182 0.0030 0.5894 4.0612
CV% 4.11 3.62 4.09 4.09 4.06
*AUC Ratio=AUC Drug/AUC IS.
**Measured concentration= (AUC Ratio/0.00504)-(-0.000761).
Table 52: Intra-day precision and accuracy data for LLOQ samples of
Metronidazole based on the standard calibration curve of the third day
of validation.
LLOQ
Concentration
(µg/ml)
AUC
Drug AUC IS
AUC
Ratio
Measured
Conc. Accuracy%
0.300
8657 5443797 0.0016 0.318 106.0
9218 6583392 0.0014 0.279 93.0
9137 6299686 0.0015 0.298 99.3
8859 6733962 0.0013 0.259 86.3
9098 6488931 0.0014 0.279 93.0
8955 6663827 0.0013 0.259 86.3
Mean 9043 6549962 0.0014 0.282 94.0
STDV 132 151460 0.0000 0.0229 7.6507
CV% 1.46 2.31 3.44 8.13 8.14
*AUC Ratio=AUC Drug/AUC IS.
**Measured concentration= (AUC Ratio/0.00504)-(-0.000761).

80
Comparing with the accepted criteria which is for QC levels 85.0-115% and for LLOQ
range which should be 80-120%, the accuracy and LLOQ range data obtained from the
first, second, and third day of validation are within the required range. In addition,
precision (CV%) is not exceed 20% for LLOQ, and 15% for the other concentrations
which prove the closeness of the measurements when repeatedly applied the method of
analysis to multiple aliquots of a single homogenous volume of the serum.
(Table 53) represents Inter-day accuracy and precision for the quality control samples of
MTZ in the three days of validation. All of the obtained accuracy and precision data are
within the required range.

81
14.4
00 µ
g/m
l Q
C h
igh
Day t
hre
e
14.1
67
13.9
49
15.4
57
14.7
23
14.1
67
13.9
49
15.0
28
0.7
578
5.0
4
104.4
Day t
wo
15.2
53
15.1
44
15.2
60
14.3
52
15.9
79
15.2
60
Day o
ne
15.7
56
16.1
52
16.3
71
14.6
13
14.5
47
15.4
04
9.0
00 µ
g/m
l Q
C m
id
Day t
hre
e
8.7
70
8.6
91
8.2
74
8.7
11
8.1
95
8.5
33
9.0
55
0.5
780
6.3
8
100.6
Day t
wo
9.3
85
8.6
82
8.5
50
9.5
83
9.2
09
8.7
79
Day o
ne
10.0
41
9.0
53
9.3
38
10.1
96
9.7
12
9.2
94
0.9
00 µ
g/m
l Q
C l
ow
Day t
hre
e
0.8
93
0.8
93
0.8
34
0.7
94
0.9
53
0.8
34
0.8
87
0.0
768
8.6
6
98.6
Day t
wo
1.0
55
0.9
68
0.9
02
0.9
02
0.8
88
0.8
36
Day o
ne
1.0
30
0.9
20
0.8
11
0.7
89
0.8
11
0.8
55
Mea
sure
d
Con
c.
Mea
n
ST
DV
CV
%
Acc
ura
cy
%
Tab
le 5
3:
Inte
r-d
ay a
ccu
racy
an
d p
reci
sion
for
the
qu
ali
ty c
on
trol
sam
ple
s of
Met
ron
idazo
le i
n t
he
thre
e d
ays
of
vali
dati
on

82
3.2.4 Recovery data for Metronidazole quantification
The recovery of MTZ from its biological matrix in this bioanalytical method showed a
high value and good result.
(Table 54) shows data of triplicate quality control samples of MTZ in the mobile phase
while (Table 55) shows data of triplicate quality control samples of MTZ in the serum.
Absolute recoveries for MTZ and IS were calculated by dividing average peak area of
triplicate from each QC level of serum samples (Table 55) over the same set of QC
samples that were prepared in mobile phase (Table 54) multiplied by 100%.
(Table 56) shows recovery % of MTZ and (Table 57) shows recovery % of IS which
shows a high recovery % and acceptable at the studied concentration.
Table 54: Data of Metronidazole in the mobile phase for the quality control
samples.
concentration
µg/ml
AUC
CAM AUC IS
Mean
CAM
CAM
CV%
Mean
IS
IS
CV%
0.900 26945 6485526
QC low 25973 6599327 25660 5.71 6618102 2.16
24063 6769452
9.000 268396 6396732
QC mid 272264 6489537 273374.3 2.05 6445075 0.72
279463 6448956
14.400 452856 6733985
QC high 463953 6634957 453251.6 2.32 6656193 1.05
442946 6599637

83
Table 55: Data of Metronidazole in the serum for the quality control samples.
concentration
µg/ml
AUC
CAM AUC IS
Mean
CAM
CAM
CV%
Mean
IS
IS
CV%
0.900 26317 6598347
QC low 23951 6639785 25369 4.93 6592400 0.77
25838 6539068
9.000 266945 6439784
QC mid 259745 6501329 262696 1.44 6526986 1.57
261398 6639846
14.400 459355 6598348
QC mid 463995 6549886 462249 0.55 6549366 0.75
463396 6499865
Table 56: Recovery % for Metronidazole.
concentration
µg/ml
Mean
serum
Mean mobile
phase
Recovery
%
0.150 QC low 25369 25660 98.87
1.500 QC mid 262696 273374.3 96.09
2.400 QC high 462249 453251.7 101.99
Table 57: Recovery % for Clindamycin (IS).
concentration
µg/ml
Mean
serum
Mean mobile
phase
Recovery
%
0.150 QC low 6592400 6618102 99.61
1.500 QC mid 6526986 6445075 101.27
2.400 QC high 6549366 6656193 98.40

84
3.3 The modifying effect of pomegranate fresh juice on Clarithromycin and
Metronidazole pharmacokinetic profiles
Food-drug interaction is an important field in the pharmaceutical research. Such
an interaction may affect health status due to altered PK and/or PD of the drug or dietary
substance. A dietary substance can increase the AUC of the drug increasing the risk of
adverse events and toxicity, or decrease its AUC, leading to therapeutic failure (Santos
C.A. and Boullata J.I., 2005).
Foods consumed as beverages give an explanation for a very high proportion of
dietary antioxidant intake (Pulido R. et al., 2003). Increasing facts supporting
cardioprotective benefits give a promotion for moderate beverages consumption as part
of a healthy lifestyle (Kaplan N.M. and Palmer B.F., 2000; Guilford J.M and Pezzuto
J.M., 2011). Several studies have explained the effect of wine, beer, tea, fruit juices, and
their specific constituents on CYP activity in vitro, but still clinical studies are limited.
These beverages have become highly recommended and over-the-counter supplements
for prevention and treatment of common diseases. Some ingredients especially in fruit
juices have been shown to inhibit intestinal metabolism and active efflux/uptake
processes in vitro and in vivo. Inhibition of metabolism and active efflux probably
increase, whereas inhibition of active uptake may be decrease, systemic drug exposure.
Many studies established that cytachrome P450 (CYP450) isoenzymes are
involved and play an important role in food-drug interactions (Rabia B. et al., 2007).
CYP3A4 which is the most considerable CYP450 isoenzymes, in particular, is found at
quite high concentrations in the mucosa of the small intestine with broad substrate
specificity which means that drug substrates for this enzyme are subject to metabolism
during absorption, this explain why it is responsible for about 30-40% of drugs
metabolism (Scott J.G. and Wen Z., 2001; Badyal D.K. and Dadhich A.P., 2001).
Pomegranate fruit extract is a rich source of polyphenols which are flavoring,
coloring, and also has antioxidant effect that they can help protect cells from damage and
may help to lower inflammation. Also pomegranate can provides about 40% of the daily
requirement of vitamin C. Pomegranate is a rich source of crude fibers, pectin, sugars,

85
and several tannins (Gil M.I. et al., 2000). In addition, pomegranate seed oil and juice
contains certain species of lavonoids and anthocyanins.
Recently, pomegranate has been widely consumed around the world especially in
the Middle Eastern countries, Pomegranate juice, according to legend has been used as a
medicine for thousands of years (Langley P., 2000). In laboratory tests, pomegranate
shows antiviral, antibacterial, and antioxidant properties. Some reports talked about a
decreasing effect of pomegranate in cardiovascular diseases by inhibition of low-density
lipoprotein oxidation (Gil M.I. et al., 2000; Aviram M. et al., 2002, 2004; Noda Y. et al.,
2002). Furthermore, therapeutic properties of the fruit have been suggested for use in
cases of breast cancer (Kim N.D. et al., 2002). Based on these findings, pomegranate has
been increasingly consumed. Higher pomegranate consumption allows for an increased
possibility of pomegranate-drug interaction. Therefore, it is important to evaluate the
interaction between pomegranate and medications. In addition, there is some expectation
that pomegranate juice may interact with medications (much like grapefruit juice does).
The effect of pomegranate juice on carbamazepine metabolism was studied in
human’s liver (in vitro); in results, pomegranate juice inhibited the human CYP3A-
mediated metabolism of carbamazepine. On the other hand, short pre-treatment
pomegranate juice inhibited intestinal, but not hepatic, CYP3A4 activity (in vivo) (Hidaka
M. et al., 2005). Another study showed that pre-treatment of rats with pomegranate juice
for longer period (i.e., 7 days) decreased intestinal permeation of carbamazepine which is
supposed to be due to induction of CYP3A4 enzyme (Adukondalu D. et al., 2010).
Further studies are needed to prove their effects in human beings or animals.
Another clinical study suggested lack of clinical significance of the effect of
pomegranate juice when it is given with a single oral dose of midazolam (Farkas D. et al.,
2007).
The ability of pomegranate juice to inhibit the activity of human CYP2C9 was
investigated using human liver microsomes. Pomegranate juice was shown to be a potent
inhibitor of human CYP2C9. The addition of pomegranate juice resulted in almost
complete inhibition of human CYP2C9 activity. In addition, they investigated the effect
of pomegranate juice on the pharmacokinetics of tolbutamide (substrate for CYP2C9) in

86
rats. The results showed that the area under the concentration-time curve was
approximately 1.2-fold greater when pomegranate juice was injected before oral
administration of the tolbutamide. The elimination half-life of tolbutamide was not
altered by pomegranate juice administration. These findings suggest pomegranate juice
ingestion inhibits the intestinal metabolism of tolbutamide without inhibiting the hepatic
metabolism in rats (Nagata M. et al., 2007).
A more recent study evaluated the effect of repeated commercially available
pomegranate juice consumption on the CYP3A-mediated metabolism of midazolam
(Misaka S. et al., 2011). Pomegranate juice did not significantly alter midazolam PK.
Repeated consumption of pomegranate juice may not cause a clinically relevant
interaction with midazolam.
Generally, studies which have been done for the effect of pomegranate juice on
the drugs pharmacokinetic or its enteric CYP3A inhibition potential are still few or
premature. There is no study done for the effect of Pomegranate on CAM or
Metronidazole pharmacokinetics. However, the effect of grapefruit juice on the CAM
pharmacokinetic profile was studied. According to this study, freshly squeezed white
grapefruit delayed the Tmax of both CAM and 14-OH-C by one hour. This finding
interpreted as presence of a competition for intestinal CYP3A4 and/or absorptive sites
(Cheng K.L. et al., 1998).
CAM is widely used with other medications as a triple therapy (e.g. with proton
pump inhibitors and Metronidazole) for the treatment of Helicobacter pylori (H.pylori)
which is one of the main causes of peptic ulcer diseases (PUD). Any significant changes
in the plasma concentration or the pharmacokinetic profile of CAM could lead to a
serious side effects and toxicity (in higher concentrations) or treatment failed (in lower
concentrations). Furthermore, CAM is metabolized in liver by CYP3A4 to an active
metabolite (14-hydroxyclarithromycin), so any substance that induces this enzyme
activity will increase its metabolism and enhance its toxicity. CAM is known as a potent
inhibitor of CYP3A4 (which is mainly expressed in intestine and liver) (Rodrigues A.D.,
1997), so it can affect the absorption and/or metabolism of other drugs which are
substrate for the same enzyme leading to severe drug-drug interactions.

87
According to bacteriological studies, the pharmacokinetic parameters of
antibiotics have been shown to be coordinated with their ability to eradicate bacteria; as a
result any significant changes in such parameters could affect their clinical outcome and
even could be developed to a bacterial resistance (Ball P. et al., 2002). Therefore, it is
very important to take in consideration the food-drug interactions or drug-drug
interactions of antibiotics since these interactions can affect antibiotics pharmacokinetic
parameters.
In the current study, the pharmacokinetic profile of each drug, namely CAM and
MTZ was evaluated on rats with a single dose of PJ administration on a sample size of 6
and 4, respectively, and of the same sample sizes for a multiple dose administration of PJ
comparing with a sample size of 4 administered with DW. Then the pharmacokinetic
profile of each drug was evaluated on rats alone on a sample size of 7 for CAM and 6 for
MTZ, and sample size of 5 when combined together. The range, mean, standard
deviation, standard error, Cohen’s d and paired t-test were calculated by Microsoft Excel.
Cohen’s d a standardized measure of effect size for difference between two means
(Cohen’s d = (mean1-mean2)/pooled STDV. Cohen’s d<0.3 small effect, 0.3-0.7 is
medium effect, finally, 0.8 and greater is a large effect.
3.3.1 Effect of a single and multiple dose of pomegranate juice on Clarithromycin
As shown in (Table 58) and (Figure 11), When CAM administered alone, it
reached its mean maximum plasma level (1.83µg/ml) after one hour and then gradually
declines to reach minimum plasma concentration of (0.56µg/ml) after (6 hours) from the
time of drug administration.
As shown in (Table 59) and (Figure 11) the same drug when administrated half an
hour after a single dose (5 ml /kg) of PJ administration, the mean maximum
concentration increased to reach (2.25µg/ml) but with shifted Tmax since reaching to
mean maximum level was delayed to appear after 3 hours from the point of drug
administration and it is continue to decline until reach the end of follow up period of six
hours with a very narrow gap (difference in mean plasma drug concentration) between a
drug alone and drug with PJ. which is represented by (7.14%) percent change. The

88
maximum change in the mean plasma drug concentration of CAM after giving a single
dose of PJ administration was after three hours from CAM administration which
increased by (1.30µg/ml) with a percent change of (136.84%, compared to administration
with DW. The effect of a single dose of PJ used was evaluated as a strong effect at the
three hours time interval (Cohen’s d =1.18) while it is considered as a moderate to small
effect at the other time intervals. This elevating in plasma CAM pharmacokinetic
parameters when used with a single dose of PJ comparing to singly use, however failed to
reach the level of statistical significance which may be contributed to a very small sample
size or to low dose of PJ. Furthermore, Cmax and AUC were increased by (+22.9%) and
(39.2%), respectively, with decreasing in t½ and increasing in the elimination rate
constant by (45.7) and (50.8), respectively, as explained in (Table 60).
As shown in (Table 61) and (Figure 11), CAM when administered half an hour
after a multiple dose (5ml/kg) of PJ (which administrated for two days two times daily
and one dose at the third day before experiment),the mean plasma concentration
increased to reach a maximum plasma level (1.21 µg/ml) after half an hour from drug
administration. The maximum percent change in mean plasma level of CAM was at time
intervals one hour which was obviously lower than that of drug’s level administered with
DW by (39.97%). However, it returned to increase at three hours by (22.57%). According
to Cohen’s d measurement the effect of a multiple dose of PJ was weak except at one
hour interval (Cohen’s d =1.15) which could be considered as strong lowering effect.
These changes in plasma CAM pharmacokinetic parameters when used with a multiple
dose of PJ comparing to single use, however failed to reach the level of statistical
significance which may be contributed to a very small sample size or to low dose of PJ.
Furthermore, Cmax, Tmax, and AUC were decreased by (33.9%), (50.0%), and (9.7%),
respectively while t½ was increased by (62.0%) with decreasing in the elimination rate
constant by (40.0%), as explained in (Table 62).

89
Table 58: Results of Clarithromycin with DW (n=4).
Time (hr)
Drug
assessed
CAM
+ DW
0.5
1
2
3
4
6
Mean
(µg/ml) 1.05±0.39 1.83±0.34 1.25±0.15 0.95±0.23 0.74±0.21 0.56±0.17
Range 0.19-2.05 0.86-2.31 0.79-1.44 0.52-1.56 0.36-1.32 0.23-1.04
STDV 0.77 0.67 0.31 0.46 0.41 0.34
Table 59: Results of Clarithromycin with a single dose of pomegranate juice with a
comparison to a Clarithromycin with DW administration (n=6).
Time (hr)
Drug
assessed
CAM
+
Single dose
of juice
0.5 1
2
3
4
6
Mean(µg/ml) 1.56±0.32 2.01±0.30 1.33±0.24 2.25±0.71 1.18±0.42 0.61±0.10
Range 0.67-2.94 1.09-2.72 0.67-2.03 0.59-4.5 0.52-3.2 0.25-0.92
STDV 0.78 0.73 0.60 1.75 1.02 0.23
Comparing the M.P.C with CAM + DW
Difference
between 2
means
+0.51 +0.18 +0.08 +1.30 +0.44 +0.04
Cohen’s d +0.66 +0.26 +0.18 +1.18 +0.62 +0.18
Percent
change +48.57 +9.84 +6.40 +136.84 +59.46 +7.14
P(t-test) 0.35* 0.70* 0.79* 0.13* 0.38* 0.84*
*P>0.05 (insignificant).

90
Table 60: Comparing Cmax, Tmax, AUC, T½, and the elimination rate constant
between: Clarithromycin + DW and (Clarithromycin + single dose of juice).
CAM +
DW
CAM +
single dose
of PJ Difference
Percent
change
Cmax(µg/ml) 1.83±0.22 2.25±0.46 +0.42* +22.9
Tmax (hr) 1±0.7 3±0.77 +2.0 +200
AUC͢͢͢͢͢͢͢͢͢ 0→t
(µg/ml*hr) 5.76±1.12 8.02±1.43 +2.26* +39.2
T½ (hr) 2.93 1.59 -1.34* -45.7
Ke 0.236 0.435 +0.12* +50.8
*P>0.05 (insignificant).
The data shows insignificant effect of single dose of PJ on Cmax and AUC of CAM
(appendix B, Table 74).
Table 61: Results of Clarithromycin with a multiple dose of pomegranate juice with
a comparison to a Clarithromycin with DW administration (n=6).
Time (hr)
Drug
assessed
CAM
+
Multiple
dose of juice
0.5 1
2
3
4
6
Mean(µg/ml) 1.21±0.32 1.10±0.25 1.15±0.15 1.16±0.20 0.72±0.18 0.55±0.20
Range 0.46-2.48 0.46-1.98 0.71-1.66 0.41-1.61 0.3-1.49 0.1-1.32
STDV 0.79 0.60 0.37 0.48 0.45 0.49
Comparing the M.P.C with CAM + DW
Difference
between 2
means
+0.16 -0.73 -0.10 +0.21 -0.02 -0.01
Cohen’s d +0.21 -1.15 -0.29 +0.45 -0.04 -0.02
Percent
change +15.28 -39.97 -7.95 +22.57 -2.60 -1.63
P(t-test) 0.76* 0.13* 0.66* 0.51* 0.95* 0.97*
*P>0.05 (insignificant).

91
Table 62: Comparing Cmax, Tmax, AUC, T½, and the elimination rate constant
between: Clarithromycin with DW and (Clarithromycin + multiple dose of juice).
CAM+
DW
CAM +
multiple
dose of PJ Difference
Percent
change
Cmax(µg/ml) 1.83±0.22 1.21±0.23 -0.62* -33.9
Tmax (hr) 1±0.7 0.5±0.43 -0.500 -50.00
AUC͢͢͢͢͢͢͢͢͢ 0→t
(µg/ml*hr) 5.76±1.12 5.20±0.58 -0.56* -9.7
T½ (hr) 2.03 3.29 +1.26* +62.0
Ke 0.35 0.21 -0.14* -40.0
*P>0.05 (insignificant).
The data shows insignificant effect of multiple dose of PJ on Cmax and AUC of CAM
(appendix B, Table 74).
As seen in (Table 63), if we compare between the single and multiple dose effect of PJ on
CAM pharmacokinetics, the data shows insignificant change.
Table 63: Comparison between single and multiple dose effect of PJ on
Clarithromycin.
CAM +
single dose
of P.J
CAM +
multiple dose
of PJ Difference
Percent
change
Cmax(µg/ml) 2.25±0.46 1.21±0.23 -1.13* -50.2
Tmax (hr) 3±0.77 0.5±0.43 -2.5 -83.3
AUC͢͢͢͢͢͢͢͢͢ 0→t
(µg/ml*hr) 8.02±1.43 5.20±0.58 -2.82* -35.2
T½ (hr) 1.59 3.29 +1.7* +106.9
Ke 0.435 0.21 -0.23* -51.7
*P>0.05 (insignificant).

92
Figure 11: Line chart showing the changes in mean plasma Clarithromycin
concentration with time after drug administration with DW, with single
dose of juice, and with multiple dose of juice.
As shown from the results, when a single dose a day of normal-strength
pomegranate fresh juice was administered to rats half an hour before CAM administration
(In comparison with DW-feed rats), the Cmax and AUC of CAM increased with two
hours lateness (Table 60). This is thought to be within the moderate range of significance
according to Cohen’s d measurement (i.e. there is no significant effect of short pre-
treatment with pomegranate juice on the pharmacokinetic profile of CAM).Two hours-
long delay to the appearance of CAM in serum is possibly not clinically significant, since
CAM has t½ of 5 to 7 hr (Chu S.Y. et al., 1992) and with twice-daily dosing, therapeutic
plasma concentrations of CAM would be maintained. However, two doses a day of
normal-strength pomegranate fresh juice was administered to rats for two days followed
by a single dose on the third day (the day of experiment) showed opposite results since
there was a declining in the pharmacokinetic parameters of CAM that were considered
moderate according to Cohen’s d measurement (Table 62).
-0.50
0.00
0.50
1.00
1.50
2.00
2.50
3.00
0.0 1.0 2.0 3.0 4.0 5.0 6.0 7.0
Pla
sma d
rug c
on
cen
trati
on
(µ
g/m
l)
Time (hour)
With D.W
With single dose P.J
With multiple dose P.J

93
The elevation of the pharmacokinetic parameters of Clarithromycin when
administered with single dose of pomegranate juice and the declining of these parameters
after multiple dose of pomegranate juice administration could be due to inhibition then
induction for the enteric metabolism since other studies showed the same results, e.g.
inhibitory effect on intestinal CYP3A4-mediated metabolism of carbamazepine after
single dose of pomegranate juice (Hidaka M. et al., 2005) and induction effect of enteric
CYP3A4 activity on carbamazepine metabolism after a multiple dose of pomegranate
juice (Adukondalu D. et al., 2010). Furthermore, the changing in t½ and the elimination
rate constant of Clarithromycin after single and multiple pomegranate juice
administration give an expectation that pomegranate juice could affect the hepatic-
mediated metabolism of Clarithromycin but with insignificant manner.
Comparing with grape fruit effect on CAM, pomegranate juice did not
significantly change Cmax of CAM but still greater than the effect of grapefruit juice
which was negligible (Cheng K.L. et al., 1998). Furthermore, the Tmax was delayed for
about two hours comparing with one hour lateness when administered with grapefruit
juice. These mild effects of pomegranate juice on the Cmax and Tmax of CAM can be
properly attributed to the inhibition of the intestinal CYP3A4 slightly greater than the
inhibition effect of grapefruit.
3.3.2 Effect of a single and multiple dose of pomegranate juice on Metronidazole
As shown in (Table 63) and (Figure 12), when MTZ administered alone, it reached
its mean maximum plasma level (13.35µg/ml) after one hour and then gradually declines
to reach minimum plasma concentration of (6.12µg/ml) after (6 hours) from the time of
drug administration.
As shown in (Table 64) and (Figure 12) the same drug when administrated 30 min
after a single dose (5 ml /kg) of PJ administration, the mean maximum concentration
increased to reach (12.62µg/ml) after (1 hours) from the point of drug administration then
continue declining until reach a negligible gap (difference in mean plasma drug
concentration) between a drug alone and drug with PJ at the sixth hour from
administration. The mean plasma drug concentration of MTZ after half an hour when a

94
single dose of PJ administered with MTZ was increased by (0.85) and return to decrease
at one hour by (0.73) with a percent change of (7.34%) and (5.4%), respectively
compared to MTZ administration with DW. Moreover, the mean plasma drug
concentration of MTZ decreased continuously reaching to a maximum lowering effect by
(11.8%) and (15.08%) after three and six hours, respectively, from drug administration.
The effect of this single dose of PJ used was evaluated as medium elevating effect
(Cohen’s d =0.37) at the half an hour time interval but this effect decreased with time
with a maximum declining effect at one hour time interval which was evaluated as strong
declining effect (Cohen’s d =1.43) Furthermore, Cmax, AUC, and t½ were decreased by
(5.5%), (7.86%), and (12.5%), respectively, with increasing in the elimination rate
constant by (14.2%) while Tmax was not changed, showed in (Table 65).These percent
changes in plasma MTZ pharmacokinetics when used with a single dose of PJ comparing
to singly use, however failed to reach the level of statistical significance which may be
contributed to a very small sample size or to low dose of PJ.
As shown in (Table 66) and (Figure 12), MTZ when administered 30 min after a
multiple dose (5ml/kg) of PJ (which administrated for two days two times daily and one
dose at the third day before experiment), the mean plasma concentration increased to
reach a maximum plasma level (19.15µg/ml) after an hour from drug administration. At
all time intervals the mean plasma concentrations of MTZ was obviously higher than that
of drug’s level administered with DW. and remain at high levels until reach a wide gap
between a drug alone and drug with PJ at the sixth hour from drug administration. The
mean plasma MTZ concentration when used after a multiple dose of PJ was elevated on
all time intervals by (6.422), (5.79), (8.5), (6.13), (5.8), and (4.26), respectively,
compared to administration with DW. Observing that maximum elevating value was after
two hours from MTZ administration following multiple dose of PJ. The effect of multiple
dose of PJ on elevating plasma MTZ level compared to its single drug use was evaluated
as a highly strong effect in all time intervals. This elevating in plasma MTZ concentration
level when used with a multiple dose of PJ compared to separately use could be clinically
considered as a significant elevating effect. In addition, Cmax, AUC, and t½ were
increased by (43.4%), (132.3%), and (27%), respectively, with decreasing in the
elimination rate constant by (6.25%) while Tmax was not changed, showed in (Table 67).

95
Table 64: Results of Metronidazole with DW (n=2).
Time (hr)
Drug
assessed
MTZ +
DW
0.5 1
2
3
4
6
Mean
(µg/ml) 11.58±0.08 13.35±0.4 10.48±0.49 10.65±0.43 7.77±0.15 6.12±0.38
Range 11.5-11.66 13.7-13.0 10.97-10 10.21-11.08 7.91-7.6 5.74-6.5
STDV 0.113 0.502 0.69 0.615 0.212 0.537
Table 65: Results of Metronidazole with a single dose of pomegranate juice with a
comparison to a Metronidazole with DW administration (n=4).
Time (hr)
Drug
assessed
MTZ
+
Single
dose of
juice
0.5 1
2
3
4
6
Mean
(µg/ml) 12.43±0.52 12.62±0.26 10.84±0.39 9.39±0.28 6.99±0.20 5.27±0.20
Range 11-13.5 12.2-13.3 10.05-11.7 8.83-9.99 6.6-7.4 4.85-5.7
STDV 1.046 0.515 0.781 0.551 0.390 0.397
Comparing the M.P.C with MTZ + DW
Difference
between 2
means
+0.85
-0.73
-0.358
-1.3
-0.77
-0.92
Cohen’s d +0.37 -1.43 -0.49 -0.54 -0.64 -0.49
Percent
change +7.34 -5.4 -3.4 -11.80 -9.95 -15.08
P(t-test) 0.34* 0.17* 0.62* 0.06* 0.065* 0.2*
*P>0.05 (insignificant).

96
Table 66: Comparing Cmax, Tmax, AUC, T½, and the elimination rate constant
between: Metronidazole with DW and (Metronidazole + single dose of juice).
MTZ+ DW
MTZ +
single dose
of PJ
Difference
Percent
change
Cmax(µg/ml) 13.35±0.35 12.62±0.30 -0.73* -5.5
Tmax (hr) 1 1±0.15 0.00 0.00
AUC0→∞
(µg/ml*hr) 94.13±6.04 86.73±1.09 -7.4* -7.86
T½ (hr) 4.47 3.91 -0.56* -12.5
Ke 0.155 0.177 +0.022* +14.2
*P>0.05 (insignificant).
The data shows insignificant effect of single dose of PJ on Cmax and AUC of MTZ
(appendix B, Table 75).
Table 67: Results of Metronidazole with a multiple dose of pomegranate juice with a
comparison to a Metronidazole with DW administration (n=4).
Time (hr)
Drug
assessed
MTZ
+
Multiple
dose of
juice
0.5 1
2
3
4
6
Mean
(µg/ml) 18.0±0.5 19.15±0.7 19.06±2.0 16.78±0.7 13.60±0.4 10.38±0.7
Range 16.8-19.3 17.7-21.1 16.3-24.8 15.4-18.4 12.46-14.6 8.97-12.2
STDV 1.021 1.435 4.026 1.325 0.883 1.416
Comparing the M.P.C with MTZ + DW
Difference
between 2
means
+6.42
+5.79
+8.5
+6.13
+5.8
+4.26
Cohen’s d +11.36 +5.96 +3.6 +7.98 +11.05 +5.14
Percent
change +55.47 +43.4 +81.9 +57.6 +75.08 +69.6
P(t-test) 0.001** 0.006** 0.047** 0.004** 0.001** 0.02**
**P˂0.05 (significant).

97
Table 68: Comparing Cmax, Tmax, AUC, T½, and the elimination rate constant
between: Metronidazole with DW and (Metronidazole + multiple dose of juice).
MTZ+
DW
MTZ +
multiple
dose of PJ
Difference
Percent
change
Cmax(µg/ml) 13.35±0.35 19.15±1.60 +5.8** +43.4
Tmax (hr) 1 1±0.35 0.00 0.00
AUC0→∞
(µg/ml*hr) 94.13±6.04 218.68±12.07 +124.55** +132.3
T½ (hr) 4.47 5.68 +1.2* +27
Ke 0.155 0.122 -0.033* -21.2
**P>0.05 (significant), *P> 0.05 (insignificant).
The data shows significant effect of multiple dose of PJ on Cmax, and AUC of MTZ
(appendix B, Table 75).
As seen in (Table 69), if we compare between the single and multiple dose effect of PJ on
MTZ pharmacokinetics, the data shows significant change in Cmax and AUC of MTZ.
Table 69: Comparison between single and multiple dose effect of PJ on
Metronidazole.
MTZ + single
dose of P.J
MTZ +
multiple dose of
PJ
Difference Percent
change
Cmax(µg/ml) 12.62±0.3 19.15±1.60 +6.55** +51.9
Tmax (hr) 1±0.15 1±0.35 0.00 0.00
AUC0→∞
(µg/ml*hr) 86.73±1.09 218.68±12.07 +131.98** +152.2
T½ (hr) 3.91 5.68 +1.77* +45.3
Ke 0.177 0.122 -0.06* -31.0
**P>0.05 (significant), *P> 0.05 (insignificant).

98
Figure 12: Line chart showing the changes in mean plasma Metronidazole
concentration with time after drug administration with DW, with single
dose of juice, and with multiple dose of juice.
The effect of pomegranate juice or even grapefruit juice on Metronidazole has not
been studied previously. In the current study, in comparison with DW-feed rats, a single
dose a day of normal-strength pomegranate fresh juice was administered to rats half an
hour before Metronidazole administration, Metronidazole pharmacokinetic parameters
were very slightly decreased by pre-treatment with single dose of pomegranate juice with
unchanged Tmax (Table 65). In contrast, two doses a day of normal-strength
pomegranate fresh juice was administered to rats for two days followed by a single dose
on the third day, showed a considerable increase in the pharmacokinetic parameters
(Cmax and AUC) (P<0.05) of Metronidazole (Table 67). From this finding we may
conclude that pomegranate juice with a multiple dose pomegranate juice pre-treatment is
a good intestinal enzyme inhibitor. Moreover, there was a slight increase on t½ and very
slight decrease on the elimination rate constant which means that the hepatic enzymes
could be not affected.
-5.0
0.0
5.0
10.0
15.0
20.0
25.0
0.0 1.0 2.0 3.0 4.0 5.0 6.0 7.0
Dru
g p
lasm
a c
on
cen
trati
on
µg/m
l
Time(hour)
With D.W
With single dose P.J
With multiple dose P.J

99
3.4 The modifying effect of concomitantly administered Clarithromycin and
Metronidazole on their pharmacokinetic profiles
In general, drug interactions can be attributed to pharmacodynamic (i.e. due to
synergistic or antagonistic effects) or pharmacokinetic (i.e. during drug absorption,
distribution, metabolism or elimination) processes (Reynolds J.C., 1990). Moreover,
interactions may also be based on biopharmaceutical modifications, e.g. altered solubility
of the active drug ingredient or its release from the dosage form. Pharmacokinetic
interactions can generally be considered in two ways: the influence of a drug on the
pharmacokinetics of a co-administered medication or the influence of a concomitant
medication on the pharmacokinetics of the drug (Vanderhoff B.T. and Tahboub R.M.,
2002).
The major function of drug metabolism is to make drugs more hydrophilic and
more easily excreted in the urine or bile. CYP system responsible for metabolism of
many compounds by phase I metabolism forming biotransformation products that are
either easily eliminated by the kidneys or undergo further step of metabolism in phase II
reactions prior to elimination ( Meyer U.A., 1996).
The CYP system is a large family of isoenzymes that is found chiefly in the
hepatocytes and small intestine enterocytes and, to a lesser extent, in the kidneys, lungs,
brain and other tissues. Most of human drug metabolism is mediated by six CYP
isoenzymes: CYP1A2, CYP2C9, CYP2C19, CYP2D6, CYP2E1 and CYP3A4 (Meyer
U.A., 1996).
The majority of drug-drug interactions occur as a result of competitive inhibition
when two compounds compete with each other on the same binding site of a CYP
isoenzyme. In this case, the extent of interaction depends on the compounds affinities for
the CYP enzyme (i.e. the substance with the higher affinity to enzyme will inhibit
biotransformation of the lower affinity substrate) (Shapiro L.E. and Shear N.H., 2002).
Most major drug-drug interactions mediated by competitive inhibition of the
isoenzymes are at two main sites: the intestine and liver. Induction or inhibition of the
activity of CYP isoenzymes in the liver can lead to changes in hepatic clearance.
100
CYP3A4 is the predominant CYP isoenzyme in the human intestine and its activity plays
an important role in altering the first-pass metabolism of drugs (Cummins C.L. et al.,
2002) Therefore, intestinal CYP3A4 inhibition also can affect in a wide extent the
bioavailability of the orally administered CYP3A4-substrates ( Shen D.D et al., 1997)
A triple therapy of a proton pump inhibitor (PPI), anti-secretory drugs for
treatment of gastric acid-related disordered , and two selections of antimicrobial drugs is
commonly used and recommended for Helicobacter pylori (H.pylori), one of the main
causes of peptic ulcer diseases (PUD) (Neville P.M. et al., 2001). (H. pylori)-positive
Patients with long-term PPIs therapy are under the risk for the development of gastric
atrophy. Therefore, eradication of H. pylori is important for preventing the progression of
gastritis when PPI therapy is added (Schenk B.E. et al., 2000). The widely used
antimicrobial drugs for eradication of H. pylori are CAM and MTZ (Megraud F., 1998).
The pharmacokinetic interaction between CAM and MTZ when concomitantly
administered to rats was not studied previously although the H.Pylori-treatment fail is
considered as a serious problem increasingly. Moreover, all previous studies were mostly
done to investigate the interaction between CAM and proton pump inhibitors.
3.4.1 Effect of combination on Clarithromycin
As shown in (Table 68) and (Figure 13), when CAM administered alone, it
reached its mean maximum plasma level (1.27µg/ml) after two hours and then gradually
declines to reach minimum plasma concentration of (0.67µg/ml) after (6 hours) from the
time of drug administration.
As shown in (Table 69) and (Figure 13) the same drug when administrated with
MTZ the mean maximum concentration increased to reach (1.15µg/ml) after an hour
from the moment of drug administration but one hour earlier than that when administered
alone with a very slight reduction, even so, the reduction percentage in the mean
maximum level is not exceed (9.4%(. The mean plasma drug concentration of CAM in
the most time intervals when administered with MTZ was very slightly decreased
compared to its administration alone. According to the values of Cohen’s d the effect of
combination on CAM was evaluated as moderate lowering effect except at four hours

101
time interval was considered as strong lowering effect (Cohen’s d=1.67). (Table 70)
shows the comparison in the pharmacokinetic parameters between CAM when
administered alone and CAM after combination with MTZ. Cmax and AUC decreased by
(9.4%) and (6.7%), respectively, while t½ was very slightly increased by (40%), on the
other hand, Tmax decreased by one hour.
Table 70: Results of Clarithromycin alone (n=7).
Time (hr)
Drug
assessed
CAM
alone
0.5 1
2
3
4
6
Mean
(µg/ml) 1.06±0.19 1.25±0.13 1.27±0.14 1.09±0.18 0.91±0.09 0.67±0.04
Range 0.13-1.58 0.88-1.73 0.80-1.85 0.59-1.96 0.59-1.17 0.54-0.88
STDV 0.50 0.34 0.36 0.48 0.24 0.11
Table 71: Results of Clarithromycin after combination with Metronidazole with a
comparison to a lone Clarithromycin administration (n=5).
Time (hr)
Drug
assessed
CAM
combined
0.5 1
2
3
4
6
Mean
(µg/ml) 1.12±0.06 1.15±0.03 1.10±0.10 0.90±0.05 0.61±0.06 0.54±0.09
Range 0.9-1.3 1.08-1.2 0.92-1.45 0.73-1.07 0.45-0.8 0.34-0.88
STDV 0.14 0.06 0.22 0.12 0.13 0.21
Comparing the M.P.C with CAM alone
Difference
between 2
means
+0.05 -0.10 -0.18 -0.19 -0.30 -0.14
Cohen’s d +0.17 -0.50 -0.61 -0.61 -1.67 -0.8
Percent
change +5.10 -7.95 -13.91 -17.09 -33.10 -20.28
P(t-test) 0.82* 0.54* 0.35* 0.43* 0.03** 0.17*
*P>0.05 (insignificant).

102
Table 72: Comparing Cmax, Tmax, AUC, T½, and the elimination rate constant
between: Clarithromycin alone and Clarithromycin after combination with
Metronidazole.
CAM
alone
CAM
Combined Difference
Percent
change
Cmax(µg/ml) 1.27±0.13 1.15±0.06 -0.12* -9.4
Tmax (hr) 2.0±0.41 1.000±0.3 -1.000 -50.00
AUC0→∞
(µg/ml*hr) 9.03±0.62 8.42±0.8 -0.61* -6.7
T½ (hr) 3.25 4.55 +1.3* +40
Ke 0.213 0.151 -0.062* -29.1
*P>0.05 (insignificant).
The data shows insignificant change on Cmax and AUC of CAM after combination with
MTZ (Appendix B, Table 76).
Figure 13: Line chart showing the changes in mean plasma Clarithromycin
concentration with time after separately drug administration and in
combination with Metronidazole.
0.00
0.20
0.40
0.60
0.80
1.00
1.20
1.40
1.60
0.0 1.0 2.0 3.0 4.0 5.0 6.0 7.0
Dru
g p
lasm
a c
on
cen
trati
on
µg/m
l
Time (hour)
CAM alone
CAM combined
103
3.4.2 Effect of combination on Metronidazole
As shown in (Table 71) and (Figure 14), when MTZ administered alone, it reached
its mean maximum plasma level (12.96µg/ml) after one hour and then gradually declines
to reach minimum plasma concentration of (5.62 µg/ml) after (6 hours) from the time of
drug administration. The same drug when administrated with CAM, the mean maximum
concentration increased to reach (12.32 µg/ml) and also gradually declines to reach
minimum plasma concentration of (6.24 µg/ml) after (6 hours) with a very narrow gap
(difference in mean plasma drug concentration) between a drug alone and drug with
MTZ.
As shown in (Table 72), the mean plasma drug concentration of MTZ after half an
hour, and after the last hour (six hours) from administration with CAM was increased by
(0.094) and (0.624), respectively compared to administration alone. However, the mean
plasma drug concentration of MTZ after the remaining four hours (1, 2, 3 and 4 hours)
from administration with CAM was decreased by (0.643), (0.224), (0.03), and (0.716),
respectively, compared to administration alone. The effect of drug combination on
lowering plasma MTZ level on the first hour and the forth hour after concomitantly MTZ
administration with CAM was evaluated as strong lowering effect (Cohen’s d =1.30 and
Cohen’s d =1.28), respectively. However, the effect was considered strong elevating
effect (Cohen’s d =0.94) at the last time interval. These changes in plasma MTZ
concentration when used with CAM comparing to singly use failed to reach the level of
statistical significance (P>0.05).
(Table 73) shows a slight decreasing in Cmax and AUC by (4.94%) and (2.13),
respectively. On the other hand, there was a slight increasing in t½ by (19.78%) with
decreasing of elimination rate constant by (16.51%) while there was no change in the in
Tmax.

104
Table 73: Results of Metronidazole alone (n=6).
Time (hr)
Drug
assessed
MTZ
alone
0.5 1
2
3
4
6
Mean
(µg/ml) 11.14±0.23 12.96±0.18 11.28±0.34 9.42±0.20 8.00±0.19 5.62±0.20
Range 10.32-11.5 12.5-00.8 10.3-12.5 8.8-9.97 7.4-8.8 4.8-6.2
STDV 0.562 0.452 0.822 0.484 0.475 0.501
Table 74: Results of Metronidazole after combination with Clarithromycin with a
comparison to a lone Metronidazole administration (n=5).
Time (hr)
Drug
assessed
MTZ
combined
0.5 1
2
3
4
6
Mean
(µg/ml) 11.24±0.40 12.32±0.24 11.06±0.27 9.39±0.48 7.29±0.29 6.24±0.37
Range 9.99-12 11.6-13 10.5-11.8 8.45-11.1 6.47-7.85 5.01-7.05
STDV 0.894 0.540 0.611 1.066 0.643 0.823
Comparing the M.P.C with MTZ alone
Difference
between 2
means
+0.094
-0.643
-0.224
-0.03
-0.7
+0.624
Cohen’s d +0.13 -1.30 -0.31 -0.04 -1.28 +0.94
Percent
change 0.84 -4.96 -1.99 -0.32 -8.95 11.10
P(t-test) 0.84* 0.06* 0.63* 0.95* 0.062* 0.16*
*P>0.05 (insignificant).

105
Table 75: Comparing Cmax, Tmax, AUC, T½, and the elimination rate constant
between: Metronidazole alone and (Metronidazole after combination with
Clarithromycin).
MTZ
alone
MTZ
Combined Difference
Percent
change
Cmax(µg/ml) 12.96±0.18 12.32±0.2 -0.64* -4.94
Tmax (hr) 1.000 1.000±0.09 0.000 0.00
AUC0→t
(µg/ml*hr) 53.621±0.6 52.480±0.55 -1.141* -2.13
T½ (hr) 3.991 4.780 +0.789* +19.78
Ke 0.174 0.145 -0.0298 -16.51
*P>0.05 (insignificant).
The data shows insignificant change on pharmacokinetic parameters of MTZ after
combination with CAM (Appendix B, Table 77).
Figure 14: Line chart showing the changes in mean plasma Metronidazole
concentration with time after separately drug administration and in
combination with Clarithromycin.
0
2
4
6
8
10
12
14
16
0.0 1.0 2.0 3.0 4.0 5.0 6.0 7.0
Dru
g p
lasm
a c
on
cen
trati
on
µg/m
l
Time (hour)
MET alone
MET combined

106
According to the results obtained in this study, there was no interaction between
CAM and MTZ since Cmax, Tmax, and AUC were calculated for both drugs and showed
no change comparing with each one alone.
One of the aims of this study was to investigate the pharmacokinetic profile of
the interested drugs when concomitantly administered in the presence of pomegranate
juice. This step of the study was not performed due to following reasons:
1- According to the results obtained, there was no significant effect of a single
pomegranate juice dose on CAM and MTZ pharmacokinetic parameters when
administered separately. In addition, there was no drug-drug interaction between them.
This make us to assume that single dose of pomegranate juice will not affect their
pharmacokinetic parameters when combined together.
2- If we suppose that multiple dose of pomegranate juice could affect the
pharmacokinetic of the combination, this supposition is still unscientific since CAM
was not affected by multiple pomegranate juice doses and also was not affected by
concomitant administration with MTZ, and therefore it couldn’t be affected by them if
combined together. Moreover, for MTZ, also there will be no change in its
pharmacokinetic behavior from that obtained (when administered with multiple
pomegranate juice doses) since it was not affected by CAM.
3- Other reasons that should be considered, in any scientific research. In addition to
wasting of time, cost, and labor. There should be ethical considerations represented by
the three R’s which are defined as the replacement of animals, a reduction in the
numbers used or a refinement of techniques that may reduce or replace animals or
reduce the pain, stress or distress of the animals (Farnaud S., 2009).

107
4. Conclusion
A simple, reproducible analytical method with high resolution and sensitivity was
used for simultaneous quantification of Clarithromycin and Metronidazole. An acceptable
recovery was achieved in this method which was with a minimum value of (97.75 and
96.09) % for Clarithromycin and Metronidazole, respectively. The method was partially
validated and all of obtained data was within the acceptance criteria according to United
State Food and Drug Administration and European Medicines Agency guidelines.
The effect of single and multiple doses of fresh pomegranate juice on the
pharmacokinetics profile for each of Clarithromycin and Metronidazole was investigated.
In comparison with distilled water-feed rats the results showed insignificant elevation
effect of single dose pre-treatment with pomegranate juice on the pharmacokinetic profile
of Clarithromycin which could be due to inhibition of the enteric metabolic enzymes
(Same results for the effect of pomegranate juice on carbamazepine, Hidaka M. et al.,
2005). Furthermore, two hours-long delay to the appearance of Clarithromycin in serum
is possibly not clinically significant, since Clarithromycin has t½ of 5 to 7 h and with
twice-daily dosing, therapeutic plasma concentrations of Clarithromycin would be
maintained. This shifting on Cmax of Clarithromycin in presence of single dose of
pomegranate juice could be due to changing on the absorption rate, releasing after
accumulation of the drug in some organs of the body, or manipulation on the metabolic
enzymes. In addition, the multiple dose administration of pomegranate juice showed
insignificant declining in the pharmacokinetic parameters of Clarithromycin which could
be due to induction of the enteric metabolic enzymes (Same effect on carbamazepine
metabolism after a multiple dose of pomegranate juice, Adukondalu D. et al., 2010).
Moreover, the changing in t½ and the elimination rate constant of Clarithromycin after
single and multiple pomegranate juice administration give an expectation that
pomegranate juice could affect the hepatic-mediated metabolism of Clarithromycin but
with insignificant manner.
In case of Metronidazole, single dose pre-treatment with pomegranate juice
showed negligible effect on its pharmacokinetic parameters. In contrast, multiple doses of
normal-strength pomegranate fresh juice administration showed a considerable increase
in the pharmacokinetic parameters (Cmax and AUC) (P<0.05) of Metronidazole. From

108
this finding we may conclude that pomegranate juice with a multiple dose pre-treatment
is a good intestinal enzyme inhibitor, as well as grapefruit juice (Veronese M.L. et al.,
2003, Paine M.F. and Oberlies N.H., 2007). Since there was a slight increase on the t½
and very slight decrease on the elimination rate constant, we can conclude that the
hepatic enzymes could not be affected.
The effect of concomitant administration on the pharmacokinetic profile of each
drug also was investigated since these drugs are commonly used in a regimen with proton
pump inhibitors as a triple therapy for treatment of peptic ulcer disease caused by
Helicobacter pylori infection. The results showed no significant interaction between them
that is why we didn’t continue to investigate for the effect of pomegranate juice on such
combination. The absence of the pharmacokinetic interaction between Clarithromycin
and Metronidazole gives some indication that they have different metabolic pathways and
they do not compete at the same metabolic enzymes.
Since multiple dose of pomegranate juice affected significantly the enteric
metabolism of Metronidazole (as mentioned above) and as concluded that the later has
other than CYP3A4-Clarithromycin mediated metabolism, therefore these findings let us
to conclude that pomegranate juice could affect Metronidazole-mediated enteric
metabolic enzymes other than CYP3A4.
From previous studies on the effect of pomegranate juice on other medications,
e.g. lack of the clinical and pharmacokinetical significance of the effect of pomegranate
juice when it is given with CYP3A4-mediated metabolism of midazolam (Farkas D. et
al., 2007; Misaka S. et al., 2011) and its significant inhibitory effect on enteric CYP2C9-
mediated metabolism of tolbutamide in rats (Nagata M. et al., 2007), we can expect that
pomegranate juice could affect CYP2C9-mediated metabolism of Metronidazole.
On the other hand, there are different enteric metabolic enzymes involved in the
orally administered drug metabolism; therefore, we cannot confirm these findings unless
further in vitro and in vivo investigations are established.

109
5. References
Adukondalu, D., K.Y. Shravan, V.Y. Vamshi, K.R. Shiva, and R.Y. Madhusudan. 2010.
Effect of pomegrnate juice pre-treatment on the transport of carbamazepine across rat
intestine. Journal of Faculty of Pharmacy. 18 (4), pp. 254-9.
Agosti, S., L. Casalino, G. Bertero, A. Barsotti, C. Brunelli, and S. Morelloni. 2012. A
dangerous fruit juice. The American Journal of Emergency Medicine. 30, 5–8.
Amsden, G.W. 1996. Erythromycin, clarithromycin, and azithromycin: are the
differences real? Clinical Therapeutics. 18: 56-73
Arpino, P. 1992. Combined liquid chromatography mass spectrometry. Part III.
Application of thermospray, Mass Spectrometry Reviews. 11, pp 3-40.
Aviram, M., L. Dornfeld, M. Kaplan, R. Coleman, D. Gaitini, S. Nitecki, A. Hofman, M.
Rosenblat, N. Volkova, D. Presser, et al. 2002. Pomegranate juice flavonoids inhibit low-
density lipoprotein oxidation and cardiovascular diseases: studies in atherosclerotic mice
and in humans. Drugs under Experimental and Clinical Research. 28:49–62.
Aviram, M., M. Rosenblat, D. Gaitini, et al. 2004. Pomegranate juice consumption for 3
years by patients with carotid artery stenosis reduces common carotid intima-media
thickness, blood pressure and LDL oxidation. Clinical Nutrition. 23(3):423-433.
Badyal, D.K., and A.P. Dadhich. 2001 Cytochrome p450 and Drug Interactios, Indian
Journal of Pharmacology. 33:248-259.
Baldwin, M.A., and F.W. Mclafferty. 1973. Liquid Chromatography–mass spectrometry
interface - I: the direct introduction of liquid solutions into a chemical ionization mass
spectrometer. Journal of Mass Spectrometry. 7:1111-2.
Ball, P., F. Baquero, O. Cars, et al. 2002. Antibiotic therapy of community respiratory
tract infections: strategies for optimal outcomes and minimized resistance emergence.
Journal of Antimicrobial Chemotherapy. 49:31–40.
Berg, J., J. Tymoczko, and L. Stryer. 2002. Biochemistry. W.H. Freeman and Company,
ISBN 0-7167-4955-6.
Brenner, G.M. 2000: Pharmacology. Philadelphia, PA: W.B. Saunders Company. ISBN
0-7216-7757-6.
Brown, C., G. Taniguchi, and K. Yip. 1989. The monoamine oxidase inhibitor–tyramine
interaction. Journal of Clinical Pharmacology. 29, 529–532.

110
Chen, K.T., S.J. Twu, H.J. Chang, and R.S. Lin. 2003. Outbreak of Stevens-Johnson
Syndrom/Toxic Epidermal Necrolysis Associated with Mebemdazole and Metronidazole
Use Among Filipino Laborers in Taiwan. American Journal of Public Health 93(3): 489-
492.
Cheng, K.L., A.N. Nafziger, C.A. Peloquin, and G.W. Amsden. 1998. Effect of
Grapefruit Juice on Clarithromycin Pharmacokinetics. 42(4), p.927-929.
Chin, T.W., M. Loeb, and I.W. Fong. 1995. Effects of an acidic beverage (Coca-Cola) on
absorption of Ketoconazole. Antimicrobial Agents And Chemotherapy. 39: 1671-5.
Chu, S., B. Paark, C. Locke, et al. 1992. Drug-food interaction potential of
clarithromycin, a new macrolide antimicrobial. Journal of Clinical Pharmacology. 32:
32-36.
Chu, S.Y., R. Deaton, and J. Cavanaugh. 1992. Absolute bioavailability of clarithromycin
after oral administration in humans. Antimicrobial Agents And Chemotherapy. 36: 1147-
50.
Chu, S.Y., D.S. Wilson, R.L. Deaton, et al. 1993 Single- and multiple-dose
pharmacokinetics of clarithromycin, a new macrolide antimicrobial. Journal of Clinical
Pharmacology. 33: 719-26.
Chu, S.Y, L. T. Sennello, S. T. Bunnell, L. L. Varga, D. S. Wilson, and R. C. Sonders.
1992. Pharmacokinetics of clarithromycin, a new macrolide, after single ascending oral
doses. Antimicrobial Agents And Chemotherapy. 36:2447–2453.
Cina, S.J., R.A. Russell, and S.E. Conradi. 1996. Sudden death due to metronidazole
/ethanol interaction. The American Journal of Forensic Medicine and pathology. 17(4):
343-346.
Coleman, M. D. 2005. Human drug metabolism: an introduction. John Wiley, Chichester,
England; Hoboken, NJ.
Coleman, M. D. 2010. Human drug metabolism 2nd ed. Wiley-Blackwell, Oxford;
Hoboken, NJ, pp 1 electronic resource (xiv, 346 p.).
Corina, I., and Mino C. 2005. Drug Metabolism, Current Concepts 1: 171-204.
Corrie, K., and J.G. Hardman. 2011. Mechanisms of drug interactions:
pharmacodynamics and pharmacokinetics. Anaesthesia & Intensive Care Medicine 12:
156-159.
Craig, C.R., and R.E Stitzel. 2004. Modern pharmacology with clinical applications.
Lippincott Williams and Wilkins, Philadelphia.

111
Cŕdoba -Diaz, D., M. Cŕdoba -Diaz, S. Awad, and M. Cŕdoba -Borrego. 2001. Effect of
pharmacotechnical design on the in vitro interaction of ketoconazole tablets with non-
systemic antacids. International Journal of Pharmaceutics. 226: 61-68
Cummins, C.L., W. Jacobsen, and L.Z. Benet. 2002. Unmasking the dynamic interplay
between intestinal P-glycoprotein and CYP3A4. The Journal of Pharmacology And
Experimental Therapeutics. 300: 1036-45.
Davey, P.G. 1991. The pharmacokinetics of clarithromycin and its 14-OH metabolite.
The Journal of Hospital Infection. 19 Suppl. A: 29-37.
Dennis, J. R. 1981, Maintaining and troubleshooting HPLC Systems, John Wiley and
sons Inc, New York, pp. 77-83.
Donovan, J. L., K. D. Chavin, C. L. Devane, R. M. Taylor, J. S. Wang, Y. Ruan, et al.
2004. Green tea (Camelliasinensis) extract does not alter cytochrome p4503A4 or 2D6
activity in healthy volunteers. Drug Metabolism And Disposition. 32, 906–908.
Drenthe College, Standard base techniques. 2010. High Performance Liquid
Chromatography. The Netherlands.
Dreosti, I. E. 1996. Bioactive ingredients: antioxidants and polyphenols in tea. Nutrition
Reviews 54, S51–S58.
Dresser, G.K., J.D. Spence, and D.G. Bailey. 2000. Pharmacokinetic-Parmacodynamic
consequences and clinical relevance of cytochrome P4503A4 inhibition. Clinical
Pharmacokinetics. 38(1): 41-57.
Edwards, D.J., M.E. Fitzsimmons, E.G Schuetz, K. Yasuda, M.P. Ducharme, L.H.
Warbasse, et al. 1999. 6′, 7′-Dihydroxybergamottin in grapefruit juice and Seville
orange juice: effects on cyclosporine disposition, enterocyte CYP3A4, and P-
glycoprotein. Therapeutics And Clinical Pharmacology. 65, 237–244.
El-Toumy, A.A., W.H. Rauwald. (2002). "Two ellagitannins from Punica granatum
heartwood". Phytochemistry. 61 (8):971–4.
EMA, European Medicines Agency. 2011. Science Medicines Health.
Ewan, J., T. Chrystal, R.L. Koch, M.A. McLafferty and P. Goldman. 1980. Relationship
between metroniazole metabolism and bacterial activity, Antimicrobial Agent
Chemotherapy. 18, 566-573.

112
Farkas, D., L. E. Oleson, Y. Zhao, J. S. Harmatz, M. A. Zinny, M. H. Court, et al. 2007.
Pomegranate juice does not impair clearance of oral or intravenous midazolam, a probe
for cytochrome P450-3A activity: comparison with grapefruit juice. Journal of Clinical
pharmacology. 47, 286–294.
Farnaud, S. 2009. The evolution of the Three Rs. Alternatives to Laboratory Animals. 37
(3), pp. 249-54.
Fenn, J.B., M. Mann, C.K. Meng, S.F. Wong, and C.M. Whitehouse. 1989. Electrospray
ionization for mass spectrometry of large biomolecules. Science. 246:64-71.
Fleisher, D., C. Li, Y. Zhou, L. H. Pao, and A. Karim. 1999. Drug, meal and formulation
interactions influencing drug absorption after oral administration. Clinical implications.
Clinical Pharmacokinetic 36, 233–254.
Food and Drug Administration. 2001.
Fraschini, F., F. Scaglione, G. Pintucci, et al. 1991. The diffusion of Clarithromycin &
roxithromycin in to nasal mucosa, tonsil & lung in humans. Journal of Antimicrobial
Chemotherapy. 27[supp1A]: 61-65.
Galmier, M.J., A.M. Frasey, M. Bastide , E. Beyssac , J. Petit, J.M. Aiache, and C.
Lartigue-Mattei. 1998. Simple and sensitive method for determination of metronidazole
in human serum by high-performance liquid chromatography. Journal of
Chromatography B. 720:239–243.
Gelisse, P., D. Hillaire-Buys, E. Halaili, et al. 2007. Carbamazepine and clarithromycin: a
clinically relevant drug interaction. Revue neurologique 163:1096-9.
Genser, D. 2008. Food and drug interaction: conseqences for the nutrition/health status.
Annals of Nutrition and Metabolism. 52(Suppl. 1), 29–32.
Gibbs, M.A., and N.A. Hosea. 2003. Factors affecting the clinical development of
cytochrome p450 CYP3A substrates. Clinical Pharmacokinetic 42, 969–984.
Gil, M.I., F.A. Tomas-Barberan, B. Hess-Pierce, D.M. Holcroft, and A.A. Kader. 2000.
Antioxidant activity of pomegranate juice and its relationship with phenolic composition
and processing. Journal of Agricultural and Food Chemistry. 48:4581–4589.
Gross, J.H. 2004. Mass Spectrometry: A Textbook; Springer-Verlag, Heidlberg,
Germany. ISBN: 3540407391 reviewed JASMS 16:793.

113
Guidance for Industry S6 Preclinical Safety Evaluation of Biotechnology-Derived
Pharmaceuticals. ICH. 1997.
Guilford, J.M., and J.M. Pezzuto. 2011. Wine and health: a review. American Journal of
Enology and Viticulture. 62,471–486.
Guo, L.Q., K. Fukuda, T. Ohta, and Y. Yamazoe. 2000. Role of furanocoumarin
derivatives on grapefruit juice-mediated inhibition of human CYP3A activity.
Drug Metabolism And Disposition. 28, 766–771.
Hagenbuch, B., and C. Gui. 2008. Xenobiotic transporters of the human organic anion
transporting polypeptides (OATP) family. Xenobiotica. 38, 778–801.
Hamilton, R.J. and P.A. Sewell. 1982. Introduction to high performance liquid
chromatography, Chapman and Hall, New York, London. pp. 1-2, 2nd Edition.
Hanley, M. J., P. Cancalon, W. W. Widmer, and D. J. Greenblatt. 2011. The effect of
grapefruit juice on drug disposition. Expert Opinion on Drug Metabolism and
Toxicology. 7, 267–286.
Hardy, D.G., D.R. Guay, and R.N. Jones. 1992. Clarithromycin, a unique macrolide: a
pharmacokinetic, microbiological, and clinical overview. Diagnostic Microbiololgy and
Infectious Disease. 15: 39-53.
Hidaka, M., M. Okumura, K. Fujita, T. Ogikubo, K. Yamasaki, T. Iwakiri, et al. 2005.
Effects of pomegranate juice on human cytochrome p4503A (CYP3A) and
carbamazepine pharmacokinetics in rats. Drug Metabolism And Disposition. 33, 644–
648.
Holbrook, A. M., J. A. Pereira, R. Labiris, H. McDonald, J. D. Douketis, M. Crowther, et
al. 2005. Systematic overview of warfarin and its drug and food interactions. Archives
of Internal Medicine. 165, 1095–1106.
Honig, P. K., D. C. Wortham, A. Lazarev, and L. R. Cantilena. 1996. Grapefruit juice
alters the systemic bioavailability and cardiac repolarization of terfenadine in poor
metabolizers of terfenadine. Journal of Clinical Pharmacology. 36:345–351.
Huang, S.M., J. M. Strong, L. Zhang, K. S. Reynolds, S. Nallani, R. Temple, et al. 2008.
New era in drug interaction evaluation: US Food and Drug Administration update on
CYP enzymes, transporters, and the guidance process. Journal of Clinical Pharmacology.
48, 662–670.

114
Huang, S.M., H. Zhao, J. I. Lee, K. Reynolds, L. Zhang, R. Temple, et al. 2010.
Therapeutic protein–drug interactions and implications for drug development. Clinical
Pharmacology and Therapeutics. 87, 497–503.
Hukkinen, S.K., A. Varhe, K. T. Olkkola, and P. J. Neuvonen. 1995. Plasma
concentrations of triazolam are increased by concomitant ingestion of grapefruit juice.
Clinical Pharmacology and Therapeutics. 58:127–131.
Humphries, T.J., Merritt G.J. 1999. Review article: drug interactions with agents used to
treat acid-related diseases. Alimentary Pharmacology and Therapeutics. 13 Suppl 3: 18-
26.
IARC. 2010. Agents classified by the IARC Monographs, volumes 1-100 (PHP).
International Agency for Research on cancer (IARC). World Health Organization.
James, M.M. 2009. Chromatography. Wiley-VCH Verlag Gmbh & Co. KGaA DOI:
10.1002/3527600434.eap064.pub2
Jang, G. R., and R. Z Harris. 2007. Drug interactions involving ethanol and alcoholic
beverages. Expert Opinion on Drug Metabolism and Toxicology. 3, 719–731.
Jessa, M.J., D.A. Barrett, P.N. Shaw, R.C. Spiller. 1996. Rapid and selective high-
performance liquid chromatographic method for the determination of metronidazole and
its active metabolite in human plasma, saliva and gastric juice. Journal of
Chromatography B. 677:374-379.
Jiang, X.L., F.J. Gonzalez, A.M. Yu. 2011. Drug-metabolizing enzyme, transporter, and
nuclear receptor genetically modified mouse models. Drug Metabolism Reviews. 43(1):
27-40.
Jiang, Y., J. Wang, H. Li, Y. Wang, J. Gu. 2007. Determination of clarithromycin in
human plasma by liquid chromatography-electrospray ionization tandem mass
spectrometry. Journal of Pharmaceutical and Biomedical Analysis. 43 (4), pp. 1460-4.
Juurlink, D.N. 2007. Drug interactions with warfarin: What clinicians need to know.
Canadian Medical Association Journal. 177(4): 369-71.
Kamochi, H., T. Nii, K. Eguchi, et al. 1999. Clarithromycin associated with torsades de
pointes. Japanese Circulation Journal. 63: 421-422.
Kanatani, M.S and B.J. Guglielmo. 1994. The new macrolides: azithromycin and
clarithromycin .The Western Journal of Medicine. 160:31-7

115
Kaplan, N.M., and B.F Palmer. 2000. Nutritional and health benefits of beer. The
American Journal of Medical Sciences. 320, 320–326.
Karen and Liyuan. 2005. High Performance Liquid Chromatography. [Terhubung
berkala] www.ecs.umass.edu.com [10 Pebruari 2012].
Katzung, B.G. 2012. Basic & Clinical Pharmecology, 12th ed. McGraw-Hill, New York,
U.S.A.
Kays, M.B. 2012. Drug Interactions in Infectious Diseases, 3rd Edition. The Annals of
Pharmacotherapy. Harvey Whitney Books Co. NLM ID: 9203131.
Kim, D.W., J. Park, B. Yoon, M.J. Beak, J.E. Kim, and S.Y Kim. 2004. Metronidazole-
induced encephalopathy. Journal of the Neurological Sciences, 224:107-111.
Kim, N.D., R. Mehta, W. Yu, I. Neeman, T. Livney, A. Amichay, D. Poirier, P. Nicholls,
A. Kirby, W. Jiang, et al. 2002. Chemopreventive and adjuvant therapeutic potential of
pomegranate (Punica granatum) for human breast cancer. Breast Cancer Research and
Treatment. 71:203–217.
Kim, R. B. 2003. Organic anion-transporting polypeptide (OATP) transporter family and
drug disposition. European Journal of Clinical Investtigation. 33(Suppl. 2), 1–5.
Kupferschmidt, H. H., H. R. Ha, W. H. Ziegler, P. J. Meier, and S. Krahenbuhl. 1995.
Interaction between grapefruit juice and midazolam in humans. Clinical Pharmacology
and Therapeutics. 58, 20–28.
Kuriyama, A., J.L. Jackson, A. Doi, and T. Kamiya. 2011. Metronidazole-Induced
Central Nervous System Toxicity. Clinical Neuropharmacology 34(6): 1.
Kwon, Y. 2001. Handbook of essential pharmacokinetics, phamacidynamics, and drug
metabolism for industrial scientists. Kluwer Academic/Plenum publishers, New York.
Langley, P. 2000. Why a pomegranate? British Medical Journal. 321(7269):1153-4.
Le Tiec, C., A. Barrail, C. Goujard, and A. M. Taburet. 2005. Clinical pharmacokinetics
and summary of efficacy and tolerability of atazanavir. Clinical Pharmacokinetic. 44,
1035–1050.
LEE, D.Y., J. W.KIM, and M. G. LEE. 2007. Pharmacokinetic interaction between
oltipraz and omeprazole in rats: Competitive inhibition of metabolism of oltipraz by
omeprazole via CYP1A1 and 3A2, and of omeprazole by oltipraz via CYP1A1/2, 2D1/2,
and 3A1/2. European Journal of Pharmaceutical Sciences. 32: 328-339.

116
LEE, E., S.W. LEE, H.G. CHOI, C.K. KIM. 2001. Bioavailibility of cyclosporine A
dispersed in sodium lauryl sulfate-dextrin based solid microspheres. International Journal
of Pharmaceutics. 218: 125-131.
Li, W., H. Jia, and K. Zhao. 2007. Determination of clarithromycin in rat plasma by
HPLC–UV method with pre-column derivatization. Talanta. 71:385–390.
Liederer, B.M., and R.T. Borchardt. 2006. Enzymes involved in the bioconversion of
ester-based prodrugs. Journal of Pharmaceutical Science. 95, 1177–1195.
Lilja, J. J., K.T. Kivistö, J.T. Backman, and P. J. Neuvonen. 2000. Effect of grapefruit
juice dose on grapefruit juice-triazolam interaction: repeated consumption prolongs
triazolam half-life. European Journal of clinical Pharmacology. 56, 411–415.
Lin, J. H., and A.Y. Lu. 2001. Interindividual variability in inhibition and induction of
cytochrome P450 enzymes. Annual Review of Pharmacology and Toxicology. 41, 535–
567.
Loft, S. 1990. Metronidazole and antipyridine as probes for the study of foreign
compound metabolism, Pharmacology Toxicology. 66 (suppl. VI) 1–31.
Loft S., S.V. Otton, M.S. Lennard, G.T. Tucker, and H.E. Poulsen. 1991.
Characterization of metronidazole metabolism by human liver microsomes. Biochemical
Pharmacology. 4: 1127-1134.
Lourenço, R. 2001. Enteral feeding: drug/nutrient interaction. Clinical Nutrition. 20, 187–
193.
Lown, K. S., D. G. Bailey, R. J. Fontana, S. K. Janardan, C. H. Adair, L. A. Fortlage, et
al. 1997. Grapefruit juice increases felodipine oral availability in humans by decreasing
intestinal CYP3A protein expression. Journal of Clinical Investigation. 99, 2545–2553.
Machado, T.B., C.R. Leal, F. Amaral, R.N. Santos, G. Silva, M. Kuster. 2002.
"Antimicrobial Ellagitannin of Punica granatum Fruits".Journal of the Brazilian Chemical
Society. 13 (5): 606.
Malhotra, S., D. G. Bailey, M. F. Paine, and P. B. Watkins. 2001. Seville orange juice
felodipine interaction: comparison with dilute grapefruit juice and involvement of
furocoumarins. Clinical Pharmacology and Therapeutics. 69, 14–23.
Marvin, C. McMaster. 2007. HPLC A Practical user‘s Guide. New Jersey: John Wiley &
Sons. 2nded; pp. 3-13.

117
McEvoy, G.K. ed. 1995. American hospital formulary services, drug information.
Bethesda, American Society of Hospital Pharmacists. pp. 569-571.
McNair, H.M., and J.M. Miller. 1998. Basic Gas Chromatography. 2nded. Wiley. pp. 190
Megraud, F. 1998. Epidemiology and mechanism of antibiotic resistance in Helicobacter
pylori. Gastroenterology. 115:1278-82.
Mertens-Talcott, S.U., I. Zadezensky, W. V. De Castro, H. Derendorf, and V.
Butterweck. 2006. Grapefruit–drug interactions: can interactions with drugs be avoided?
Journal of Clinical Pharmacology. 46, 1390–1416.
Meyer, U.A. 1996. Overview of enzymes of drug metabolism. Journal of
Pharmacokinetics and Biopharmaceutics. 24: 449-59.
Meyer, V., 2010. Practical High- performance Liquid Chromatography, 5th ed. Wiley:
New York. ISBN: 0470688432, 9780470688434.
Misaka, S., R. Nakamura, S. Uchida, K. Takeuchi, N. Takahashi, N. Inui, et al. 2011.
Effect of 2 weeks' consumption of pomegranate juice on the pharmacokinetics of a single
dose of midazolam: an open-label randomized, single-center, 2-period crossover study in
healthy Japanese volunteers. Clinical Therapeutics. 33, 246–252.
Mouly, S. J., C. Matheny, M. F. Paine, G. Smith, J. Lamba, V. Lamba, et al. 2005.
Variation in oral clearance of saquinavir is predicted by CYP3A5 genotype but not by
enterocyte content of cytochrome P450 3A5. Clinical Pharmacology and Therapeutics.78,
605–618.
Nagata, M., M. Hidaka, H. Sekiya, Y. Kawano, K.Yamasaki, M. Okumura, and K.
Arimori. 2007. Effects of Pomegranate Juice on Human Cytochrome P4502C9 and
Tolbutamide Pharmacokinetics in Rats. Drug metabolism and Disposition. 35:302–305.
Nawwar, A.M., A.M. Hussein. 1994. "NMR spectral analysis of polyphenols from Punica
granatum". Phytochemistry. 36 (3): 793.
Neville, P.M., S. Barrowclough, W. Crocombe, A.T. Axon, M. Wrangstadh, and P.
Moayyedi. 2001.Randomised study of the efficacy of omeprazole and clarithromycin
with either amoxicillin or screened primary care patients . Digestive and Liver Disease.
33:131-4.
Niessen, W.M.A. 1999. State-of-the-art in liquid chromatography–mass spectrometry.
Journal of Chromatography A. Review. 856: 179–197.

118
Nirmala, K., T. Prasanna, and K. Polasa. 2010. Modulation of xenobiotic metabolism in
ginger (Zingiber officinale Roscoe) fed rats. International Journal of Nutrition and
Metabolism. 2(3), pp. 056-062.
Noda, Y., T. Kaneyuki, A. Mori, and L. Packer. 2002. Antioxidant activities of
pomegranate fruit extract and its anthocyanidins: delphinidin, cyanidin and pelargonidin.
Journal of Agricultural and Food Chemistry. 50:166–171.
Oswald, S., J. Petersa, M. Vennerb, and W. Siegmunda. 2011. LC–MS/MS method for
the simultaneous determination of clarithromycin, rifampicin and their main metabolites
in horse plasma, epithelial lining fluid and broncho-alveolar cells. Journal of
Pharmaceutical and Biomedical Analysis. 55 (1), pp. 194-201.
Paine, M.F., and N. H. Oberlies. 2007. Clinical relevance of the small intestine as an
organ of drug elimination: drug–fruit juice interactions. Expert Opinion on Drug
Metabolism and Toxicology. 3, 67–80.
Paine, M. F., A. B. Criss, and Watkins P. B. 2004. Two major grapefruit juice
components differ in intestinal CYP3A4 inhibition kinetic and binding properties. Drug
Metabolism and Disposition. 32, 1146–1153.
Paine, M. F., A. B. Criss, and P. B. Watkins, 2005. Two major grapefruit juice
components differ in time to onset of intestinal CYP3A4 inhibition. Journal of
Pharmacology and Experimental Therapeutics. 312, 1151–1160.
Paine, M. F., H. L. Hart, S. S. Ludington, R. L. Haining, A. E. Rettie, and D. C. Zeldin.
2006. The human intestinal cytochrome P450. Drug Metabolism and Disposition.34,
880–886.
Patchett, A.A. 1984. The chemistry of enalapril. British Journal of Clinical
Pharmacology. 18, 201S–207S.
Penzak, S. R., E. P. Acosta , M. Turner , D. J. Edwards , Y. Y. Hon, H. D. Desai, et al.
2002. Effect of Seville orange juice and grapefruit juice on indinavir pharmacokinetics.
Journal of Clinical Pharmacology. 42, 1165–1170.
Peters, D.H., and S.P. Clissold, 1992. Clarithromycin: A review of its antimicrobial
activity, pharmacokinetic properties, and therapeutic potential. Drugs. 44: 117-167.
Peters, D.H., H.A. Friendel, D. Mc Tavish. 1992. Azithromycin: A review of its
antimicrobial activity, pharmacokinetic properties and clinical efficacy. Drugs. 44: 750-
799.

119
Plosker, G. L., and L. J. Scott, 2003. Saquinavir: a review of its use in boosted regimens
for treating HIV infection. Drugs. 63, 1299–1324.
Polk, R. E. 1989. Drug–drug interactions with ciprofloxacin and other fluoroquinolones.
American Journal of Medecine. 87(5A), 76S–81S.
Preissner, S., K. Kroll, M. Dunkel, C. Senger, G. Goldsobel, D. Kuzman, S. Guenther, R.
Winneburg, M. Schroeder, and R. Preissner. 2010: Super CYP: a comprehensive database
on Cytochrome P450 enzymes including a tool for analysis of CYP-drug interactions.
Nucleic Acids Research. Jan; 38 (Database issue):D237-43. doi:10.1093/nar/gkp970.
Epub 2009 Nov 24.
Pulido, R., M. Hernández-García, and F. Saura-Calixto . 2003. Contribution of beverages
to the intake of lipophilic and hydrophilic antioxidants in the Spanish diet. European
Journal of Clinical Nutrition. 57, 1275–1282.
Qiao, J., C. GU, W. Shang, J. Du, W. Yin, M. Zhu, et al. 2011. Effect of green tea on
pharmacokinetics of 5-fluorouracil in rats and pharmacodynamics in human cell lines in
vitro. Food and Chemical Toxicology. 49, 1410–1415.
Rabia, B., Nousheen A., and Y. K. Arshad. 2011. Food-Drug interactions. Oman
Medical Journal. 26(2): 77-83.
Recker, M.W., K.L. Kier. 1997. Potential interaction between Clarithromycin and
Warfarin. The Annals of pharmacotherapy. 31(9): 996-8.
Reynolds, J.C. 1990. The clinical importance of drug interactions with antiulcer therapy.
Journal of Clinical Gastroenterology. 12 Suppl. 2: 54S-63S.
Reynolds, J.E.F. ed. 1993 Martindale, the extra pharmacopoeia, 30th ed. London, the
Pharmaceutical Press, pp. 516-521.
Riss, J., J. Cloyd, J. Gates, and S. Collins. 2008. Benzodiazepines in epilepsy:
pharmacology and pharmacokinetics. Acta Neurologica Scandinavica. 118(2): 69-86.
Rodrigues, A.D., E.M. Roberts, D.J. Mulford, Y. Yao, and D. Ouellet. 1997. Oxidative
metabolism of clarithromycin in the presence of human liver microsome: major role for
the cytochrome P4503A (CYP3A) subfamily. Drug Metabolism and Disposition. 25:623-
30.
Sabra, R. 1988. Topics in clinical pharmacology: lovastatin. American Journal of
Medical Sciences. 296, 426–428.

120
Sagan, C., A. Salvador, D. Dubreuil, P.P. Poulet, D. Duffaut, I. Brumpt . 2005.
Simultaneous Determination of metronidazole and spiramycin I in human plasma,
saliva and gingival crevicular fluid by LC-MS/MS. Journal of Pharmaceutical and
Biomedical Analalysis. 38 (2), pp. 298-306.
Saito, M., M. Hirata-Koizumi, M. Matsumoto, T. Urano, and R. Hasegawa. 2005.
Undesirable effects of citrus juice on the pharmacokinetics of drugs: focus on recent
studies. Drug Safety 28, 677–694.
Samuelson, J. 1999.Why metronidazole is active against both bacteria and parasites.
Antimicrobial Agent Chemotherapy. 43; 1533–1551.
Santos, C.A., and J.I. Boullata. 2005. An approach to evaluating drug–nutrient
interactions. Pharmacotherapy 25, 1789–1800.
Schenk, B.E., E.J. Kuipers, G.F. Nelis, et al. 2000. Effect of Helicobacter pylori
eradication on chronic gastritis during omeprazole therapy. Gut. 46 (5): 615-21.
Schmiedlin-Ren, P., D. J. Edwards, M. E. Fitzsimmons, K. He, K. S Lown, P. M. Woster,
et al. 1997. Mechanisms of enhanced oral availability of CYP3A4 substrates by
grapefruit constituents.DecreasedenterocyteCYP3A4concentrationandmechanism-based
in activation by furanocoumarins. Drug Metabolism and Disposition.25, 1228–1233.
Scott, J.G., Z. Wen. 2001. Cytochromes P450 of Insects: The Tip of the Iceberg, Pest
Management Sience.
Seden, K., L. Dickinson, S. Khoo, and D. Back. 2010. Grapefruit–drug interactions.
Drugs. 70, 2373–2407.
Self, T.H., C. R. Chrisman, A. M. Baciewicz, and M. S. Bronze. 1999. Isoniazid drug and
food interactions. American Journal of Medical Sciences. 317, 304–311.
Seeram, N.P., L.S. Adams, S.M. Henning et al. 2005. "In vitro antiproliferative, apoptotic
and antioxidant activities of punicalagin, ellagic acid and a total pomegranate tannin
extract are enhanced in combination with other polyphenols as found in pomegranate
juice". Journal of Nutritional Biochemistry. 16 (6): 360–7.
Sergent, T., I. Dupont, E.V. Heiden, M.L. Scrippo, L. Pussemier, and Y.J. Schneider.
2009. CYP1A1 and CYP3A4 modulation by dietary flavonoids in human intestinal Caco-
2 cells. Toxicology Letters. 191(2-3), pp. 216-222.
Shapiro, L.E., and Shear N.H. 2002. Drug interactions: proteins, pumps, and P-450s.
Journal of American Academy of Dermatology. 47: 467-84.

121
Shen, D.D., K.L. Kunze, K.E. Thummel. 1997. Enzyme-catalyzed proceses of first-pass
hepatic and intestinal drug extraction. Advanced Drug Delivery Reviews. 27: 99-127.
Shin, J, D.F. Pauly, J.A. Johnson, R.F Frye. 2008. Simplified method for determination of
clarithromycin in human plasma using protein precipitation in a 96-well format and
liquid chromatography-tandem mass spectrometry. Journal of Chromatography B.
871(1):130-4. doi:10.1016/j.jchromb.2008. 06.050.
Singh, B.N. 1999. Effects of food on clinical pharmacokinetics. Clinical
Pharmacokinetics. 37, 213–255.
Skoog, D.A., F.J. Holler, S.R. Crouch. 2007. Principles of Instrumental Analysis 6th ed.
Belmont ,CA. Thomson Higher Education. pp. 98.
Dolan. 2011 Introduction to modern liquid .J and ,Kirkland .J L., ,Snyder
ed. ISBN: 1118210395, 9781118210390. rdhromatography. Wiley interscience. 3c
Taninaka, C., H. Ohtani, E. Hanada, H. Kotaki, H. Sato, and T. Iga. 2000. Determination
of erythromycin, clarithromycin, roxithromycin, and azithromycin in plasma by high-
performance liquid chromatography with amperometric detection. Journal of
Chomatography B. 738: 405–411.
Tapaninen, T., P. J. Neuvonen, and M. Niemi. 2010. Grapefruit juice greatly reduces the
plasma concentrations of the OATP2B1 and CYP3A4 substrate aliskiren. Clinical
Pharmacology and Therapeutics. 88, 339–342.
Tavakoli, N., D. F. Varshosaz, and M.R. Zargarzadeh. 2007. Development and validation
of a simple HPLC method for simultaneous in vitro determination of amoxicillin and
metronidazole at single wavelength. Journal of Pharmaceutical and Biomedical
Analalysis. 43(1), pp. 325-9.
Thanou, M., J.C. Verhoef, and H. E. Junginger. 2001. Chitosan and its derivatives as
intestinal absorption enhancers. Advanced Drug Delivery Reviews 50: 91-101.
Tzulker, R., I. Glazer, I. Bar-Ilan, D. Holland, M. Aviram, and R. Amir. 2007.
Antioxidant activity, polyphenol content and related compounds in different fruit juices
and homogenates prepared from 29 different pomegranate accessions. Journal of
Agriculture and Food Chemistry. 55, 9559–9570.
United states pharmacopeia. 2010, US pharmacopial convention, Rockville, MD. USP
29, <1225> validation of compendial methods.
Valenzuela, B., J. Rebollo, T. Pérez, A. Brugarolas, and J. J Pérez-Ruixo. 2011. Effect of
grapefruit juice on the pharmacokinetics of docetaxel in cancer patients: a case report.
British Journal of Clinical Pharmacology. 72, 978–981.

122
Van Rooyen, G.F., M.J. Smit , A.D. De Jager , H.K. Hundt , K.J. Swart , and A.F. Hundt.
2002. Sensitive liquid chromatography-tandem mass spectrometry method for the
determination of clarithromycin in human plasma. Journal of Chromatography B
Analytical Technologies in the Biomedical and Life Sciences. 768 (2), pp. 223-9.
Vanderhoff, B.T., and R.M. Tahboub. 2002. Proton pump inhibitors: an update.
American Family Physician. 66: 273-80.
Velde, F., J.C. Alffenaar, A. M. A. Wessels, B. Greijdanus, and D.R.A. Uges. 2009.
Simultaneous determination of clarithromycin, rifampicin and their main metabolites in
human plasma by liquid chromatography–tandem mass spectrometry. Journal of
Chromatography B. 877: 1771–1777.
Venkatakrishnan, K., L.L. von Moltke, and G.J. Greenblatt. 2001. Human drug
metabolism and the cytochrome P450: application and relevance of in vitro models.
Journal of Clinical Pharmacology. 41: 1149-79.
Vinson, J. A., K. Teufel, and N. Wu. 2004. Green and black teas inhibit atherosclerosis
by lipid, antioxidant, and fibrinolytic mechanisms. Journal of Agricultural and Food
Chemistry. 52, 3661–3665.
Vischini, G., P. Niscola, A. Stefoni, and F. Farneti. 2011. Increased plasma levels of
tacrolimus after ingestion of green tea. American Journal of Kidney Diseases. 58, 329.
Vogeser, M., and C. Seger. 2008. A decade of HPLC–MS/MS in the routine clinical
laboratory - goals for further developments. Clinical Biochemistry. 41:649-62.
Vogeser, M. 2003. Liquid chromatography–tandem mass spectrometry-application in the
clinical laboratory. Clinical Chemistry and Laboratory Medicine. 41:117-26.
Wallace, R.J., B.A. Brown, and D.E. Griffith. 1993. Drug intolerance to high-dose
clarithromycin among elderly patients .Diagnostic Microbiology and Infectious Disease.
16:215-21.
Wang, Y.J., Y.T. Wu, J.Y. Lin, C.H. Chu, H.Y. Huang, Y.C. Wang, J.K. Chen, and
C.S. Yang. 2012. Rapid quantitative analysis of clarithromycin in rat plasma by UPLC-
MS/MS after intravenous injection of the clarithromycin-loaded ultrafine PLGA
nanoparticles. Journal of Chromatography B Analytical Technologies in the Biomedical
and Life Sciences. 895-896, pp. 178-81.
Wason, S., J. Digiacinto, and M. W. Davis. 2011. Consumption of grapefruit or Seville
orange juice does not affect the pharmacokinetics of colchicine. American Society for

123
Clinical Pharmacology and Therapeutics Annual Meeting Abstract PI-77, Dallas, TX,
March 2–5.
Wibawa, J.I.D., P.N. Shaw, and D.A. Barrett. 2003. Quantification of clarithromycin, its
14-hydroxy and decladinose metabolites in rat plasma, gastric juice and gastric tissue
using high-performance liquid chromatography with electrochemical detection. Journal
of Chromatography B. 3; 783:59–366.
Williams, A., and V. Frasca. 2001. Unit 8.2 Ion-Exchange chromatography.
Wynn, G.H. 2009 Clinical manual of drug interaction principles for medical practice.
American Psychiatric Publication, Washington, DC.
Yasui, N, K. Otani, S. Kaneko, et al. 1997. Carbamazepine toxicity induced by
clarithromycin co-administration in psychiatric patients. International clinical
Psychopharmacology. 12:225-9.
Yeung, P.K., R. Little, Y. Jiang , S.J. Buckley, P.T. Pollak , H. Kapoor , and S.J.
Veldhuyzen van Zanten . 1998. A simple high performance liquid chromatography assay
for simultaneous determination of omeprazole and metronidazole in human plasma and
gastric fluid. Journal of Pharmaceutical and Biomedical Analalysis. 17 (8), pp. 1393-8.
Zuckerman, J.M. 2000. The newer macrolides: Azithromycin and CAM. Infectious
Disease Clinics of North America. 14(2): 449-462.

124
Appendix (A):
HPLC Chromatograms

125
Figure 15: Clarithromycin blank chromatogram.

126
Figure 16: Clarithromycin zero chromatogram.
Clindamycin

127
Figure 17: Clarithromycin LLOQ chromatogram.
Clindamycin
Clarithromycin

128
Figure 18: Clarithromycin SCC7 chromatogram.
Clindamycin
Clarithromycin

129
Figure 19: Clarithromycin rat unknown sample chromatogram at 4.00 hr measured
as 0.878 µg/ml.
Clarithromycin Clindamycin

130
Figure 20: Metronidazole blank chromatogram.

131
Figure 21: Metronidazole zero chromatogram.
Clindamycin
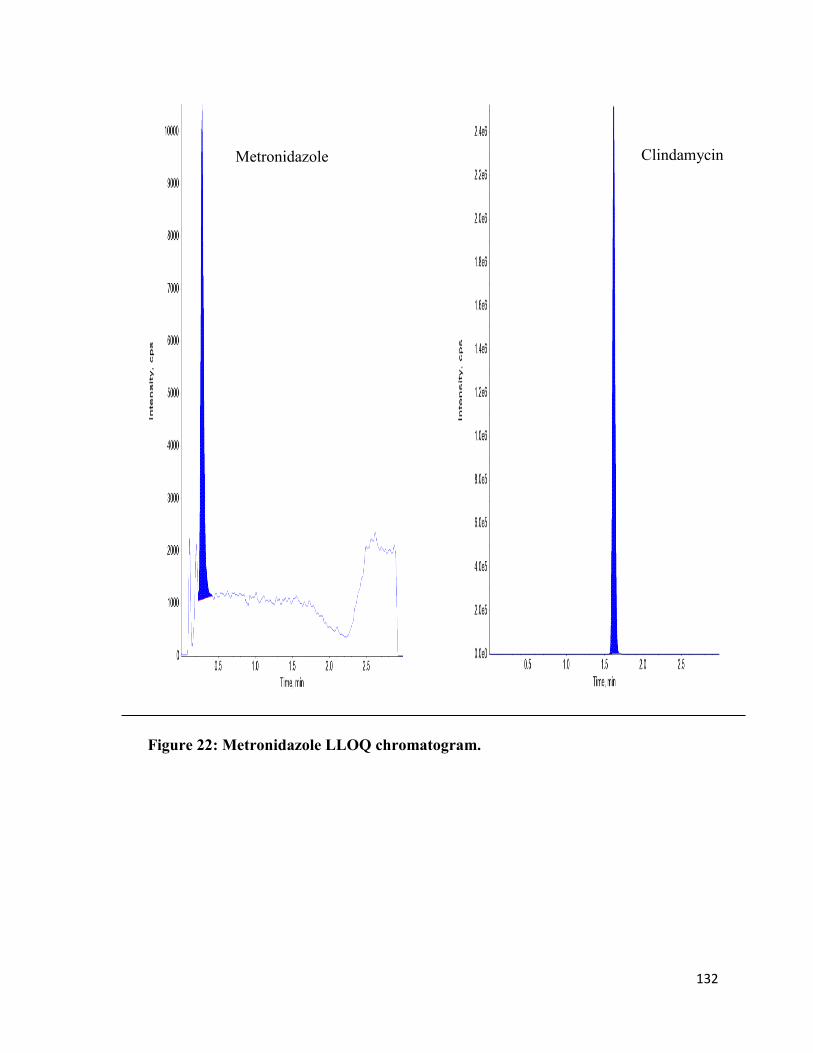
132
Figure 22: Metronidazole LLOQ chromatogram.
Clindamycin
Metronidazole

133
Figure 23: Metronidazole SCC7 chromatogram.
Clindamycin
Metronidazole

134
Figure 24: Metronidazole rat unknown sample chromatogram at 4.00 hr measured
as 7.83 µg/ml.
Clindamycin
Metronidazole

135
Appendix (B):
Preclinical Data

136
Table 76: Data measured for Clarithromycin experiments after administration with
DW, single dose of PJ, and multiple dose of PJ.
*P>0.05 (insignificant), **P˂0.05 (significant).
Plasma concentrations µg/ml
After Pharmacokinetic Parameters
A) CAM
With
DW
30
min.
1 hr 2hr 3hr 4hr 6hr Cmax
(µg/ml)
AUC͢͢͢͢͢͢͢͢͢ 0→t
(µg/ml*hr)
T1/2
(hr) Ke
1 1.11 2.25 1.40 1.02 0.68 0.43 2.25 6.11 2.10 0.33
2 2.05 2.31 1.44 1.56 1.32 1.04 2.31 8.78 4.33 0.16
3 0.86 0.86 1.36 0.52 0.36 0.23 1.36 3.73 1.58 0.44
4 0.19 1.91 0.79 0.68 0.59 0.55 1.91 4.43 2.77 0.25
Total N 4 4 4 4 4 4 4 4 4 4
B) With Single dose PJ
1 2.94 2.61 1.91 1.62 3.21 0.92 2.94 7.84 0.58 1.2 2 1.55 1.93 1.62 4.30 0.93 0.60 1.93 10.83 1.05 0.66 3 1.66 2.54 2.03 1.67 0.87 0.60 2.54 6.95 2.39 0.29 4 0.95 1.18 0.92 0.74 0.53 0.78 1.18 13.88 8.66 0.08 5 0.67 1.09 0.67 4.56 0.52 0.25 4.56 5.47 0.71 0.97 6 1.59 2.72 0.82 0.59 0.99 0.48 2.72 3.15 1.98 0.35
Total N 6 6 6 6 6 6 6 6 6 6
P(t-test)
between
A and B
0.35
*
0.70
*
0.79
*
0.13
*
0.38
*
0.84
*
0.22
*
0.28
* 0.94
*
0.22
*
C) With Multiple dose PJ
1 1.64 1.41 1.17 1.47 0.83 0.55 1.64 6.18 6.30 0.11 2 2.48 1.98 1.66 1.51 1.49 0.95 2.48 5.67 3.85 0.18 3 1.45 1.44 1.05 1.22 0.86 1.32 1.45 6.63 4.62 0.15 4 0.57 0.77 0.82 1.61 0.37 0.19 1.61 6.20 0.98 0.71 5 0.68 0.54 1.48 0.73 0.30 0.1 1.48 3.67 1.03 0.67 6 0.46 0.46 0.71 0.41 0.46 0.21 0.71 2.86 2.31 0.3
Total N 6 6 6 6 6 6 6 6 6 6
P(t-test)
between
A and C
0.76* 0.13* 0.66* 0.51* 0.95* 0.97* 0.25* 0.68* 0.69* 0.70*
P(t-test)
between
B and C
0.46* 0.04** 0.54* 0.17* 0.34* 0.82* 0.06* 0.13* 0.69* 0.28*

137
Table 77: Data measured for Metronidazole experiments after administration with
DW, single dose of PJ, and multiple dose of PJ.
*P>0.05 (insignificant), **P˂0.05 (significant).
Plasma concentrations µg/ml
After
Pharmacokinetic Parameters
A) MTZ
With
DW
30
min.
1 hr 2hr 3hr 4hr 6hr Cmax
(µg/ml)
AUC0→∞
(µg/ml*hr)
T1/2
(hr) Ke
1 11.66 13.71 10.97 11.08 7.92 6.50 13.71 100.17 4.62 0.15
2 11.50 13.0 10.00 10.21 7.62 5.74 13.0 88.09 4.33 0.16
Total N 2 2 2 2 2 2 2 2 2 2
B) With Single dose PJ
1 11.13 12.31 10.35 9.02 7.38 5.71 12.31 88.27 4.62 0.15
2 12.86 12.51 11.19 9.71 6.60 5.32 12.86 85.18 4.33 0.16
3 13.59 12.29 10.05 8.84 6.73 4.85 13.59 75.78 3.65 0.19
4 12.15 13.38 11.76 10.00 7.28 4.92 13.38 78.31 3.47 0.20
Total N 4 4 4 4 4 4 4 4 4 4
P(t-test)
between
A and B
0.34
*
0.17
*
0.62
*
0.06
*
0.065
*
0.20
*
0.54
*
0.1
*
0.34
*
0.33
*
C) With Multiple dose PJ
1 16.84 18.62 16.28 18.37 14.61 12.22 18.64 235.74 8.66 0.08
2 17.75 17.70 16.28 15.39 13.73 10.71 17.75 201.61 7.70 0.09
3 18.11 21.11 24.81 17.30 13.61 9.63 24.81 137.70 2.89 0.24
4 19.31 19.15 18.89 16.05 12.46 8.98 19.30 151.09 4.95 0.14
Total N 4 4 4 4 4 4 4 4 4 4
P(t-test)
between
A and C
0.001 **
0.002 **
0.021**
0.002 **
0.0004 **
0.006 **
0.02 **
0.027 **
0.47*
0.77*
P(t-test)
between
B and C
0.0002**
0.0001**
0.007 **
0.00005**
0.00001**
0.0004**
0.0047 **
0.0048 **
0.18*
0.37*

138
Table 78: Data measured for Clarithromycin experiments alone and after
concomitant administration with Metronidazole.
*P>0.05 (insignificant), **P˂0.05 (significant).
Plasma concentrations µg/ml
After
Pharmacokinetic Parameters
CAM
alone
30
min.
1 hr 2hr 3hr 4hr 6hr Cmax
(µg/ml)
AUC0→∞
(µg/ml*hr)
T1/2
(hr) Ke
1 0.13 1.06 1.10 1.35 1.13 0.70 1.35 8.99 3.15 0.22
2 1.24 1.01 1.10 0.80 1.17 0.60 1.24 8.45 5.33 0.13
3 1.12 1.27 1.47 0.78 0.64 0.54 1.47 7.79 2.77 0.25
4 1.03 1.09 0.80 0.59 0.83 0.65 1.09 7.67 6.93 0.1
5 0.79 0.88 1.06 0.80 0.59 0.68 1.06 7.67 6.30 0.11
6 1.58 1.73 1.53 1.96 1.09 0.66 1.96 10.97 3.65 0.19
7 1.54 1.69 1.85 1.33 0.95 0.88 1.85 11.65 3.65 0.19
Total N 7 7 7 7 7 7 7 7 7 7
After combination with MTZ
1 1.28 1.22 0.92 0.89 0.46 0.35 1.28 6.67 2.89 0.24
2 0.89 1.20 1.14 0.94 0.81 0.88 1.20 11.34 11.55 0.06
3 1.14 1.09 1.05 1.07 0.56 0.58 1.14 8.72 4.95 0.14
4 1.12 1.08 0.92 0.73 0.64 0.45 1.12 7.39 4.08 0.17
5 1.15 1.15 1.45 0.89 0.61 0.44 1.45 7.99 2.31 0.3
Total N 5 5 5 5 5 5 5 5 5 5
P(t-test) 0.82
*
0.54
*
0.35
*
0.43
*
0.03
**
0.17
*
0.22
*
0.57
*
0.74
*
0.81
*

139
Table 79: Data measured for Metronidazole experiments alone and after
concomitant administration with Clarithromycin.
*P>0.05 (insignificant).
Plasma concentrations µg/ml
After
Pharmacokinetic Parameters
MTZ
alone
30
min.
1 hr 2hr 3hr 4hr 6hr Cmax
(µg/ml)
AUC͢͢͢͢͢͢͢͢͢ 0→t
(µg/ml*hr)
T1/2
(hr) Ke
1 11.52 12.94 10.84 8.76 7.37 5.36 12.94 51.48 3.85 0.18
2 11.38 12.94 11.02 9.56 8.09 4.87 12.94 52.98 3.47 0.20
3 11.55 13.81 12.53 9.80 7.87 5.58 13.81 55.85 3.85 0.18
4 10.32 12.83 10.35 9.50 8.82 6.23 12.83 54.09 4.62 0.15
5 11.55 12.46 12.03 8.92 7.82 5.53 12.46 53.33 4.33 0.16
6 10.54 12.81 10.94 9.98 8.08 6.13 12.81 54.05 4.62 0.15
Total N 6 6 6 6 6 6 6 6 6 6
After combination with CAM
1 11.70 12.60 10.90 11.10 6.47 5.01 12.60 52.02 3.85 0.18
2 9.99 13.00 11.60 8.54 7.83 6.26 13.00 52.89 4.62 0.15
3 11.90 11.60 10.50 8.45 6.74 7.05 11.90 50.76 4.33 0.16
4 10.60 12.00 10.50 9.49 7.85 6.92 12.00 52.99 6.30 0.11
5 12.00 12.40 11.80 9.35 7.56 5.96 12.40 53.75 4.62 0.15
Total N 5 5 5 5 5 5 5 5 5 5
P(t-test) 0.84* 0.06* 0.63* 0.95* 0.062* 0.16* 0.06* 0.18* 0.18* 0.18*

140
الملخص
بوجود ن الفئرادراسة تحليلية ذات مصداقية لمعايرة الكالريثرومايسن والميترونايدازول في دم
عصير الرمان
إعداد
هيفاء توفيق ابو طبيخ
المشرف المشارك المشرف
هديا الدكتور وائل ابو ح الدكتور إياد مالا
درة على اإلعتقاد بأن له القاستهالك عصير الرمان اصبح شائعا اليوم وخصوصا في دول الشرق األوسط نتيجة
ايدازول هي الكالريثرومايسين و الميترون مثل المضادات الحيوية وأن بعض ، العالج والوقاية من األمراض الشائعة
ي على خاصة في عالج القرحة المعدية الناتجة عن اإللتهاب البكتيرمعا قد تعطىمن األدوية شائعة اإلستعمال و
ي على نفس . إضافة لذلك ، كال الدوائين لهما التأثير المثبط واأليضفشل العالج بصورة متزايدة الرغم من مشكلة
اإلنزيم.
ائين معا في دم ب مستوى الدولحسا وتم التحقق منها وذلك حساسة، و سريعة، يلية بسيطة لقد تم استخدام طريقة تحل
ون من وقد كان الطور المتحرك يتك ، باستخدام جهاز اإلستشراب المائي عالي اإلنجاز والطيف الكتليالفئران
معدل وكان ، مايكروميتر 0بقطر 01 كربونفصل نوع بعمود ( %5.0) (الفورميك) النمليك الميثانول وحمض
. مل/دقيقة 50.بحدود التدفق
ايسن بة استخالص الكالريثرومحيث ان نس ، على درجة عالية من الجودة البالزما منانت طريقة اإلستخالص ك
. مع وجود مقدار دقة جيد جدا لكال الدوائين (51.5%) وكانت نسبة استخالص الميترونايدازول(%57.70كانت )
ير الرمان على حركية ران بعصفئمسبقة القصيرة والطويلة األمد للالنتائج تبين عدم وجود تأثير للمعالجة الباستعراض
اهمية كون له وهذا التأثير قد ال ت ،الكالريثرومايسن ماعدا تأخر الدواء ساعتين للوصول إلى أعلى تركيز له في الدم
تأثير أظهر إعطاء عصير الرمان لمدة طويلة نسبيا قبل جرعة الميترونايدازول ، من ناحية اخرىواضحة سريريا.
وائيد خلأيضا لم يظهر اي تدا)بجرعة واحدة( عطاء الدوائين بنفس الوقتإ. أما الفأر جسمواضح على حركيته في
بينهما.
Related Documents