Agricultural and Forest Meteorology 119 (2003) 87–107 Validating daily climate interpolations over complex terrain in Austria Hubert Hasenauer a,∗ , Katarina Merganicova a , Richard Petritsch a , Stephan A. Pietsch a , Peter E. Thornton b a Institute of Forest Growth Research, University of Natural Resources and Applied Life Sciences Vienna, Peter Jordan Straße 82, A-1190 Vienna, Austria b Climate and Global Dynamics Division, National Center for Atmospheric Research, Boulder, CO 80305, USA Received 30 August 2002; received in revised form 14 April 2003; accepted 19 April 2003 Abstract Based on daily weather records of minimum and maximum air temperatures as well as precipitation from more than 250 stations between 1960 and 1998 across Austria we interpolate and validate daily climate interpolations using DAYMET. The current version of DAYMET interpolates on a systematic grid daily minimum and maximum temperature and precipitation from surrounding stations based on the principles of a weighted Gaussian filter. In addition, it calculates missing daily solar radiation (Srad) and humidity as it can be derived from temperature and precipitation data. In this study we calibrated DAYMET using the Austrian climate data base and developed a DAYMET point version, which allows us to interpolate daily weather for any location within the country, as it is needed to link existing field observations with missing weather data. We validated this procedure by using an independent data set of 23 stations located across the country. Our results can be summarized as follows: the sensitivity study using the full data set of about 3 million values of daily air temperature (minimum and maximum) as well as precipitation data indicated no regional or elevation related trends or biases. The only exception are daily precipitation predictions in very high altitudes (>1800 m), where model predictions diverge from observations probably due to an increase in the error of recording precipitation rates. The independent model validation using 23 stations consisting of minimum and maximum air temperature, precipitation, solar radiation observations as well as humidity data indicated no trends or bias. The mean error and the prediction interval, an indicator of the expected error range for future applications of the model, suggest no bias. Finally an assessment for two selected stations in Austria, Schmittenhöhe and Großenzersdorf, indicated a good coincidence between model predictions and observations using DAYMET. © 2003 Elsevier Science B.V. All rights reserved. Keywords: Temperature; Precipitation; DAYMET; Biometeorology; Ecosystem modeling 1. Introduction Daily climate characteristics, such as minimum and maximum air temperature, precipitation, solar ∗ Corresponding author. Tel.: +43-1-476-54-4205; fax: +43-1-476-54-4242. E-mail address: [email protected] (H. Hasenauer). radiation (Srad) and humidity are important driving variables within modeling land surface processes (VEMAP Members, 1995; Waring and Running, 1998). Whereas daily temperature and precipitation measurements may be available from official weather stations, humidity and solar radiation observations are commonly restricted to a small number of sta- tions and the missing information has to be estimated 0168-1923/$ – see front matter © 2003 Elsevier Science B.V. All rights reserved. doi:10.1016/S0168-1923(03)00114-X

Welcome message from author
This document is posted to help you gain knowledge. Please leave a comment to let me know what you think about it! Share it to your friends and learn new things together.
Transcript
Agricultural and Forest Meteorology 119 (2003) 87–107
Validating daily climate interpolations overcomplex terrain in Austria
Hubert Hasenauera,∗, Katarina Merganicovaa, Richard Petritscha,Stephan A. Pietscha, Peter E. Thorntonb
a Institute of Forest Growth Research, University of Natural Resources and Applied Life Sciences Vienna,Peter Jordan Straße 82, A-1190 Vienna, Austria
b Climate and Global Dynamics Division, National Center for Atmospheric Research, Boulder, CO 80305, USA
Received 30 August 2002; received in revised form 14 April 2003; accepted 19 April 2003
Abstract
Based on daily weather records of minimum and maximum air temperatures as well as precipitation from more than 250stations between 1960 and 1998 across Austria we interpolate and validate daily climate interpolations using DAYMET. Thecurrent version of DAYMET interpolates on a systematic grid daily minimum and maximum temperature and precipitationfrom surrounding stations based on the principles of a weighted Gaussian filter. In addition, it calculates missing daily solarradiation (Srad) and humidity as it can be derived from temperature and precipitation data. In this study we calibrated DAYMETusing the Austrian climate data base and developed a DAYMET point version, which allows us to interpolate daily weatherfor any location within the country, as it is needed to link existing field observations with missing weather data. We validatedthis procedure by using an independent data set of 23 stations located across the country. Our results can be summarizedas follows: the sensitivity study using the full data set of about 3 million values of daily air temperature (minimum andmaximum) as well as precipitation data indicated no regional or elevation related trends or biases. The only exception aredaily precipitation predictions in very high altitudes (>1800 m), where model predictions diverge from observations probablydue to an increase in the error of recording precipitation rates. The independent model validation using 23 stations consistingof minimum and maximum air temperature, precipitation, solar radiation observations as well as humidity data indicated notrends or bias. The mean error and the prediction interval, an indicator of the expected error range for future applications ofthe model, suggest no bias. Finally an assessment for two selected stations in Austria, Schmittenhöhe and Großenzersdorf,indicated a good coincidence between model predictions and observations using DAYMET.© 2003 Elsevier Science B.V. All rights reserved.
Keywords: Temperature; Precipitation; DAYMET; Biometeorology; Ecosystem modeling
1. Introduction
Daily climate characteristics, such as minimumand maximum air temperature, precipitation, solar
∗ Corresponding author. Tel.:+43-1-476-54-4205;fax: +43-1-476-54-4242.E-mail address: [email protected] (H. Hasenauer).
radiation (Srad) and humidity are important drivingvariables within modeling land surface processes(VEMAP Members, 1995; Waring and Running,1998). Whereas daily temperature and precipitationmeasurements may be available from official weatherstations, humidity and solar radiation observationsare commonly restricted to a small number of sta-tions and the missing information has to be estimated
0168-1923/$ – see front matter © 2003 Elsevier Science B.V. All rights reserved.doi:10.1016/S0168-1923(03)00114-X
88 H. Hasenauer et al. / Agricultural and Forest Meteorology 119 (2003) 87–107
using algorithms which simultaneously estimate solarradiation and humidity from daily air temperature,precipitation and day length data (e.g.Running et al.,1987; Thornton and Running, 1999; Scheifinger andKromp-Kolb, 2000).
For situations where only monthly mean climateinformation is available, stochastic weather generatorsare a possible alternative to determine daily weatherpatterns (Friend, 1998). Such weather generatorsfollow a two-step procedure: first, a variable, e.g.precipitation (Richardson, 1981; Jones and Thornton,2000) or temperature (Strandman et al., 1993), isdefined according to a random process such as theMarkov chain approach. Days with precipitation aredetermined (Richardson, 1981; Wilks, 1999) and theamount of precipitation may be derived based accord-ing Richardson (1981)or a gamma distribution (Jonesand Thornton, 2000; Soltani et al., 2000). In thesecond step, all other daily variables of interest (min-imum and maximum air temperature, solar radiation,etc.) are defined as they depend upon precipitation (orair temperature as inStrandman et al., 1993). Exam-ples of weather generators are WGEN (Soltani et al.,2000) and MarkSim (Jones and Thornton, 2000). Arecent approach byDurban and Glasbey (2001)gen-erates simultaneously all daily climate variables usinga multivariate latent Gaussian process.
While for plot level related research or smaller ar-eas the installation of climate stations may be reason-able, with increasing application area this approachbecomes more and more unreliable and expensive.Consequently, large scale hydrological and forestecosystem studies are often hampered by missingdaily climate input information. This suggests that theefficient use of existing data and interpolation tech-nologies are extremely crucial for large-scale forestecosystem research.
In such situations official observation networksinstalled and maintained by national weather centers(e.g. the Austrian National Weather Center in Vienna)are a unique and extremely valuable data source. Suchdata are commonly distributed across the whole coun-try and their technique of recording and maintainingstandardized data is important to ensure the reliabil-ity and comparability of daily climate temperatureand precipitation records. In addition, climate inter-polation procedures based on official observationshave been developed to assess daily minimum and
maximum air temperature (Tmin andTmax) as well asprecipitation (e.g.Thornton et al., 1997), which allowus to be independent from the location of a particularclimate station.
The simplest method is to assume that the data fromthe nearest climatic station represent the situation atthe location of interest. This approximation techniqueof site climate is called Thiessen polygon (Goovaerts,2000) and may be suitable in homogeneous areaswith high station densities. For mountainous regionsand/or areas with a low station density inverse dis-tance weighting algorithms have been used to increasethe accuracy of the resulting predictions. Examplesare the squared distance and gradient inverse squareddistance as described inPrice et al. (2000); Xia et al.(1999, 2001), and the optimal interpolation method(Ashraf et al., 1997; Xia et al., 1999). Weighting ofnearby points is a function of the distance approachcombining ideas of proximity, such as the Thiessenpolygons, with a gradual change of the trend surface.
A similar method is kriging and its variants (e.g. de-trended kriging, co-kriging) named afterKrige (1951),a South African mining engineer. It uses a linear com-bination of weights at known points to estimate thevalue at an unknown point. For details see (Matheron,1970; Ashraf et al., 1997; Xia et al., 1999, 2001;Goovaerts, 2000). Another common interpolationmethod is splining such as thin plate smoothing splines(Hutchinson, 1995; Price et al., 2000; Xia et al., 2001).This method may be considered as the mathematicalequivalent of fitting a flexible curve to a series of datapoints, or a data smoothing. The advantage of splin-ing is that it is relatively robust and less dependent onthe underlying statistical model (Hutchinson, 1995).The disadvantage may be that no error estimates areprovided and that it requires regularly spaced data.
Several authors (e.g.Ashraf et al., 1997; Nalderand Wein, 1998; Xia et al., 1999, 2001; Hartkampet al., 1999; Goovaerts, 2000; Price et al., 2000) com-pared different interpolation methods and concludedthat geostatistical approaches, such as the krigingmethod, produce more accurate results than others.However, the trade off is that methods like krig-ing require a parameterization for each day as wellas an estimation of the spatial correlation structure,i.e. examination of semi-variogram and a subjectiveselection of the most suitable model. Nevertheless,the superiority of kriging versus inverse distance
H. Hasenauer et al. / Agricultural and Forest Meteorology 119 (2003) 87–107 89
weighting diminishes as the station density increases(Goovaerts, 2000).
The purpose of this study is to validate the applica-bility of an existing climate interpolation algorithm toproduce daily climate input parameters for large scaleforest ecosystem modeling in Austria. The model cho-sen is the current version of DAYMET (Thornton et al.,1997) because across Austria a large number ofweather stations with daily climate data (Tmin, Tmax,precipitation) are available. The model is based on atruncated Gaussian weighting filter and can be con-sidered as an inverse distance weighting approach.Furthermore in a previous study we have successfullyenhanced and tested the estimation procedure of gen-erating missing daily incoming solar radiation andvapor pressure (VP) from available dailyTmin, Tmaxand precipitation data within Alpine areas in Austria(Thornton et al., 2000).
For our future forest ecosystem-modeling efforts,DAYMET has two desirable properties: it allows usto (1) predict dailyTmin, Tmax and precipitation forany location in Austria and (2) based on the results ofstep 1, we can derive the missing daily solar radiationand vapor pressure data according toThornton et al.(2000). DAYMET has been used and tested across theUS (Thornton et al., 1997) but it has never been vali-dated in other areas of the world such as the complexmountainous terrain of the Austrian Alps in centralEurope.
The different working steps of our study can besummarized as follows:
(1) We initialize DAYMET using a large and represen-tative data set provided by the Austrian NationalWeather Center. The data set comprises daily cli-mate records forTmin, Tmax, and precipitation be-tween 1960 and 1998 (=39 years) from stationsall across the country.
(2) We perform a cross-validation sensitivity analysisto test our interpolation results for possible sys-tematic spatial and temporal trends.
(3) We validate the interpolation results by compar-ing daily climate predictions versus observationsusing an independent data set of 23 climate sta-tions. These stations are not used in the initial-ization procedure and consist ofTmin, Tmax, pre-cipitation, solar radiation and relative humidity(needed for calculating vapor pressure) measures.
This validation step can be considered as a typicalfuture DAYMET application example for gener-ating missing daily climate input parameters forany given location within Austria.
2. Methods
The model, developed at the Numerical Terrady-namic Simulation Group (NTSG), University of Mon-tana (seeThornton et al., 1997) interpolates dailyTmin,Tmax and precipitation for a given point and estimatesthe daily solar radiation and vapor pressure deficit forthis point using the interpolation results ofTmin, Tmaxand precipitation. The interpolation procedure is basedon a reduced Gaussian filter, using a certain number ofstations located near a given point. The filter weight isassociated with a radial distance from the plot center(point of interest), and a unitless shape parameter:
W(r) =
0; r > Rp
exp
[−
(r
Rp
)2
α
]; r ≤ Rp
(1)
whereW(r) is the filter weight associated with a radialdistancer for p, Rp is the truncation distance from p,andα the unitless shape parameter.
The size of the truncation radius depends on thestation density and varies as a smoothed function toensure a continuous interpolation surface. An averageof 25 stations are used for theTmin andTmax interpo-lations and an average of 15 for daily precipitation.Determining the minimum number of stations forinterpolation is important because otherwise in areaswith a small station density the accuracy of the re-sulting predictions will decrease. To ensure an evenlydistributed number of observations within the trun-cation distance, the radius is changed by an iterativeprocedure (for details seeThornton et al., 1997).
In DAYMET, the General Cartographic Transfor-mation Package (GCTP) (seeSnyder, 1987) is usedto transform the available location description of eachstation from latitude and longitude to a Lambert sys-tem. In addition, a digital elevation map (DEM) witha resolution of 1 km is used in this model.
Prediction algorithms forTmin andTmax are identi-cal and focus on the prediction of a single point at agiven day, as they may be calculated from the stations
90 H. Hasenauer et al. / Agricultural and Forest Meteorology 119 (2003) 87–107
selected within the truncation radius and the optimalGaussian shape parameter (GSP)α. To correct for thedifferences in temperature that may result from eleva-tion differences between the observed and predictionpoints, a weighted least square regression is applied.
Precipitation predictions follow a two-step proce-dure: (1) daily occurrence and (2) daily total precip-itation. The model assumes a spatial daily coherencein the occurrence of precipitation (wet versus dry) ex-pressed as a binomial predictor of spatial precipitationoccurrence that is a function of the weighted occur-rence of the surrounding stations. For a given pointand a day of interest, the probability of precipitationoccurrence depends on the proportion of wet versusdry stations within the given truncation area and theweights of the surrounding stations.Thornton et al.(1997)suggest a ratio of 0.52 (wet/all). Temperatureestimation is handled in a similar way. The elevationcorrection in the form of weighted least square regres-sion is used to calculate the amount of precipitationand the interpolation weights are multiplied with (Bi)the variable representing the station precipitation (0 or1) to ensure that only those stations where precipita-tion has occurred are used.
Pp =∑n
i=1WiBi[Pi + {(1 + f)/(1 − f)}]∑ni=1WiBi
(2)
f = β0 + β1(zp − zi) (3)
wherePp is the predicted daily precipitation,Wi theweight,Bi the binomial estimator for precipitation oc-currence (0 or 1),Pi the measured precipitation at oneof the 15 stations within the truncation radius,f theresult of the smoothing procedure,zp and zi indicatethe elevation gradient from the station’s locationzi tothe prediction pointzp. According to this formulation| f | must be<1.0. Thus, the valuefmax is introducedto define the upper boundary line (always<1.0) forf. In case |f | is greater thanfmax, f is set equal tofmax. This value addresses the problem in estimatingdaily rain for high elevated locations or in very rainyareas. Iffmax is smaller, less information from the re-gression is used while anfmax = 1 indicates that therisk of extrapolation errors may occur if the eleva-tion difference between the base station and locationof extrapolation is large.Thornton et al. (1997)sug-gested anfmax of 0.95. This value is used also in thisstudy. Note all these regressions are recalculated for
each day and each variable within the truncation ra-dius (Rp) selected.
Unlike daily temperature (Tmin, Tmax) and precip-itation, which are derived from neighboring stations,solar radiation and water vapor pressure deficit pre-dictions require dailyTmin, Tmax and precipitation forthe location of interest. These procedures have beentested and adjusted for high Alpine Areas in Austriaand are described inThornton et al. (2000). In the fol-lowing we briefly summarize these procedures as theyare implemented in DAYMET.
For predicting daily solar radiation, first the daylength is determined, the period of direct radiation.Next, the extraterrestrial potential incoming radiationand the transmissivity coefficient, the reduction fac-tor accounting for the conditions and the amount ofair mass incoming radiation has to pass through areassessed. This transmissivity coefficient depends oncloud cover and temperature. It is important to notethat for these analyses we incorporated in DAYMETthe potential shadowing effect as it may result fromhigh alpine mountains and the radiation reflections dueto snow pack. These effects have been found to sig-nificantly influence predicted daily solar radiation andignoring this impact may lead to biased radiation pre-dictions in Austria (seeThornton et al., 2000).
The estimation of water vapor pressure deficit isbased on the assumption thatTmin can be set equal todew point temperature (Kimball et al., 1997) and thatat a given temperature the water vapor pressure in theatmosphere can be derived according toAbbott andTabony (1985):
3. Data
For this study two data sets across Austria wereavailable: one for initializing DAYMET and perform-ing the sensitivity tests and the second one for anindependent model validation. Both data sets wereprovided by the Austrian National Weather Center(ZAMG) in Vienna Austria.
Data set one consists of daily minimum and max-imum air temperature (Tmin, Tmax) as well as dailyprecipitation records across Austria for the time pe-riod between 1960 and 1998 (=39 years). The dailytemperatures have a measurement error of 0.1◦C andthe precipitation observations of 0.1 mm (Böhm, 1992;
H. Hasenauer et al. / Agricultural and Forest Meteorology 119 (2003) 87–107 91
Auer, 1993). In addition, meta data including an identi-fication code of the climate station, latitude, longitudeand elevation, were obtained and used in our study.
In a small country like Austria it is important to en-sure that climate interpolations are not affected by itsdistance to the country’s border. Frontal zones com-monly approach Austria from western or northwest-ern direction and ignoring weather information (e.g.from Germany and Switzerland) may cause systematicinterpolation errors. Thus, we additionally obtaineddaily climate data (Tmin, Tmax, precipitation) from allneighboring countries, within the limit of about 70 kmfrom the Austrian border between 1960 and 1998. The70 km limit was defined according to preliminary in-terpolation runs, which indicated that the maximumtruncation radius for climate interpolations in Aus-tria will be less than 70 km. Together with the Aus-trian data set they serve as our database to initializeDAYMET.
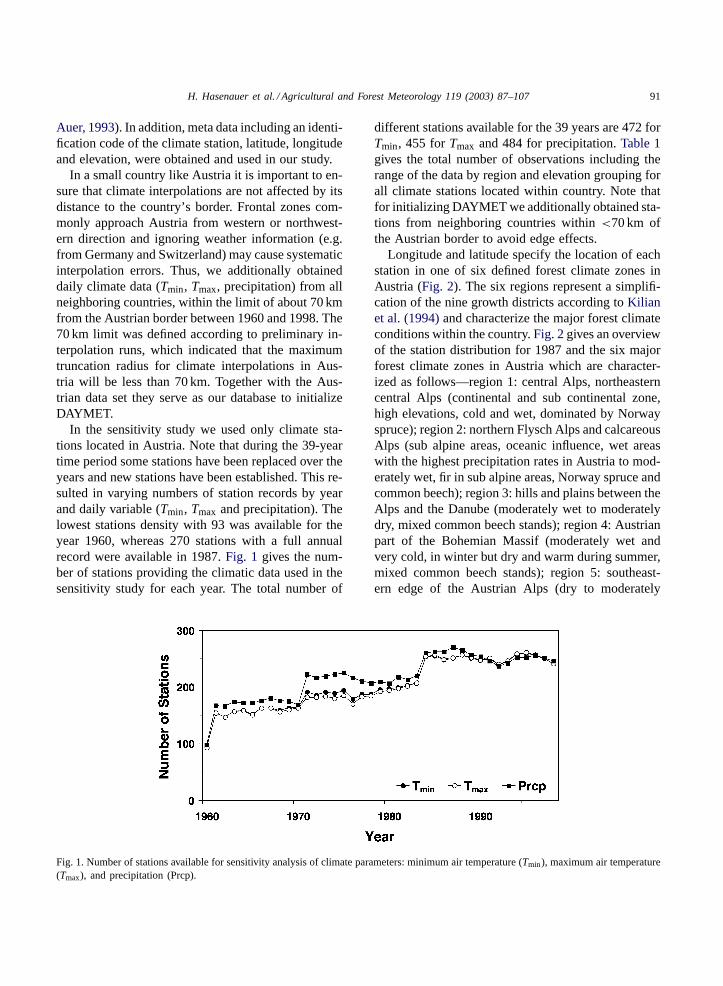
In the sensitivity study we used only climate sta-tions located in Austria. Note that during the 39-yeartime period some stations have been replaced over theyears and new stations have been established. This re-sulted in varying numbers of station records by yearand daily variable (Tmin, Tmax and precipitation). Thelowest stations density with 93 was available for theyear 1960, whereas 270 stations with a full annualrecord were available in 1987.Fig. 1 gives the num-ber of stations providing the climatic data used in thesensitivity study for each year. The total number of
Fig. 1. Number of stations available for sensitivity analysis of climate parameters: minimum air temperature (Tmin), maximum air temperature(Tmax), and precipitation (Prcp).
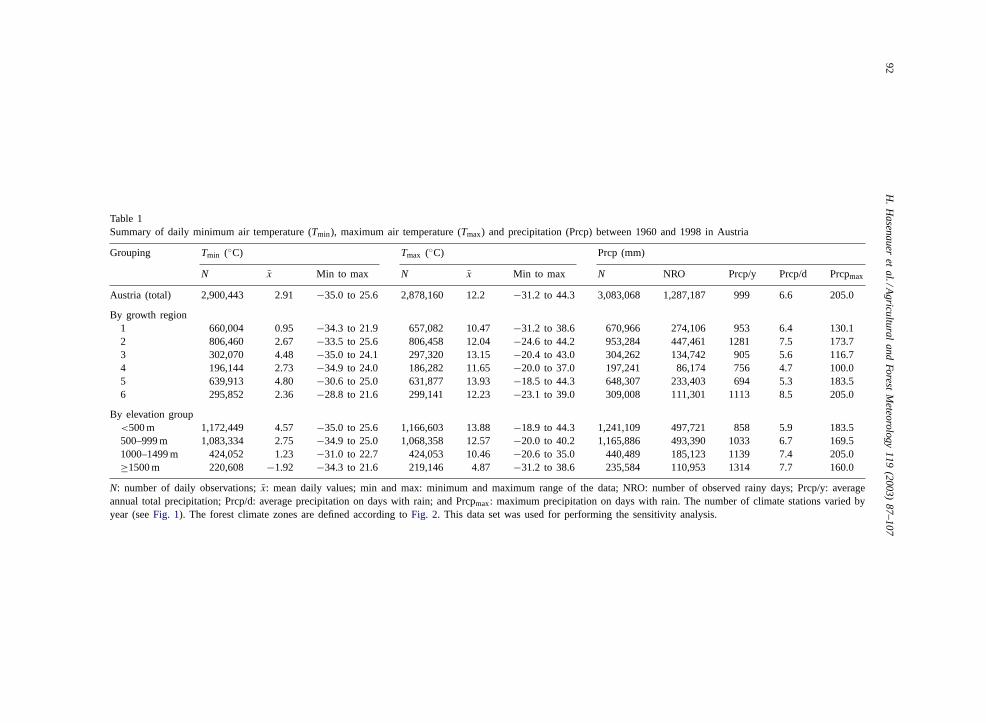
different stations available for the 39 years are 472 forTmin, 455 forTmax and 484 for precipitation.Table 1gives the total number of observations including therange of the data by region and elevation grouping forall climate stations located within country. Note thatfor initializing DAYMET we additionally obtained sta-tions from neighboring countries within<70 km ofthe Austrian border to avoid edge effects.
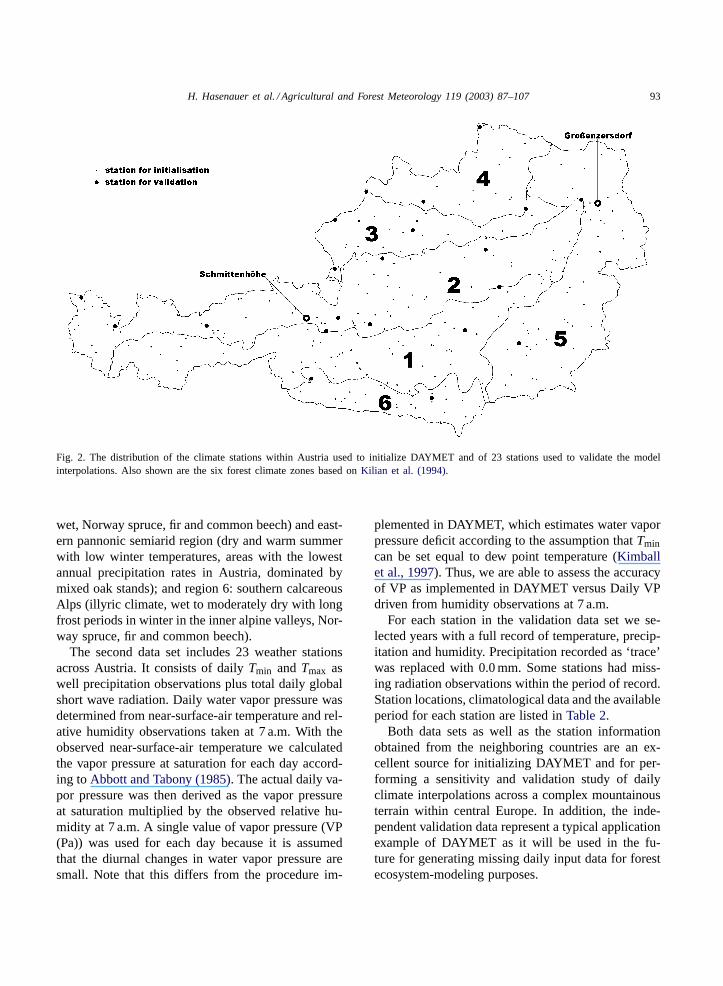
Longitude and latitude specify the location of eachstation in one of six defined forest climate zones inAustria (Fig. 2). The six regions represent a simplifi-cation of the nine growth districts according toKilianet al. (1994)and characterize the major forest climateconditions within the country.Fig. 2gives an overviewof the station distribution for 1987 and the six majorforest climate zones in Austria which are character-ized as follows—region 1: central Alps, northeasterncentral Alps (continental and sub continental zone,high elevations, cold and wet, dominated by Norwayspruce); region 2: northern Flysch Alps and calcareousAlps (sub alpine areas, oceanic influence, wet areaswith the highest precipitation rates in Austria to mod-erately wet, fir in sub alpine areas, Norway spruce andcommon beech); region 3: hills and plains between theAlps and the Danube (moderately wet to moderatelydry, mixed common beech stands); region 4: Austrianpart of the Bohemian Massif (moderately wet andvery cold, in winter but dry and warm during summer,mixed common beech stands); region 5: southeast-ern edge of the Austrian Alps (dry to moderately
92H
.H
asenaueret
al./Agricultural
andForest
Meteorology
119(2003)
87–107
Table 1Summary of daily minimum air temperature (Tmin), maximum air temperature (Tmax) and precipitation (Prcp) between 1960 and 1998 in Austria
Grouping Tmin (◦C) Tmax (◦C) Prcp (mm)
N x̄ Min to max N x̄ Min to max N NRO Prcp/y Prcp/d Prcpmax
Austria (total) 2,900,443 2.91 −35.0 to 25.6 2,878,160 12.2 −31.2 to 44.3 3,083,068 1,287,187 999 6.6 205.0
By growth region1 660,004 0.95 −34.3 to 21.9 657,082 10.47 −31.2 to 38.6 670,966 274,106 953 6.4 130.12 806,460 2.67 −33.5 to 25.6 806,458 12.04 −24.6 to 44.2 953,284 447,461 1281 7.5 173.73 302,070 4.48 −35.0 to 24.1 297,320 13.15 −20.4 to 43.0 304,262 134,742 905 5.6 116.74 196,144 2.73 −34.9 to 24.0 186,282 11.65 −20.0 to 37.0 197,241 86,174 756 4.7 100.05 639,913 4.80 −30.6 to 25.0 631,877 13.93 −18.5 to 44.3 648,307 233,403 694 5.3 183.56 295,852 2.36 −28.8 to 21.6 299,141 12.23 −23.1 to 39.0 309,008 111,301 1113 8.5 205.0
By elevation group<500 m 1,172,449 4.57 −35.0 to 25.6 1,166,603 13.88 −18.9 to 44.3 1,241,109 497,721 858 5.9 183.5500–999 m 1,083,334 2.75 −34.9 to 25.0 1,068,358 12.57 −20.0 to 40.2 1,165,886 493,390 1033 6.7 169.51000–1499 m 424,052 1.23 −31.0 to 22.7 424,053 10.46 −20.6 to 35.0 440,489 185,123 1139 7.4 205.0≥1500 m 220,608 −1.92 −34.3 to 21.6 219,146 4.87 −31.2 to 38.6 235,584 110,953 1314 7.7 160.0
N: number of daily observations;̄x: mean daily values; min and max: minimum and maximum range of the data; NRO: number of observed rainy days; Prcp/y: averageannual total precipitation; Prcp/d: average precipitation on days with rain; and Prcpmax: maximum precipitation on days with rain. The number of climate stations varied byyear (seeFig. 1). The forest climate zones are defined according toFig. 2. This data set was used for performing the sensitivity analysis.
H. Hasenauer et al. / Agricultural and Forest Meteorology 119 (2003) 87–107 93
Fig. 2. The distribution of the climate stations within Austria used to initialize DAYMET and of 23 stations used to validate the modelinterpolations. Also shown are the six forest climate zones based onKilian et al. (1994).
wet, Norway spruce, fir and common beech) and east-ern pannonic semiarid region (dry and warm summerwith low winter temperatures, areas with the lowestannual precipitation rates in Austria, dominated bymixed oak stands); and region 6: southern calcareousAlps (illyric climate, wet to moderately dry with longfrost periods in winter in the inner alpine valleys, Nor-way spruce, fir and common beech).
The second data set includes 23 weather stationsacross Austria. It consists of dailyTmin and Tmax aswell precipitation observations plus total daily globalshort wave radiation. Daily water vapor pressure wasdetermined from near-surface-air temperature and rel-ative humidity observations taken at 7 a.m. With theobserved near-surface-air temperature we calculatedthe vapor pressure at saturation for each day accord-ing toAbbott and Tabony (1985). The actual daily va-por pressure was then derived as the vapor pressureat saturation multiplied by the observed relative hu-midity at 7 a.m. A single value of vapor pressure (VP(Pa)) was used for each day because it is assumedthat the diurnal changes in water vapor pressure aresmall. Note that this differs from the procedure im-
plemented in DAYMET, which estimates water vaporpressure deficit according to the assumption thatTmincan be set equal to dew point temperature (Kimballet al., 1997). Thus, we are able to assess the accuracyof VP as implemented in DAYMET versus Daily VPdriven from humidity observations at 7 a.m.
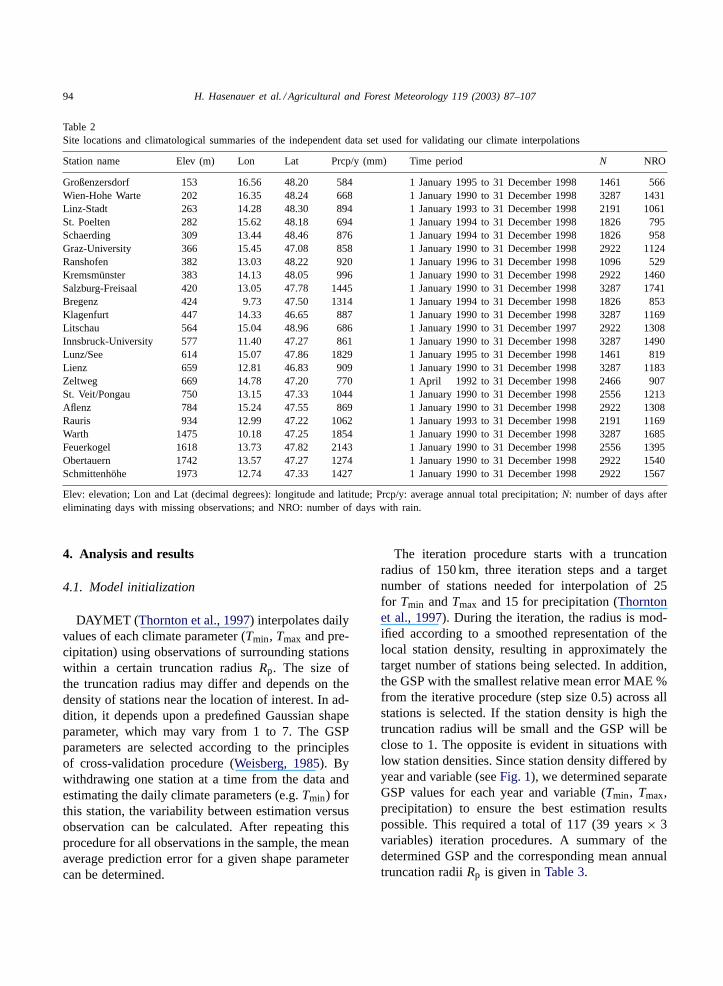
For each station in the validation data set we se-lected years with a full record of temperature, precip-itation and humidity. Precipitation recorded as ‘trace’was replaced with 0.0 mm. Some stations had miss-ing radiation observations within the period of record.Station locations, climatological data and the availableperiod for each station are listed inTable 2.
Both data sets as well as the station informationobtained from the neighboring countries are an ex-cellent source for initializing DAYMET and for per-forming a sensitivity and validation study of dailyclimate interpolations across a complex mountainousterrain within central Europe. In addition, the inde-pendent validation data represent a typical applicationexample of DAYMET as it will be used in the fu-ture for generating missing daily input data for forestecosystem-modeling purposes.
94 H. Hasenauer et al. / Agricultural and Forest Meteorology 119 (2003) 87–107
Table 2Site locations and climatological summaries of the independent data set used for validating our climate interpolations
Station name Elev (m) Lon Lat Prcp/y (mm) Time period N NRO
Großenzersdorf 153 16.56 48.20 584 1 January 1995 to 31 December 1998 1461 566Wien-Hohe Warte 202 16.35 48.24 668 1 January 1990 to 31 December 1998 3287 1431Linz-Stadt 263 14.28 48.30 894 1 January 1993 to 31 December 1998 2191 1061St. Poelten 282 15.62 48.18 694 1 January 1994 to 31 December 1998 1826 795Schaerding 309 13.44 48.46 876 1 January 1994 to 31 December 1998 1826 958Graz-University 366 15.45 47.08 858 1 January 1990 to 31 December 1998 2922 1124Ranshofen 382 13.03 48.22 920 1 January 1996 to 31 December 1998 1096 529Kremsmünster 383 14.13 48.05 996 1 January 1990 to 31 December 1998 2922 1460Salzburg-Freisaal 420 13.05 47.78 1445 1 January 1990 to 31 December 1998 3287 1741Bregenz 424 9.73 47.50 1314 1 January 1994 to 31 December 1998 1826 853Klagenfurt 447 14.33 46.65 887 1 January 1990 to 31 December 1998 3287 1169Litschau 564 15.04 48.96 686 1 January 1990 to 31 December 1997 2922 1308Innsbruck-University 577 11.40 47.27 861 1 January 1990 to 31 December 1998 3287 1490Lunz/See 614 15.07 47.86 1829 1 January 1995 to 31 December 1998 1461 819Lienz 659 12.81 46.83 909 1 January 1990 to 31 December 1998 3287 1183Zeltweg 669 14.78 47.20 770 1 April 1992 to 31 December 1998 2466 907St. Veit/Pongau 750 13.15 47.33 1044 1 January 1990 to 31 December 1998 2556 1213Aflenz 784 15.24 47.55 869 1 January 1990 to 31 December 1998 2922 1308Rauris 934 12.99 47.22 1062 1 January 1993 to 31 December 1998 2191 1169Warth 1475 10.18 47.25 1854 1 January 1990 to 31 December 1998 3287 1685Feuerkogel 1618 13.73 47.82 2143 1 January 1990 to 31 December 1998 2556 1395Obertauern 1742 13.57 47.27 1274 1 January 1990 to 31 December 1998 2922 1540Schmittenhöhe 1973 12.74 47.33 1427 1 January 1990 to 31 December 1998 2922 1567
Elev: elevation; Lon and Lat (decimal degrees): longitude and latitude; Prcp/y: average annual total precipitation;N: number of days aftereliminating days with missing observations; and NRO: number of days with rain.
4. Analysis and results
4.1. Model initialization
DAYMET (Thornton et al., 1997) interpolates dailyvalues of each climate parameter (Tmin, Tmax and pre-cipitation) using observations of surrounding stationswithin a certain truncation radiusRp. The size ofthe truncation radius may differ and depends on thedensity of stations near the location of interest. In ad-dition, it depends upon a predefined Gaussian shapeparameter, which may vary from 1 to 7. The GSPparameters are selected according to the principlesof cross-validation procedure (Weisberg, 1985). Bywithdrawing one station at a time from the data andestimating the daily climate parameters (e.g.Tmin) forthis station, the variability between estimation versusobservation can be calculated. After repeating thisprocedure for all observations in the sample, the meanaverage prediction error for a given shape parametercan be determined.
The iteration procedure starts with a truncationradius of 150 km, three iteration steps and a targetnumber of stations needed for interpolation of 25for Tmin andTmax and 15 for precipitation (Thorntonet al., 1997). During the iteration, the radius is mod-ified according to a smoothed representation of thelocal station density, resulting in approximately thetarget number of stations being selected. In addition,the GSP with the smallest relative mean error MAE %from the iterative procedure (step size 0.5) across allstations is selected. If the station density is high thetruncation radius will be small and the GSP will beclose to 1. The opposite is evident in situations withlow station densities. Since station density differed byyear and variable (seeFig. 1), we determined separateGSP values for each year and variable (Tmin, Tmax,precipitation) to ensure the best estimation resultspossible. This required a total of 117 (39 years× 3variables) iteration procedures. A summary of thedetermined GSP and the corresponding mean annualtruncation radiiRp is given inTable 3.
H. Hasenauer et al. / Agricultural and Forest Meteorology 119 (2003) 87–107 95
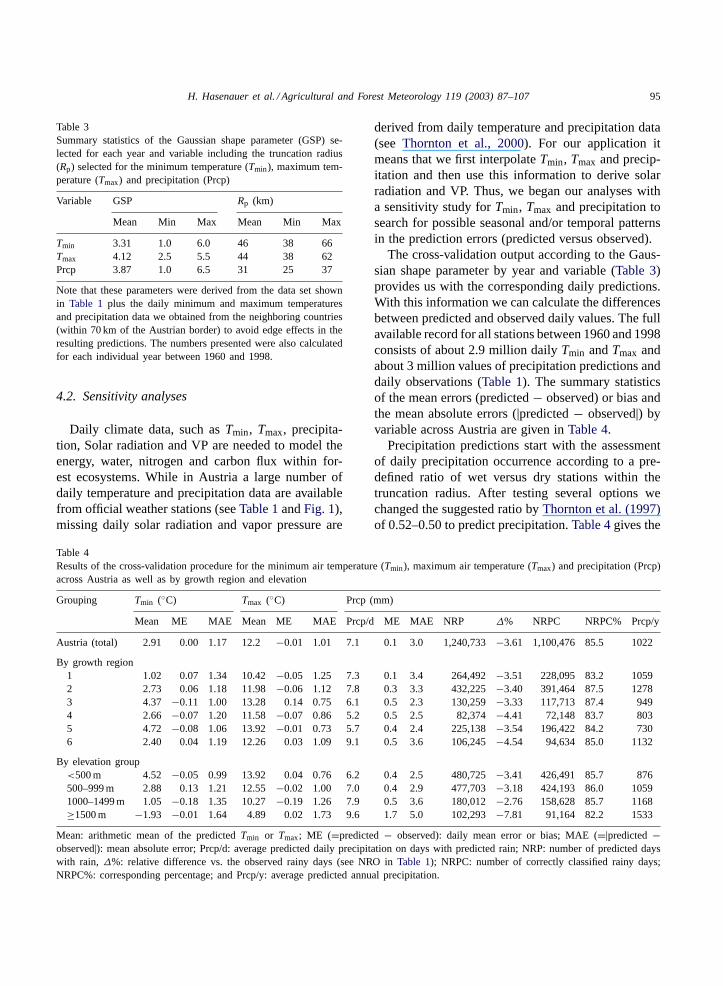
Table 3Summary statistics of the Gaussian shape parameter (GSP) se-lected for each year and variable including the truncation radius(Rp) selected for the minimum temperature (Tmin), maximum tem-perature (Tmax) and precipitation (Prcp)
Variable GSP Rp (km)
Mean Min Max Mean Min Max
Tmin 3.31 1.0 6.0 46 38 66Tmax 4.12 2.5 5.5 44 38 62Prcp 3.87 1.0 6.5 31 25 37
Note that these parameters were derived from the data set shownin Table 1 plus the daily minimum and maximum temperaturesand precipitation data we obtained from the neighboring countries(within 70 km of the Austrian border) to avoid edge effects in theresulting predictions. The numbers presented were also calculatedfor each individual year between 1960 and 1998.
4.2. Sensitivity analyses
Daily climate data, such asTmin, Tmax, precipita-tion, Solar radiation and VP are needed to model theenergy, water, nitrogen and carbon flux within for-est ecosystems. While in Austria a large number ofdaily temperature and precipitation data are availablefrom official weather stations (seeTable 1andFig. 1),missing daily solar radiation and vapor pressure are
Table 4Results of the cross-validation procedure for the minimum air temperature (Tmin), maximum air temperature (Tmax) and precipitation (Prcp)across Austria as well as by growth region and elevation
Grouping Tmin (◦C) Tmax (◦C) Prcp (mm)
Mean ME MAE Mean ME MAE Prcp/d ME MAE NRP ∆% NRPC NRPC% Prcp/y
Austria (total) 2.91 0.00 1.17 12.2 −0.01 1.01 7.1 0.1 3.0 1,240,733−3.61 1,100,476 85.5 1022
By growth region1 1.02 0.07 1.34 10.42−0.05 1.25 7.3 0.1 3.4 264,492−3.51 228,095 83.2 10592 2.73 0.06 1.18 11.98−0.06 1.12 7.8 0.3 3.3 432,225−3.40 391,464 87.5 12783 4.37 −0.11 1.00 13.28 0.14 0.75 6.1 0.5 2.3 130,259−3.33 117,713 87.4 9494 2.66 −0.07 1.20 11.58 −0.07 0.86 5.2 0.5 2.5 82,374−4.41 72,148 83.7 8035 4.72 −0.08 1.06 13.92 −0.01 0.73 5.7 0.4 2.4 225,138−3.54 196,422 84.2 7306 2.40 0.04 1.19 12.26 0.03 1.09 9.1 0.5 3.6 106,245−4.54 94,634 85.0 1132
By elevation group<500 m 4.52 −0.05 0.99 13.92 0.04 0.76 6.2 0.4 2.5 480,725−3.41 426,491 85.7 876500–999 m 2.88 0.13 1.21 12.55−0.02 1.00 7.0 0.4 2.9 477,703−3.18 424,193 86.0 10591000–1499 m 1.05 −0.18 1.35 10.27 −0.19 1.26 7.9 0.5 3.6 180,012−2.76 158,628 85.7 1168≥1500 m −1.93 −0.01 1.64 4.89 0.02 1.73 9.6 1.7 5.0 102,293−7.81 91,164 82.2 1533
Mean: arithmetic mean of the predictedTmin or Tmax; ME (=predicted− observed): daily mean error or bias; MAE (=|predicted−observed|): mean absolute error; Prcp/d: average predicted daily precipitation on days with predicted rain; NRP: number of predicted dayswith rain, ∆%: relative difference vs. the observed rainy days (see NRO inTable 1); NRPC: number of correctly classified rainy days;NRPC%: corresponding percentage; and Prcp/y: average predicted annual precipitation.
derived from daily temperature and precipitation data(see Thornton et al., 2000). For our application itmeans that we first interpolateTmin, Tmax and precip-itation and then use this information to derive solarradiation and VP. Thus, we began our analyses witha sensitivity study forTmin, Tmax and precipitation tosearch for possible seasonal and/or temporal patternsin the prediction errors (predicted versus observed).
The cross-validation output according to the Gaus-sian shape parameter by year and variable (Table 3)provides us with the corresponding daily predictions.With this information we can calculate the differencesbetween predicted and observed daily values. The fullavailable record for all stations between 1960 and 1998consists of about 2.9 million dailyTmin andTmax andabout 3 million values of precipitation predictions anddaily observations (Table 1). The summary statisticsof the mean errors (predicted− observed) or bias andthe mean absolute errors (|predicted− observed|) byvariable across Austria are given inTable 4.
Precipitation predictions start with the assessmentof daily precipitation occurrence according to a pre-defined ratio of wet versus dry stations within thetruncation radius. After testing several options wechanged the suggested ratio byThornton et al. (1997)of 0.52–0.50 to predict precipitation.Table 4gives the
96 H. Hasenauer et al. / Agricultural and Forest Meteorology 119 (2003) 87–107
mean errors and mean absolute errors. Additionallywe computed the number of days with predicted rainNRP, the relative difference versus the observed num-ber of days (NRO) with rain∆% = (NRP − NRO)/NRO, the correctly predicted days with rain NRPC andtheir percentage NRPC% versus NRO plus the pre-dicted mean annual rainfall for the 39 years (Prcp/y).
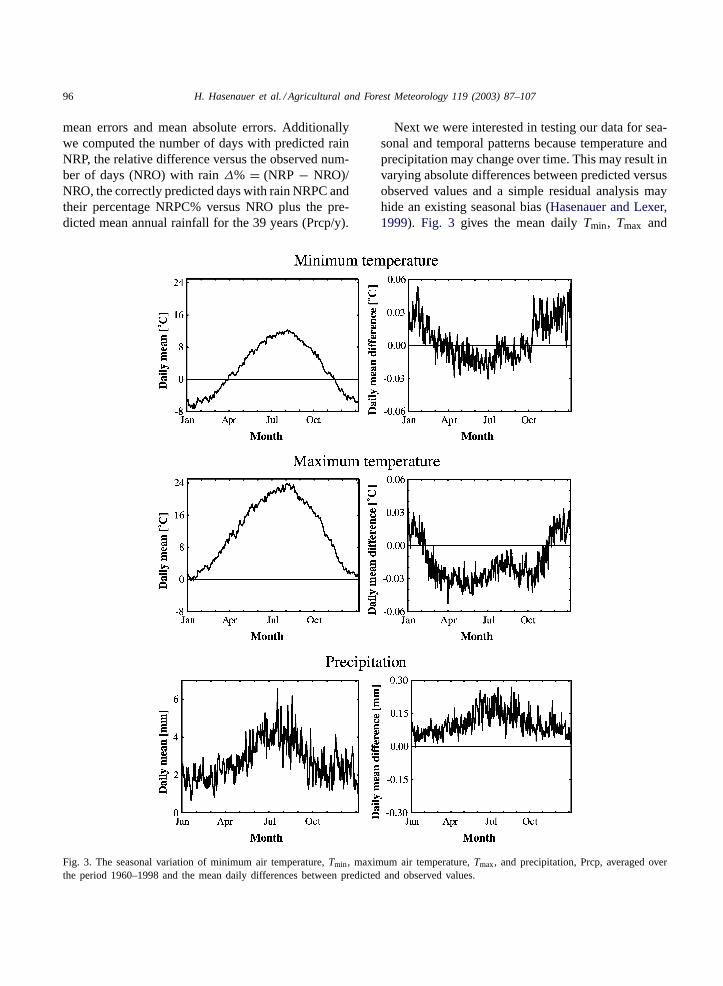
Fig. 3. The seasonal variation of minimum air temperature,Tmin, maximum air temperature,Tmax, and precipitation, Prcp, averaged overthe period 1960–1998 and the mean daily differences between predicted and observed values.
Next we were interested in testing our data for sea-sonal and temporal patterns because temperature andprecipitation may change over time. This may result invarying absolute differences between predicted versusobserved values and a simple residual analysis mayhide an existing seasonal bias (Hasenauer and Lexer,1999). Fig. 3 gives the mean dailyTmin, Tmax and
H. Hasenauer et al. / Agricultural and Forest Meteorology 119 (2003) 87–107 97
precipitation including the differences between pre-dicted versus observed values. Note that the mean sea-sonal error range for all across Austria was<0.1◦Cand thus smaller than the measurement error (Böhm,1992; Auer, 1993). Only during the summer periodprecipitation tends to slightly exceed this number.
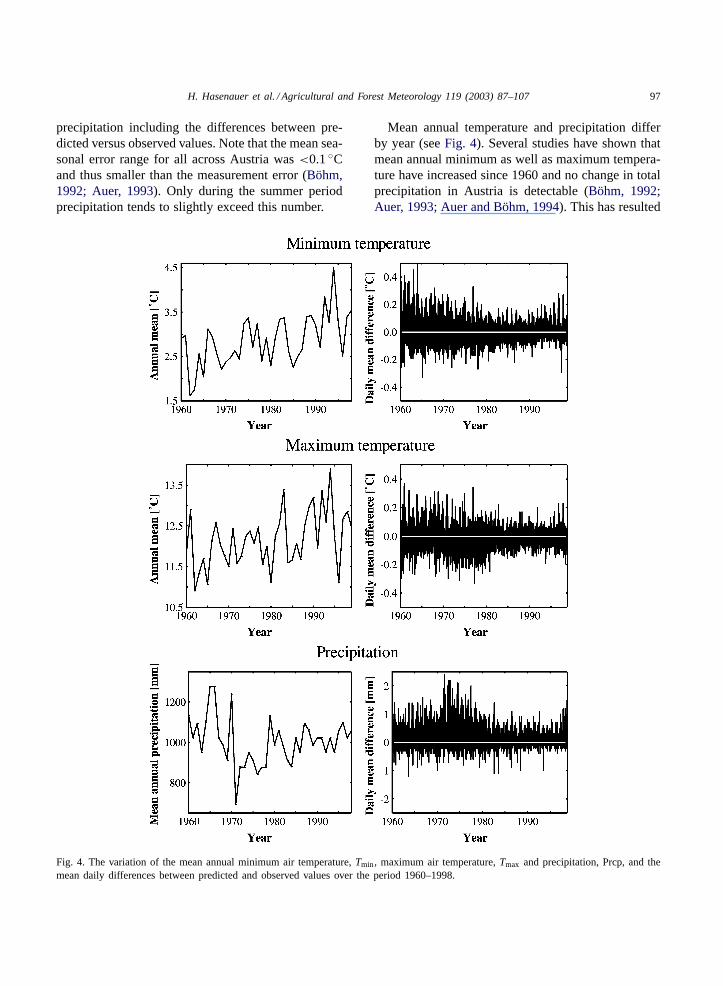
Fig. 4. The variation of the mean annual minimum air temperature,Tmin, maximum air temperature,Tmax and precipitation, Prcp, and themean daily differences between predicted and observed values over the period 1960–1998.
Mean annual temperature and precipitation differby year (seeFig. 4). Several studies have shown thatmean annual minimum as well as maximum tempera-ture have increased since 1960 and no change in totalprecipitation in Austria is detectable (Böhm, 1992;Auer, 1993; Auer and Böhm, 1994). This has resulted
98 H. Hasenauer et al. / Agricultural and Forest Meteorology 119 (2003) 87–107
in shorter periods of lake ice-cover on mountain lakes(Sommaruga-Wögrath et al., 1997) and higher treegrowth increment rates in the late 1980s (Hasenaueret al., 1999) in Austria. For a climate interpolationmodel such as DAYMET it is important that differ-ences between predicted and observed values are inde-pendent from the mean temperature and precipitationdevelopment by year or season. Only this will ensureunbiased interpolation results.Fig. 4 shows the meanannualTmin, Tmax and precipitation development plusthe corresponding daily mean differences between pre-dicted versus observed values in Austria (all stationsavailable) between 1960 and 1998. The graphs to theleft give the mean development for each year. Thegraphs to the right represent the mean daily values of14,245 days, the time period between 1 January 1960and 31 December 1998.
The six forest climate zones of Austria (Fig. 2) rep-resent the major forest eco-climatic conditions as theyare considered to affect tree growth. They are also typi-cal for the species distribution in the country. Thus, wetested the resulting predictions by growth region forpossible seasonal as well as temporal trends.Table 4presents the predicted mean dailyTmin, Tmax and pre-cipitation, the mean error and the mean absolute error.Again, for precipitation we additionally assessed thenumber of predicted rainy days, the difference versusobserved rainy days, the number of correctly predictedrainy days plus the mean annual precipitation rate.
Seasonal trend analysis forTmin, Tmax and precipi-tation within each of the 6 forest climate zones indi-cated no significant trends (α = 0.05). TheR2 valuesfor Tmin, Tmax, and precipitation ranged between 0.00and 0.08 with correspondingt values between 0 and1.58, which is smaller than the table value ofttable =1.96, for α = 0.05, andn = 365. The daily meanminimum and maximum values ranged between –0.2and+0.2◦C and were randomly distributed through-out the year. The only exception was theTmax devel-opment in forest climate zones 3 and 4. While in theregion 3 a mean overestimation for the winter months(October to February) of 0.21◦C was evident, in theregion 4 daily mean differences within this time periodwere lower by−0.2◦C on average. For precipitationno such patterns were detectable.
Climate conditions of an Alpine country like Aus-tria are strongly affected by elevation. Temperaturedecreases with increasing elevation and precipita-
tion rates generally increase with higher elevation.To test our predictions for a potential elevation bias,we grouped our Austrian climate data accordingto four different elevation classes:<500, 500–999,1000–1499 and≥1500 m. Similar toFigs. 3 and 4, wetested for seasonal and temporal trends (39-year timeperiod) by elevation grouping and climate variable.Graphs (not shown) suggested no trend. The resultingelevation group statistics are given inTable 4. Theysuggest thatTmin andTmax values are within the ex-pected error range (<0.1◦C) and the differences arerandomly distributed.
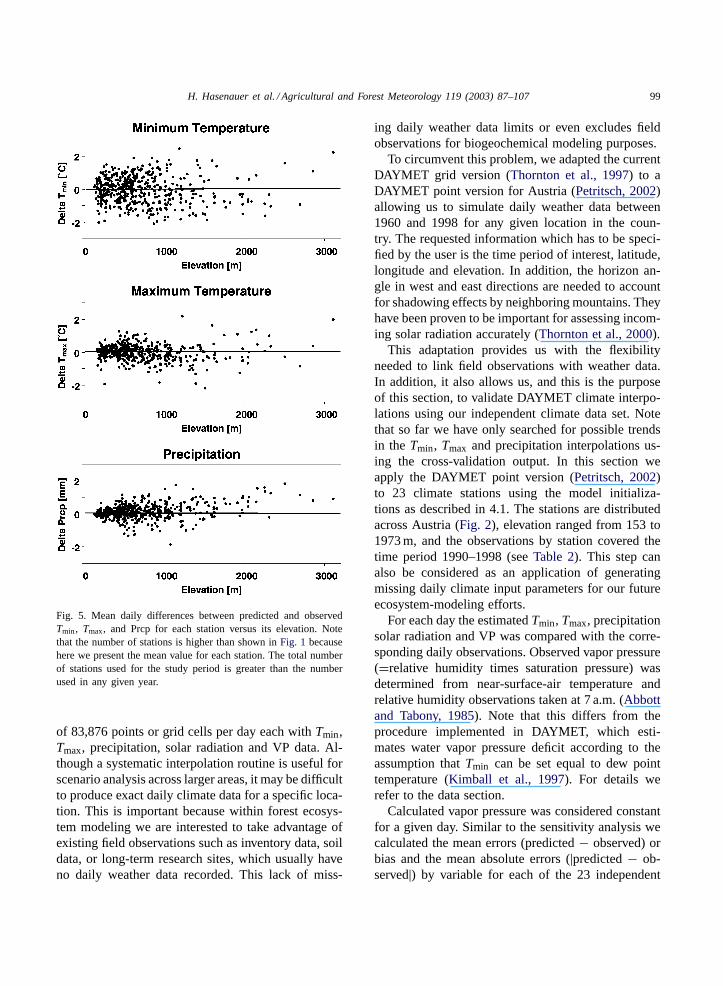
For precipitation, however, it is interesting to notethat all elevation groups tend to range around zeroexcept climate stations above≥1500 m in elevation(Table 4). Thus, we next analyzed our data for a pos-sible elevation related bias by calculating for each cli-mate station the mean of all daily differences forTmin,Tmax, and precipitation and plotted the results versuselevation (Fig. 5). Note that we used all stations avail-able during the 39 years. A trend analysis of theseresiduals exhibited no significant relationship forTmin(R2 = 0.0047,t = 1.52 < ttable, n = 472,α = 0.05),and for Tmax (R2 = 0.0034, t = 1.24 < ttable, n =455, α = 0.05) suggesting that DAYMET producesunbiased results.
For precipitation the trend analysis resulted in a sig-nificant systematic trend (R2 = 0.078, t = 6.40 >
ttable, n = 484, α = 0.05). Considering the resultsof Table 4and Fig. 5 we assumed that this trend isprobably due to an overestimation of daily precipita-tion rates for stations located in higher altitudes, whilethe precipitation estimates in lower elevations seem tobe unbiased. For testing this hypothesis we removedthe 35 stations located above 1500 m (seeFig. 7) andtested the residuals of the remaining 446 stations fora possible significant trend. The results indicated notrend or bias (R2 = 0.0082, t = 1.90 < ttable, n =446,α = 0.05) for precipitation interpolations below1500 m in elevation.
4.3. Independent model validation
The current version of DAYMET (Thornton et al.,1997) interpolatesTmin, Tmax and precipitation on asystematic grid (1 km grid size) using a digital ele-vation map for the area of interest. According to thesize of the country, a full record for Austria consists
H. Hasenauer et al. / Agricultural and Forest Meteorology 119 (2003) 87–107 99
Fig. 5. Mean daily differences between predicted and observedTmin, Tmax, and Prcp for each station versus its elevation. Notethat the number of stations is higher than shown inFig. 1 becausehere we present the mean value for each station. The total numberof stations used for the study period is greater than the numberused in any given year.
of 83,876 points or grid cells per day each withTmin,Tmax, precipitation, solar radiation and VP data. Al-though a systematic interpolation routine is useful forscenario analysis across larger areas, it may be difficultto produce exact daily climate data for a specific loca-tion. This is important because within forest ecosys-tem modeling we are interested to take advantage ofexisting field observations such as inventory data, soildata, or long-term research sites, which usually haveno daily weather data recorded. This lack of miss-
ing daily weather data limits or even excludes fieldobservations for biogeochemical modeling purposes.
To circumvent this problem, we adapted the currentDAYMET grid version (Thornton et al., 1997) to aDAYMET point version for Austria (Petritsch, 2002)allowing us to simulate daily weather data between1960 and 1998 for any given location in the coun-try. The requested information which has to be speci-fied by the user is the time period of interest, latitude,longitude and elevation. In addition, the horizon an-gle in west and east directions are needed to accountfor shadowing effects by neighboring mountains. Theyhave been proven to be important for assessing incom-ing solar radiation accurately (Thornton et al., 2000).
This adaptation provides us with the flexibilityneeded to link field observations with weather data.In addition, it also allows us, and this is the purposeof this section, to validate DAYMET climate interpo-lations using our independent climate data set. Notethat so far we have only searched for possible trendsin the Tmin, Tmax and precipitation interpolations us-ing the cross-validation output. In this section weapply the DAYMET point version (Petritsch, 2002)to 23 climate stations using the model initializa-tions as described in 4.1. The stations are distributedacross Austria (Fig. 2), elevation ranged from 153 to1973 m, and the observations by station covered thetime period 1990–1998 (seeTable 2). This step canalso be considered as an application of generatingmissing daily climate input parameters for our futureecosystem-modeling efforts.
For each day the estimatedTmin, Tmax, precipitationsolar radiation and VP was compared with the corre-sponding daily observations. Observed vapor pressure(=relative humidity times saturation pressure) wasdetermined from near-surface-air temperature andrelative humidity observations taken at 7 a.m. (Abbottand Tabony, 1985). Note that this differs from theprocedure implemented in DAYMET, which esti-mates water vapor pressure deficit according to theassumption thatTmin can be set equal to dew pointtemperature (Kimball et al., 1997). For details werefer to the data section.
Calculated vapor pressure was considered constantfor a given day. Similar to the sensitivity analysis wecalculated the mean errors (predicted− observed) orbias and the mean absolute errors (|predicted− ob-served|) by variable for each of the 23 independent
100H
.H
asenaueret
al./Agricultural
andForest
Meteorology
119(2003)
87–107
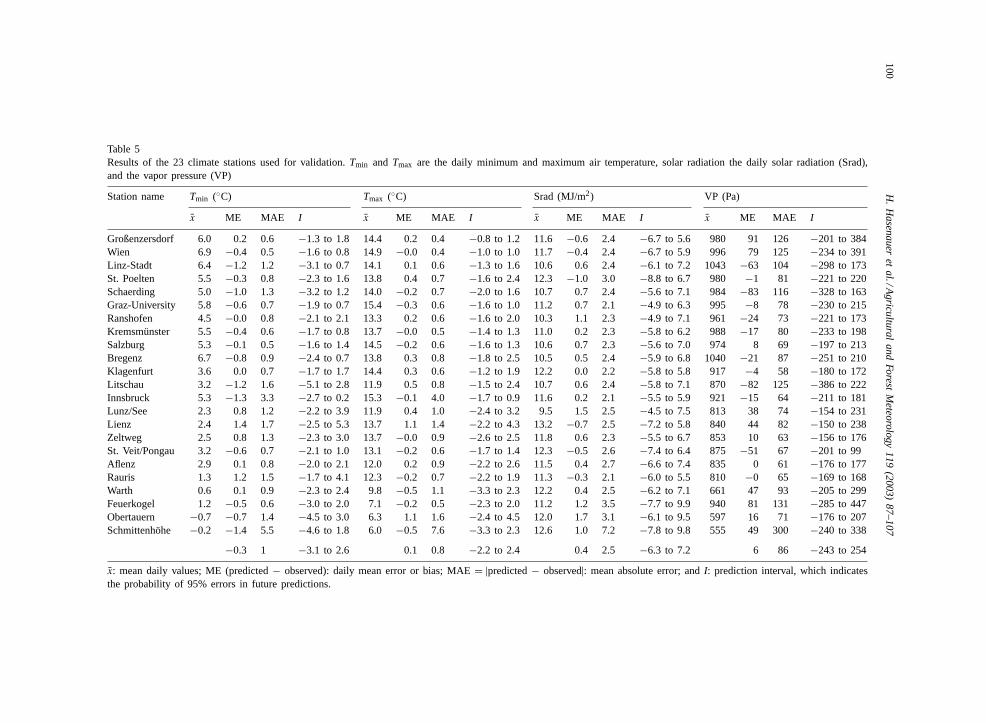
Table 5Results of the 23 climate stations used for validation.Tmin and Tmax are the daily minimum and maximum air temperature, solar radiation the daily solar radiation (Srad),and the vapor pressure (VP)
Station name Tmin (◦C) Tmax (◦C) Srad (MJ/m2) VP (Pa)
x̄ ME MAE I x̄ ME MAE I x̄ ME MAE I x̄ ME MAE I
Großenzersdorf 6.0 0.2 0.6 −1.3 to 1.8 14.4 0.2 0.4 −0.8 to 1.2 11.6 −0.6 2.4 −6.7 to 5.6 980 91 126 −201 to 384Wien 6.9 −0.4 0.5 −1.6 to 0.8 14.9 −0.0 0.4 −1.0 to 1.0 11.7 −0.4 2.4 −6.7 to 5.9 996 79 125 −234 to 391Linz-Stadt 6.4 −1.2 1.2 −3.1 to 0.7 14.1 0.1 0.6 −1.3 to 1.6 10.6 0.6 2.4 −6.1 to 7.2 1043 −63 104 −298 to 173St. Poelten 5.5 −0.3 0.8 −2.3 to 1.6 13.8 0.4 0.7 −1.6 to 2.4 12.3 −1.0 3.0 −8.8 to 6.7 980 −1 81 −221 to 220Schaerding 5.0 −1.0 1.3 −3.2 to 1.2 14.0 −0.2 0.7 −2.0 to 1.6 10.7 0.7 2.4 −5.6 to 7.1 984 −83 116 −328 to 163Graz-University 5.8 −0.6 0.7 −1.9 to 0.7 15.4 −0.3 0.6 −1.6 to 1.0 11.2 0.7 2.1 −4.9 to 6.3 995 −8 78 −230 to 215Ranshofen 4.5 −0.0 0.8 −2.1 to 2.1 13.3 0.2 0.6 −1.6 to 2.0 10.3 1.1 2.3 −4.9 to 7.1 961 −24 73 −221 to 173Kremsmünster 5.5 −0.4 0.6 −1.7 to 0.8 13.7 −0.0 0.5 −1.4 to 1.3 11.0 0.2 2.3 −5.8 to 6.2 988 −17 80 −233 to 198Salzburg 5.3 −0.1 0.5 −1.6 to 1.4 14.5 −0.2 0.6 −1.6 to 1.3 10.6 0.7 2.3 −5.6 to 7.0 974 8 69 −197 to 213Bregenz 6.7 −0.8 0.9 −2.4 to 0.7 13.8 0.3 0.8 −1.8 to 2.5 10.5 0.5 2.4 −5.9 to 6.8 1040 −21 87 −251 to 210Klagenfurt 3.6 0.0 0.7 −1.7 to 1.7 14.4 0.3 0.6 −1.2 to 1.9 12.2 0.0 2.2 −5.8 to 5.8 917 −4 58 −180 to 172Litschau 3.2 −1.2 1.6 −5.1 to 2.8 11.9 0.5 0.8 −1.5 to 2.4 10.7 0.6 2.4 −5.8 to 7.1 870 −82 125 −386 to 222Innsbruck 5.3 −1.3 3.3 −2.7 to 0.2 15.3 −0.1 4.0 −1.7 to 0.9 11.6 0.2 2.1 −5.5 to 5.9 921 −15 64 −211 to 181Lunz/See 2.3 0.8 1.2 −2.2 to 3.9 11.9 0.4 1.0 −2.4 to 3.2 9.5 1.5 2.5 −4.5 to 7.5 813 38 74 −154 to 231Lienz 2.4 1.4 1.7 −2.5 to 5.3 13.7 1.1 1.4 −2.2 to 4.3 13.2 −0.7 2.5 −7.2 to 5.8 840 44 82 −150 to 238Zeltweg 2.5 0.8 1.3 −2.3 to 3.0 13.7 −0.0 0.9 −2.6 to 2.5 11.8 0.6 2.3 −5.5 to 6.7 853 10 63 −156 to 176St. Veit/Pongau 3.2 −0.6 0.7 −2.1 to 1.0 13.1 −0.2 0.6 −1.7 to 1.4 12.3 −0.5 2.6 −7.4 to 6.4 875 −51 67 −201 to 99Aflenz 2.9 0.1 0.8 −2.0 to 2.1 12.0 0.2 0.9 −2.2 to 2.6 11.5 0.4 2.7 −6.6 to 7.4 835 0 61 −176 to 177Rauris 1.3 1.2 1.5 −1.7 to 4.1 12.3 −0.2 0.7 −2.2 to 1.9 11.3 −0.3 2.1 −6.0 to 5.5 810 −0 65 −169 to 168Warth 0.6 0.1 0.9 −2.3 to 2.4 9.8 −0.5 1.1 −3.3 to 2.3 12.2 0.4 2.5 −6.2 to 7.1 661 47 93 −205 to 299Feuerkogel 1.2 −0.5 0.6 −3.0 to 2.0 7.1 −0.2 0.5 −2.3 to 2.0 11.2 1.2 3.5 −7.7 to 9.9 940 81 131 −285 to 447Obertauern −0.7 −0.7 1.4 −4.5 to 3.0 6.3 1.1 1.6 −2.4 to 4.5 12.0 1.7 3.1 −6.1 to 9.5 597 16 71 −176 to 207Schmittenhöhe −0.2 −1.4 5.5 −4.6 to 1.8 6.0 −0.5 7.6 −3.3 to 2.3 12.6 1.0 7.2 −7.8 to 9.8 555 49 300 −240 to 338
−0.3 1 −3.1 to 2.6 0.1 0.8 −2.2 to 2.4 0.4 2.5 −6.3 to 7.2 6 86 −243 to 254
x̄: mean daily values; ME (predicted− observed): daily mean error or bias; MAE= |predicted− observed|: mean absolute error; andI: prediction interval, which indicatesthe probability of 95% errors in future predictions.
H. Hasenauer et al. / Agricultural and Forest Meteorology 119 (2003) 87–107 101
stations (Table 5). In addition, we determined theprediction interval (I) according to Reynolds (1984)which can be interpreted as the range of the differ-ences among the predicted versus observed values:
I = D̄ ± SD
√1 + 1
nt1−0.5α,n−1 (4)
whereD̄ is the mean difference andSD the standarddeviation of the differences,n is the sample size byclimate variable, andt is the 1− α/2 quantile of thet-distribution withn−1 degrees of freedom. (Table 5).For example the results forTmin at Großenzersdorf canbe interpreted as follows: with a probability of 95%the errors in the futureTmin predictions at this stationwill be between−1.33 and 1.76◦C.
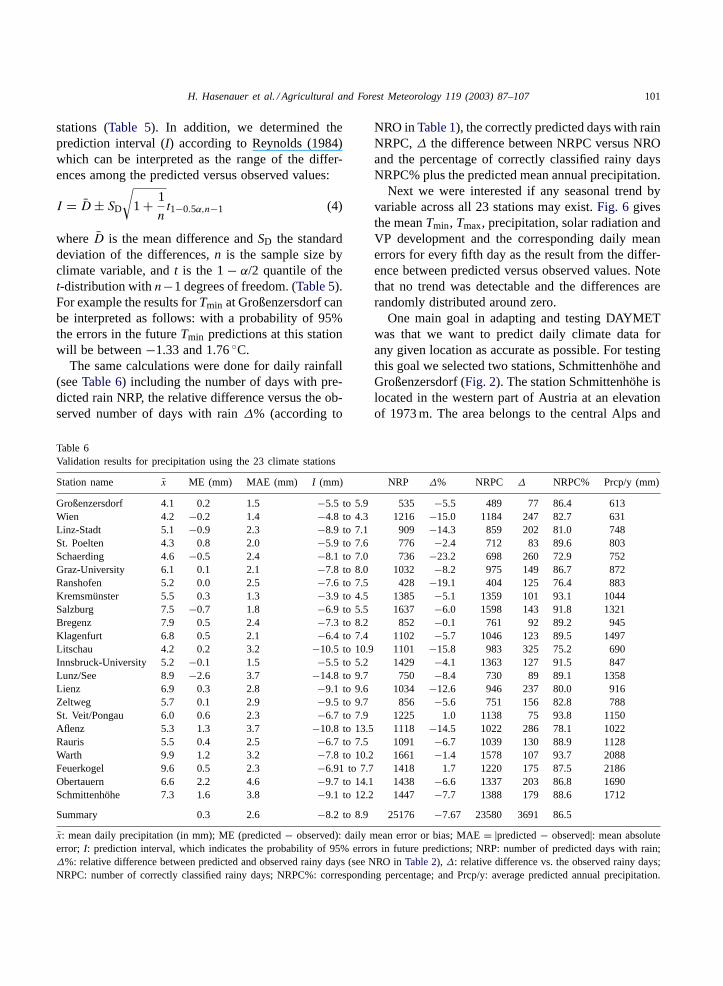
The same calculations were done for daily rainfall(seeTable 6) including the number of days with pre-dicted rain NRP, the relative difference versus the ob-served number of days with rain∆% (according to
Table 6Validation results for precipitation using the 23 climate stations
Station name x̄ ME (mm) MAE (mm) I (mm) NRP ∆% NRPC ∆ NRPC% Prcp/y (mm)
Großenzersdorf 4.1 0.2 1.5 −5.5 to 5.9 535 −5.5 489 77 86.4 613Wien 4.2 −0.2 1.4 −4.8 to 4.3 1216 −15.0 1184 247 82.7 631Linz-Stadt 5.1 −0.9 2.3 −8.9 to 7.1 909 −14.3 859 202 81.0 748St. Poelten 4.3 0.8 2.0 −5.9 to 7.6 776 −2.4 712 83 89.6 803Schaerding 4.6 −0.5 2.4 −8.1 to 7.0 736 −23.2 698 260 72.9 752Graz-University 6.1 0.1 2.1 −7.8 to 8.0 1032 −8.2 975 149 86.7 872Ranshofen 5.2 0.0 2.5 −7.6 to 7.5 428 −19.1 404 125 76.4 883Kremsmünster 5.5 0.3 1.3 −3.9 to 4.5 1385 −5.1 1359 101 93.1 1044Salzburg 7.5 −0.7 1.8 −6.9 to 5.5 1637 −6.0 1598 143 91.8 1321Bregenz 7.9 0.5 2.4 −7.3 to 8.2 852 −0.1 761 92 89.2 945Klagenfurt 6.8 0.5 2.1 −6.4 to 7.4 1102 −5.7 1046 123 89.5 1497Litschau 4.2 0.2 3.2 −10.5 to 10.9 1101 −15.8 983 325 75.2 690Innsbruck-University 5.2 −0.1 1.5 −5.5 to 5.2 1429 −4.1 1363 127 91.5 847Lunz/See 8.9 −2.6 3.7 −14.8 to 9.7 750 −8.4 730 89 89.1 1358Lienz 6.9 0.3 2.8 −9.1 to 9.6 1034 −12.6 946 237 80.0 916Zeltweg 5.7 0.1 2.9 −9.5 to 9.7 856 −5.6 751 156 82.8 788St. Veit/Pongau 6.0 0.6 2.3 −6.7 to 7.9 1225 1.0 1138 75 93.8 1150Aflenz 5.3 1.3 3.7 −10.8 to 13.5 1118 −14.5 1022 286 78.1 1022Rauris 5.5 0.4 2.5 −6.7 to 7.5 1091 −6.7 1039 130 88.9 1128Warth 9.9 1.2 3.2 −7.8 to 10.2 1661 −1.4 1578 107 93.7 2088Feuerkogel 9.6 0.5 2.3 −6.91 to 7.7 1418 1.7 1220 175 87.5 2186Obertauern 6.6 2.2 4.6 −9.7 to 14.1 1438 −6.6 1337 203 86.8 1690Schmittenhöhe 7.3 1.6 3.8 −9.1 to 12.2 1447 −7.7 1388 179 88.6 1712
Summary 0.3 2.6 −8.2 to 8.9 25176 −7.67 23580 3691 86.5
x̄: mean daily precipitation (in mm); ME (predicted− observed): daily mean error or bias; MAE= |predicted− observed|: mean absoluteerror; I: prediction interval, which indicates the probability of 95% errors in future predictions; NRP: number of predicted days with rain;∆%: relative difference between predicted and observed rainy days (see NRO inTable 2), ∆: relative difference vs. the observed rainy days;NRPC: number of correctly classified rainy days; NRPC%: corresponding percentage; and Prcp/y: average predicted annual precipitation.
NRO inTable 1), the correctly predicted days with rainNRPC,∆ the difference between NRPC versus NROand the percentage of correctly classified rainy daysNRPC% plus the predicted mean annual precipitation.
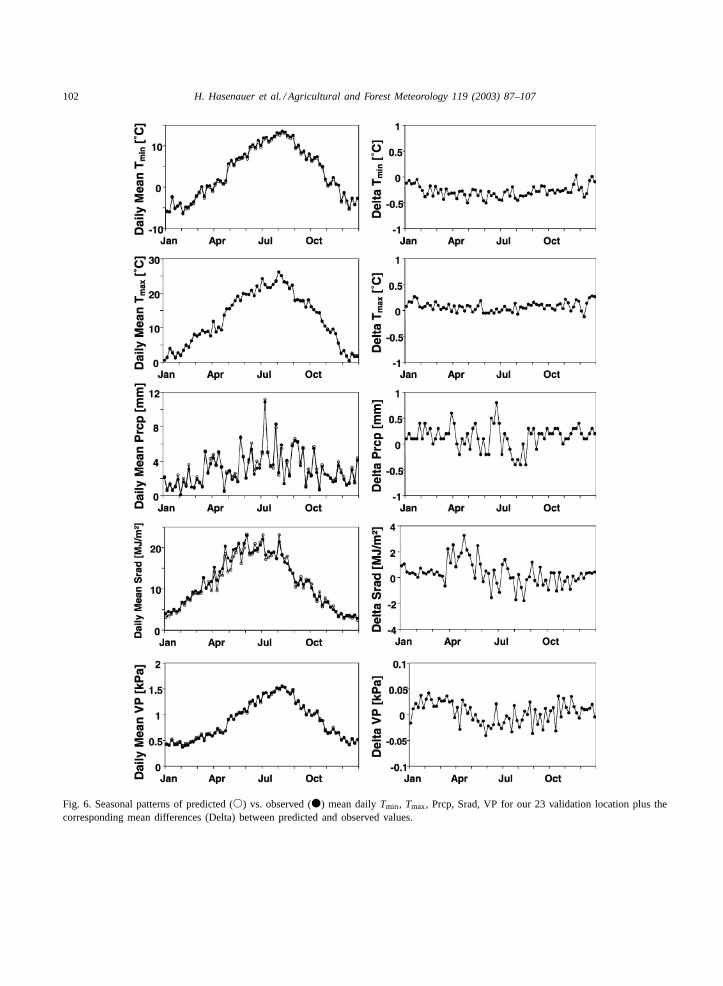
Next we were interested if any seasonal trend byvariable across all 23 stations may exist.Fig. 6 givesthe meanTmin, Tmax, precipitation, solar radiation andVP development and the corresponding daily meanerrors for every fifth day as the result from the differ-ence between predicted versus observed values. Notethat no trend was detectable and the differences arerandomly distributed around zero.
One main goal in adapting and testing DAYMETwas that we want to predict daily climate data forany given location as accurate as possible. For testingthis goal we selected two stations, Schmittenhöhe andGroßenzersdorf (Fig. 2). The station Schmittenhöhe islocated in the western part of Austria at an elevationof 1973 m. The area belongs to the central Alps and
102 H. Hasenauer et al. / Agricultural and Forest Meteorology 119 (2003) 87–107
Fig. 6. Seasonal patterns of predicted (�) vs. observed (�) mean dailyTmin, Tmax, Prcp, Srad, VP for our 23 validation location plus thecorresponding mean differences (Delta) between predicted and observed values.
H. Hasenauer et al. / Agricultural and Forest Meteorology 119 (2003) 87–107 103
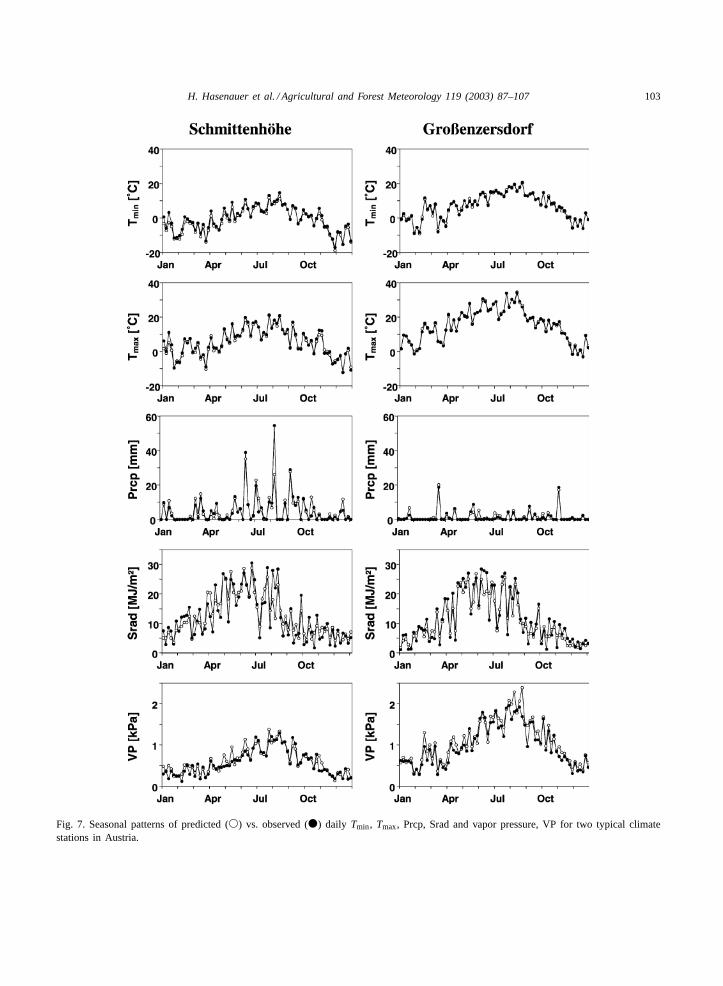
Fig. 7. Seasonal patterns of predicted (�) vs. observed (�) daily Tmin, Tmax, Prcp, Srad and vapor pressure, VP for two typical climatestations in Austria.
104 H. Hasenauer et al. / Agricultural and Forest Meteorology 119 (2003) 87–107
the station lies near the famous skiing resort of Zellam See. The surrounding landscape is characterizedby steep valleys with an elevation difference betweenthe valleys and the station of approximately 1300 m.Annual precipitation with 1427 mm (seeTable 2) ishigher than the average in Austria (about 1000 mmper year). The station Großenzersdorf is located ap-proximately 25 km north-east of the city of Viennain the flat eastern part of the country (Fig. 2). Thestation’s elevation is 153 m above see level and theannual precipitation of 581 mm is about half of theaverage annual precipitation in the country (Tables 1and 2). The climate patterns are strongly affectedby continental impacts such as hot summers andcold and dry winters.Fig. 7 gives the predicted andobserved dailyTmin, Tmax, precipitation, solar radi-ation and VP development for every fifth day forthe stations Schmittenhöhe and Großenzersdorf in1998.
5. Discussion
With this study we have demonstrated thatDAYMET (Thornton et al., 1997) is an appropri-ate tool to interpolate daily minimum and maxi-mum air temperature, precipitation as well as solarradiation and vapor pressure for any given loca-tion within Austria. The sensitivity study based onthe cross-validation results indicated no seasonal(Fig. 3) trends and the error range was low andnot significantly different from zero (Table 4). Thisis important because simple residual analyses mayhide possible seasonal patterns (seeHasenauer andLexer, 1999).
The same was evident for the temporal trends an-alyzed for the time span from 1960 to 1998 (Fig. 4).Although for Austria the mean annual temperaturesand precipitation patterns varied by year and a tem-perature increase in the late eighties is evident (Böhm,1992; Auer, 1993; Hasenauer et al., 1999) the result-ing mean daily differences between predicted versusobserved data did not show any trend (Fig. 4). This in-dicates that our climate interpolations with DAYMETwere unaffected by inter annual variations as well asby the temperature increase.
In our sensitivity analysis, we were also inter-ested if any regional and/or elevation related trends
may exist. The regional grouping of the stations (seeFig. 2) addresses the differences in the forest climaticzones within the country and thus strongly followsthe species distribution. The elevation gradient is ofinterest because most of our available climate stationsare in lower elevations and thus the extrapolation tostations located in higher elevations was of particularinterest. As shown inTable 4no trends are evidentfor Tmin andTmax within the forest climate zones andthe elevation groups.
For precipitation the results are different. While forthe six distinguished forest climate zones no signifi-cant trends between predicted and observed data aredetectable with increasing elevation a significant over-estimation (seeSection 4.3, Fig. 5) in precipitation oc-curred. After removing the 35 stations above 1500 min elevation this trend became non-significant suggest-ing that in higher elevations daily precipitation predic-tions diverge from station observations. One reasonfor this effect may be that with increasing elevationthe station density at a give elevation decreases. Thus,more stations located in lower elevations are used topredict daily weather data at higher altitudes. Whilethis works very well forTmin andTmax for precipita-tion the proportion of precipitation as snow increasesexponentially and wind speed is getting higher whichstrongly affects the accuracy of the precipitation ob-servations. The data recording error for daily precipi-tation rates increases because part of the precipitationis not recorded. This has been reported in several stud-ies (Rubel and Hantel, 1999; Ungersböck et al., 2001;Fuchs et al., 2001) and according to wind speed, theform of precipitation (snow or rain) and precipitationintensity, correction factors for rain gauge measure-ments may be applied to ensure accurate observationresults.
For our climate stations the calculated relativemean differences between predicted and observedprecipitation by station (seeFig. 5) show that at1500 m we have a difference of 2%, which increasesexponentially to 5% in 2000 m and to about 15% atan elevation of 2,500 m and drops for the stationsabove this elevation to less than 10%. These patternsare similar to results reported bySevruk (1986)whichsuggest an observation error of 2–10% for liquid and10–20% for solid precipitation andFuchs et al. (2001)concluded in their study that in very high alpine areasthe expected observation error diminishes because
H. Hasenauer et al. / Agricultural and Forest Meteorology 119 (2003) 87–107 105
higher precipitation intensity leads to lower correctionfactors.
The model validation using an independent and rep-resentative sample of 23 climate stations distributedacross Austria withTmin, Tmax, precipitation solar ra-diation observations and vapor pressure data derivedfrom near-surface-air temperature and relative humid-ity observations at 7 a.m. indicated a good coinci-dence with the DAYMET prediction results (Tables 5and 6). The mean errors as well as the prediction in-terval (Reynolds, 1984), an indicator for the expectedrange of errors are close to zero, suggesting unbi-ased and consistent interpolation results. No seasonaltrends or bias were detectable and mean differencesbetween predicted and observed daily climate vari-ables are around zero (Fig. 6).
According to our findings in the sensitivity part ofthis study, we were specifically interested how dailyas well as mean annual rain predictions correspondto available observations. The mean error, mean abso-lute error, number of predicted rainy days as well asthe percentage of correctly classified days with rainare good (Table 6), and a comparison between meanannual predicted (Table 6) versus mean annual ob-served rain (Table 2) resulted in no systematic trendin the calculated relative differences (R2 = 0.0016,t = 0.84 < ttable, n = 23, α = 0.05).
In our future applications we want to produce cli-mate parameters for any location within Austria, sothat we are able to link existing field observation datafrom inventories, long-term research sites, etc. withdaily weather data. This step has required an adapta-tion of the original DAYMET grid version (Thorntonet al., 1997) to a point version (seePetritsch, 2002).Thus, we next assessed the predictions results for thetwo very different climatic stations in Austria, Schmit-tenhöhe and Großenzersdorf. InFig. 7, the predictionsand observations of every fifth day by variable areshown for both stations. Although the results are goodit can be seen that in flat areas, such as the area sur-rounding station Großenzersdorf, the coincidence ofpredicted and observed data are slightly better versusin areas, which are characterized by a very complexand diverse landscape. Note that the station Schmit-tenhöhe is at the top of a mountain (elevation about2000 m) surrounded by valleys.
For our future use of DAYMET we can conclude,that the model adequately addresses the complex
weather situations in an Alpine country like Austria.The predictions are in coincidence with observations.The only exception was precipitation where in el-evations above 1500–1700 m, we may have somediscrepancies between predicted and observed datamainly due to an error in underestimating rain ob-servations. The adaptation of DAYMET to a pointversion allows us to produce daily minimum andmaximum temperature, precipitation, solar radiationas well as vapor pressure for any day and loca-tion within the country starting in 1960. This isessential for our efforts to further enhance hydro-logical and forest ecosystem-modeling efforts inAustria.
Acknowledgements
This work was begun as a part of the project“Modeling Forest Ecosystems” within the Researchprogram Forest Ecosystem Restoration (SFB 008)funded by the Austrian Science Foundations andcompleted with funding from a joint research grandfrom the Austrian Ministry of Forestry, Agricultureand Environment as well as the Austrian Ministry ofScience and Education. We are very grateful to theAustrian National Weather Center in Vienna, Austria,for providing the excellent weather records. DAYMETwas made available by the NTSG-Lab, Universityof Montana, Missoula, MT. Many thanks to HerbertForemayer, Institute of Meteorology and Physics,University of Agricultural Sciences in Vienna, for hisfruitful discussions throughout the work as well asthe data handling support. Helpful review commentswere provided by Bruce Michie, two anonymousreviewers and the editor.
References
Abbott, P.F., Tabony, R.C., 1985. The estimation of humidityparameters. Meteorol. Mag. 114, 49–56.
Ashraf, M., Loftis, J.C., Hubbard, K.G., 1997. Application ofgeostatistics to evaluate partial weather station networks. Agric.For. Meteorol. 84, 255–271.
Auer, I., 1993. Niederschlagsschwankungen in Österreich seitBeginn der instrumentellen Beobachtungen durch die Zentralan-stalt für Meteorologie und Geodynamik. ÖsterreichischeBeiträge zu Meteorologie und Geophysik, Heft 7. Publ. Nr.
106 H. Hasenauer et al. / Agricultural and Forest Meteorology 119 (2003) 87–107
351, Zentralanstalt für Meteorologie und Geodynamik, Wien,73 pp.
Auer, I., Böhm, R., 1994. Combined temperature–precipitationvariations in Austria during the instrumental period. Theor.Appl. Climatol. 49, 161–174.
Böhm, R., 1992. Lufttemperaturschwankungen in Österreich seit1775. Österreichische Beiträge zu Meteorologie und Geophysik,Heft 5. Publ. Nr. 341, Zentralanstalt für Meteorologie undGeodynamik, Wien, 96 pp.
Durban, M., Glasbey, C.A., 2001. Weather modelling using amultivariate latent Gaussian model. Agric. For. Meteorol. 109,187–201.
Friend, A.D., 1998. Parameterization of a global daily weathergenerator for terrestrial ecosystem modelling. Ecol. Modell.109, 121–140.
Fuchs, T., Rapp, J., Rubel, F., Rudolf, B., 2001. Correction ofsynoptic precipitation observations due to systematic measuringerrors with special regard to precipitation phases. Phys. Chem.Earth (B) 26 (9), 689–693.
Goovaerts, P., 2000. Geostatistical approaches for incorporatingelevation into the spatial interpolation of rainfall. J. Hydrol.228, 113–129.
Hartkamp, A.D., deBeurs, K., Stein, A., White, J.W., 1999.Interpolation techniques for climate variables. NationalResearch Group. Geographic Information Systems, vol. 99-01.27 pp.
Hasenauer, H., Lexer, M.J., 1999. Accuracy assessment of climateinput parameters for biogeochemical modeling. In: Tome,M., Soares, P. (Eds.), IUFRO Conference on Empirical andProcess-Based Models for Forest Tree and Stand Simulation.Edicoes Salamandra, Lisboa, Portugal, pp. 55–68.
Hasenauer, H., Nemani, R.R., Schadauer, K., Running, S.W., 1999.Forest growth response to changing climate between 1961 and1990 in Austria. Forest Ecol. Manage. 122, 209–219.
Hutchinson, M.F., 1995. Interpolating mean rainfall using thinplate smoothing splines. Int. J. GIS 9 (4), 385–403.
Jones, P.G., Thornton, P.K., 2000. MarkSim: software to generatedaily weather data for Latin America and Africa. Agron. J. 92,445–453.
Kilian, W., Müller, F., Starlinger, F., 1994. Die forstlichenWuchsgebiete Österreichs, No. 82. Berichte der ForstlichenBundesversuchsanstalt, Wien, 60 pp.
Kimball, J.S., Running, S.W., Nemani, R.R., 1997. An improvedmethod for estimating surface humidity from daily minimumtemperature. Agric. For. Meterol. 85, 87–98.
Krige, D.G., 1951. A statistical approach to some mine valuationsproblems at the Witwatersrand. J. Chem. Metall. Mining Soc.South Afr. 52, 119–138.
Matheron, G., 1970. La theorie des variables regionalisees et sesapplications, Fascicule 5. Les Cahiers du Centre de MorphologieMathemetique de Fontainebleau, Ecole Nationale Superieuredes Mines, Pare, 212 pp.
Nalder, I.A., Wein, R.W., 1998. Spatial interpolation of climaticnormals: test of a new method in the Canadian boreal forest.Agric. For. Meteorol. 92, 211–225.
Petritsch, R., 2002. Anwendung und Validierung desKlimainterpolationsmodells DAYMET in Österreich. Dipl.Arbeit, Univ. Bodenkultur, Wien, 95 pp.
Price, D.T., McKenney, D.W., Nalder, I.A., Hutchinson, M.F.,Kesteven, J.L., 2000. A comparison of two statistical methodsfor spatial interpolation of Canadian monthly mean climatedata. Agric. For. Meteorol. 101, 81–94.
Reynolds Jr., M.R., 1984. Estimating the error in modelpredictions. For. Sci. 30, 454–469.
Richardson, C.W., 1981. Stochastic simulation of daily precipi-tation, temperature, and solar radiation. Water Resource Res.17 (1), 182–190.
Rubel, F., Hantel, M., 1999. Correction of daily rain gaugemeasurements in the Baltic sea drainage basin. Nordic Hydrol.30, 191–208.
Running, S.W., Nemani, R.R., Hungerford, R.D., 1987.Extrapolation of synoptic meteorological data in mountainousterrain and its use for simulating forest evapotranspiration andphotosynthesis. Can. J. For. Res. 17, 472–483.
Scheifinger, H., Kromp-Kolb, H., 2000. Modelling global radiationin complex terrain: comparing two statistical approaches. Agric.For. Meteorol. 100, 127–136.
Sevruk, B., 1986. Correction of precipitation measurements—summary report. In: Sevruk, B. (Ed.), Correction of PrecipitationMeasurements, No. 23. Züricher Geographische Schriften,pp. 13–23.
Snyder, J.P., 1987. Map Projections—A Working Manual. USGeological Survey Professional Paper 1395, US GovernmentPrinting Office, Washington, DC.
Soltani, A., Latifi, N., Nasiri, M., 2000. Evaluating of WGEN forgenerating long term weather data for crop simulations. Agric.For. Meteorol. 102, 1–12.
Sommaruga-Wögrath, S., Koinig, K.A., Schmidt, R., Sommaruga,R., Tessadri, R., Psenner, R., 1997. Temperature effects on theacidity of remote alpine lakes. Nature 387, 64–67.
Strandman, H., Väisänen, H., Kellomäki, S., 1993. A procedurefor generating synthetic weather records in conjunction ofclimatic scenario for modelling of ecological impacts ofchanging climate in boreal conditions. Ecol. Modell. 70, 195–200.
Thornton, P.E., Running, S.W., 1999. An improved algorithm forestimating incident daily solar radiation from measurements oftemperature, humidity, and precipitation. Agric. For. Meteorol.93, 211–228.
Thornton, P.E., Running, S.W., White, M.A., 1997. Generatingsurfaces of daily meteorological variables over large regions ofcomplex terrain. J. Hydrol. 190, 214–251.
Thornton, P.E., Hasenauer, H., White, M.A., 2000. Simultaneousestimation of daily solar radiation and humidity fromobserved temperature and precipitation: an application overcomplex terrain in Austria. Agric. For. Meteorol. 104, 255–271.
Ungersböck, M., Rubel, F., Fuchs, T., Rudolf, B., 2001. Biascorrection of global daily rain gauge measurements. Phys.Chem. Earth (B) 26 (5–6), 411–414.
VEMAP Members, 1995. Vegetation/Ecosystem Modeling andAnalysis Project (VEMAP):comparing biogeography andbiogeochemistry models in a continental-scale study ofterrestrial ecosystem responses to climate change and CO2
doubling. Global Biogeochem. Cycles 9, 407–437.

H. Hasenauer et al. / Agricultural and Forest Meteorology 119 (2003) 87–107 107
Waring, H.R., Running, S.W., 1998. Forest Ecosystems—Analysisat Multiple Scale, second ed. Academic Press, New York, 370pp.
Weisberg, S., 1985. Applied Linear Regression. Second ed. Wiley,New York, 324 pp.
Wilks, D.S., 1999. Simultaneous stochastic simulation of dailyprecipitation, temperature and solar radiation at multiple sitesin complex terrain. Agric. For. Meteorol. 96, 85–101.
Xia, Y., Winterhalter, M., Fabian, P., 1999. A model to interpolatemonthly mean climatological data at Bavarian forest climatestations. Theor. App. Climatol. 64, 27–38.
Xia, Y., Fabian, P., Winterhalter, M., Zhao, M., 2001. Forestclimatology: estimation and use of daily climatologicaldata for Bavaria, Germany. Agric. For. Meteorol. 106, 87–103.
Related Documents