Validating a Cell Viability Measurement NIST Workshop: “Strategies to Achieve Measurement Assurance for Cell Therapy Products” May 11-12, 2015 Ivan N. Rich, PhD Founder, Chairman & CEO 1485 Garden of the Gods Road Colorado Springs, CO www.hemogenix.com [email protected]

Welcome message from author
This document is posted to help you gain knowledge. Please leave a comment to let me know what you think about it! Share it to your friends and learn new things together.
Transcript
Validating a Cell Viability Measurement
NIST Workshop: “Strategies to Achieve Measurement Assurance for Cell Therapy Products”
May 11-12, 2015
Ivan N. Rich, PhDFounder, Chairman & CEO
1485 Garden of the Gods RoadColorado Springs, COwww.hemogenix.com
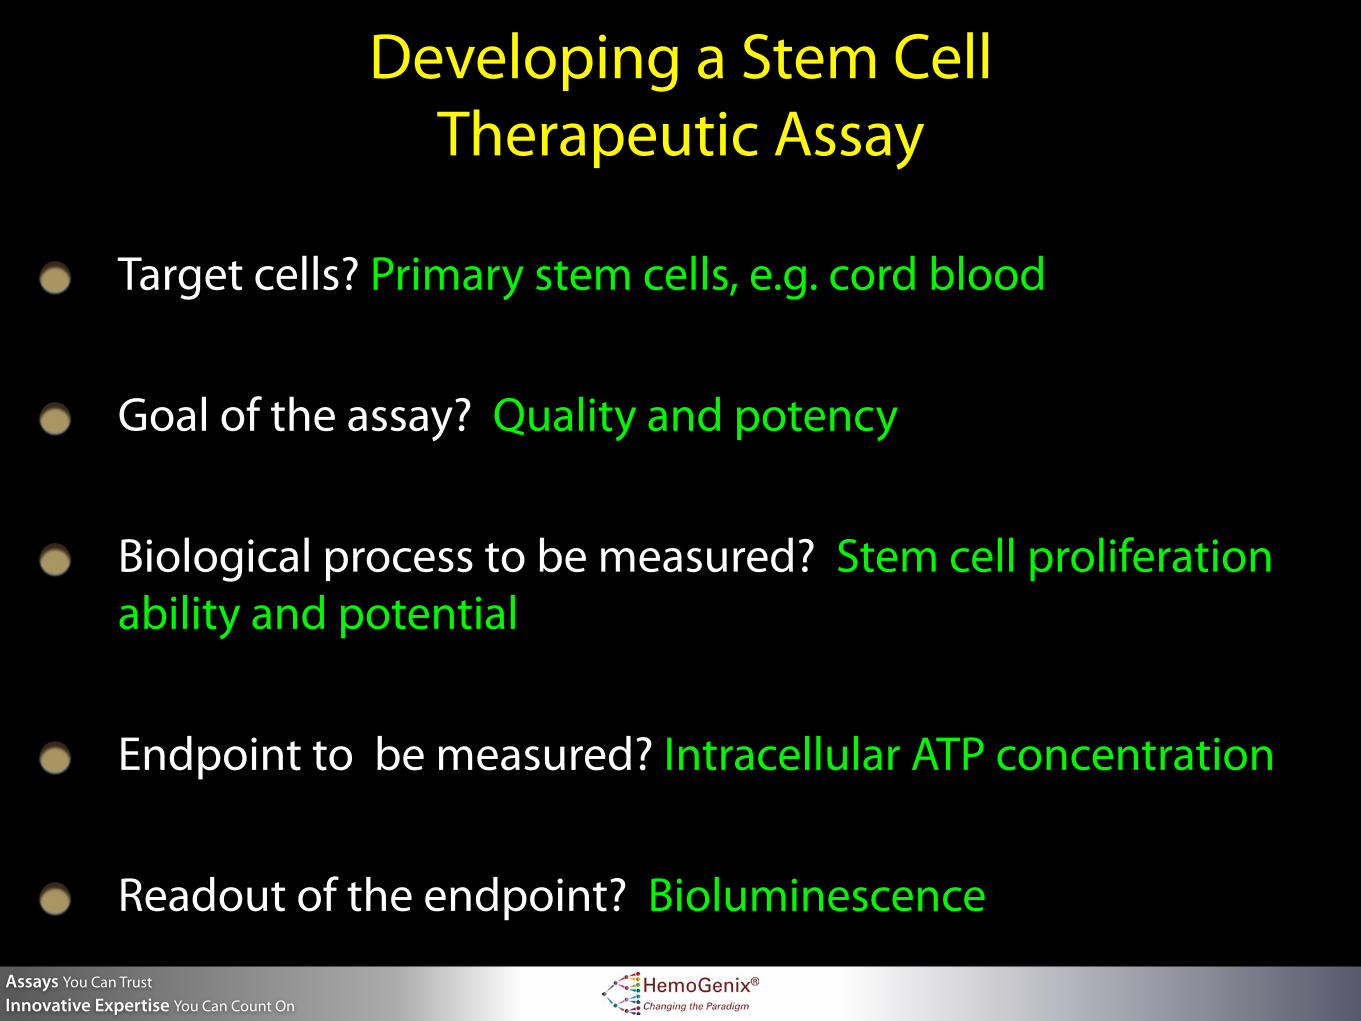
Developing a Stem Cell Therapeutic Assay
Target cells? Primary stem cells, e.g. cord blood
Goal of the assay? Quality and potency
Biological process to be measured? Stem cell proliferation ability and potential
Endpoint to be measured? Intracellular ATP concentration
Readout of the endpoint? Bioluminescence
Assays You Can Trust Innovative Expertise You Can Count On

Assays You Can Trust Innovative Expertise You Can Count On
PROLIFERATIONABILITY
(”Quality”)
PROLIFERATIONCAPACITY
DIFFERENTIATION
MATURATION
“STEMNESS” /PRIMITIVENESS
SELF-RENEWAL POTENCY
B-CFCT-CFC
BFU-E 1GM-CFC 1 (2)
Mk-CFC 1
LTC-IC
HPP-SP 1 & 2
CFC-GEMM 1
Lymphoid
stem cell
CFU-EG-CFCM-CFC
Eosino-
phil
Macro-
phageB-cellT-cell Basophil Neutrophil PlateletRBC
Mature Functional Circulating Blood Cells
Stem cell determination
CFC-GEMM 2
BFU-E 2
Mk-CFC 2
CFC-GEM 1
CFC-GEM 2 (3)
Stem Cell Compartment
(~0.001-0.01%)
ProgenitorCell
Compartment
PrecursorCell
Compartment
GM-CFC 3
Range for total
nucleated cell
count (TNC)
Range for mononuclear
cell count (MNC)
Range for CD34+count
Quiescence
Range ofCFU assay
Range ofHALO
stem cellassaysfor cell
therapy
Extended rangecapability
Time toEngraftment
Our Goal is to Measure the “Quality” and Potency of Primitive Stem Cells that are used for Transplantation

Assays You Can Trust Innovative Expertise You Can Count On
Stem Cell “Quality” Dye Exclusion Viability does not Correlate with
Metabolic Viability for Umbilical Cord Blood
%TNC Viability TNC CFU-GEMM TNC HPP-SP % MNC Viability MNC CFC-GEMM MNC HPP-SP0
10
20
30
40
50
60
70
80
90
100
110
0.00.10.20.30.40.50.60.70.80.91.01.11.21.31.41.51.61.71.81.92.0
Perc
ent V
iabi
lity
% Viability vs Stem cell ATP (@ 4,000)
Mean A
TP C
oncentration (µM) / W
ell
ATP Acceptance/Rejection
Total Nucleated Cell Fraction (TNC)
Mononuclear Cell Fraction (MNC)
Adapted from: Patterson et al. J. Translation Medicine (2015) 13:94
Assays You Can Trust Innovative Expertise You Can Count On
Adapted from: Patterson et al. J. Translation Medicine (2015) 13:94
0 1000 2000 3000 4000 50000.00
0.05
0.10
0.15
0.20
0.25
0.30
0.35
0.40
0.45
0.50
0.55
0.60
0.65
0.70
0.75
0.80
0.85
0.90
0.95
1.00
Cell Concentrations / Well
Mea
n A
TP C
once
ntra
tion
(µM
) / W
ell
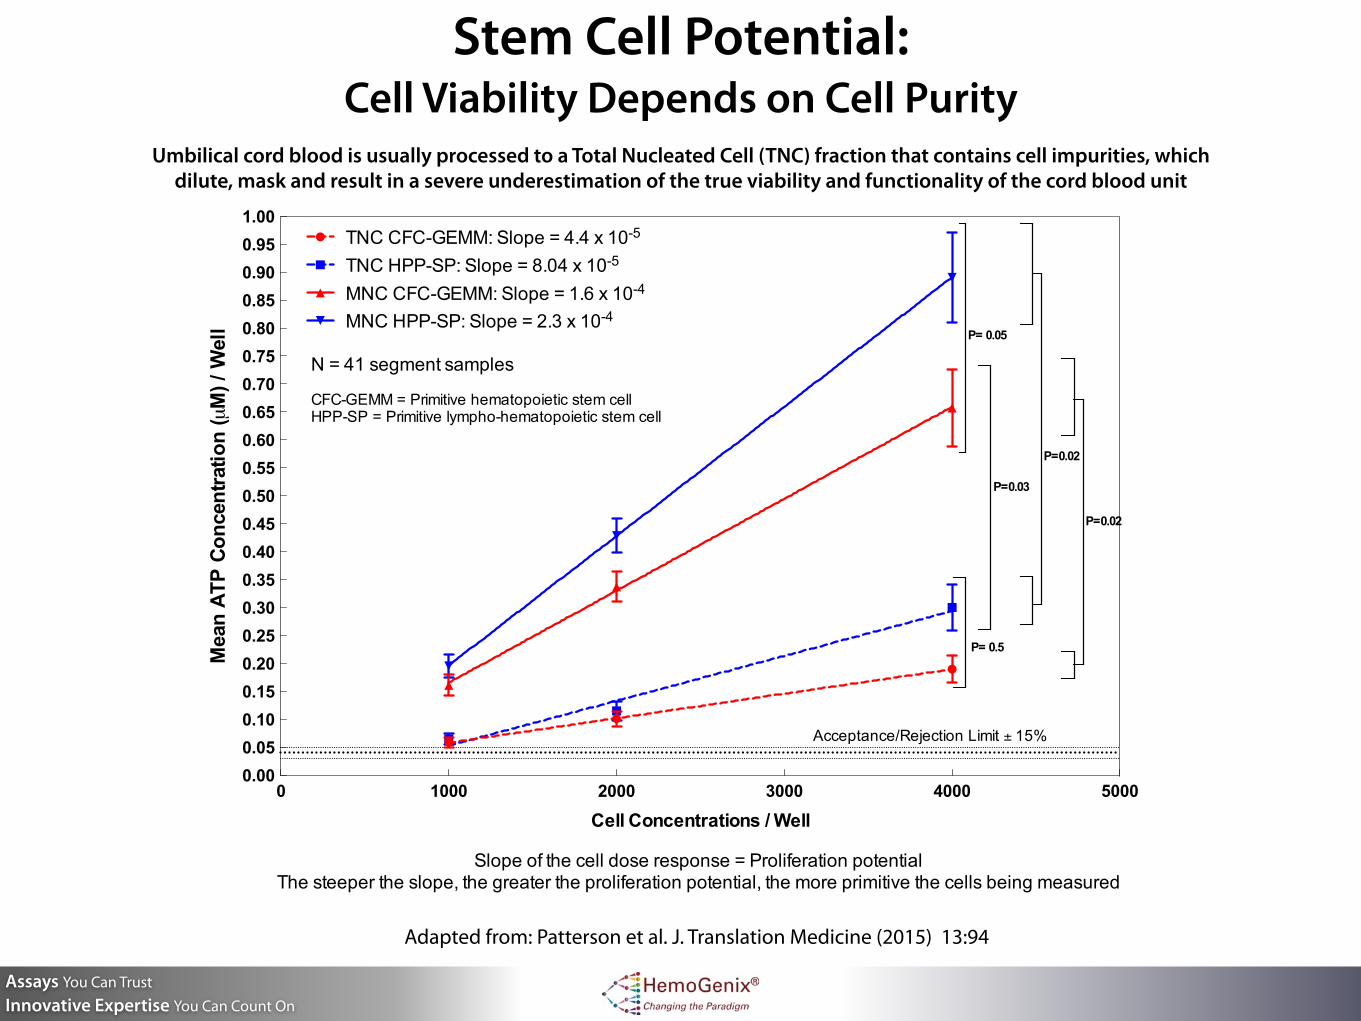
TNC CFC-GEMM: Slope = 4.4 x 10⁻⁵
TNC HPP-SP: Slope = 8.04 x 10⁻⁵
MNC CFC-GEMM: Slope = 1.6 x 10⁻⁴
MNC HPP-SP: Slope = 2.3 x 10⁻⁴
Acceptance/Rejection Limit ± 15%
N = 41 segment samples
P= 0.05
P= 0.5
P=0.02
P=0.03
P=0.02
Slope of the cell dose response = Proliferation potentialThe steeper the slope, the greater the proliferation potential, the more primitive the cells being measured
CFC-GEMM = Primitive hematopoietic stem cellHPP-SP = Primitive lympho-hematopoietic stem cell
Stem Cell Potential: Cell Viability Depends on Cell Purity
Umbilical cord blood is usually processed to a Total Nucleated Cell (TNC) fraction that contains cell impurities, which dilute, mask and result in a severe underestimation of the true viability and functionality of the cord blood unit

• Measure the “active” components
• Quantitatively measure biological activity
• Predict the intended response
• Release the product for use
• Include a reference standard, to determine potency ratio
• Include standards and controls for validation
Assays You Can Trust Innovative Expertise You Can Count On
A Potency Assay is a Very Special Viability Assay
A potency assay must:
Potency Ratios for Umbilical Cord Blood Stem Cells
1 2 3 4 5 6 7 8 9 10 11 12 13 14 15 16 17 18 19 20 21 22 23 24 25 26 27 28 29 30 31 320
1
2
3
4
5
6
Umbilical Cord Blood Sample Number
Pot
ency
Rat
io
Primitive Hematopoietic Stem Cells
Primitive Lympho-Hematopoietic Stem Cells
Cord blood reference standard(the potency is always 1)
Dose response slope = Proliferation potential = Primitiveness = Potency = Engraftment potentialPotency Ratio = Slope of the stem cell dose response / Slope of the dose response for the Reference Standard
Stem cells with potency lower than the reference standard should not be used for transplantation

Assays You Can Trust Innovative Expertise You Can Count On
Can You Trust These Results?

Assays You Can Trust Innovative Expertise You Can Count On
Assay Verification: Comparison of a new assay against an
established assay

Assays You Can Trust Innovative Expertise You Can Count On
CAMEO™-4 vs CAMEO™-96: R = 0.997 CAMEO™-4 vs HALO®: R = 0.986
CAMEO™-96 vs HALO®: R = 0.964
Verification of ATP Bioluminescence Assay Against TwoMethylcellulose Colony-Forming Unit (CFU) Assays
From: Rich IN. Expert Opinion Drug Metab Toxicol (2007) 3:295-307
Cell Concentrations: 250 500
1,000 2,500 5,000
10,000 20,000
CAMEO™-4: A miniaturized colony-formingunit (CFU) assay with a manual,subjective readout.
CAMEO™-96: A fully standardized,methylcellulose CFU assay capable ofdetermining both hematopoietic cell proliferation and differentiation usingtwo different readouts in the same assay.

Assays You Can Trust Innovative Expertise You Can Count On
Relationship between MTS and Intracellular ATP as a Function of Cell Dose
0.0 0.1 0.2 0.3 0.4 0.5
0.00
0.05
0.10
0.15
0.20
Cells/Well:2505001,0002,5005,00010,00020,000
R2 = 0.994
Linear regression95% Confidence limits
ATP Concentration (uM)
MTS
Abs
orba
nce
Verification of Two Metabolic Viability Assays

Assays You Can Trust Innovative Expertise You Can Count On
Assay Validation: Measurement Assurance

The Principle of Bioluminomics™ Assays Chemical Energy can be used as a Biochemical Marker for Multiple Readouts
Assays You Can Trust Innovative Expertise You Can Count On
The intracellular concentration of ATP correlates directly with:
ProliferationViability Cytotoxicity Cell Number
Released iATP + Luciferin + Luciferase = Bioluminescence
LIGHT
Relative Luminescence
Units (RLU)

The ATP Standard Curve
Assays You Can Trust Innovative Expertise You Can Count On
Low calibrator
High calibrator
Extra high calibrator
Individual values
Calibrators
Linear regression
95% confidence intervals
95% prediction intervals

Assays You Can Trust Innovative Expertise You Can Count On
Establishment of an ATP Standard
Sample No. Stock [ATP] (UV-Vis)
Abs (@lambda max)
Final ATP Conc (UV-Vis)
1 97.66 0.154 10.00
2 96.95 0.152 9.87
3 95.0 0.155 10.06
4 91.49 0.153 9.94
5 97.66 0.156 10.13
6 96.95 0.158 10.26
-0.2
0
0.2
0.4
0.6
0.8
1
1.2
1.4
1.6
1.8
200 220 240 260 280 300 320 340
Abs
orba
nce
Wavelength
100uM ATP #100511
Stored at 2-8C Stored at -20C
ATP Concentration (uM)
0.01 0.1 110000
100000
1e6
1e7ATP Standard Curve
Log-Log Fit: Log(y) = A + B * Log(x): A B R^2STD (ATP Standard Plus: Conc (uM) vs RLU) 6.7 0.984 1STD - In-house (ATP Standard #260511: Conc (uM) vs RLU) 6.69 0.984 1
Lambda max at 259-260nm. According to Beer’s Law: ATP Concentration (µM) = Absorbance at lambda max / Extinction coefficient of ATP (0.0154)
Comparison of an ATP Standard with anATP In-House Preparation
Absorbance Profile of ATP
Stock 100µM ATP Diluted to 10µM ATP

Assays You Can Trust Innovative Expertise You Can Count On
Accuracy of the ATP Standard Curve Do the measured values agree with the expected values?
ATP Standard Curve Concentrations
Expected ATP Concentrations 0.01µM 0.05µM 0.1µM 0.5µM 1µM
Mean (µM) 0.00965 0.05186 0.10210 0.49873 0.98799
St. Dev (µM) 0.00057 0.00321 0.00443 0.02338 0.05048
%CV 5.93 6.21 4.35 4.69 5.11
N= 72 72 72 72 72

Assays You Can Trust Innovative Expertise You Can Count On
Accuracy of the ATP Standard Curve
Dose Response Number Intercept Slope Correlation
Coefficient (R)1 1.68 0.96 1
0.999 2 2.21 0.97 0.9993 2.06 0.985 14 2.14 0.976 15 6.1 0.944 0.9986 6.03 0.979 17 6.22 0.964 0.9998 6.09 0.986 19 6.13 0.978 1
10 6.08 0.962 0.99911 6.1 0.976 112 6.11 0.979 113 5.85 0.982 114 5.81 0.987 115 5.85 0.965 116 6.07 0.979 1
Mean 5.033 0.973 1St. Dev. 1.802 0.012 0.0006
%CV 35.804 1.233 0.06

• A plot of “true positive rate” or sensitivity against the “false positive rate” or specificity.
• A tradeoff between sensitivity and specificity (an increase in sensitivity = a decrease in specificity).
• The close the curve follows the left axis and the top boarder, the more accurate the test.
• A 45-degree diagonal indicates that the assay is “worthless”.
• Area under the curve (AUC) is a measure of accuracy. Must be between 0.5 and 1, 0.5 being a “worthless” assay and 1 being an ideal assay.
Assays You Can Trust Innovative Expertise You Can Count On
Sample Accuracy, Sensitivity and Specificity
Receiver Operator Characteristics
(ROC Curves)
Assays You Can Trust Innovative Expertise You Can Count On
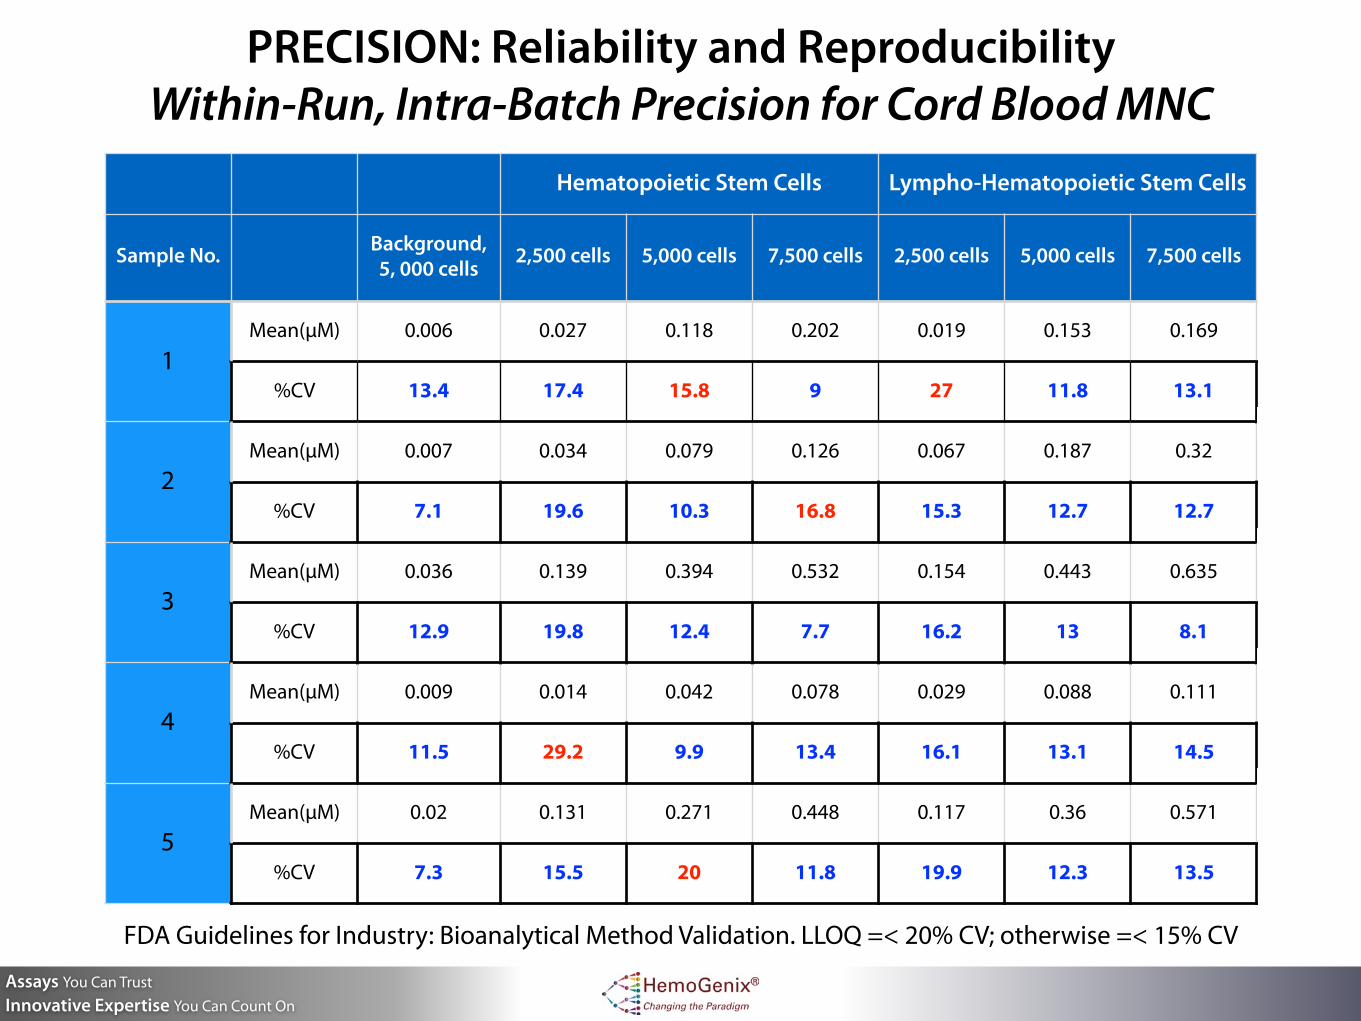
PRECISION: Reliability and Reproducibility Within-Run, Intra-Batch Precision for Cord Blood MNC
Hematopoietic Stem Cells Lympho-Hematopoietic Stem Cells
Sample No. Background, 5, 000 cells 2,500 cells 5,000 cells 7,500 cells 2,500 cells 5,000 cells 7,500 cells
1Mean(µM) 0.006 0.027 0.118 0.202 0.019 0.153 0.169
%CV 13.4 17.4 15.8 9 27 11.8 13.1
2Mean(µM) 0.007 0.034 0.079 0.126 0.067 0.187 0.32
%CV 7.1 19.6 10.3 16.8 15.3 12.7 12.7
3Mean(µM) 0.036 0.139 0.394 0.532 0.154 0.443 0.635
%CV 12.9 19.8 12.4 7.7 16.2 13 8.1
4Mean(µM) 0.009 0.014 0.042 0.078 0.029 0.088 0.111
%CV 11.5 29.2 9.9 13.4 16.1 13.1 14.5
5Mean(µM) 0.02 0.131 0.271 0.448 0.117 0.36 0.571
%CV 7.3 15.5 20 11.8 19.9 12.3 13.5
FDA Guidelines for Industry: Bioanalytical Method Validation. LLOQ =< 20% CV; otherwise =< 15% CV

Assays You Can Trust Innovative Expertise You Can Count On
PRECISION: Reliability and Reproducibility Between-Run, Inter-Batch Precision for Cord Blood MNC
FDA Guidelines for Industry: Bioanalytical Method Validation. LLOQ =< 20% CV; otherwise =< 15% CV
Hematopoietic Cord Blood Stem Cells
Lympho-Hematopoietic Stem Cells
2,500 Cells
5,000 Cells
7,500 Cells
2,500 Cells
5,000 Cells
7,500 Cells
Mean (µM) 0.024 0.049 0.078 0.055 0.123 0.205
St. Dev. (µM) 0.0023 0.0053 0.0076 0.0062 0.016 0.0276
%CV 9.75 10.74 9.77 11.21 12.71 13.48
16 cord blood batches (different units) measured over a 30 day period

Assays You Can Trust Innovative Expertise You Can Count On
Inter-Laboratory Robustness
From: Reems et al. Transfusion (2008) 48: 620-628

Why are Standards, Calibrators and Controls so Important?
• The output of a luminometer or fluorimeter is in non-standardized relative units, e.g. RLU or RFU
• Calibrators ensure that the instrument is working correctly. • Standards and controls ensure that the reagents are working
correctly with low dispensing error. • The standard curve standardizes the assay to allow the
conversion of non-standard units into standardized concentrations.
• This, in turn, allows direct comparison of results over time. • Incorporates an internal proficiency test for both the user and
the assay. • Allows assay validation: Measuring accuracy, sensitivity and
specificity, precision and robustness.
Assays You Can Trust Innovative Expertise You Can Count On

• Linear regression correlation coefficient (R) = >0.997 • Linear regression slope = 0.937 (slope range allowed: 0.796-1.07) • Low calibrator = 0.05uM ATP (range allowed: 0.043-0.058uM ATP) • High calibrator = 0.7uM ATP (range allowed: 0.595-0.805uM ATP) • Extra high calibrator = 1.75uM (range allowed: 1.488-2.013uM) • Lowest ATP value indicating unsustainable proliferation = 0.04uM ATP +- 15% • ATP value below which cells are metabolically dead = 0.01uM ATP • Assay linearity = >4 logs • Assay cell linearity: 1,000 - > 25,000 cells • Assay sensitivity = 0.001uM ATP • Assay cell sensitivity: 20-25 cells • Accuracy (% correct outcomes): ~95% • Sensitivity and specificity: Receiver Operator Characteristics (ROC) AUC: 0.73-0.752 • Precision: = <15% (LLOQ): 20% • Robustness (intra- and inter-laboratory): ~95% • High throughput capability (Z-factor): >0.76
Assay Characteristics and Validation Parameters
Assays You Can Trust Innovative Expertise You Can Count On

Thank You
The Siamese Twins in the Garden of the Gods Park with Pike’s Peak in the background
Related Documents