Presentation BBSPA Valentin Kunev Manager, BBSPA 3rd SE Europe Hydrocarbons Upstream Workshop Royal Olympic Hotel, Athens, October 30-31, 2018

Welcome message from author
This document is posted to help you gain knowledge. Please leave a comment to let me know what you think about it! Share it to your friends and learn new things together.
Transcript
Presentation BBSPA
Valentin Kunev
Manager, BBSPA
3rd SE Europe Hydrocarbons Upstream Workshop Royal Olympic Hotel, Athens, October 30-31, 2018
Oil production and consumption (refinery throughput) in the BBS Region
BBSPA statistical review
4
Crude oil production, million tonnes
mt/y Albania B & H Bulgaria Croatia Georgia Greece Hungary Macedonia Romania Serbia Turkey Ukraine
1990 1.07 0 0.06 2.5 0.19 0.77 1.92 0 7.93 1.06 3.71 4.09
1991 0.85 0 0.06 2.18 0.19 0.79 1.84 0 6.79 1.1 4.36 3.95
1992 0.59 0 0.05 1.92 0.13 0.65 1.77 0 6.62 1.17 4.28 3.62
1993 0.57 0 0.04 1.9 0.04 0.54 1.65 0 6.71 1.15 3.89 3.34
1994 0.54 0 0.04 1.58 0.05 0.5 1.58 0 6.74 1.03 3.7 3.16
1995 0.52 0 0.04 1.5 0.05 0.44 1.67 0 6.72 1.07 3.52 2.99
1996 0.49 0 0.03 1.47 0.13 0.48 1.48 0 6.63 1.02 3.5 2.95
1997 0.36 0 0.03 1.53 0.13 0.44 1.36 0 6.52 0.98 3.45 2.89
1998 0.37 0 0.03 1.59 0.12 0.29 1.26 0 6.31 0.92 3.22 2.7
1999 0.33 0 0.04 1.18 0.09 0.02 1.24 0 6.14 0.97 2.94 2.67
2000 0.31 0 0.03 1.31 0.11 0.28 1.14 0 6 0.98 2.8 3.7
2001 0.34 0 0.03 1.22 0.1 0.19 1.06 0 6 0.9 2.6 3.7
2002 0.31 0 0.03 1.11 0.07 0.19 1.05 0 5.8 0.81 2.4 3.7
2003 0.36 0 0.03 1.05 0.14 0.14 1.13 0 5.7 0.68 2.4 4
2004 0.44 0 0.03 1 0.1 0.13 1.08 0 5.5 0.67 2.27 4.2
2005 0.42 0 0.03 0.95 0.07 0.1 0.88 0 5.2 0.61 2.27 4.4
2006 0.5 0 0.03 0.92 0.06 0.09 0.86 0 4.78 0.55 2.16 4.52
2007 0.56 0 0.03 0.88 0.06 0.07 0.8 0 4.54 0.65 2.13 4.43
2008 0.58 0 0.03 0.83 0.05 0.08 0.74 0 4.54 0.65 2.15 4.21
2009 0.58 0 0.02 0.78 0.05 0.13 0.72 0 4.32 0.66 2.4 4
2010 0.74 0 0.02 0.76 0.05 0.12 0.64 0 4.17 0.87 2.54 3.54
2011 0.89 0 0.02 0.66 0.05 0.1 0.6 0 4.22 1.02 2.43 3.32
2012 1.03 0 0.02 0.6 0.07 0.07 0.59 0 4.11 1.2 2.32 3.29
2013 1.23 0 0.02 0.59 0.05 0.07 0.61 0 4.13 1.16 2.4 2.75
2014 1.34 0 0.02 0.53 0.04 0.06 0.57 0 3.99 1.11 2.46 2.52
2015 1.27 0 0.02 0.61 0.04 0.02 0.6 0 3.99 1.02 2.52 2.46
2016 1.05 0 0.02 0.68 0.03 0.16 0.69 0 3.68 1.04 2.57 1.6
2017 0.95 0 0.02 0.68 0.03 0.13 0.71 0 3.53 na 2.55 1.5
y-o-y -10% 0% 0% 0% -19% 3% -4% -1% -6%
.
In 2017 Hungary increased crude production while Albania, Romania, Ukraine and Turkey decreased.
0
5
10
15
20
25
1990 1995 2000 2005 2010 2015
Crude Oil Production, mt/y
Albania Croatia Greece Hungary
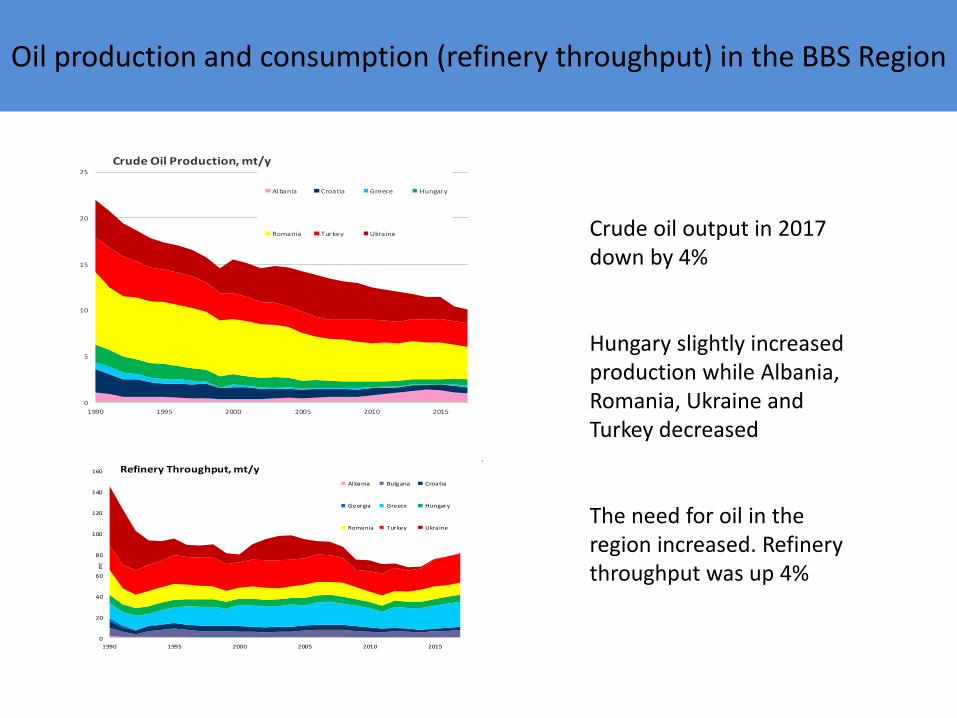
Romania Turkey Ukraine Crude oil output in 2017 down by 4%
Hungary slightly increased production while Albania, Romania, Ukraine and Turkey decreased
The need for oil in the region increased. Refinery throughput was up 4%
BBSPA statistical review
5
Refinery throughput, million tonnes
mt/y Albania B & H Bulgaria Croatia Georgia Greece Hungary Macedonia Romania Serbia Turkey Ukraine
1990 1.09 2 8.29 6.86 2.38 14.41 8.16 1.22 24.1 4.9 23 57.19
1991 0.85 1.82 4.51 4.54 1.92 12.81 7.67 0.96 15.23 3.5 22.6 53.29
1992 0.59 0 2.42 3.96 0.45 13.42 7.47 1 12.97 2.17 23.19 38.02
1993 0.57 0 5.7 4.98 0.32 11.19 7.72 1.02 14.25 1.35 25.52 23.01
1994 0.54 0 6.96 5.09 0.19 14.01 7.05 0.14 15 1.23 24.89 18.96
1995 0.52 0 7.99 5.44 0.05 14.86 7.51 0.12 15.49 1.37 27.2 16.29
1996 0.49 0 6.95 4.93 0.02 17.93 6.79 0.66 13.7 2.3 26.44 12.19
1997 0.37 0 5.96 5.26 0.04 18.17 7.03 0.4 12.78 3.09 26.96 11.84
1998 0.37 0 5.58 5.32 0.03 18.54 7.18 0.76 12.28 2.45 27.71 12.5
1999 0.33 0 5.66 5.48 0.04 16.06 7.04 0.6 10.41 1.34 25.72 10.54
2000 0.32 0.52 5.33 5.23 0 20.66 5.94 0.86 10.7 1.26 24.2 7.6
2001 0.33 0.25 5.44 4.83 0 20.27 6.8 0.64 11.4 2.77 25.8 15
2002 0.37 0.23 4.79 4.83 0 20.41 5.99 0.54 11.7 3.39 26.1 20.6
2003 0.4 0.07 4.99 4.87 0 20.13 6.34 0.83 10.9 3.68 26.5 23.5
2004 0.44 0.14 5.29 5.08 0 20.94 6.34 0.83 11.09 4 26 22.9
2005 0.43 0.14 6.2 4.85 0 19.4 6.99 0.96 13.05 3.8 25.5 18.04
2006 0.44 0.02 7.09 4.64 0 21.46 6.9 1.07 12.74 3.02 26.49 13.38
2007 0.41 0.02 7.09 4.99 0 21.99 7 1.09 12.33 3.23 25.39 12.8
2008 0.4 0.02 7.12 4.6 0 20.65 6.92 1.06 13.06 3.25 24.21 10.21
2009 0.24 0.98 6.25 4.8 0 19.56 6.24 0.97 11.24 2.88 16.98 9.5
2010 0.25 1.14 5.52 3.86 0 18.77 6.36 0.83 9.76 2.79 19.22 10.5
2011 0.2 1.22 5.07 3.24 0 16.05 6.3 0.72 9.68 2.36 20.99 9.25
2012 0.07 1.02 5.9 3.07 0 20.52 6.09 0.26 9.1 2.3 22.12 4.57
2013 0.07 1.04 5.62 2.87 0 19.89 5.96 na 10.07 2.75 19.93 2.99
2014 0.07 1 5.16 2.35 0 20.69 6.52 na 11.44 2.61 20 2.08
2015 0.07 0.92 6 2.78 0 21.66 6.47 na 12.42 2.94 25.53 0.42
2016 0.12 0.87 6.27 3.12 0 23.19 6.63 na 11.2 2.97 27.37 0.18
2017 0.44 na 6.75 3.57 0 24.03 6.51 na 11.41 na 28.09 0.49
y-o-y 8% 14% 4% -2% 2% 3%
.
Bulgaria, Croatia, Greece, Romania, Turkey and Ukraine increased refinery throughput in 2017, while Hungary decreased.
na - data difficult to find
0
20
40
60
80
100
120
140
160
1990 1995 2000 2005 2010 2015
mt
Refinery Throughput, mt/y
Albania Bulgaria Croatia
Georgia Greece Hungary
Romania Turkey Ukraine
Gas production and consumption in the BBS Region
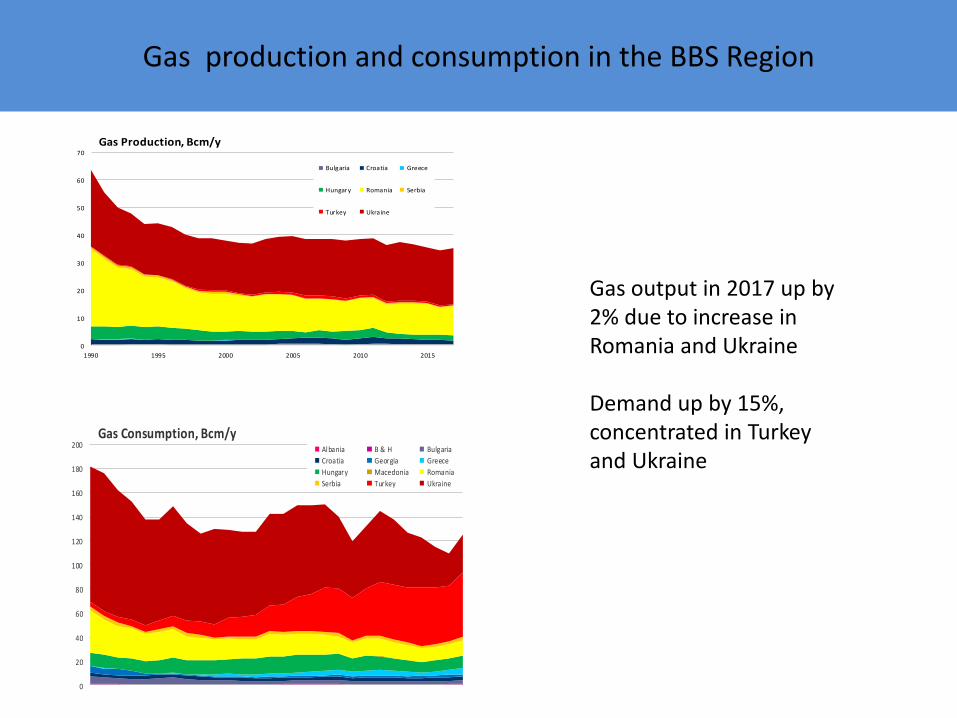
Gas output in 2017 up by 2% due to increase in Romania and Ukraine
Demand up by 15%, concentrated in Turkey and Ukraine
BBSPA statistical review
6
Gas production, Bcm
bcm/y Albania B & H Bulgaria Croatia Georgia Greece Hungary Macedonia Romania Serbia Turkey Ukraine
1990 0.25 0 0.01 1.99 0.06 0.17 4.69 0 28.2 0.65 0.21 27.81
1991 0.15 0 0.01 1.83 0.06 0.17 4.74 0 24.68 0.75 0.21 23.29
1992 0.11 0 0.04 1.81 0.05 0.16 4.45 0 21.67 0.84 0.2 20.83
1993 0.08 0 0.07 2.06 0.05 0.11 4.79 0 20.63 0.84 0.2 19.15
1994 0.05 0 0.06 1.8 0 0.06 4.62 0 18.24 0.8 0.2 18.25
1995 0.03 0 0.05 1.98 0.01 0.05 4.66 0 17.78 0.83 0.18 18.75
1996 0.02 0 0.04 1.8 0 0.06 4.43 0 16.94 0.55 0.21 19
1997 0.02 0 0.03 1.73 0 0.06 4.13 0 14.65 0.59 0.26 18.72
1998 0.02 0 0.03 1.58 0 0.05 3.65 0 13.72 0.68 0.57 18.55
1999 0.02 0 0.03 1.56 0 0 3.23 0 13.77 0.71 0.74 18.68
2000 0.01 0 0.02 1.66 0.07 0.05 3.19 0 13.7 0.67 0.64 18.1
2001 0.01 0 0.02 1.76 0.04 0.05 3.23 0 12.9 0.54 0.31 18.4
2002 0.01 0 0.02 1.76 0.02 0.05 3.1 0 12.4 0.43 0.38 18.8
2003 0.01 0 0.01 1.85 0.02 0.04 2.94 0 13.4 0.34 0.56 19.5
2004 0.02 0 0.33 1.85 0.01 0.03 3.02 0 13 0.3 0.71 20.1
2005 0.02 0 0.54 1.84 0.01 0.02 2.82 0 12.7 0.26 0.9 20.6
2006 0.02 0 0.52 2.03 0.01 0.03 2.07 0 12.1 0.23 0.9 20.7
2007 0.02 0 0.33 2.35 0.02 0.02 2.57 0 11.52 0.24 0.89 20.6
2008 0.02 0 0.25 2.04 0.02 0.01 2.6 0 11.42 0.29 1.01 21
2009 0.09 0 0.02 1.9 0.01 0.01 3.09 0 10.86 0.29 0.73 21.18
2010 0.09 0 0.07 2.33 0.01 0.01 2.94 0 11.51 0.43 0.68 20.5
2011 0 0 0.55 2.47 0.01 0 3.1 0 10.68 0.62 0.79 20.6
2012 0 0 0.36 2.01 0.01 0.01 2.06 0 10.37 0.48 0.63 20.5
2013 0 0 0.28 1.98 0.01 0.01 1.8 0 10.97 0.47 0.54 21.4
2014 0 0 0.18 1.81 0.01 0 1.85 0 11.22 0.47 0.47 20.5
2015 0.03 0 0.08 1.83 0.01 0 1.77 0 11.25 0.43 0.39 19.89
2016 0.09 0 0.09 1.7 0.01 0 1.84 0 9.93 0.43 0.37 20.2
2017 0.1 0 0.07 1.53 0.01 0 1.81 0 10.64 0.4 0.35 20.5
y-o-y 11% -22% -10% -2% 7% -7% -5% 1%
Gas production in 2017 increased in Romania and Ukraine, and declined in Bulgaria, Croatia, Hungary, Serbia
and Turkey.
0
10
20
30
40
50
60
70
1990 1995 2000 2005 2010 2015
Gas Production, Bcm/y
Bulgaria Croatia Greece
Hungar y Romania Serbia
Tur key Ukraine
BBSPA statistical review
7
Gas consumption, Bcm
bcm/y Albania B & H Bulgaria Croatia Georgia Greece Hungary Macedonia Romania Serbia Turkey Ukraine
1990 0.25 0.49 6.64 2.7 5.6 0.17 10.97 0 35.49 3.18 3.51 113.04
1991 0.15 0.45 5.68 2.5 4.9 0.17 10.88 0 29.29 3.08 4.29 114.75
1992 0.11 0.42 5 2.59 4.87 0.16 9.56 0 26.08 2.78 4.7 106.01
1993 0.08 0.14 4.68 2.74 3.91 0.11 10.29 0 25.08 1.73 5.22 98.99
1994 0.05 0.17 4.7 2.58 2 0.06 10.39 0 22.84 1.45 5.56 88.02
1995 0.03 0.15 5.64 2.38 1.19 0.05 11.29 0 23.68 1.66 7.12 84.28
1996 0.02 0.25 5.75 2.67 1.07 0.06 12.6 0 23.9 2.39 8.6 91.68
1997 0.02 0.15 4.55 2.77 0.92 0.21 11.95 0 19.62 2.65 10.27 81.64
1998 0.02 0.17 3.85 2.66 0.94 0.89 12.03 0.02 18.44 2.47 11.01 73.22
1999 0.02 0.18 3.31 2.69 0.85 1.5 12.19 0.04 16.9 1.78 11.01 79.42
2000 0.01 0.27 3.42 2.45 1.14 2 11.97 0.07 17 1.8 15.46 73.4
2001 0.01 0.29 3.14 2.57 0.97 1.88 13.29 0.09 15.8 2.02 16.68 70.5
2002 0.01 0.3 2.74 2.68 0.81 2.02 13.3 0.09 15.9 2.08 18.01 69.8
2003 0.01 0.21 2.91 2.67 0.92 2.29 14.59 0.08 18.7 2.29 21.74 76.3
2004 0.02 0.37 2.84 2.83 1.08 2.51 13.72 0.07 18 2.58 22.88 75.8
2005 0.02 0.38 3.22 2.71 1.3 2.67 14.63 0.08 17.6 2.44 27.93 76.4
2006 0.02 0.37 3.25 2.69 1.3 3.28 14.44 0.08 17 2.28 31.18 73.9
2007 0.02 0.35 3.41 3.1 1.07 4.05 13.41 0.1 16.37 2.38 36.42 69.8
2008 0.02 0.31 3.34 3.06 1.56 4.2 13.32 0.12 14.5 2.49 37.53 59.7
2009 0.01 0.23 2.55 2.78 1.68 3.45 11.06 0.1 13.26 1.78 35.7 47
2010 0.01 0.24 2.81 2.96 1.69 3.97 12.44 0.12 13.9 2.35 39.61 52.17
2011 0 0.28 2.99 3.17 1.65 4.74 11.08 0.14 14.28 2.67 44.71 59.3
2012 0 0.26 2.99 2.91 1.49 4.34 10 0.14 13.5 2.22 45.25 54.77
2013 0 0.2 2.88 2.67 1.54 3.84 9.28 0.15 12.48 2.19 45.64 45.5
2014 0 0.17 2.78 2.43 2.19 2.63 8.5 0.14 11.59 1.98 48.61 42.14
2015 0 0.22 3.09 2.59 2.02 3.2 9.13 0.13 10.93 2.19 47.65 33.72
2016 0.09 0.23 3.13 2.65 2.26 4.07 9.72 0.21 11.42 2.23 46.45 26.7
2017 0.09 0.24 3.20 3.10 2.30 4.97 10.37 0.28 12.29 3.00 53.60 31.46
y-o-y 0% 4% 2% 17% 2% 22% 7% 33% 8% 35% 15% 18%
Gas consumption in 2017 increased in all countries in the region.
0
20
40
60
80
100
120
140
160
180
200
1990 1995 2000 2005 2010 2015
Gas Consumption, Bcm/yAlbania B & H Bulgaria
Croatia Georgia Greece
Hungary Macedonia Romania
Serbia Turkey Ukraine
Oil and gas import dependency in the BBS Region
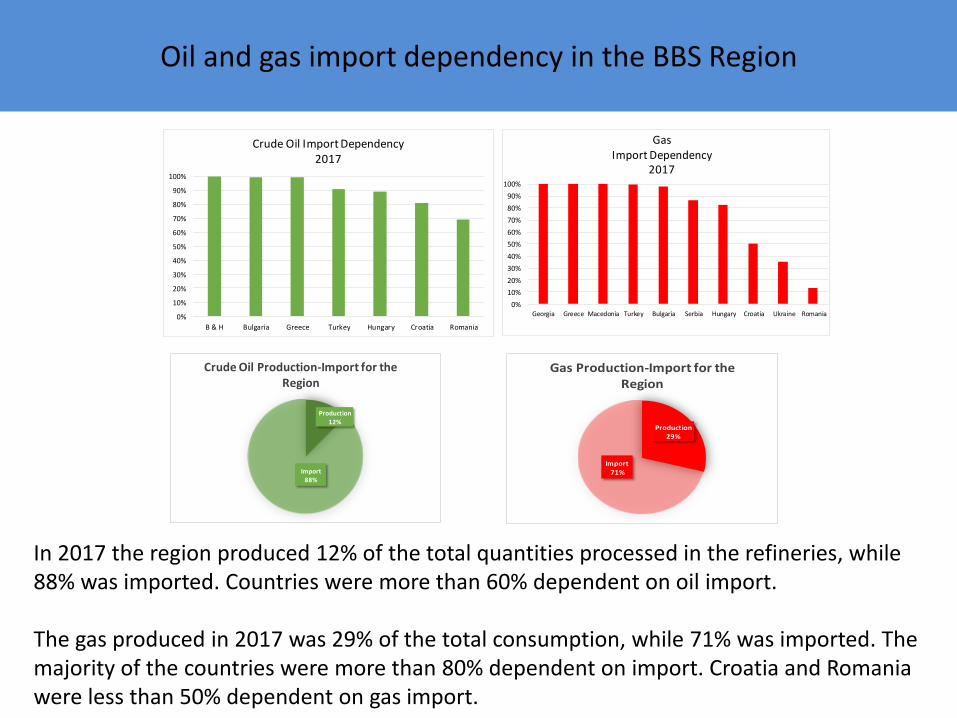
In 2017 the region produced 12% of the total quantities processed in the refineries, while 88% was imported. Countries were more than 60% dependent on oil import.
The gas produced in 2017 was 29% of the total consumption, while 71% was imported. The majority of the countries were more than 80% dependent on import. Croatia and Romania were less than 50% dependent on gas import.
BBSPA statistical review
8
Oil and Gas Import Dependency
In 2017 the region produced 12% of the total quantities processed in the refineries, while 88% was imported. All
countries were more than 60% dependent on import.
The gas produced in 2017 was 29% of the total consumption, while 71% was imported. The majority of the coun-
tries were more than 80% dependent on import. Croatia, Romania and Romania were less than 50% dependent
on import.
Production29%
Import71%
Gas Production-Import for the Region
Production12%
Import88%
Crude Oil Production-Import for the Region
0%
10%
20%
30%
40%
50%
60%
70%
80%
90%
100%
B & H Bulgaria Greece Turkey Hungary Croatia Romania
Crude Oil Import Dependency2017
0%
10%
20%
30%
40%
50%
60%
70%
80%
90%
100%
Georgia Greece Macedonia Turkey Bulgaria Serbia Hungary Croatia Ukraine Romania
Gas Import Dependency
2017
Gas pipeline projects status
34
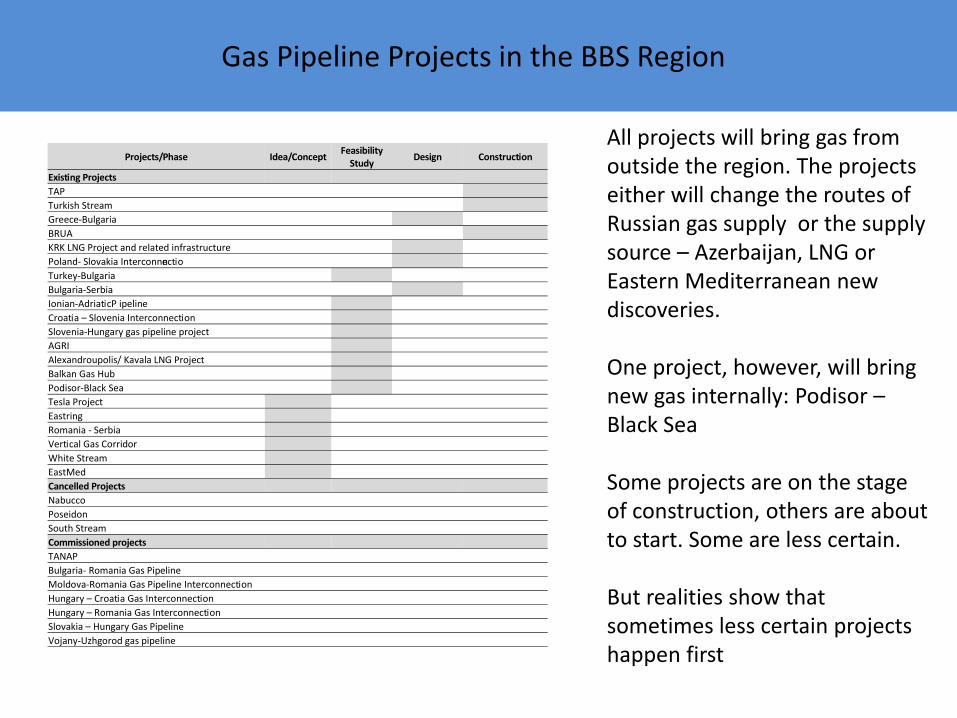
Gas pipeline projects in the BBS region
Gas Pipelines Projects Status, June 2017
Projects/Phase Idea/Concept Feasibility
Study Design Construction
Existing Projects
TAP
Turkish Stream
Greece-Bulgaria
BRUA
KRK LNG Project and related infrastructure
Poland- Slovakia Interconnection
Turkey-Bulgaria
Bulgaria-Serbia
Ionian-Adriatic
P ipeline
Croatia – Slovenia Interconnection
Slovenia-Hungary gas pipeline project
AGRI
Alexandroupolis/ Kavala LNG Project
Balkan Gas Hub
Podisor-Black Sea
Tesla Project
Eastring
Romania - Serbia
Vertical Gas Corridor
White Stream
EastMed
Cancelled Projects
Nabucco
Poseidon
South Stream
Commissioned projects
TANAP
Bulgaria- Romania Gas Pipeline
Moldova-Romania Gas Pipeline Interconnection
Hungary – Croatia Gas Interconnection
Hungary – Romania Gas Interconnection
Slovakia – Hungary Gas Pipeline
Vojany-Uzhgorod gas pipeline
Gas Pipeline Projects in the BBS Region
All projects will bring gas from outside the region. The projects either will change the routes of Russian gas supply or the supply source – Azerbaijan, LNG or Eastern Mediterranean new discoveries.
One project, however, will bring new gas internally: Podisor –Black Sea
Some projects are on the stage of construction, others are about to start. Some are less certain.
But realities show that sometimes less certain projects happen first
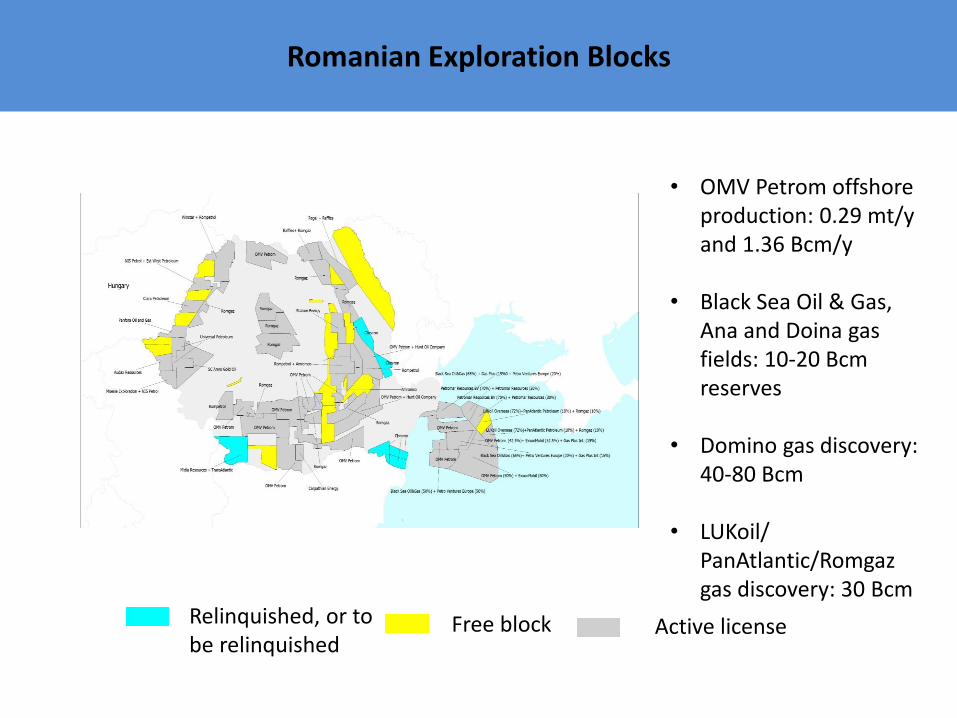
Relinquished, or to be relinquished
Free block Active license
• OMV Petrom offshore production: 0.29 mt/y and 1.36 Bcm/y
• Black Sea Oil & Gas, Ana and Doina gas fields: 10-20 Bcmreserves
• Domino gas discovery: 40-80 Bcm
• LUKoil/ PanAtlantic/Romgazgas discovery: 30 Bcm
Romanian Exploration Blocks
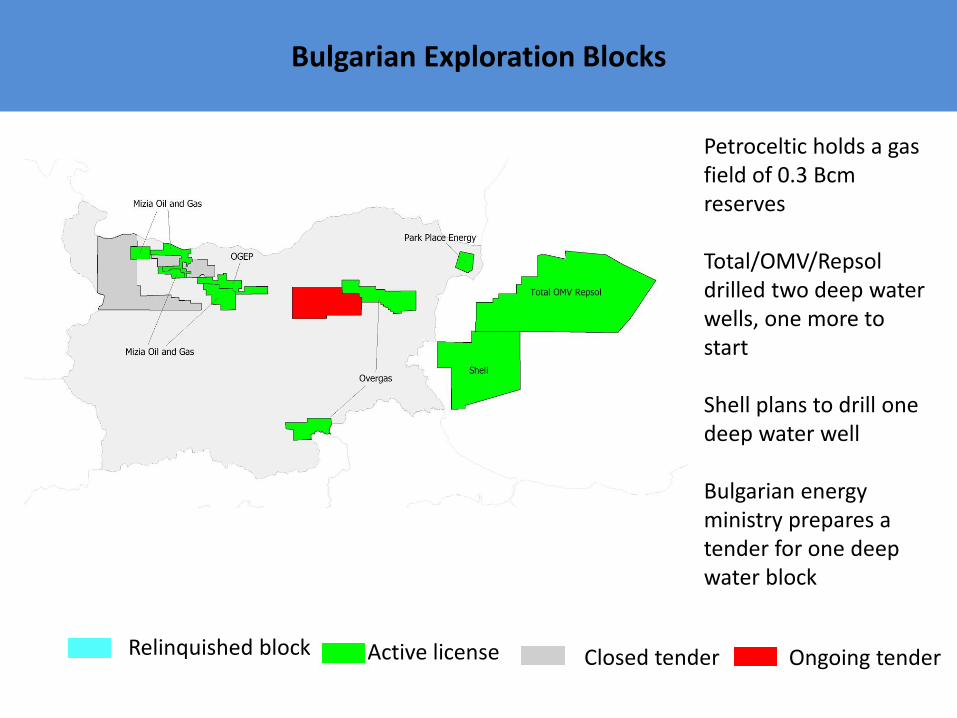
Relinquished block Active license Closed tender Ongoing tender
Petroceltic holds a gas field of 0.3 Bcmreserves
Total/OMV/Repsoldrilled two deep water wells, one more to start
Shell plans to drill one deep water well
Bulgarian energy ministry prepares a tender for one deep water block
Bulgarian Exploration Blocks
Upstream activities update
28
Bulgaria
Active license
Forthcoming and ongoing tender
March 2017. Shell completed the seismic acquisition programme of its block offshore Bulgaria.
July 2017. Noble’s Globetrotter II will drill its second well Rubin-1 in Han Asparuh block offshore Bulgaria this au-
tumn under a contract with Total.
January 2018 . Shell is expected to start an exploration drilling programme in block 1-14 Khan Kubrat in the Bulgari-
an sector of the Black Sea in late 2018 or in 2019. Drilling operations on the second well Rubin-1 contracted with
Total were completed as expected in early January 2018.
May 2018. Mizia Oil and Gas , which has four exploration permits onshore Bulgaria, received an one –year exten-
sion on one of them.
Closed tender
Bulgarian exploration blocks
June 2018
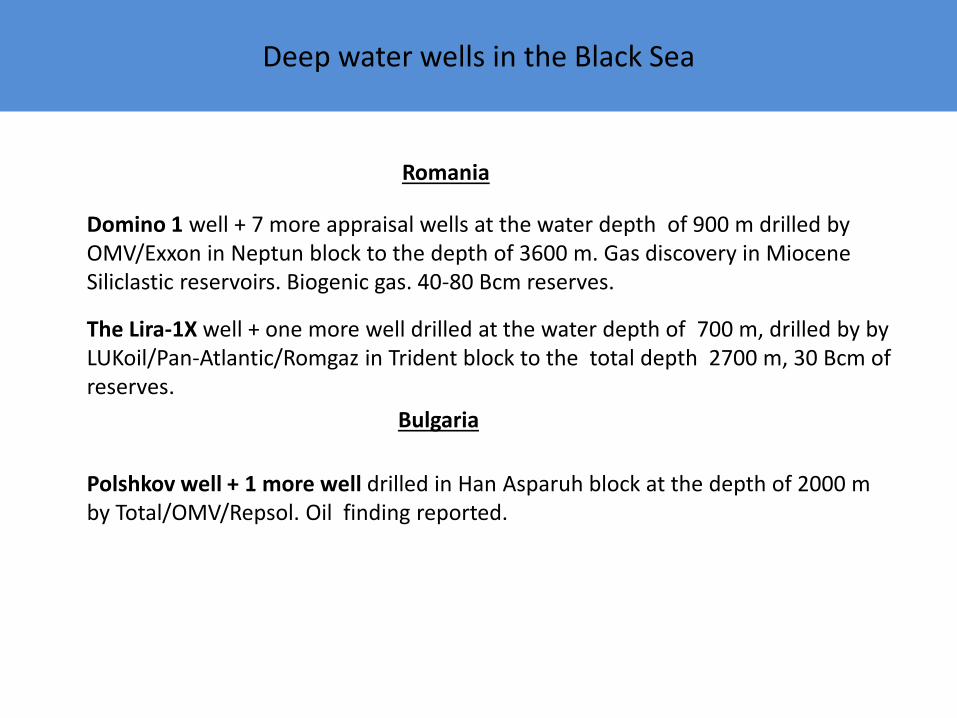
Deep water wells in the Black Sea
Domino 1 well + 7 more appraisal wells at the water depth of 900 m drilled by OMV/Exxon in Neptun block to the depth of 3600 m. Gas discovery in Miocene Siliclastic reservoirs. Biogenic gas. 40-80 Bcm reserves.
Romania
The Lira-1X well + one more well drilled at the water depth of 700 m, drilled by by LUKoil/Pan-Atlantic/Romgaz in Trident block to the total depth 2700 m, 30 Bcm of reserves.
Bulgaria
Polshkov well + 1 more well drilled in Han Asparuh block at the depth of 2000 m by Total/OMV/Repsol. Oil finding reported.
Deep water wells in the Black Sea
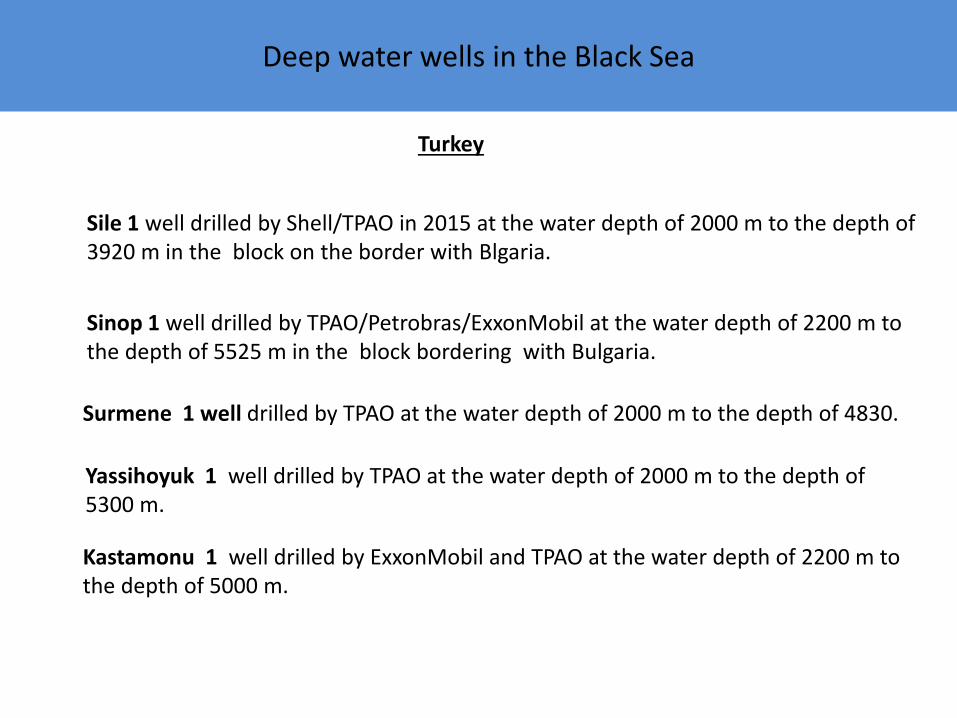
Turkey
Sile 1 well drilled by Shell/TPAO in 2015 at the water depth of 2000 m to the depth of 3920 m in the block on the border with Blgaria.
Sinop 1 well drilled by TPAO/Petrobras/ExxonMobil at the water depth of 2200 m to the depth of 5525 m in the block bordering with Bulgaria.
Surmene 1 well drilled by TPAO at the water depth of 2000 m to the depth of 4830.
Yassihoyuk 1 well drilled by TPAO at the water depth of 2000 m to the depth of 5300 m.
Kastamonu 1 well drilled by ExxonMobil and TPAO at the water depth of 2200 m to the depth of 5000 m.
Deep water wells in the Black Sea
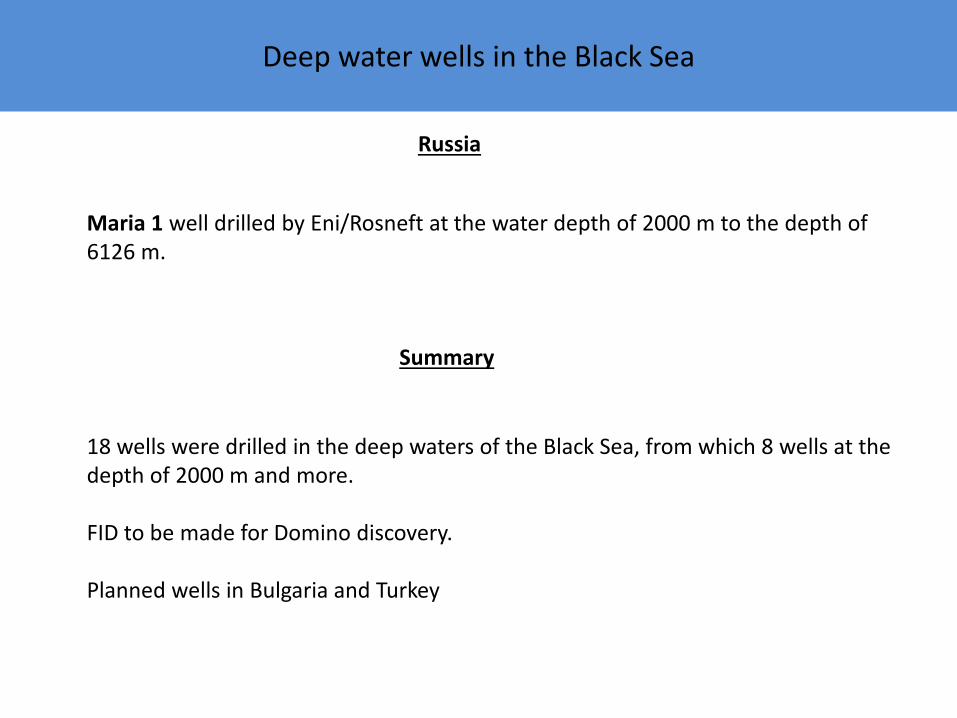
Russia
Maria 1 well drilled by Eni/Rosneft at the water depth of 2000 m to the depth of 6126 m.
Summary
18 wells were drilled in the deep waters of the Black Sea, from which 8 wells at the depth of 2000 m and more.
FID to be made for Domino discovery.
Planned wells in Bulgaria and Turkey

Thank you for your attention
Related Documents


![Osaka University Knowledge Archive : OUKA · surfaces with finite local monodromy. The main results here were already announced in [Us.4] only with some idea of froofs. A kunev surface](https://static.cupdf.com/doc/110x72/5f868b40cb975547c2188988/osaka-university-knowledge-archive-ouka-surfaces-with-finite-local-monodromy.jpg)