Val Veirs Colorado College Colorado Springs, CO Source Levels of Orca (Orcinus Orca) Social Vocalizations Measured with a Shore-Based Hydrophone Array S-19 Call -- 169 dB re 1Pa @ 1m

Val Veirs Colorado College Colorado Springs, CO
Jan 01, 2016
Source Levels of Orca ( Orcinus Orca ) Social Vocalizations Measured with a Shore-Based Hydrophone Array. Val Veirs Colorado College Colorado Springs, CO. S-19 Call -- 169 dB re 1 m Pa @ 1m. Orca Vocalization and Localization -- OVAL. - PowerPoint PPT Presentation
Welcome message from author
This document is posted to help you gain knowledge. Please leave a comment to let me know what you think about it! Share it to your friends and learn new things together.
Transcript

Val Veirs
Colorado College
Colorado Springs, CO
Source Levels of Orca (Orcinus Orca) Social Vocalizations Measured with a Shore-Based
Hydrophone Array
S-19 Call -- 169 dB re 1Pa @ 1m
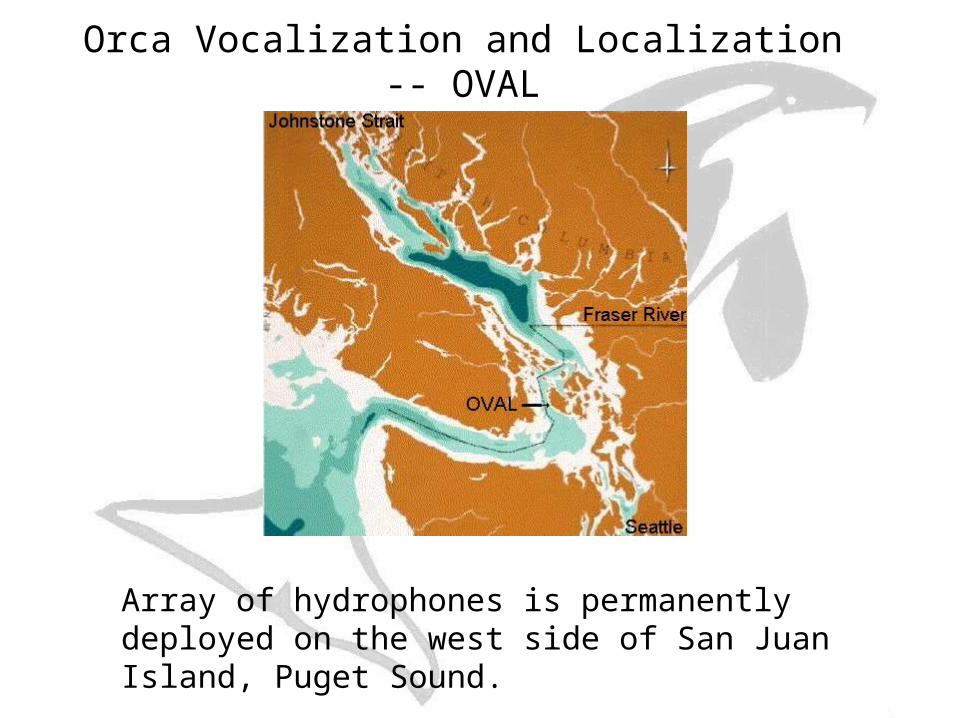
Array of hydrophones is permanently deployed on the west side of San Juan Island, Puget Sound.
Orca Vocalization and Localization -- OVAL

Each spring for the past 5 years a group of undergraduate physics majors from Colorado College have worked at the
site – deploying, repairing, operating …
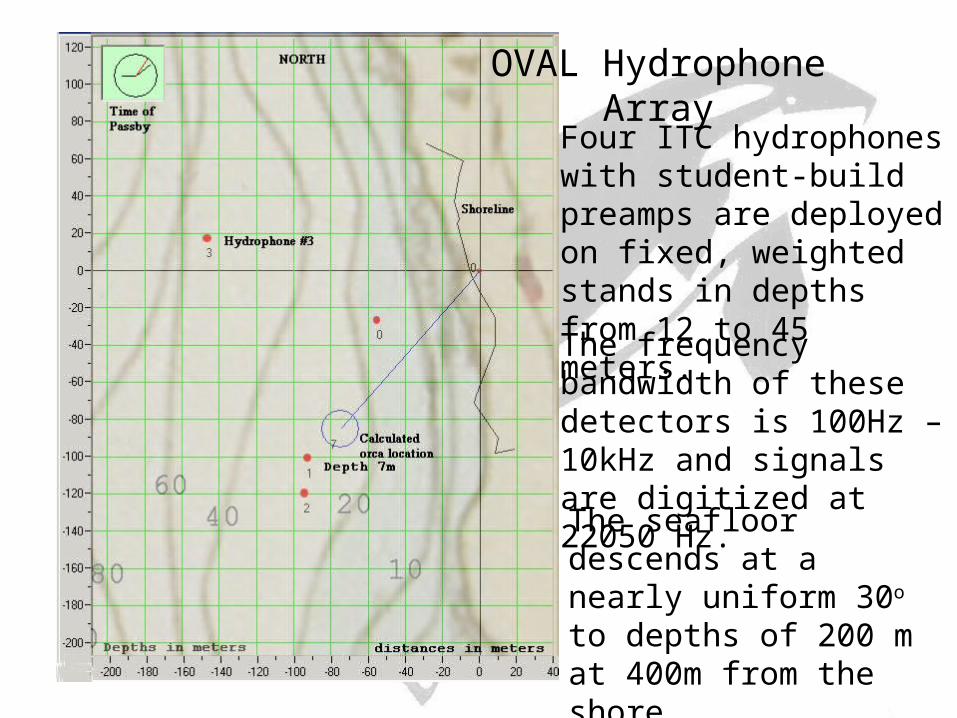
OVAL Hydrophone ArrayFour ITC hydrophones with student-build preamps are deployed on fixed, weighted stands in depths from 12 to 45 meters.
The seafloor descends at a nearly uniform 30o to depths of 200 m at 400m from the shore.
The frequency bandwidth of these detectors is 100Hz – 10kHz and signals are digitized at 22050 Hz.
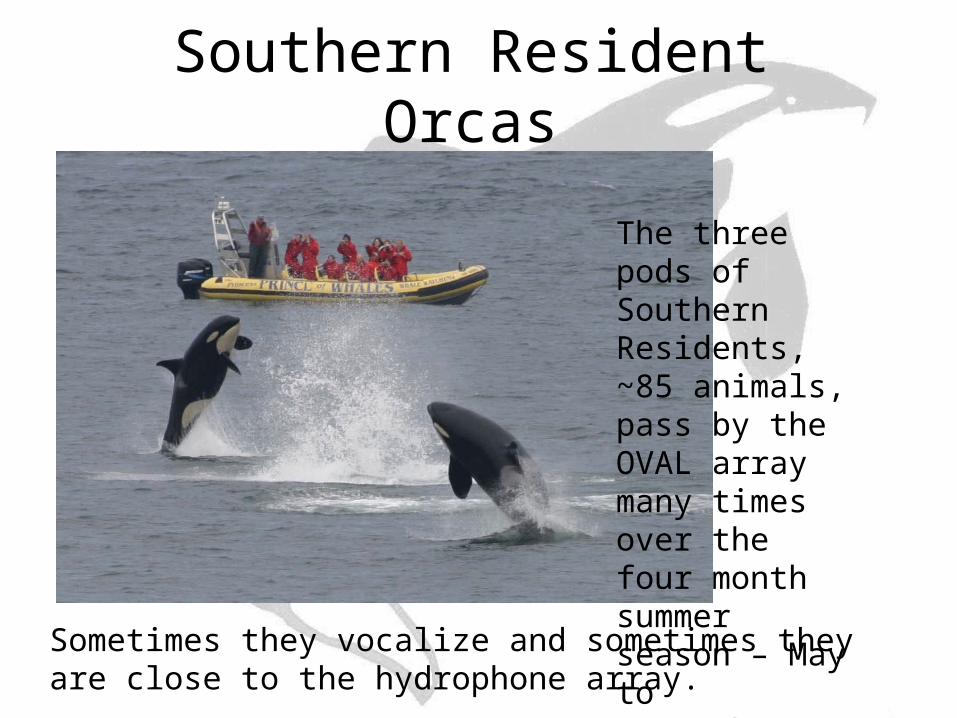
Southern Resident Orcas
The three pods of Southern Residents, ~85 animals, pass by the OVAL array many times over the four month summer season – May to September.
Sometimes they vocalize and sometimes they are close to the hydrophone array.
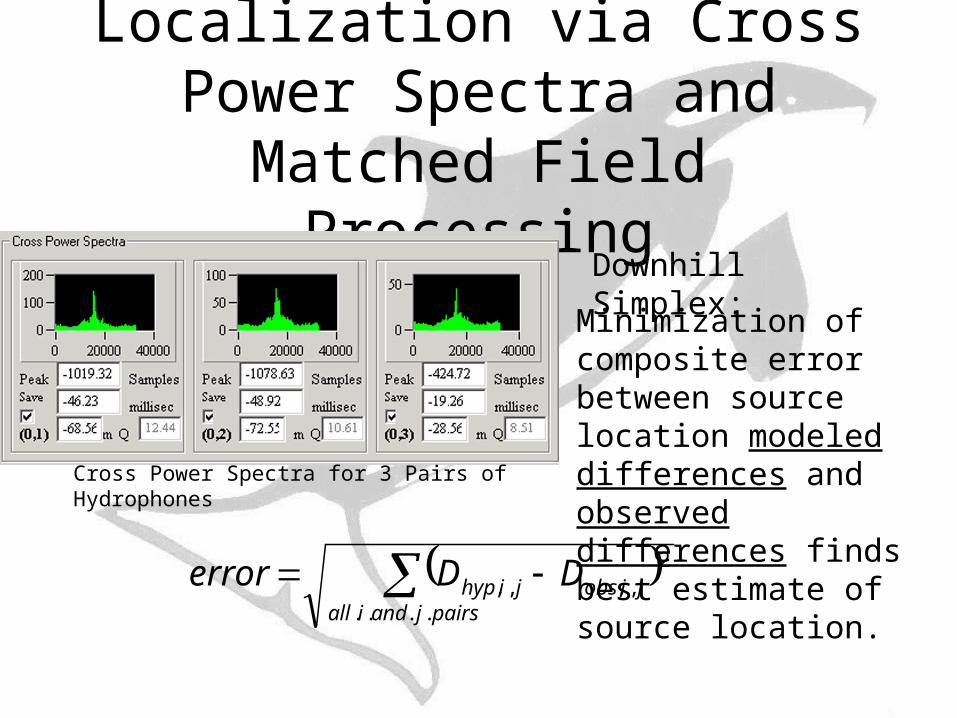
Localization via Cross Power Spectra and Matched Field
Processing
pairsjandiall
jiobsjihyp DDerror....
2,,,,
Minimization of composite error between source location modeled differences and observed differences finds best estimate of source location.
Downhill Simplex:
Cross Power Spectra for 3 Pairs of Hydrophones

Calibration of Hydrophone
Array
Chirps are sent to the hydrophones from J-9 underwater projector from known depths and GPS locations.
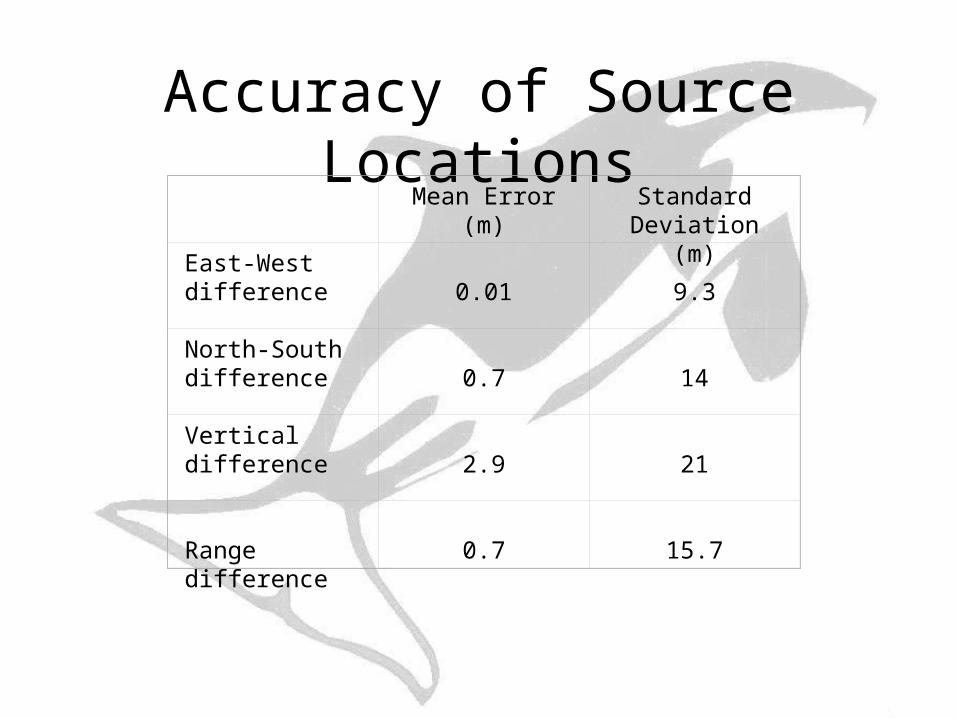
Accuracy of Source Locations Mean Error (m) Standard
Deviation (m)
East-West difference 0.01 9.3
North-South difference 0.7 14
Vertical difference 2.9 21
Range difference 0.7 15.7

Spreading ModelChirps sent from J-9 at source level of 140 dB re 1 Pa @ 1 m show average decrease in received level with distance is close to cylindrical spreading.
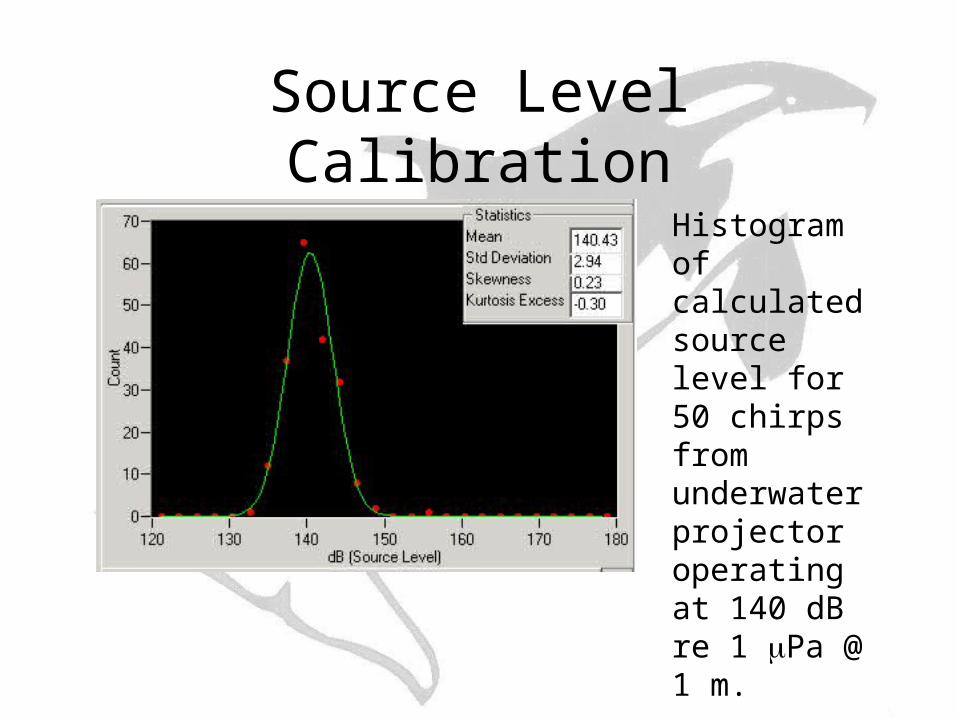
Source Level Calibration
Histogram of calculated source level for 50 chirps from underwater projector operating at 140 dB re 1 Pa @ 1 m.
Summer 2004 Orca Passbys
The OrcaSound hydrophone array ran continuously from May through September.
The system triggered on orca social vocalizations on 24 separate passbys on 19 different days.
A total of 1.84 Gb of acoustic data was automatically recorded during these passbys. All of these signals passed amplitude vs time profile constraints designed to accept transient signals that include orca vocalizations.

445 Orca Calls Near the ArraySelection Criteria: Events
Passing:
The localization must be of adequate quality (Q > 6) and the distance from any hydrophone and the localized position must be less than 400m (this distance is ~ twice the array aperture).
602
The frequency structure of the call must be “orca-like”. There must be a relatively small number of prominent peaks in the power spectra that persist continuously for periods of time ~ a half a second or more during the call.
456
A trained observer checked to hear and see if the recording is an orca vocalization.
445

Source Level Distribution 445 orca vocalizations within 400 m of hydrophones
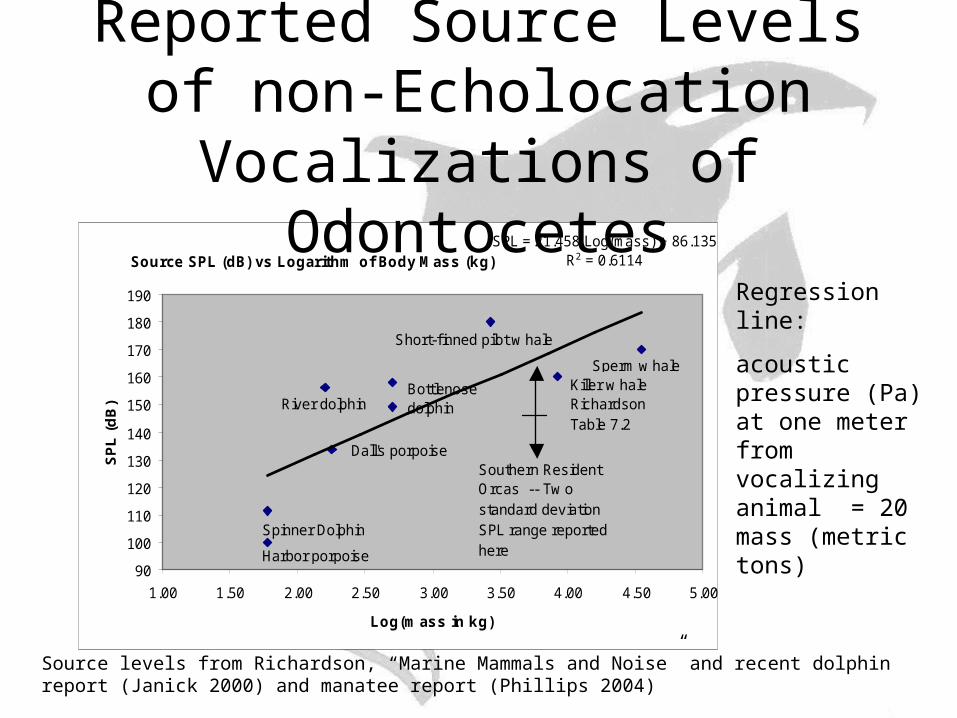
Source SPL (dB) vs Logarithm of Body Mass (kg)SPL = 21.458 Log(mass) + 86.135
R2 = 0.6114
90
100
110
120
130
140
150
160
170
180
190
1.00 1.50 2.00 2.50 3.00 3.50 4.00 4.50 5.00
Log(m ass in kg)
SP
L (
dB
)
Harbor porpoise
Spinner Dolphin
Dall's porpoise
BottlenosedolphinRiver dolphin
Sperm w hale
Short-f inned pilot w hale
Killer w haleRichardson Table 7.2
Southern ResidentOrcas -- Tw ostandard deviation SPL range reported here
Source levels from Richardson, “Marine Mammals and Noise” and recent dolphin report (Janick 2000) and manatee report (Phillips 2004)
Reported Source Levels of non-Echolocation Vocalizations of
Odontocetes
Regression line:
acoustic pressure (Pa) at one meter from vocalizing animal = 20 mass (metric tons)
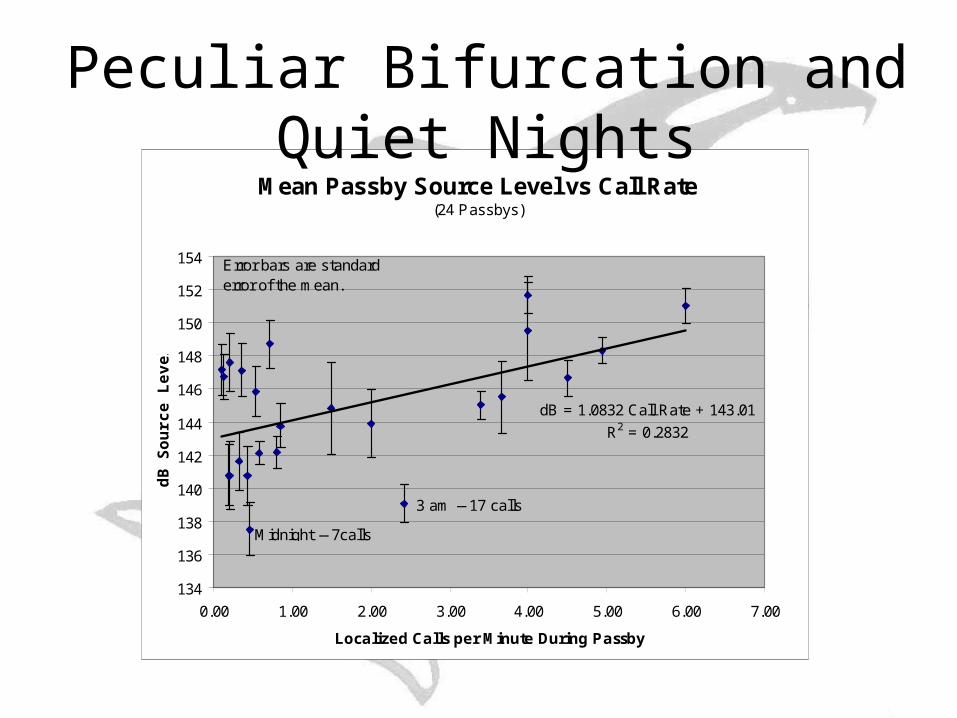
Mean Passby Source Level vs Call Rate(24 Passbys)
dB = 1.0832 Call Rate + 143.01
R2 = 0.2832
134
136
138
140
142
144
146
148
150
152
154
0.00 1.00 2.00 3.00 4.00 5.00 6.00 7.00
Localized Calls per Minute During Passby
dB
So
urc
e L
evel
Error bars are standard error of the mean.
Midnight -- 7calls
3 am -- 17 calls
Peculiar Bifurcation and Quiet Nights

Passby Average Source Level vs. BackgroundSource dB = 0.3601xBackground dB + 106.6
R2 = 0.2779
134
136
138
140
142
144
146
148
150
152
154
95 100 105 110 115 120
Background dB
Ave
rag
e S
ou
rce
Lev
el d
B
Midnight
3 am
Background Noise and Average Source Levels

Acknowledgement and Thanks
March 2000: Tami Beitzel, Jonah Huckabay, Rois Langner, Vik Sarkar, Davis Thomson March 2001: Kat Baker, Hannes Hubmayr, Bethany Marsh, Amos Ngola March 2002: Anderson English, Paul Guidice, Winn Jewett, Peter Richardson, Michael Silk, Hillary Swanson, Erika Danforth, Matt Ayres, Molly Yoder-Williams
March 2003: Luke Galli, Brian Hurlbutt, Winn Jewett, Bill Morton, Sara Schuster, Zach Van Hilsen
March 2004: Liz Martin, Craig Peterson, Luke Roberts, Nick Santorsola, Max Stevens, Yulan Qing
Colorado College Students:
The Colorado College Physics Department and Faculty Research Committee
The Whale Museum of Friday Harbor and Dr. Rich Osborne
Leslie Veirs and Scott Veirs
Related Documents