www.labmedicine.com Winter 2013 | Volume 44, Number 1 Lab Medicine e1 Vacancy Survey Since 1988, the American Society for Clinical Pathology (ASCP) has conducted its Vacancy Survey to determine the extent and distribution of workforce shortages within the nation’s clinical laboratories. This confidential survey has been administered every 2 years and has served as the primary source of information for academic, government, and industry labor analysts. Results from past surveys show that laboratory medicine is a rapidly evolving field. Although ASCP recognizes the importance of continuity, each administration of the Wage and Vacancy Survey represents an opportunity to improve its methodology to collect the most current relevant data while maximizing survey participation. The Survey has evolved in response to changes within the profession; new questions were added to the 2012 Survey to examine some of the factors affecting wage and vacancy rates. The ASCP continues to gather questions, comments, and suggestions from our members regarding the profession with the goal of addressing them through this important survey. Methodology The 2012 Vacancy Survey was conducted through collaboration between ASCP’s Institute of Science, Technology, & Policy in Washington, DC and its Educational Design and Technology division and Board of Certification in Chicago, IL. Select ASCP members who work in the field of laboratory medicine were recruited to review the survey questions and to critique the report. Partner organizations were also invited to participate in completing the survey to get a larger scope of the current issues faced by the laboratory workforce. Electronic survey invitations were sent on July 25, 2012, via Survey Gizmo (an online survey vendor). The survey was closed on August 31, 2012. To maximize response, this survey used snowball sampling, in which respondents were asked to forward the invitation e-mail message to other individuals currently practicing in the field. This year, ASCP also used social media (ie, Facebook and LinkedIn) to disseminate the Vacancy Survey to help augment response rates. The main goals of this year’s Vacancy Survey were to address the following: The American Society for Clinical Pathology’s 2012 Vacancy Survey of Clinical Laboratories in the United States Edna Garcia, MPH 1 , Asma Ali, MA 2 , Shahid Choudhry, PhD 3 DOI: 10.1309/LMZK40NMGLFLW9SX Abbreviations ASCP, American Society for Clinical Pathology; CMP, Certificate Maintenance Program; NCA, National Credentialing Agency; CME, continuing medical education; ASCLS, American Society for Clinical Laboratory Science; AACC, American Association for Clinical Chemistry; AMT, American Medical Technologists; ASC, American Society of Cytopathology; ASCT, American Society for Cytotechnology; ASM, American Society for Microbiology; CLMA, Clinical Laboratory Management Association; ARUP, Associated Regional and University Pathologists; LabCorp, Laboratory Corporation of America; SEIU, Service Employees International Union; AP, anatomic pathology; CT, cytotechnologist; HT, histotechnician; HTL, histotechnologist; PA, pathologist assistant; BB, technologist in blood banking; MLS, medical laboratory scientist; MT, medical technologist; MLT, medical laboratory technician; SBB, specialist in blood banking; CG, technologist in cytogenetics; SCT, specialist in cytotechnology; QIHC, qualification in immunohistochemistry; M, technologist in microbiology; SM, specialist in microbiology; MB, technologist in molecular biology; MP, molecular pathology; CLA, clinical laboratory assistant; and PBT, phlebotomy technician; IHC, immunohistochemistry 1 American Society for Clinical Pathology (ASCP) Institute of Science, Technology, & Policy, Washington, DC, 2 ASCP EDT Chicago, IL, 3 SAC Core Research Services, Chicago, IL *To whom correspondence should be addressed. E-mail: [email protected]

Welcome message from author
This document is posted to help you gain knowledge. Please leave a comment to let me know what you think about it! Share it to your friends and learn new things together.
Transcript
www.labmedicine.com Winter 2013 | Volume 44, Number 1 Lab Medicine e1
Vacancy Survey
Since 1988, the American Society for Clinical Pathology (ASCP) has conducted its Vacancy Survey to determine the extent and distribution of workforce shortages within the nation’s clinical laboratories. This confidential survey has been administered every 2 years and has served as the primary source of information for academic, government, and industry labor analysts. Results from past surveys show that laboratory medicine is a rapidly evolving field. Although ASCP recognizes the importance of continuity, each administration of the Wage and Vacancy Survey
represents an opportunity to improve its methodology to collect the most current relevant data while maximizing survey participation. The Survey has evolved in response to changes within the profession; new questions were added to the 2012 Survey to examine some of the factors affecting wage and vacancy rates. The ASCP continues to gather questions, comments, and suggestions from our members regarding the profession with the goal of addressing them through this important survey.
MethodologyThe 2012 Vacancy Survey was conducted through collaboration between ASCP’s Institute of Science, Technology, & Policy in Washington, DC and its Educational Design and Technology division and Board of Certification in Chicago, IL. Select ASCP members who work in the field of laboratory medicine were recruited to review the survey questions and to critique the report. Partner organizations were also invited to participate in completing the survey to get a larger scope of the current issues faced by the laboratory workforce. Electronic survey invitations were sent on July 25, 2012, via Survey Gizmo (an online survey vendor). The survey was closed on August 31, 2012. To maximize response, this survey used snowball sampling, in which respondents were asked to forward the invitation e-mail message to other individuals currently practicing in the field. This year, ASCP also used social media (ie, Facebook and LinkedIn) to disseminate the Vacancy Survey to help augment response rates.
The main goals of this year’s Vacancy Survey were to address the following:
The American Society for Clinical Pathology’s 2012 Vacancy Survey of Clinical Laboratories in the United States
Edna Garcia, MPH1, Asma Ali, MA2, Shahid Choudhry, PhD3
DOI: 10.1309/LMZK40NMGLFLW9SX
AbbreviationsASCP, American Society for Clinical Pathology; CMP, Certificate Maintenance Program; NCA, National Credentialing Agency; CME, continuing medical education; ASCLS, American Society for Clinical Laboratory Science; AACC, American Association for Clinical Chemistry; AMT, American Medical Technologists; ASC, American Society of Cytopathology; ASCT, American Society for Cytotechnology; ASM, American Society for Microbiology; CLMA, Clinical Laboratory Management Association; ARUP, Associated Regional and University Pathologists; LabCorp, Laboratory Corporation of America; SEIU, Service Employees International Union; AP, anatomic pathology; CT, cytotechnologist; HT, histotechnician; HTL, histotechnologist; PA, pathologist assistant; BB, technologist in blood banking; MLS, medical laboratory scientist; MT, medical technologist; MLT, medical laboratory technician; SBB, specialist in blood banking; CG, technologist in cytogenetics; SCT, specialist in cytotechnology; QIHC, qualification in immunohistochemistry; M, technologist in microbiology; SM, specialist in microbiology; MB, technologist in molecular biology; MP, molecular pathology; CLA, clinical laboratory assistant; and PBT, phlebotomy technician; IHC, immunohistochemistry
1American Society for Clinical Pathology (ASCP) Institute of Science, Technology, & Policy, Washington, DC, 2ASCP EDT Chicago, IL, 3SAC Core Research Services, Chicago, IL
*To whom correspondence should be addressed. E-mail: [email protected]

e2 Lab Medicine Winter 2013 | Volume 44, Number 1 www.labmedicine.com
Vacancy Survey
laboratory department
departmentMost of the names on the initial e-mail recipient list were derived from the ASCP database and included:
survey as a supervisor, manager, lead, educator, educational program director, or director who have direct reports and can report on vacancies, anticipated vacancies, and certifications of staff
ASCP and can report on vacancies, anticipated vacancies, and certifications of staff
o Individuals with lifetime certification o Individuals who are lifetime certified and who
voluntarily maintain Certificate Maintenance Program (CMP) credits
o Individuals who voluntarily maintain a National Credentialing Agency (NCA) component of their certification
-cal education (CME) coursework through ASCP and can report on vacancies, anticipated vacancies, and certifications of staff
o Individuals who have participated in relevant CME courses but are not ASCP certified
Survey and can report on vacancies, anticipated vacancies, and certifications of staff from 2010
ASCP also requested participation from the following partnering entities:
Blood Banks)
(ASCLS)
The 2012 Vacancy Survey sought to collect staff- and supervisory-level data for the following laboratory areas:
this year)
this year)
surveyed this year)
area surveyed this year; sample sides did not allow for statistically significant comparisons)
this year)
surveyed this year; sample sizes did not allow for statistically significant comparisons)
ASCP survey administrators recognize that there is no standard approach for how laboratories are organized and that laboratory areas may hire staff with a variety of certifications. The ASCP provided survey participants with the opportunity to report on the certifications that exist or are sought after for the laboratory area under their supervision.
Key FindingsThe primary objective of this research was to estimate the rate of shortages within clinical laboratory departments. Overall, this survey presents data from 935 respondents
States. Of all the departments surveyed, phlebotomy,
microbiology, chemistry, histology, and specimen
www.labmedicine.com Winter 2013 | Volume 44, Number 1 Lab Medicine e3
Vacancy Survey
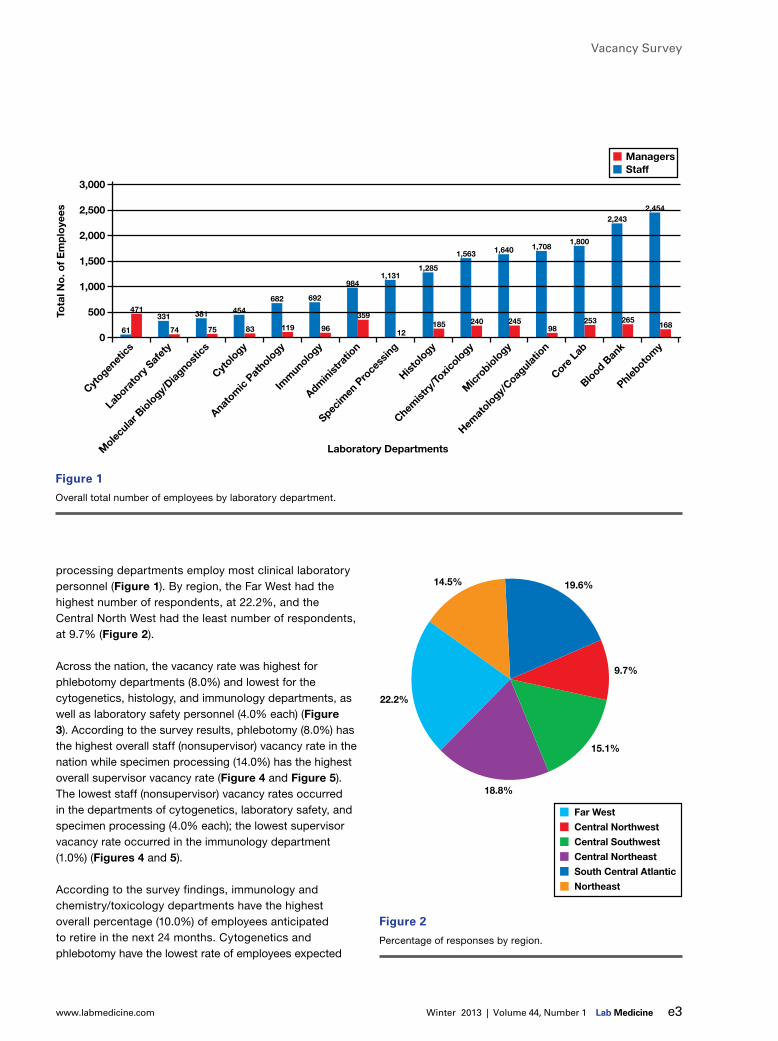
processing departments employ most clinical laboratory personnel (Figure 1). By region, the Far West had the highest number of respondents, at 22.2%, and the Central North West had the least number of respondents, at 9.7% (Figure 2).
Across the nation, the vacancy rate was highest for phlebotomy departments (8.0%) and lowest for the cytogenetics, histology, and immunology departments, as
Figure 3). According to the survey results, phlebotomy (8.0%) has the highest overall staff (nonsupervisor) vacancy rate in the
overall supervisor vacancy rate (Figure 4 and Figure 5). The lowest staff (nonsupervisor) vacancy rates occurred in the departments of cytogenetics, laboratory safety, and
vacancy rate occurred in the immunology department (1.0%) (Figures 4 and 5).
According to the survey findings, immunology and
overall percentage (10.0%) of employees anticipated
phlebotomy have the lowest rate of employees expected
Figure 2
Percentage of responses by region.
Figure 1
Overall total number of employees by laboratory department.
0
500
Cytogen
etics
Labora
tory
Saf
ety
Molec
ular B
iolo
gy/Diag
nostics
Cytolo
gy
Anatom
ic Pat
hology
Imm
unology
Admin
istra
tion
Specim
en P
roce
ssin
g
Histolo
gy
Chemist
ry/T
oxicolo
gy
Micr
obiolo
gy
Hemat
ology/
Coagulat
ion
Core L
ab
Blood B
ank
Phleboto
my
1,000
1,500
2,000
Laboratory Departments
Tota
l No
. of
Em
plo
yees 2,500
3,000
61
471331
74
381
75
454
83
682
119
692
96
984
359
1,131
12
1,285
185
1,563
240
1,640
245
1,708
98
1,800
253
2,243
265
2,454
168
ManagersStaff
14.5% 19.6%
9.7%
15.1%
18.8%
22.2%
Far West
Central Northwest
Central Southwest
Central Northeast
South Central Atlantic
Northeast

e4 Lab Medicine Winter 2013 | Volume 44, Number 1 www.labmedicine.com
Vacancy Survey
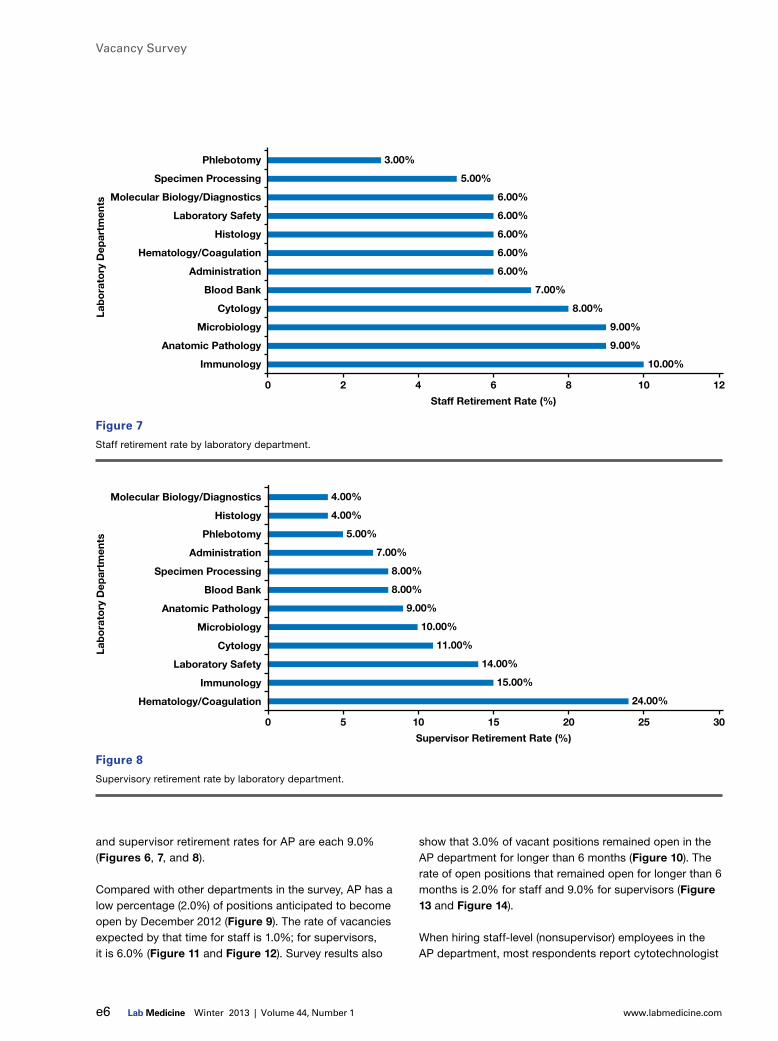
Figure 6). The staff retirement rate is highest in the immunology department (10.0%) and lowest in the phlebotomy department (3.0%) (Figure 7). The supervisor retirement
Figure 8).
diagnostics and phlebotomy departments have the highest percentage (8.0%) of positions anticipated
positions by that time (Figure 9). Data also reveal that
Figure 3
Immunology
0 1 2 3 4 5 6 7 8
Overall Vacancy Rates (%)
Lab
ora
tory
Dep
artm
ents
9
Microbiology
4.0%4.0%4.0%4.0%
5.0%5.0%5.0%5.0%
6.0%6.0%6.0%6.0%6.0%
7.0%8.0%
Administration
Laboratory Safety
Anatomic Pathology
Blood BankCore Lab
Hematology/CoagulationChemistry/Toxicology
Cytogenetics
Histology
Molecular Biology/Diagnostics
Specimen Processing
Phlebotomy
Cytology
Figure 4
Staff (non-supervisory) vacancy rates by laboratory department. Note: sample sizes for Reproductive Medicine and Genetics
Immunology
0 1 2 3 4 5 6 7
Staff (Nonsupervisory) Vacancy Rates (%)
Lab
ora
tory
Dep
artm
ents
98
Microbiology
4.0%4.0%4.0%
5.0%5.0%5.0%5.0%5.0%
6.0%6.0%6.0%
7.0%7.0%7.0%
8.0%
AdministrationLaboratory Safety
Anatomic PathologyBlood Bank
Core LabHematology/Coagulation
Chemistry/Toxicology
Cytogenetics
Histology
Molecular Biology/Diagnostics
Specimen Processing
Phlebotomy
Cytology

www.labmedicine.com Winter 2013 | Volume 44, Number 1 Lab Medicine e5
Vacancy Survey
percentage of vacancies that remained open for longer Figure 10).
The regional distribution of states is shown in Table 1. The Central South West and Far West regions reported higher vacancy rates than other regions; the Central North East had the lowest vacancy rates (Table 2).
Anatomic Pathology (AP), Including Non-MD ProfessionalsThe total vacancy rate for AP is 7.0% (Figure 3). The staff (nonsupervisor) vacancy rate is 7.0%; the supervisory vacancy rate is 2.0% (Figures 4 and 5). Results also reveal that 8.0% of all AP employees are expected
Figure 5
Immunology
0 2 4 6 8 10 12 14
Supervisory Vacancy Rates (%)
Lab
ora
tory
Dep
artm
ents
16
Microbiology
1.0%2.0%2.0%2.0%
3.0%3.0%3.0%
4.0%4.0%4.0%
5.0%6.0%6.0%
7.0%14.0%
Administration
Laboratory Safety
Anatomic Pathology
Blood Bank
Core Lab
Hematology/CoagulationChemistry/Toxicology
Cytogenetics
Histology
Molecular Biology/Diagnostics
Specimen Processing
Phlebotomy
Cytology
ImmunologyChemistry/Toxicology
0 2 4 6
Overall Retirement Rate (%)
Lab
ora
tory
Dep
artm
ents
8 10 12
Microbiology
10.00%10.00%
9.00%9.00%
8.00%8.00%8.00%
7.00%7.00%7.00%
6.00%5.00%5.00%
4.00%4.00%
Core LabAdministration
Anatomic PathologyCytology
Blood BankHematology/Coagulation
Laboratory SafetyHistology
Molecular Biology/DiagnosticsSpecimen Processing
PhlebotomyCytogenetics
Figure 6
Overall retirement rate by laboratory department.
e6 Lab Medicine Winter 2013 | Volume 44, Number 1 www.labmedicine.com
Vacancy Survey
and supervisor retirement rates for AP are each 9.0% (Figures 6, 7, and 8).
Compared with other departments in the survey, AP has a low percentage (2.0%) of positions anticipated to become open by December 2012 (Figure 9). The rate of vacancies expected by that time for staff is 1.0%; for supervisors,
Figure 11 and Figure 12). Survey results also
show that 3.0% of vacant positions remained open in the Figure 10). The
months is 2.0% for staff and 9.0% for supervisors (Figure 13 and Figure 14).
When hiring staff-level (nonsupervisor) employees in the AP department, most respondents report cytotechnologist
Immunology
0 2 4 6
Staff Retirement Rate (%)
Lab
ora
tory
Dep
artm
ents
8 10 12
Microbiology
10.00%
9.00%
9.00%
8.00%
7.00%
6.00%
6.00%
6.00%
6.00%
6.00%
5.00%
3.00%
Administration
Anatomic Pathology
Cytology
Blood Bank
Hematology/Coagulation
Laboratory Safety
Histology
Molecular Biology/Diagnostics
Specimen Processing
Phlebotomy
Immunology
0 5 10 15
Supervisor Retirement Rate (%)
Lab
ora
tory
Dep
artm
ents
20 25 30
Microbiology
4.00%
4.00%
5.00%
7.00%
8.00%
8.00%
9.00%
10.00%
11.00%
14.00%
15.00%
24.00%
Administration
Anatomic Pathology
Cytology
Blood Bank
Hematology/Coagulation
Laboratory Safety
Histology
Molecular Biology/Diagnostics
Specimen Processing
Phlebotomy
Figure 7
Staff retirement rate by laboratory department.
Figure 8
Supervisory retirement rate by laboratory department.

www.labmedicine.com Winter 2013 | Volume 44, Number 1 Lab Medicine e7
Vacancy Survey
pathologist assistants (PA) as the preferred credential or
AP department indicated that they are not required to hire only certified individuals.
Within AP, data show that 100% of staff (nonsupervisors) and supervisors are certified (Figure 15 and Figure 16).
The vacancy rate for the anatomic pathology department is highest in the Northeast region (7.0%) and lowest in the Central North West (5.0%) (Table 2).
Blood Bank (Immunohematology)The vacancy rate for the blood bank department is
Figure 3). This year’s staff (nonsupervisor) and
Immunology
0 1 2 3 4 5 6 7 8
Overall Percentage of Positions Anticipated in the Next 6 Months(by December 2012)
Lab
ora
tory
Dep
artm
ents
9
Microbiology
0.40%1.00%1.00%
2.00%2.00%
3.00%3.00%3.00%
4.00%5.00%5.00%
6.00%7.00%
8.00%8.00%
AdministrationAnatomic Pathology
CytologyChemistry/Toxicology
Cytogenetics
Core Lab
Blood Bank
Hematology/Coagulation
Laboratory Safety
Histology
Molecular Biology/DiagnosticsSpecimen Processing
Phlebotomy
Figure 9
Immunology
0 1 2 3 4 5 6
Percentage of Overall PositionsOpen for More Than 6 Months
Lab
ora
tory
Dep
artm
ents
7
Microbiology
2.00%3.00%3.00%3.00%3.00%3.00%3.00%
4.00%4.00%4.00%4.00%4.00%
5.00%5.00%
6.00%
AdministrationAnatomic Pathology
Chemistry/ToxicologyBlood Bank
Laboratory Safety
Cytogenetics
Hematology/Coagulation
Histology
Molecular Biology/DiagnosticsCore Lab
Specimen ProcessingPhlebotomy
Cytology
Figure 10

e8 Lab Medicine Winter 2013 | Volume 44, Number 1 www.labmedicine.com
Vacancy Survey
Immunology
0 2 4 6 8 10
Percentage of Staff (Non-supervisory) Anticipated in the Next 6 Months(by December 2012)
Lab
ora
tory
Dep
artm
ents
12
Microbiology
0.31%
0.44%
1.00%
1.00%
3.00%
4.00%
5.00%
5.00%
6.00%
8.00%
9.00%
10.00%
Administration
Anatomic Pathology
Cytology
Blood Bank
Hematology/Coagulation
Laboratory Safety
Histology
Molecular Biology/Diagnostics
Specimen Processing
Phlebotomy
Figure 11
Table 1. Regional Distribution by States
Region States
Far West Alaska (AK), Arizona (AZ), California (CA), Colorado (CO), Hawaii (HI), Idaho (ID), Montana (MT), Nevada (NV), New Mexico (NM), Oregon (OR), Utah (UT), Washington (WA), Wyoming (WY)
Central Northwest Iowa (IA), Kansas (KS), Minnesota (MN), Missouri (MO), Nebraska (NE), North Dakota (ND), South Dakota (SD)
Central Southwest Arkansas (AR), Louisiana (LA), Oklahoma (OK), Texas (TX)
Central Northeast Illinois (IL), Indiana (IN), Michigan (MI), Ohio (OH), Wisconsin (WI)
South Central Atlantic Alabama (AL), Delaware (DE), District of Columbia (DC), Florida (FL), Georgia (GA), Kentucky (KY), Maryland (MD), Mississippi (MS), North Carolina (NC), South Carolina (SC), Tennessee (TN), Virginia (VA), West Virginia (WV)
Northeast Connecticut (CT), Maine (ME), Massachusetts (MA), New Hampshire (NH), New Jersey (NJ), New York (NY), Pennsylvania (PA), Rhode Island (RI), Vermont (VT)
Table 2. Vacancy Rates by Region
Central Central Central South Central Laboratory Department Far West (%) Northwest (%) Southwest (%) Northeast (%) Atlantic (%) Northeast (%)
Administration 6 1 5 3 3 8Anatomic Pathology 6 3 4 4 6 7Blood Bank 6 4 9 4 7 5Chemistry/Toxicology 6 5 6 4 4 3Core Lab 6 4 6 4 5 4Cytogenetics 3 0 4 2 4 4Cytology 2 5 2 4 5 4Hematology/Coagulation 5 6 9 3 3 5Histology 4 5 3 1 5 5Immunology 8 6 6 3 3 2Laboratory Safety 8 5 1 0 7 0Microbiology 5 1 4 5 4 3Molecular Biology/Diagnostics 5 3 8 6 4 4Phlebotomy 5 7 9 5 7 10Specimen Processing 5 6 8 7 5 9

www.labmedicine.com Winter 2013 | Volume 44, Number 1 Lab Medicine e9
Vacancy Survey
supervisor vacancy rates are each 7.0% (Figures 4 and 5). Survey respondents working at blood banks indicated that they anticipate a 7.0% overall retirement rate in the
anticipated retirement rate of 7.0%, compared with 8.0% for supervisors (Figures 6-8).
Blood banks also have a lower rate of expected available positions by December 2012, at 1.0% (Figure 9). This rate is almost nonexistent for staff (0.3%) but in the high range for supervisors (5.0%) (Figures 11 and 12). Blood banks also have the highest rate of overall and supervisor
Immunology
0 1 2 3 4 5 6 7
Percentage of Supervisor Positions Anticipated in the Next 6 Months(by December 2012)
Lab
ora
tory
Dep
artm
ents
8
Microbiology
0.00%
1.00%
2.00%
2.00%
3.00%
4.00%
4.00%
4.00%
5.00%
6.00%
6.00%
7.00%
Administration
Anatomic Pathology
Blood Bank
Hematology/Coagulation
Chemistry/Toxicology
Histology
Molecular Biology/Diagnostics
Specimen Processing
Phlebotomy
Cytology
Figure 12
Immunology
0 1 2 3 4 5
Percentage of Staff (Non-supervisory)Open for More Than 6 Months
Lab
ora
tory
Dep
artm
ents
6
Microbiology
2.00%
3.00%
3.00%
3.00%
3.00%
3.00%
4.00%
4.00%
4.00%
4.00%
4.00%
5.00%
Administration
Anatomic Pathology
Blood Bank
Laboratory Safety
Hematology/Coagulation
Histology
Molecular Biology/Diagnostics
Specimen Processing
Phlebotomy
Cytology
Figure 13

e10 Lab Medicine Winter 2013 | Volume 44, Number 1 www.labmedicine.com
Vacancy Survey
at 5.0% and 25.0%, respectively (Figures 10 and 14). The rate of staff positions that remained open for longer than
Figure 13).
Respondents from blood banks prefer technologist in blood
technologist (MT), medical laboratory technician (MLT), and specialist in blood banking (SBB) certifications when hiring
staff (nonsupervisor) employees. In this department, 75.5% of the respondents reported that certification is required of candidates for staff positions. According to the survey results, 81.0% of staff and 85.0% of supervisors working in blood banks are certified (Figures 15 and 16). The Central South West region has the highest vacancy rate (9.0%) and the Central North East and Central North West regions have
Table 2).
Immunology
0 5 10 15 20 25
Percentage of Supervisory PositionsOpen for More Than 6 Months
Lab
ora
tory
Dep
artm
ents
30
Microbiology
1.00%
1.00%
2.00%
2.00%
3.00%
3.00%
3.00%
4.00%
7.00%
7.00%
9.00%
25.00%
Administration
Anatomic Pathology
Blood Bank
Laboratory Safety
Hematology/Coagulation
Histology
Molecular Biology/Diagnostics
Specimen Processing
Phlebotomy
Cytology
Figure 14
Immunology
0
Percentage of Certi�ed Staff (Non-supervisory) (%)
Lab
ora
tory
Dep
artm
ents
12020 40 60 80 100
Microbiology
50.00%
50.00%
63.00%
66.00%
77.00%
79.00%
79.00%
81.00%
83.00%
90.00%
100.00%
100.00%
100.00%
Administration
Anatomic Pathology
Blood Bank
Laboratory Safety
Cytogenetics
Hematology/Coagulation
Histology
Molecular Biology/Diagnostics
Specimen Processing
Phlebotomy
Cytology
Figure 15
Percentage of certified staff by department.

www.labmedicine.com Winter 2013 | Volume 44, Number 1 Lab Medicine e11
Vacancy Survey
Chemistry/Toxicology
(Figure 3). The staff (nonsupervisor) vacancy rate and that Figures 4 and 5). Results
Figure 6).
Compared with other departments in the survey,
Figure 9). This department also has the highest rate of vacancies that
Figure 10).
department prefer to hire employees with medical
certification is a prerequisite for candidates for hire. The
highest in the Central South West and Far West regions Table 2).
Further analysis of the staff and supervisor retirement rate, anticipated vacancies by December 2012, the rate
months, and percent of certified respondents could not be performed because the results would be rendered statistically insignificant.
Core Laboratory
ASCP collected data on core laboratories for the first time with this survey. Laboratory workflow models using core laboratory organizational methods have gained wide popularity in the past 20 years. Although specific test menus for core laboratories vary from facility to facility, those facilities generally handle hematology, chemistry, and, in many cases, microbiology. Core laboratories may serve 1 or more hospitals, physician offices, and nursing homes.
Figure 3). The total vacancy rate for staff (nonsupervisors) is 7.0%
Figures 4 and 5). Results also reveal that 9.0% of the total core laboratory
months (Figure 6).
According to survey results, the rate for expected vacancies by December 2012 in the core laboratory is
Figure 9vacant positions remained open in the core laboratory for
Figure 10).
When hiring staff-level (nonsupervisor) employees for core laboratories, most respondents report medical laboratory
laboratory technician (MLT) as the preferred credential

e12 Lab Medicine Winter 2013 | Volume 44, Number 1 www.labmedicine.com
Vacancy Survey
participants reported that certification is a prerequisite for candidates for hire. The Central South West and Far West
Central North East, Central North West, and Northeast Table 2).
Further analysis of the staff and supervisor retirement rates, anticipated vacancies by December 2012, rate of
months, and percent of certified respondents could not be performed because the results would be rendered statistically insignificant.
CytogeneticsFigure 3).
supervisor vacancy rate is 3.0% (Figures 4 and 5). Survey respondents from the cytogenetics department indicated
Figure 6).
The overall percentage of positions anticipated by December 2012 for cytogenetics is 3.0% (Figure 9). The rate of positions remaining open in the cytogenetics
Figure 10).
The certification of choice when hiring staff-level (nonsupervisor) employees in the cytogenetics department is technologist in cytogenetics (CG). Although CG is the
department indicated that certification is not a prerequisite for candidates for hire. Despite this, survey results show that 79.0% of staff and 100% of supervisors are certified (Figure 15 and Figure 16). The vacancy rate for the cytogenetics department is highest in the Central South
each) and lowest in the Central North West (0%) (Table 2).
Further analysis of the staff and supervisor retirement rates, anticipated vacancies by December 2012, and rate
months could not be performed because the results would be rendered statistically insignificant.
CytologyThe vacancy rate for the cytology department is 5.0% (Figure 3). Total staff (nonsupervisor) and supervisor vacancy rates are each 5.0% (Figures 4 and 5). Survey results show that 8.0% of cytology personnel are expected
retirement rate is 8.0% and the rate for supervisors is 11.0% (Figures 6-8).
The rate of anticipated positions by December 2012 for the cytology department is 1.0% (Figure 9). The percentage for staff-level positions is also almost nonexistent, at
December 2012 for supervisors, however, is the highest among all the departments surveyed, at 7.0% (Figures 11 and 12). Cytology has the lowest percentage of vacant
at 2.0% (Figure 10). The rate of positions remaining open
(Figures 13 and 14).
Respondents from the cytology department prefer cytotechnologist (CT) and specialist in cytotechnology (SCT) certifications when hiring staff-level (nonsupervisor) employees. Also, 79.1% of the supervisors indicated that certification is a prerequisite for candidates for hire. Survey results show that 100% of staff and supervisors are certified (Figures 15 and 16). By region, the vacancy rate for cytology is highest in the Central North West and South Central Atlantic regions (5.0% each) and lower in the Far West and Central South West (2.0% each) (Table 2).
Hematology/Coagulation
Figure 3). Total staff (nonsupervisor) Figures
4 and 5coagulation department indicated that they anticipate a
Figures 6-8).
The overall percentage of positions anticipated by Figure
9). The rate of vacancies expected by that time for staff is Figures 11 and 12). The
(Figure 10). The percentage of open positions that remained
supervisors (Figures 13 and 14).
department prefer to hire employees with medical

www.labmedicine.com Winter 2013 | Volume 44, Number 1 Lab Medicine e13
Vacancy Survey
reported that certification is required when hiring staff. According to survey results, 90.0% of staff and 100% of supervisors are certified (Figures 15 and 16). The Central South West region has the highest vacancy rate, at 9.0%, and the South Central Atlantic and Central North East had the lowest vacancy rate, at 3.0%.
HistologyFigure 3).
The staff (nonsupervisory) vacancy rate is 5.0% and Figures 4 and 5).
-
(Figures 6-8).
According to survey results, the rate of anticipated Figure
9). The percentage of positions anticipated to become open by that time is higher for staff (5.0%) than supervisors (3.0%) (Figures 11 and 12). Overall, 3.0% of positions in
(Figure 10). The rates of vacancies left open for longer
(Figures 13 and 14).
When hiring staff-level (nonsupervisor) employees in the histology department, most respondents report
qualification in
the respondents from this department indicated that certification is not a prerequisite for candidates for hire.
supervisors in the histology department are certified (Figures 15 and 16). The Central North West and South Central Atlantic regions have the highest vacancy rates (5.0% each); the lowest rates are observed in the Central South West (3.0%).
Immunology
(Figure 3). The total vacancy rate for staff (nonsupervisors) is 5.0% and for supervisors is 1.0% (Figures 4 and 5).
anticipates an overall retirement rate of 10.0%, the highest in all the departments surveyed. The staff (nonsupervisor)
retirement rate is 10.0%, which is also the highest among all departments surveyed; the supervisor retirement rate is 15.0% (Figures 6-8).
The overall percentage of positions anticipated by December 2012 for immunology is 5.0%. The rate of vacant positions expected during that time for staff
Figures 11 and 12). The rate of vacant positions in immunology
(Figure 10). The rates of staff and supervisor positions
respectively (Figures 13 and 14).
The certifications of choice when hiring staff-level (nonsupervisor) employees in the immunology department
(MT) and medical laboratory technician (MLT). In this
that certification is a prerequisite for hire. According to survey results, 100% of staff and supervisors are certified (Figures 15 and 16). The vacancy rate for the immunology department is highest in the Far West region (8.0%) and lowest in the North East (2.0%).
Laboratory SafetyIn recent years, many facilities have added 1 or more full- or part-time safety officers to administer laboratory safety programs. Specific responsibilities for this position vary by institution; however, they generally include all or a combination of the following: oversight of lab safety policies and procedures, management of employee injuries and exposures, regular safety audits, staff education, and chemical hygiene.
The vacancy rate for the laboratory safety department is Figure 3). The staff (nonsupervisor) vacancy rate
(Figures 4 and 5). Survey respondents from the laboratory safety department indicated that they anticipate a 7.0% re-
Figures 6-8).
The rate of anticipated positions by December 2012 for the laboratory safety department is 3.0%. The rate of
and nonexistent for supervisors (0%) (Figures 11 and 12). Overall, 3.0% of positions remain open in the laboratory
Figure 10).

e14 Lab Medicine Winter 2013 | Volume 44, Number 1 www.labmedicine.com
Vacancy Survey
The rate of open positions that remained open for longer
(Figures 13 and 14).
Respondents from the laboratory safety department
medical technologist (MT), and medical laboratory technician (MLT) certifications when hiring staff-level
are the certifications of choice, 51.3% of the respondents from this department indicated that certification is not a prerequisite for candidates for hire. Survey results show that 79.0% of staff and 100% of supervisors are certified (Figures 15 and 16). The Far West region has the highest vacancy rate (8.0%) and the Central North East has the lowest (0%).
MicrobiologyThe total vacancy rate for microbiology is 5.0% (Figure 3). The staff (nonsupervisor) vacancy rate is 5.0% and the supervisor vacancy rate is 2.0% (Figures 4 and 5). Results also reveal that 9.0% of microbiology-department employees are expected to retire in the next
9.0%; for supervisors, it is 10.0% (Figures 6-8).
According to the survey, the rate of anticipated positions by December 2012 in microbiology is 3.0%. The rate of positions anticipated to open during that time is lower
Figures 11 and 12). Results also show that 3.0% of the vacant positions that remained open in the microbiology
Figure 10). The rate of open positions that remained open for longer
(Figures 13 and 14).
When hiring staff-level (nonsupervisor) employees in the microbiology department, most respondents report
(MT), medical laboratory technician (MLT), technologist in microbiology (M), or specialist in microbiology (SM) as the preferred credential or certification. Also,
is a prerequisite for candidates for hire. Survey results show that 83.0% of staff and 90.0% of supervisors in the microbiology department are certified (Figures 15 and 16). The vacancy rate is highest in the Far West and Central North East regions (5.0% each) and lowest in the Central North West (1.0%) (Table 2).
Molecular Biology/Diagnostics
department is 5.0% (Figure 3). The vacancy rate for staff
(Figures 4 and 5). Survey respondents from the molecular
Staff (nonsupervisors) members have a retirement rate of
Figures 6-8).
Compared with other departments in the survey, molecular
(8.0%) of open positions anticipated by December 2012 (Figure 9). Vacancies expected during that time for staff are also the highest among all departments, at 10.0%, but very low for supervisors, at 1.0% (Figures 11 and 12). This department also has the highest rate of overall and staff
5.0% each. The rate of supervisory positions that remained open is 1.0% (Figures 10, 13, and 14).
diagnostics department prefer to hire employees with
of the respondents from this department indicated that certification is not a prerequisite for candidates for hire. Survey results show that 77.0% of staff and 80.0%
department are certified (Figures 15 and 16). The Central South West has the highest vacancy rate, at 8.0%, and the Central North West has the lowest vacancy rate, at 3.0% (Table 2).
PhlebotomyThe vacancy rate for the phlebotomy department is 8.0% (Figure 3). This department also has the highest staff (nonsupervisor) vacancy rate, at 8.0%, of all the departments surveyed. The supervisor vacancy rate is 3.0% (Figures 4 and 5employees in phlebotomy are anticipated to retire in the
3.0%; the rate for supervisors is 5.0% (Figures 6-8).
highest rate of positions expected to open by December 2012, at 8.0% (Figure 9). Expected vacancies during that time for staff are also the higher among all departments, at

www.labmedicine.com Winter 2013 | Volume 44, Number 1 Lab Medicine e15
Vacancy Survey
Figures 11 and 12).
months (Figure 10). The rate of open positions that remain
for supervisors (Figures 13 and 14).
The certifications of choice for new staff-level employees in the phlebotomy department are clinical laboratory assistant (CLA), medical laboratory technician (MLT), and phlebotomy technician (PBT). Respondents also reported hiring noncertified staff to work in the phlebotomy
indicated that certification is not a prerequisite for candidates for hire. Results show that 50.0% of staff and 85.0% of supervisors in the phlebotomy department are certified (Figures 15 and 16). The North East region has the highest vacancy rate (10.0%) and the Far West and Central North East have the lowest (5.0% each) (Table 2).
Specimen ProcessingThe vacancy rate for the specimen processing department is 5.0% (Figure 3). The staff (nonsupervisor) vacancy
Figures 4 and 5). Survey results show that 5.0% of personnel in specimen
The staff (nonsupervisor) retirement rate is 5.0%; for supervisors, it is 8.0% (Figures 6-8).
The overall percentage of positions anticipated by December 2012 for specimen processing is 7.0% (Figure 9). The rate of vacancies expected during that time for staff is 8.0%; for supervisors, it is 2.0% (Figures 11 and 12).
months (Figure 10). The rate of open positions that remain
supervisors (Figures 13 and 14).
Respondents from the specimen processing department prefer clinical laboratory assistant (CLA), medical
medical laboratory technician (MLT) and phlebotomy technician (PBT) certifications when hiring staff-level employees. Noncertified staff was also hired to perform specimen processing in this department. In fact, 81.5% of the survey participants indicated that certification is not a prerequisite for candidates for hire. Survey results show that 50.0% of staff and 88.0% of supervisors in the
specimen processing department are certified (Figures 15 and 16). The North East region has the highest vacancy rate (9.0%) and the Far West and South Central Atlantic have the lowest vacancy rates (5.0% each) (Table 2).
AdministrationMany facilities have 1 or more full- or part-time positions devoted to laboratory administration. Although the specific responsibilities for these positions vary greatly by institution, they generally require clinical-laboratory technical expertise and are therefore staffed with trained laboratory professionals. The vacancy rate for the
Figure 3). The vacancy rate for staff (nonsupervisors) is 5.0%; for supervisors, it
Figures 4 and 5). Results also reveal that 8.0% of administration-department employees are expected to
Figures 6-8).
According to survey results, the rate of anticipated open positions by December 2012 in the administration department is 2.0% (Figure 9). The percentage of positions anticipated to open during that time is lower for
Figures 11 and 12). The rate of administration vacancies that remain open
Figure 10). The rates for staff and supervisor positions that remain open for
Figures 13 and 14).
When hiring staff-level employees in the administration department, most respondents report medical laboratory
credential or certification. Also, 51.1% of supervisors indicated that certification is a prerequisite for candidates
93.0% of supervisors are certified (Figures 15 and 16). The vacancy rate is highest in the North East region (8.0%) and lowest in the Central North West (1.0%) (Table 2).
The Current Laboratory WorkforceCompared with those of ASCP’s 2010 Vacancy survey, this year’s results reveal decreased overall vacancy rates for
histology, immunology, and microbiology departments. Data also show a slight decrease in staff (nonsupervisor) and supervisor vacancy rates by department except for the cytology department, whose staff vacancy rate has doubled since 2010. Overall, the rate of certified laboratory
e16 Lab Medicine Winter 2013 | Volume 44, Number 1 www.labmedicine.com
Vacancy Survey
and histology departments reported a slight decrease in the rate of certified staff; the number of certified staff and supervisors decreased this year for microbiology compared with the most recent Vacancy Survey.
This year, the Vacancy Survey asked about the total
due to the retirement of personnel. Results show that the projected retirement rate for supervisors is higher than that for staff (Figures 7 and 8). In comparing the anticipated rate of vacancies by December 2012 among all the departments surveyed, staff rates are generally higher than supervisory rates (Figures 11 and 12). The rate of staff positions that take longer to fill (ie, those that
the corresponding supervisor positions is highest for blood banks. The cytology department has the lowest rate of
The 2010 ASCP Vacancy Survey report showed that overall, the most difficult work shift to fill was the night shift. In addition to challenges in staffing the night shift, the previous report had also pointed out that the immunology and phlebotomy departments also had difficulties in hiring for the day shift. This year’s survey results, however, reveal
that overall, laboratory departments are not experiencing difficulties in hiring staff for any work-shift. At the staff level, most laboratories filled most positions within 3 months of posting (Figure 17). Supervisor positions were
Figure 18).
The rise of new technologies in the field of laboratory medicine prompted ASCP to ask whether this has affected staffing in laboratories. Approximately 72.8% of participants indicated that new technologies have not caused changes to their staffing needs. Those who are affected by new laboratory technologies, however, reported that although new technologies potentially decreased the need for as large a staff, the number of tests and the workload have increased. Some of the new technologies mentioned were molecular testing, automation, flow cytometry, genetic testing, and
SummaryThis year, the ASCP Vacancy Survey included information on 7 new departments (administration, core laboratory,

www.labmedicine.com Winter 2013 | Volume 44, Number 1 Lab Medicine e17
Vacancy Survey
histocompatibility) in addition to the 10 laboratory areas surveyed in 2010. Vacancy rates are at least 2% lower for staff (nonsupervisor) and supervisor positions this year, compared with 2 years ago. The economy, the aging workforce, innovations in science and technology, and laboratory program closures appear to be contributing factors in the current status of the laboratory workforce.
The current state of the economy poses a challenge in the clinical laboratory field. The ease in staffing observed regardless of work shift suggests that laboratorians are accepting shifts that used to be difficult to fill to provide additional income or that facilities are asking their employees to work additional shifts to cut costs.
staff suggest that managers tend to be older compared with the staff they oversee. Further, the current Vacancy Survey results indicate that there is a higher rate of anticipated vacancies by December 2012 for staff compared with supervisors. The assumption has been that retirement among Baby Boomers will lead to an increase in vacancies for younger workers; however, this has not happened yet due to variations in the labor market. A report published by the Robert Wood Johnson Foundation1 stated that the economic downturn has “created pressure on healthcare professionals to revise
their career and retirement plans.” Even with a current unemployment rate of 7.7% as of November 2012,2 the lowest it has been since 2009, it appears that many laboratory professionals nearing retirement age now tend to stay longer in their employed positions due to economic uncertainties.3
The growing demand for medical care due to an aging population is driving the fast-paced advances in medical technology and the explosion of higher laboratory test volume (data results show that the highest percentage
Laboratory Departments
Per
cent
age
0102030405060708090
100
Imm
unology
Labora
tory
Saf
ety
Micr
obiolo
gy
Admin
istra
tion
Anatom
ic Pat
hology
Blood B
ank
Hemat
ology/
Coagulat
ion
Chemist
ry/T
oxicolo
gy
Core L
ab
Cytogen
etics
Histolo
gy
Molec
ular B
iolo
gy/Diag
nostics
Specim
en P
roce
ssin
g
Phleboto
my
Cytolo
gy
<3 months3 to 6 months6 months to a year>1 year
Figure 18
Time to fill empty supervisory positions.
05
10152025
100,001 to1,000,000
tests
33%29%
25%
12%
1%
10,001 to100,000
tests
More than1,000,000
tests
Annual Laboratory Testing Volume
Per
cen
tag
e
1 to10,000tests
0tests
3035
Figure 19
Overall annual laboratory testing volume.

e18 Lab Medicine Winter 2013 | Volume 44, Number 1 www.labmedicine.com
Vacancy Survey
of laboratories across the nation have an annual testing volume of 100,001 to 1 million tests) (Figure 19). Although these factors may redefine the workforce skills necessary to meet the demands of the laboratory of tomorrow, they have not reduced the need for qualified laboratory professionals. Many of this year’s survey respondents indicated that program closures and limited programs available in colleges and universities have led to difficulty in finding qualified laboratorians.
Lack of laboratory expertise in new graduates, lack of recognition for health professionals in the field of allied health, and inferior monetary compensation compared with other health care professions appear to be contributing factors in the current shortage of well-trained and qualified laboratory personnel. Planning a systematic strategy to address these issues is needed to ensure that the profession can achieve increased visibility and yield opportunities for advancement in the future. LM
Contributors
of Science, Technology, & Policy, Washington, DC
& Policy, Washington, DC
of Certification, Chicago, IL
Reviewers
Services, MedStar Montgomery Medical Center, Olney, MD
Consultant, Joint CommissionPhyllis Walker, MS, MT(ASCP) SBB, Consultant
tory and Molecular Diagnostics, Department of
Medical Center, Omaha
References 1. Bernstein, J. Issue Brief: Impact of the Economy on Health Care.
Robert Wood Johnson Foundation Web site. http://www.rwjf.org/en/research-publications/find-rwjf-research/2009/08/impact-of-the-economy-on-health-care-.html. Accessed December 29, 2012.
2. Unemployment in November 2012. Bureau of Labor Statistics Web site. http://www.bls.gov/news.release/pdf/empsit.pdf. Accessed December 29, 2012.
3. Labor Force Statistics from the Current Population Survey. Bureau of Labor Statistics Web site. http://data.bls.gov/timeseries/LNS14000000. Accessed December 29, 2012.
Related Documents