Lyrics Matter Using Lyrics to Solve Music Information Retrieval Tasks by Abhishek Singhi A thesis presented to the University of Waterloo in fulfillment of the thesis requirement for the degree of Master of Mathematics in Computer Science Waterloo, Ontario, Canada, 2015 c Abhishek Singhi 2015 brought to you by CORE View metadata, citation and similar papers at core.ac.uk provided by University of Waterloo's Institutional Repository

Welcome message from author
This document is posted to help you gain knowledge. Please leave a comment to let me know what you think about it! Share it to your friends and learn new things together.
Transcript

Lyrics MatterUsing Lyrics to Solve Music Information Retrieval Tasks
by
Abhishek Singhi
A thesispresented to the University of Waterloo
in fulfillment of thethesis requirement for the degree of
Master of Mathematicsin
Computer Science
Waterloo, Ontario, Canada, 2015
c© Abhishek Singhi 2015
brought to you by COREView metadata, citation and similar papers at core.ac.uk
provided by University of Waterloo's Institutional Repository

I hereby declare that I am the sole author of this thesis. This is a true copy of the thesis,including any required final revisions, as accepted by my examiners.
I understand that my thesis may be made electronically available to the public.
ii

Abstract
Music Information Retrieval (MIR) research tends to focus on audio features like melodyand timbre of songs while largely ignoring lyrics. Lyrics and poetry adhere to a specificrhyme and meter structure which set them apart from prose. This structure could beexploited to obtain useful information, which can be used to solve Music InformationRetrieval tasks. In this thesis we show the usefulness of lyrics in solving MIR tasks. Forour first result, we show that the presence of lyrics has a variety of significant effectson how people perceive songs, though it is unable to significantly increase the agreementbetween Canadian and Chinese listeners about the mood of the song. We find that themood assigned to a song is dependent on whether people listen to it, read the lyrics orboth together. Our results suggests that music mood is so dependent on cultural andexperiental context to make it difficult to claim it as a true concept. We also show that wecan predict the genre of a document based on the adjective choices made by the authors.Using this approach, we show that adjectives more likely to be used in lyrics are morerhymable than those more likely to be used in poetry and are also able to successfullyseparate poetic lyricists like Bob Dylan from non-poetic lyricists like Bryan Adams. Wethen proceed to develop a hit song detection model using 31 rhyme, meter and syllablefeatures and commonly used Machine Learning algorithms (Bayesian Network and SVM).We find that our lyrics features outperform audio features at separating hits and flops.Using the same features we can also detect songs which are likely to be shazamed heavily.Since most of the Shazam Hall of Fame songs are by upcoming artists, our advice to themis to write lyrically complicated songs with lots of complicated rhymes in order to riseabove the “sonic wallpaper”, get noticed and shazamed, and become famous. We arguethat complex rhyme and meter is a detectable property of lyrics that indicates qualitysongmaking and artisanship and allows artists to become successful.
iii
Acknowledgements
I am grateful to everyone in the gym at CIF who has allowed me to work in, spottedme, helped me improve my form or taught me a new exercise. Some of my best times atWaterloo have been spent in the gym.
I would like to thank my advisor Prof Dan Brown for his guidance, encouragement andpatience. He has always been open to new ideas, providing quick and honest feedback, andhas given me the freedom to pursue them. His assistance and insight has been invaluableduring my masters. I am also thankful to my readers Prof Charlie Clarke and Prof DanielVogel for taking the time to evaluate and provide feedback on my thesis.
I am exceedingly grateful to my uncle Jeetendra Falodia for helping me have a smoothtransition from India to Canada. He has always been there for me, offering me guidanceand encouragement when needed, and in general has been a pretty cool uncle. Thank youto my friends Idhayachandhiran Ilampooranan, Rahul Deshpande, Sandeep Vridhagiri andDinesh Alapati for all the fun times we had, whether in Waterloo or during one of ourmany road trips.
iv

Dedication
Kate, thanks for making me realize that I can.
v
Table of Contents
List of Tables x
List of Figures xiii
1 Introduction 1
1.1 Lyrics and Music Mood Perception . . . . . . . . . . . . . . . . . . . . . . 2
1.2 Lyrics vs Poetry . . . . . . . . . . . . . . . . . . . . . . . . . . . . . . . . . 2
1.3 Hit Song Detection . . . . . . . . . . . . . . . . . . . . . . . . . . . . . . . 3
1.4 How To Get Shazamed? . . . . . . . . . . . . . . . . . . . . . . . . . . . . 3
1.5 Summary . . . . . . . . . . . . . . . . . . . . . . . . . . . . . . . . . . . . 4
2 Background and Related Work 5
2.1 Lyrics and Neuroscience . . . . . . . . . . . . . . . . . . . . . . . . . . . . 5
2.2 Lyrics and Music Information Retrieval . . . . . . . . . . . . . . . . . . . . 6
3 On Cultural, Textual And Experiental Aspects Of Music Mood 8
3.1 Introduction . . . . . . . . . . . . . . . . . . . . . . . . . . . . . . . . . . . 8
3.2 Related Work . . . . . . . . . . . . . . . . . . . . . . . . . . . . . . . . . . 10
3.2.1 What is Mood Detection? . . . . . . . . . . . . . . . . . . . . . . . 10
3.2.2 Methods for Detecting Mood . . . . . . . . . . . . . . . . . . . . . 10
3.2.3 Mood Tags . . . . . . . . . . . . . . . . . . . . . . . . . . . . . . . 10
vi
3.2.4 Music Mood Perception between different Cultures . . . . . . . . . 11
3.3 Method . . . . . . . . . . . . . . . . . . . . . . . . . . . . . . . . . . . . . 11
3.3.1 Data Set . . . . . . . . . . . . . . . . . . . . . . . . . . . . . . . . . 11
3.3.2 Participants . . . . . . . . . . . . . . . . . . . . . . . . . . . . . . . 13
3.3.3 Survey . . . . . . . . . . . . . . . . . . . . . . . . . . . . . . . . . . 13
3.4 Results . . . . . . . . . . . . . . . . . . . . . . . . . . . . . . . . . . . . . . 14
3.4.1 Lyrics and music mood perception between cultures . . . . . . . . . 14
3.4.2 Stability across the three kinds of experiences . . . . . . . . . . . . 16
3.4.3 “Melancholy” lyrics . . . . . . . . . . . . . . . . . . . . . . . . . . . 17
3.4.4 Genre and Mood . . . . . . . . . . . . . . . . . . . . . . . . . . . . 17
3.5 Conclusions: Does Music Mood Exist? . . . . . . . . . . . . . . . . . . . . 19
4 Are Poetry and Lyrics All That Different? 21
4.1 Introduction . . . . . . . . . . . . . . . . . . . . . . . . . . . . . . . . . . . 21
4.1.1 Definitions and Synonyms . . . . . . . . . . . . . . . . . . . . . . . 21
4.2 Related Work . . . . . . . . . . . . . . . . . . . . . . . . . . . . . . . . . . 23
4.3 Data Set . . . . . . . . . . . . . . . . . . . . . . . . . . . . . . . . . . . . . 24
4.3.1 Articles . . . . . . . . . . . . . . . . . . . . . . . . . . . . . . . . . 25
4.3.2 Lyrics . . . . . . . . . . . . . . . . . . . . . . . . . . . . . . . . . . 25
4.3.3 Poetry . . . . . . . . . . . . . . . . . . . . . . . . . . . . . . . . . . 25
4.3.4 Test Data . . . . . . . . . . . . . . . . . . . . . . . . . . . . . . . . 26
4.4 Method . . . . . . . . . . . . . . . . . . . . . . . . . . . . . . . . . . . . . 26
4.4.1 Extracting Synonyms . . . . . . . . . . . . . . . . . . . . . . . . . . 27
4.4.2 Probability Distribution . . . . . . . . . . . . . . . . . . . . . . . . 28
4.4.3 Document classification algorithm . . . . . . . . . . . . . . . . . . . 28
4.5 Results . . . . . . . . . . . . . . . . . . . . . . . . . . . . . . . . . . . . . . 29
4.5.1 Document Classification . . . . . . . . . . . . . . . . . . . . . . . . 30
4.5.2 Adjective Usage in Lyrics versus Poems . . . . . . . . . . . . . . . . 30
vii
4.5.3 Poetic vs non-Poetic Lyricists . . . . . . . . . . . . . . . . . . . . . 32
4.5.4 Concept representation in Lyrics vs Poetry . . . . . . . . . . . . . . 33
4.6 Conclusion . . . . . . . . . . . . . . . . . . . . . . . . . . . . . . . . . . . . 33
5 Can Song Lyrics Predict Hits? 36
5.1 Introduction . . . . . . . . . . . . . . . . . . . . . . . . . . . . . . . . . . . 36
5.2 Related Work . . . . . . . . . . . . . . . . . . . . . . . . . . . . . . . . . . 37
5.3 Rhymes . . . . . . . . . . . . . . . . . . . . . . . . . . . . . . . . . . . . . 39
5.3.1 Imperfect Rhymes . . . . . . . . . . . . . . . . . . . . . . . . . . . 39
5.3.2 Internal Rhymes . . . . . . . . . . . . . . . . . . . . . . . . . . . . 40
5.4 Data Definition . . . . . . . . . . . . . . . . . . . . . . . . . . . . . . . . . 41
5.5 Method . . . . . . . . . . . . . . . . . . . . . . . . . . . . . . . . . . . . . 43
5.6 Results . . . . . . . . . . . . . . . . . . . . . . . . . . . . . . . . . . . . . . 46
5.6.1 The Broadest Definition of Flop . . . . . . . . . . . . . . . . . . . . 46
5.6.2 The “Flash in a Pan” Definition of Flop . . . . . . . . . . . . . . . 50
5.6.3 The “Hit on One Chart” Definition of Flop . . . . . . . . . . . . . . 51
5.6.4 The “Not-Hit Single” Definition of Flop . . . . . . . . . . . . . . . 51
5.7 What makes a song hit? . . . . . . . . . . . . . . . . . . . . . . . . . . . . 52
5.8 Conclusion: Lyrics Complexity and Craftmanship . . . . . . . . . . . . . . 53
6 Lyrics Complexity and Shazam 54
6.1 Introduction . . . . . . . . . . . . . . . . . . . . . . . . . . . . . . . . . . . 54
6.2 Related Work . . . . . . . . . . . . . . . . . . . . . . . . . . . . . . . . . . 56
6.3 Data . . . . . . . . . . . . . . . . . . . . . . . . . . . . . . . . . . . . . . . 56
6.4 Method . . . . . . . . . . . . . . . . . . . . . . . . . . . . . . . . . . . . . 57
6.4.1 Lyrics Complexity . . . . . . . . . . . . . . . . . . . . . . . . . . . 57
6.5 Shazam Users . . . . . . . . . . . . . . . . . . . . . . . . . . . . . . . . . . 58
6.6 Results . . . . . . . . . . . . . . . . . . . . . . . . . . . . . . . . . . . . . . 58
viii

6.6.1 Separating the Shazam Hall of Fame songs from Hits using the lyricsfeatures . . . . . . . . . . . . . . . . . . . . . . . . . . . . . . . . . 59
6.6.2 Lyrics complexity and shazams . . . . . . . . . . . . . . . . . . . . 61
6.6.3 Shazam Hall of Fame and Chorus Complexity . . . . . . . . . . . . 65
6.7 Conclusion: Advice for musicians . . . . . . . . . . . . . . . . . . . . . . . 67
7 Conclusion 69
References 74
ix

List of Tables
3.1 The mood clusters used in the study. . . . . . . . . . . . . . . . . . . . . . 11
3.3 The list of names, artists and the year of release of songs which were usedin the study. . . . . . . . . . . . . . . . . . . . . . . . . . . . . . . . . . . . 13
3.4 The number of statistically-significantly similar responses between the dif-ferent cultures for the three different ways they interact with the songs.Canadians refer to Canadians of both Chinese and non-Chinese origin. . . 16
3.5 Spearman’s rank correlation coefficient between the groups. The groups“only lyrics” and “only audio” identify when participants had access to onlylyrics and audio respectively while “audio+lyrics refers to when they hadaccess to both simultaneously. . . . . . . . . . . . . . . . . . . . . . . . . . 16
3.6 The most commonly assigned mood clusters for each experimental context.Most songs are assigned to the third mood cluster when participants areshown only the lyrics. . . . . . . . . . . . . . . . . . . . . . . . . . . . . . . 17
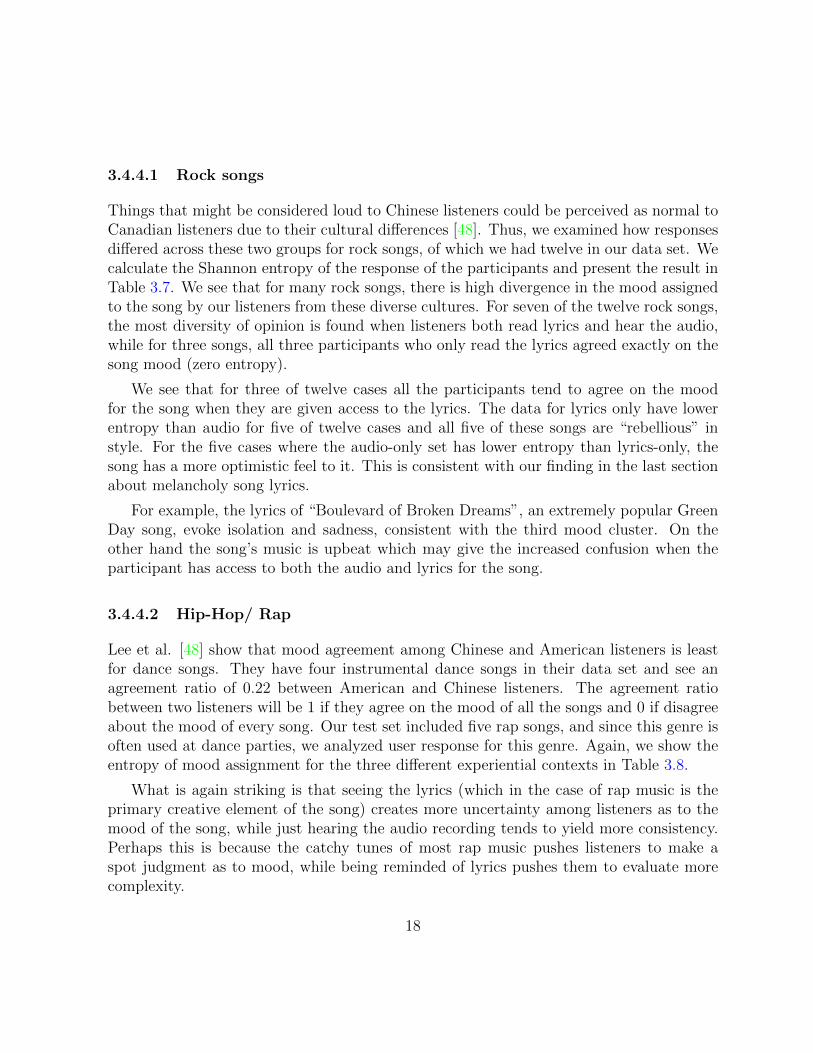
3.7 Entropy values for the mood assignment of rock songs, for the three differentcategories of interactions with a song. An entropy value of 0 indicates thateveryone agreed on the mood of the song. . . . . . . . . . . . . . . . . . . . 19
3.8 Entropy values for hip-hop/ rap songs for the three different categories foreach of the three ways people interact with a song. An entropy value of 0indicates that everyone agreed on the mood of the song. . . . . . . . . . . 19
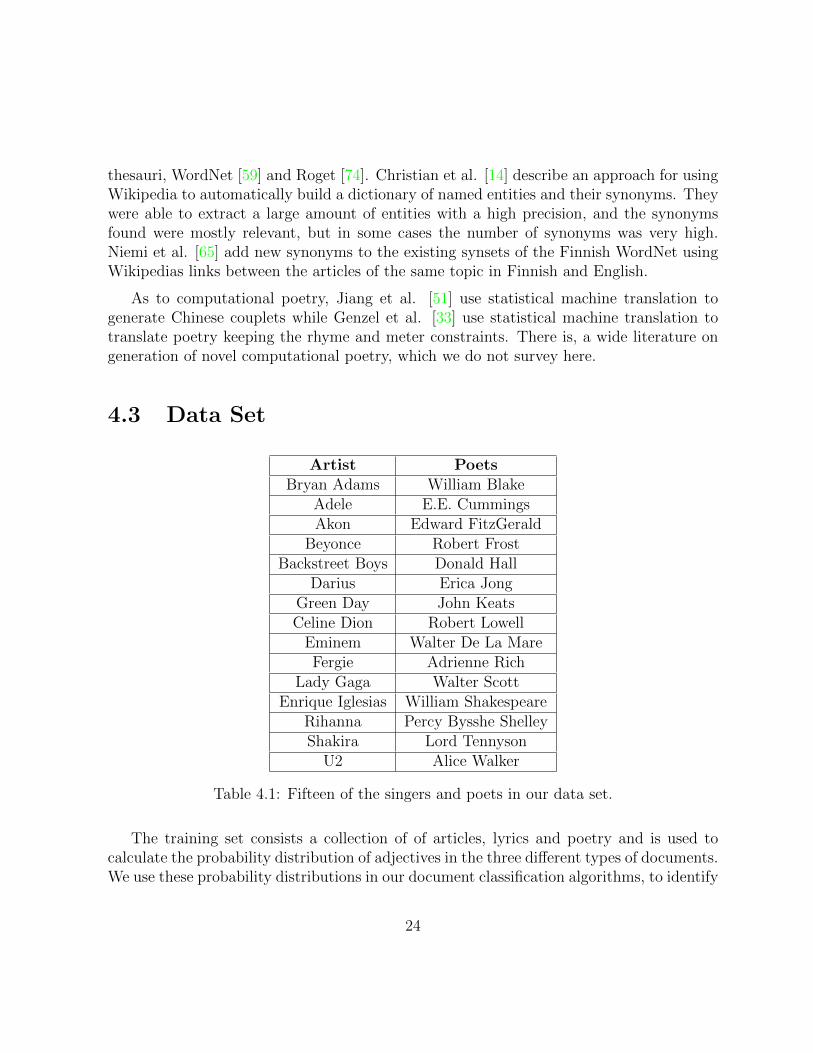
4.1 Fifteen of the singers and poets in our data set. . . . . . . . . . . . . . . . 24
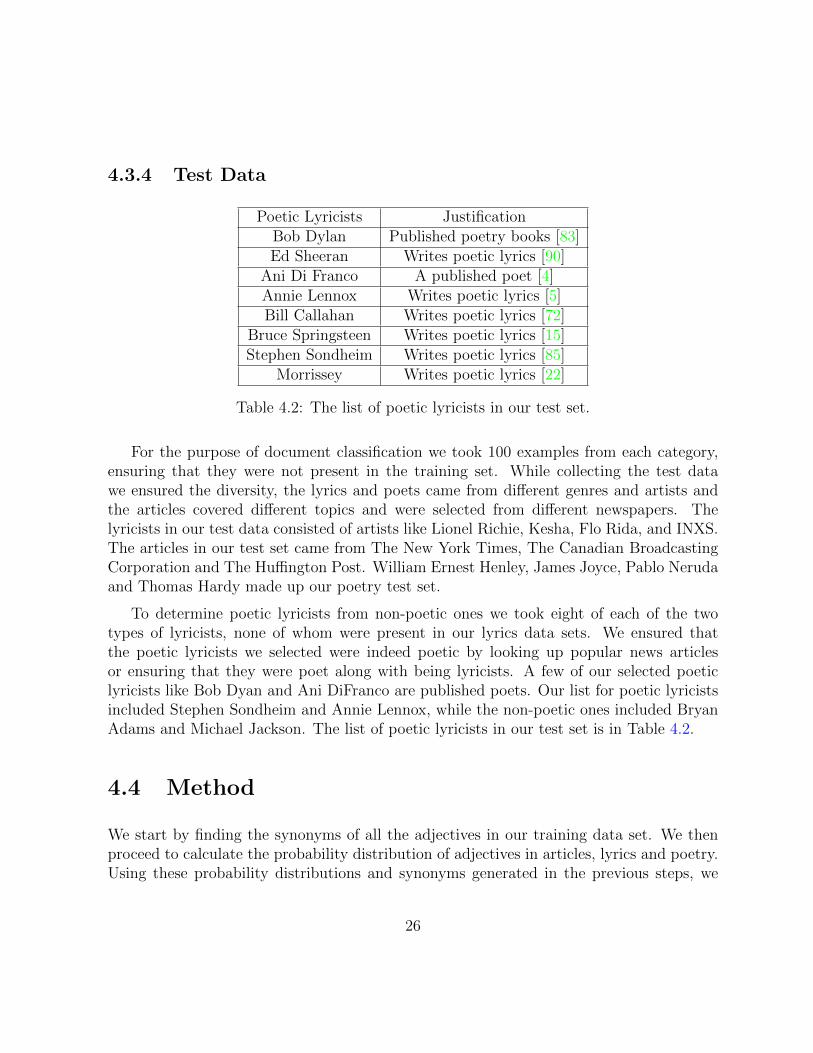
4.2 The list of poetic lyricists in our test set. . . . . . . . . . . . . . . . . . . . 26
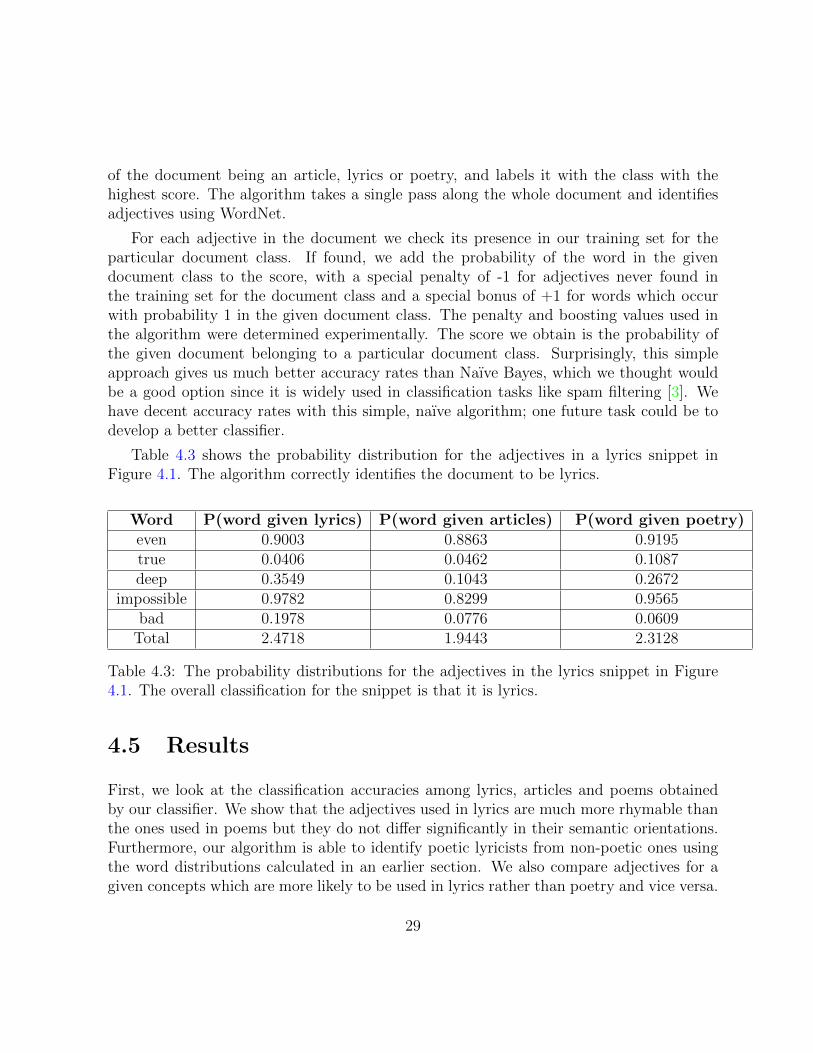
4.3 The probability distributions for the adjectives in the lyrics snippet in Figure4.1. The overall classification for the snippet is that it is lyrics. . . . . . . . 29
x
4.4 The confusion matrix for document classification. Many lyrics are catego-rized as poems, and many poems as articles. . . . . . . . . . . . . . . . . . 31
4.5 Statistical values for the number of words an adjective rhymes with. Thetwo-tailed P value is less than 0.0001. . . . . . . . . . . . . . . . . . . . . 31
4.6 Statistical values for the semantic orientation of adjectives used in lyrics andpoetry. The two-tailed P value equals 0.8072. . . . . . . . . . . . . . . . . 31
4.7 Percentage of misclassified lyrics as poetry for poetic lyricists. . . . . . . . 32
4.8 Percentage of misclassified lyrics as poetry for non-poetic lyricists. . . . . . 33
4.9 For twenty different concepts, we compare adjectives which are more likelyto be used in lyrics rather than poetry and vice versa. . . . . . . . . . . . . 34
5.1 The number of hits and flops in our data set using the four definitions of flops. 41
5.2 Fifteen of the artists in our data set. . . . . . . . . . . . . . . . . . . . . . 42
5.4 The list of lyric features used by our algorithm. Singles per rhyme is theonly feature that argues against lyrical complexity and is more relevant inChapter 6. . . . . . . . . . . . . . . . . . . . . . . . . . . . . . . . . . . . . 45
5.5 Stress pattern in different meters. . . . . . . . . . . . . . . . . . . . . . . . 46
5.6 The results we obtain using a weighted-cost SVM. The weights are chosento keep the recall close to 50%. . . . . . . . . . . . . . . . . . . . . . . . . 47
5.7 The results we obtain using a Bayesian network. . . . . . . . . . . . . . . . 47
5.8 Lyrics features outperform the audio features in discering hits from flops. . 49
5.9 Surprisingly, the naıve Bayesian network gives us better result than weighted-cost SVM when using both audio and lyrics features. . . . . . . . . . . . . 49
5.10 We see a noticable improvement in performance with lyrics longer than 50lines, which are more accurate than the shorter ones. Compare to Table 5.7 50
5.11 The most important features and their values for hit detection and thepercentage of hits and flops falling in that range. . . . . . . . . . . . . . . . 52
5.12 The outcome of our algorithm on hits in our data set using the first definitionof flops for four popular artists. . . . . . . . . . . . . . . . . . . . . . . . . 52
6.1 The number of Shazam users and the number of smartphones sold worldwide. 58
xi

6.2 The results for separating Shazam Hall of Fame songs from hits using aweighted-cost SVM . . . . . . . . . . . . . . . . . . . . . . . . . . . . . . . 59
6.3 The results for separating Shazam Hall of Fame songs from hits using aBayesian Network. The SVM does a better job at predicting hits, thoughthe Bayes Net classifier is more stringent . . . . . . . . . . . . . . . . . . . 60
6.4 The top five most lyrically-complicated Hall of Fame songs. . . . . . . . . . 65
6.5 The table lists Hall of Fame songs having the chorus as the lyrically mostcomplex and least complex part of the song. . . . . . . . . . . . . . . . . . 67
xii
List of Figures
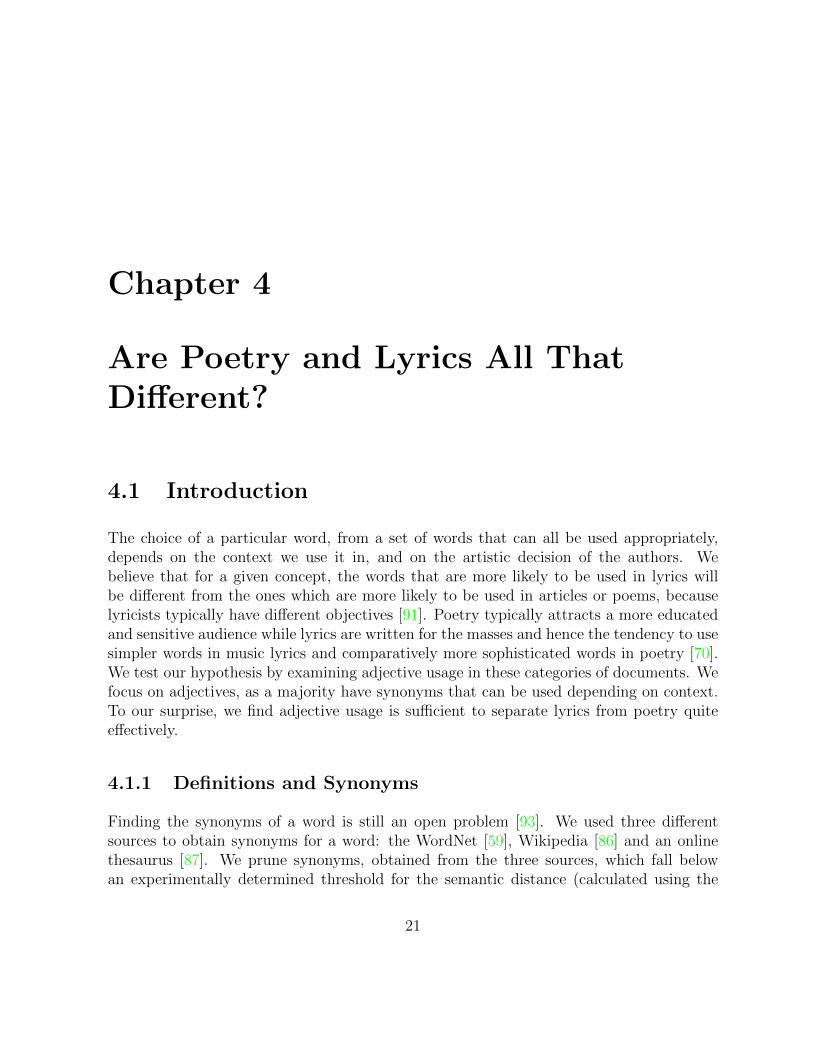
4.1 The bold-faced words are the adjectives our algorithm takes into accountwhile classifying a document, which in this case in a snippet of lyrics by theBackstreet Boys. . . . . . . . . . . . . . . . . . . . . . . . . . . . . . . . . 22
5.1 The receiver operating characteristic curve obtained when using the firstand second definition of flops respectively. The areas under the ROC curvesare 0.688 and 0.573 respectively. . . . . . . . . . . . . . . . . . . . . . . . . 48
5.2 The ROC curve obtained when using the first definition of flop and aweighted-cost SVM. The black and the red curves are obtained using thelyrics and audio features respectively. The AUC using the lyrics and audiofeatures is 0.692 and 0.572 respectively. . . . . . . . . . . . . . . . . . . . . 50
6.1 An overlapped histogram of the lyrics complexity of the hits and Hall ofFame songs. The red coloured part is the histogram for the Hall of Famesongs while the histogram for hits is coloured green. Despite having far morehits than Hall of Fame songs, the majority of songs with lyric complexitymeasure greater than 8 are from the Hall of Fame. The overlapped portionis coloured dark green. . . . . . . . . . . . . . . . . . . . . . . . . . . . . . 62
6.2 A scatter plot showing the relationship between the number of shazamsand lyrics complexity for the songs in the 2013 Billboard Year-End Hot 100singles chart (Correlation coefficient = 0.3986). The curve of best fit hasR-squared value of 0.1976. Lyrically complex songs tends to be shazamedmore. . . . . . . . . . . . . . . . . . . . . . . . . . . . . . . . . . . . . . . . 63
xiii
6.3 A scatter plot showing the relationship between the number of shazamsand lyrics complexity for the songs in the 2008 Billboard Year-End Hot100 singles chart (Correlation coefficient = -0.1757). The curve of best fithas R-squared value of 0.0564. In the early years, the relationship betweenshazams and lyric complexity is less clear. . . . . . . . . . . . . . . . . . . 64
6.4 A scatter plot showing the relationship between the number of shazams andthe 2014 Billboard Year-End Hot 100 rank for the songs which made it tothe year end chart. “Blurred Lines” was the #2 song in 2013, which explainsits outlier status for 2014. . . . . . . . . . . . . . . . . . . . . . . . . . . . 66
xiv
Chapter 1
Introduction
Music information retrieval (MIR) is the interdisciplinary science of retrieving informationfrom music, focusing on the use of audio signals, lyrics and metadata of songs. Typical MIRapplications include recommender systems, automatic music transcriptions and automaticcategorization (into mood and genre, for example). Much of the research in MIR tendsto focus on the audio signal of the music, specifically melodic or timbral features or onmeta-tagged data of songs [56]. Some MIR tasks have used text features associated withthe semantics and grammar of the words along with the audio features [45]. Lyrics featureslike rhyme and meter, that provide structure to the lyrics and separate it from prose, havelargely been ignored.
In this thesis, we show the usefulness of lyrics features in solving some important MIRtasks. Lyrics contain much of the emotional content of a typical popular song [2] and cancontribute to the memorizability of songs if they have catchy rhyme [89]. Behavioral andneuropsychological research has shown that individuals process lyrics and tune separatelywhile listening to songs [37]. We show that the presence of lyrics does influence the way asong is perceived by the listener. We also show that different genres of writing use differentadjectives for the same concept and using this observation we are able to separate lyricsfrom poetry. Using 31 rhyme, meter and syllable features we are able to separate hitsfrom flops surprisingly well. We show that lyrics features outperform audio features at hitdetection. We also find that the presence of lots of rhymes, in particular imperfect andinternal rhymes, makes it more likely that a song will end up being a hit. We also find thatthe songs in the Shazam Hall of Fame [67] are lyrically more complicated and in particularhave more complex rhymes than hits that are less shazamed.
1
1.1 Lyrics and Music Mood Perception
In Chapter 3, we present the result from a user study to determine if the presence of lyricscan help increase the agreement between Canadian and Chinese listeners about the mood ofthe song. We study the impact of the presence of lyrics on music mood perception for bothCanadian and Chinese listeners by conducting a user study of Canadians not of Chineseorigin, Chinese-Canadians, and Chinese people who have lived in Canada for fewer thanthree years. While our original hypotheses were largely connected to cultural componentsof mood perception, we also analyzed how stable mood assignments were when listenerscould read the lyrics of recent popular English songs they were hearing versus when theyonly heard the songs. We find that the mood assigned to a song is dependent on whetherpeople listen to it, read the lyrics or both together. We also showed the lyrics of some songsto participants without playing the recorded music. For example, people assign differentmoods to the same song in these three scenarios. People tend to assign a song to themood cluster that includes “melancholy” more often when they read the lyrics withoutlistening to it, and having access to the lyrics does not help reduce the difference in musicmood perception between Canadian and Chinese listeners significantly. Our results causeus to question the idea that songs have inherent mood. Rather, we suggest that the mooddepends on both cultural and experiential context.
1.2 Lyrics vs Poetry
In Chapter 4, we show that we can predict the genre of a document based on the adjectivechoices made by authors. We hypothesize that different genres of writing use differentadjectives for the same concept. We test our hypothesis on lyrics, articles and poetry. Weuse the English Wikipedia and over 13,000 news articles from four leading newspapers forthe article data set. Our lyrics data set consists of lyrics of more than 10,000 songs by 56popular English singers, and our poetry dataset is made up of more than 20,000 poems from60 famous poets. We find the probability distribution of synonymous adjectives in all thethree different categories and use it to predict if a document is an article, lyrics or poetrygiven its set of adjectives. We achieve an accuracy level of 67% for lyrics, 80% for articlesand 57% for poetry. Using this approach we show that adjectives more likely to be usedin lyrics are more rhymable than those more likely to be used in poetry, but they do notdiffer significantly in their semantic orientations, which was found using SentiWordNet [30].Furthermore we show that our algorithm is successfully able to detect “poetic” lyricists like
2

Bob Dylan, who have published books of poetry, from non-poetic ones like Bryan Adams,as the lyrics of more “poetic” lyricists are more often misclassified as poetry.
1.3 Hit Song Detection
In Chapter 5, we introduce our hit detection model. The music information retrieval taskof predicting hits is largely unsolved [68]. Previous efforts to predict whether a song willbe a hit have focused on audio features of the sound recording. We instead focus on thelyrics, which are an opportunity for songwriters to show off their artisanship, and whichcan be more easily analyzed using computer algorithms. Using 31 rhyme, syllable andmeter features, we create Bayesian network and support vector machine filters that aresurprisingly effective at separating hits from flops. We define hits as songs that made itto the Billboard Year-End Hot 100 singles chart between the years 2008 and 2013. Flopsare harder to define: they are non-hit songs that had a chance of being hits, for examplebecause of having had enough airplay to appear on a weekly chart, or by having beenreleased by a singer with many hits. Since it is difficult to agree on the definition offlops, we analyze several variant definitions. Our largest data set consists of 492 hits and6323 flops. Using cross validation, a weighted support vector machine gives us recall andprecision values of 0.492 and 0.243 respectively for the hits on our largest data set, which ismuch stronger than would be expected by random chance. Adding fourteen audio featuresgives a slight improvement, but the lyrics features are significantly much more useful thanaudio features in separating hits and flops. We argue that complex rhyme and meter is adetectable property of lyrics that indicates quality songmaking, and that it is this propertythat allows our filter to predict hit songs successfully.
1.4 How To Get Shazamed?
In Chapter 6, we present a way for upcoming artists to rise above “sonic wallpaper” andbecome successful through the route of highly-shazamed lyrically complex songs. Themusic recognition service Shazam has been used to identify more than 15 billion songs,with over 500 million users. People use Shazam to identify songs they do not know aboutin settings where they cannot see the artist and title information. Songs with over 5 millionshazams 1 are placed in the Shazam Hall of Fame [67]. We seek to identify what makes a
1In this manuscript, we use “shazam” as both noun and verb, consistent with popular usage, and wewrite it with lower case.
3
song catchy enough for users to shazam it, focusing on complexity in the rhyme and meterpattern of songs. In particular we, seek to separate songs in the Shazam Hall of Famefrom hit songs (not found in the Hall of Fame). Songs in the Shazam Hall of Fame arelyrically more complicated and in particular have more complex rhymes than hits. Usinglinear regression to predict the number of shazams, we show a model using the lyricalcomplexity as a feature better predicts the number of shazams. Additionally, we note thatmany of the songs in the Shazam Hall of Fame are by relatively unknown artists who usean early Shazam success to create visibility, and we conclude that, one way for an artist tobreak out is to write catchy complex lyrics with complicated rhymes. Songs by upcomingartists usually have the chorus as the lyrically least complex part of the song while songs byestablished artists usually have chorus as the lyrically most complex part of the song, andwe conjecture that this may relate to how the song-writing process changes as a musician’scareer progresses.
1.5 Summary
In this thesis, we show the usefulness of lyrics in solving four important Music InformationRetrieval tasks. For our first result, we show that the presence of lyrics has a variety ofsignificant effects on how people perceive songs. We then proceed to show that we canpredict the genre of a document based on the adjective choices made by the authors. Forour next result, we show that rhyme and meter features are useful in separating hits andflops and outperform the currently popularly used audio features. Using the same featureswe can also detect songs which are likely to be shazamed heavily. We argue that complexrhyme and meter is a detectable property of lyrics that indicates quality songmaking andartisanship and allows artists to become successful.
The material in this thesis is based on our previous works, both published and underreview. Chapter 3 and 4 is based on our papers which we presented at ISMIR 2014([78, 76]). The hit detection model in Chapter 5 is based on the late breaking demo wepresented at ISMIR 2014 [77] and a paper we presented in CMMR 2015 [79].
4
Chapter 2
Background and Related Work
Lyrics have widely been ignored in Music Information Retrieval research. The main focushas been on the use of low level audio features to solve MIR problems. Lee et al. [54] analyzethe topics of International Society for Music Information Retrieval, the top MIR conference,papers from 2000 to 2008. Analyzing the most commonly used title and abstract terms,they conclude that the focus of research has mainly been on audio. Lyrics does not makeit to the top-10 ranked title terms for any of the years between 2000 and 2008. Downieet al. [27] analyze the first 10 years, 1999 to 2009, of International Society for MusicInformation Retrieval conference. They conclude that there was a heavy emphasis onmusic in symbolic form over audio during ISMIR’s early years but audio is now the mainfocus of MIR research.
2.1 Lyrics and Neuroscience
Lyrics, though largely ignored [54], are an integral part of a listeners musical experience andcan be useful in solving in important MIR tasks. Lyrics contain much of the emotionalcontent of a typical popular song. Anderson et al. [2], examined effects of songs withviolent lyrics on aggressive thoughts and hostile feelings. They demonstrated that collegestudents who heard a violent song felt more hostile than those who heard a similar butnonviolent song. These effects replicated across songs and song types (e.g., rock, humorous,nonhumorous). Furthermore, behavioral and neuropsychological research has shown thatindividuals process lyrics and tune separately while listening to a song. Besson et al.[9], study whether people listening to a song treat the linguistic and musical components
5
separately or integrate them within a single percept. They find that harmonic processingis not affected by the semantics of the sentence even when presented in stimuli in whichthe lyrics and the tunes are strongly intertwined. They conclude that lyrics and tunes invocal music may be integrated in memory, but they are processed independently on-linewhen the semantic and harmonic aspects are considered.
Stratton et al. [84] conducted experiments on college students to examine the relativeimpact of lyrics versus music on mood. They find that sad lyrics along with music increaseddepression and decreased positive affect, even for songs performed in an upbeat style.Furthermore, melodies paired with sad lyrics were rated as less pleasant when studentsheard the melody by itself. They conclude that lyrics appear to have greater power todirect mood change than music alone. Lennings and Warburton [55] ran an experimentwhere 194 participants heard music either with or without lyrics, and with or withouta violent music video, and were then given the chance to aggress. They find that thestrongest effect was elicited by exposure to violent lyrics, regardless of whether violentimagery accompanied the music, and regardless of various person-based characteristics.
Gueguen [34] et al. study the effect of romantic lyrics on 18 to 20 year old singlefemale participants. They were made to hear romantic lyrics or neutral ones while waitingfor the experiment to start. Five minutes later, the participant interacted with a youngmale confederate in a marketing survey. During a break, the male confederate asked theparticipant for her phone number. It was found that women previously exposed to romanticlyrics complied with the request more readily than women exposed to the neutral ones.
Lyrics contains much of the typical emotional content of a song and has a greater powerto direct mood change than music alone. Neuropsychological research has shown thatindividuals process lyrics and tune separately. Hence, lyrics form a very vital componentof any song and can be useful in solving challenging MIR tasks.
2.2 Lyrics and Music Information Retrieval
Past research has shown textual features to be better than audio features at solving cer-tain MIR tasks. Hu and Downie [46], combine audio and text features for multi modalmood classification. Out of the 18 categories, textual features significantly outperformedthe audio features in seven categories, while the audio features outperforms all textualfeatures in only one category. Dhanaraj and Logan [24], use both text and audio featuresindividually and together to predict hit songs. They learn the most prominent sounds andtopics of each song (using textual analysis), and conclude that the text features are slightly
6

more useful than the audio features; combining both of them together does not producesignificant improvements. Combining textual and audio features can be useful at times.Hu and Downie [45], evaluated the usefulness of textual features in music mood classifica-tion. They conclude that systems using both the audio and textual features outperformedsystems just using the audio features in mood classification.
Lyrics features like rhyme and meter, sets lyrics and poetry apart from prose and canbe useful in solving difficult MIR problems. Hirjee and Brown [40], came up with a methodof scoring potential rhymes using a probabilistic model based on phoneme frequencies inrap lyrics. They used this scoring to automatically identify internal and line-final rhymes issong lyrics. They conclude that their probabilistic method is superior at detecting rhymesthan the rule based methods. Hirjee and Brown [41], developed a probabilistic model ofmisheard lyrics trained on actual misheard lyrics, and develop a phoneme similarity scoringmatrix based on this model. They conclude that the probabilistic method is superior toother methods at finding the correct lyrics.
Smith et al. [80] used tf-idf weighting to find typical phrases and rhyme pairs in songlyrics. They develop an application that estimates how cliched a song is and concludethat the typical number-one hits, on average, are more cliched. They believe that songpopularity and writing quality are not necessarily connected.
Previous work on poetry has focused on poetry translation, and automatic poetry gen-eration. Genzel et al. [33] develop a system for the machine translation of poetry. Theyshow that a machine translation system can be constrained to search for translations obey-ing a particular length, meter and rhyming constraint. However, the impact on translationquality is profound and the system is too slow. Jiang and Zhou [51] generate Chinese cou-plets using statistical machine translation. The system takes the first sentence as the inputand generates the N-best list of proposed second sentences. They filter the candidates thatviolate the linguistic constraints and rank the remaining candidates using a support vectormachine.
Lyrics, compared to the audio, is currently largely ignored in the MIR research, and inthis thesis we show that it is possible to solve some traditionally difficult MIR problems likehit song detection using lyric features. We believe that lyrics analysis has the potential tosolve other challenging MIR problems like: playlist generation, song segmentation, genreand mood detection. High-level lyric features can be combined with low level audio featuresto improve the existing benchmarks of important MIR problems.
7
Chapter 3
On Cultural, Textual AndExperiental Aspects Of Music Mood
3.1 Introduction
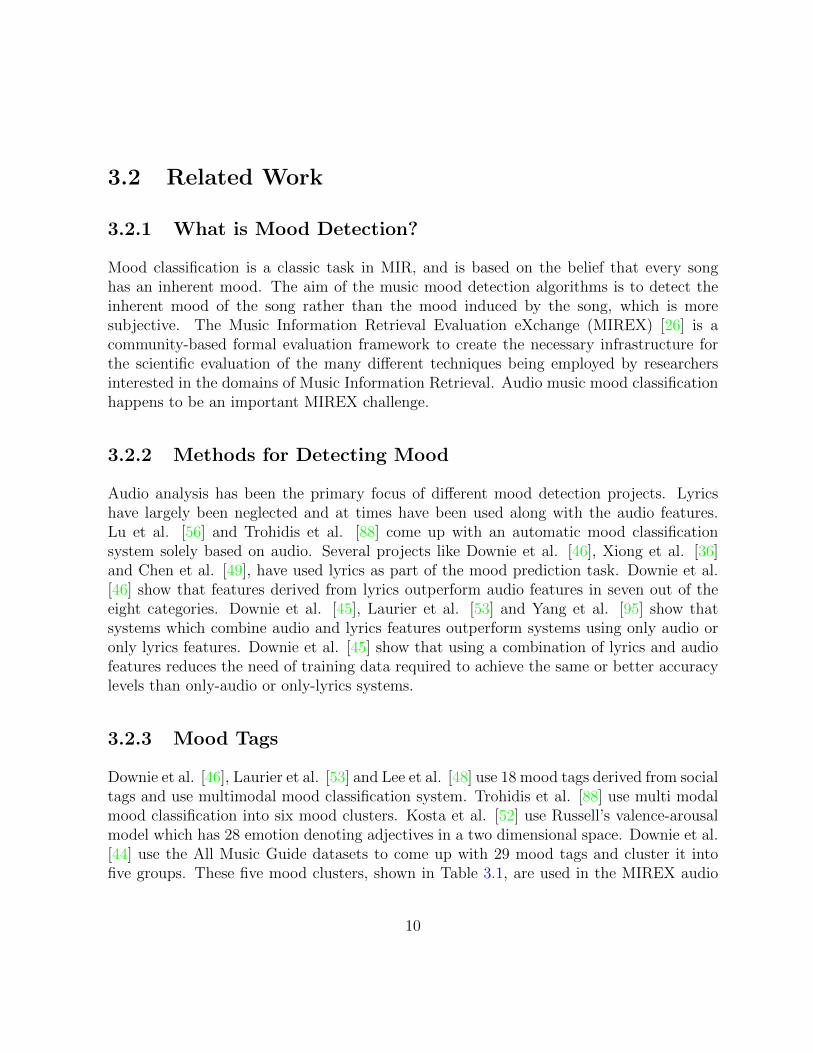
Music mood detection has been identified as an important Music Information Retrieval(MIR) task. It is based on the belief that every song has an inherent mood. It is animportant feature of music recommendation systems as mood is an important criteriabased on which people search for songs [94]. Though most automatic mood classificationsystems are solely based on the audio content of the song, some systems have used lyricsor have combined audio and lyrics features (e.g., [46, 36, 49] and [45, 53]) Previous studieshave shown that combing these features improves classification accuracy (e.g., [45, 53] and[95]) but as mentioned by Downie et al. in [46], there is no consensus on whether audio orlyrical features are more useful.
Implicit in mood identification is the belief that songs have inherent mood, but inpractice this assignment is unstable. Recent work has focused on associating songs withmore than one mood label, where similar mood tags are generally grouped together intothe same label (e.g.,[88]), but this still tends to be in a stable listening environment.
Our focus is instead on the cultural and experiential context in which people interactwith a work of music. People’s cultural origin may affect their response to a work of art, asmay their previous exposure to a song, their perception of its genre, or the role that a songor similar songs has had in their life experiences. We focus on people’s cultural origin, andon how they interact with songs (for example, seeing the lyrics sheet or not). Listening to
8
songs while reading lyrics is a common activity: for example, there are lyrics videos (whichonly show lyrics text) on YouTube with hundreds of millions of views (e.g. Green Day’s“Boulevard of Broken Dreams”) [66], and CD liner notes often include the text of lyrics[12]. Our core hypothesis is that there is enough plasticity in assigning moods to songs,based on context, to argue that many songs have no inherent mood.
Past studies have shown that there exist differences in music mood perception amongChinese and American listeners (e.g., [48]). We surmised that some of this difference inmood perception is due to weak English language skills of Chinese listeners: perhaps suchlisteners are unable to grasp the wording in the audio. We expected that they might moreconsistently match the assignments of native English-speaking Canadians when shown thelyrics to songs they are hearing than in their absence. We addressed the cultural hypothesisby exploring Canadians of Chinese origin, most of whom speak English natively but havebeen raised in households that are at least somewhat culturally Chinese. If such Chinese-Canadians match Canadians not of Chinese origin in their assignments of moods to songs,this might at least somewhat argue against the supposition that being Chinese culturallyhad an effect on mood assignment, and would support our belief that linguistic skillsaccount for at least some of the differences. Our campus has many Chinese and Chinese-Canadians, which also facilitated our decision to focus on these communities.
In this study we use the same five mood clusters as are used in the MIREX audio moodclassification task and ask the survey participants to assign a song to only one mood cluster.A multimodal mood classification could be a possible extension to our work here. Some inMIR work [52] had used Russell’s valence-arousal model, where the mood is determined bythe valence and arousal scores of the song; we use the simpler 5-group classification here.
In practice, our hypotheses about language expertise were not upheld by our exper-imental data. Rather, our data support the claim that both cultural background andexperiential context have significant impact on the mood assigned by listeners to songs,and this effect makes us question the meaningfulness of mood as a category in MIR.
This work was published at ISMIR 2014 [78], and this chapter quotes extensively fromthat publication.
9
3.2 Related Work
3.2.1 What is Mood Detection?
Mood classification is a classic task in MIR, and is based on the belief that every songhas an inherent mood. The aim of the music mood detection algorithms is to detect theinherent mood of the song rather than the mood induced by the song, which is moresubjective. The Music Information Retrieval Evaluation eXchange (MIREX) [26] is acommunity-based formal evaluation framework to create the necessary infrastructure forthe scientific evaluation of the many different techniques being employed by researchersinterested in the domains of Music Information Retrieval. Audio music mood classificationhappens to be an important MIREX challenge.
3.2.2 Methods for Detecting Mood
Audio analysis has been the primary focus of different mood detection projects. Lyricshave largely been neglected and at times have been used along with the audio features.Lu et al. [56] and Trohidis et al. [88] come up with an automatic mood classificationsystem solely based on audio. Several projects like Downie et al. [46], Xiong et al. [36]and Chen et al. [49], have used lyrics as part of the mood prediction task. Downie et al.[46] show that features derived from lyrics outperform audio features in seven out of theeight categories. Downie et al. [45], Laurier et al. [53] and Yang et al. [95] show thatsystems which combine audio and lyrics features outperform systems using only audio oronly lyrics features. Downie et al. [45] show that using a combination of lyrics and audiofeatures reduces the need of training data required to achieve the same or better accuracylevels than only-audio or only-lyrics systems.
3.2.3 Mood Tags
Downie et al. [46], Laurier et al. [53] and Lee et al. [48] use 18 mood tags derived from socialtags and use multimodal mood classification system. Trohidis et al. [88] use multi modalmood classification into six mood clusters. Kosta et al. [52] use Russell’s valence-arousalmodel which has 28 emotion denoting adjectives in a two dimensional space. Downie et al.[44] use the All Music Guide datasets to come up with 29 mood tags and cluster it intofive groups. These five mood clusters, shown in Table 3.1, are used in the MIREX audio
10
music mood classification task. We use these clusters, where each song is assigned a singlemood cluster.
3.2.4 Music Mood Perception between different Cultures
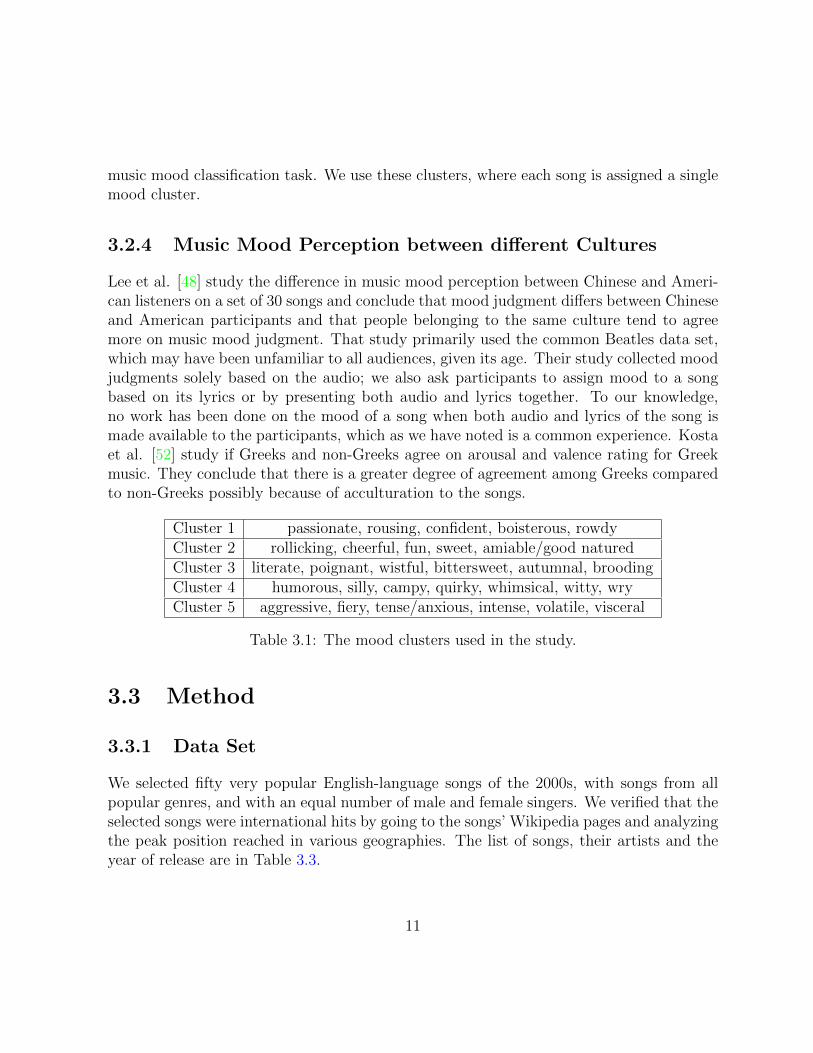
Lee et al. [48] study the difference in music mood perception between Chinese and Ameri-can listeners on a set of 30 songs and conclude that mood judgment differs between Chineseand American participants and that people belonging to the same culture tend to agreemore on music mood judgment. That study primarily used the common Beatles data set,which may have been unfamiliar to all audiences, given its age. Their study collected moodjudgments solely based on the audio; we also ask participants to assign mood to a songbased on its lyrics or by presenting both audio and lyrics together. To our knowledge,no work has been done on the mood of a song when both audio and lyrics of the song ismade available to the participants, which as we have noted is a common experience. Kostaet al. [52] study if Greeks and non-Greeks agree on arousal and valence rating for Greekmusic. They conclude that there is a greater degree of agreement among Greeks comparedto non-Greeks possibly because of acculturation to the songs.
Cluster 1 passionate, rousing, confident, boisterous, rowdyCluster 2 rollicking, cheerful, fun, sweet, amiable/good naturedCluster 3 literate, poignant, wistful, bittersweet, autumnal, broodingCluster 4 humorous, silly, campy, quirky, whimsical, witty, wryCluster 5 aggressive, fiery, tense/anxious, intense, volatile, visceral
Table 3.1: The mood clusters used in the study.
3.3 Method
3.3.1 Data Set
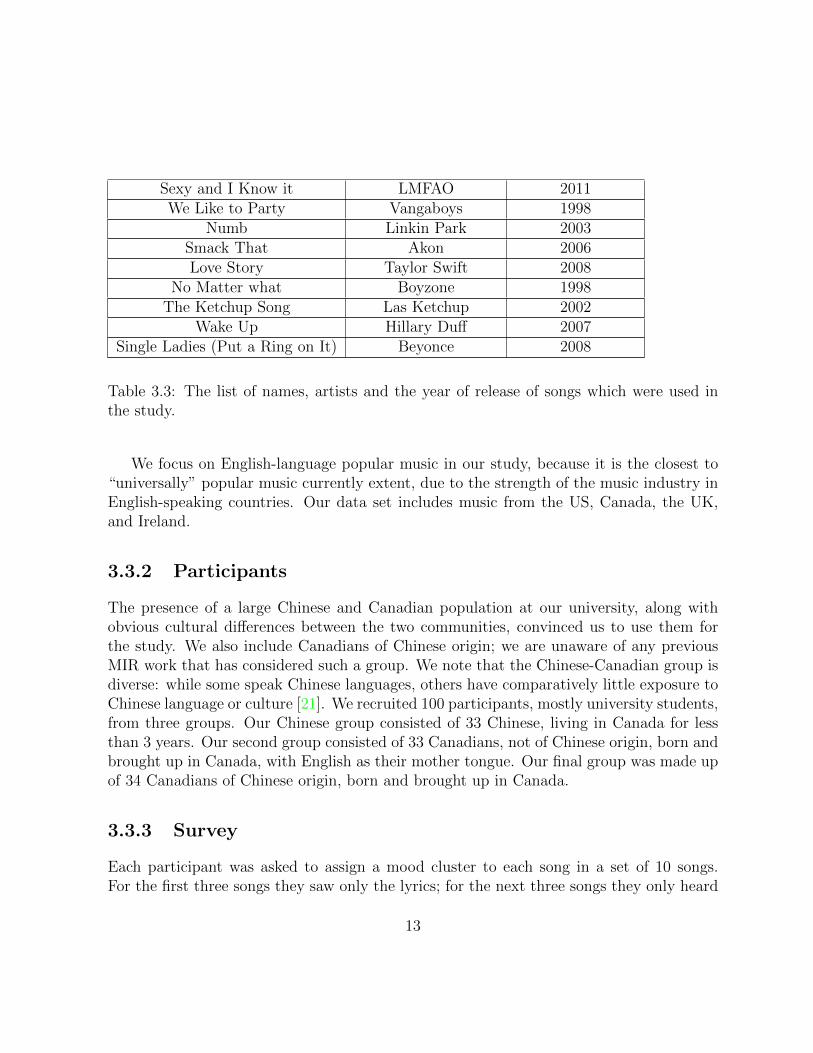
We selected fifty very popular English-language songs of the 2000s, with songs from allpopular genres, and with an equal number of male and female singers. We verified that theselected songs were international hits by going to the songs’ Wikipedia pages and analyzingthe peak position reached in various geographies. The list of songs, their artists and theyear of release are in Table 3.3.
11

Song Artist Year of ReleaseUmbrella Rihanna 2007
American Indiot Green Day 2004Beautiful Day U2 2000
Oops I did it Again Britney Spears 2000Party in the USA Miley Cyrus 2010
Pocketful of Sunshine Natasha Bedingfield 2010Hips Don’t Lie Shakira 2005
Hero Enrique Iglesias 2001In the End Linkin Park 2000
It’s not Over Daughtry 2006You’re Beautiful James Blunt 2004
Maria Maria Santana 2000Human The Killers 2008
We Belong Together Mariah Carey 2005Bad Day Daniel Powter 2005
London Bridge Fergie 2006Bleeding Love Leona Lewis 2007Viva La Vida Coldplay 2008
Disturbia Rihanna 2007Womanizer Britney Spears 2008
When I’m Gone Eminem 2005Whenever Wherever Shakira 2001
Yellow Coldplay 2000Bubbly Colbie Caillat 2007
Complicated Avril Lavigne 2002Apologize One Republic 2007
You Sang to me Marc Anthony 2000It’s My Life Bon Jovi 2000
Boulevard of Broken Dreams Green Day 2004Poker Face Lady Gaga 2008
Feel Robbie Williams 2002Rolling in the Deep Adele 2011
Irreplaceable Beyonce 2006Don’t Phunk with my Heart The Black Eyed Peas 2005
Stars are Blind Paris Hilton 2006
12
Sexy and I Know it LMFAO 2011We Like to Party Vangaboys 1998
Numb Linkin Park 2003Smack That Akon 2006Love Story Taylor Swift 2008
No Matter what Boyzone 1998The Ketchup Song Las Ketchup 2002
Wake Up Hillary Duff 2007Single Ladies (Put a Ring on It) Beyonce 2008
Table 3.3: The list of names, artists and the year of release of songs which were used inthe study.
We focus on English-language popular music in our study, because it is the closest to“universally” popular music currently extent, due to the strength of the music industry inEnglish-speaking countries. Our data set includes music from the US, Canada, the UK,and Ireland.
3.3.2 Participants
The presence of a large Chinese and Canadian population at our university, along withobvious cultural differences between the two communities, convinced us to use them forthe study. We also include Canadians of Chinese origin; we are unaware of any previousMIR work that has considered such a group. We note that the Chinese-Canadian group isdiverse: while some speak Chinese languages, others have comparatively little exposure toChinese language or culture [21]. We recruited 100 participants, mostly university students,from three groups. Our Chinese group consisted of 33 Chinese, living in Canada for lessthan 3 years. Our second group consisted of 33 Canadians, not of Chinese origin, born andbrought up in Canada, with English as their mother tongue. Our final group was made upof 34 Canadians of Chinese origin, born and brought up in Canada.
3.3.3 Survey
Each participant was asked to assign a mood cluster to each song in a set of 10 songs.For the first three songs they saw only the lyrics; for the next three songs they only heard
13

the first 90 seconds of the audio; and for the last four songs they had access to both thelyrics and the first 90 seconds of the audio simultaneously. They assigned each song toone of the five mood clusters shown in Table 3.1. We collected 1000 music mood responsesfor 50 songs, 300 each based solely either on audio or lyrics and 400 based on both audioand lyrics together. We note that due to their high popularity, some songs shown only vialyrics may have been known to some participants. We did not ask participants if this wasthe case.
3.4 Results
We hypothesized that the difference in music mood perception between American andChinese listeners demonstrated by Hu and Lee [48] is because of the weak spoken Englishlanguage skills of Chinese students, and that this might give them some difficulty in un-derstand the wording of songs; this is why we allowed our participants to see the lyrics forseven out of ten songs. Hence, we had hypothesized before our study that Chinese-bornChinese will more consistently match Canadians when they are shown the lyrics to songs,and Chinese-born Chinese listeners will have less consistency in their assignment of moodsto songs than do Canadian-born non-Chinese when given only the recording of a song.Furthermore, we believed that just reading the lyrics will be more helpful in matchingCanadians than just hearing the music for Chinese-born Canadians. We believed thatCanadian-born Chinese participants will be indistinguishable from Canadian-born non-Chinese participants sice they have similar English Language skills. We also believed moodto be dependent on experiental context and had hypothesized that people often assign dif-ferent mood to the same song depending on whether they read the lyrics, or listen the audioor both simultaneously. Finally, since music mood is heavily dependent on experiental andcultural context we believed that a song does not have an inherent mood: its “mood”depends on the way it is perceived by the listener, which is often listener-dependent.
3.4.1 Lyrics and music mood perception between cultures
Hu and Lee [48] had shown that there exists difference in music mood perception betweenAmerican and Chinese listeners. Hence, we started this study with the hypothesis thatdifference in music mood perception between Chinese and Canadian cultures is partlycaused by English language skills, since the spoken English-language skill of Chinese peopleare weaker than that of Canadians, and that if participants are asked to assign mood to
14
a song based on its lyrics, we will see much more similarity in judgment between the twodifferent groups.
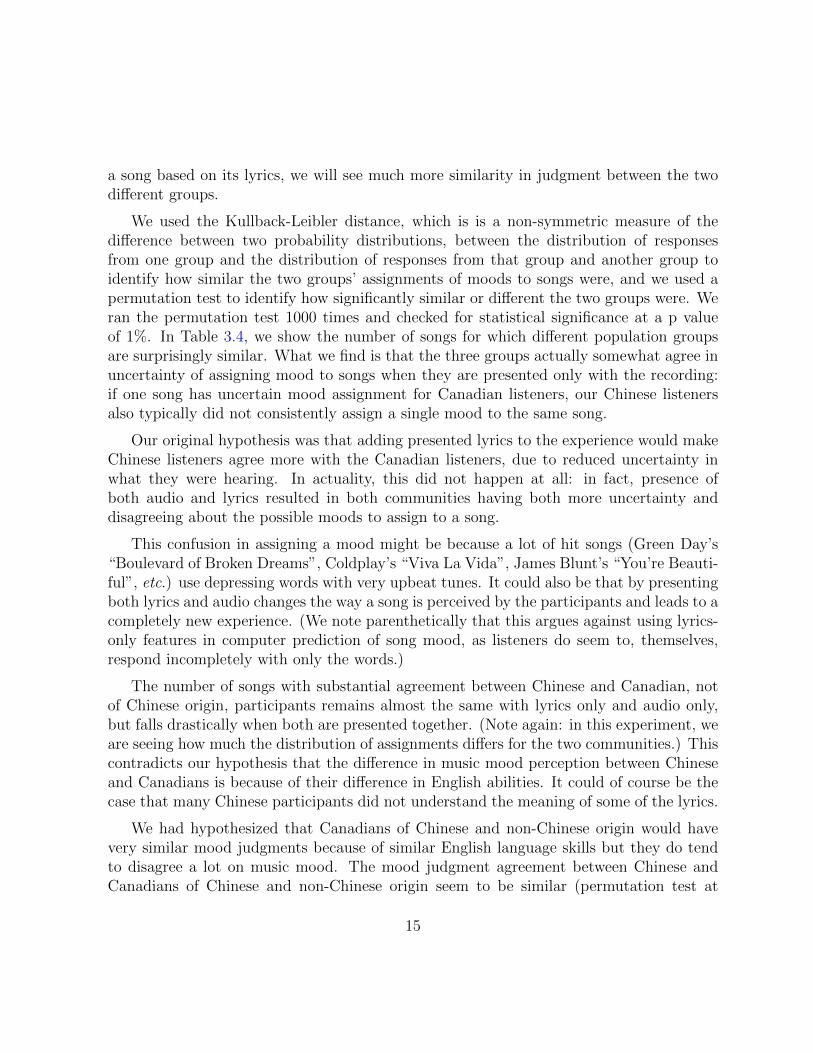
We used the Kullback-Leibler distance, which is is a non-symmetric measure of thedifference between two probability distributions, between the distribution of responsesfrom one group and the distribution of responses from that group and another group toidentify how similar the two groups’ assignments of moods to songs were, and we used apermutation test to identify how significantly similar or different the two groups were. Weran the permutation test 1000 times and checked for statistical significance at a p valueof 1%. In Table 3.4, we show the number of songs for which different population groupsare surprisingly similar. What we find is that the three groups actually somewhat agree inuncertainty of assigning mood to songs when they are presented only with the recording:if one song has uncertain mood assignment for Canadian listeners, our Chinese listenersalso typically did not consistently assign a single mood to the same song.
Our original hypothesis was that adding presented lyrics to the experience would makeChinese listeners agree more with the Canadian listeners, due to reduced uncertainty inwhat they were hearing. In actuality, this did not happen at all: in fact, presence ofboth audio and lyrics resulted in both communities having both more uncertainty anddisagreeing about the possible moods to assign to a song.
This confusion in assigning a mood might be because a lot of hit songs (Green Day’s“Boulevard of Broken Dreams”, Coldplay’s “Viva La Vida”, James Blunt’s “You’re Beauti-ful”, etc.) use depressing words with very upbeat tunes. It could also be that by presentingboth lyrics and audio changes the way a song is perceived by the participants and leads to acompletely new experience. (We note parenthetically that this argues against using lyrics-only features in computer prediction of song mood, as listeners do seem to, themselves,respond incompletely with only the words.)
The number of songs with substantial agreement between Chinese and Canadian, notof Chinese origin, participants remains almost the same with lyrics only and audio only,but falls drastically when both are presented together. (Note again: in this experiment, weare seeing how much the distribution of assignments differs for the two communities.) Thiscontradicts our hypothesis that the difference in music mood perception between Chineseand Canadians is because of their difference in English abilities. It could of course be thecase that many Chinese participants did not understand the meaning of some of the lyrics.
We had hypothesized that Canadians of Chinese and non-Chinese origin would havevery similar mood judgments because of similar English language skills but they do tendto disagree a lot on music mood. The mood judgment agreement between Chinese andCanadians of Chinese and non-Chinese origin seem to be similar (permutation test at
15
p > 0.99) and we conclude that we can make no useful claims about the Chinese-Canadianparticipants in our sample.
On the whole we conclude that the presence of lyrics does not significantly increase themusic mood agreement between Chinese and Canadian participants: in fact, being able toread lyrics while listening to a recording seems to significantly decrease the music moodagreement between the groups.
lyrics audio audio+lyricsChinese Canadians 25 22 14Chinese Canadian-Chinese 36 31 27Chinese non-Chinese Canadians 31 32 23
non-Chinese Canadians Canadian-Chinese 36 29 31
Table 3.4: The number of statistically-significantly similar responses between the differentcultures for the three different ways they interact with the songs. Canadians refer toCanadians of both Chinese and non-Chinese origin.
3.4.2 Stability across the three kinds of experiences
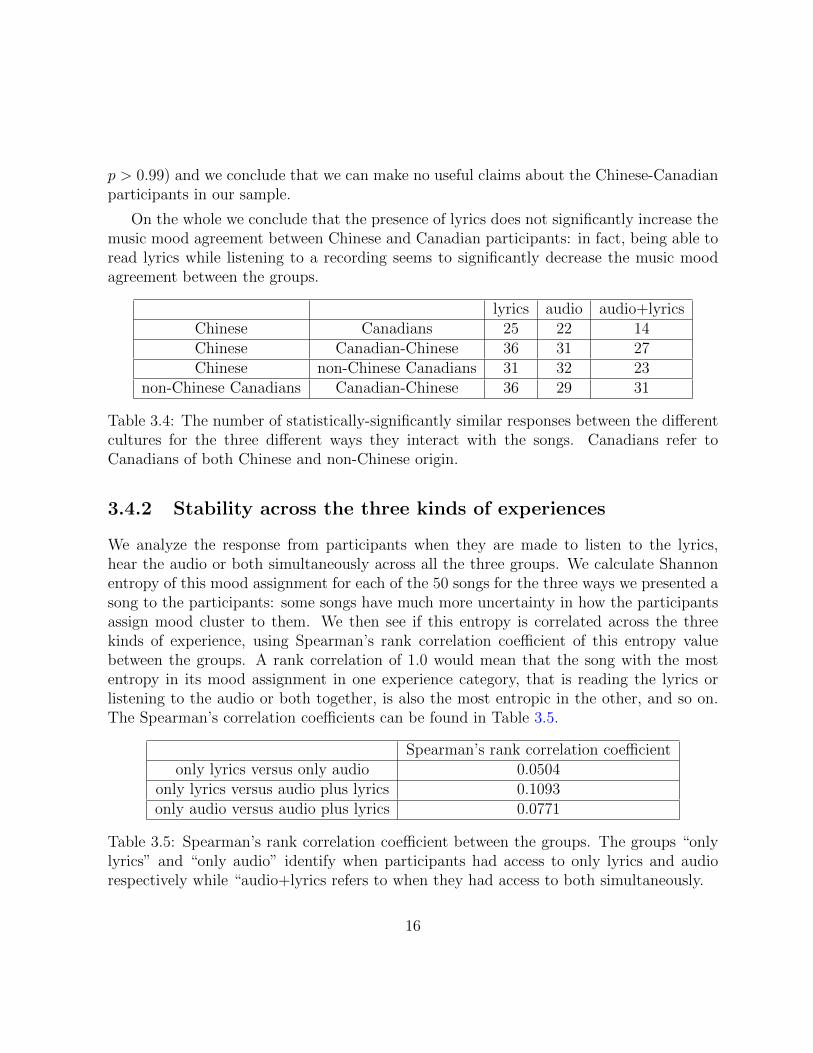
We analyze the response from participants when they are made to listen to the lyrics,hear the audio or both simultaneously across all the three groups. We calculate Shannonentropy of this mood assignment for each of the 50 songs for the three ways we presented asong to the participants: some songs have much more uncertainty in how the participantsassign mood cluster to them. We then see if this entropy is correlated across the threekinds of experience, using Spearman’s rank correlation coefficient of this entropy valuebetween the groups. A rank correlation of 1.0 would mean that the song with the mostentropy in its mood assignment in one experience category, that is reading the lyrics orlistening to the audio or both together, is also the most entropic in the other, and so on.The Spearman’s correlation coefficients can be found in Table 3.5.
Spearman’s rank correlation coefficientonly lyrics versus only audio 0.0504
only lyrics versus audio plus lyrics 0.1093only audio versus audio plus lyrics 0.0771
Table 3.5: Spearman’s rank correlation coefficient between the groups. The groups “onlylyrics” and “only audio” identify when participants had access to only lyrics and audiorespectively while “audio+lyrics refers to when they had access to both simultaneously.
16
The low value of the correlation analysis suggests that there is almost no relationshipbetween “certainty” in music mood across the three different kinds of experiences: forsongs like “Wake Up” by Hillary Duff and “Maria Maria” by Santana, listeners who onlyheard the song were consistent in their opinion that the song was from the second cluster,“cheerful”, while listeners who heard the song and read the lyrics were far more uncertainas to which class to assign the song to.
3.4.3 “Melancholy” lyrics
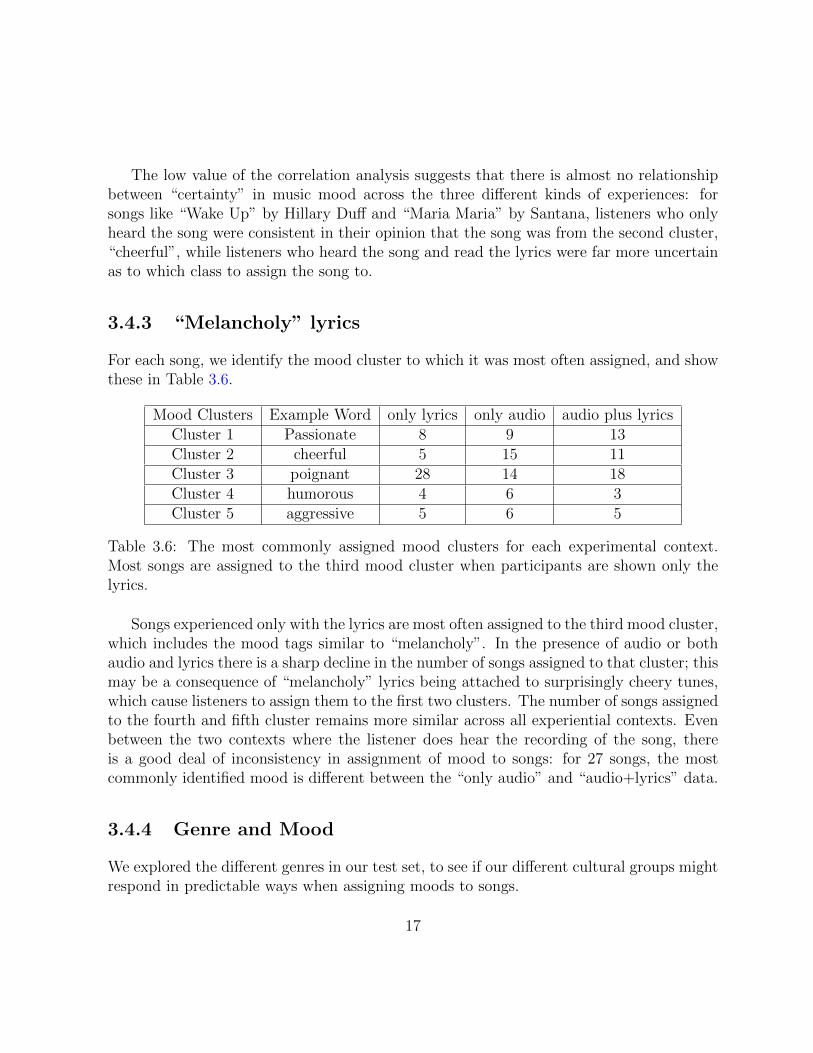
For each song, we identify the mood cluster to which it was most often assigned, and showthese in Table 3.6.
Mood Clusters Example Word only lyrics only audio audio plus lyricsCluster 1 Passionate 8 9 13Cluster 2 cheerful 5 15 11Cluster 3 poignant 28 14 18Cluster 4 humorous 4 6 3Cluster 5 aggressive 5 6 5
Table 3.6: The most commonly assigned mood clusters for each experimental context.Most songs are assigned to the third mood cluster when participants are shown only thelyrics.
Songs experienced only with the lyrics are most often assigned to the third mood cluster,which includes the mood tags similar to “melancholy”. In the presence of audio or bothaudio and lyrics there is a sharp decline in the number of songs assigned to that cluster; thismay be a consequence of “melancholy” lyrics being attached to surprisingly cheery tunes,which cause listeners to assign them to the first two clusters. The number of songs assignedto the fourth and fifth cluster remains more similar across all experiential contexts. Evenbetween the two contexts where the listener does hear the recording of the song, thereis a good deal of inconsistency in assignment of mood to songs: for 27 songs, the mostcommonly identified mood is different between the “only audio” and “audio+lyrics” data.
3.4.4 Genre and Mood
We explored the different genres in our test set, to see if our different cultural groups mightrespond in predictable ways when assigning moods to songs.
17
3.4.4.1 Rock songs
Things that might be considered loud to Chinese listeners could be perceived as normal toCanadian listeners due to their cultural differences [48]. Thus, we examined how responsesdiffered across these two groups for rock songs, of which we had twelve in our data set. Wecalculate the Shannon entropy of the response of the participants and present the result inTable 3.7. We see that for many rock songs, there is high divergence in the mood assignedto the song by our listeners from these diverse cultures. For seven of the twelve rock songs,the most diversity of opinion is found when listeners both read lyrics and hear the audio,while for three songs, all three participants who only read the lyrics agreed exactly on thesong mood (zero entropy).
We see that for three of twelve cases all the participants tend to agree on the moodfor the song when they are given access to the lyrics. The data for lyrics only have lowerentropy than audio for five of twelve cases and all five of these songs are “rebellious” instyle. For the five cases where the audio-only set has lower entropy than lyrics-only, thesong has a more optimistic feel to it. This is consistent with our finding in the last sectionabout melancholy song lyrics.
For example, the lyrics of “Boulevard of Broken Dreams”, an extremely popular GreenDay song, evoke isolation and sadness, consistent with the third mood cluster. On theother hand the song’s music is upbeat which may give the increased confusion when theparticipant has access to both the audio and lyrics for the song.
3.4.4.2 Hip-Hop/ Rap
Lee et al. [48] show that mood agreement among Chinese and American listeners is leastfor dance songs. They have four instrumental dance songs in their data set and see anagreement ratio of 0.22 between American and Chinese listeners. The agreement ratiobetween two listeners will be 1 if they agree on the mood of all the songs and 0 if disagreeabout the mood of every song. Our test set included five rap songs, and since this genre isoften used at dance parties, we analyzed user response for this genre. Again, we show theentropy of mood assignment for the three different experiential contexts in Table 3.8.
What is again striking is that seeing the lyrics (which in the case of rap music is theprimary creative element of the song) creates more uncertainty among listeners as to themood of the song, while just hearing the audio recording tends to yield more consistency.Perhaps this is because the catchy tunes of most rap music pushes listeners to make aspot judgment as to mood, while being reminded of lyrics pushes them to evaluate morecomplexity.
18
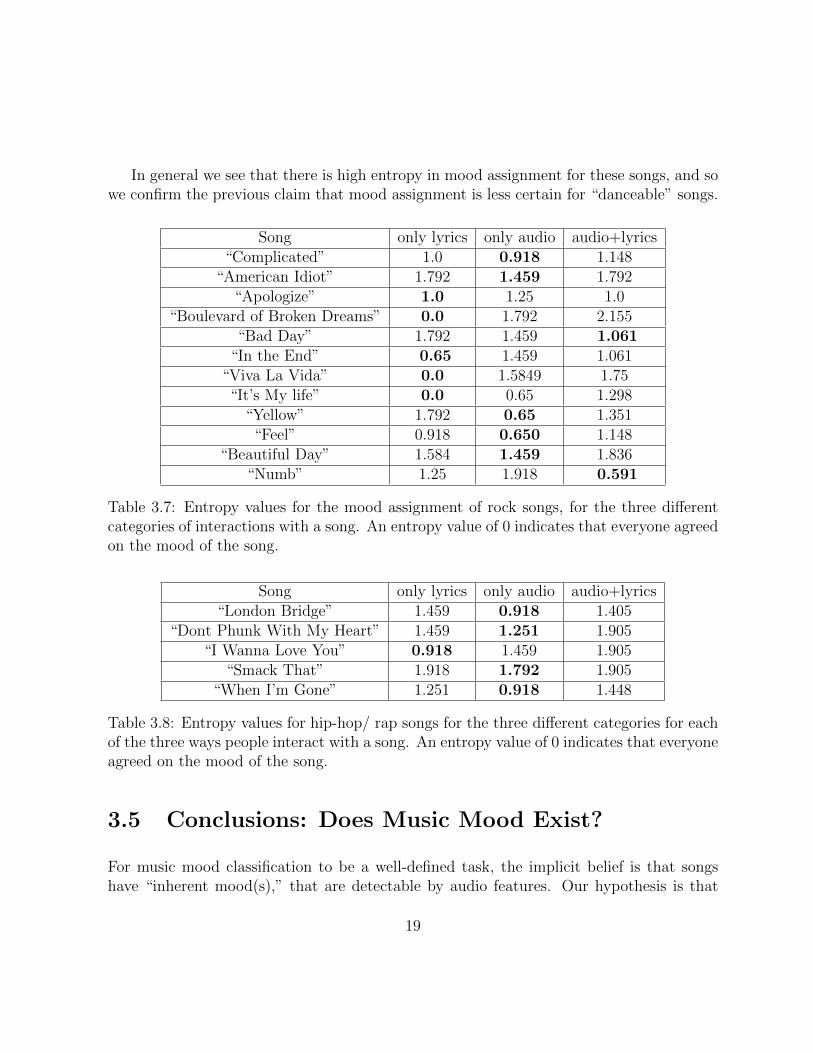
In general we see that there is high entropy in mood assignment for these songs, and sowe confirm the previous claim that mood assignment is less certain for “danceable” songs.
Song only lyrics only audio audio+lyrics“Complicated” 1.0 0.918 1.148
“American Idiot” 1.792 1.459 1.792“Apologize” 1.0 1.25 1.0
“Boulevard of Broken Dreams” 0.0 1.792 2.155“Bad Day” 1.792 1.459 1.061
“In the End” 0.65 1.459 1.061“Viva La Vida” 0.0 1.5849 1.75“It’s My life” 0.0 0.65 1.298
“Yellow” 1.792 0.65 1.351“Feel” 0.918 0.650 1.148
“Beautiful Day” 1.584 1.459 1.836“Numb” 1.25 1.918 0.591
Table 3.7: Entropy values for the mood assignment of rock songs, for the three differentcategories of interactions with a song. An entropy value of 0 indicates that everyone agreedon the mood of the song.
Song only lyrics only audio audio+lyrics“London Bridge” 1.459 0.918 1.405
“Dont Phunk With My Heart” 1.459 1.251 1.905“I Wanna Love You” 0.918 1.459 1.905
“Smack That” 1.918 1.792 1.905“When I’m Gone” 1.251 0.918 1.448
Table 3.8: Entropy values for hip-hop/ rap songs for the three different categories for eachof the three ways people interact with a song. An entropy value of 0 indicates that everyoneagreed on the mood of the song.
3.5 Conclusions: Does Music Mood Exist?
For music mood classification to be a well-defined task, the implicit belief is that songshave “inherent mood(s),” that are detectable by audio features. Our hypothesis is that
19
many songs have no inherent mood, but that the perceived mood of a song depends oncultural and experiential factors. The data from our study supports our hypothesis.
We have earlier shown that the mood judgment of a song depends on whether it isheard to or its lyrics is read or both together, and that all three contexts produce moodassignments that are strikingly independent.
We have shown that participants are more likely to assign a song to the “melancholy”mood cluster when only reading its lyrics, and we have shown genre-specific cultural andexperiential contexts that affect how mood appears to be perceived. Together, these find-ings suggest that that the concept of music mood is fraught with uncertainty.
The MIREX audio mood classification task has had a maximum classification accuracyof less than 70% [47], with no significant recent improvements. Perhaps, this suggeststhat the field is stuck at a plateau, and we need to redefine “music mood” and changeour approach to the music mood classification problem. Music mood is highly affected byexternal factors like the way a listener interacts with the song, the genre of the song, themood and personality of the listener, and future systems should take these factors intoaccount.
20
Chapter 4
Are Poetry and Lyrics All ThatDifferent?
4.1 Introduction
The choice of a particular word, from a set of words that can all be used appropriately,depends on the context we use it in, and on the artistic decision of the authors. Webelieve that for a given concept, the words that are more likely to be used in lyrics willbe different from the ones which are more likely to be used in articles or poems, becauselyricists typically have different objectives [91]. Poetry typically attracts a more educatedand sensitive audience while lyrics are written for the masses and hence the tendency to usesimpler words in music lyrics and comparatively more sophisticated words in poetry [70].We test our hypothesis by examining adjective usage in these categories of documents. Wefocus on adjectives, as a majority have synonyms that can be used depending on context.To our surprise, we find adjective usage is sufficient to separate lyrics from poetry quiteeffectively.
4.1.1 Definitions and Synonyms
Finding the synonyms of a word is still an open problem [93]. We used three differentsources to obtain synonyms for a word: the WordNet [59], Wikipedia [86] and an onlinethesaurus [87]. We prune synonyms, obtained from the three sources, which fall belowan experimentally determined threshold for the semantic distance (calculated using the
21

Figure 4.1: The bold-faced words are the adjectives our algorithm takes into account whileclassifying a document, which in this case in a snippet of lyrics by the Backstreet Boys.
method described by Pirro et al. [69]) between the synonyms and the word. The list ofrelevant synonyms obtained after pruning was used to obtain the probability distributionover words for each class of document, for common adjectival concepts. Semantic distanceis a metric defined over a set of terms, where the idea of distance between them is basedon the likeness of their meaning or semantic content. We use the method described byPirro et al. [69], where they consider a broader range of relations (e.g., part-of) along withassessing how two objects are alike.
Lyrics and poetry started as very similar concepts. In the early nineteenth century, lyricwas one of three broad categories of poetry in classical antiquity, along with drama andepic [16]. Lyric poetry was a form of poetry which expresses personal emotions or feelings,typically spoken in the first person usually with a musical accompaniment known as a lyre[16]. Over the course of time both have evolved into two slightly different elements. Akey requirement of our study is that there exists a difference, albeit a hazy one, betweenpoetry and lyrics. Poetry attracts a more educated and sensitive audience while lyrics arewritten for the masses [70]. Poetry, unlike lyrics, is often structurally more constrained,adhering to a particular meter and style [70]. Lyrics are often written keeping the musicin mind while poetry is written against a silent background. Lyrics, unlike poetry, oftenrepeat lines and segments, causing us to believe that lyricists tend to pick more rhymableadjectives. Furthermore, a good song made by its hooks, and there are several differentkinds of hook. One of them is catchy rhyme, which can contribute to the memorizabilityof songs [89]. Of course, some poetic forms also repeat lines, such as the villanelle.
22
We use a bag of words model for the adjectives, where we do not care about their relativepositions in the text, but only their frequencies. Finding synonyms of a given word is avital step in our approach and since it is still considered a difficult task, improvement insynonyms finding approaches will lead to an improvement in our classification accuracy.
Our classification algorithm has a linear run time as it scans through the document onceto detect the adjectives and calculate the probability of the document being a poetry, lyricor an article. The document class with the highest probability is chosen as the outcome.We attain an overall accuracy of 68%. Lyricists with a relatively high percentage of lyricsmisclassified as poetry tend to be recognized for their poetic style, such as Bob Dylan, whohas published books of poetry, and Annie Lennox.
This work was published at ISMIR 2014 [76], and this chapter quotes extensively fromthat publication.
4.2 Related Work
We do not know of any work on the classification of documents based on the adjectiveusage into genre, nor are we aware of any computational work which discerns poetic fromnon-poetic lyricists. Previous works have used adjective choice for various purposes likesentiment analysis [20]. Work on poetry has focused on poetry translation, automaticpoetry generation, rather than focusing on the word choice of poetry.
Chesley et al. [20] classifies blog posts according to sentiment using verb classes andadjective polarity, achieving accuracy levels of 72.4% on objective posts, 84.2% for positiveposts, and 80.3% for negative posts. Entwisle et al. [29] analyzes the free verbal productionsof ninth-grade males and females and conclude that girls use more adjectives than boysbut fail to reveal differential use of qualifiers by social class.
Smith et al. [80] use tf-idf weighting to find typical phrases and rhyme pairs in songlyrics and conclude that the typical number one hits, on average, are more cliched. Nicholset al. [64] studies the relationship between lyrics and melody on a large symbolic databaseof popular music and conclude that songwriters tend to align salient (prominent) noteswith salient (prominent) lyrics.
There is some existing work on automatic generation of synonyms. Zhou et al. [93]extracts synonyms using three sources - a monolingual dictionary, a bilingual corpus anda monolingual corpus, and use a weighted ensemble to combine the synonyms producedfrom the three sources. They get improved results when compared to the manually built
23
thesauri, WordNet [59] and Roget [74]. Christian et al. [14] describe an approach for usingWikipedia to automatically build a dictionary of named entities and their synonyms. Theywere able to extract a large amount of entities with a high precision, and the synonymsfound were mostly relevant, but in some cases the number of synonyms was very high.Niemi et al. [65] add new synonyms to the existing synsets of the Finnish WordNet usingWikipedias links between the articles of the same topic in Finnish and English.
As to computational poetry, Jiang et al. [51] use statistical machine translation togenerate Chinese couplets while Genzel et al. [33] use statistical machine translation totranslate poetry keeping the rhyme and meter constraints. There is, a wide literature ongeneration of novel computational poetry, which we do not survey here.
4.3 Data Set
Artist PoetsBryan Adams William Blake
Adele E.E. CummingsAkon Edward FitzGerald
Beyonce Robert FrostBackstreet Boys Donald Hall
Darius Erica JongGreen Day John KeatsCeline Dion Robert Lowell
Eminem Walter De La MareFergie Adrienne Rich
Lady Gaga Walter ScottEnrique Iglesias William Shakespeare
Rihanna Percy Bysshe ShelleyShakira Lord Tennyson
U2 Alice Walker
Table 4.1: Fifteen of the singers and poets in our data set.
The training set consists a collection of of articles, lyrics and poetry and is used tocalculate the probability distribution of adjectives in the three different types of documents.We use these probability distributions in our document classification algorithms, to identify
24
poetic from non-poetic lyricists and to determine adjectives more likely to be used in lyricsrather than poetry and vice versa.
4.3.1 Articles
We take the English Wikipedia and over 13,000 news articles from four major newspapers:The Chicago Sun-Times, Washington Post, Los Angeles Times, and The Hindu (which haseditions from many Indian cities), as our article data set. Wikipedia, an enormous andfreely available data set is edited by experts. Both of these are extremely rich sources ofdata on many topics. To remove the influence of the presence of articles about poems andlyrics in Wikipedia we ensured that the articles were not about poetry or music by notselecting articles belonging to the Entertainment or Music category to be in our data set.
4.3.2 Lyrics
We took more than 10,000 lyrics from 56 very popular English singers. The author andhis supervisor both listen to English music and hence it was easy to come up with a listwhich included singers from many popular genres with diverse backgrounds. We focuson English-language popular music in our study, because it is the closest to “universally”popular music, due to the strength of the music industry in English-speaking countries.We do not know if our work would generalize to non-English Language songs. Our dataset includes lyrics from American, Canadian, British and Irish lyricists. A list of fifteen ofthese singers is in Table 4.1.
4.3.3 Poetry
We took more than 20,000 English-language poems from 61 famous poets, like RobertFrost, William Blake and John Keats, over the last three hundred years. We selected thetop poets from Poem Hunter [50]. A list of fifteen of these poets is in Table 4.1. We selecteda wide time range for the poets, as many of the most famous English poets are from thattime period. None of the poetry selected were translations from another language. Mostof the poets in our dataset are poets from North America and Europe.
25
4.3.4 Test Data
Poetic Lyricists JustificationBob Dylan Published poetry books [83]Ed Sheeran Writes poetic lyrics [90]
Ani Di Franco A published poet [4]Annie Lennox Writes poetic lyrics [5]Bill Callahan Writes poetic lyrics [72]
Bruce Springsteen Writes poetic lyrics [15]Stephen Sondheim Writes poetic lyrics [85]
Morrissey Writes poetic lyrics [22]
Table 4.2: The list of poetic lyricists in our test set.
For the purpose of document classification we took 100 examples from each category,ensuring that they were not present in the training set. While collecting the test datawe ensured the diversity, the lyrics and poets came from different genres and artists andthe articles covered different topics and were selected from different newspapers. Thelyricists in our test data consisted of artists like Lionel Richie, Kesha, Flo Rida, and INXS.The articles in our test set came from The New York Times, The Canadian BroadcastingCorporation and The Huffington Post. William Ernest Henley, James Joyce, Pablo Nerudaand Thomas Hardy made up our poetry test set.
To determine poetic lyricists from non-poetic ones we took eight of each of the twotypes of lyricists, none of whom were present in our lyrics data sets. We ensured thatthe poetic lyricists we selected were indeed poetic by looking up popular news articlesor ensuring that they were poet along with being lyricists. A few of our selected poeticlyricists like Bob Dyan and Ani DiFranco are published poets. Our list for poetic lyricistsincluded Stephen Sondheim and Annie Lennox, while the non-poetic ones included BryanAdams and Michael Jackson. The list of poetic lyricists in our test set is in Table 4.2.
4.4 Method
We start by finding the synonyms of all the adjectives in our training data set. We thenproceed to calculate the probability distribution of adjectives in articles, lyrics and poetry.Using these probability distributions and synonyms generated in the previous steps, we
26
calculate the probability of a document in our test set being an article, lyrics or poetryand the predicted genre of the document is the highest probability choice.
4.4.1 Extracting Synonyms
We extract the synonyms for a term from three sources: WordNet, Wikipedia and an onlinethesaurus.
WordNet [59] is a large lexical database of English where words are grouped into setsof cognitive synonyms (synsets) together based on their meanings. WordNet interlinks notjust word forms but specific senses of words. As a result, words that are found in closeproximity to one another in the network are semantically disambiguated. The synonymsreturned by WordNet need some pruning. For example, for “happy”, the WordNet returns“prosperous”, “halcyon”, “bright” and “golden” as synonyms, along with other plausiblesynonyms.
We use Wikipedia [86] redirects to discover terms that are mostly synonymous. Itreturns a large number of words, which might not be synonyms, so we need to prune theresults. This method has been widely used for obtaining the synonyms of named entities(e.g. [14]), but we get decent results for adjectives too. Using the Wikipedia redirectsto obtain the synonym of “happy”, we obtain “happyness”, “warm” and “fuzzy” and“felicitous” along with some other plausible synonyms.
We also used an online thesaurus [87] that lists words grouped together accordingto similarity of meaning. Though it gives very accurate synonyms, pruning is necessary toget better results. For “happy”, an online thesaurus returns “heaven-sent”, “tickled”, and“queer” along with the other plausible synonyms.
The semantic distance between each of the synonyms obtained from the three sourcesand the word was calculated. We prune synoyms which fall below a certain semanticsimilarity threshold, which was determined experimentally. Semantic distance is a metricdefined over a set of terms, where the idea of distance between them is based on the likenessof their meaning or semantic content. To calculate the semantic similarity distance betweenwords we use the method described by Pirro et al. [69], where they consider a broaderrange of relations (e.g., part-of) along with assessing how two objects are alike. Extractingsynonyms for a given word is an open problem and with improvement in this area ouralgorithm will achieve better classification accuracy levels.
For example, for “happy” we obtain the following synonyms:
27
Via WordNet: elated, cheerful, happy, blessed, prosperous, golden, joyful, bright,laughing, riant, contented, glad, content, felicitous, halcyon, blissful, euphoric, joyous.
Via Wikipedia redirects: happiness, enjoyment, happy, gladness, lightheartedness,jolly, light-hearted, light-hearted, happyness, happier, warm, cheerfulness, happy, felicitous,felicitously, jocund, jocundity, jocundly, exulting, exulted, exults, exultantly, exultance,exultancy, exultingly, hapiness, jolliness, gaiety, happiest, happily.
Via online thesaurus: fluky, fortuitous, heaven-sent, lucky, providential, blissful,chuffed, delighted, gratified, joyful, joyous, pleased, satisfied, thankful, tickled, contented,gratified, happy, pleased, satisfied, fortunate, happy, applicable, appropriate, apt, becom-ing, befitting, felicitous, fitted, fitting, good, happy, meet, pretty, proper, right, suitable,happy, obsessed, queer.
After pruning: blessed, glad, felicitous, suitable, appropriate, blissful, good, meet,fitting, riant, joyful, laughing, lucky, euphoric, joyous, happy, fortuitous, pleased, cheerful,providential, elated.
4.4.2 Probability Distribution
We believe that the choice of an adjective to express a given concept depends on the genreof writing: adjectives used in lyrics will be different from ones used in poems or in articles.Poetry is typically written for a more sophisticated and educated audience while lyricsare written for the masses [70]. Hence, it is plausible to assume that lyrics will containsimpler words than poetry for the same concept. We calculate the probability of a specificadjective for each of the three document types.
First, WordNet is used to identify the adjectives in our training sets. For each adjective,we compute its frequency in the training set for all the three document classes and itssynonyms. We then compute the frequency of all its synonyms in all the document classes.The ratio of the frequency of the adjective to the frequency of all its synonyms in all thedosument classes is calculated, which is the frequency with which that adjective representsits synonym group in that class of writing. This ratio is the probability of a documentbelonging to a particular document class given the occurence of the adjective.
4.4.3 Document classification algorithm
We use a simple linear time algorithm which takes as input the probability distributionsfor adjectives, calculated above, and the document(s) to be classified, calculates the score
28
of the document being an article, lyrics or poetry, and labels it with the class with thehighest score. The algorithm takes a single pass along the whole document and identifiesadjectives using WordNet.
For each adjective in the document we check its presence in our training set for theparticular document class. If found, we add the probability of the word in the givendocument class to the score, with a special penalty of -1 for adjectives never found inthe training set for the document class and a special bonus of +1 for words which occurwith probability 1 in the given document class. The penalty and boosting values used inthe algorithm were determined experimentally. The score we obtain is the probability ofthe given document belonging to a particular document class. Surprisingly, this simpleapproach gives us much better accuracy rates than Naıve Bayes, which we thought wouldbe a good option since it is widely used in classification tasks like spam filtering [3]. Wehave decent accuracy rates with this simple, naıve algorithm; one future task could be todevelop a better classifier.
Table 4.3 shows the probability distribution for the adjectives in a lyrics snippet inFigure 4.1. The algorithm correctly identifies the document to be lyrics.
Word P(word given lyrics) P(word given articles) P(word given poetry)even 0.9003 0.8863 0.9195true 0.0406 0.0462 0.1087deep 0.3549 0.1043 0.2672
impossible 0.9782 0.8299 0.9565bad 0.1978 0.0776 0.0609
Total 2.4718 1.9443 2.3128
Table 4.3: The probability distributions for the adjectives in the lyrics snippet in Figure4.1. The overall classification for the snippet is that it is lyrics.
4.5 Results
First, we look at the classification accuracies among lyrics, articles and poems obtainedby our classifier. We show that the adjectives used in lyrics are much more rhymable thanthe ones used in poems but they do not differ significantly in their semantic orientations.Furthermore, our algorithm is able to identify poetic lyricists from non-poetic ones usingthe word distributions calculated in an earlier section. We also compare adjectives for agiven concepts which are more likely to be used in lyrics rather than poetry and vice versa.
29
4.5.1 Document Classification
Our test set consists of the text of 100 examples from each of our three categories. Usingour algorithm with the adjective distributions we get an accuracy of 67% for lyrics, 80%for articles and 57% for poems.
The confusion matrix showing the performance of our algorithm is in Table 4.4. Wefind that we can detect articles with the highest accuracy, this might be because of theenormous size of the article training set which consisted of all English Wikipedia articles.A slightly more number of articles get misclassified as lyrics than poetry. A large numberof misclassified poems get classified as articles rather than lyrics, but most misclassifiedlyrics get classified as poems. Typically poetry is written for a more sophisticated andeducated audience; newspaper and wikipedia articles (our article data set) targets similaraudience. Hence it is plausible that a majority of poetry gets misclassified as articles, buta majority of articles getting misclassified as lyrics rather than poetry is surprising.
For example, the first step of running the document classification algorithm on thesong snippet in Figure 4.1 will consist of detecting all the adjectives. We then proceedto get the synonyms of all the adjectives which have previously been detected using themethod described in Section 4.4.1. We then proceed to calculate the score of the documentbeing lyrics, poetry or article using the probability distributions for each of the documentclass. The probability distribution of adjectives for each document class is calculated usingthe method described in Section 4.4.2. The document class with the highest score is thepredicted class of the given document.
4.5.2 Adjective Usage in Lyrics versus Poems
Poetry is written against a silent background while lyrics are often written keeping themelody, rhythm, instrumentation, the quality of the singers voice and other qualities ofthe recording in mind [70]. Furthermore, unlike most poetry, lyrics include repeated lines[70]. This led us to believe the adjectives which were more likely to be used in lyrics ratherthan poetry would be more rhymable.
Rhymezone [71] is a website which maintains a list of word a given word rhymes with.We counted the number of words an adjective in our lyrics and poetry list rhymes withfrom their website. The values are tabulated in Table 4.5. From the values in Table 4.5,we can clearly see that the adjectives which are more likely to be used in lyrics to bemuch more rhymable than the adjectives which are more likely to be used in poetry. Forexample, “happy”, which is more likely to be used in poetry rather than in lyrics, rhymes
30
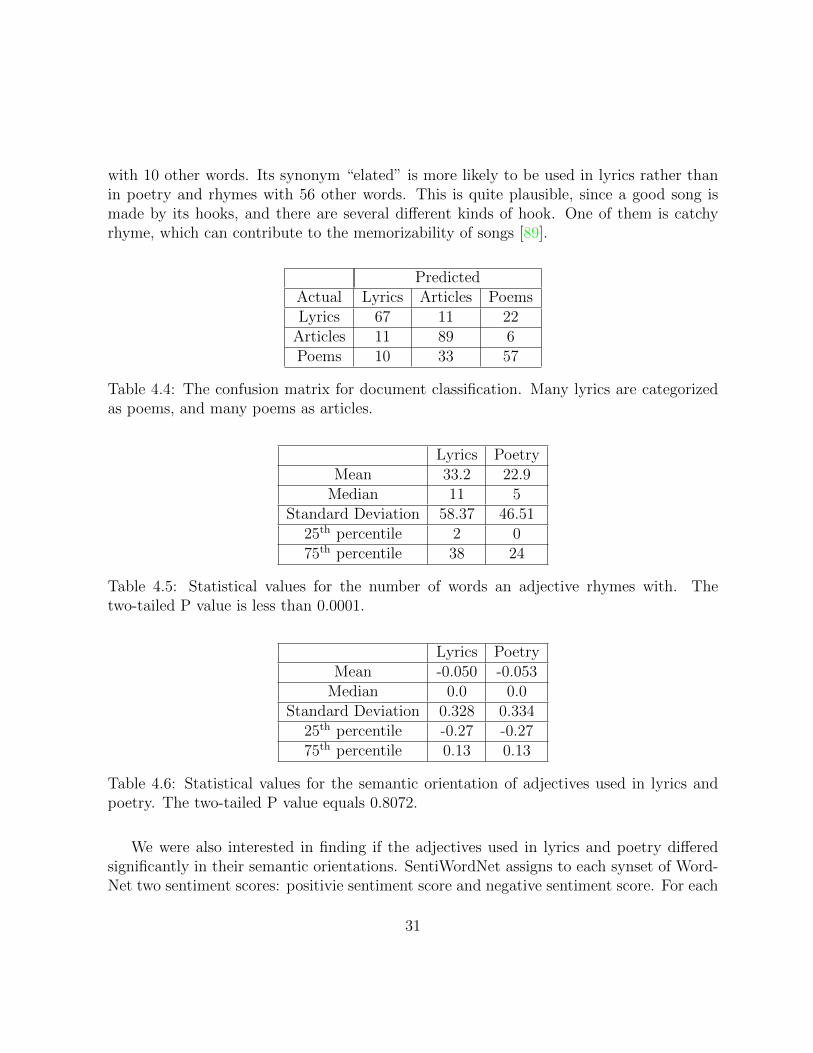
with 10 other words. Its synonym “elated” is more likely to be used in lyrics rather thanin poetry and rhymes with 56 other words. This is quite plausible, since a good song ismade by its hooks, and there are several different kinds of hook. One of them is catchyrhyme, which can contribute to the memorizability of songs [89].
PredictedActual Lyrics Articles PoemsLyrics 67 11 22
Articles 11 89 6Poems 10 33 57
Table 4.4: The confusion matrix for document classification. Many lyrics are categorizedas poems, and many poems as articles.
Lyrics PoetryMean 33.2 22.9
Median 11 5Standard Deviation 58.37 46.51
25th percentile 2 075th percentile 38 24
Table 4.5: Statistical values for the number of words an adjective rhymes with. Thetwo-tailed P value is less than 0.0001.
Lyrics PoetryMean -0.050 -0.053
Median 0.0 0.0Standard Deviation 0.328 0.334
25th percentile -0.27 -0.2775th percentile 0.13 0.13
Table 4.6: Statistical values for the semantic orientation of adjectives used in lyrics andpoetry. The two-tailed P value equals 0.8072.
We were also interested in finding if the adjectives used in lyrics and poetry differedsignificantly in their semantic orientations. SentiWordNet assigns to each synset of Word-Net two sentiment scores: positivie sentiment score and negative sentiment score. For each
31
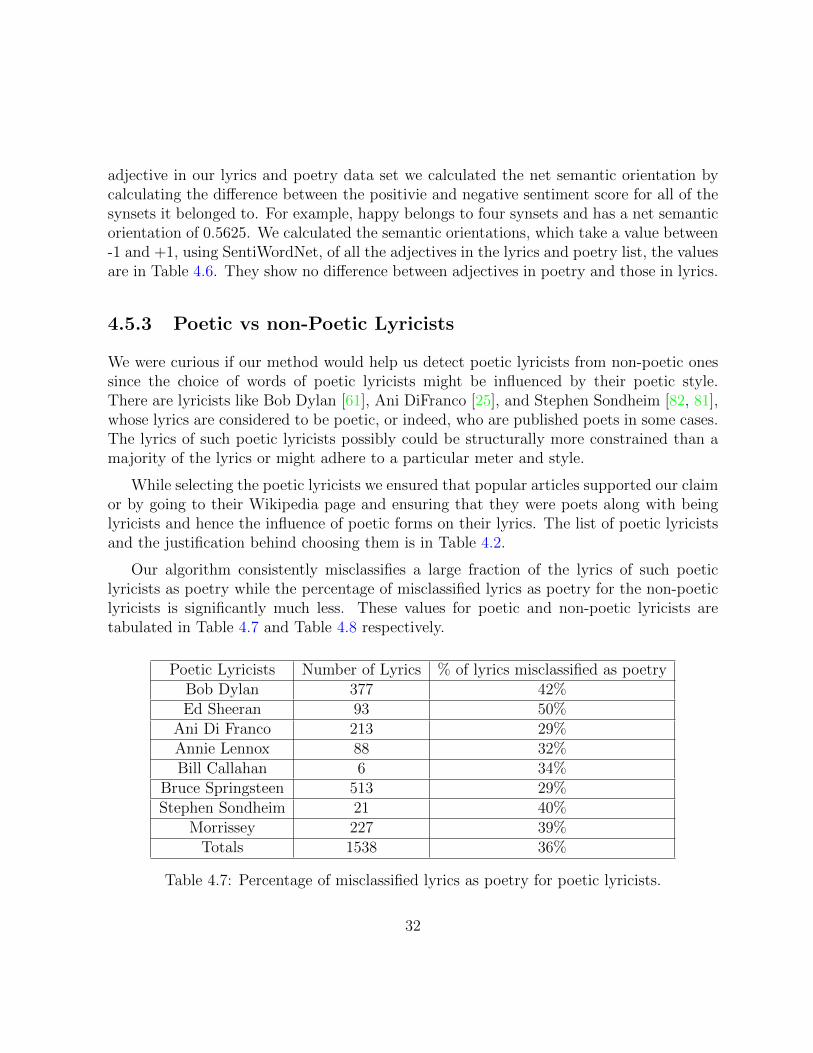
adjective in our lyrics and poetry data set we calculated the net semantic orientation bycalculating the difference between the positivie and negative sentiment score for all of thesynsets it belonged to. For example, happy belongs to four synsets and has a net semanticorientation of 0.5625. We calculated the semantic orientations, which take a value between-1 and +1, using SentiWordNet, of all the adjectives in the lyrics and poetry list, the valuesare in Table 4.6. They show no difference between adjectives in poetry and those in lyrics.
4.5.3 Poetic vs non-Poetic Lyricists
We were curious if our method would help us detect poetic lyricists from non-poetic onessince the choice of words of poetic lyricists might be influenced by their poetic style.There are lyricists like Bob Dylan [61], Ani DiFranco [25], and Stephen Sondheim [82, 81],whose lyrics are considered to be poetic, or indeed, who are published poets in some cases.The lyrics of such poetic lyricists possibly could be structurally more constrained than amajority of the lyrics or might adhere to a particular meter and style.
While selecting the poetic lyricists we ensured that popular articles supported our claimor by going to their Wikipedia page and ensuring that they were poets along with beinglyricists and hence the influence of poetic forms on their lyrics. The list of poetic lyricistsand the justification behind choosing them is in Table 4.2.
Our algorithm consistently misclassifies a large fraction of the lyrics of such poeticlyricists as poetry while the percentage of misclassified lyrics as poetry for the non-poeticlyricists is significantly much less. These values for poetic and non-poetic lyricists aretabulated in Table 4.7 and Table 4.8 respectively.
Poetic Lyricists Number of Lyrics % of lyrics misclassified as poetryBob Dylan 377 42%Ed Sheeran 93 50%
Ani Di Franco 213 29%Annie Lennox 88 32%Bill Callahan 6 34%
Bruce Springsteen 513 29%Stephen Sondheim 21 40%
Morrissey 227 39%Totals 1538 36%
Table 4.7: Percentage of misclassified lyrics as poetry for poetic lyricists.
32

Non-Poetic Lyricists Number of Lyrics % of lyrics misclassified as poetryBryan Adams 232 14%
Michael Jackson 321 22%Drake 144 7%
Backstreet Boys 248 23%Radiohead 240 26%
Stevie Wonder 300 17%Led Zeppelin 118 8%
Kesha 146 18%Totals 1749 17%
Table 4.8: Percentage of misclassified lyrics as poetry for non-poetic lyricists.
From the values in Table 4.7 and Table 4.8 we see that there is a clear separation betweenthe misclassification rate between poetic and non-poetic lyricists. The maximum misclas-sification rate for the non-poetic lyricists, 26% is less than the minimum mis-classificationrate for poetic lyricists, 29%. Furthermore the difference in average misclassification ratebetween the two groups of lyricists is 19%. Hence our simple algorithm can accuratelyidentify poetic lyricists from non-poetic ones, based only on adjective usage: with enoughexamples, poetic lyricists are those that routinely have their lyrics classified as poetry, notlyrics.
4.5.4 Concept representation in Lyrics vs Poetry
We compare adjective uses for common concepts. To represent physical beauty we aremore likely to use words like “sexy” and “hot” in lyrics but “gorgeous” and “handsome”in poetry. For 20 of these, results are tabulated in Table 4.9. The difference could possiblybe because unlike lyrics, which are written for the masses, poetry is generally written forpeople who are interested in literature [70].
4.6 Conclusion
We have developed a method to detect the genre of a document based on the probabilitydistribution of synonymous adjectives. Our key finding is that the choice of synonym foreven a small number of adjectives is sufficient to reliably identify the genre of documents.
33
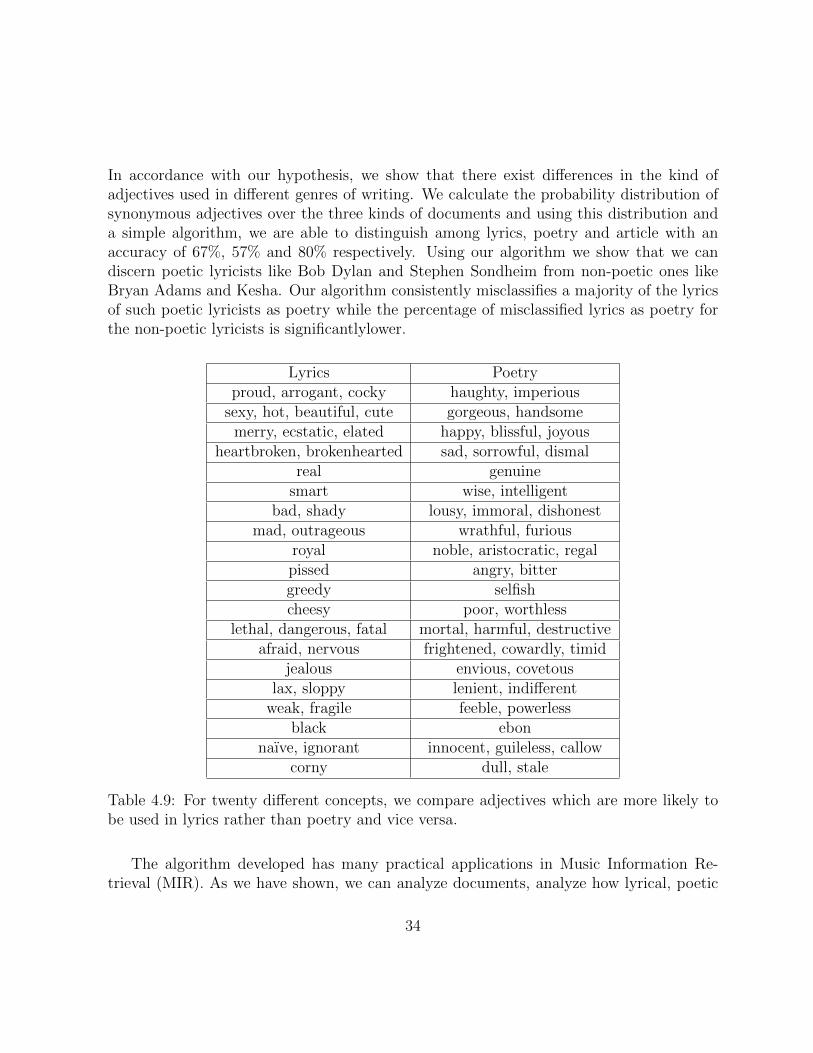
In accordance with our hypothesis, we show that there exist differences in the kind ofadjectives used in different genres of writing. We calculate the probability distribution ofsynonymous adjectives over the three kinds of documents and using this distribution anda simple algorithm, we are able to distinguish among lyrics, poetry and article with anaccuracy of 67%, 57% and 80% respectively. Using our algorithm we show that we candiscern poetic lyricists like Bob Dylan and Stephen Sondheim from non-poetic ones likeBryan Adams and Kesha. Our algorithm consistently misclassifies a majority of the lyricsof such poetic lyricists as poetry while the percentage of misclassified lyrics as poetry forthe non-poetic lyricists is significantlylower.
Lyrics Poetryproud, arrogant, cocky haughty, imperious
sexy, hot, beautiful, cute gorgeous, handsomemerry, ecstatic, elated happy, blissful, joyous
heartbroken, brokenhearted sad, sorrowful, dismalreal genuine
smart wise, intelligentbad, shady lousy, immoral, dishonest
mad, outrageous wrathful, furiousroyal noble, aristocratic, regalpissed angry, bittergreedy selfishcheesy poor, worthless
lethal, dangerous, fatal mortal, harmful, destructiveafraid, nervous frightened, cowardly, timid
jealous envious, covetouslax, sloppy lenient, indifferent
weak, fragile feeble, powerlessblack ebon
naıve, ignorant innocent, guileless, callowcorny dull, stale
Table 4.9: For twenty different concepts, we compare adjectives which are more likely tobe used in lyrics rather than poetry and vice versa.
The algorithm developed has many practical applications in Music Information Re-trieval (MIR). As we have shown, we can analyze documents, analyze how lyrical, poetic
34
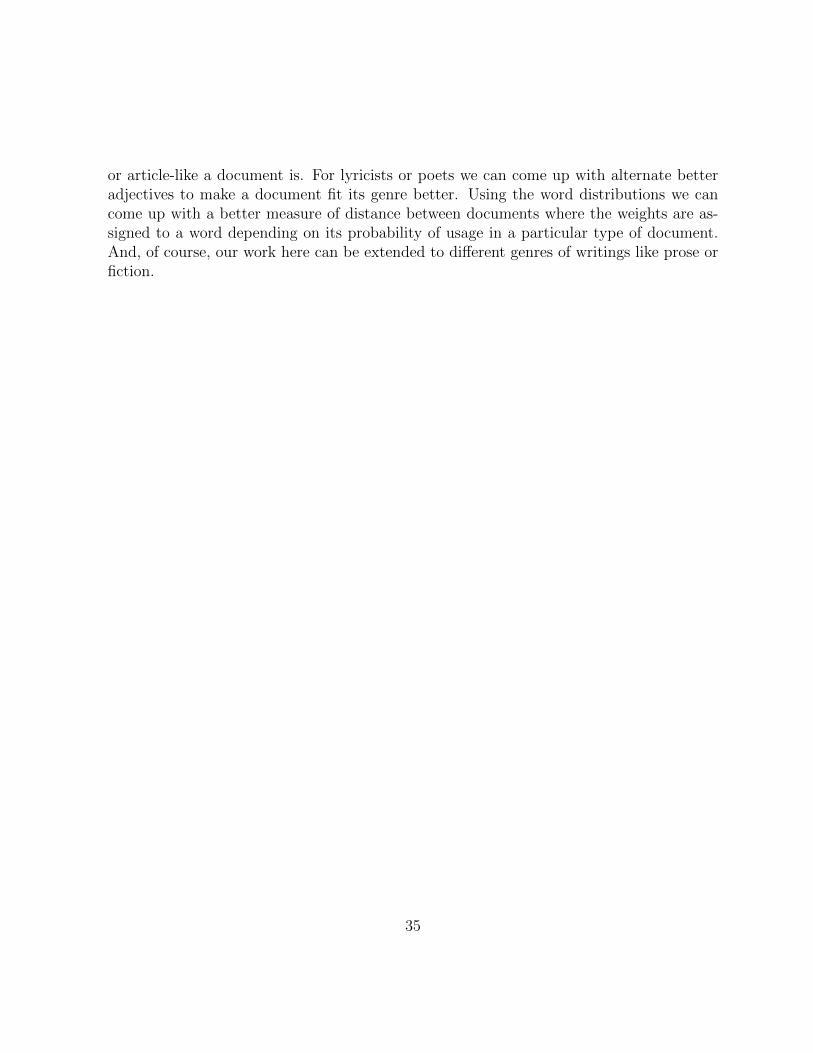
or article-like a document is. For lyricists or poets we can come up with alternate betteradjectives to make a document fit its genre better. Using the word distributions we cancome up with a better measure of distance between documents where the weights are as-signed to a word depending on its probability of usage in a particular type of document.And, of course, our work here can be extended to different genres of writings like prose orfiction.
35
Chapter 5
Can Song Lyrics Predict Hits?
5.1 Introduction
Can we predict if a song will be a hit before it is even released? This music informationretrieval task, sometimes called hit song science [63], has traditionally been seen as ex-tremely hard [68]. Solving it would be of immense use to music label companies. Theywant to invest resources in songs likely to become hits and give a good return on theirinvestment, rather than publicizing songs set to be flops. Successful hit detection mightalso identify talented music artists whose songs otherwise would not have received enoughairplay time. Most previous work in hit song detection has been of modest success, andhas typically focused on audio aspects of a song recording [63, 68], though Dhanaraj andLogan [24] used both text and audio features in their experiments.
Our focus in this thesis is on studying lyrics as a component of the artistic creation ina song. Since lyrics are typically set in verses and choruses, we analyze the structure ofthese elements, with a focus on rhyme, meter and syllable content. Lyrics contain muchof the emotional content of a typical popular song [2], and are also a much smaller inputset (typically a few kilobytes for a song) than the megabytes to analyze in a recording ofthe audio of the song. Lyrics also contribute to the memorizability of songs [89], and offersongwriters the opportunity to show off their creativity in an easily noticed fashion, suchas through clever wordplay or rhyme patterns. Finally, behavioral and neuropsychologicalresearch has shown that individuals process lyrics and tune separately while listening tosongs [37].
We make use of song lyrics to build our models, though in later experiments we added14 audio features from Echo Nest [62] to analyze the effectiveness of incorporating the
36
audio recording into prediction of hits. We use the complete set of 24 rhyme and syllablefeatures of the Rhyme Analyzer [42], and add seven new meter features identifying thefraction of lines written in a particular meter. The description of our 31 lyrics features isin Table 5.4.
As is often true with music information retrieval tasks, the core question in our workis the separation of types of recordings that are hard to define: what is a hit, and whatis a flop? We define hits as songs that made it to the Billboard Year-End Hot 100 singleschart in the years 2008-2013. We select recent hits since pop music evolves over time: a1960’s-era Beatles hit, which no doubt a lot of people still listen to, might be a flop in2015. By contrast, it might be difficult to come to a consensus on the definition of a flop,so we use several different definitions of flops, ranging from a very broad one to extremelyrestricted ones.
We use standard machine-learning algorithms, such as weighted support vector machine[19] and Bayesian network classifiers from Weka [35], with 10-fold cross validation. TheSVM slightly outperforms the Bayesian network, but we focus our presentation on theBayes net classifiers, for simplicity of presentation. Surprisingly, the Bayesian networks weobtain from Weka are naıve Bayes: the effect of one feature is independent of another.
Our major results are twofold. First, the simple classifiers we build from lyric featuresare surprisingly effective at separating flops and hits. And second, in all cases where oneof our rhyme or meter features is helpful in predicting whether a song is a hit or not, wefind that the more complex a song’s rhyme or meter, the more likely it is a hit.
A limitation of focusing on lyrics is that it prevents us from distinguishing good andbad covers of the same song by different artists singing the same words. Similarly, a songmight become a hit on the basis of great instrumental work or a terrific video: our methodscannot be expected to succeed in these cases either. However, a key result of our work isthat we can distinguish clever lyrics from less clever ones, and that this separation allowsus to identify at least one aspect of high-quality, or at least successful, songwriting.
The results of this Chapter has previously been presented as a late breaking demo atISMIR 2014 [77] and at CMMR 2015 [79]. This chapter quotes extensively from thesepublications.
5.2 Related Work
Several authors have previously attempted to predict hit songs, largely using audio features.Dhanaraj and Logan [24] use both text and audio features individually and together to
37
predict hit songs. They take songs which made it to the number 1 position in the UnitedStates, United Kingdom, or Australia from January 1956 to April 2004 as hits. They donot describe the songs that they consider flops. They learn the most prominent sounds andtopics of each song (using textual analysis), and conclude that the text features are slightlymore useful than the audio features; combining both of them together does not producesignificant improvements. They obtain an average area under ROC curve of 0.66 using theaudio features, while using the text features, or combining both types of features, gives anaverage area under ROC curve of 0.68 and 0.69 respectively. They focus on the semanticcontent of the words, learning the topic every song belongs to in their lyrics collection.A key limitation of their work is that they used features designed for prose rather thanones designed for verse. Ni et al. [63] use audio features to discern the top 5 hits fromthe other top 30-40 hits using a shifting perceptron. They achieve classification accuracyof slightly more than 50% across all the decades from 1960-2010. Pachet and Roy [68]attempt to use spectral features like chroma, spectral centroid, skewness, and manuallyentered labels, to learn a label of low, medium or high popularity using a support vectormachine with boosting. They conclude that using their features, it is not possible to gaugethe popularity of a song.
Fan and Casey [31] used a set of ten common audio features such as energy, loudnessand danceability with a time weighted linear regression model and a support vector ma-chine model to predict Chinese and UK pop hits from a data set of 347 Chinese and 405English songs. They conclude that Chinese hit song prediction is easier than British hitsong prediction and show that the audio feature characteristics of Chinese hit songs aresignificantly different from those of UK hit songs. They obtain an error rate of slightlymore than 41% and 39% for English and Chinese songs respectively on balanced data.Herremans et al. [38] used audio features to discern Top 10 dance song hits from songswith lower listed position. They obtained the best results with logistic regression closelyfollowed by naıve Bayes classifier.
Bischoff et al. [13] exploit social annotations and interactions in Last.fm and the re-lationships between tracks, artists and albums to predict hits. Since these social tagsincorporate lots of information about why hits are hits, they are clearly of a different sortthan those that are based on the primary creative work only.
Only one group has previously focused on the properties of lyrics that distinguish themas not being prose: Smith et al. [80] make use of TF-IDF weighting to find typical phrasesand rhyme pairs in song lyrics and conclude that typical number one hits, on average, aremore cliched.
Though our audio features are similar to the ones used by previous work, we are unaware
38
of any previous work which uses meter and syllable features for hit detection. Unlike Smithet al. [80], which concentrates on cliched rhymes, we consider all rhyming pairs in the lyrics,including imperfect and line-internal rhymes.
Unfortunately, it is difficult to compare the results from our work with those fromprevious works: these works do not provide a confusion matrix, nor do they provide easilyinterpretable results. There are some key differences and enhancements between our workand previous works: the use of unique lyrical features, exploring different definitions offlops, and providing complete results of our experiments. We are unaware of any previouswork that explored the consequence of using different definitions of flops, but this is key,as each definition has its own pros and cons and warrants attention. Unlike previouswork with songs spanning a few decades [24], we select hits from the shorter 2008-2013interval, as music taste evolves over time. Also, our data sets are available at a website,www.cs.uwaterloo.ca/~browndg/CMMR15data.
5.3 Rhymes
A rhyme is a repetition of similar sounds or the same sound in two or more words, mostoften in the final syllables of lines in poetry and lyrics. They can be further divided intodegree and manner of phonetic similarity into perfect and general rhymes. Perfect rhymeshave their final stressed vowel and the following sound identical, as in sight and flight,deign and gain, madness and sadness [39]. General rhyme can refer to the rhyme betweenvarious kinds of phonetic similarity between words, as in “wing” and “caring”, “bend” and“ending”, “shake” and “hate”. In this thesis the focus in on imperfect rhymes. Rhymescan also be classified according to their position in the verse. We here focus on internalrhymes. The examples that follow come from Hirjee’s Master’s thesis [39].
5.3.1 Imperfect Rhymes
Imperfect rhyme is a type of rhyme formed by words with similar but not identical sounds.In most instances, either the vowel segments are different while the consonants are identical,or vice versa. Examples include:
When have I last looked onThe round green eyes and the long wavering bodies
Of the dark leopards of the moon? [96]
39
where “on” and “moon” are imperfect rhymes.
5.3.2 Internal Rhymes
Internal rhymes occurs when a word or phrase in the interior of a line rhymes with a wordor phrase at the end of a line, or within a different line. They are of the following types:chain rhymes, compound rhymes, and bridge rhymes.
Chain rhymes are consecutive words or phrases in which each rhymes with the pre-vious, as in:
New York City gritty committee pity the fool thatAct shitty in the midst of the calm the witty [60]
where “city”, “gritty”, “committee”, and “pity” participate in a chain since they allrhyme and follow each other contiguously
Compound rhymes are formed when two pairs of line internal rhymes overlap withina single line, as in:
Yo, I stick around like hockey, now what the puckCooler than fuck, maneuver like Vancouver Canucks [60]
where “maneuver” and “Vancouver” are found between “fuck” and “Canucks.”
Bridge rhymes are internal rhymes spanning two lines where both the members arenot line final, as in:
Still I be packin agilities unseenForreal-a my killin abilities unclean facilities. [60]
where “agilities” and “abilities” are bridge rhymes.
Link rhymes are internal rhymes spanning two lines where the first word or phrase isline-final, as in:
How I made it you salivated over my calibratedRaps that validated my ghetto credibility [60]
where “calibrated” and “validated” are link rhymes.
40

5.4 Data Definition
A specific focus of our project has been to rigorously define the two groups of songs thatwe wish to separate. We define hits as songs which made it to the Billboard Year-End Hot100 singles chart between 2008 and 2013, eliminating duplicate songs repeated across twoyears. This leaves 492 hits.
Far more challenging has been the definition of “flop.” With no “flops chart” it isdifficult to come to a consensus on this concept. Previous authors [63] have used the songsat the lower end of the top 100 year end charts as flops, but we believe that those songsare not flops since very popular songs of genres with relatively few listeners can end upin those positions. Hence, we conduct experiments on four different definitions of flops,ranging from broad to very narrow. The number of hits and flops in our data set for thefour definitions of flops is in Table 5.1.
Hits Flops TotalDefinition 1 492 6323 6815Definition 2 492 1131 1623Definition 3 92 234 326Definition 4 492 765 1257
Table 5.1: The number of hits and flops in our data set using the four definitions of flops.
For our first exploration, we start by defining a set of 57 artists who have had massive hitsongs in the 2008-2013 period. These “hit artists” include household American, Canadianand British names like Lady Gaga, Justin Bieber, and Adele. Fifteen of them are listed inTable 5.2. In this framework, a flop is a song released by a hit artist that did not reach thedefinition of “hit”. However, many artists include songs on their albums that cannot beexpected to be huge hits, so this definition of flop is broad: it does not take into accountsongs which could have become a hit had they received enough airplay time.
41
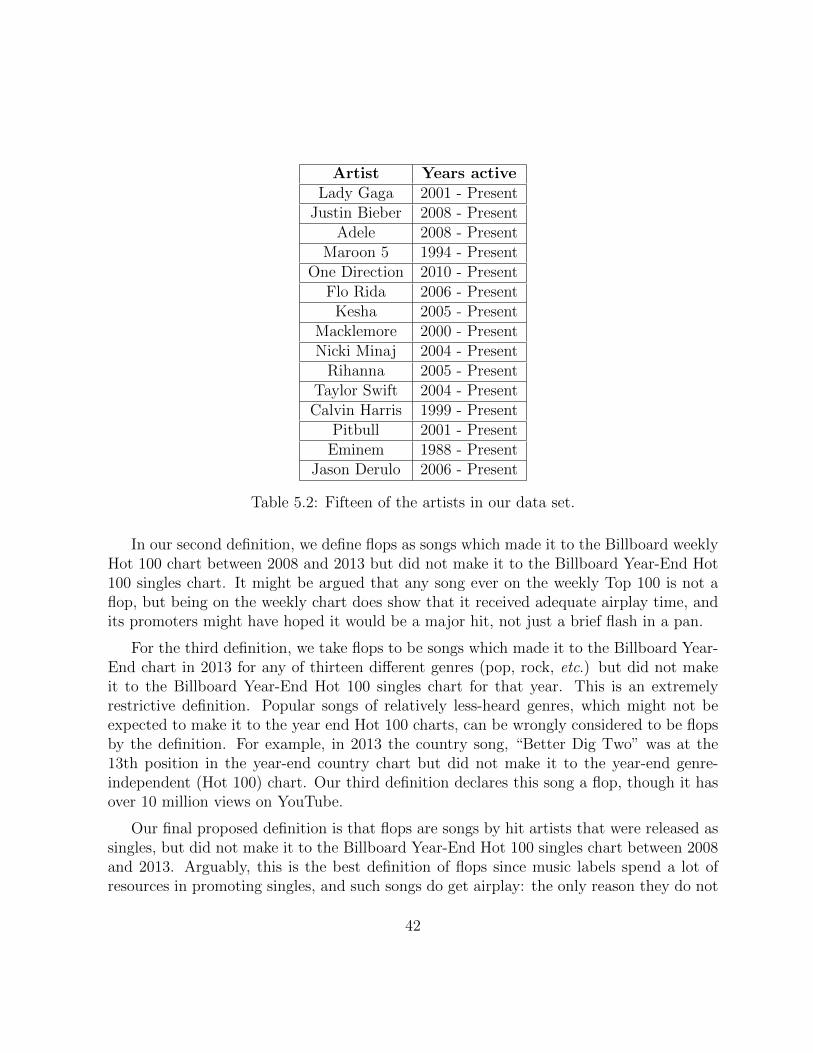
Artist Years activeLady Gaga 2001 - Present
Justin Bieber 2008 - PresentAdele 2008 - Present
Maroon 5 1994 - PresentOne Direction 2010 - Present
Flo Rida 2006 - PresentKesha 2005 - Present
Macklemore 2000 - PresentNicki Minaj 2004 - Present
Rihanna 2005 - PresentTaylor Swift 2004 - PresentCalvin Harris 1999 - Present
Pitbull 2001 - PresentEminem 1988 - Present
Jason Derulo 2006 - Present
Table 5.2: Fifteen of the artists in our data set.
In our second definition, we define flops as songs which made it to the Billboard weeklyHot 100 chart between 2008 and 2013 but did not make it to the Billboard Year-End Hot100 singles chart. It might be argued that any song ever on the weekly Top 100 is not aflop, but being on the weekly chart does show that it received adequate airplay time, andits promoters might have hoped it would be a major hit, not just a brief flash in a pan.
For the third definition, we take flops to be songs which made it to the Billboard Year-End chart in 2013 for any of thirteen different genres (pop, rock, etc.) but did not makeit to the Billboard Year-End Hot 100 singles chart for that year. This is an extremelyrestrictive definition. Popular songs of relatively less-heard genres, which might not beexpected to make it to the year end Hot 100 charts, can be wrongly considered to be flopsby the definition. For example, in 2013 the country song, “Better Dig Two” was at the13th position in the year-end country chart but did not make it to the year-end genre-independent (Hot 100) chart. Our third definition declares this song a flop, though it hasover 10 million views on YouTube.
Our final proposed definition is that flops are songs by hit artists that were released assingles, but did not make it to the Billboard Year-End Hot 100 singles chart between 2008and 2013. Arguably, this is the best definition of flops since music labels spend a lot ofresources in promoting singles, and such songs do get airplay: the only reason they do not
42

make it to the year end chart is because of negative response of listeners. On the otherhand, singles are much less relevant now than they once were [75].
For all songs, we obtained lyrics from a free online lyrics repository [57]. On manualinspection of the lyrics of flops we observe that the stored lyrics of flops that are shorterthan thirty lines are very noisy on lyrics websites, with misspellings, errors or repetitionsof meaningless syllables like “lalala”. It is hard to automatically predict rhyme featureson messy lyrics. Thus, we only study songs with at least thirty lines of lyrics. Sincealmost all the hits were greater than thirty lines we did not eliminate any based on theirlengths, though many short hits were hard to classify. We downloaded Billboard chartsfrom Billboard’s website [10], while the list of single releases of artists were obtained fromthe artists’ discography pages on Wikipedia [92].
5.5 Method
We use the complete set of 24 rhyme and syllable features of the Rhyme Analyzer [42], atool developed to analyze hip-hop lyrics, and that finds rhymes, including imperfect rhymes(like “time” rhyming with “line”) and internal rhymes (where both elements of a rhymingpair are not in line-final position), and calculates syllable features. The description of theseinternal rhymes is in Section 5.3. We refer the reader to Hirjee and Brown [43] for moreinformation about these features.
We use a total of 31 lyrics features, which are defined in Table 5.4. Lyrics, unlike prose,adhere to certain structure, and these features can both separate lyrics from prose andmay identify high-quality songmaking craftsmanship. We add seven new meter featuresidentifying the fraction of lines written in iambic, trochaic, spondaic, anapestic, dactylic,amphibrachic and pyrrhic meter, using the CMU Pronunciation Dictionary [28] to tran-scribe lyrics to a sequence of phonemes with indicated stress. In this framework, spondaicmeter indicates a line entirely of stressed syllables, and pyrrhic means line of entirely un-stressed syllables. The other meters have patterns with stressed and unstressed syllables.The stress pattern of the meter features we use can be found in Table 5.5. We use a totalof 31 lyric features, the definition of which can be found in Table 5.4. Lyrics, unlike prose,is expected to adhere to certain structure and these features separate lyrics from prose andcan be considered to be proxy for craftmanship. We use different definitions of flops, asdescribed in the previous section, and include no flops shorter than 30 lines.
Feature Definition
43
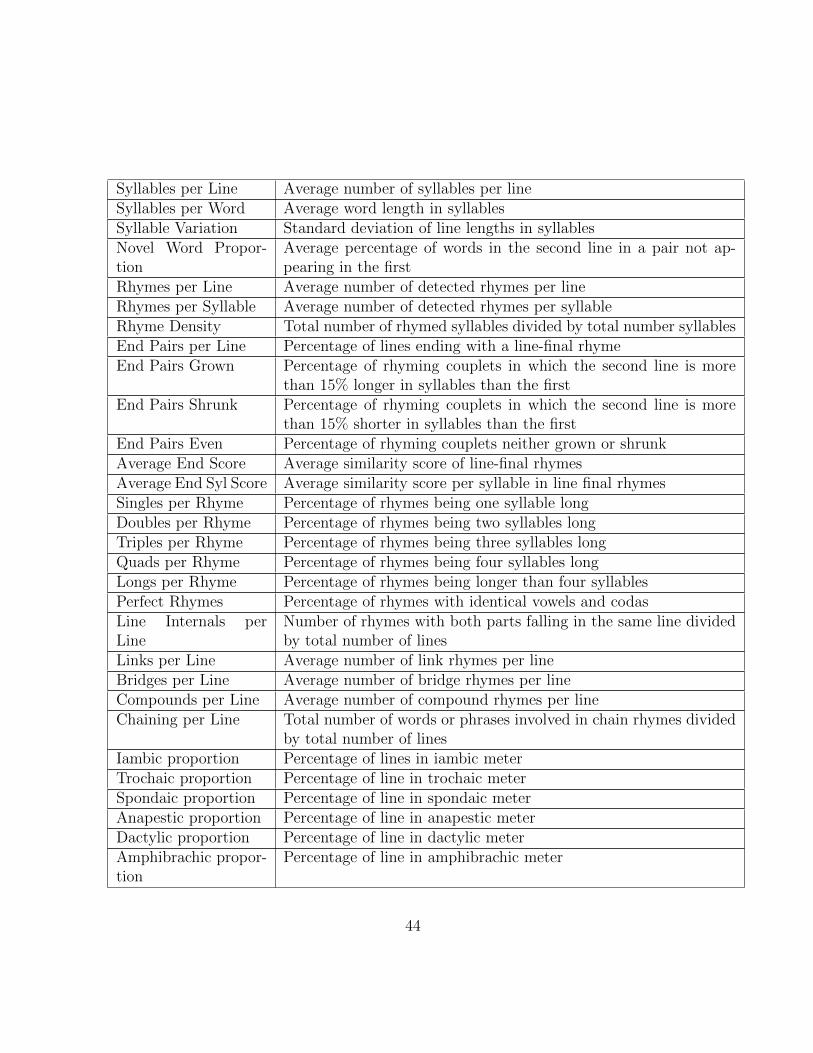
Syllables per Line Average number of syllables per lineSyllables per Word Average word length in syllablesSyllable Variation Standard deviation of line lengths in syllablesNovel Word Propor-tion
Average percentage of words in the second line in a pair not ap-pearing in the first
Rhymes per Line Average number of detected rhymes per lineRhymes per Syllable Average number of detected rhymes per syllableRhyme Density Total number of rhymed syllables divided by total number syllablesEnd Pairs per Line Percentage of lines ending with a line-final rhymeEnd Pairs Grown Percentage of rhyming couplets in which the second line is more
than 15% longer in syllables than the firstEnd Pairs Shrunk Percentage of rhyming couplets in which the second line is more
than 15% shorter in syllables than the firstEnd Pairs Even Percentage of rhyming couplets neither grown or shrunkAverage End Score Average similarity score of line-final rhymesAverage End Syl Score Average similarity score per syllable in line final rhymesSingles per Rhyme Percentage of rhymes being one syllable longDoubles per Rhyme Percentage of rhymes being two syllables longTriples per Rhyme Percentage of rhymes being three syllables longQuads per Rhyme Percentage of rhymes being four syllables longLongs per Rhyme Percentage of rhymes being longer than four syllablesPerfect Rhymes Percentage of rhymes with identical vowels and codasLine Internals perLine
Number of rhymes with both parts falling in the same line dividedby total number of lines
Links per Line Average number of link rhymes per lineBridges per Line Average number of bridge rhymes per lineCompounds per Line Average number of compound rhymes per lineChaining per Line Total number of words or phrases involved in chain rhymes divided
by total number of linesIambic proportion Percentage of lines in iambic meterTrochaic proportion Percentage of line in trochaic meterSpondaic proportion Percentage of line in spondaic meterAnapestic proportion Percentage of line in anapestic meterDactylic proportion Percentage of line in dactylic meterAmphibrachic propor-tion
Percentage of line in amphibrachic meter
44
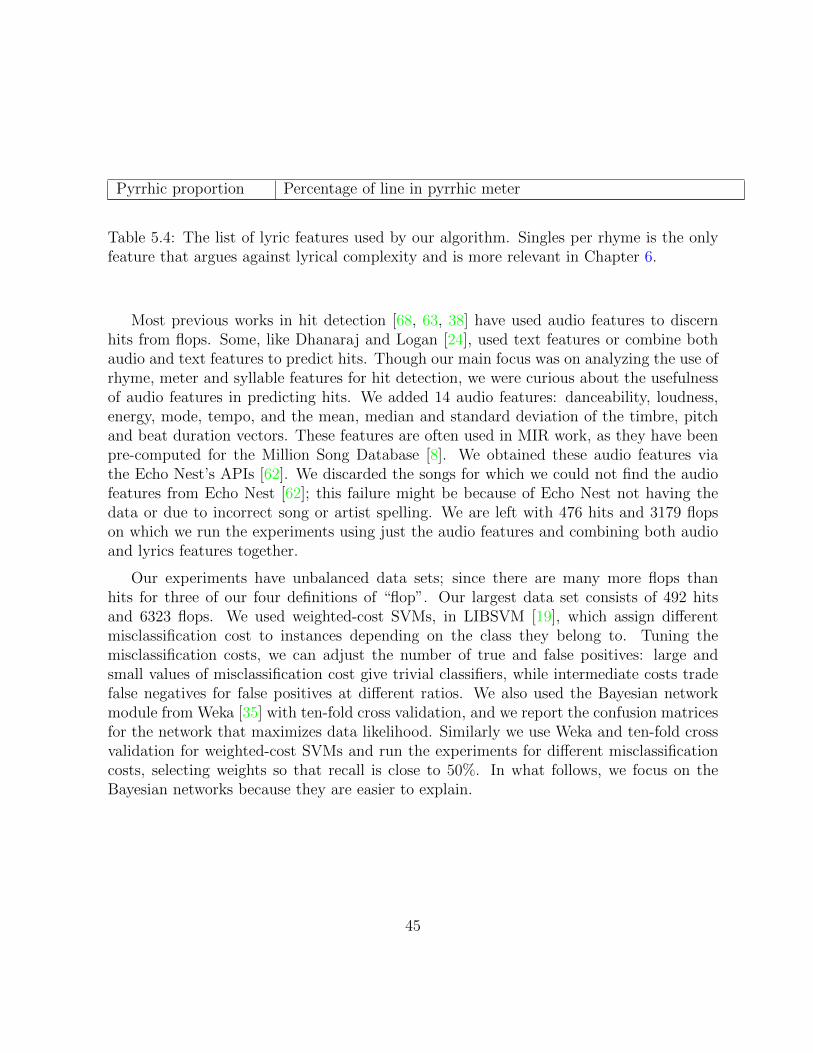
Pyrrhic proportion Percentage of line in pyrrhic meter
Table 5.4: The list of lyric features used by our algorithm. Singles per rhyme is the onlyfeature that argues against lyrical complexity and is more relevant in Chapter 6.
Most previous works in hit detection [68, 63, 38] have used audio features to discernhits from flops. Some, like Dhanaraj and Logan [24], used text features or combine bothaudio and text features to predict hits. Though our main focus was on analyzing the use ofrhyme, meter and syllable features for hit detection, we were curious about the usefulnessof audio features in predicting hits. We added 14 audio features: danceability, loudness,energy, mode, tempo, and the mean, median and standard deviation of the timbre, pitchand beat duration vectors. These features are often used in MIR work, as they have beenpre-computed for the Million Song Database [8]. We obtained these audio features viathe Echo Nest’s APIs [62]. We discarded the songs for which we could not find the audiofeatures from Echo Nest [62]; this failure might be because of Echo Nest not having thedata or due to incorrect song or artist spelling. We are left with 476 hits and 3179 flopson which we run the experiments using just the audio features and combining both audioand lyrics features together.
Our experiments have unbalanced data sets; since there are many more flops thanhits for three of our four definitions of “flop”. Our largest data set consists of 492 hitsand 6323 flops. We used weighted-cost SVMs, in LIBSVM [19], which assign differentmisclassification cost to instances depending on the class they belong to. Tuning themisclassification costs, we can adjust the number of true and false positives: large andsmall values of misclassification cost give trivial classifiers, while intermediate costs tradefalse negatives for false positives at different ratios. We also used the Bayesian networkmodule from Weka [35] with ten-fold cross validation, and we report the confusion matricesfor the network that maximizes data likelihood. Similarly we use Weka and ten-fold crossvalidation for weighted-cost SVMs and run the experiments for different misclassificationcosts, selecting weights so that recall is close to 50%. In what follows, we focus on theBayesian networks because they are easier to explain.
45

Meter Stress pattern
Iambic Unstressed + StressedTrochaic Stressed + UnstressedSpondaic Stressed + StressedAnapestic Unstressed + Unstressed + StressedDactylic Stressed + Unstressed + UnstressedAmphibrachic Unstressed + Stressed + UnstressedPyrrhic Unstressed + Unstressed
Table 5.5: Stress pattern in different meters.
5.6 Results
Lyrics features can quite effectively separate hits and flops. For our broadest definition offlops, we can correctly detect around half of the hits and misclassify just 12.8% of flops ashits. A summary of our results are in Tables 5.6 and 5.7.
Filters produced from lyrics features significantly outperform the best filter we can buildfor audio features, for all definitions of flops. Combining the audio and lyrics features givesus the best results, but they are not much better than the ones obtained solely using thelyrics features. We perform experiments for all the definitions of flops as defined in Section5.4. From our Bayesian network we find that our most important features are rhymesper line, rhyme density, end pairs shrunk, link and line internal rhymes per line, andthe audio feature of loudness. These features indicate that songs with lots of rhymes, inparticular complicated ones, are more likely to end up becoming hit. We argue that complexrhyme and meter is a detectable property of lyrics that indicates quality songmaking andartisanship and allows artists to become successful.
5.6.1 The Broadest Definition of Flop
In our first experiment, hits are songs which made it to the Billboard Year-End Hot 100singles chart between the years 2008-2013 while flops are songs by hit artists which did notmake it to the year-end chart. The results using a weighted-cost SVM and Bayes net isshown in Table 5.6 and 5.7 respectively. We are able to correctly detect around half of thehits and misclassify just 12.8% of flops as hits. A weighted-cost SVM outperforms Bayesian
46
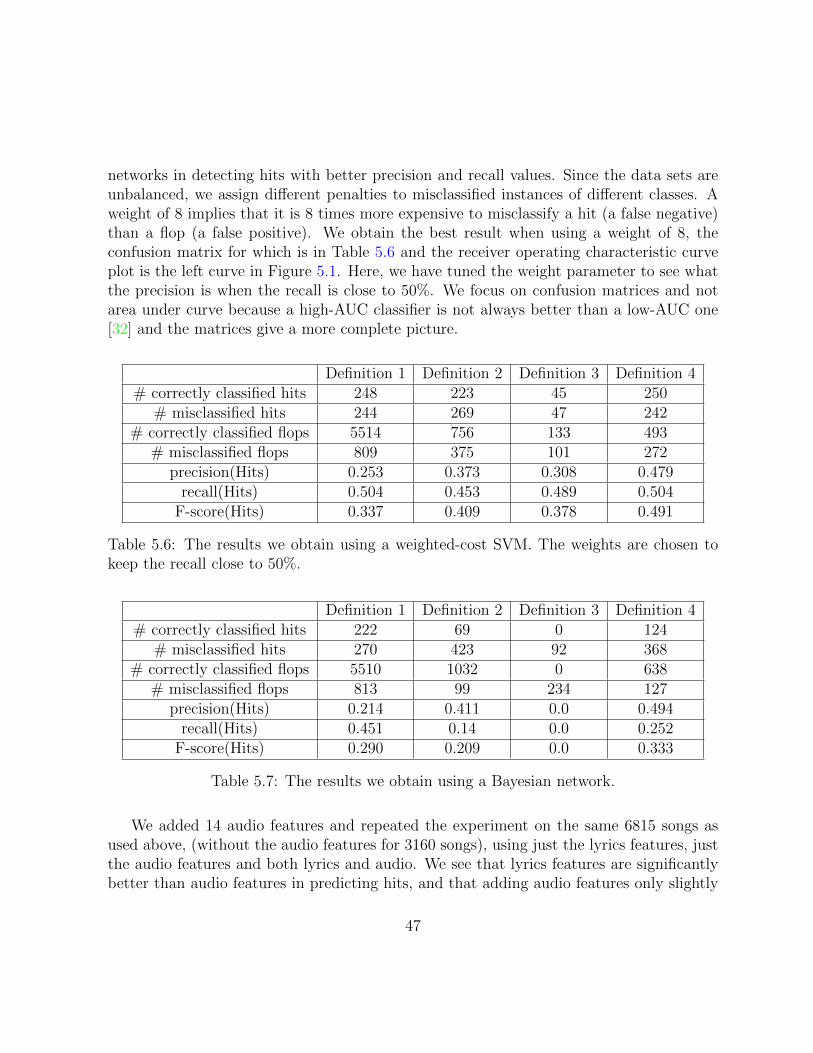
networks in detecting hits with better precision and recall values. Since the data sets areunbalanced, we assign different penalties to misclassified instances of different classes. Aweight of 8 implies that it is 8 times more expensive to misclassify a hit (a false negative)than a flop (a false positive). We obtain the best result when using a weight of 8, theconfusion matrix for which is in Table 5.6 and the receiver operating characteristic curveplot is the left curve in Figure 5.1. Here, we have tuned the weight parameter to see whatthe precision is when the recall is close to 50%. We focus on confusion matrices and notarea under curve because a high-AUC classifier is not always better than a low-AUC one[32] and the matrices give a more complete picture.
Definition 1 Definition 2 Definition 3 Definition 4# correctly classified hits 248 223 45 250
# misclassified hits 244 269 47 242# correctly classified flops 5514 756 133 493
# misclassified flops 809 375 101 272precision(Hits) 0.253 0.373 0.308 0.479
recall(Hits) 0.504 0.453 0.489 0.504F-score(Hits) 0.337 0.409 0.378 0.491
Table 5.6: The results we obtain using a weighted-cost SVM. The weights are chosen tokeep the recall close to 50%.
Definition 1 Definition 2 Definition 3 Definition 4# correctly classified hits 222 69 0 124
# misclassified hits 270 423 92 368# correctly classified flops 5510 1032 0 638
# misclassified flops 813 99 234 127precision(Hits) 0.214 0.411 0.0 0.494
recall(Hits) 0.451 0.14 0.0 0.252F-score(Hits) 0.290 0.209 0.0 0.333
Table 5.7: The results we obtain using a Bayesian network.
We added 14 audio features and repeated the experiment on the same 6815 songs asused above, (without the audio features for 3160 songs), using just the lyrics features, justthe audio features and both lyrics and audio. We see that lyrics features are significantlybetter than audio features in predicting hits, and that adding audio features only slightly
47
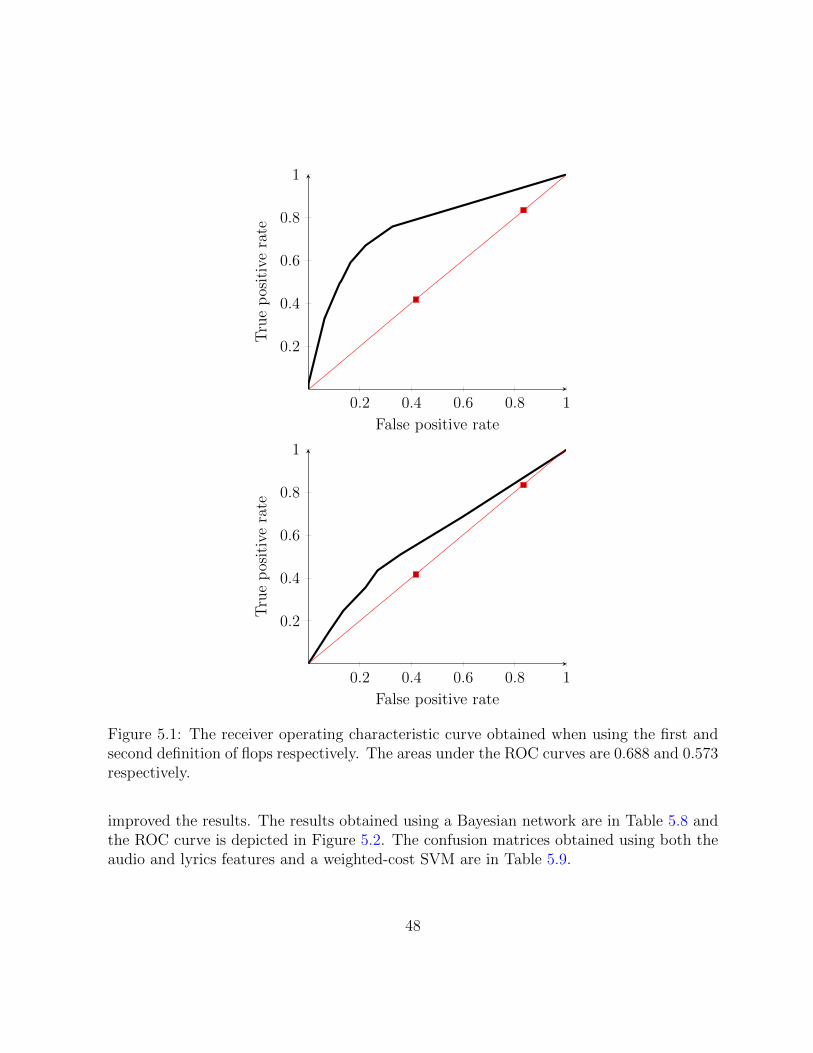
0.2 0.4 0.6 0.8 1
0.2
0.4
0.6
0.8
1
False positive rate
Tru
ep
osit
ive
rate
0.2 0.4 0.6 0.8 1
0.2
0.4
0.6
0.8
1
False positive rate
Tru
ep
osit
ive
rate
Figure 5.1: The receiver operating characteristic curve obtained when using the first andsecond definition of flops respectively. The areas under the ROC curves are 0.688 and 0.573respectively.
improved the results. The results obtained using a Bayesian network are in Table 5.8 andthe ROC curve is depicted in Figure 5.2. The confusion matrices obtained using both theaudio and lyrics features and a weighted-cost SVM are in Table 5.9.
48
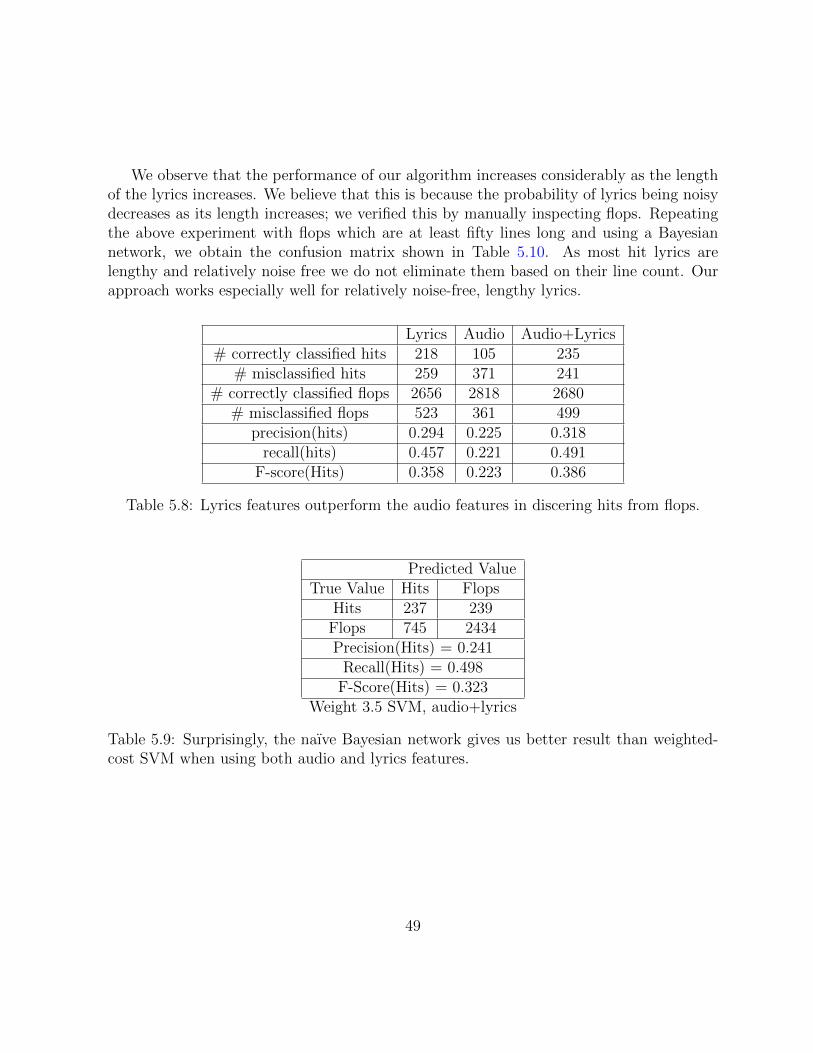
We observe that the performance of our algorithm increases considerably as the lengthof the lyrics increases. We believe that this is because the probability of lyrics being noisydecreases as its length increases; we verified this by manually inspecting flops. Repeatingthe above experiment with flops which are at least fifty lines long and using a Bayesiannetwork, we obtain the confusion matrix shown in Table 5.10. As most hit lyrics arelengthy and relatively noise free we do not eliminate them based on their line count. Ourapproach works especially well for relatively noise-free, lengthy lyrics.
Lyrics Audio Audio+Lyrics# correctly classified hits 218 105 235
# misclassified hits 259 371 241# correctly classified flops 2656 2818 2680
# misclassified flops 523 361 499precision(hits) 0.294 0.225 0.318
recall(hits) 0.457 0.221 0.491F-score(Hits) 0.358 0.223 0.386
Table 5.8: Lyrics features outperform the audio features in discering hits from flops.
Predicted ValueTrue Value Hits Flops
Hits 237 239Flops 745 2434Precision(Hits) = 0.241
Recall(Hits) = 0.498F-Score(Hits) = 0.323
Weight 3.5 SVM, audio+lyrics
Table 5.9: Surprisingly, the naıve Bayesian network gives us better result than weighted-cost SVM when using both audio and lyrics features.
49

0.2 0.4 0.6 0.8 1
0.2
0.4
0.6
0.8
1
False positive rate
Tru
ep
osit
ive
rate
Figure 5.2: The ROC curve obtained when using the first definition of flop and a weighted-cost SVM. The black and the red curves are obtained using the lyrics and audio featuresrespectively. The AUC using the lyrics and audio features is 0.692 and 0.572 respectively.
Predicted ValueTrue Value Hits Flops
Hits 218 274Flops 305 1780Precision(Hits) = 0.416
Recall(Hits) = 0.443F-Score(Hits) = 0.429
Bayesian network, Lyrics only
Table 5.10: We see a noticable improvement in performance with lyrics longer than 50lines, which are more accurate than the shorter ones. Compare to Table 5.7
5.6.2 The “Flash in a Pan” Definition of Flop
As noted earlier, the first definition of flop is broad as we classify songs with no airplaytime as flops. In this experiment, hits are songs which made it to the Billboard Year-EndHot 100 singles chart between the years 2008-2013, while flops are songs which made it tothe Billboard weekly Hot 100 chart between 2008 and 2013 but never rose to the Billboard
50
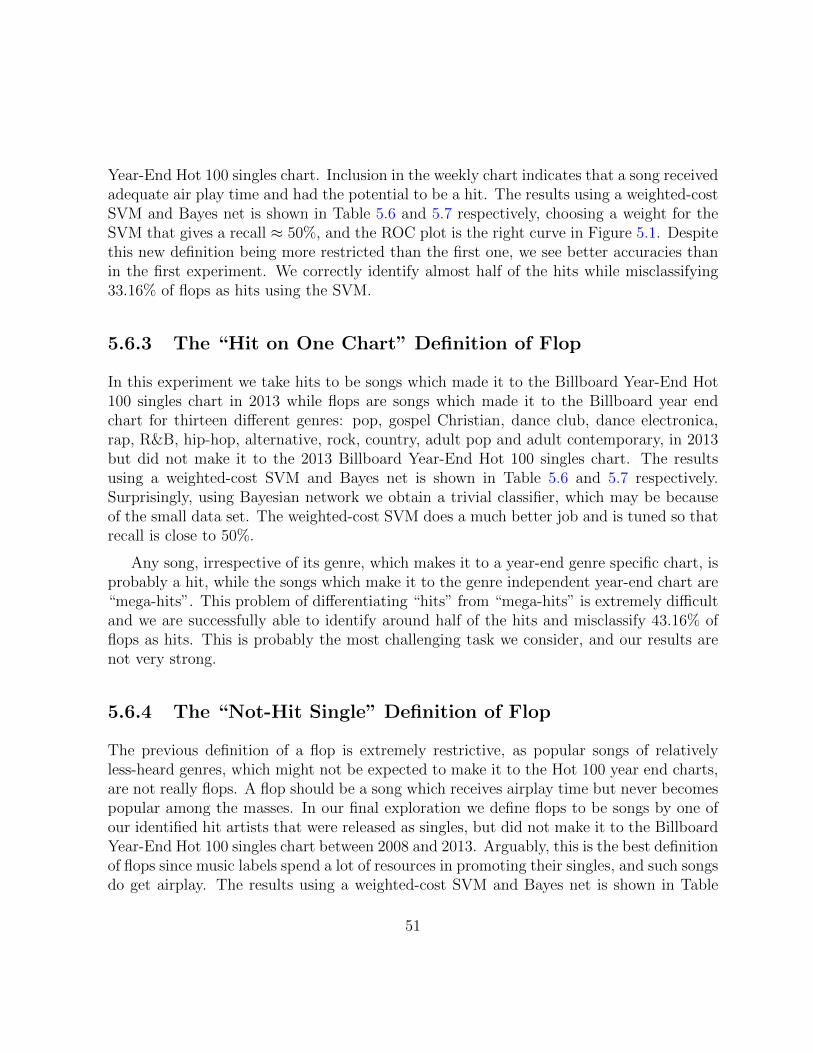
Year-End Hot 100 singles chart. Inclusion in the weekly chart indicates that a song receivedadequate air play time and had the potential to be a hit. The results using a weighted-costSVM and Bayes net is shown in Table 5.6 and 5.7 respectively, choosing a weight for theSVM that gives a recall ≈ 50%, and the ROC plot is the right curve in Figure 5.1. Despitethis new definition being more restricted than the first one, we see better accuracies thanin the first experiment. We correctly identify almost half of the hits while misclassifying33.16% of flops as hits using the SVM.
5.6.3 The “Hit on One Chart” Definition of Flop
In this experiment we take hits to be songs which made it to the Billboard Year-End Hot100 singles chart in 2013 while flops are songs which made it to the Billboard year endchart for thirteen different genres: pop, gospel Christian, dance club, dance electronica,rap, R&B, hip-hop, alternative, rock, country, adult pop and adult contemporary, in 2013but did not make it to the 2013 Billboard Year-End Hot 100 singles chart. The resultsusing a weighted-cost SVM and Bayes net is shown in Table 5.6 and 5.7 respectively.Surprisingly, using Bayesian network we obtain a trivial classifier, which may be becauseof the small data set. The weighted-cost SVM does a much better job and is tuned so thatrecall is close to 50%.
Any song, irrespective of its genre, which makes it to a year-end genre specific chart, isprobably a hit, while the songs which make it to the genre independent year-end chart are“mega-hits”. This problem of differentiating “hits” from “mega-hits” is extremely difficultand we are successfully able to identify around half of the hits and misclassify 43.16% offlops as hits. This is probably the most challenging task we consider, and our results arenot very strong.
5.6.4 The “Not-Hit Single” Definition of Flop
The previous definition of a flop is extremely restrictive, as popular songs of relativelyless-heard genres, which might not be expected to make it to the Hot 100 year end charts,are not really flops. A flop should be a song which receives airplay time but never becomespopular among the masses. In our final exploration we define flops to be songs by one ofour identified hit artists that were released as singles, but did not make it to the BillboardYear-End Hot 100 singles chart between 2008 and 2013. Arguably, this is the best definitionof flops since music labels spend a lot of resources in promoting their singles, and such songsdo get airplay. The results using a weighted-cost SVM and Bayes net is shown in Table
51

5.6 and 5.7 respectively, again choosing a weight for the SVM that gives us recall ≈ 50%.We correctly identify half of the hits while misclassifying only 35.56% of flops as hits.
5.7 What makes a song hit?
Feature % of hits % of flopsRhymes per line ≥ 3.016 18.08 6.17Rhyme density ≥ 0.594 15.44 5.19
End pairs shrunk ≥ 0.735 13.21 3.33Link rhymes per line ≥ 0.527 8.73 2.29
Line internal rhymes per line ≥ 1.618 17.68 5.72Loudness ≤ 12.909 24.8 10.0
Table 5.11: The most important features and their values for hit detection and the per-centage of hits and flops falling in that range.
Artist Correctly classified hits Misclassified hitsMaroon 5 Misery, Daylight, One More
NightPayphone, Moves Like Jagger
Adele Set Fire to the Rain, SomeoneLike You, Rumour Has It
Rolling in the Deep
Lady Gaga Bad Romance, Applause, JustDance
Born This Way, Paparazzi, Tele-phone
Leona Lewis Bleeding Love Better in Time
Table 5.12: The outcome of our algorithm on hits in our data set using the first definitionof flops for four popular artists.
Perhaps the most surprising, and indeed heartening, result from our experiments is thatrhyme, meter and lyrics matter in hit detection and that complexity is connected to beinga hit. By contrast, none of our audio features allow for an investigation of these parametersfor the musical part of a song. Surprisingly, loudness is the only important audio feature:very loud songs are more likely to end up as flops. Table 5.11 lists some of the mostimportant features, their boundary values for the hit detection, and the percentage of hitsand flops falling in that range using the Bayesian network coming from our first definition
52
of flops. For example, “One More Night,” a very popular song by Maroon 5, is correctlyidentified as a hit because of the presence of frequent complicated rhymes. “Payphone,”another popular Maroon 5 song is misclassified as a flop due its comparative simplicity.Similarly, extremely popular songs like “Rolling in the Deep,” “Born this Way,” etc. aremisclassified as flops due to their fewer, rhymes. These songs may have hit for otherreasons, of course. Table 5.12 lists the outcome of our algorithm on hits in our data setfor four popular artists.
We do not claim that the presence of these features make a hit, we simply assertcorrelation. Again, as noted in the introduction, our features cannot identify songs withclever videos, terrific performers, or with a groundswell of social media support. But theycan identify clever lyrics, and this alone does seem to be influential in the success of hitsongs.
5.8 Conclusion: Lyrics Complexity and Craftmanship
We introduced our hit detection model in this chapter. We have used 31 rhyme, syllable andmeter features for hit song detection, an important and largely unsolved, music informationretrieval task. Our lyrics features significantly outperform 14 audio features for this task.Combing the lyrics and audio features gives us slightly better results.
We see that the presence of lots of rhymes, in particular complicated ones, makes itmore likely that the song will be a hit. We assert correlation between the presence of thesefeatures and the probability of a song being a hit . The rhyme and meter features we useis indicative of craftmanship and the amount of effort put into songmaking. It is difficultto come up with audio features which can act as a proxy for the effort put in a song, andhence we believe that lyrics features are more powerful than the audio ones in discerninghits from flops. We argue that complex rhyme and meter is a detectable property of lyricsthat indicates quality songmaking and artisanship and allows artists to become successful.An obvious drawback of this approach is that we cannot predict if the outcome of a coveror remake of a song is going to be any different from the original song, since they sharelyrics.
53
Chapter 6
Lyrics Complexity and Shazam
6.1 Introduction
Shazam (shazam.com), is a music recognition service that analyzes a captured 10 secondclip of a song, matching its acoustic fingerprint in a database of more than 11 million songs.It has been used to identify over 15 billion songs by its over 500 million users [23]. Peopleshazam songs they like but do not know yet. Typically, these are songs someone else playsfor them and for which they do not have access to the title and artist information. Shazamis presumably not used by listeners of streaming music services like Spotify or video serviceslike YouTube where the artist or title information is needed if we want to listen to a song.It is unlikely that people listening to songs on their phones or media players would beshazaming a song since they just need to look at the screen to get the song information.Likely scenarios where people shazam songs could include songs played at a nightclub orgym or on the radio [58]. For a song to be shazamed it needs some exposure, and thenumber of shazams can be used to identify if an exposed song is being received favourably[58].
Why do people use a service like Shazam? Presumably, people shazam songs theylike, but are unaware of, so that they can listen to them later. Such songs could be byrelatively unknown upcoming artists. Popular artists have a distinct voice and style whichthe masses are already aware of. For example, “Let Her Go” by Passenger, who wasrelatively unknown before this song, has over 16 million shazams, while “Shake it Off” byTaylor Swift, one of the most successful current popular singers in the world, has just morethan 3.5 million Shazams. Both these songs occupy roughly the same position on the 2014Billboard Year-End Hot 100 chart [11].
54
In fact, this pattern is broader: on manual inspection, we see that a majority of thesongs in the Shazam Hall of Fame [67] are first hits, where “first hit” of an artist is thatartist’s first song to reach the Billboard’s Year-End Hot 100 singles chart. Also surprisingis that many songs with lots of shazams do not in fact become hits at all (again defininghits as songs on the Billboard’s Year-End Hot 100 singles chart). For example, “Take Meto Church,” by Hozier and “Jubel,” by Klingande have never made it to the Billboard’sYear-End Hot 100 chart, though the former looks likely to do so for 2015.
Can we identify features that cause users to more likely to shazam a song? We solelyfocus on song lyrics in our answer, for all of the reasons discussed in our previous chapters.Additionally, songs with catchy lyrics may be more likely to rise above the background andhave listeners shazam them. We use the complete set of 24 rhyme and syllable features ofthe Rhyme Analyzer [42], and add the seven new meter features identifying the fraction oflines written in a particular meter, as discussed in Chapter 5.
We hypothesize that we can separate hits from the Hall of Fame songs using thesefeatures. If so, perhaps the features separating the two classes could be used by relativelyunknown artists to break out and become successful. These features make these more-oftenshazamed songs stand out from the background, and are part of the reason why peopleshazam them. Obviously, songs will still require a fair amount of exposure.
We use standard machine-learning algorithms, such as weighted support vector machine[19] and Bayesian network classifiers from Weka [35] to separate Shazam Hall of Fame andhit songs. We employ ten-fold cross validation. The SVM outperforms the Bayesiannetwork, and is able to identify 54.41% of Hall of Fame songs and misclassify 18.51% hitsas belonging to Hall of Fame. Our Bayesian Network suggests that lyrics with lots ofrhymes, in particular complicated ones, are more likely to end up in the Shazam Hall ofFame. Using linear regression to build a model that can predict the number of shazamsfor a song, we find that models that include a measure of lyrical complexity that we definehere as one of their features are better at predicting the number of shazams than modelswhich does not use the lyrics complexity feature. Hence, this shows that complex lyricsdoes play an important role in determining whether a song is going to stand out and getnoticed.
In Chapter 5, the focus is on craftmanship and how writing complex lyrics with lotsof rhymes, in particular complicated internal and imperfect rhymes, make it more likelythat the song will end up becoming a hit. In this chapter, our focus is on noticeabilityor catchiness. We focus on how an upcoming artist can rise about the “sonic wallpaper,”get noticed and shazamed and become successful. Obviously, the common theme acrossboth of these is that lyrics matter and complex rhyme and meter is a detectable property
55
of lyrics that indicates quality songmaking and artisanship and allows artists to becomesuccessful.
A limitation of focusing on lyrics is that it prevents us from distinguishing good andbad covers and remixes of the same song by different artists. Similarly, a song might beshazamed more because of catchy tune or beats but our method cannot detect that.
We are not aware of work on what makes a song catchy in the sense that Shazamcapitalizes upon. An unique aspect of our work here is the advice we have for upcom-ing singers, regrding the rhyme usage in their lyrics they need to break out and becomesuccessful, which we present in Section 6.7.
6.2 Related Work
As mentioned in Chapter 5, Hirjee and Brown [40] came up with a probabilistic model toidentify rhymes in song lyrics based on the different rhyming patterns found in hip-hop. Inour work, we use the features of the Rhyme Analyzer [42] software from their work. Smithet al. [80], make use of TF-IDF weighting to find typical phrases and rhyme pairs in songlyrics and conclude that typical number one hits, on average, are more cliched.
We in Chapter 5, have used the rhyme, meter and syllable features from the RhymeAnalyzer to separate hits from flops. We conclude that for purposes of hit identification,the rhyme complexity may in fact be a proxy for high-effort song writing and quality ofartisanship
Matt Bailey, from Coleman Insights, [58] analyzed 16 weeks of U.S. Shazam charts andconcluded that songs tend to peak on Shazam after sales but before radio exposure andon-demand listening. He concluded that the most high impact use of Shazam is to seewhich of the new exposed songs are sparking the greatest interest from listeners. He wasinconclusive about Shazam’s ability to make a hit.
6.3 Data
As in Chapter 5, we define hits as songs from the Billboard Year-End Hot 100 singleschart in the years 2008-2014 not present in the Shazam Hall of Fame. The Shazam Hallof Fame has songs which have been shazamed over 5 million times. It is further dividedinto three categories: platinum (15 million+ shazams), gold (10 million+ shazams) and
56

silver (5 million+ shazams). At the time of the study there were 81 English-language and1 Spanish-language song in the Hall of Fame. As noted earlier, most songs in the Hall ofFame are first hits by their artists such as Adele’s first hit, “Rolling in the Deep”. Someof the most popular current artists like Lady Gaga and Coldplay have no songs in the Hallof Fame.
We started with 81 English Hall of Fame songs and 508 hits. For all songs, we obtainedlyrics from a free online lyrics repository (metrolyrics.com). We removed songs with lyricsless than 30 lines long since it is hard to predict rhyme features on such short lyrics, partlybecause they are also usually messy in their transcriptions [79]. We were left with 68 Hallof Fame songs and 389 hits. We downloaded Billboard Year-end charts from billboard.comwhile the number of shazams for a song was provided by Shazam.
6.4 Method
As described in Chapter 5, we use 31 rhyme, syllable and meter features. We used thecomplete set of 24 rhyme and syllable features of the Rhyme Analyzer [42] and added sevennew meter features. These features separate lyrics from prose and could be consideredproxy for skilled lyric writing, particularly given their previous use in separating hits fromflops [79]. We refer the reader to Section 5.5 for more details on the features used.
We used a weighted-cost SVM, from LIBSVM [19], from Weka [35], with ten-fold crossvalidation. It assigns different misclassification cost to instances depending on the classthey belong to which helps with unbalanced data sets. Tuning the misclassification costs,we can adjust the number of true and false positives: large and small values of misclassi-fication cost give trivial classifiers, while intermediate costs trade false negatives for falsepositives. We also used the Bayesian network module from Weka with ten-fold cross valida-tion, and we report the confusion matrices for the network that maximizes data likelihood.
6.4.1 Lyrics Complexity
We define lyrics complexity to be the sum of the normalized values of our rhyme, meterand syllable features. For each feature, its contribution to the total lyrical complexitymeasure ranges between 0 (if the feature is at its minimum value) and +1 (if the featureis at its maximum). We here have employed feature scaling, where each feature has thesame weight to calculate the complexity of the song. Since we have 31 rhyme, meter andsyllable features, the lyrical complexity of a song can range from 0 - 31. Using normalizing
57
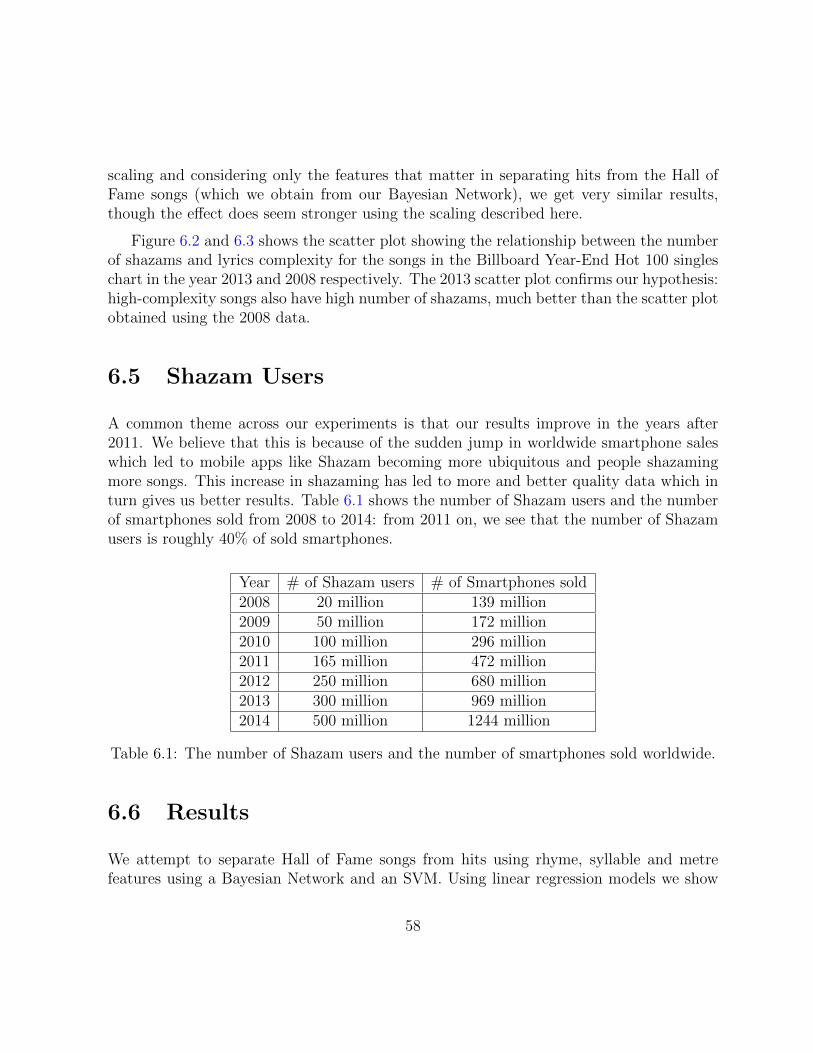
scaling and considering only the features that matter in separating hits from the Hall ofFame songs (which we obtain from our Bayesian Network), we get very similar results,though the effect does seem stronger using the scaling described here.
Figure 6.2 and 6.3 shows the scatter plot showing the relationship between the numberof shazams and lyrics complexity for the songs in the Billboard Year-End Hot 100 singleschart in the year 2013 and 2008 respectively. The 2013 scatter plot confirms our hypothesis:high-complexity songs also have high number of shazams, much better than the scatter plotobtained using the 2008 data.
6.5 Shazam Users
A common theme across our experiments is that our results improve in the years after2011. We believe that this is because of the sudden jump in worldwide smartphone saleswhich led to mobile apps like Shazam becoming more ubiquitous and people shazamingmore songs. This increase in shazaming has led to more and better quality data which inturn gives us better results. Table 6.1 shows the number of Shazam users and the numberof smartphones sold from 2008 to 2014: from 2011 on, we see that the number of Shazamusers is roughly 40% of sold smartphones.
Year # of Shazam users # of Smartphones sold2008 20 million 139 million2009 50 million 172 million2010 100 million 296 million2011 165 million 472 million2012 250 million 680 million2013 300 million 969 million2014 500 million 1244 million
Table 6.1: The number of Shazam users and the number of smartphones sold worldwide.
6.6 Results
We attempt to separate Hall of Fame songs from hits using rhyme, syllable and metrefeatures using a Bayesian Network and an SVM. Using linear regression models we show
58
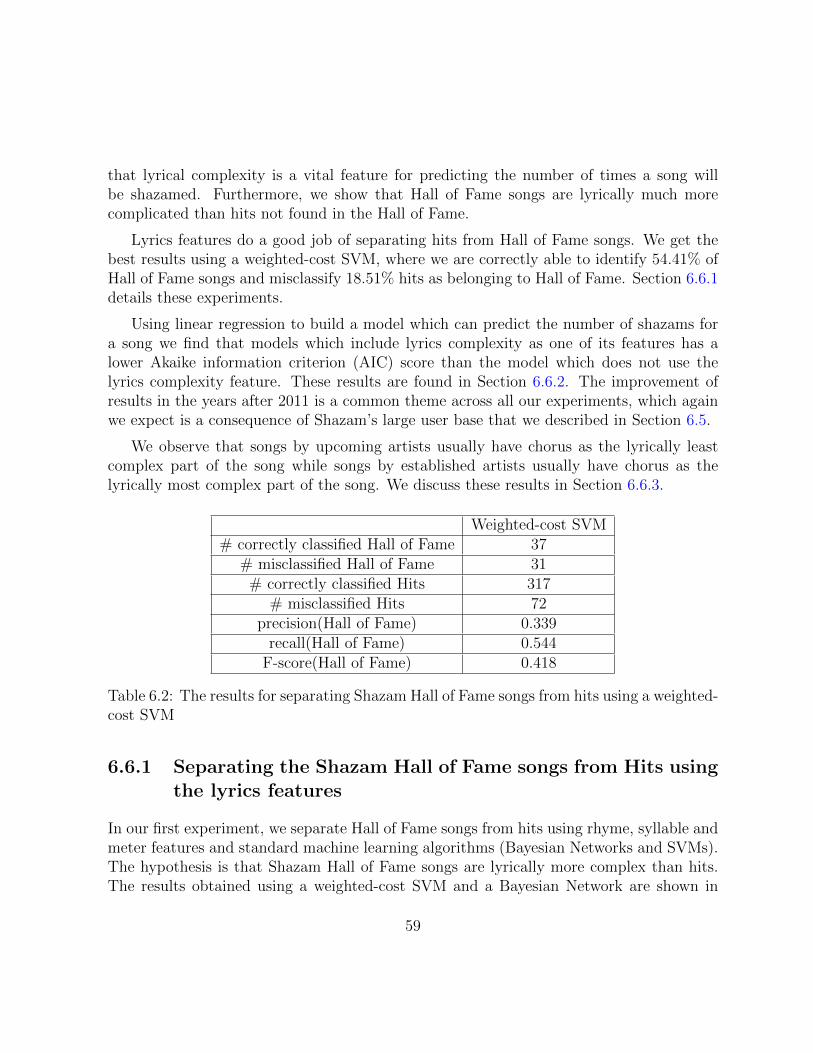
that lyrical complexity is a vital feature for predicting the number of times a song willbe shazamed. Furthermore, we show that Hall of Fame songs are lyrically much morecomplicated than hits not found in the Hall of Fame.
Lyrics features do a good job of separating hits from Hall of Fame songs. We get thebest results using a weighted-cost SVM, where we are correctly able to identify 54.41% ofHall of Fame songs and misclassify 18.51% hits as belonging to Hall of Fame. Section 6.6.1details these experiments.
Using linear regression to build a model which can predict the number of shazams fora song we find that models which include lyrics complexity as one of its features has alower Akaike information criterion (AIC) score than the model which does not use thelyrics complexity feature. These results are found in Section 6.6.2. The improvement ofresults in the years after 2011 is a common theme across all our experiments, which againwe expect is a consequence of Shazam’s large user base that we described in Section 6.5.
We observe that songs by upcoming artists usually have chorus as the lyrically leastcomplex part of the song while songs by established artists usually have chorus as thelyrically most complex part of the song. We discuss these results in Section 6.6.3.
Weighted-cost SVM# correctly classified Hall of Fame 37
# misclassified Hall of Fame 31# correctly classified Hits 317
# misclassified Hits 72precision(Hall of Fame) 0.339
recall(Hall of Fame) 0.544F-score(Hall of Fame) 0.418
Table 6.2: The results for separating Shazam Hall of Fame songs from hits using a weighted-cost SVM
6.6.1 Separating the Shazam Hall of Fame songs from Hits usingthe lyrics features
In our first experiment, we separate Hall of Fame songs from hits using rhyme, syllable andmeter features and standard machine learning algorithms (Bayesian Networks and SVMs).The hypothesis is that Shazam Hall of Fame songs are lyrically more complex than hits.The results obtained using a weighted-cost SVM and a Bayesian Network are shown in
59

Tables 6.2 and 6.3 respectively. A weighted-cost SVM outperforms Bayesian networks indetecting Hall of Fame songs with better precision and recall values. As in Chapter 5, weassign different penalties to misclassified instances of different classes. A weight of 8 impliesthat it is 8 times more expensive to misclassify a Hall of Fame song (a false negative) thana hit (a false positive) from the training set. We obtain the best result when using a weightof 3.4, for which results are in Table 5.6: the weight parameter is tuned to see what theprecision is when the recall is close to 50%.
Bayesian Network# correctly classified Hall of Fame 19
# misclassified Hall of Fame 49# correctly classified Hits 356
# misclassified Hits 33precision(Hall of Fame) 0.365
recall(Hall of Fame) 0.279F-score(Hall of Fame) 0.316
Table 6.3: The results for separating Shazam Hall of Fame songs from hits using a BayesianNetwork. The SVM does a better job at predicting hits, though the Bayes Net classifier ismore stringent
Shazam Hall of Fame songs are lyrically more complicated, though other features doplay some role. From our Bayesian network we find that our most important featuresare features like syllables per line, end pairs shrunk and syllable variation which highlightline length and its variation across the lyrics; features like rhymes per line and rhymesper syllable which account for the frequency of rhymes in the lyrics; and features likelink rhymes per line, bridge rhymes per line and compound rhymes per line highlight thecomplex rhyming strategy. As in Chapter 5, the Bayesian network we obtain from Wekais naıve Bayes: the effect of one feature is independent of another. The definition of thesefeatures is in Table 5.4.
In our earlier work, presented as Chapter 5 of this thesis, we concluded that hits arelyrically more complicated than flops, having frequent complicated rhymes. Hall of Famesongs are even more complicated than hits. Since most of the songs in the Hall of Fameare first hits, we conclude that for an upcoming artist to break out and become successful,one good route is to write lyrically complicated lyrics with lots of complex rhymes.
There are some first hits with high chart position but surprisingly few shazams, suchas “Whatever it is,” by Zac Brown Band. It is his first hit, occupies the 94th position on
60
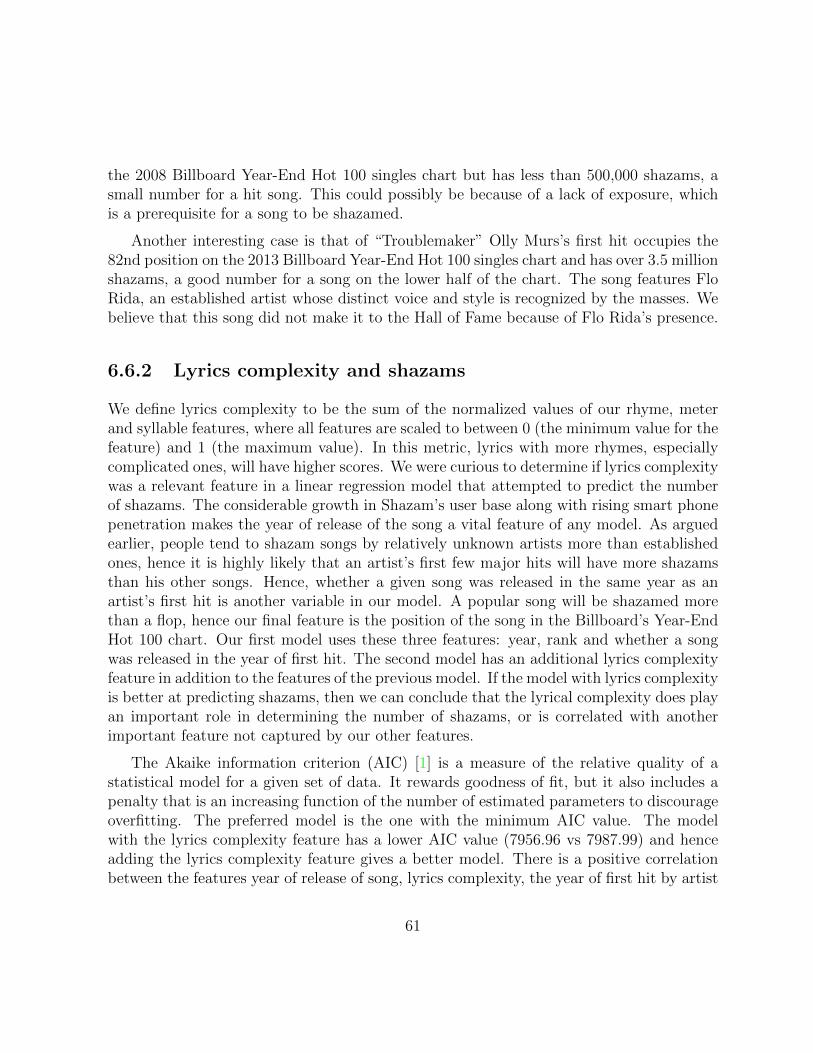
the 2008 Billboard Year-End Hot 100 singles chart but has less than 500,000 shazams, asmall number for a hit song. This could possibly be because of a lack of exposure, whichis a prerequisite for a song to be shazamed.
Another interesting case is that of “Troublemaker” Olly Murs’s first hit occupies the82nd position on the 2013 Billboard Year-End Hot 100 singles chart and has over 3.5 millionshazams, a good number for a song on the lower half of the chart. The song features FloRida, an established artist whose distinct voice and style is recognized by the masses. Webelieve that this song did not make it to the Hall of Fame because of Flo Rida’s presence.
6.6.2 Lyrics complexity and shazams
We define lyrics complexity to be the sum of the normalized values of our rhyme, meterand syllable features, where all features are scaled to between 0 (the minimum value for thefeature) and 1 (the maximum value). In this metric, lyrics with more rhymes, especiallycomplicated ones, will have higher scores. We were curious to determine if lyrics complexitywas a relevant feature in a linear regression model that attempted to predict the numberof shazams. The considerable growth in Shazam’s user base along with rising smart phonepenetration makes the year of release of the song a vital feature of any model. As arguedearlier, people tend to shazam songs by relatively unknown artists more than establishedones, hence it is highly likely that an artist’s first few major hits will have more shazamsthan his other songs. Hence, whether a given song was released in the same year as anartist’s first hit is another variable in our model. A popular song will be shazamed morethan a flop, hence our final feature is the position of the song in the Billboard’s Year-EndHot 100 chart. Our first model uses these three features: year, rank and whether a songwas released in the year of first hit. The second model has an additional lyrics complexityfeature in addition to the features of the previous model. If the model with lyrics complexityis better at predicting shazams, then we can conclude that the lyrical complexity does playan important role in determining the number of shazams, or is correlated with anotherimportant feature not captured by our other features.
The Akaike information criterion (AIC) [1] is a measure of the relative quality of astatistical model for a given set of data. It rewards goodness of fit, but it also includes apenalty that is an increasing function of the number of estimated parameters to discourageoverfitting. The preferred model is the one with the minimum AIC value. The modelwith the lyrics complexity feature has a lower AIC value (7956.96 vs 7987.99) and henceadding the lyrics complexity feature gives a better model. There is a positive correlationbetween the features year of release of song, lyrics complexity, the year of first hit by artist
61

Figure 6.1: An overlapped histogram of the lyrics complexity of the hits and Hall ofFame songs. The red coloured part is the histogram for the Hall of Fame songs while thehistogram for hits is coloured green. Despite having far more hits than Hall of Fame songs,the majority of songs with lyric complexity measure greater than 8 are from the Hall ofFame. The overlapped portion is coloured dark green.
62
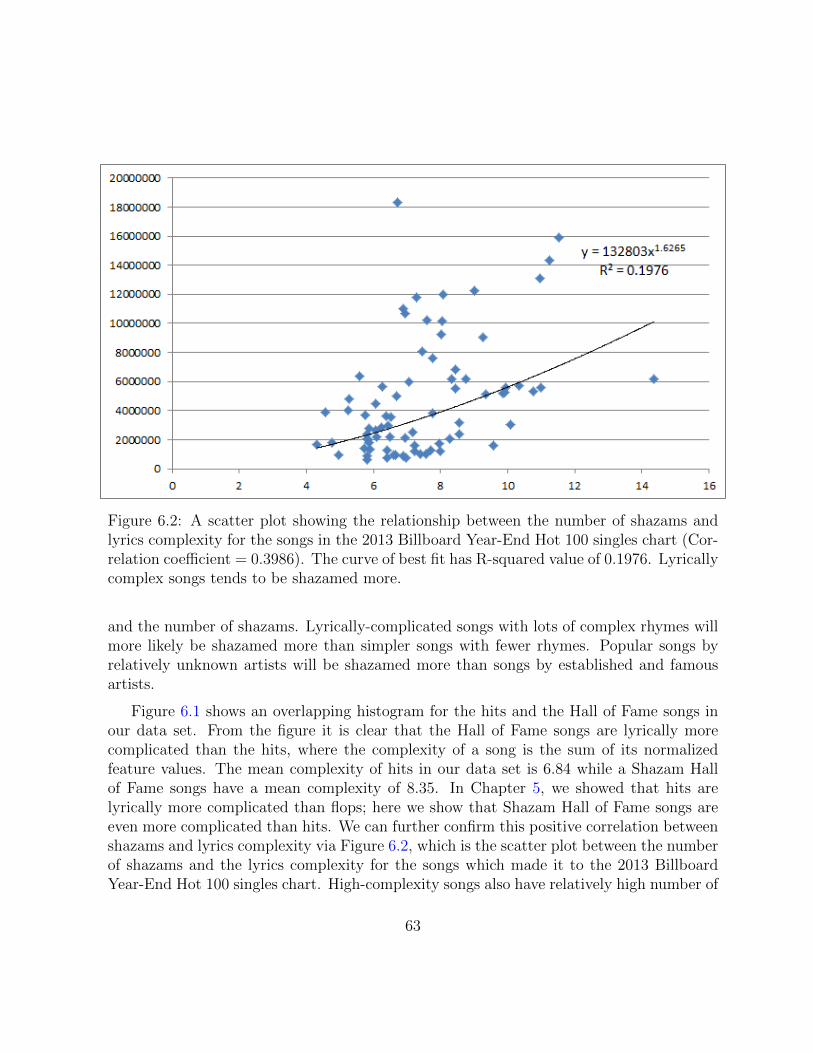
Figure 6.2: A scatter plot showing the relationship between the number of shazams andlyrics complexity for the songs in the 2013 Billboard Year-End Hot 100 singles chart (Cor-relation coefficient = 0.3986). The curve of best fit has R-squared value of 0.1976. Lyricallycomplex songs tends to be shazamed more.
and the number of shazams. Lyrically-complicated songs with lots of complex rhymes willmore likely be shazamed more than simpler songs with fewer rhymes. Popular songs byrelatively unknown artists will be shazamed more than songs by established and famousartists.
Figure 6.1 shows an overlapping histogram for the hits and the Hall of Fame songs inour data set. From the figure it is clear that the Hall of Fame songs are lyrically morecomplicated than the hits, where the complexity of a song is the sum of its normalizedfeature values. The mean complexity of hits in our data set is 6.84 while a Shazam Hallof Fame songs have a mean complexity of 8.35. In Chapter 5, we showed that hits arelyrically more complicated than flops; here we show that Shazam Hall of Fame songs areeven more complicated than hits. We can further confirm this positive correlation betweenshazams and lyrics complexity via Figure 6.2, which is the scatter plot between the numberof shazams and the lyrics complexity for the songs which made it to the 2013 BillboardYear-End Hot 100 singles chart. High-complexity songs also have relatively high number of
63
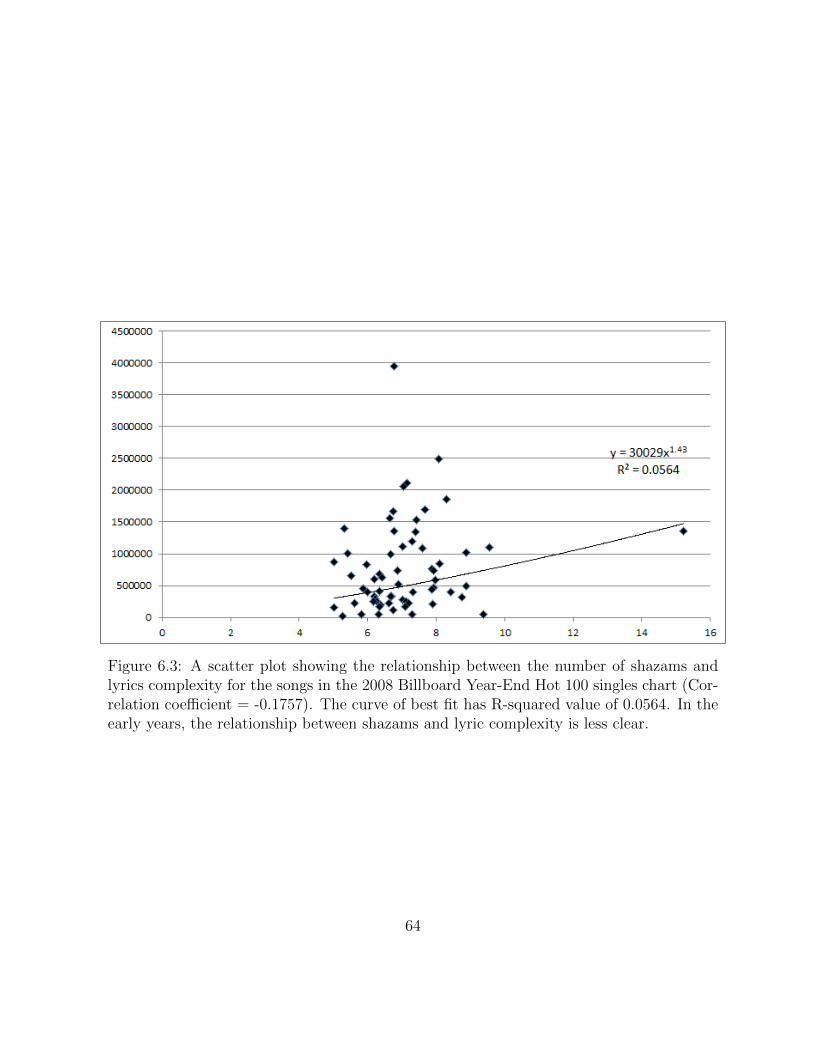
Figure 6.3: A scatter plot showing the relationship between the number of shazams andlyrics complexity for the songs in the 2008 Billboard Year-End Hot 100 singles chart (Cor-relation coefficient = -0.1757). The curve of best fit has R-squared value of 0.0564. In theearly years, the relationship between shazams and lyric complexity is less clear.
64
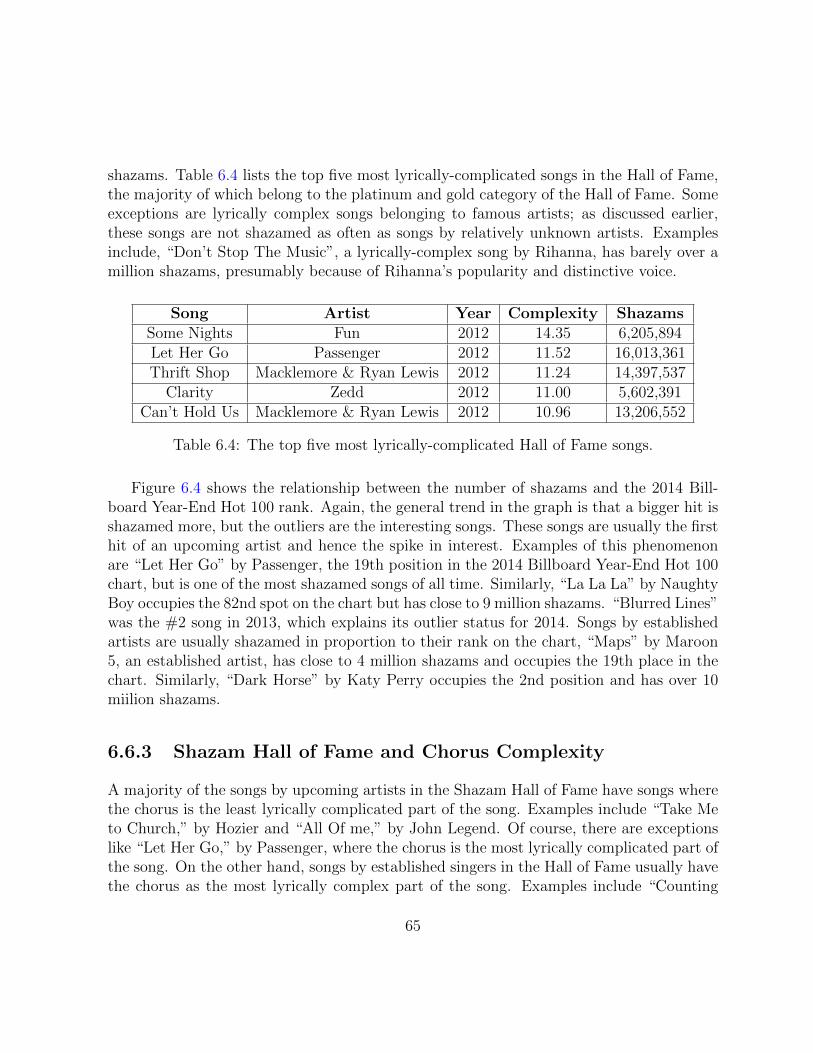
shazams. Table 6.4 lists the top five most lyrically-complicated songs in the Hall of Fame,the majority of which belong to the platinum and gold category of the Hall of Fame. Someexceptions are lyrically complex songs belonging to famous artists; as discussed earlier,these songs are not shazamed as often as songs by relatively unknown artists. Examplesinclude, “Don’t Stop The Music”, a lyrically-complex song by Rihanna, has barely over amillion shazams, presumably because of Rihanna’s popularity and distinctive voice.
Song Artist Year Complexity ShazamsSome Nights Fun 2012 14.35 6,205,894Let Her Go Passenger 2012 11.52 16,013,361Thrift Shop Macklemore & Ryan Lewis 2012 11.24 14,397,537
Clarity Zedd 2012 11.00 5,602,391Can’t Hold Us Macklemore & Ryan Lewis 2012 10.96 13,206,552
Table 6.4: The top five most lyrically-complicated Hall of Fame songs.
Figure 6.4 shows the relationship between the number of shazams and the 2014 Bill-board Year-End Hot 100 rank. Again, the general trend in the graph is that a bigger hit isshazamed more, but the outliers are the interesting songs. These songs are usually the firsthit of an upcoming artist and hence the spike in interest. Examples of this phenomenonare “Let Her Go” by Passenger, the 19th position in the 2014 Billboard Year-End Hot 100chart, but is one of the most shazamed songs of all time. Similarly, “La La La” by NaughtyBoy occupies the 82nd spot on the chart but has close to 9 million shazams. “Blurred Lines”was the #2 song in 2013, which explains its outlier status for 2014. Songs by establishedartists are usually shazamed in proportion to their rank on the chart, “Maps” by Maroon5, an established artist, has close to 4 million shazams and occupies the 19th place in thechart. Similarly, “Dark Horse” by Katy Perry occupies the 2nd position and has over 10miilion shazams.
6.6.3 Shazam Hall of Fame and Chorus Complexity
A majority of the songs by upcoming artists in the Shazam Hall of Fame have songs wherethe chorus is the least lyrically complicated part of the song. Examples include “Take Meto Church,” by Hozier and “All Of me,” by John Legend. Of course, there are exceptionslike “Let Her Go,” by Passenger, where the chorus is the most lyrically complicated part ofthe song. On the other hand, songs by established singers in the Hall of Fame usually havethe chorus as the most lyrically complex part of the song. Examples include “Counting
65
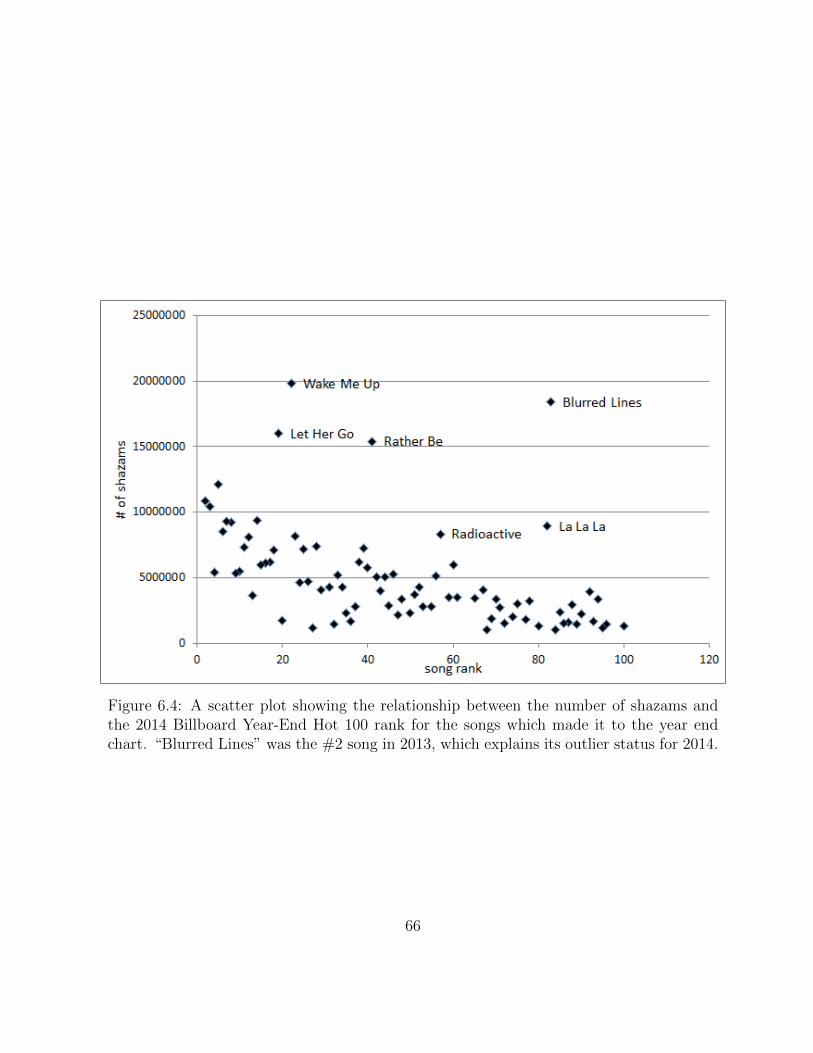
Figure 6.4: A scatter plot showing the relationship between the number of shazams andthe 2014 Billboard Year-End Hot 100 rank for the songs which made it to the year endchart. “Blurred Lines” was the #2 song in 2013, which explains its outlier status for 2014.
66
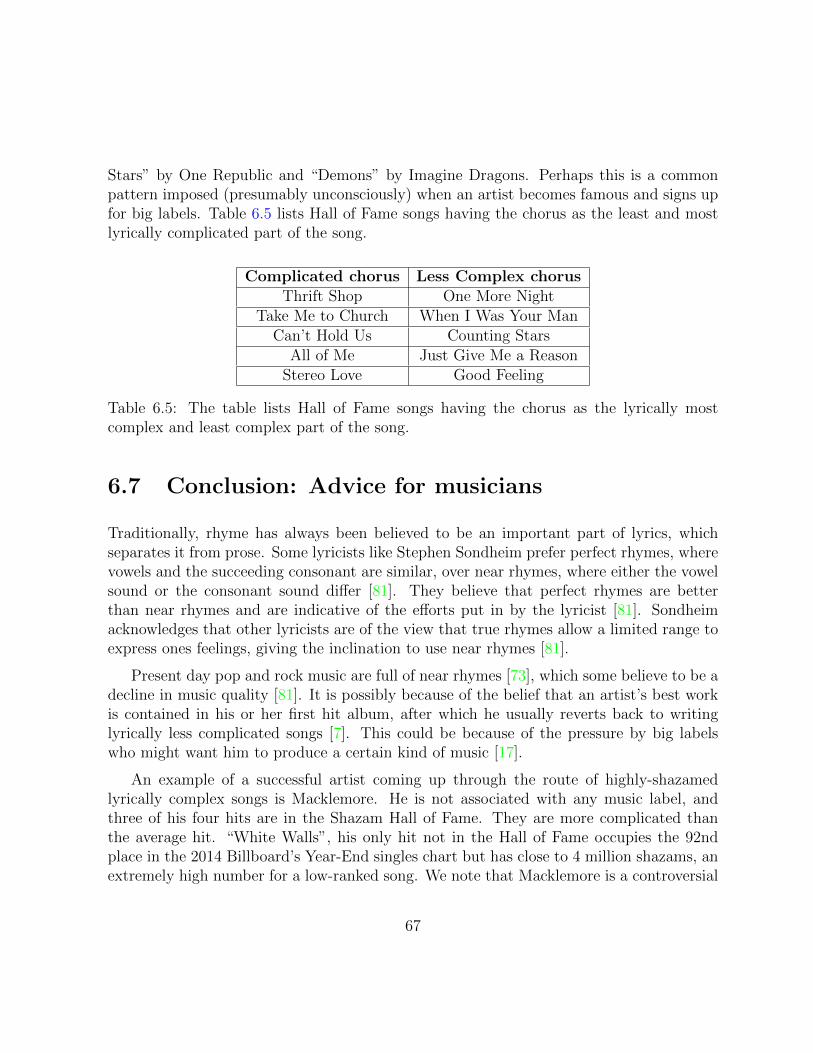
Stars” by One Republic and “Demons” by Imagine Dragons. Perhaps this is a commonpattern imposed (presumably unconsciously) when an artist becomes famous and signs upfor big labels. Table 6.5 lists Hall of Fame songs having the chorus as the least and mostlyrically complicated part of the song.
Complicated chorus Less Complex chorusThrift Shop One More Night
Take Me to Church When I Was Your ManCan’t Hold Us Counting Stars
All of Me Just Give Me a ReasonStereo Love Good Feeling
Table 6.5: The table lists Hall of Fame songs having the chorus as the lyrically mostcomplex and least complex part of the song.
6.7 Conclusion: Advice for musicians
Traditionally, rhyme has always been believed to be an important part of lyrics, whichseparates it from prose. Some lyricists like Stephen Sondheim prefer perfect rhymes, wherevowels and the succeeding consonant are similar, over near rhymes, where either the vowelsound or the consonant sound differ [81]. They believe that perfect rhymes are betterthan near rhymes and are indicative of the efforts put in by the lyricist [81]. Sondheimacknowledges that other lyricists are of the view that true rhymes allow a limited range toexpress ones feelings, giving the inclination to use near rhymes [81].
Present day pop and rock music are full of near rhymes [73], which some believe to be adecline in music quality [81]. It is possibly because of the belief that an artist’s best workis contained in his or her first hit album, after which he usually reverts back to writinglyrically less complicated songs [7]. This could be because of the pressure by big labelswho might want him to produce a certain kind of music [17].
An example of a successful artist coming up through the route of highly-shazamedlyrically complex songs is Macklemore. He is not associated with any music label, andthree of his four hits are in the Shazam Hall of Fame. They are more complicated thanthe average hit. “White Walls”, his only hit not in the Hall of Fame occupies the 92ndplace in the 2014 Billboard’s Year-End singles chart but has close to 4 million shazams, anextremely high number for a low-ranked song. We note that Macklemore is a controversial
67
figure in the rap press where some believe him not to be a true rapper [6]. Nonetheless, heis famous and successful and has a massive fan following [18].
Songs in the Hall of Fame are lyrically more complicated than hits and as argued earlier,a majority of them are by upcoming artists. Hence, this suggests one way for an upcomingartist to suceed is to write complicated lyrics with lots of rhymes, especially complicatedones, to get recognized, and rise above the sonic wallpaper of daily life, be shazamed, andbecome successful. Our focus, in this study, has been on imperfect and internal rhymesand their presence does improve a songs chance of making it to the Hall of Fame.
68
Chapter 7
Conclusion
In this thesis, we have studied the usefulness of lyrics, which compared to the audio, havelargely been ignored by the Music Information Retrieval (MIR) research [63], in solvingsome important MIR tasks. We find that lyrics do matter and in some cases outperformaudio features in solving MIR tasks. We find that the presence of lyrics has a variety ofsignificant effects on how people perceive songs. We have also shown that we can separatelyrics and poetry based on the kinds of adjectives used. Our most surprising result isthat lyrically complicated songs with lots of ryhmes, in particular internal and imperfectrhymes, are more likely to end up as hits. We see that the songs in the Shazam Hall ofFame are lyrically even more complicated than these hits.
In Chapter 3 we presented the results from a user study to determine if lyrics can helpbridge the music mood perception between different cultures. Our experiment shows thatthe presence of lyrics has a significant effect on how people perceive songs. To our surprise,reading lyrics alongside listening to a song does not significantly reduce the differences inmusic mood perception between Canadian and Chinese listeners. Also, while we includedtwo different sets of Canadian listeners (Canadian-Chinese, and Canadians not of Chineseorigin), we can make no useful conclusions about the Chinese-Canadian group. We do con-sistently see that presence of both audio and lyrics reduces the consistency of music moodjudgment between Chinese and Canadian listeners. This phenomenon may be because ofirony caused by negative words presented in proximity to upbeat beats, or it could be thatpresenting both audio and lyrics together might be a completely different experience forthe listener. This is an obvious setting for further work. We have shown that the moodof a song depends on its experiential context. Interestingly, songs where listeners agreestrongly about the mood of the song when only listening to the recording are often quiteuncertain in their mood assignments when the lyrics are shown alongside the recording.
69
We also show that many “melancholy” lyrics are found in songs assigned to a morecheerful mood by listeners, again suggesting that for such songs, the extent to whichlisteners focus on the lyrics may influence how sad they view a song to be. We analyzedthe mood assignments of participants on rock and hip-hop songs. We see that people tendto agree much more to the mood of a hip-hop song when they are made to listen to thesong. We found that for rebellious or negative rock songs, being able to read lyrics leads tomore agreement in music mood but being able to hear the audio leads to more agreementfor positive songs. In both the genres we found that hearing audio while reading lyricslead to less agreement on music mood of songs. Our results suggest that music moodis so dependent on cultural and experiential context to make it difficult to claim it as atrue concept. With the classification accuracy of mood classification systems reaching aplateau with no significant improvements we suggest that we need to redefine the term“music mood” and change our approach toward the music mood classification problem.We fundamentally also wonder if “mood” as an MIR concept needs to be reconsidered. Iflisteners disagree more or less about the mood of a song when it is presented alongsideits lyrics, that suggests a general uncertainty in the concept of “mood”. We leave moreevidence gathering about this concept to future work as well.
A possible extension to our work could be running a similar study using a larger set ofsongs and more participants, possibly from more diverse cultures than the ones we studied.Future studies could focus on multi-modal music mood classification where a song couldbelong to more than one mood, to see if even in this more robust domain there is a stableway to assign songs to clusters of moods when they are experienced in different contexts.We also wonder if other contextual experiments can show other effects about mood: forexample, if hearing music while in a car or on public transit, or in stores, makes the “mood”of a song more uncertain.
In Chapter 4, we developed a method to detect the genre of a document based on theprobability distribution of synonymous adjectives. Our key finding is that the choice ofsynonym for even a small number of adjectives are sufficient to reliably identify the genreof documents. In accordance with our hypothesis, we show that there exist differencesin the kind of adjectives used in different genres of writing. We calculate the probabilitydistribution of synonymous adjectives over the three kinds of documents and using thisdistribution and a simple algorithm, we are able to distinguish among lyrics, poetry andarticle with an accuracy of 67%, 57% and 80% respectively. Adjectives likely to be used inlyrics are more rhymable than the ones used in poetry. This might be because lyrics arewritten keeping in mind the melody, rhythm, instrumentation, quality of the singer’s voiceand other qualities of the recording while poetry is without such concerns. There is nosignificant difference in the semantic orientation of adjectives which are more likely to be
70
used in lyrics and those which are more likely to be used in poetry. Using the probabilitydistributions, obtained from training data, we present adjectives more likely to be used inlyrics rather than poetry and vice versa for twenty common concepts. Using the probabilitydistributions and our algorithm we show that we can discern poetic lyricists like Bob Dylanand Stephen Sondheim from nonpoetic ones like Bryan Adams and Kesha. Our algorithmconsistently misclassifies a majority of the lyrics of such poetic lyricists as poetry whilethe percentage of misclassified lyrics as poetry for the non-poetic lyricists is significantlylower.
Calculating the probability distribution of adjectives over the various document typesis a vital step in our method which in turn depends on the synonyms extracted for anadjective. Synonym extraction is still an open problem and with improvements in it our al-gorithm will give better accuracy levels. We extract synonyms from three different sources:Wikipeia, WordNet and an online thesaurus, and prune the results based on the semanticsimilarity between the adjectives and the obtained synonyms. We use a simple naıve algo-rithm, which gives us a better result than Naıve Bayes. An extension to the work can becoming up with an improved version of the algorithm with better accuracy levels. Futureworks can use a larger dataset for lyrics and poetry (we have an enormous dataset forarticles) to come up with better probability distributions for the two document types orto identify parts of speech that effectively separates genres of writing. Our work here canbe extended to different genres of writings like prose, fiction etc. to analyze the adjectiveusage in those writings. It would be interesting to do similar work for verbs and discern ifdifferent words, representing the same action, are used in different genres of writings.
In Chapter 5, we introduce our hit detection model. We have used 31 rhyme, syllableand meter features for hit song detection, an important music information retrieval task.Our lyrics features significantly outperform 14 audio features for this task. Combing thelyrics and audio features gives us slightly better results. We select hits to be songs whichmade it to the Billboard Year-End Hot 100 singles between the years 2008 and 2013. Flopsare non-hit songs, depending on our definition of flop, ranging from a very broad one toextremely restricted ones. Our largest data set consists of 492 hits and 6323 flops bythe most popular current English-language music artists. We use Bayesian networks andweighted-cost support vector machines with 10-fold cross validation. Varying the weightsof the SVM, we can adjust the values of true and false positives depending on the economiccosts associated with missing a hit and investing in a flop. For our largest data set, usingjust the lyrics features we can identify about half of the hits, while misclassifying only12.8% of flops as hits. For the hit detection task, we are consistently able to correctlyidentify about half of the hits across all the four definitions of flops.
We see that the presence of many rhymes, in particular complicated ones, makes it
71
more likely that the song will be a hit. Surprisingly, very loud songs are more likely to beflops. We do not claim that the presence of these features make a hit, though we do assertcorrelation. The rhyme and meter features we use is indicative of craftmanship and theamount of effort put into songmaking. It is difficult to come up with audio features whichcan act as a proxy for the effort put in a song, and hence we believe that lyrics featuresare more powerful than the audio ones in discerning hits from flops. An obvious drawbackof this approach is that we cannot predict if the outcome of a cover or remake of a songis going to be any different from the original song, since they share lyrics. Our work isnovel and simple, and it outperforms previous hit detection models. An extension mightbe to combine these features with features derived from either recordings, scores or textcomplexity, and to focus on specific genres.
In Chapter 6, we discuss a way for upcoming artist to rise above the “sonic wallpa-per” and become successful through the route of highly-shazamed lyrically complex songs.Shazam is used by people to identify songs they like, but are unaware of, usually in sce-narios where someone else plays the song for them. Such songs are usually by relativelyunknown and upcoming artists as popular artists have distinct voice and style which themasses are usually aware of. We wanted to identify whether lyric features could identifysongs likely to be heavily shazamed, as complex rhyme and meter might make a song sur-prising enough that a person would use the app on it. We select hits to be songs whichmade it to the Billboard Year-End Hot 100 singles between the years 2008 and 2014 andare not present in the Shazam Hall of Fame. Our data set consists of 68 Hall of Fame songsand 389 hits. We use a Bayesian Network and a weighted-cost support vector machine toseparate hits from Hall of Fame songs using the 31 rhyme, meter and syllable features aswe used in Chapter 5. Consistent with our hypothesis, we see that the presence of lots ofrhymes, in particular complicated imperfect and internal rhymes, makes it more likely thatthe song will end up in the Shazam Hall of Fame. We define lyrics complexity to be thesum of the normalized values of our 31 lyrics features. Lyrics complexity is an importantfeature of a linear regression model used to predict the number of shazams. Outliers onthe shazams versus Billboard Year-End Hot 100 rank graph are usually hits by upcomingartists. Songs by upcoming artists usually have the chorus as the lyrically least complexpart of the song while songs by established artists usually have the chorus as the lyricallymost complex part of the song.
Our work is simple and is surprisingly effective at explaining which songs will be shaz-amed, and how often. Our advice to upcoming singers is to write lyrically complicatedsongs with many complicated rhymes in order to rise above the sonic wallpaper, get noticedand shazamed, and become famous.
In this thesis, we show the usefulness of lyrics in solving four important Music Informa-
72
tion Retrieval tasks. For our first result, we show that the presence of lyrics has a varietyof significant effects on how people perceive songs. We then proceed to show that we canpredict the genre of a document based on the adjective choices made by the authors. Forour next result, we show that rhyme and meter features are useful in separating hits andflops and outperform the currently popularly used audio features. Using the same featureswe can also detect songs which are likely to be shazamed heavily. We argue that complexrhyme and meter is a detectable property of lyrics that indicates quality songmaking andartisanship and allows artists to become successful.
73

References
[1] Hirotugu Akaike. A new look at the statistical model identification. IEEE Transactionson Automatic Control, 19(6):716–723, 1974.
[2] Craig A Anderson, Nicholas L Carnagey, and Janie Eubanks. Exposure to violentmedia: the effects of songs with violent lyrics on aggressive thoughts and feelings.Journal of Personality and Social Psychology, 84(5):960–971, 2003.
[3] Ion Androutsopoulos, John Koutsias, Konstantinos V Chandrinos, and Constantine DSpyropoulos. An experimental comparison of naıve Bayesian and keyword-based anti-spam filtering with personal e-mail messages. In Proceedings of the 23rd AnnualInternational ACM SIGIR Conference on Research and Development in InformationRetrieval, pages 160–167. ACM, 2000.
[4] Ani DiFranco Wikipeida article. http://en.wikipedia.org/wiki/Ani DiFranco.
[5] Beard, Alison. Lifes Work: Annie Lennox. https://hbr.org/2010/10/lifes-work-annie-lennox. 2010.
[6] Ben Beaumont-Thomas. The Grammys 2014: is Macklemore’s success bad for hip-hop? The Guardian, 27 January 2014.
[7] Ben Kaye. Proof the sophomore album slump is a real problem.http://consequenceofsound.net/2015/02/proof-the-sophomore-album-slump-is-a-real-problem/. 2015.
[8] Thierry Bertin-Mahieux, Daniel P.W. Ellis, Brian Whitman, and Paul Lamere. TheMillion Song Dataset. In International Society for Music Information Retrieval, pages591–596, 2011.
74
[9] Mireille Besson, Frederique Faita, Isabelle Peretz, A-M Bonnel, and Jean Requin.Singing in the brain: Independence of lyrics and tunes. Psychological Science,9(6):494–498, 1998.
[10] Billboard. http://www.billboard.com/.
[11] Billboard Year-End Hot 100 singles of 2014. http://www.billboard.com/charts/year-end/2014/hot-100-songs.
[12] Dean Leonard Biron. Writing and Music: Album Liner Notes. PORTAL Journal ofMultidisciplinary International Studies, 8(1), 2011.
[13] Kerstin Bischoff, Claudiu S Firan, Mihai Georgescu, Wolfgang Nejdl, and Raluca Paiu.Social knowledge-driven music hit prediction. In Proceedings of the Advanced DataMining and Applications Conference, pages 43–54. 2009.
[14] Christian Bøhn and Kjetil Nørvag. Extracting named entities and synonyms fromWikipedia. In IEEE International Conference on Advanced Information Networkingand Applications, pages 1300–1307, 2010.
[15] Bruce Springsteen Wikipedia article. http://en.wikipedia.org/wiki/Bruce Springsteen.
[16] Felix Budelmann. Introducing Greek lyric. Budelmann, F.(red.). The CambridgeCompanion to Greek lyric. Bladsy, pages 1–18, 2009.
[17] David Byrne. How music works. McSweeney’s, 2012.
[18] Jon Caramanica. Finding a place in the hip-hop ecosystem. The New York Times,page C1, 27 January 2014.
[19] Chih-Chung Chang and Chih-Jen Lin. LIBSVM: A library for support vector ma-chines. ACM Transactions on Intelligent Systems and Technology, 2:27:1–27:27, 2011.
[20] Paula Chesley, Bruce Vincent, Li Xu, and Rohini K Srihari. Using verbs and adjectivesto automatically classify blog sentiment. Training, 580(263):233, 2006.
[21] Tina Chui, Kelly Tran, and John Flanders. Chinese Canadians: Enriching the culturalmosaic. Canadian Social Trends, 76(2), 2005.
[22] Michael Deacon. Morrissey doesn’t write poetry, he writes lyrics. The Telegraph, 23May 2009.
75
[23] Dean Van Nguyen. Silicon Republic. http://www.siliconrepublic.com/digital-life/item/38714-15-billion-songs-have-been/. 2014.
[24] Ruth Dhanaraj and Beth Logan. Automatic Prediction of Hit Songs. In InternationalSociety for Music Information Retrieval, pages 488–491, 2005.
[25] Ani DiFranco. Ani DiFranco: Verses. Seven Stories Press, 2011.
[26] J Downie, Kris West, Andreas Ehmann, and Emmanuel Vincent. The 2005 musicinformation retrieval evaluation exchange (mirex) 2005): Preliminary overview. InInternational Conference for Music Information Retrieval, pages 320–323, 2005.
[27] J Stephen Downie, Donald Byrd, and Tim Crawford. Ten years of ISMIR: Reflec-tions on challenges and opportunities. In International Society for Music InformationRetrieval, pages 13–18, 2009.
[28] H Elovitz, Rodney Johnson, Astrid McHugh, and J Shore. Letter-to-sound rules forautomatic translation of English text to phonetics. In IEEE Transactions on Acoustics,Speech and Signal Processing, volume 24, pages 446–459, 1976.
[29] Doris R Entwisle and Catherine Garvey. Verbal productivity and adjective usage.Language and Speech, 15(3):288–298, 1972.
[30] Andrea Esuli and Fabrizio Sebastiani. SentiWordNet: A publicly available lexicalresource for opinion mining. In Proceedings of Language Resources and EvaluationConference, volume 6, pages 417–422, 2006.
[31] Jianyu Fan and Michael A Casey. Study of Chinese and UK hit Songs Prediction.Proceedings of Computer Music Multidisciplinary Research (CMMR), 2013.
[32] Tom Fawcett. An introduction to ROC analysis. Pattern Recognition Letters,27(8):861–874, 2006.
[33] Dmitriy Genzel, Jakob Uszkoreit, and Franz Och. Poetic statistical machine trans-lation: rhyme and meter. In Conference on Empirical Methods in Natural LanguageProcessing, pages 158–166, 2010.
[34] Nicolas Gueguen, Celine Jacob, and Lubomir Lamy. love is in the air: Effects of songswith romantic lyrics on compliance with a courtship request. Psychology of Music,38(3):303–307, 2010.
76
[35] Mark Hall, Eibe Frank, Geoffrey Holmes, Bernhard Pfahringer, Peter Reutemann,and Ian H Witten. The WEKA data mining software: an update. In ACM SIGKDDExplorations Newsletter, volume 11, pages 10–18, 2009.
[36] Hui He, Jianming Jin, Yuhong Xiong, Bo Chen, Wu Sun, and Ling Zhao. Languagefeature mining for music emotion classification via supervised learning from lyrics.In 3rd International Symposium on Computation and Intelligence, pages 426–435.Springer, 2008.
[37] David H Henard and Christian L Rossetti. All you need is love? Communication in-sights from pop music’s number-one hits. Journal of Advertising Research, 54(2):178–191, 2014.
[38] Dorien Herremans, David Martens, and Kenneth Sorensen. Dance hit song prediction.In International Workshop on Machine Learning and Music, ECML/PKDD, 2013.
[39] Hussein Hirjee. Rhyme, rhythm, and rhubarb: Using probabilistic methods to analyzehip hop, poetry, and misheard lyrics. Master’s thesis, University of Waterloo, 2010.
[40] Hussein Hirjee and Daniel G Brown. Automatic Detection of Internal and ImperfectRhymes in Rap Lyrics. In International Society for Music Information Retrieval,pages 711–716, 2009.
[41] Hussein Hirjee and Daniel G Brown. Automatic detection of internal and imperfectrhymes in rap lyrics. In International Society for Music Information Retrieval, pages711–716, 2009.
[42] Hussein Hirjee and Daniel G Brown. Rhyme Analyzer: An Analysis Tool for RapLyrics. In International Society for Music Information Retrieval, 2010.
[43] Hussein Hirjee and Daniel G. Brown. Using automated rhyme detection to characterizerhyming style in rap music. Empirical Musicology Review, 5(4):121–145, 2010.
[44] Xiao Hu and J Stephen Downie. Exploring mood metadata: Relationships with genre,artist and usage metadata. In International Society for Music Information Retrieval,pages 67–72, 2007.
[45] Xiao Hu and J Stephen Downie. Improving mood classification in music digital li-braries by combining lyrics and audio. In Proceedings of the 10th Annual Joint Con-ference on Digital Libraries, pages 159–168. ACM, 2010.
77
[46] Xiao Hu and J Stephen Downie. When lyrics outperform audio for music moodclassification: A feature analysis. In International Society for Music InformationRetrieval, pages 619–624, 2010.
[47] Xiao Hu, J Stephen Downie, Cyril Laurier, Mert Bay, and Andreas F Ehmann. The2007 MIREX audio mood classification task: Lessons learned. In International Societyfor Music Information Retrieval, pages 462–467, 2008.
[48] Xiao Hu and Jin Ha Lee. A cross-cultural study of music mood perception betweenAmerican and Chinese listeners. In International Society for Music Information Re-trieval, pages 535–540, 2012.
[49] Yajie Hu, Xiaoou Chen, and Deshun Yang. Lyric-based song emotion detection withaffective lexicon and fuzzy clustering method. In International Society for MusicInformation Retrieval, pages 123–128, 2009.
[50] Poem Hunter. http://www.poemhunter.com.
[51] Long Jiang and Ming Zhou. Generating Chinese couplets using a statistical MTapproach. In International Conference on Computational Linguistics, volume 1, pages377–384, 2008.
[52] Katerina Kosta, Yading Song, Gyorgy Fazekas, and Mark B Sandler. A study ofcultural dependence of perceived mood in Greek music. In International Society forMusic Information Retrieval, pages 317–322, 2013.
[53] Cyril Laurier, Jens Grivolla, and Perfecto Herrera. Multimodal music mood classifi-cation using audio and lyrics. In International Conference on Machine Learning andApplications, pages 688–693, 2008.
[54] Jin Ha Lee, M Cameron Jones, and J Stephen Downie. An analysis of ISMIR proceed-ings: Patterns of authorship, topic, and citation. In International Society for MusicInformation Retrieval, pages 57–62, 2009.
[55] Heidi I Brummert Lennings and Wayne A Warburton. The effect of auditory versusvisual violent media exposure on aggressive behaviour: the role of song lyrics, videoclips and musical tone. Journal of Experimental Social Psychology, 47(4):794–799,2011.
[56] Lie Lu, Dan Liu, and Hong-Jiang Zhang. Automatic mood detection and tracking ofmusic audio signals. Audio, Speech, and Language Processing, IEEE Transactions on,14(1):5–18, 2006.
78

[57] Metro Lyrics. http://www.metrolyrics.com.
[58] Matt Bailey. What You Can and Can’t Learn From Shazam.http://www.colemaninsights.com/news/what-you-can-and-cant-learn-from-shazam.2015.
[59] George A Miller. Wordnet: a lexical database for English. Communications of theACM, 38(11):39–41, 1995.
[60] Pharoahe Monch. Internal affairs. Rawkus Records, 1999.
[61] Keith Negus. Bob Dylan. Equinox London, 2008.
[62] Echo Nest. http://echonest.com/.
[63] Yizhao Ni, Raul Santos-Rodrıguez, Matt McVicar, and Tijl de Bie. Hit song scienceonce again a science? Proceedings of the 4th International Workshop on MachineLearning and Music: Learning from Musical Structure, 2011.
[64] Eric Nichols, Dan Morris, Sumit Basu, and Christopher Raphael. Relationships be-tween lyrics and melody in popular music. In International Society on Music Infor-mation Retrieval, pages 471–476, 2009.
[65] Jyrki Niemi, Krister Linden, and Mirka Hyvarinen. Using a bilingual resource to addsynonyms to a Wordnet: Finnwordnet and Wikipedia as an example. Global WordNetAssociation, pages 227–231, 2012.
[66] Boulevard of Broken Dreams Lyrics Video. https://www.youtube.com/results?search query=boulevard+of+broken+dreams+lyrics.
[67] Shazam Hall of Fame. http://www.shazam.com/hall-of-fame.
[68] Francois Pachet and Pierre Roy. Hit song science is not yet a science. In InternationalSociety for Music Information Retrieval, pages 355–360, 2008.
[69] Giuseppe Pirro and Jerome Euzenat. A feature and information theoretic frameworkfor semantic similarity and relatedness. In International Semantic Web Conference,pages 615–630, 2010.
[70] The Difference Between Poetry and Song Lyrics.http://bostonreview.net/forum/poetry-brink/difference-between-poetry-and-song-lyrics.
79
[71] Rhyme Zone. http://rhymezone.com/.
[72] Rowan Righelato. Bill Callahan doesn’t just write songs, he sings poems. TheGuardian, 19 September 2013.
[73] Robin Frederick. To rhyme or not to rhyme, http://mysongcoach.com/rhyming-in-contemporary-songs/. 2013.
[74] Peter Mark Roget. Roget’s Thesaurus of English Words and Phrases. TY CrowellCompany, 1911.
[75] Roy Shuker. Understanding popular music. Psychology Press, 1994.
[76] Abhishek Singhi and Daniel G Brown. Are poetry and lyrics all that different? InInternational Society for Music Information Retrieval, pages 471–476, 2014.
[77] Abhishek Singhi and Daniel G Brown. Hit song detection using lyric features alone.In International Society for Music Information Retrieval, 2014.
[78] Abhishek Singhi and Daniel G Brown. On cultural, textual and experiential aspectsof music mood. In International Society for Music Information Retrieval, pages 1–6,2014.
[79] Abhishek Singhi and Daniel G Brown. Can song lyrics predict hits? To appear inInternational Symposium on Computer Music Multidisciplinary Research, 2015.
[80] Alex G Smith, Christopher XS Zee, and Alexandra L Uitdenbogerd. In your eyes:Identifying cliches in song lyrics. In The Australasian Language Technology Associa-tion Workshop, pages 88–96, 2012.
[81] Stephen Sondheim. Finishing the hat: collected lyrics (1954-1981) with attendantcomments, principles, heresies, grudges, whines and anecdotes. Knopf, 2010.
[82] Stephen Sondheim. Look, I made a hat: collected lyrics (1981-2011), with attendantcomments, amplifications, dogmas, harangues, digressions, anecdotes and miscellany.Knopf, 2011.
[83] Dana Stevens and Francine Prose. Bob dylan: Musician or poet? The New YorkTimes, page BR27, 17 December 2013.
[84] Valerie N Stratton and Annette H Zalanowski. Affective impact of music vs. lyrics.Empirical Studies of the Arts, 12(2):173–184, 1994.
80

[85] Steven Suskin. Opening Night on Broadway: A Critical Quotebook of the Golden Eraof the Musical Theatre, Oklahoma!(1943) to Fiddler on the Roof (1964). SchirmerTrade Books, 1990.
[86] WikiSynonyms: Find synonyms using Wikipedia redirects.http://wikisynonyms.ipeirotis.com/search.
[87] Online Thesaurus. http://www.merriam-webster.com.
[88] Konstantinos Trohidis, Grigorios Tsoumakas, George Kalliris, and Ioannis P Vlahavas.Multi-label classification of music into emotions. In International Society for MusicInformation Retrieval, pages 325–330, 2008.
[89] Dirk Vanderbeke. Rhymes without reason? or: The improbable evolution of poetry.Politics and Culture, 1, 2010.
[90] Villarreal, Alexandra. 5 Reasons Every Hopeless Romantic Needs to Listen to EdSheeran. http://mic.com/articles/73449/5-reasons-every-hopeless-romantic-needs-to-listen-to-ed-sheeran. 2013.
[91] Lyric Writing vs. Poetry. http://www.writersdigest.com/qp7-migration-books/writing-better-lyrics-interview.
[92] Wikipedia. http://en.wikipedia.org/.
[93] Hua Wu and Ming Zhou. Optimizing synonym extraction using monolingual and bilin-gual resources. In Proceedings of the Second International Workshop on Paraphrasing,volume 16, pages 72–79, 2003.
[94] Yi-Hsuan Yang and Homer H Chen. Music emotion recognition. CRC Press, 2011.
[95] Yi-Hsuan Yang, Yu-Ching Lin, Heng-Tze Cheng, I-Bin Liao, Yeh-Chin Ho, andHomer H Chen. Toward multi-modal music emotion classification. In Pacific RimConference on Multimedia, pages 70–79, 2008.
[96] William Butler Yeats. The wild swans at Coole. Macmillan, 1919.
81
Related Documents


![Writing your thesis with our LaTeX-Template [1em][width=3cm]img](https://static.cupdf.com/doc/110x72/6207451f49d709492c2fb72c/writing-your-thesis-with-our-latex-template-1emwidth3cmimg.jpg)


