1 To: The Honorable Kevin Mullin, Chair, Green Mountain Care Board From: John Brumsted, CEO, University of Vermont Health Network Todd Keating, CFO, University of Vermont Health Network Date: February 14, 2020 Subject: Fiscal Year 2019 Actual-to-Budget Narrative ______________________________________________________________________________ UVM Health Network Executive Summary As the UVM Health Network has reported in previous submissions to the Green Mountain Care Board, margin performance continues to be a main financial focus of our affiliate hospitals. Adequate operating margin allows the Network to enhance the care we provide to our patients, maintain our high credit ratings, and decrease our borrowing costs. On a consolidated basis, the Network’s Vermont hospitals saw a 1.8% operating margin in FY 2019, which follows similar trends of decreasing operating margins year over year, for the past four years. For context, in order to meet our financial framework goal and the expectations of our rating agencies, we need to be working to a 3% Network margin in FY 2022. For our Network as a whole, our actual margin performance in FY 2019 was off budget by 1.2%, or $25.5M. The compounding impact of not receiving medical inflation rate increases for commercial payers and imposing the full burden of the cost shift over the years is taking its toll on margin performance. For the first quarter of FY 2020, we have seen a further erosion of our margin, and actually posted a negative margin of $10M for the Network as a whole. The causes for this decline are multi-factorial, and represent challenges we are facing as a whole, as well as challenges at the individual affiliate level, but to be clear, this is not sustainable. Our Network is not immune from the challenges and pressures that are causing financial strain on hospitals and health care organizations locally and across the country. In addition to higher than expected workforce expenses, high pharmacy costs (including oncology and infusion expenses) challenged our expense growth as we provided the level of care necessary for the patients who walked through our doors. As utilization for these services rises, the cost of that care follows and compounds. Not only does this impact expenses, but because it is a pass through item to patients, in FY 2019 we estimate additional pharmaceutical utilization and higher than budgeted inflation rates resulted in increased net patient revenues between $13M to $19M. We will get into more detail on the impacts this has on both current and future budgets with the FY 2021 budget submission.

Welcome message from author
This document is posted to help you gain knowledge. Please leave a comment to let me know what you think about it! Share it to your friends and learn new things together.
Transcript
1
To: The Honorable Kevin Mullin, Chair, Green Mountain Care Board
From: John Brumsted, CEO, University of Vermont Health Network
Todd Keating, CFO, University of Vermont Health Network
Date: February 14, 2020
Subject: Fiscal Year 2019 Actual-to-Budget Narrative
______________________________________________________________________________
UVM Health Network Executive Summary
As the UVM Health Network has reported in previous submissions to the Green Mountain Care
Board, margin performance continues to be a main financial focus of our affiliate hospitals.
Adequate operating margin allows the Network to enhance the care we provide to our patients,
maintain our high credit ratings, and decrease our borrowing costs. On a consolidated basis, the
Network’s Vermont hospitals saw a 1.8% operating margin in FY 2019, which follows similar
trends of decreasing operating margins year over year, for the past four years. For context, in
order to meet our financial framework goal and the expectations of our rating agencies, we need
to be working to a 3% Network margin in FY 2022. For our Network as a whole, our actual
margin performance in FY 2019 was off budget by 1.2%, or $25.5M. The compounding impact
of not receiving medical inflation rate increases for commercial payers and imposing the full
burden of the cost shift over the years is taking its toll on margin performance. For the first
quarter of FY 2020, we have seen a further erosion of our margin, and actually posted a negative
margin of $10M for the Network as a whole. The causes for this decline are multi-factorial, and
represent challenges we are facing as a whole, as well as challenges at the individual affiliate
level, but to be clear, this is not sustainable.
Our Network is not immune from the challenges and pressures that are causing financial strain
on hospitals and health care organizations locally and across the country. In addition to higher
than expected workforce expenses, high pharmacy costs (including oncology and infusion
expenses) challenged our expense growth as we provided the level of care necessary for the
patients who walked through our doors. As utilization for these services rises, the cost of that
care follows and compounds. Not only does this impact expenses, but because it is a pass
through item to patients, in FY 2019 we estimate additional pharmaceutical utilization and higher
than budgeted inflation rates resulted in increased net patient revenues between $13M to $19M.
We will get into more detail on the impacts this has on both current and future budgets with the
FY 2021 budget submission.
2
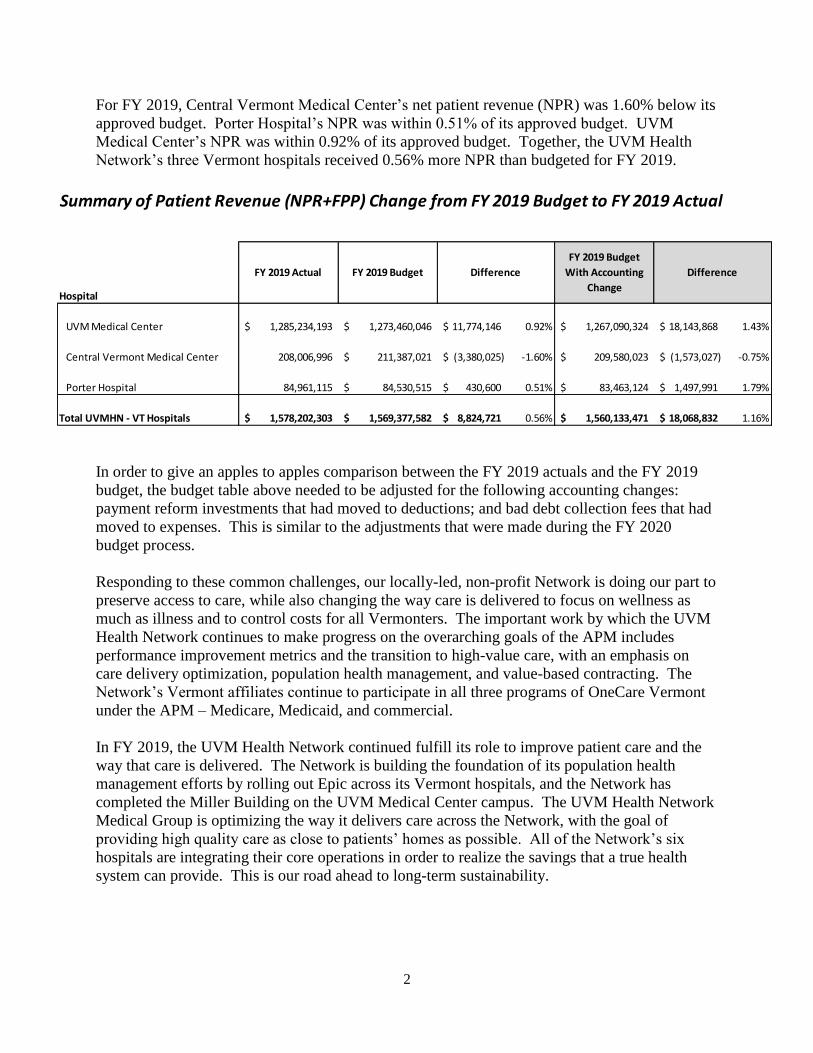
For FY 2019, Central Vermont Medical Center’s net patient revenue (NPR) was 1.60% below its
approved budget. Porter Hospital’s NPR was within 0.51% of its approved budget. UVM
Medical Center’s NPR was within 0.92% of its approved budget. Together, the UVM Health
Network’s three Vermont hospitals received 0.56% more NPR than budgeted for FY 2019.
In order to give an apples to apples comparison between the FY 2019 actuals and the FY 2019
budget, the budget table above needed to be adjusted for the following accounting changes:
payment reform investments that had moved to deductions; and bad debt collection fees that had
moved to expenses. This is similar to the adjustments that were made during the FY 2020
budget process.
Responding to these common challenges, our locally-led, non-profit Network is doing our part to
preserve access to care, while also changing the way care is delivered to focus on wellness as
much as illness and to control costs for all Vermonters. The important work by which the UVM
Health Network continues to make progress on the overarching goals of the APM includes
performance improvement metrics and the transition to high-value care, with an emphasis on
care delivery optimization, population health management, and value-based contracting. The
Network’s Vermont affiliates continue to participate in all three programs of OneCare Vermont
under the APM – Medicare, Medicaid, and commercial.
In FY 2019, the UVM Health Network continued fulfill its role to improve patient care and the
way that care is delivered. The Network is building the foundation of its population health
management efforts by rolling out Epic across its Vermont hospitals, and the Network has
completed the Miller Building on the UVM Medical Center campus. The UVM Health Network
Medical Group is optimizing the way it delivers care across the Network, with the goal of
providing high quality care as close to patients’ homes as possible. All of the Network’s six
hospitals are integrating their core operations in order to realize the savings that a true health
system can provide. This is our road ahead to long-term sustainability.
Summary of Patient Revenue (NPR+FPP) Change from FY 2019 Budget to FY 2019 Actual
Hospital
UVM Medical Center 1,285,234,193$ 1,273,460,046$ 11,774,146$ 0.92% 1,267,090,324$ 18,143,868$ 1.43%
Central Vermont Medical Center 208,006,996 211,387,021$ (3,380,025)$ -1.60% 209,580,023$ (1,573,027)$ -0.75%
Porter Hospital 84,961,115 84,530,515$ 430,600$ 0.51% 83,463,124$ 1,497,991$ 1.79%
Total UVMHN - VT Hospitals 1,578,202,303$ 1,569,377,582$ 8,824,721$ 0.56% 1,560,133,471$ 18,068,832$ 1.16%
FY 2019 BudgetFY 2019 Actual Difference
FY 2019 Budget
With Accounting
Change
Difference
3
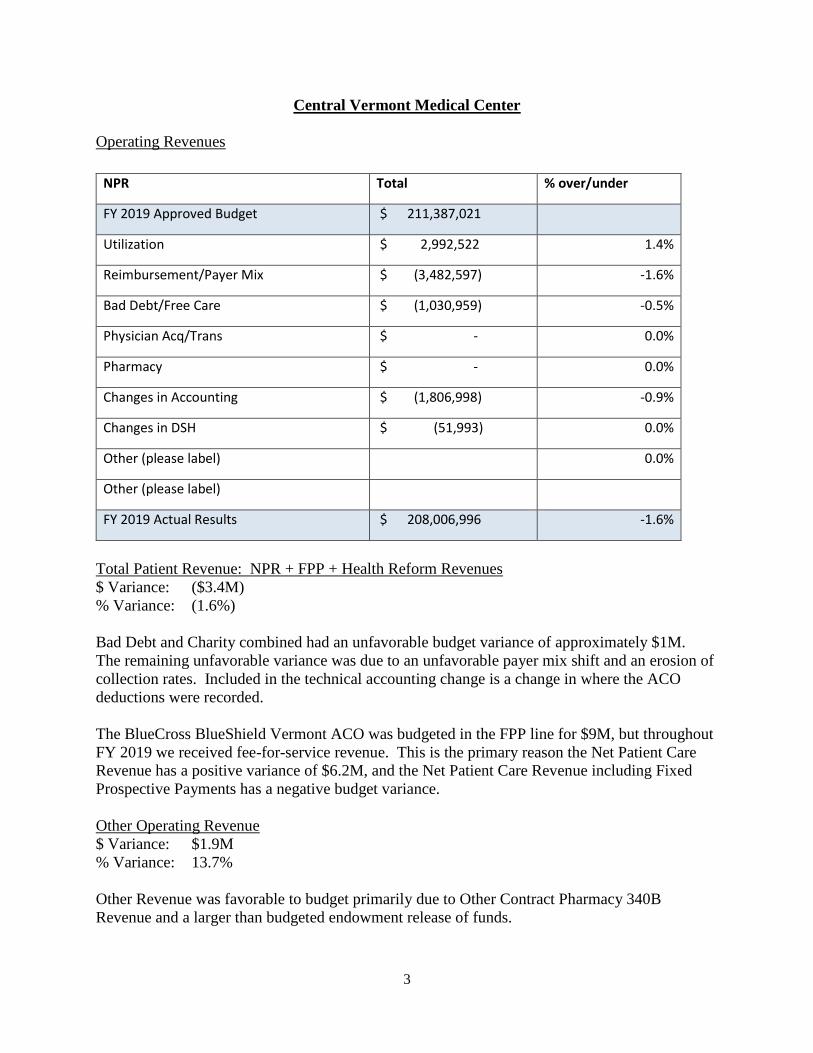
Central Vermont Medical Center
Operating Revenues
NPR Total % over/under
FY 2019 Approved Budget $ 211,387,021
Utilization $ 2,992,522 1.4%
Reimbursement/Payer Mix $ (3,482,597) -1.6%
Bad Debt/Free Care $ (1,030,959) -0.5%
Physician Acq/Trans $ - 0.0%
Pharmacy $ - 0.0%
Changes in Accounting $ (1,806,998) -0.9%
Changes in DSH $ (51,993) 0.0%
Other (please label) 0.0%
Other (please label)
FY 2019 Actual Results $ 208,006,996 -1.6%
Total Patient Revenue: NPR + FPP + Health Reform Revenues
$ Variance: ($3.4M)
% Variance: (1.6%)
Bad Debt and Charity combined had an unfavorable budget variance of approximately $1M.
The remaining unfavorable variance was due to an unfavorable payer mix shift and an erosion of
collection rates. Included in the technical accounting change is a change in where the ACO
deductions were recorded.
The BlueCross BlueShield Vermont ACO was budgeted in the FPP line for $9M, but throughout
FY 2019 we received fee-for-service revenue. This is the primary reason the Net Patient Care
Revenue has a positive variance of $6.2M, and the Net Patient Care Revenue including Fixed
Prospective Payments has a negative budget variance.
Other Operating Revenue
$ Variance: $1.9M
% Variance: 13.7%
Other Revenue was favorable to budget primarily due to Other Contract Pharmacy 340B
Revenue and a larger than budgeted endowment release of funds.
4
Operating Expenses
Expenses Amount % over/under
FY 2019 Approved Budget $ 221,962,950
Salaries $ (2,869,607) -1.3%
Fringe Benefits $ 1,602,551 0.7%
Physician $ 750,625 0.3%
Contract Staffing $ 2,350,305 1.1%
Supplies $ (274,442) -0.1%
Drugs $ 4,749,785 2.1%
Facilities $ 190,565 0.1%
IT Related $ 49,187 0.0%
Depreciation $ (655,630) -0.3%
Interest $ 65,362 0.0%
Health Care Provider Tax $ (949,232) -0.4%
Purchased Services $ 1,509,393 0.7%
Other $ 919,654 0.4%
Changes in Accounting $ (985,478) -0.4%
FY 2019 Actual Results $ 228,415,989 2.9%
Total Operating Expense from the FY 2019 budget to FY 2019 actual was unfavorable by
$6.5M, or 2.9%.
Staff Salaries
$ Variance: ($2.9M)
% Variance: (1.3%)
Salaries Non-MD were favorable to budget, primarily due to shortages in nursing positions.
Fringe Benefits
$ Variance: ($1.6M)
% Variance: (0.7%)
Fringe Benefits were unfavorable to budget due to a high volume of specialty pharmaceutical
spend within our self-funded health insurance plan related to employees with cancer diagnoses.
Physician Salaries
$ Variance: ($0.8M)
% Variance: (0.3%)
Physician Fees were over budget due to unbudgeted physician travelers in the Hospitalist and
Neurology service areas of $800K and $680K, respectively.
Contract Staffing
$ Variance: ($2.3M)
% Variance: (1.1%)
5
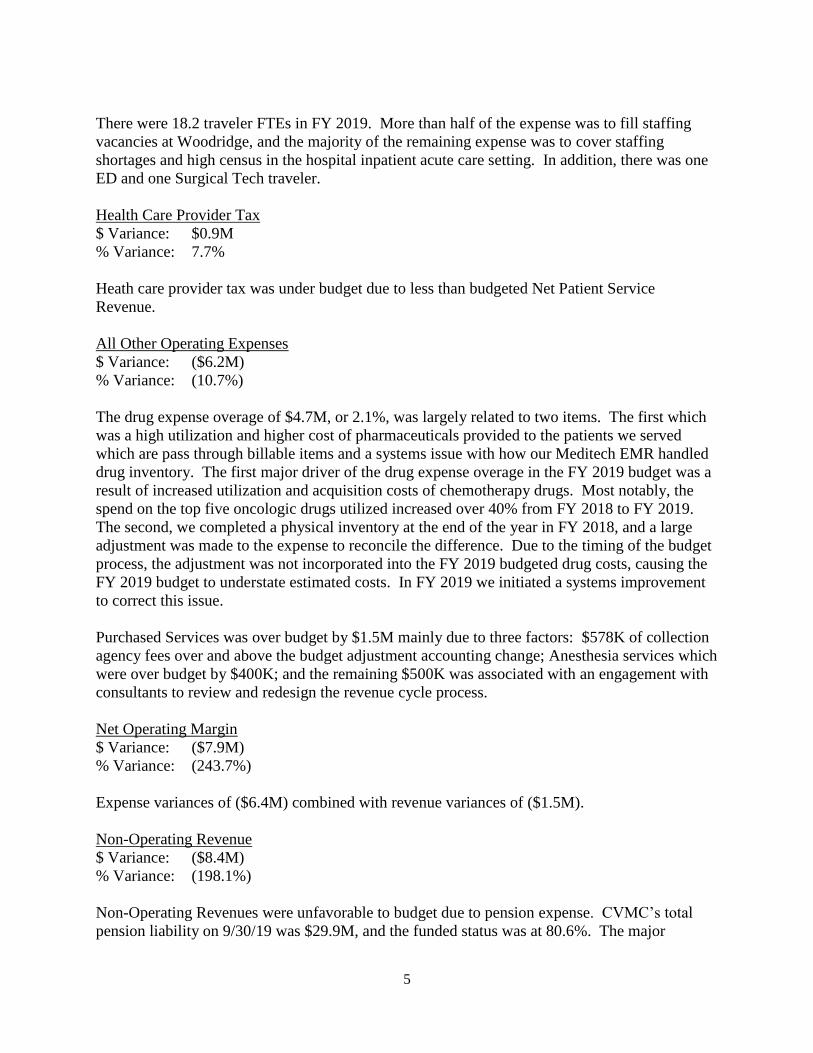
There were 18.2 traveler FTEs in FY 2019. More than half of the expense was to fill staffing
vacancies at Woodridge, and the majority of the remaining expense was to cover staffing
shortages and high census in the hospital inpatient acute care setting. In addition, there was one
ED and one Surgical Tech traveler.
Health Care Provider Tax
$ Variance: $0.9M
% Variance: 7.7%
Heath care provider tax was under budget due to less than budgeted Net Patient Service
Revenue.
All Other Operating Expenses
$ Variance: ($6.2M)
% Variance: (10.7%)
The drug expense overage of $4.7M, or 2.1%, was largely related to two items. The first which
was a high utilization and higher cost of pharmaceuticals provided to the patients we served
which are pass through billable items and a systems issue with how our Meditech EMR handled
drug inventory. The first major driver of the drug expense overage in the FY 2019 budget was a
result of increased utilization and acquisition costs of chemotherapy drugs. Most notably, the
spend on the top five oncologic drugs utilized increased over 40% from FY 2018 to FY 2019.
The second, we completed a physical inventory at the end of the year in FY 2018, and a large
adjustment was made to the expense to reconcile the difference. Due to the timing of the budget
process, the adjustment was not incorporated into the FY 2019 budgeted drug costs, causing the
FY 2019 budget to understate estimated costs. In FY 2019 we initiated a systems improvement
to correct this issue.
Purchased Services was over budget by $1.5M mainly due to three factors: $578K of collection
agency fees over and above the budget adjustment accounting change; Anesthesia services which
were over budget by $400K; and the remaining $500K was associated with an engagement with
consultants to review and redesign the revenue cycle process.
Net Operating Margin
$ Variance: ($7.9M)
% Variance: (243.7%)
Expense variances of ($6.4M) combined with revenue variances of ($1.5M).
Non-Operating Revenue
$ Variance: ($8.4M)
% Variance: (198.1%)
Non-Operating Revenues were unfavorable to budget due to pension expense. CVMC’s total
pension liability on 9/30/19 was $29.9M, and the funded status was at 80.6%. The major
6
contributor to this variance is the change in discount rate from 9/30/18 of 4.40% to 3.25% on
9/30/19, which was offset a little by stronger actual investment returns.
Total Margin
$ Variance: ($16.3M)
% Variance: (217.9%)
Negative operating margin variance combined with a negative non-operating revenue variance.
Summary
In FY 2018 CVMC posted an operating loss of $7.9M, and in FY 2019 CVMC was able to
reduce that loss to $4.7M. CVMC continues to respond to the challenges of a changing Central
Vermont payer landscape with a shift away from commercial payers to governmental and
transition to the APM. Increasing salary and contracted workforce (traveler) expense is another
challenge that is being addressed creatively though a variety of workforce development
programs. Epic will improve the overall coordination of patient care delivery system throughout
the UVM Health Network, and our revenue systems implementation costs and reduced
productivity during the implementation and stabilization phases will have a financial impact in
the short term.
CVMC remains committed to implementation of margin improvement initiatives and a break-
even operating margin for FY 2020. We look forward to our continued collaboration with the
Green Mountain Care Board, including our work with the Board on CVMC’s performance
improvement plan, which began at the onset of FY 2020.
7
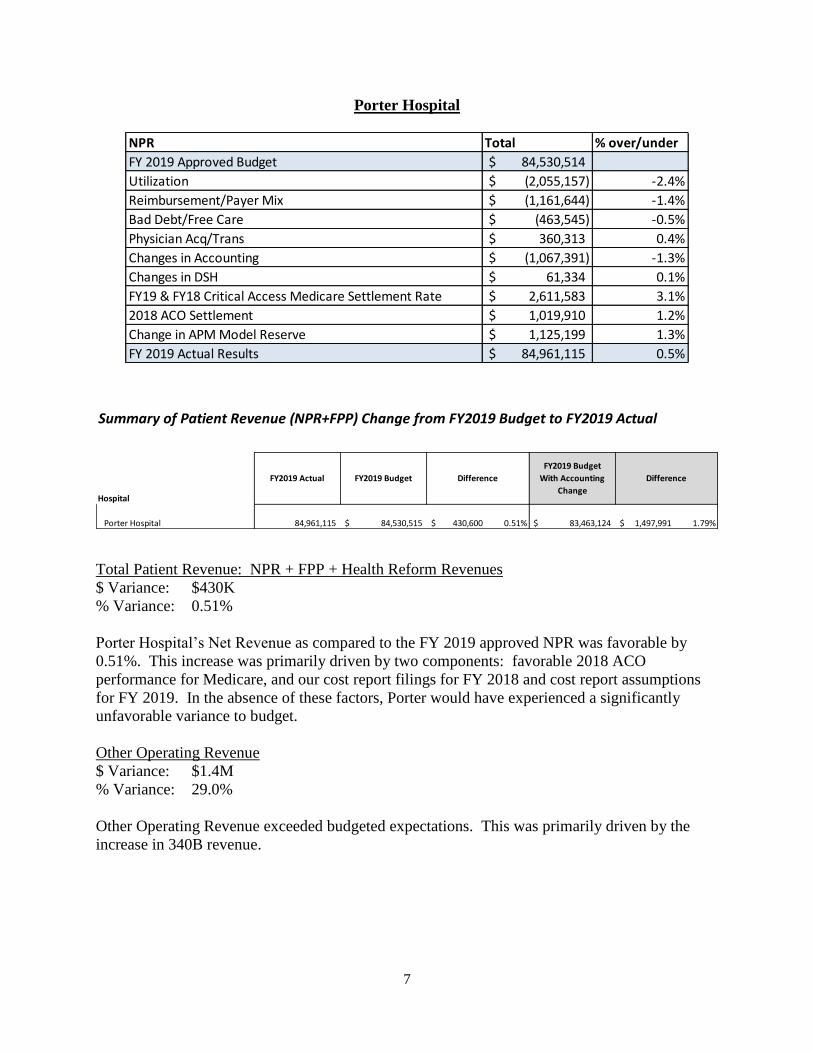
Porter Hospital
Total Patient Revenue: NPR + FPP + Health Reform Revenues
$ Variance: $430K
% Variance: 0.51%
Porter Hospital’s Net Revenue as compared to the FY 2019 approved NPR was favorable by
0.51%. This increase was primarily driven by two components: favorable 2018 ACO
performance for Medicare, and our cost report filings for FY 2018 and cost report assumptions
for FY 2019. In the absence of these factors, Porter would have experienced a significantly
unfavorable variance to budget.
Other Operating Revenue
$ Variance: $1.4M
% Variance: 29.0%
Other Operating Revenue exceeded budgeted expectations. This was primarily driven by the
increase in 340B revenue.
NPR Total % over/under
FY 2019 Approved Budget 84,530,514$
Utilization (2,055,157)$ -2.4%
Reimbursement/Payer Mix (1,161,644)$ -1.4%
Bad Debt/Free Care (463,545)$ -0.5%
Physician Acq/Trans 360,313$ 0.4%
Changes in Accounting (1,067,391)$ -1.3%
Changes in DSH 61,334$ 0.1%
FY19 & FY18 Critical Access Medicare Settlement Rate 2,611,583$ 3.1%
2018 ACO Settlement 1,019,910$ 1.2%
Change in APM Model Reserve 1,125,199$ 1.3%
FY 2019 Actual Results 84,961,115$ 0.5%
Summary of Patient Revenue (NPR+FPP) Change from FY2019 Budget to FY2019 Actual
Hospital
Porter Hospital 84,961,115 84,530,515$ 430,600$ 0.51% 83,463,124$ 1,497,991$ 1.79%
FY2019 BudgetFY2019 Actual Difference
FY2019 Budget
With Accounting
Change
Difference
8
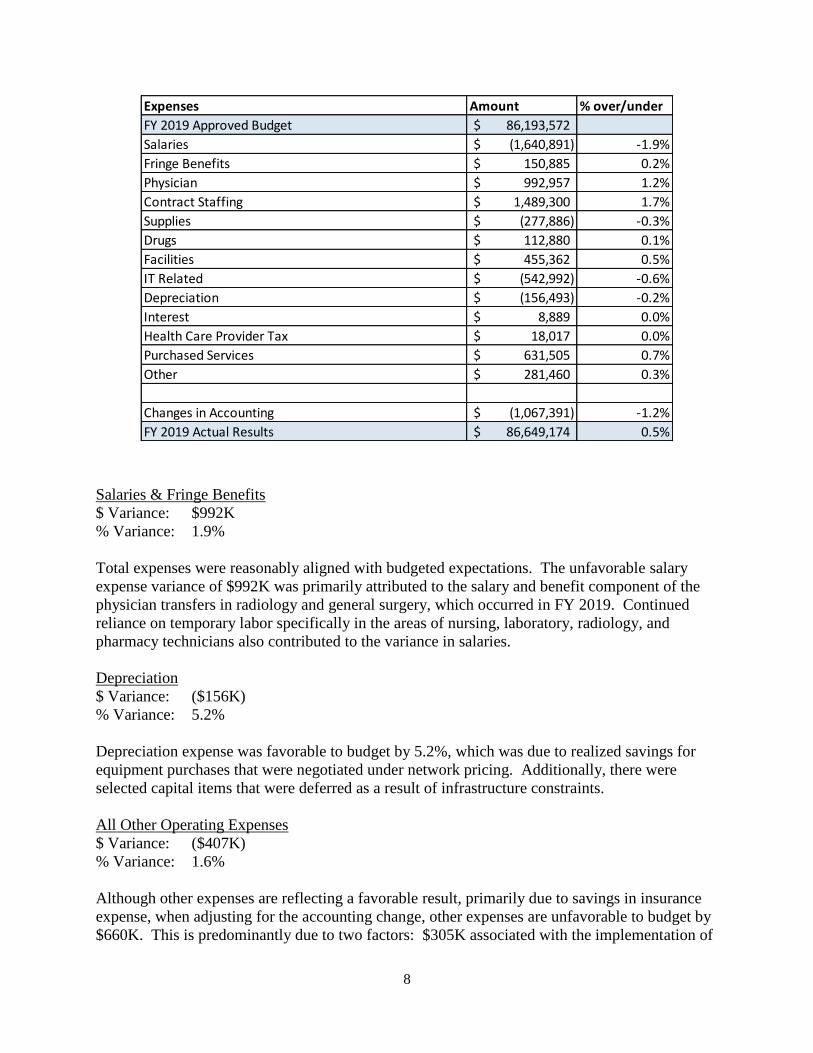
Salaries & Fringe Benefits
$ Variance: $992K
% Variance: 1.9%
Total expenses were reasonably aligned with budgeted expectations. The unfavorable salary
expense variance of $992K was primarily attributed to the salary and benefit component of the
physician transfers in radiology and general surgery, which occurred in FY 2019. Continued
reliance on temporary labor specifically in the areas of nursing, laboratory, radiology, and
pharmacy technicians also contributed to the variance in salaries.
Depreciation
$ Variance: ($156K)
% Variance: 5.2%
Depreciation expense was favorable to budget by 5.2%, which was due to realized savings for
equipment purchases that were negotiated under network pricing. Additionally, there were
selected capital items that were deferred as a result of infrastructure constraints.
All Other Operating Expenses
$ Variance: ($407K)
% Variance: 1.6%
Although other expenses are reflecting a favorable result, primarily due to savings in insurance
expense, when adjusting for the accounting change, other expenses are unfavorable to budget by
$660K. This is predominantly due to two factors: $305K associated with the implementation of
Expenses Amount % over/under
FY 2019 Approved Budget 86,193,572$
Salaries (1,640,891)$ -1.9%
Fringe Benefits 150,885$ 0.2%
Physician 992,957$ 1.2%
Contract Staffing 1,489,300$ 1.7%
Supplies (277,886)$ -0.3%
Drugs 112,880$ 0.1%
Facilities 455,362$ 0.5%
IT Related (542,992)$ -0.6%
Depreciation (156,493)$ -0.2%
Interest 8,889$ 0.0%
Health Care Provider Tax 18,017$ 0.0%
Purchased Services 631,505$ 0.7%
Other 281,460$ 0.3%
Changes in Accounting (1,067,391)$ -1.2%
FY 2019 Actual Results 86,649,174$ 0.5%
9
the Workday payroll and HRIS system, and $345K for a negotiated property lease settlement.
Net Operating Margin
$ Variance: $1.4M
% Variance: 1.5%
Operating margin performance was favorable to budgeted expectations. The positive
performance from an operating perspective was mainly driven by favorable 2018 Medicare
performance in the ACO, and FY 2018 and FY 2019 cost report settlements and assumptions. In
the absence of these factors, Porter would have experienced a breakeven operating margin as
compared to budget.
Non-Operating Revenue
$ Variance: $298K
% Variance: 74.7%
Non-operating revenue exceeded budgeted expectations due to favorable investment
performance.
Total Margin
$ Variance: $1.7M
% Variance: 1.8%
Total margin exceeded budgeted expectations due to aforementioned factors.
10
UVM Medical Center
Total Patient Revenue: NPR + FPP + Health Reform Revenues
$ Variance: $11.8M
% Variance: 0.9%
While there was a favorable revenue variance of $11.8M, it is important to understand the
driving factors behind it and the real impact it had on the total expense base. The expense
related to this addition revenue was much higher than $11.8M, resulting in a margin deficit.
Actual collections rates were below budget estimates by approximately -1.0%, which
resulted in an unfavorable variance to budget of approximately -$30M in revenues. The
primary causes of this were: the commercial rate request was reduced from 4.0% to 2.5%
by the Green Mountain Care Board; there was a change in the outpatient Medicare
payment rates; and lower than anticipated ACO revenues.
Although professional revenues were lower than budget, revenues from additional
inpatient and outpatient volume helped fill the revenue void created by the unfavorable
collection rate. However, there were additional expenses associated with this volume,
which the hospital had to find other sources to fund.
Additional revenues related to increased utilization and base cost of pharmaceuticals
provided to patients we served resulted in an additional $10M to $15M in revenues.
These revenues were the result of a higher pharmaceutical expense base to treat patients.
Other Operating Revenue
$ Variance: $45.4M
% Variance: 43.0%
The main driver was higher than budgeted 340B specialty and contract pharmacy volume.
Another large driver was the fact that for FY 2019, the UVM Health Network was required to
adopt the new Revenue Recognition accounting pronouncement. Grant revenues are now
reported in hospital operations, which accounts for $8.6M of this variance. Because grant
revenues equal grant expenses, they have a bottom line zero dollar impact.
Staff Salaries
$ Variance: ($31.9M)
% Variance: (7.2%)
Below are the driving factors of this variance:
11
Additional FTEs primarily related to additional inpatient and outpatient volume/revenues
drove a significant increase in the number of FTEs, which accounts for over $16M of the
variance.
Due to workforce challenges, there was an increased utilization of travelers and other
premium pay factors, which resulted in an approximately $6.4M variance.
Unbudgeted salary increases due to higher than expected wage inflation/low
unemployment (tech and nurse union contract, $13 hour minimum, LNA increase, other
range and market adjustments) resulting in $6.6M of variance.
Due to a reporting change for grant revenues and expenses, grant salaries are now
reported as part of hospital operations. Because grant expenses are covered by grant
revenues, they have a bottom line zero dollar impact. This expense was not budgeted,
and the variance accounts for $3.2M.
Physician Salaries
$ Variance: $4.4M
% Variance: 2.6%
Professional revenues were lower than budget, which had a direct impact on the Medical
Group’s financial performance. There is an adjustment portion of the physician’s salary related
to performance, which generated a lower salary base and accounts for this favorable variance.
Fringe Benefits
$ Variance: $0.8M
% Variance: 0.5%
Favorability in Workers Comp, Physician, and Non-Physician fringes, offset by higher claims
experience in our self-funded plan.
All Other Operating Expenses
$ Variance: ($41.4M)
% Variance: (9.7%)
Higher medical surgical supplies of $8.5M driven from high volume and revenues. Higher
pharmacy expense of $22.7M, driven by higher volumes/revenues and increased cost base.
Higher purchased services of $10M, offset by $8.2M of favorable expense variance across other
areas.
Net Operating Margin
$ Variance: ($7.8M)
% Variance: (20.0%)
12
Expense variances were larger than the revenue variances. The difference between our requested
and budgeted 4.0% commercial rate increase and the 2.5% that was approved was $6M. If the
4.0% had been approved, we would have covered more of the inflationary increases in our
budget, and we would have come close to meeting our net operating margin target.
Non-Operating Revenue
$ Variance: $1.5M
% Variance: 4.4%
Higher than budgeted market performance on investments.
Total Margin
$ Variance: ($6.4M)
% Variance: (8.9%)
Large operating margin variance with a small market performance offset.
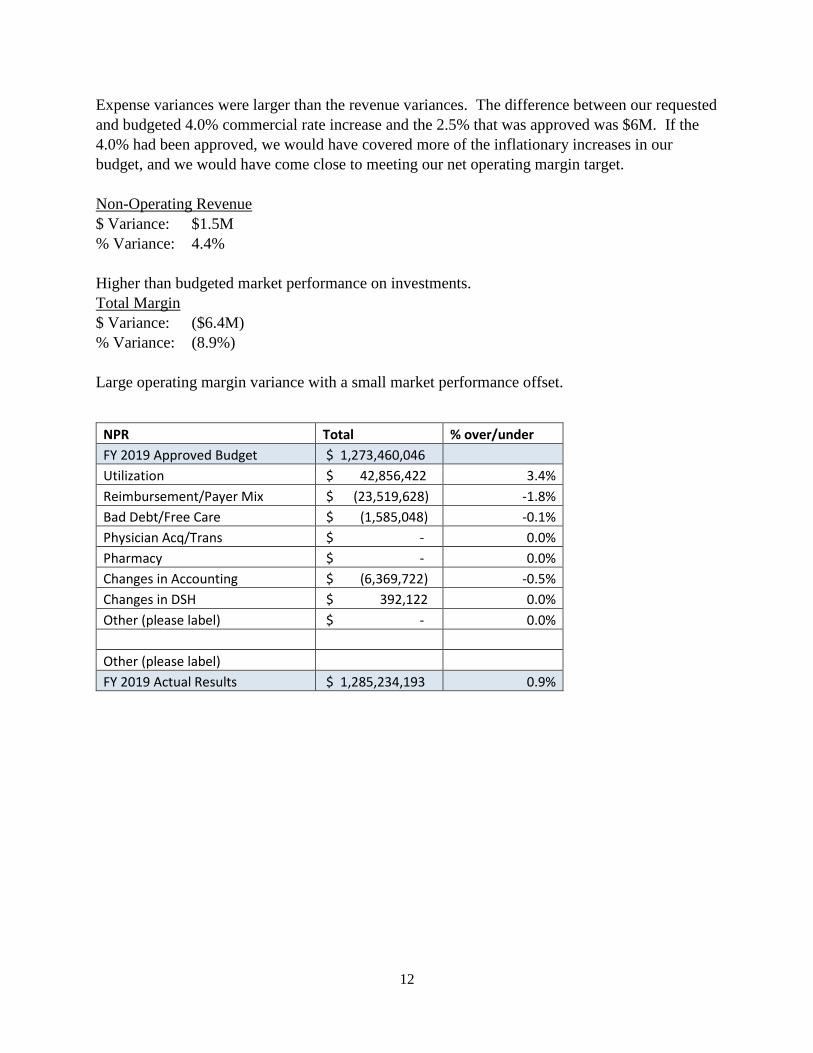
NPR Total % over/under
FY 2019 Approved Budget $ 1,273,460,046
Utilization $ 42,856,422 3.4%
Reimbursement/Payer Mix $ (23,519,628) -1.8%
Bad Debt/Free Care $ (1,585,048) -0.1%
Physician Acq/Trans $ - 0.0%
Pharmacy $ - 0.0%
Changes in Accounting $ (6,369,722) -0.5%
Changes in DSH $ 392,122 0.0%
Other (please label) $ - 0.0%
Other (please label)
FY 2019 Actual Results $ 1,285,234,193 0.9%

13
Expenses Amount % over/under
FY 2019 Approved Budget $ 1,339,909,057
Salaries $ 11,539,704 0.9%
Fringe Benefits $ (1,788,124) -0.1%
Physician $ (5,456,529) -0.4%
Contract Staffing $ 18,007,324 1.3%
Supplies $ 8,099,627 0.6%
Drugs $ 22,758,522 1.7%
Facilities $ (2,036,608) -0.2%
IT Related $ 1,242,540 0.1%
Depreciation $ (396,676) 0.0%
Interest $ (2,055,038) -0.2%
Health Care Provider Tax $ (503,175) 0.0%
Purchased Services $ 11,537,238 0.9%
Other $ 1,863,812 0.1%
Grant Accounting Adjustment $ 8,590,689 0.6%
Changes in Accounting $ (6,369,722) -0.5%
FY 2019 Actual Results $ 1,404,942,642 4.9%
Related Documents