Welcome message from author
This document is posted to help you gain knowledge. Please leave a comment to let me know what you think about it! Share it to your friends and learn new things together.
Transcript


i
Table of contents
Reference to Particulars Paragraph(s) Page(s)
Preface v Overview vii-xvii Chapter-I Functioning of State Public Sector Undertakings 1 1-16 Introduction 1.1 1 Accountability framework 1.2-1.4 1-2 Stake of Government of Uttar Pradesh 1.5 2 Investment in State PSUs 1.6-1.7 2-4 Special support and returns during the year 1.8 4-6 Reconciliation with Finance Accounts 1.9 6 Arrears in finalisation of accounts 1.10-1.12 6-8 Impact of not finalised accounts 1.13 8 Placement of Separate Audit Reports 1.14 9 Performance of PSUs as per their latest finalised accounts 1.15-1.18 10-11 Winding up of not working PSUs 1.19-1.20 12 Accounts Comments 1.21-1.22 12-14 Response of the Government to Audit 1.23 14 Follow up action on Audit Reports 1.24-1.26 14-15 Disinvestment, Restructuring and Privatisation of PSUs and
reforms in power sector 1.27 16
Chapter-II Performance Audits relating to Government companies
and Statutory corporations 2 17-127
Performance Audit on Re-structured Accelerated Power Development and Reforms Programme
2.1 17-46
Performance Audit on Working of Electrical Wing of the Uttar Pradesh Rajkiya Nirman Nigam Limited
2.2 47-75
Audit on Metering System in Dakshinanchal Vidyut Vitran Nigam Limited
2.3 76-88
Audit on Construction of Solid Waste Management System in selected cities by Construction and Design Services wing of Uttar Pradesh Jal Nigam
2.4 89-107
Audit on Recovery of dues by Uttar Pradesh Financial Corporation
2.5 108-119
Follow-up Audit of Performance Audit on Functioning of Uttar Pradesh State Road Transport Corporation
2.6 120-127
Chapter-III Transaction Audit Observations relating to Government
companies and Statutory corporations 3 129-143
Purvanchal Vidyut Vitran Nigam Limited Undue benefit to consumer 3.1 129-130 Delay in change of category of consumer 3.2 130-131 Fixed charges not recovered due to delay in release of
connection 3.3 131-133
ii
Chapter-III Purvanchal Vidyut Vitran Nigam Limited and Uttar
Pradesh Power Transmission Corporation Limited
Undue favour to contractors 3.4 133-134 Uttar Pradesh Rajkiya Nirman Nigam Limited Loss due to undue benefit to contractor 3.5 134-135 Loss due to payment to contractor without ensuring actual
value of work 3.6 135-136
Avoidable payment of Income Tax 3.7 136-137 Loss due to inadmissible expenditure on quality control
tests 3.8 137-138
Dakshinanchal Vidyut Vitran Nigam Limited Loss due to not-levying of Regulatory Surcharge 3.9 138-139 Uttar Pradesh Jal Nigam Infructuous expenditure 3.10 139-141 Avoidable expenditure on disposal of surplus earth 3.11 141-143
No. ANNEXURES 1.1 Statement showing summarised financial position and
working results of Government companies and Statutory corporations as per their latest finalised financial statements/ accounts
1.1 and 1.15 145-151
1.2 Statement showing investments made by the State Government in PSUs whose accounts are in arrears
1.11 152
2.1.1 Organisational Chart 2.1.3 153 2.1.2 Statement showing test checked towns 2.1.6 154
2.1.3 A Statement showing overall financial progress of R-APDRP as on 31 March 2016
2.1.7 and 2.1.27
155
2.1.3 B Statement showing financial progress of test checked towns as on 31 March 2016
2.1.7 and 2.1.27
155
2.1.4 A Statement showing overall physical progress of Part-B (R-APDRP)
2.1.7 and 2.1.27
156
2.1.4 B Statement showing physical progress (test checked town) of Part-B (R-APDRP)
2.1.7 and 2.1.27
156
2.1.5 Chart showing town-wise AT&C losses 2.1.12 157 2.1.6 Statement showing module-wise recommendations to
address the deficiencies noticed in UAT 2.1.16 158-159
2.1.7 Statement showing milestone based payment to IT consultant
2.1.22 160
2.1.8 Statement showing delay in award of work of Part-B from date of sanction of projects
2.1.36 161
2.1.9 Statement showing delay in award of work of Part-B from date of sanction of DPRs
2.1.36 162
2.2.1 Organisational Chart of Electrical Wing of UPRNN 2.2.2 163 2.2.2 A Statement showing year-wise physical and financial
progress of the electrical works executed by 26 Electrical Units
2.2.6 164
2.2.2 B Statement showing year-wise physical and financial progress of the electrical works executed by eight selected units
2.2.6 164
2.2.3 A Statement showing year-wise financial target and achievement of 26 Electrical Units
2.2.9 165
iii
No. ANNEXURES 2.2.3 B Statement showing year-wise financial target and
achievement of eight selected units 2.2.9 165
2.2.4 Statement showing technical staff required as per turnover, actual staff deployed and shortage of staff
2.2.10 166
2.2.5 Statement showing the required unit head and actual unit head during 2015-16
2.2.10 166
2.3.1 Statement showing roles of headquarters and field units of DVVNL in Metering System
2.3.1 167
2.3.2 Statement showing the details of short procurement of meters
2.3.5 168
2.3.3 Statement showing the details of delay in finalisation of tenders
2.3.6 169
2.3.4 Statement showing the details of the meters got defective due to “No Display”
2.3.8 169
2.3.5 Statement showing the details of periodical inspection of meters
2.3.16 170
2.3.6 Statement showing the position of ad-hoc billing 2.3.19 171
2.3.7 Statement showing the details of excess payment made to the firm engaged in work of taking meter reading and bill generation
2.3.21 172
2.3.8 Statement showing the loss of revenue due to not charging rates as per urban schedule to PTW consumers
2.3.23 173-174
2.4.1 Organisational chart of Construction and Design Services Wing
2.4.1 175
2.4.2 Statement showing role of various agencies involved in execution of the projects
2.4.1 176-177
2.4.3 Statement showing details of sanctioned cost, funds received, expenditure incurred and physical progress of projects as on 31 March 2016
2.4.3 178
2.4.4 Statement showing details of projects wherein project cost is same but capital grant is not at par
2.4.6 179
2.4.5 Statement showing detailed reasons for delay in execution of selected MSWM projects
2.4.8 180-184
2.4.6 Statement showing irregular release of capital grant and loss of interest thereon
2.4.16 185-187
2.5.1 Organisational chart and role of officers at headquarters, zonal offices and regional offices of the UPFC
2.5.1 and 2.5.6
188
2.5.2 Statement showing delay in issue of demand notice 2.5.7 189 2.5.3 Statement showing delay in issue of notice under Section 29
of SFCs Act 2.5.7 190
2.5.4 Statement showing cases in which OTS was done below value of mortgaged assets
2.5.17 191
2.6.1 Statement showing bills sent to Department but not verified as on 31 March 2016
2.6.5 192
3.1 Statement showing loss of revenue 3.1 193-195

iv
v
Preface This report deals with the results of audit of Government companies and Statutory corporations for the year ended 31 March 2016. The accounts of Government companies (including companies under Section 139 (5) and 139 (7) of the Companies Act, 2013) are audited by the Comptroller and Auditor General of India (CAG) under the provisions of section 143 (6) of the Companies Act, 2013. The accounts certified by the Statutory Auditors (Chartered Accountants) appointed by the Comptroller and Auditor General under the Companies Act are subject to supplementary audit by officers of the CAG and the CAG gives his comments or supplements the reports of the Statutory Auditors. In addition, these Companies are also subject to test audit by the CAG. Reports in relation to the accounts of a Government company or Statutory corporation are submitted to the Government by CAG for laying before State Legislature under the provisions of Section 19A of the Comptroller and Auditor General’s (Duties, Powers and Conditions of Service) Act, 1971. The instances mentioned in this Report are those, which came to notice in the course of test audit for the period 2015-16 as well as those, which came to notice in earlier years, but could not be reported in the previous Audit Reports; matters relating to the period subsequent to 2015-16 have also been included, wherever necessary. The audit has been conducted in conformity with the Auditing Standards issued by the Comptroller and Auditor General of India.

v
Overview
vii
OVERVIEW This Report contains three Chapters. Chapter-I contains Functioning of State Public Sector Undertakings, Chapter-II includes Reports of two Performance Audits and three Audits viz. Audit on Metering System in Dakshinanchal Vidyut Vitran Nigam Limited, Audit on Construction of Solid Waste Management System in selected cities by Construction and Design Services Wing of Uttar Pradesh Jal Nigam, Audit on Recovery of dues by Uttar Pradesh Financial Corporation and one Follow-up audit of Performance Audit on Functioning of Uttar Pradesh State Road Transport Corporation. Chapter-III contains 11 Transaction Audit Paragraphs on Government companies and Statutory corporations. The total financial impact of Audit findings is of ` 2,526.92 crore.
Chapter-I: Functioning of State Public Sector Undertakings
Audit of Government companies is governed by Section 139 and 143 of the Companies Act, 2013. The Accounts of Government companies are audited by Statutory Auditors appointed by Comptroller and Auditor General of India. These Accounts are also subject to supplementary audit conducted by Comptroller and Auditor General of India. Audit of Statutory corporations is governed by their respective legislations. As on 31 March 2016, the State of Uttar Pradesh had 65 working PSUs (58 Government companies and seven Statutory corporations) and 38 not working PSUs (all Government companies). The working PSUs registered a turnover of ` 85,281.53 crore and incurred overall aggregate loss of ` 17,789.91 crore as per their latest finalised Accounts as of 30 September 2016.
(Paragraphs 1.1 and 1.2) Investments in State PSUs As on 31 March 2016, the investment (Capital and Long Term Loans) in 103 PSUs was ` 1,96,277.76 crore. It grew by 200.55 per cent from ` 97,867.69 crore in 2011-12 to ` 1,96,277.76 crore in 2015-16 mainly because of increase in investment in Power Sector, which accounted for 99.46 per cent of the total investment in 2015-16. The Government contributed ` 19,794.16 crore towards equity, loans and grants/subsidies to PSUs during 2015-16.
(Paragraphs 1.6 and 1.8) Performance of PSUs as per their latest finalised Accounts As per latest finalised Accounts, out of 65 working PSUs, 33 PSUs earned profit of ` 707.52 crore and 24 PSUs incurred loss of ` 18,497.43 crore. Four working PSUs had not submitted their first Accounts whereas four working PSUs prepared their Accounts on a “no profit no loss” basis.
(Paragraph 1.16) Accounts Comments The quality of Accounts of PSUs needs improvement. Of the 44 Accounts finalised by 31 working companies during October 2015 to September 2016, the Statutory Auditors had given qualified certificates for 42 Accounts, adverse certificates for one Accounts and disclaimer for one Account. There were 95 instances where compliance of Accounting Standards was not done in 26 Accounts. Four Accounts of four working Statutory corporations were finalised during October 2015 to September 2016. Of these, two Accounts where Comptroller and Auditor General of India is the sole auditor, qualified
Audit Report on Public Sector Undertakings for the year ended 31 March 2016
viii
certificate was issued for one Account and adverse certificate was issued for the other Account. For the remaining two Accounts, Statutory Auditors had given qualified certificate for one Account and adverse certificate for the other Account. There were five instances where compliance of Accounting Standards was not done in two Accounts.
(Paragraphs 1.21 and 1.22) Arrears in finalisation of Accounts Out of 65 working PSUs, only three PSUs finalised the accounts for the year 2015-16 while 62 PSUs had 266 accounts in arrears as of September 2016 with the extent of arrears ranging from one year to 20 years. Out of 38 not working PSUs, 12 PSUs were in the process of liquidation and the remaining 26 PSUs had arrears of 422 Accounts for one to 33 years. The State Government had invested ` 19,794.16 crore (equity: ` 19,251.33 crore, loans: ` 162.73 crore, grants: ` 320.93 crore and subsidies ` 59.17 crore) in nine working PSUs during the year for which Accounts have not been finalised. In the absence of finalisation of Accounts and their subsequent audit, it could not be ascertained whether the investments and expenditure incurred had been properly accounted for and the purposes for which the amount was invested was achieved. As a result, Government’s investment in such PSUs remained outside the control of the State Legislature.
(Paragraphs 1.10, 1.11 and 1.12) Placement of Separate Audit Reports Separate Audit Reports (SARs) of Accounts of two to six years of six Corporations were not placed in the State Legislature. This weakens the legislative control over Statutory corporations and dilutes the latter’s financial accountability.
(Paragraph 1.14) Winding up of PSUs which are not working Twenty six PSUs are not working since four to 41 years. Although State Government decided for closure of these PSUs, no winding up process has been started.
(Paragraph 1.20) Follow-up action on Audit Reports All the Administrative Departments were required to submit replies/explanatory notes to paragraphs/performance audits included in the Audit Reports of the CAG of India within a period of two to three months of their presentation to the Legislature. Out of 73 paragraphs and 13 performance audits pertaining to the Audit Reports (Commercial/PSUs) for the years 2010-11 to 2014-15, explanatory notes to 36 paragraphs and 10 performance audits in respect of 10 Departments were awaited (October 2016).
(Paragraph 1.24)
Chapter-II: Performance Audits relating to Government companies and Statutory corporations
2.1 Performance Audit on Re-structured Accelerated Power Development and Reforms Programme Accelerated Power Development and Reforms Programme (APDRP) was modified (September 2008) during the XI Plan as "Re-structured Accelerated Power Development and Reforms Programme (R-APDRP)" by the Ministry of
Overview
ix
Power (MoP), Government of India (GoI). The main objectives of R-APDRP were to reduce Aggregate Technical and Commercial (AT&C) losses, bring about commercial viability in the power sector and increase consumer satisfaction. In Uttar Pradesh, the Scheme was implemented by Uttar Pradesh Power Corporation Limited (UPPCL) and Power Distribution Companies (DISCOMs) in 168 towns. The scheme was divided into Part-A and Part-B. Part-A included (i) establishment of baseline data, Information Technology (IT) applications for energy accounting/ auditing and IT based consumer service center, (ii) establishment of Supervisory Control and Data Acquisition System/ Distribution Management System (SCADA/DMS) in large towns and Part-B included regular distribution system strengthening works. The scheme was to be completed within three years from the sanction of project (June 2009) but the same was extended upto March 2017 for Part-A (i) and for Part-A (ii) SCADA and Part-B upto May 2017. Important audit findings are discussed below:
Part-A (i) of the scheme Under Part-A of the scheme, 100 per cent funds for the projects were to be provided in the form of interest bearing loan from GoI to be converted into a grant once the establishment of the required system was achieved and verified by an independent agency. Part-A of the Scheme was implemented in 168 towns with sanctioned cost of ` 775.10 crore out of which ` 508.01 crore was spent up to March 2016. In 43 selected towns, it was noticed that IT enabled system was not completed under Part-A by Information Technology Implementation Agency (ITIA) even after expiry of five years from scheduled period of completion. However, the projects had been declared Go-live in all the towns.
As the IT enabled system was not completed, the Baseline data could not be verified by Third Party Independent Evaluation Agency (TPIEA) appointed by Power Finance Corporation (PFC) so far (October 2016). The AT&C losses generated by the system even after declaration of all the towns Go-live (June 2015) were erratic and ranged between (-) 99.83 and 99.92 per cent during July 2015 to July 2016. Therefore, chances of completion of scheme even in extended period (up to March 2017) and conversion of loan of ` 474.50 crore received from GoI into grant remains remote.
(Paragraph 2.1.12) DISCOMs made irregular payment of ` 8.98 crore to Network Bandwidth Service Provider (NBSP) for partial connectivity in a town, whereas payments were to be made on successful connectivity of all the links in a town. The fact regarding poor NBSP services were also confirmed by Chief Executive Officers of beneficiary DISCOMs in the survey conducted by Audit.
(Paragraph 2.1.13) The objective of Meter Data Acquisition System (MDAS) to acquire meter data automatically without human intervention was defeated as 18 per cent sub-stations were not communicating data automatically and eight per cent feeders and 57 per cent Distribution Transformers (DTs) were not updated in MDAS as of March 2016.
(Paragraph 2.1.14)
Audit Report on Public Sector Undertakings for the year ended 31 March 2016
x
Out of 55,751 modems installed on DTs, data communication was working only in 11,933 modems (16 per cent of DTs) as of 31 March 2016. Due to this deficiency in data communication, DISCOMs were compelled to fill the gaps of energy data through manual entries, thus, defeating the objective of eliminating human intervention in energy accounting/auditing.
(Paragraph 2.1.15)
Reports generated by Customer Care Centre were not as per System Requirement Specification and the reports prescribed for status, age and level of pendency of complaints were not being generated.
(Paragraph 2.1.17)
Part-A (ii) Supervisory Control and Data Acquisition System SCADA was to be implemented in 12 towns as per guidelines of the scheme with the sanctioned cost of ` 280.81 crore. There was no physical progress in the project even after a lapse of more than four years and its completion would not be possible in the extended period upto May 2017; therefore, conversion of loan of ` 79.96 crore into grant would become inadmissible.
(Paragraph 2.1.25) Part-B of the scheme Part-B of the scheme was implemented in 167 towns1 with sanctioned cost of ` 6915.57 crore out of which ` 3,239.12 crore was spent as of March 2016. However, overall physical progress was only 56.65 per cent despite lapse of six years. Only one town i.e. Etawah was completed as of March 2016.
The AT&C losses of the DISCOMs which ranged between 23.38 and 34.92 per cent for base year 2009 increased from 33.04 to 45.95 per cent (July 2015 to July 2016) despite declaring Go-live of all towns. In one completed town i.e. Etawah, it increased from 65.71 per cent (February 2013 to April 2013) to 73.16 per cent in July 2016. In fact in all four DISCOMs, the AT&C losses actually increased after declaring the towns under them as Go-live. Thus, chance for conversion of loan of ` 3,556.24 crore into Grant of ` 1,778.12 crore (50 per cent of loan) looks remote.
(Paragraph 2.1.28)
Variation in scope of work and delay in award of work by 18 to 45 months from the date of sanction of Detail Project Reports (DPR) in 33 towns out of 42 towns resulted in cost escalation of ` 737.88 crore.
(Paragraph 2.1.36) Madhyanchal Vidyut Vitran Nigam Limited failed to offer the work to Turnkey contractor (TKC) within the validity period of rates which resulted in extra financial burden of ` 134.33 crore on the scheme.
(Paragraph 2.1.37) As per Central Vigilance Commission’s (CVC) guidelines (December 2007), verification of Bank Guarantee (BG) should be done before acceptance. Purvanchal Vidyut Vitran Nigam Limited in contravention of CVC guidelines, accepted BGs of ` 14.32 crore of a non-banking financial company from TKC without verification from the bank. During subsequent scrutiny (May 2015), it
1 Out of 168 towns, one town i.e. Noida was not selected by Paschimanchal Vidyut Vitran Nigam
Limited for implementing Part-B works, as system strengthening work was not required there.
Overview
xi
was revealed that the BGs were fake. As a result, though the agreement was terminated in July 2015, the BGs could not be encashed.
(Paragraph 2.1.38) The work of Part-B under R-APDRP in Kannauj Town was closed in April 2015 as GoUP, without assigning any reason, decided (April 2015) for conversion of overhead electrical system into underground system under Twarit Arthik Vikas Yojna of GoUP instead of under R-APDRP. However, BoD of DVVNL, prepared the DPR for the scheme, citing political sensitivity of the town as reason for the change. Thus, the improper planning while constructing overhead lines for Kannuaj Town resulted in infructuous expenditure of ` 3.10 crore incurred on construction of overhead lines.
(Paragraph 2.1.40) In six towns DISCOMs failed to provide land to TKCs for 20 sub-stations after lapse of 14 to 37 months as on March 2016. Further, due to pending completion of associated works in four towns, six sub-stations were energised with the old existing line. This fact was substantiated by the finding of joint physical inspection in Lucknow town.
(Paragraphs 2.1.41 and 2.1.42)
2.2 Performance Audit on Working of Electrical Wing of the Uttar Pradesh Rajkiya Nirman Nigam Limited
Uttar Pradesh Rajkiya Nirman Nigam Limited (Company) executes civil and electrical works. There were 26 Electrical Units (Units) which executed 957 electrical works of ` 4,006.83 crore. The eight Units test checked in audit executed 481 works valuing ` 2,303.95 crore out of which 273 works were completed at the cost of ` 804.56 crore and 208 works were under progress on which expenditure of ` 1,499.39 crore was incurred during 2011-12 to 2015-16. The important audit findings are discussed below:
The Company executed 88 works of sub-station/cable laying awarded by Uttar Pradesh Power Transmission Company Limited (UPPTCL)/Power Distribution Companies (DISCOMs). Out of this 42 works were completed and 46 works were in progress at the end of March 2016 with delays of one month to four years and four months. As a result of delay in completion of the works, expenditure of ` 1,155.12 crore incurred on 88 works remained blocked for the delayed period. The slow pace of execution by the sub-contractors mainly was due to inadequate deployment of manpower by the sub-contractors at site, despite timely release of funds by the clients. These facts were confirmed by the clients during beneficiary survey done by Audit.
In case of 83 works valuing ` 867.30 crore related to electrical works of other deposit works, completion period was not specified and time of two years to 13 years was taken in execution of the works.
(Paragraphs 2.2.9, 2.2.19, 2.2.28, 2.2.36 and 2.2.37)
Due to failure in ensuring the reasonability of rates, the Company incurred avoidable expenditure of ` 78.55 crore on award of sub-contracts at higher rates and extra expenditure of ` 3.71 crore on purchase of material at higher
Audit Report on Public Sector Undertakings for the year ended 31 March 2016
xii
rates during 2011-12 to 2015-16 which caused financial burden on its clients i.e. DISCOMs, UPPTCL and Government Departments.
(Paragraphs 2.2.20, 2.2.38 and 2.2.39)
Central Vigilance Commission (CVC) guidelines (October 1997, April 2007 and February 2011) provide that provision of allowing mobilisation advance should be clearly stipulated in the tender document. In case where it is to be provided, it should be interest bearing. Failure of General Manager, Financial Adviser and Controller of Accounts of the Company to oversee the compliance of CVC guidelines and lack of their checks as prescribed in the Manual of the Company resulted in irregular grant of interest free mobilisation advance of ` 142.03 crore to the sub-contractors by the Project Incharge of the eight units causing loss of interest of ` 21.90 crore.
(Paragraph 2.2.21) The Units, in violation of provisions of Manual and GFR awarded two works of sub-station to the sub-contractors without inviting tenders and awarded 81 other works without adhering to proper tender procedures. Further, the Units purchased items of ` 19.67 crore through supply orders and executed 68 works through work orders of ` 173.25 crore during 2011-12 to 2015-16 without inviting open tenders.
(Paragraphs 2.2.27 and 2.2.42)
Joint physical verification revealed that three Units failed to assess correct quantity of the materials as per actual requirement. As a result, control cables, power cables and conductors valuing ` 55.22 lakh were purchased in excess of six to 88 per cent of the actual requirement in construction of five sub-stations.
(Paragraph 2.2.32)
The Company did not implement decision of High Level Technical Committee to make provision for cost increase in the estimates for the project period which resulted in cost overrun of ` 216.16 crore in case of 54 works.
(Paragraph 2.2.37)
The Company failed to set and monitor the targets in physical terms. Further, it fixed the financial targets without obtaining inputs from the field units as six to 13 zones out of 15 to 18 zones did not furnish the requisite information during 2011-12 to 2015-16.
(Paragraph 2.2.9) The Company executed 33.17 to 56.51 per cent works through sub-contractors against the prescribed ceiling of 10 to 30 per cent without approval of Managing Director/Board of Directors.
(Paragraph 2. 2.12)
The works were started without obtaining technical sanction. While technical sanctions of 106 works were obtained with a delay of one month to 15 years after the start of the work, it was not obtained so far (March 2016) in respect of other 241works after a lapse of 6 months to 18 years.
(Paragraph 2.2.13)
Eight units incurred an expenditure of ` 59.33 crore in excess of the funds received on 116 works in violation of the provisions of Manual.
(Paragraph 2.2.16)
Overview
xiii
Eight Units failed to close the clients’ accounts after handing over of the work to the client due to which unspent balance of ` 10.77 crore was not refunded to respective clients.
(Paragraph 2.2.49)
2.3 Audit on Metering System in Dakshinanchal Vidyut Vitran Nigam Limited
In power distribution system, ensuring metered supply of power is one of the most important facets for prevention of pilferage/theft of energy. The Electricity Act, 2003 also provides that no licensee shall supply electricity except through installation of a correct meter. Further, U.P. Electricity Regulatory Commission directed the Dakshinanchal Vidyut Vitran Nigam Limited (Company) to ensure hundred per cent metering in its licensed area.
The important audit findings are detailed below: Deficient planning in procurement of meters led to short procurement of meters ranging between 8.11 lakh and 10.43 lakh during the five years ending March 2016. Further, the Company considered many unmetered connections as metered after providing presumptive meter numbers. As a result, number of unmetered connections increased from 10.67 lakh at the end of March 2012 to 12.98 lakh at the end of March 2016.
(Paragraphs 2.3.3 and 2.3.5)
Due to not having a system for procurement of replaceable meter covers for damaged covers despite meters being functional, an avoidable expenditure of ` 21.64 crore was incurred on replacement of 3,03,038 single/three phase meters.
(Paragraph 2.3.10)
Private tube well consumers getting supply as per urban schedule (supply of electricity for more than 10 hours) were short assessed by ` 17.81 crore due to levy of charges applicable for rural schedule.
(Paragraph 2.3.23)
Placing supplementary orders for purchase of 2.60 lakh single phase meters at old rates instead of inviting fresh tenders to get benefit of declining market trend led to loss to the Company for ` 1.86 crore.
(Paragraph 2.3.7) Failure to make inter-circle comparison of offered rates by Material Management wing of the Company led to awarding of work at higher rates resulting in extra expenditure of ` 2.74 crore.
(Paragraph 2.3.20)
The Company made payment at full rates for provisional meter reading and bill generation against the requirement of half of the rates resulting in excess payment of ` 1.48 crore.
(Paragraph 2.3.21)
Audit Report on Public Sector Undertakings for the year ended 31 March 2016
xiv
2.4 Audit on Construction of solid waste management system in selected cities by Construction and Design Services wing of Uttar Pradesh Jal Nigam
The Municipal Solid Waste (Management and Handling) Rules, 2000 notified (September 2000) by the Government of India (GoI) designated the Urban Local Bodies (ULBs) to regulate management and handling of municipal waste in their areas. The GoI sanctioned (September 2006 to January 2011) ` 419.61 crore, under Jawaharlal Nehru National Urban Renewal Mission (JNNURM), for construction of 27 Municipal Solid Waste Management (MSWM) projects in the State of Uttar Pradesh. The Government of Uttar Pradesh (GoUP) nominated (December 2007) Uttar Pradesh Jal Nigam as the executing agency for execution of these projects. The Nigam decided (March 2008) that these projects would be executed by its C&DS wing. The C&DS decided (April 2008) to execute the MSWM projects on Public-Private-Partnership (PPP) model. The important audit findings are detailed below:
Out of 27 Municipal Solid Waste Management (MSWM) projects, only 11 MSWM projects could be completed by the C&DS with a delay of more than three to five years. The remaining 16 MSWM projects were still incomplete even after delay of more than four to eight years.
Thus, ` 173.58 crore invested in 16 incomplete MSWM projects remained blocked/ unfruitful and the intended objective of the MSWM projects i.e. to dispose off of 18.31 lakh tonne municipal solid waste (MSW) per annum, in 16 cities, in a scientific manner could not be achieved even after five to nine years of sanction of the MSWM projects.
(Paragraphs 2.4.2 and 2.4.3)
Expenditure of ` 3.23 crore incurred on procurement of equipment and vehicle remained blocked as project sites were not available for three MSWM projects.
(Paragraph 2.4.10)
Expenditure of ` 126.50 crore incurred on infrastructure for 11 MSWM projects remained unfruitful due to abandonment of the same by the developers. In five selected projects, expenditure of ` 99.54 crore was incurred on construction of compost plant and sanitary landfill (` 50.01 crore), procurement of equipment and vehicles (` 36.96 crore) and other miscellaneous expenditure (` 12.57 crore). In two incomplete MSWM projects (Lucknow and Pilakhuwa) expenditure of ` 51.81 crore remained unfruitful.
(Paragraphs 2.4.11 and 2.4.12)
Undue benefit of ` 91.12 crore was extended to the developers due to release of inadmissible additional capital grant (CG), failure to release proportionate CG, irregular release of CG, release of CG without ascertaining the admissible CG payable, irregular release of mobilisation advances, short recovery of liquidated damages, short recovery of Value Added Tax from the bills and Welfare Cess short deducted.
(Paragraphs 2.4.14, 2.4.15, 2.4.16, 2.4.17, 2.4.19, 2.4.20, 2.4.26 and 2.4.27)
Overview
xv
2.5 Audit on Recovery of dues by Uttar Pradesh Financial Corporation
Uttar Pradesh Financial Corporation (Corporation) disbursed loans of ` 3,248 crore to 41,330 borrowers up to September 2007, out of which principal amount of ` 294.95 crore was pending for recovery from 5,812 borrowers besides interest of ` 29,762.371 crore as on 31 March 2016. As the sanction of loan was stopped by the Corporation from September 2007, recovery of dues remained the main activities of the Corporation. The important audit findings are detailed below:
The process for recovery of dues was not followed diligently by the Corporation, as there was delay in issue of notices to borrowers, release of advertisements in newspapers and taking physical possession of mortgaged assets, which in turn resulted in delay in sale of mortgaged assets and realisation of outstanding principal of ` 68.48 crore.
(Paragraphs 2.5.7 to 2.5.12)
Due to delay in taking authorisation from GoUP for issue of recovery certificate (RC) under Section 32G of State Financial Corporations Act, the Corporation could not effectively pursue the borrowers for recovery of dues through issue of RCs. As a result out of total 1,069 RCs for recovery of dues of ` 83.45 crore pending as on 1 April 2011, only ` 1.17 crore could be recovered.
(Paragraph 2.5.14) The Corporation failed to achieve recovery targets in all the five years from 2011-12 to 2015-16. The recovery of dues declined from ` 46.13 crore in 2011-12 to ` 25.54 crore in 2015-16.
(Paragraph 2.5.5)
Finalisation of One Time Settlement below value of mortgaged assets in eight cases resulted in loss of ` 2.68 crore to the Corporation.
(Paragraph 2.5.17)
2.6 Follow-up Audit of Performance Audit on Functioning of Uttar Pradesh State Road Transport Corporation
Performance Audit on “Functioning of Uttar Pradesh State Road Transport Corporation” covering the period from April 2004 to March 2009 was featured as paragraph 3.1 of Chapter-III of the Audit Report (Commercial) of the Comptroller and Auditor General of India for the year ended 31 March 2009, Government of Uttar Pradesh (GoUP). The Performance Audit has not been discussed by the Committee on Public Undertaking (COPU) so far (October 2016). The Performance Audit contained seven recommendations which were accepted by the Uttar Pradesh State Road Transport Corporation (Corporation) Corporation/GoUP. The Follow-up audit disclosed that one recommendation has been complied by the Corporation and six accepted audit recommendations were yet to be implemented by the Corporation as well as GoUP as the shortcomings noticed earlier still persist as detailed below:
1 Interest of ` 29,762.37 crore as on 31 December 2015.
Audit Report on Public Sector Undertakings for the year ended 31 March 2016
xvi
Neither any plan was drawn nor any action was taken by the Corporation for expansion of operation of buses on routes not nationalised.
(Paragraph 2.6.4)
The Corporation did not frame action plan for timely recovery of dues. Due to this, outstanding dues of only ` 46.58 crore could be recovered upto October 2016 against total dues of ` 83.02 crore pending as on March 2016.
(Paragraph 2.6.5)
The Corporation failed to bring up Public Private Partnership projects for tapping revenue sources from other than traffic revenue.
(Paragraph 2.6.6)
GoUP neither formulated any State transport policy on the lines of National Transport Policy nor took any initiative to do so.
(Paragraph 2.6.9)
GoUP did not follow the provisions of policy document issued in 1994 to appoint Chief Executive of the Corporation at least for a period of three years as the tenure of the Managing Director of the Corporation varied from 18 days to one year nine months and 19 days.
(Paragraph 2.6.10) GoUP did not appoint independent transport regulator though recommendation made by Audit in this regard was accepted by the GoUP.
(Paragraph 2.6.11)
Chapter-III: Transaction Audit Observations
Transaction Audit Observations included in this Report highlight deficiencies in the management of Public Sector Undertakings involving significant financial implications. The irregularities pointed out were broadly of the following nature:
There were four cases of undue favour to consumers/contractors amounting to ` 48.46 crore.
(Paragraphs 3.1, 3.4, 3.5 and 3.6) There were five cases of violation of statutory obligations amounting to ` five crore.
(Paragraphs 3.2, 3.3, 3.8, 3.9 and 3.11) There were two cases of defective/deficient planning leading to loss of ` 8.32 crore.
(Paragraphs 3.7 and 3.10) Gist of some important paragraphs is given below:
Uttar Pradesh Rajkiya Nirman Nigam Limited (UPRNN) extended undue benefit to the contractor by providing advances on adhoc basis without actual measurement of work which resulted in advances of ` 5.03 crore and interest of ` 6.72 crore remained unrecovered.
(Paragraph 3.5)
Purvanchal Vidyut Vitran Nigam Limited (PuVVNL) extended undue benefit of ` 24.96 crore to consumer by allowing adjustment of banked energy
Overview
xvii
in contravention to the provisions of Captive and Non-conventional Energy Generating Plants (CNCE) Regulations.
(Paragraph 3.1) UPRNN suffered loss of ` 6.63 crore due to payment of more than the actual value of work executed to the contractor.
(Paragraph 3.6)
UPRNN accounted for centage at the rate of 11.50 per cent instead of 6.875 per cent on the expenditure incurred on the works. As a result, it paid Income Tax of ` 5.39 crore on inadmissible centage income.
(Paragraph 3.7)
Uttar Pradesh Jal Nigam failed to provide for the sale of earth on the spot and incurred an avoidable expenditure of ` 2.93 crore on disposal of earth. It also lost opportunity to earn revenue from sale of earth to the extent of ` 75.23 lakh.
(Paragraph 3.11)
PuVVNL suffered loss of revenue of ` 1.38 crore due to inordinate delay in migration of the consumer to HV-2 category.
(Paragraph 3.2)
CHAPTER–I Functioning of State Public
Sector Undertakings

CHAPTER-I 1. Functioning of State Public Sector Undertakings
Introduction
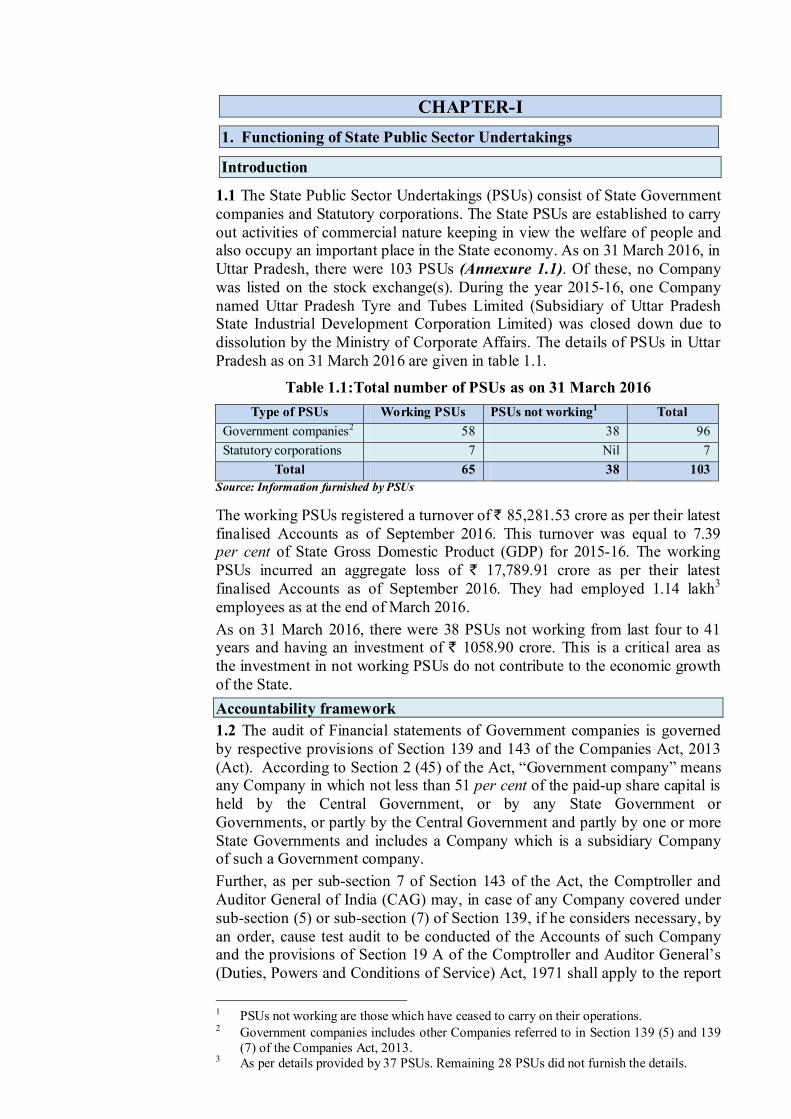
1.1 The State Public Sector Undertakings (PSUs) consist of State Government companies and Statutory corporations. The State PSUs are established to carry out activities of commercial nature keeping in view the welfare of people and also occupy an important place in the State economy. As on 31 March 2016, in Uttar Pradesh, there were 103 PSUs (Annexure 1.1). Of these, no Company was listed on the stock exchange(s). During the year 2015-16, one Company named Uttar Pradesh Tyre and Tubes Limited (Subsidiary of Uttar Pradesh State Industrial Development Corporation Limited) was closed down due to dissolution by the Ministry of Corporate Affairs. The details of PSUs in Uttar Pradesh as on 31 March 2016 are given in table 1.1.
Table 1.1:Total number of PSUs as on 31 March 2016 Type of PSUs Working PSUs PSUs not working1 Total
Government companies2 58 38 96 Statutory corporations 7 Nil 7
Total 65 38 103 Source: Information furnished by PSUs
The working PSUs registered a turnover of ` 85,281.53 crore as per their latest finalised Accounts as of September 2016. This turnover was equal to 7.39 per cent of State Gross Domestic Product (GDP) for 2015-16. The working PSUs incurred an aggregate loss of ` 17,789.91 crore as per their latest finalised Accounts as of September 2016. They had employed 1.14 lakh3 employees as at the end of March 2016. As on 31 March 2016, there were 38 PSUs not working from last four to 41 years and having an investment of ` 1058.90 crore. This is a critical area as the investment in not working PSUs do not contribute to the economic growth of the State. Accountability framework 1.2 The audit of Financial statements of Government companies is governed by respective provisions of Section 139 and 143 of the Companies Act, 2013 (Act). According to Section 2 (45) of the Act, “Government company” means any Company in which not less than 51 per cent of the paid-up share capital is held by the Central Government, or by any State Government or Governments, or partly by the Central Government and partly by one or more State Governments and includes a Company which is a subsidiary Company of such a Government company. Further, as per sub-section 7 of Section 143 of the Act, the Comptroller and Auditor General of India (CAG) may, in case of any Company covered under sub-section (5) or sub-section (7) of Section 139, if he considers necessary, by an order, cause test audit to be conducted of the Accounts of such Company and the provisions of Section 19 A of the Comptroller and Auditor General’s (Duties, Powers and Conditions of Service) Act, 1971 shall apply to the report 1 PSUs not working are those which have ceased to carry on their operations. 2 Government companies includes other Companies referred to in Section 139 (5) and 139 (7) of the Companies Act, 2013. 3 As per details provided by 37 PSUs. Remaining 28 PSUs did not furnish the details.
Audit Report on Public Sector Undertakings for the year ended 31 March 2016
2
of such test Audit. Thus, a Government company or any other Company owned or controlled, directly or indirectly, by the Central Government or by any State Government or Governments or partly by Central Government and partly by one or more State Governments is subject to audit by the CAG. An audit of the financial statements of a Company in respect of the financial years that commenced on or before 31 March 2014 shall continue to be governed by the provisions of the Companies Act, 1956. Statutory Audit 1.3 The financial statements of the Government companies (as defined in Section 2 (45) of the Act) are audited by Statutory Auditors, who are appointed by CAG as per the provisions of Section 139 (5) or (7) of the Act which shall submit a copy of the Audit Report to the CAG which, among other things, including financial statements of the Company under Section 143 (5) of the Act. These financial Statements are subject to supplementary audit conducted by CAG under the provisions of Section 143 (6) of the Act. Audit of Statutory corporations is governed by their respective legislations. Out of seven Statutory corporations, CAG is the sole auditor for Uttar Pradesh State Road Transport Corporation, Uttar Pradesh Avas Evam Vikas Parishad, Uttar Pradesh Forest Corporation and Uttar Pradesh Jal Nigam. In respect of Uttar Pradesh State Warehousing Corporation, Uttar Pradesh Financial Corporation and Uttar Pradesh Government Employees Welfare Corporation, the audit is conducted by the Chartered Accountants and supplementary audit is conducted by CAG. Role of Government and Legislature 1.4 The State Government exercises control over the affairs of these PSUs through its administrative departments. The Chief Executive and Directors to the Board are appointed by the Government. The State Legislature also monitors the accounting and utilisation of Government investment in the PSUs. For this, the Annual Reports together with the Statutory Auditors Reports and comments of the CAG, in respect of State Government companies and Separate Audit Reports in case of Statutory corporations are to be placed before the State Legislature under Section 394 of the Act or as stipulated in the respective Acts. The Audit Reports of CAG are submitted to the Government under Section 19A of the CAG’s (Duties, Powers and Conditions of Service) Act, 1971.
Stake of Government of Uttar Pradesh
1.5 The State Government has huge financial stake in these PSUs. This stake is of mainly three types: Share Capital and Loans– In addition to the Share Capital Contribution, State Government also provides financial assistance by way of loans to the PSUs from time to time. Special Financial Support- State Government provides budgetary support by way of grants and subsidies to the PSUs as and when required. Guarantees– State Government also guarantees the repayment of loans with interest availed by the PSUs from Financial Institutions.
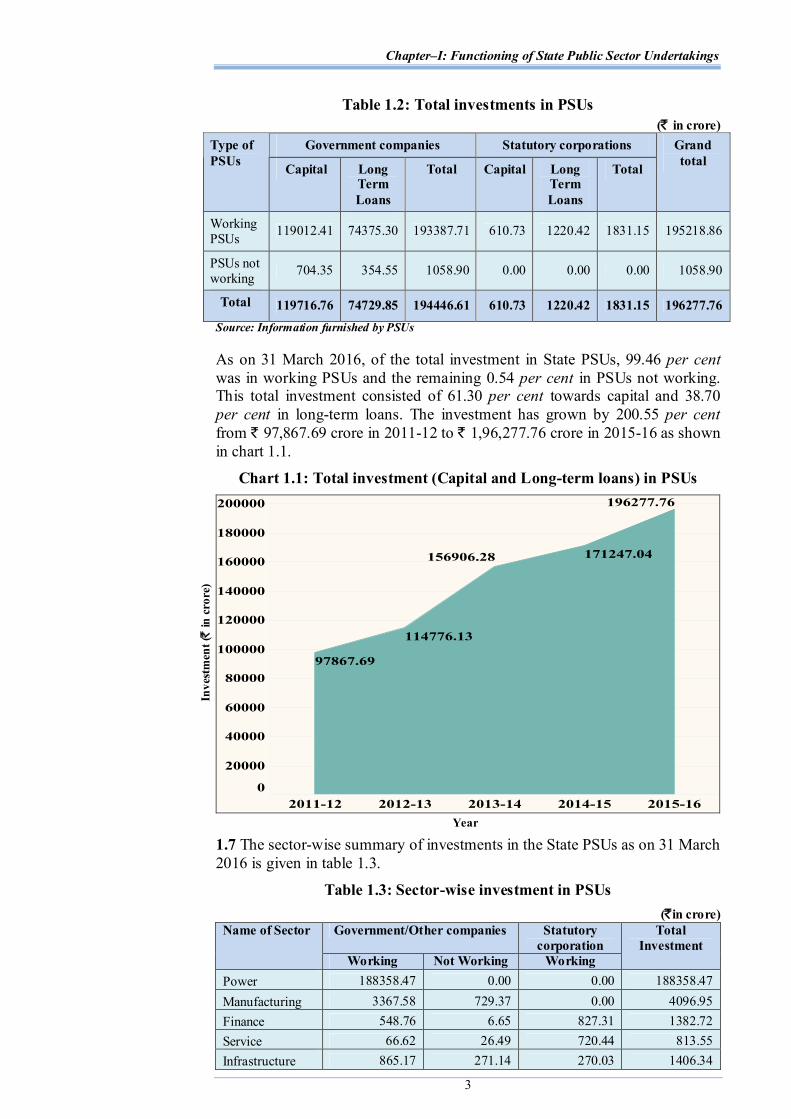
Investment in State PSUs 1.6 As on 31 March 2016, the investment (capital and long-term loans) in 103 PSUs (including companies under Section 139 (5) and 139 (7) of the Act) was ` 1,96,277.76 crore as per details given in table 1.2.
Chapter–I: Functioning of State Public Sector Undertakings
3
Table 1.2: Total investments in PSUs (` in crore)
Government companies Statutory corporations Type of PSUs Capital Long
Term Loans
Total Capital Long Term Loans
Total
Grand total
Working PSUs 119012.41 74375.30 193387.71 610.73 1220.42 1831.15 195218.86
PSUs not working 704.35 354.55 1058.90 0.00 0.00 0.00 1058.90
Total 119716.76 74729.85 194446.61 610.73 1220.42 1831.15 196277.76 Source: Information furnished by PSUs
As on 31 March 2016, of the total investment in State PSUs, 99.46 per cent was in working PSUs and the remaining 0.54 per cent in PSUs not working. This total investment consisted of 61.30 per cent towards capital and 38.70 per cent in long-term loans. The investment has grown by 200.55 per cent from ` 97,867.69 crore in 2011-12 to ` 1,96,277.76 crore in 2015-16 as shown in chart 1.1.
Chart 1.1: Total investment (Capital and Long-term loans) in PSUs
1.7 The sector-wise summary of investments in the State PSUs as on 31 March 2016 is given in table 1.3.
Table 1.3: Sector-wise investment in PSUs (`in crore)
Government/Other companies Statutory corporation
Name of Sector
Working Not Working Working
Total Investment
Power 188358.47 0.00 0.00 188358.47 Manufacturing 3367.58 729.37 0.00 4096.95 Finance 548.76 6.65 827.31 1382.72 Service 66.62 26.49 720.44 813.55 Infrastructure 865.17 271.14 270.03 1406.34
Inve
stm
ent (̀
in c
rore
)
Year
Audit Report on Public Sector Undertakings for the year ended 31 March 2016
4
Government/Other companies Statutory corporation
Name of Sector
Working Not Working Working
Total Investment
Agriculture and Allied 143.29 25.25 13.37 181.91 Miscellaneous 37.82 0.00 0.00 37.82
Total 193387.71 1058.90 1831.15 196277.76 Source: Information furnished by PSUs
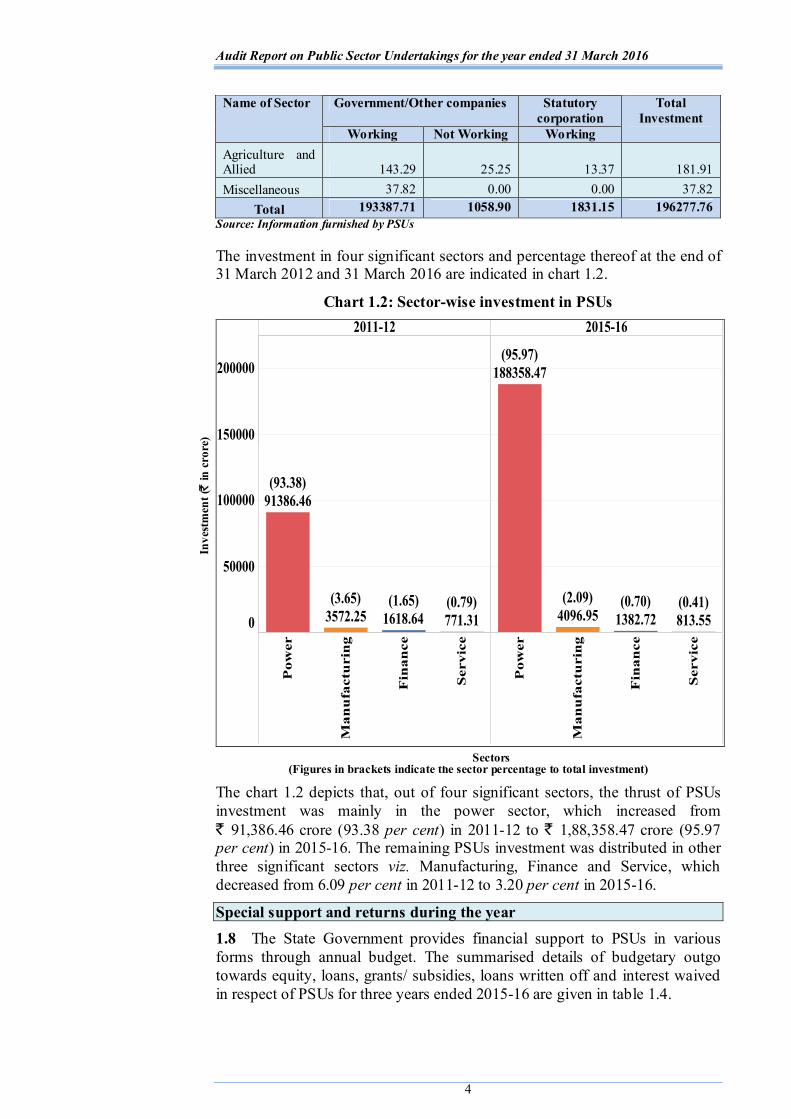
The investment in four significant sectors and percentage thereof at the end of 31 March 2012 and 31 March 2016 are indicated in chart 1.2.
Chart 1.2: Sector-wise investment in PSUs
(Figures in brackets indicate the sector percentage to total investment) The chart 1.2 depicts that, out of four significant sectors, the thrust of PSUs investment was mainly in the power sector, which increased from ` 91,386.46 crore (93.38 per cent) in 2011-12 to ` 1,88,358.47 crore (95.97 per cent) in 2015-16. The remaining PSUs investment was distributed in other three significant sectors viz. Manufacturing, Finance and Service, which decreased from 6.09 per cent in 2011-12 to 3.20 per cent in 2015-16.
Special support and returns during the year 1.8 The State Government provides financial support to PSUs in various forms through annual budget. The summarised details of budgetary outgo towards equity, loans, grants/ subsidies, loans written off and interest waived in respect of PSUs for three years ended 2015-16 are given in table 1.4.
Inve
stm
ent (̀
in c
rore
)
Sectors
Chapter–I: Functioning of State Public Sector Undertakings
5
Table 1.4: Details regarding budgetary support to PSUs (`in crore)
2013-14 2014-15 2015-16 Sl. No.
Particulars No. of
PSUs Amount No. of
PSUs Amount No. of
PSUs Amount
1. Equity Capital outgo from budget
5 5324.42 6 11464.85 6 19251.33
2. Loans given from budget
6 123.80 6 138.78 3 162.73
3. Grants/Subsidy from budget
7 2890.07 10 3977.38 3 380.10
4. Total Outgo (1+2+3)
174 8338.29 194 15581.01 94 19794.16
5. Loans converted into Equity
- - 3 1210.28 - -
6. Interest waived - - - - - - 7. Guarantees
issued 3 124.68 3 241.00 2 2761.25
8. Guarantee commitment
5 9120.15 5 59822.93 5 35218.47
Source: Information furnished by PSUs
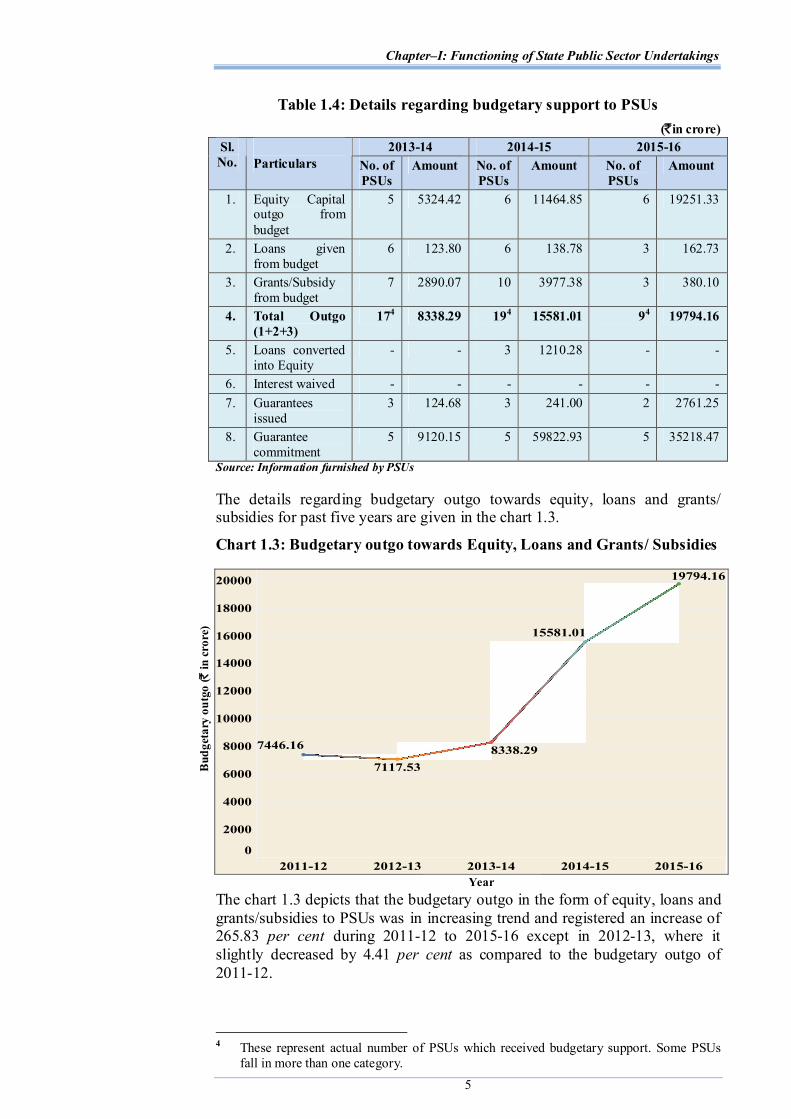
The details regarding budgetary outgo towards equity, loans and grants/ subsidies for past five years are given in the chart 1.3.
Chart 1.3: Budgetary outgo towards Equity, Loans and Grants/ Subsidies
The chart 1.3 depicts that the budgetary outgo in the form of equity, loans and grants/subsidies to PSUs was in increasing trend and registered an increase of 265.83 per cent during 2011-12 to 2015-16 except in 2012-13, where it slightly decreased by 4.41 per cent as compared to the budgetary outgo of 2011-12.
4 These represent actual number of PSUs which received budgetary support. Some PSUs fall in more than one category.
Bud
geta
ry o
utgo
(̀ in
cro
re)
Year

Audit Report on Public Sector Undertakings for the year ended 31 March 2016
6
It may be seen from table 1.4 that the amount of guarantees outstanding stood at ` 35,218.47 crore in 2015-16, which registered a significant decrease of 41.13 per cent during 2014-15 to 2015-16. In order to enable PSUs to obtain financial assistance from Banks and Financial Institutions, Government of Uttar Pradesh (GoUP) gives guarantee for which the guarantee commission is being charged at the rate of 0.25 per cent to one per cent as decided by the GoUP depending upon the loanees. The amount of guarantee commission payable up to 2014-15 by five PSUs5 was ` 4.46 crore, out of which four PSUs6 had paid guarantee commission of ` 3.36 crore during the current year. The outstanding guarantee commission decreased to ` 1.17 crore7which included ` seven lakh payable by one PSU8 during current year.
Reconciliation with Finance Accounts
1.9 The figures in respect of equity, loans and guarantees outstanding as per records of State PSUs should agree with the figures appearing in the Finance Accounts of the State. In case the figures do not agree, the concerned PSUs and the Finance Department should carry out reconciliation of differences.
The position in this regard as of 31 March 2016 is stated in table 1.5.
Table 1.5: Equity, loans and guarantees outstanding as per Finance Accounts vis-a-vis records of PSUs
(`in crore) Outstanding in
respect of Amount as per
Finance Accounts Amount as per
records of PSUs Difference
Equity 66942.29 87713.59 20771.30 Loans 8772.61 7234.31 1538.30
Guarantees 54456.28 35218.47 19237.81 Source: State Finance Accounts for the year2015-16 and information furnished by PSUs
Audit observed that the differences between the figures as per Finance Accounts and that as per records of the PSUs occurred in respect of 14 PSUs and some of the differences were pending for reconciliation since 2000-01. The Accountant General had regularly taken up the matter of not reconciled figures appearing in Finance Accounts and that in Audit Report (PSUs) with the PSUs requesting them to expedite the reconciliation. The Government and the PSUs should take concrete steps to reconcile the differences in a time-bound manner.
Arrears in finalisation of Accounts
1.10 The financial statements of the companies for every financial year are required to be finalised within six months from the end of the relevant financial year i.e. by September end in accordance with the provisions of Section 96 (1) read with Section 129 (2) of the Companies Act, 2013 (Act). 5 The Pradeshiya Industrial and Investment Corporation of U. P. Limited (` 0.49 crore),
Uttar Pradesh Power Corporation Limited (` 1.45 crore), Uttar Pradesh Rajya Vidyut Utpadan Nigam Limited (` 0.81 crore), Uttar Pradesh Power Transmission Corporation Limited (` 1.69 crore) and Pachimanchal Vidyut Vitran Nigam Limited (` 0.02 crore).
6 Uttar Pradesh Power Transmission Corporation Limited (` 1.69 crore), Pachimanchal Vidyut Vitran Nigam Limited (` 0.02 crore), Uttar Pradesh Rajya Vidyut Utpadan Nigam Limited (` 0.20 crore) and Uttar Pradesh Power Corporation Limited (` 1.45 crore).
7 The Pradeshiya Industrial and Investment Corporation of U. P. Limited (` 0.56 crore) and Uttar Pradesh Rajya Vidyut Utpadan Nigam Limited (` 0.61 crore).
8 The Pradeshiya Industrial and Investment Corporation of U. P. Limited.

Chapter–I: Functioning of State Public Sector Undertakings
7
Failure to do so may attract penal provisions under Section 99 of the Act which provides that every officer of the Company who is in default shall be punishable with fine which may extend to one lakh rupees and in case of continuing default, with a further fine which may extend to five thousand rupees for every day during which such default continues. As such Management of Government companies, whose Accounts are in arrear, are liable for default. Similarly, in case of Statutory corporations, their Accounts are finalised, audited and presented to the State Legislature as per the provisions of their respective Acts. The table 1.6 provides the details of progress made by working PSUs in finalisation of Accounts as of 30 September 2016.
Table 1.6: Position relating to finalisation of Accounts of working PSUs Sl. No.
Particulars 2011-12 2012-13 2013-14 2014-15 2015-16
1. Number of Working PSUs/other companies
85 87 87 65 65
2. Number of Accounts finalised during the year
66 84 42 43 48
3. Number of Accounts in arrears
234 228 273 2499 266
4. Number of Working PSUs with arrears in Accounts
81 82 83 61 62
5. Extent of arrears 1 to 16 years
1 to 17 years
1 to 18 years
1 to 19 years
1 to 20 years
Source: Latest finalised Accounts of PSUs
As shown in table 1.6 the number of Accounts in arrears has increased from 234 in 2011-12 to 266 in 2015-16. The average number of Accounts in arrears per working PSUs ranged between 2.75 and 4.09 during 2011-12 to 2015-16. Out of the 65 working PSUs, only three10 PSUs finalised their Accounts for the year 2015-16 while 62 PSUs had 266 Accounts in arrears as of September 2016 with extent of arrears ranging from one to 20 years. The Administrative Departments have the responsibility to oversee the activities of these PSUs and to ensure that the Accounts are finalised and adopted by these PSUs within stipulated period. The concerned Departments were informed regularly by the Senior Deputy Accountant General. In addition, the matter had been taken up by the Accountant General with the Chief Secretary and Principal Secretary (Finance), Government of Uttar Pradesh through quarterly Demi Official letters, for liquidating the arrears of Accounts. However, no improvement has been noticed.
1.11 The State Government had invested ` 19,794.16 crore (equity: ` 19,251.33 crore, loans: ` 162.73 crore, grants: ` 320.93 crore and subsidies ` 59.17 crore) in nine working PSUs during the year for which Accounts have not been finalised as detailed in Annexure-1.2. In the absence of finalisation of Accounts and their subsequent audit, it could not be ascertained whether the
9 Excluding 44 arrears of accounts of closed subsidiary companies of Uttar Pradesh State Tourism Development Corporation Limited and two arrears of accounts of Western U. P. Power Transmission Company Limited which was placed under private ownership w.e.f. 22 September 2011. 10 Serial no. A-1, 18 and 19 of Annexure 1.1.
Audit Report on Public Sector Undertakings for the year ended 31 March 2016
8
investments and expenditure incurred had been properly accounted for and the purposes for which the amount was invested, was achieved. As a result, Government’s investment in such PSUs remained outside the control of the State Legislature.
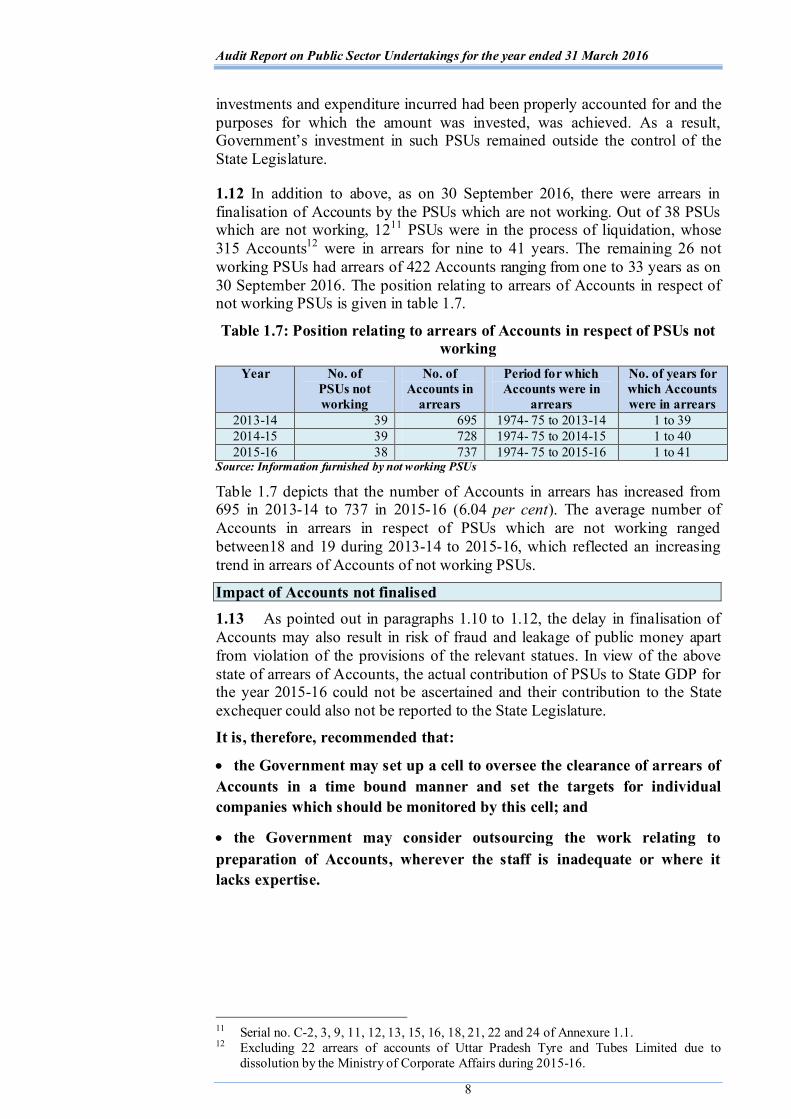
1.12 In addition to above, as on 30 September 2016, there were arrears in finalisation of Accounts by the PSUs which are not working. Out of 38 PSUs which are not working, 1211 PSUs were in the process of liquidation, whose 315 Accounts12 were in arrears for nine to 41 years. The remaining 26 not working PSUs had arrears of 422 Accounts ranging from one to 33 years as on 30 September 2016. The position relating to arrears of Accounts in respect of not working PSUs is given in table 1.7.
Table 1.7: Position relating to arrears of Accounts in respect of PSUs not working
Year No. of PSUs not working
No. of Accounts in
arrears
Period for which Accounts were in
arrears
No. of years for which Accounts were in arrears
2013-14 39 695 1974- 75 to 2013-14 1 to 39 2014-15 39 728 1974- 75 to 2014-15 1 to 40 2015-16 38 737 1974- 75 to 2015-16 1 to 41
Source: Information furnished by not working PSUs
Table 1.7 depicts that the number of Accounts in arrears has increased from 695 in 2013-14 to 737 in 2015-16 (6.04 per cent). The average number of Accounts in arrears in respect of PSUs which are not working ranged between18 and 19 during 2013-14 to 2015-16, which reflected an increasing trend in arrears of Accounts of not working PSUs.
Impact of Accounts not finalised
1.13 As pointed out in paragraphs 1.10 to 1.12, the delay in finalisation of Accounts may also result in risk of fraud and leakage of public money apart from violation of the provisions of the relevant statues. In view of the above state of arrears of Accounts, the actual contribution of PSUs to State GDP for the year 2015-16 could not be ascertained and their contribution to the State exchequer could also not be reported to the State Legislature.
It is, therefore, recommended that:
the Government may set up a cell to oversee the clearance of arrears of Accounts in a time bound manner and set the targets for individual companies which should be monitored by this cell; and
the Government may consider outsourcing the work relating to preparation of Accounts, wherever the staff is inadequate or where it lacks expertise.
11 Serial no. C-2, 3, 9, 11, 12, 13, 15, 16, 18, 21, 22 and 24 of Annexure 1.1. 12 Excluding 22 arrears of accounts of Uttar Pradesh Tyre and Tubes Limited due to
dissolution by the Ministry of Corporate Affairs during 2015-16.

Chapter–I: Functioning of State Public Sector Undertakings
9
Placement of Separate Audit Reports
1.14 On completion of financial audit of the Corporation, Separate Audit Report (SAR) is issued to the Managing Director of the Corporation and State Government. As per respective legislation of the each Corporation, the Managing Director is responsible for forwarding the SAR to the State Government for placement in the legislature. The State Government causes the SAR to be placed in the State Legislature. The position depicted in table 1.8 shows the status of placement of SARs issued by the CAG (up to 30 September 2016) on the Accounts of Statutory corporations in the State Legislature.
Table 1.8: Status of placement of SARs in State Legislature
Years for which SARs not placed in State Legislature
Sl. No.
Name of Statutory corporation
Year up to which SARs
placed in State
Legislature
Year of SAR
Date of issue to the Government
Reasons for not placing the
SARs
1. Uttar Pradesh State Road Transport Corporation
2011-12 2012-13 2013-14
6 June 2014 2 September 2015
Reasons not furnished by the Corporation
2. Uttar Pradesh Financial Corporation
2007-08
2008-09 2009-10 2010-11 2011-12 2012-13
20 May 2011 13 April 2012 27 August 2012 16 September 2013 12 November 2015
Reasons not furnished by the Corporation
3. Uttar Pradesh Forest Corporation13
--
2008-09 2009-10 2010-11 2011-12 2012-13 2013-14
9 March 2011 16 November 2011 21 September 2012 11 July 2013 6 June 2014 21 April 2015
Reasons not furnished by the Corporation
4. Uttar Pradesh Avas Evam Vikas Parishad
2010-11 2011-12 2012-13 2013-14
16 September 2013 7 November 2014 20 August 2015
Reasons not furnished by the Corporation
5. Uttar Pradesh Jal Nigam 2007-08
2008-09 2009-10 2010-11
3 August 2011 20 May 2013 12 December 2013
Reasons not furnished by the Corporation
6 Uttar Pradesh State Warehousing Corporation
2011-12 2012-13 2013-14
29 June 2015 20 July 2016
Reasons not furnished by the Corporation
Source: Information furnished by corporations and compiled by Audit
It can be observed from table 1.8 that the Corporations did not present SARs of two to six years in the State Legislature. The matter of delay in placement of the SARs was taken up regularly by the Accountant General but no action for placement was taken and also reasons for the same were not furnished. Not placing SARs in the State Legislature weakens the legislative control over Statutory corporations and dilutes the latter’s financial accountability. The Government should ensure prompt placement of SARs in the Legislature.
13 Uttar Pradesh Forest Corporation submitted its account for the year 2008-09 after incorporating necessary amendment in U. P. Forest Corporation Act, 1974.
Audit Report on Public Sector Undertakings for the year ended 31 March 2016
10
Performance of PSUs as per their latest finalised Accounts
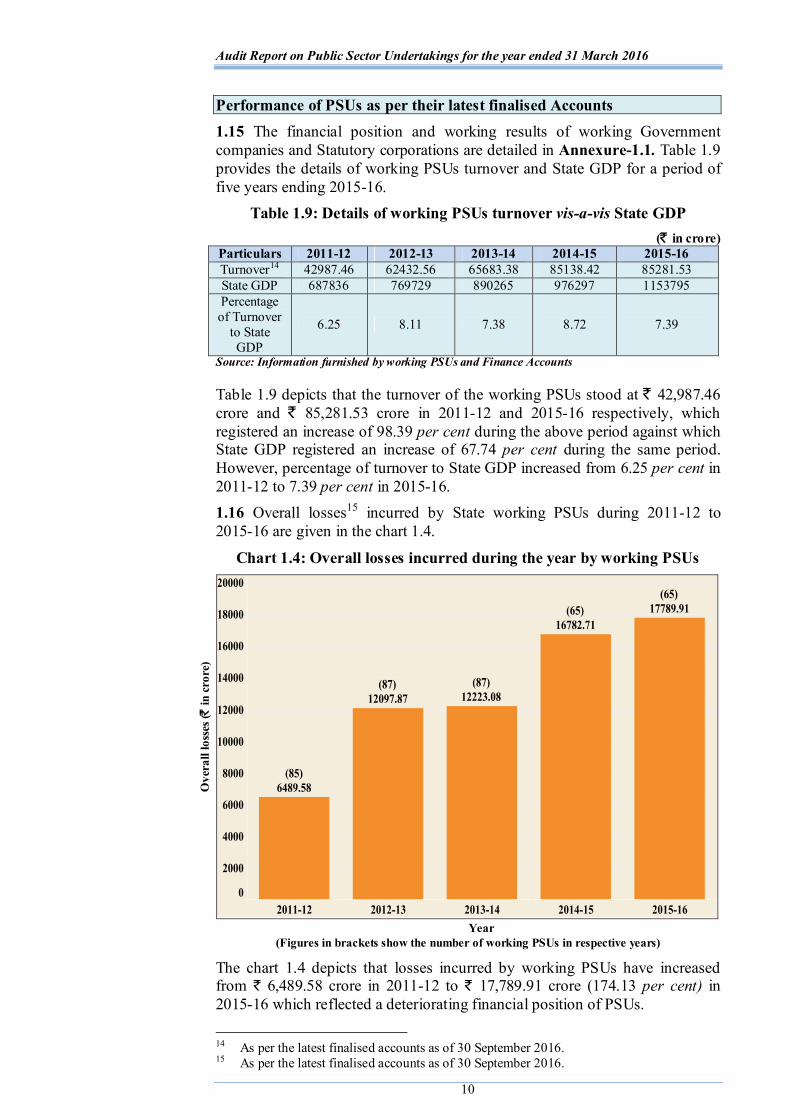
1.15 The financial position and working results of working Government companies and Statutory corporations are detailed in Annexure-1.1. Table 1.9 provides the details of working PSUs turnover and State GDP for a period of five years ending 2015-16.
Table 1.9: Details of working PSUs turnover vis-a-vis State GDP (` in crore)
Particulars 2011-12 2012-13 2013-14 2014-15 2015-16 Turnover14 42987.46 62432.56 65683.38 85138.42 85281.53 State GDP 687836 769729 890265 976297 1153795 Percentage of Turnover
to State GDP
6.25 8.11 7.38 8.72 7.39
Source: Information furnished by working PSUs and Finance Accounts
Table 1.9 depicts that the turnover of the working PSUs stood at ` 42,987.46 crore and ` 85,281.53 crore in 2011-12 and 2015-16 respectively, which registered an increase of 98.39 per cent during the above period against which State GDP registered an increase of 67.74 per cent during the same period. However, percentage of turnover to State GDP increased from 6.25 per cent in 2011-12 to 7.39 per cent in 2015-16. 1.16 Overall losses15 incurred by State working PSUs during 2011-12 to 2015-16 are given in the chart 1.4.
Chart 1.4: Overall losses incurred during the year by working PSUs
(Figures in brackets show the number of working PSUs in respective years) The chart 1.4 depicts that losses incurred by working PSUs have increased from ` 6,489.58 crore in 2011-12 to ` 17,789.91 crore (174.13 per cent) in 2015-16 which reflected a deteriorating financial position of PSUs.
14 As per the latest finalised accounts as of 30 September 2016. 15 As per the latest finalised accounts as of 30 September 2016.
Ove
rall
loss
es (̀
in c
rore
)
Year
Chapter–I: Functioning of State Public Sector Undertakings
11
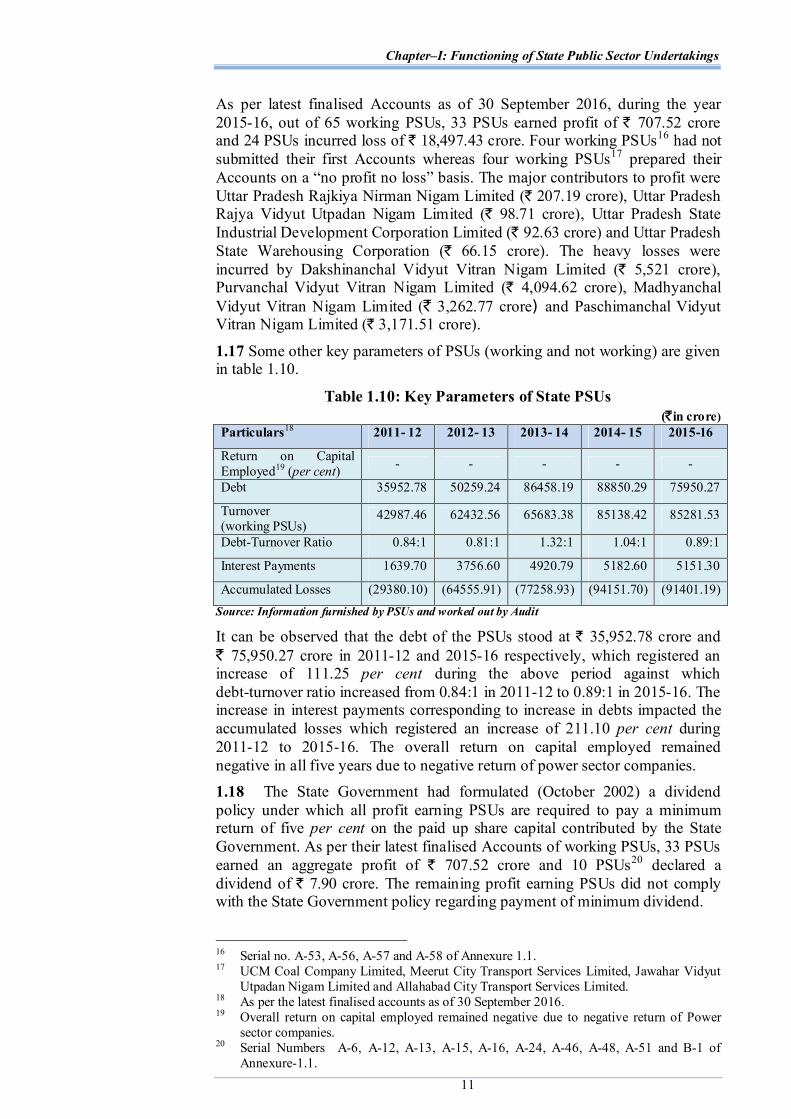
As per latest finalised Accounts as of 30 September 2016, during the year 2015-16, out of 65 working PSUs, 33 PSUs earned profit of ` 707.52 crore and 24 PSUs incurred loss of ` 18,497.43 crore. Four working PSUs16 had not submitted their first Accounts whereas four working PSUs17 prepared their Accounts on a “no profit no loss” basis. The major contributors to profit were Uttar Pradesh Rajkiya Nirman Nigam Limited (` 207.19 crore), Uttar Pradesh Rajya Vidyut Utpadan Nigam Limited (` 98.71 crore), Uttar Pradesh State Industrial Development Corporation Limited (` 92.63 crore) and Uttar Pradesh State Warehousing Corporation (` 66.15 crore). The heavy losses were incurred by Dakshinanchal Vidyut Vitran Nigam Limited (` 5,521 crore), Purvanchal Vidyut Vitran Nigam Limited (` 4,094.62 crore), Madhyanchal Vidyut Vitran Nigam Limited (` 3,262.77 crore) and Paschimanchal Vidyut Vitran Nigam Limited (` 3,171.51 crore). 1.17 Some other key parameters of PSUs (working and not working) are given in table 1.10.
Table 1.10: Key Parameters of State PSUs (`in crore)
Particulars18 2011- 12 2012- 13 2013- 14 2014- 15 2015-16
Return on Capital Employed19 (per cent) - - - - -
Debt 35952.78 50259.24 86458.19 88850.29 75950.27
Turnover (working PSUs)
42987.46 62432.56 65683.38 85138.42 85281.53
Debt-Turnover Ratio 0.84:1 0.81:1 1.32:1 1.04:1 0.89:1
Interest Payments 1639.70 3756.60 4920.79 5182.60 5151.30
Accumulated Losses (29380.10) (64555.91) (77258.93) (94151.70) (91401.19) Source: Information furnished by PSUs and worked out by Audit
It can be observed that the debt of the PSUs stood at ` 35,952.78 crore and ` 75,950.27 crore in 2011-12 and 2015-16 respectively, which registered an increase of 111.25 per cent during the above period against which debt-turnover ratio increased from 0.84:1 in 2011-12 to 0.89:1 in 2015-16. The increase in interest payments corresponding to increase in debts impacted the accumulated losses which registered an increase of 211.10 per cent during 2011-12 to 2015-16. The overall return on capital employed remained negative in all five years due to negative return of power sector companies. 1.18 The State Government had formulated (October 2002) a dividend policy under which all profit earning PSUs are required to pay a minimum return of five per cent on the paid up share capital contributed by the State Government. As per their latest finalised Accounts of working PSUs, 33 PSUs earned an aggregate profit of ` 707.52 crore and 10 PSUs20 declared a dividend of ` 7.90 crore. The remaining profit earning PSUs did not comply with the State Government policy regarding payment of minimum dividend.
16 Serial no. A-53, A-56, A-57 and A-58 of Annexure 1.1. 17 UCM Coal Company Limited, Meerut City Transport Services Limited, Jawahar Vidyut Utpadan Nigam Limited and Allahabad City Transport Services Limited. 18 As per the latest finalised accounts as of 30 September 2016. 19 Overall return on capital employed remained negative due to negative return of Power sector companies. 20 Serial Numbers A-6, A-12, A-13, A-15, A-16, A-24, A-46, A-48, A-51 and B-1 of
Annexure-1.1.
Audit Report on Public Sector Undertakings for the year ended 31 March 2016
12
Winding up of PSUs which are not working
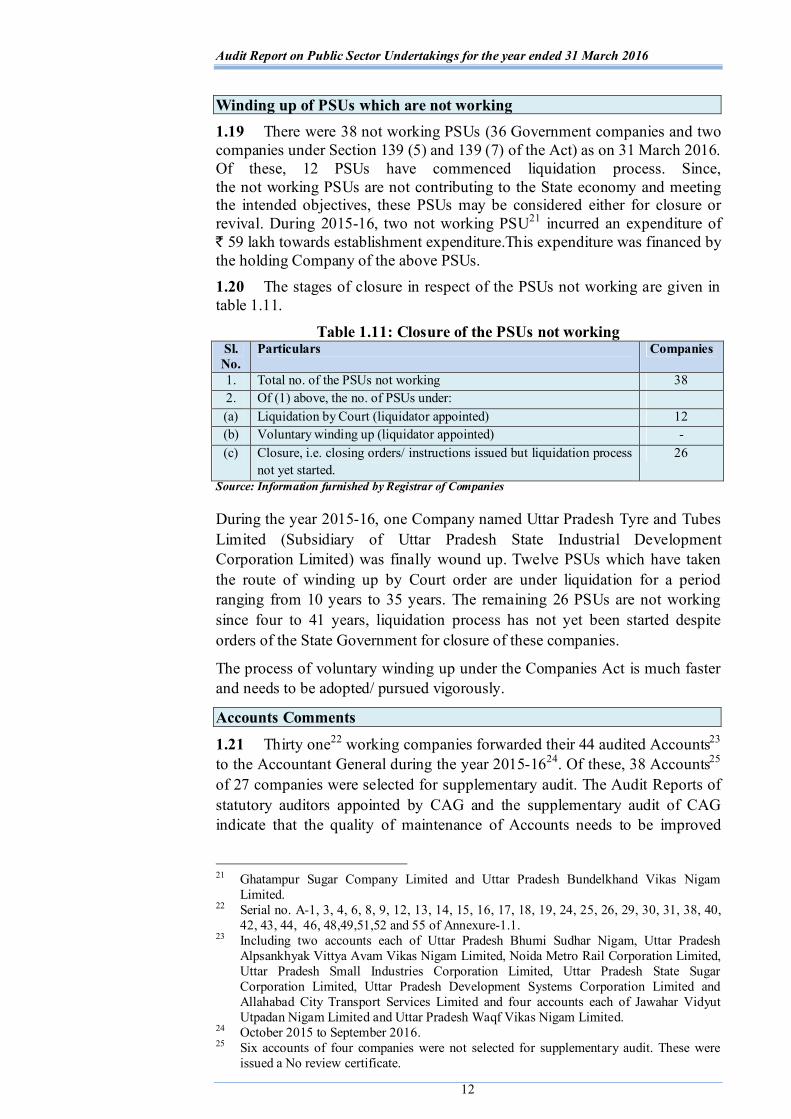
1.19 There were 38 not working PSUs (36 Government companies and two companies under Section 139 (5) and 139 (7) of the Act) as on 31 March 2016. Of these, 12 PSUs have commenced liquidation process. Since, the not working PSUs are not contributing to the State economy and meeting the intended objectives, these PSUs may be considered either for closure or revival. During 2015-16, two not working PSU21 incurred an expenditure of ` 59 lakh towards establishment expenditure.This expenditure was financed by the holding Company of the above PSUs. 1.20 The stages of closure in respect of the PSUs not working are given in table 1.11.
Table 1.11: Closure of the PSUs not working Sl. No.
Particulars Companies
1. Total no. of the PSUs not working 38 2. Of (1) above, the no. of PSUs under: (a) Liquidation by Court (liquidator appointed) 12 (b) Voluntary winding up (liquidator appointed) - (c) Closure, i.e. closing orders/ instructions issued but liquidation process
not yet started. 26
Source: Information furnished by Registrar of Companies
During the year 2015-16, one Company named Uttar Pradesh Tyre and Tubes Limited (Subsidiary of Uttar Pradesh State Industrial Development Corporation Limited) was finally wound up. Twelve PSUs which have taken the route of winding up by Court order are under liquidation for a period ranging from 10 years to 35 years. The remaining 26 PSUs are not working since four to 41 years, liquidation process has not yet been started despite orders of the State Government for closure of these companies.
The process of voluntary winding up under the Companies Act is much faster and needs to be adopted/ pursued vigorously.
Accounts Comments
1.21 Thirty one22 working companies forwarded their 44 audited Accounts23 to the Accountant General during the year 2015-1624. Of these, 38 Accounts25 of 27 companies were selected for supplementary audit. The Audit Reports of statutory auditors appointed by CAG and the supplementary audit of CAG indicate that the quality of maintenance of Accounts needs to be improved
21 Ghatampur Sugar Company Limited and Uttar Pradesh Bundelkhand Vikas Nigam Limited. 22 Serial no. A-1, 3, 4, 6, 8, 9, 12, 13, 14, 15, 16, 17, 18, 19, 24, 25, 26, 29, 30, 31, 38, 40,
42, 43, 44, 46, 48,49,51,52 and 55 of Annexure-1.1. 23 Including two accounts each of Uttar Pradesh Bhumi Sudhar Nigam, Uttar Pradesh
Alpsankhyak Vittya Avam Vikas Nigam Limited, Noida Metro Rail Corporation Limited, Uttar Pradesh Small Industries Corporation Limited, Uttar Pradesh State Sugar Corporation Limited, Uttar Pradesh Development Systems Corporation Limited and Allahabad City Transport Services Limited and four accounts each of Jawahar Vidyut Utpadan Nigam Limited and Uttar Pradesh Waqf Vikas Nigam Limited.
24 October 2015 to September 2016. 25 Six accounts of four companies were not selected for supplementary audit. These were
issued a No review certificate.
Chapter–I: Functioning of State Public Sector Undertakings
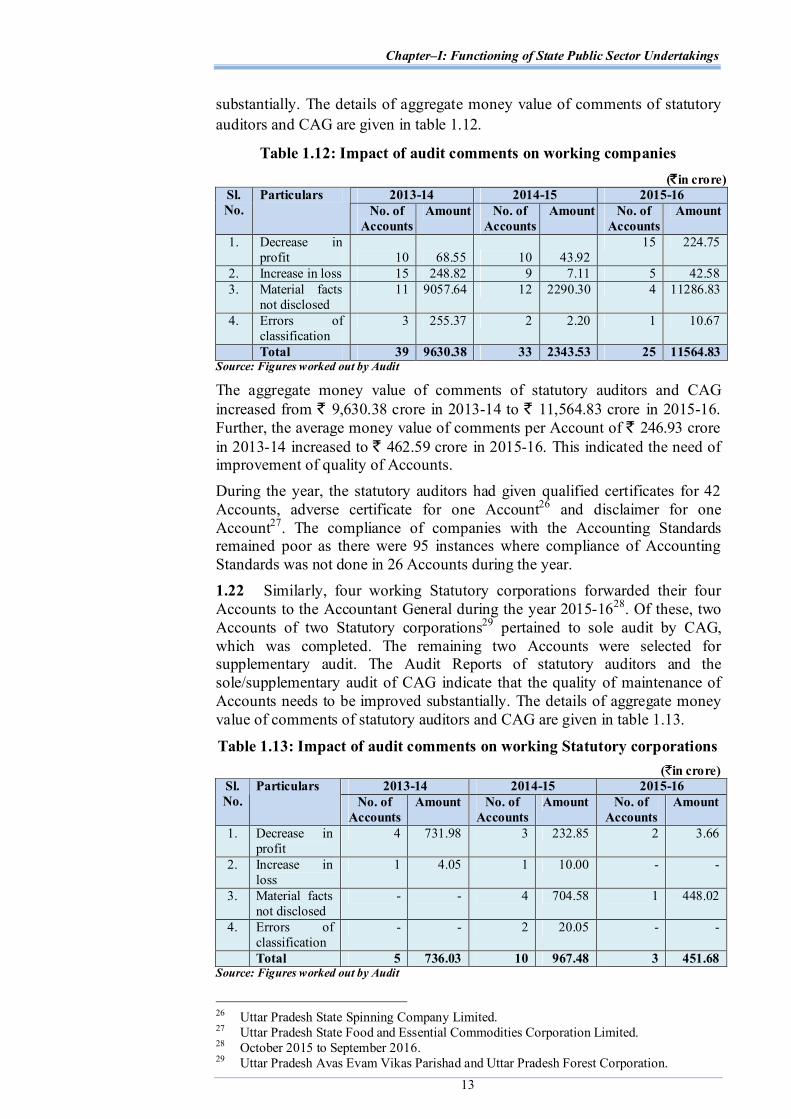
13
substantially. The details of aggregate money value of comments of statutory auditors and CAG are given in table 1.12.
Table 1.12: Impact of audit comments on working companies (`in crore)
2013-14 2014-15 2015-16 Sl. No.
Particulars No. of
Accounts Amount No. of
Accounts Amount No. of
Accounts Amount
1. Decrease in profit 10 68.55 10 43.92
15 224.75
2. Increase in loss 15 248.82 9 7.11 5 42.58 3. Material facts
not disclosed 11 9057.64 12 2290.30 4 11286.83
4. Errors of classification
3 255.37 2 2.20 1 10.67
Total 39 9630.38 33 2343.53 25 11564.83 Source: Figures worked out by Audit
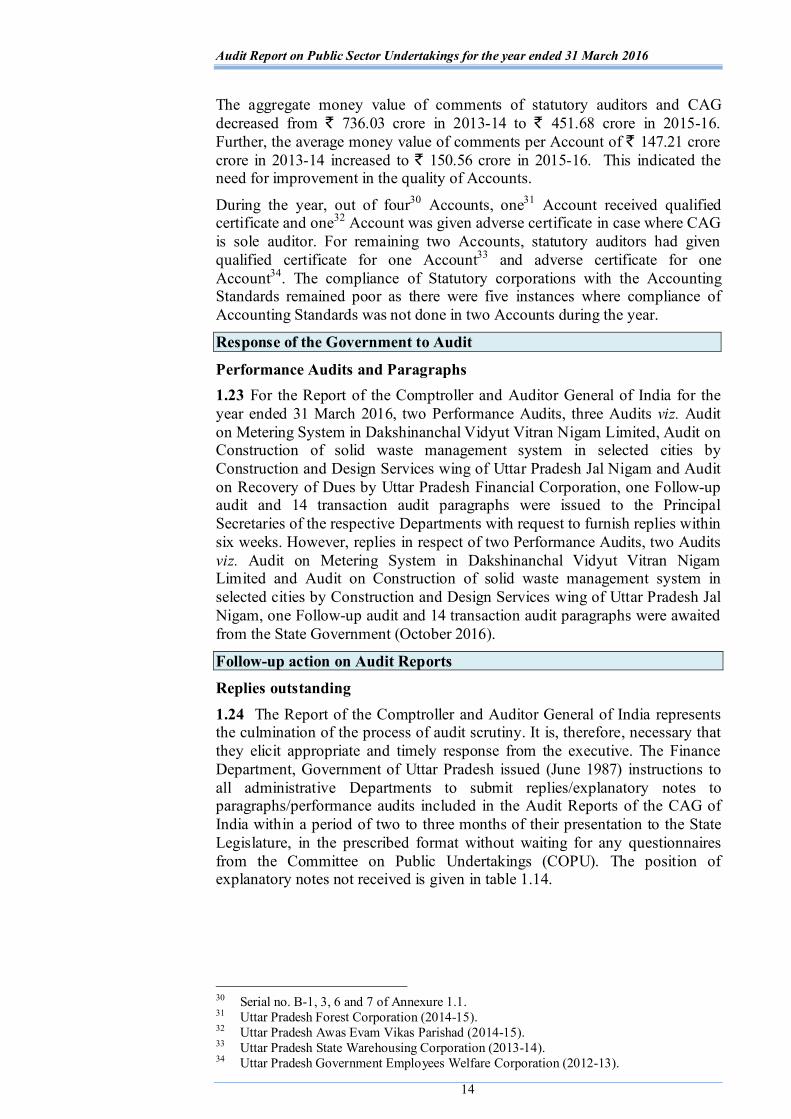
The aggregate money value of comments of statutory auditors and CAG increased from ` 9,630.38 crore in 2013-14 to ` 11,564.83 crore in 2015-16. Further, the average money value of comments per Account of ` 246.93 crore in 2013-14 increased to ` 462.59 crore in 2015-16. This indicated the need of improvement of quality of Accounts. During the year, the statutory auditors had given qualified certificates for 42 Accounts, adverse certificate for one Account26 and disclaimer for one Account27. The compliance of companies with the Accounting Standards remained poor as there were 95 instances where compliance of Accounting Standards was not done in 26 Accounts during the year. 1.22 Similarly, four working Statutory corporations forwarded their four Accounts to the Accountant General during the year 2015-1628. Of these, two Accounts of two Statutory corporations29 pertained to sole audit by CAG, which was completed. The remaining two Accounts were selected for supplementary audit. The Audit Reports of statutory auditors and the sole/supplementary audit of CAG indicate that the quality of maintenance of Accounts needs to be improved substantially. The details of aggregate money value of comments of statutory auditors and CAG are given in table 1.13.
Table 1.13: Impact of audit comments on working Statutory corporations (`in crore)
2013-14 2014-15 2015-16 Sl. No.
Particulars No. of
Accounts Amount No. of
Accounts Amount No. of
Accounts Amount
1. Decrease in profit
4 731.98 3 232.85 2 3.66
2. Increase in loss
1 4.05 1 10.00 - -
3. Material facts not disclosed
- - 4 704.58 1 448.02
4. Errors of classification
- - 2 20.05 - -
Total 5 736.03 10 967.48 3 451.68 Source: Figures worked out by Audit
26 Uttar Pradesh State Spinning Company Limited. 27 Uttar Pradesh State Food and Essential Commodities Corporation Limited. 28 October 2015 to September 2016. 29 Uttar Pradesh Avas Evam Vikas Parishad and Uttar Pradesh Forest Corporation.
Audit Report on Public Sector Undertakings for the year ended 31 March 2016
14
The aggregate money value of comments of statutory auditors and CAG decreased from ` 736.03 crore in 2013-14 to ` 451.68 crore in 2015-16. Further, the average money value of comments per Account of ` 147.21 crore crore in 2013-14 increased to ` 150.56 crore in 2015-16. This indicated the need for improvement in the quality of Accounts.
During the year, out of four30 Accounts, one31 Account received qualified certificate and one32 Account was given adverse certificate in case where CAG is sole auditor. For remaining two Accounts, statutory auditors had given qualified certificate for one Account33 and adverse certificate for one Account34. The compliance of Statutory corporations with the Accounting Standards remained poor as there were five instances where compliance of Accounting Standards was not done in two Accounts during the year.
Response of the Government to Audit
Performance Audits and Paragraphs 1.23 For the Report of the Comptroller and Auditor General of India for the year ended 31 March 2016, two Performance Audits, three Audits viz. Audit on Metering System in Dakshinanchal Vidyut Vitran Nigam Limited, Audit on Construction of solid waste management system in selected cities by Construction and Design Services wing of Uttar Pradesh Jal Nigam and Audit on Recovery of Dues by Uttar Pradesh Financial Corporation, one Follow-up audit and 14 transaction audit paragraphs were issued to the Principal Secretaries of the respective Departments with request to furnish replies within six weeks. However, replies in respect of two Performance Audits, two Audits viz. Audit on Metering System in Dakshinanchal Vidyut Vitran Nigam Limited and Audit on Construction of solid waste management system in selected cities by Construction and Design Services wing of Uttar Pradesh Jal Nigam, one Follow-up audit and 14 transaction audit paragraphs were awaited from the State Government (October 2016).
Follow-up action on Audit Reports
Replies outstanding 1.24 The Report of the Comptroller and Auditor General of India represents the culmination of the process of audit scrutiny. It is, therefore, necessary that they elicit appropriate and timely response from the executive. The Finance Department, Government of Uttar Pradesh issued (June 1987) instructions to all administrative Departments to submit replies/explanatory notes to paragraphs/performance audits included in the Audit Reports of the CAG of India within a period of two to three months of their presentation to the State Legislature, in the prescribed format without waiting for any questionnaires from the Committee on Public Undertakings (COPU). The position of explanatory notes not received is given in table 1.14.
30 Serial no. B-1, 3, 6 and 7 of Annexure 1.1. 31 Uttar Pradesh Forest Corporation (2014-15). 32 Uttar Pradesh Awas Evam Vikas Parishad (2014-15). 33 Uttar Pradesh State Warehousing Corporation (2013-14). 34 Uttar Pradesh Government Employees Welfare Corporation (2012-13).

Chapter–I: Functioning of State Public Sector Undertakings
15
Table 1.14: Explanatory notes not received (as on 30 September 2016) Year of the
Audit Report (Commercial/
PSUs)
Date of placement of Audit Report in
the State Legislature
Total Performance Audit (PA) and
Paragraphs in the Audit Report
Number of PA/ Paragraphs for
which explanatory notes were not
received PA Paragraphs PA Paragraphs
2010-11 30 May 2012 2 13 0 8 2011-12 16 September 2013 2 14 1 6 2012-13 20 June 2014 1 19 1 2 2013-14 17 August 2015 2 15 2 9 2014-15 8 March 2016 6 12 6 11
Total 13 73 10 36 Source: Information compiled by Audit
From the above, it could be seen that, out of 73 paragraphs and 13 Performance Audits, explanatory notes to 36 Paragraphs and 10 Performance Audits in respect of 10 Departments, which were commented upon, were awaited (September 2016).
Discussion of Audit Reports by COPU 1.25 The status as on 30 September 2016 of Performance Audits and paragraphs that appeared in Audit Reports (Commercial/PSUs) and on which discussion completed by the COPU is given in table 1.15.
Table 1.15: Performance Audits/Paragraphs appeared in Audit Reports vis-a-vis discussed as on 30 September 2016
Number of Performance Audits (PAs)/Paragraphs
Appeared in Audit Report PAs and Paragraphs on which discussion completed
Period of Audit
Report PAs Paragraphs PAs Paragraphs
1982-83 to 2009-10 135 901 78 539
2010-11 335 13 0 3 2011-12 2 14 0 4 2012-13 1 19 0 6 2013-14 2 15 0 2 2014-15 6 12 0 0
Total 149 974 78 554 Source: Information compiled by Audit
Compliance to Reports of the Committee on Public Undertakings 1.26 The internal working rules of COPU do not provide for vetting of Action Taken Notes (ATNs) by the Accountant General. Hence, the ATNs on the recommendations of COPU are furnished by the Departments to the Accountant General, only at the time of discussion of ATNs by COPU. Therefore, the status of ATNs is not discussed here.
It is recommended that the Government may ensure: sending of replies/explanatory notes to Paragraphs/Performance Audits as per the prescribed time schedule; revamping of the system of responding to audit observations.
35 Included Stand alone Performance Audit Report on Sale of Sugar Mills of Uttar Pradesh State Sugar Corporation Limited.
Audit Report on Public Sector Undertakings for the year ended 31 March 2016
16
Disinvestment, Restructuring and Privatisation of PSUs and reforms in power sector
1.27 There was no disinvestment, restructuring, privatisation of PSUs and reforms in power sector in the State of Uttar Pradesh during 2015-16.
CHAPTER–II Performance Audit relating to
Government companies and Statutory corporations

CHAPTER-II
2. Performance Audits relating to Government companies and Statutory corporations
2.1 Performance Audit on Re-structured Accelerated Power Development and Reforms Programme
Executive summary Accelerated Power Development and Reforms Programme (APDRP) was modified (September 2008) during the XI Plan as "Re-structured Accelerated Power Development and Reforms Programme (R-APDRP)" by the Ministry of Power (MoP), Government of India (GoI). The main objectives of R-APDRP were to reduce Aggregate Technical and Commercial (AT&C) losses, bring about commercial viability in the power sector and increase consumer satisfaction. In Uttar Pradesh, the Scheme was implemented by Uttar Pradesh Power Corporation Limited (UPPCL) and Power Distribution Companies (DISCOMs) in 168 towns. The scheme was divided into Part-A and Part-B. Part-A included (i) establishment of baseline data, Information Technology (IT) applications for energy accounting/ auditing and IT based consumer service center, (ii) establishment of Supervisory Control and Data Acquisition System/ Distribution Management System (SCADA/DMS) in large towns and Part-B included regular distribution system strengthening works. The scheme was to be completed within three years from the sanction of project (June 2009) but the same was extended upto March 2017 for Part-A (i) and for Part-A (ii) SCADA and Part-B upto May 2017.
Important audit findings are discussed below:
Part-A (i) of the scheme Under Part-A of the scheme, 100 per cent funds for the projects were to be provided in the form of interest bearing loan from GoI to be converted into a grant once the establishment of the required system was achieved and verified by an independent agency. Part-A of the Scheme was implemented in 168 towns with sanctioned cost of ` 775.10 crore out of which ` 508.01 crore was spent up to March 2016. In 43 selected towns, it was noticed that IT enabled system was not completed under Part-A by Information Technology Implementation Agency (ITIA) even after expiry of five years from scheduled period of completion. However, the projects had been declared Go-live in all the towns.
As the IT enabled system was not completed, the Baseline data could not be verified by Third Party Independent Evaluation Agency (TPIEA) appointed by Power Finance Corporation (PFC) so far (October 2016). The AT&C losses generated by the system even after declaration of all the towns Go-live (June 2015) were erratic and ranged between (-) 99.83 and 99.92 per cent during July 2015 to July 2016. Therefore, chances of completion of scheme even in extended period (up to March 2017) and conversion of loan of ` 474.50 crore received from GoI into grant remained remote.
(Paragraph 2.1.12)
Audit Report on Public Sector Undertakings for the year ended 31 March 2016
18
DISCOMs made irregular payment of ` 8.98 crore to Network Bandwidth Service Provider (NBSP) for partial connectivity in a town, whereas payments were to be made on successful connectivity of all the links in a town. The fact regarding poor NBSP services were also confirmed by Chief Executive Officers of beneficiary DISCOMs in the survey conducted by Audit.
(Paragraph 2.1.13) The objective of Meter Data Acquisition System (MDAS) to acquire meter data automatically without human intervention was defeated as 18 per cent sub-stations were not communicating data automatically and eight per cent feeders and 57 per cent Distribution Transformers (DTs) were not updated in MDAS as of March 2016.
(Paragraph 2.1.14) Out of 55,751 modems installed on DTs, data communication was working only in 11,933 modems (16 per cent of DTs) as of 31 March 2016. Due to this deficiency in data communication, DISCOMs were compelled to fill the gaps of energy data through manual entries, thus, defeating the objective of eliminating human intervention in energy accounting/auditing.
(Paragraph 2.1.15) Reports generated by Customer Care Centre were not as per System Requirement Specification and the reports prescribed for status, age and level of pendency of complaints were not being generated.
(Paragraph 2.1.17) Part-A (ii) Supervisory Control and Data Acquisition System SCADA was to be implemented in 12 towns as per guidelines of the scheme with the sanctioned cost of ` 280.81 crore. There was no physical progress in the project even after a lapse of more than four years and its completion would not be possible in the extended period upto May 2017; therefore, conversion of loan of ` 79.96 crore into grant would become inadmissible.
(Paragraph 2.1.25) Part-B of the scheme Part-B of the scheme was implemented in 167 towns1 with sanctioned cost of ` 6915.57 crore out of which ` 3,239.12 crore was spent as of March 2016. However, overall physical progress was only 56.65 per cent despite lapse of six years. Only one town i.e. Etawah was completed as of March 2016. The AT&C losses of the DISCOMs which ranged between 23.38 and 34.92 per cent for base year 2009 increased from 33.04 to 45.95 per cent (July 2015 to July 2016) despite declaring Go-live of all towns. In one completed town i.e. Etawah, it increased from 65.71 per cent (February 2013 to April 2013) to 73.16 per cent in July 2016. In fact in all four DISCOMs, the AT&C losses actually increased after declaring the towns under them as Go-live. Thus, chance for conversion of loan of ` 3,556.24 crore into Grant of ` 1,778.12 crore (50 per cent of loan) looks remote.
(Paragraph 2.1.28) Variation in scope of work and delay in award of work by 18 to 45 months from the date of sanction of Detail Project Reports (DPR) in 33 towns out of 42 towns resulted in cost escalation of ` 737.88 crore.
(Paragraph 2.1.36) 1 Out of 168 towns, one town i.e. Noida was not selected by Paschimanchal Vidyut Vitran Nigam
Limited for implementing Part-B works, as system strengthening work was not required there.
Chapter- II: Performance Audits relating to Government companies and Statutory corporations
19
Madhyanchal Vidyut Vitran Nigam Limited failed to offer the work to Turnkey contractor (TKC) within the validity period of rates which resulted in extra financial burden of ` 134.33 crore on the scheme.
(Paragraph 2.1.37) As per Central Vigilance Commission’s (CVC) guidelines (December 2007), verification of Bank Guarantee (BG) should be done before acceptance. Purvanchal Vidyut Vitran Nigam Limited in contravention of CVC guidelines, accepted BGs of ` 14.32 crore of a non-banking financial company from TKC without verification from the bank. During subsequent scrutiny (May 2015), it was revealed that the BGs were fake. As a result, though the agreement was terminated in July 2015, the BGs could not be encashed.
(Paragraph 2.1.38) The work of Part-B under R-APDRP in Kannauj Town was closed in April 2015 as GoUP, without assigning any reason, decided (April 2015) for conversion of overhead electrical system into underground system under Twarit Arthik Vikas Yojna of GoUP instead of under R-APDRP. However, BoD of DVVNL, prepared the DPR for the scheme, citing political sensitivity of the town as reason for the change. Thus, the improper planning while constructing overhead lines for Kannuaj Town resulted in infructuous expenditure of ` 3.10 crore incurred on construction of overhead lines.
(Paragraph 2.1.40) In six towns DISCOMs failed to provide land to TKCs for 20 sub-stations after lapse of 14 to 37 months as on March 2016. Further, due to pending completion of associated works in four towns, six sub-stations were energised with the old existing line. This fact was substantiated by the finding of joint physical inspection in Lucknow town.
(Paragraphs 2.1.41 and 2.1.42)
Introduction
2.1.1 Accelerated Power Development and Reforms Programme (APDRP) was modified during the XI Plan as "Re-structured Accelerated Power Development and Reforms Programme (R-APDRP)" by the Ministry of Power (MoP), Government of India (GoI). The main objectives of R-APDRP were to reduce Aggregate Technical and Commercial (AT&C) losses, bring about commercial viability in the power sector, reduce outages and interruptions and increase consumer satisfaction. The Power Finance Corporation Limited (PFC) was the nodal agency for the operationalisation and implementation of Scheme under overall guidance of the MoP, GoI. In Uttar Pradesh, the Scheme was implemented by Uttar Pradesh Power Corporation Limited (UPPCL) and Power Distribution Companies (DISCOMs)2 in 168 towns.
Projects under R-APDRP Scheme were to be taken up in two parts, Part-A and Part-B. Part-A includes (i) establishment of baseline data and IT applications for energy accounting/ auditing and IT based consumer service center and (ii) establishment of Supervisory Control and Data Acquisition System/ Distribution Management System (SCADA/DMS) in large towns3. Part-B includes regular distribution system strengthening works.
2 Madhyanchal Vidyut Vitran Nigam Limited (MVVNL), Purvanchal Vidyut Vitran Nigam Limited
(PuVVNL), Paschimanchal Vidyut Vitran Nigam Limited (PVVNL) and Dakshinanchal Vidyut Vitran Nigam Limited (DVVNL), subsidiaries of UPPCL.
3 Having a population over 4 lakh and annual input energy of 350 MUs.
Audit Report on Public Sector Undertakings for the year ended 31 March 2016
20
Funding mechanism and benefit from the scheme 2.1.2 Initially 100 per cent and 25 per cent funds for the approved projects of Part-A and Part-B of the schemes respectively were to be provided in the form of interest bearing loan from GoI through PFC. The balance funds for Part-B projects were to be raised by DISCOMs from Financial Institutions (FIs), namely PFC/REC and/or own resources. Guidelines of the scheme provided in case of Part-A, that 100 per cent loan plus interest thereon was to be converted into a grant once the establishment of the required system is achieved and verified by an independent agency. No conversion to grant was to be made in case projects were not completed within the extended timeline (extended period up to March 2017). In case of Part-B, if DISCOMs achieved the target of 15 per cent AT&C losses on a sustained basis for a period of five years in the project area and project was completed within the time schedule fixed by the Steering Committee (extended up to May 2017), loan against Part-B projects plus interest thereon up to 50 per cent was to be converted into grant in equal tranches, every year after the year in which the baseline data system (Part-A) of the project area concerned was established and verified by the independent agency appointed by MoP through the nodal agency. Thus, considering the financial health, scarcity of funds and huge losses incurred by the DISCOMs, timely completion of the scheme provided an opportunity to DISCOMs to establish IT enabled systems and improve its power distribution infrastructure and thereby reduce its AT&C losses up to 15 per cent and also avail the benefit of grant.
In Uttar Pradesh, the Scheme was sanctioned in 168 towns4 with sanctioned cost of ` 7,971.48 crore out of which a total of ` 4,110.70 crore (GoI: ` 1,990.57 crore and FIs: ` 2,120.13 crore) was released to DISCOMs. Of this, ` 3,764.72 crore was expended upto March 2016. The scheme was to be completed within three years from the sanction of project (June 2009) but the same was extended upto March 2017 for Part-A IT enabled system and upto May 2017 for Part-A SCADA and Part-B. The R-APDRP scheme has not been completed so far (October 2016).
Organisational set up 2.1.3 The UPPCL, being holding company, has been monitoring the implementation of R-APDRP Scheme. The Chairman, UPPCL with the assistance of its Directors5, monitors the progress of the Scheme.
The Management of the DISCOMs is vested with a Board of Directors comprising Chairman, Managing Director (MD) and three other Directors appointed by the State Government. Nodal Officers (Superintending Engineers) at each DISCOM Headquarters are responsible to monitor the implementation of the Scheme and coordinate with all stake holders and Chief Executive Officer (Superintending Engineers) at each Circle level of DISCOMs are responsible to look after the execution and monitoring of the Scheme. The Organisational set up is shown in the Annexure-2.1.1.
Audit objectives
2.1.4 The audit objectives of the Performance Audit were to assess whether: 4 Part-A of the Scheme was implemented in 168 towns and Part-B in 167 towns (excluding Noida
town). 5 Director (Commercial) for Part-A and Director (Distribution) for Part-B.
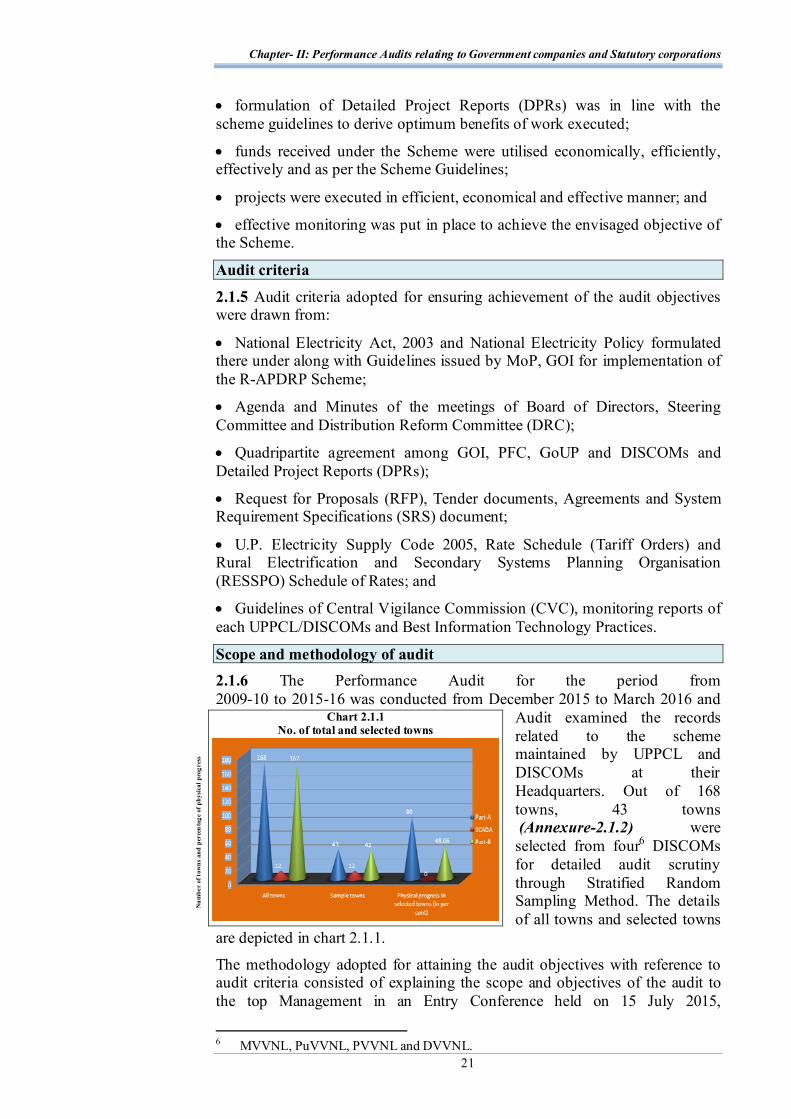
Chapter- II: Performance Audits relating to Government companies and Statutory corporations
21
formulation of Detailed Project Reports (DPRs) was in line with the scheme guidelines to derive optimum benefits of work executed;
funds received under the Scheme were utilised economically, efficiently, effectively and as per the Scheme Guidelines;
projects were executed in efficient, economical and effective manner; and
effective monitoring was put in place to achieve the envisaged objective of the Scheme.
Audit criteria
2.1.5 Audit criteria adopted for ensuring achievement of the audit objectives were drawn from:
National Electricity Act, 2003 and National Electricity Policy formulated there under along with Guidelines issued by MoP, GOI for implementation of the R-APDRP Scheme;
Agenda and Minutes of the meetings of Board of Directors, Steering Committee and Distribution Reform Committee (DRC);
Quadripartite agreement among GOI, PFC, GoUP and DISCOMs and Detailed Project Reports (DPRs);
Request for Proposals (RFP), Tender documents, Agreements and System Requirement Specifications (SRS) document;
U.P. Electricity Supply Code 2005, Rate Schedule (Tariff Orders) and Rural Electrification and Secondary Systems Planning Organisation (RESSPO) Schedule of Rates; and
Guidelines of Central Vigilance Commission (CVC), monitoring reports of each UPPCL/DISCOMs and Best Information Technology Practices.
Scope and methodology of audit 2.1.6 The Performance Audit for the period from 2009-10 to 2015-16 was conducted from December 2015 to March 2016 and
Audit examined the records related to the scheme maintained by UPPCL and DISCOMs at their Headquarters. Out of 168 towns, 43 towns (Annexure-2.1.2) were selected from four6 DISCOMs for detailed audit scrutiny through Stratified Random Sampling Method. The details of all towns and selected towns
are depicted in chart 2.1.1.
The methodology adopted for attaining the audit objectives with reference to audit criteria consisted of explaining the scope and objectives of the audit to the top Management in an Entry Conference held on 15 July 2015,
6 MVVNL, PuVVNL, PVVNL and DVVNL.
Chart 2.1.1 No. of total and selected towns
Num
ber
of t
owns
and
per
cen
tage
of p
hysi
cal p
rogr
ess

Audit Report on Public Sector Undertakings for the year ended 31 March 2016
22
examination of records at UPPCL and DISCOMs. Besides, joint physical verification of 33/11 KV sub-stations constructed in five towns7 under the Scheme was conducted and feedback from the DISCOMs were obtained.
The Performance Audit report was issued to the Management and Government in July 2016 for their comments. An Exit conference was held on 30 August 2016 with the Management and Government. Replies of the Management were received in October 2016 which have been duly considered while finalising the Performance Audit Report. Reply of the Government was awaited (October 2016).
Financial and physical progress 2.1.7 DISCOM-wise financial and physical progress of the Scheme as a whole (168 towns) and in selected towns (43) for the last seven years up to March 2016 has been detailed in the Annexure-2.1.3 (A and B) and 2.1.4 (A and B) and summarised in table 2.1.1.
Table 2.1.1 Financial and Physical progress of the scheme
(` in crore) All Towns Sampled Towns
Scheme Sanctioned cost
Fund released Expenditure
Physical progress
(in per cent)
Sanctioned cost
Fund released Expenditure
Physical progress
(in per cent)
Part-A (i) IT System
775.10 474.50 508.018 90 536.95 348.69 336.26 90
Part-A (ii) SCADA
280.81 79.96 17.599 0 280.81 79.96 17.59 0
Part-B 6915.57 3556.24 3239.12 56.65 5042.96 1857.64 1760.19 48.06 Total 7971.48 4110.70 3764.72 5860.72 2286.29 2114.04 Source: Information furnished by UPPCL and DISCOMs.
Table 2.1.1 depicts that the sanctioned cost of the scheme was ` 7,971.48 crore out of which a total of ` 4,110.70 crore (GoI: ` 1,990.57 crore and FIs: ` 2,120.13 crore) was released to DISCOMs. Despite expenditure of ` 3,764.72 crore upto March 2016, physical progress of 90 and 56.65 per cent could only be achieved in Part- A (i) and B respectively whereas no physical progress was achieved in Part- A (ii) SCADA.
Implementation of the Scheme
2.1.8 For implementation of Part-A of the scheme, Information Technology Consultant (ITC) was to be appointed by the UPPCL from empanelled list of PFC. The ITC was responsible for preparation of DPRs and monitoring of the progress of work related to Part-A. Alongwith this, an Information Technology Implementation Agency (ITIA) was to be appointed from firms empanelled with PFC, for the establishment of IT enabled system without human intervention (Go-live10) in the DISCOMs. In case of Part-B, the DPRs were prepared by the consultants appointed by the UPPCL/DISCOMs and monitoring of the projects was to be done by a project 7 Lucknow, Hardoi, Faizabad, Unnao and Bangarmau. 8 Including ` 33.51 crore incurred from internal resources. 9 This is mobilisation advance paid to SCADA Implementing Agency and payment to SCADA
consultant. 10 Town is declared Go-live where IT enabled system is complete as per System Requirement
Specification and report of AT&C losses is reported online without human intervention.
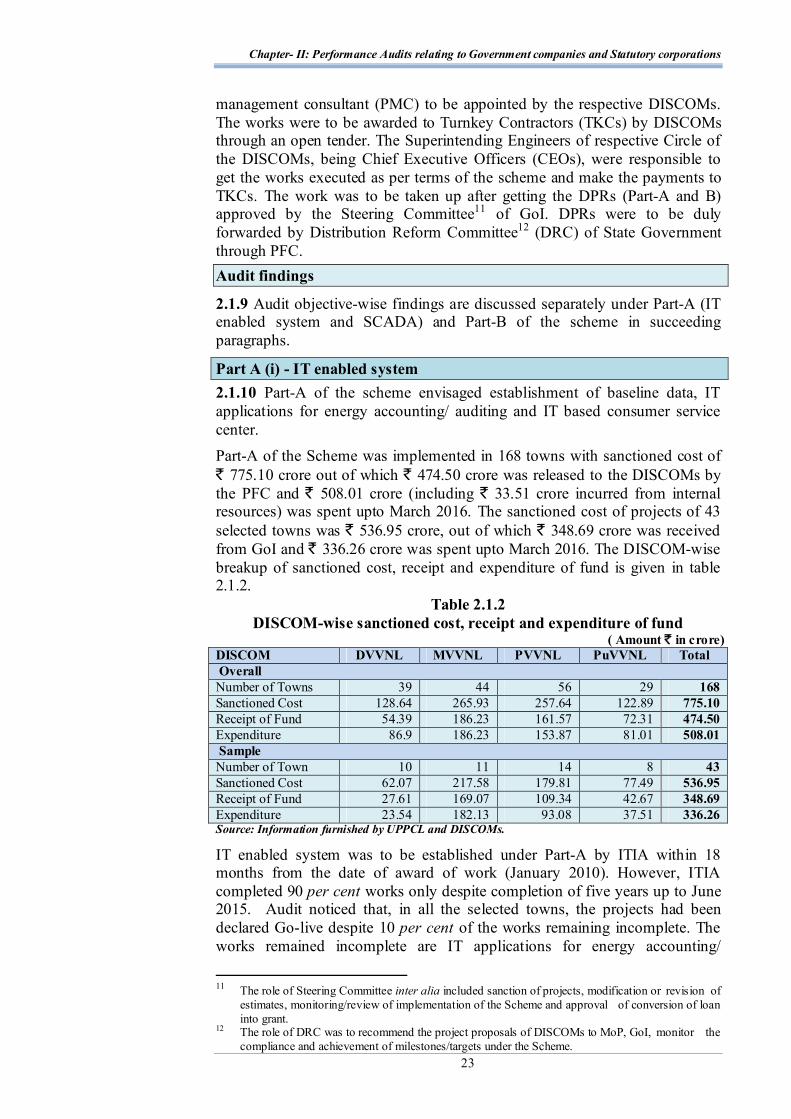
Chapter- II: Performance Audits relating to Government companies and Statutory corporations
23
management consultant (PMC) to be appointed by the respective DISCOMs. The works were to be awarded to Turnkey Contractors (TKCs) by DISCOMs through an open tender. The Superintending Engineers of respective Circle of the DISCOMs, being Chief Executive Officers (CEOs), were responsible to get the works executed as per terms of the scheme and make the payments to TKCs. The work was to be taken up after getting the DPRs (Part-A and B) approved by the Steering Committee11 of GoI. DPRs were to be duly forwarded by Distribution Reform Committee12 (DRC) of State Government through PFC. Audit findings
2.1.9 Audit objective-wise findings are discussed separately under Part-A (IT enabled system and SCADA) and Part-B of the scheme in succeeding paragraphs.
Part A (i) - IT enabled system 2.1.10 Part-A of the scheme envisaged establishment of baseline data, IT applications for energy accounting/ auditing and IT based consumer service center. Part-A of the Scheme was implemented in 168 towns with sanctioned cost of ` 775.10 crore out of which ` 474.50 crore was released to the DISCOMs by the PFC and ` 508.01 crore (including ` 33.51 crore incurred from internal resources) was spent upto March 2016. The sanctioned cost of projects of 43 selected towns was ` 536.95 crore, out of which ` 348.69 crore was received from GoI and ` 336.26 crore was spent upto March 2016. The DISCOM-wise breakup of sanctioned cost, receipt and expenditure of fund is given in table 2.1.2.
Table 2.1.2 DISCOM-wise sanctioned cost, receipt and expenditure of fund
( Amount ` in crore) DISCOM DVVNL MVVNL PVVNL PuVVNL Total Overall Number of Towns 39 44 56 29 168 Sanctioned Cost 128.64 265.93 257.64 122.89 775.10 Receipt of Fund 54.39 186.23 161.57 72.31 474.50 Expenditure 86.9 186.23 153.87 81.01 508.01 Sample Number of Town 10 11 14 8 43 Sanctioned Cost 62.07 217.58 179.81 77.49 536.95 Receipt of Fund 27.61 169.07 109.34 42.67 348.69 Expenditure 23.54 182.13 93.08 37.51 336.26 Source: Information furnished by UPPCL and DISCOMs.
IT enabled system was to be established under Part-A by ITIA within 18 months from the date of award of work (January 2010). However, ITIA completed 90 per cent works only despite completion of five years up to June 2015. Audit noticed that, in all the selected towns, the projects had been declared Go-live despite 10 per cent of the works remaining incomplete. The works remained incomplete are IT applications for energy accounting/
11 The role of Steering Committee inter alia included sanction of projects, modification or revision of
estimates, monitoring/review of implementation of the Scheme and approval of conversion of loan into grant.
12 The role of DRC was to recommend the project proposals of DISCOMs to MoP, GoI, monitor the compliance and achievement of milestones/targets under the Scheme.
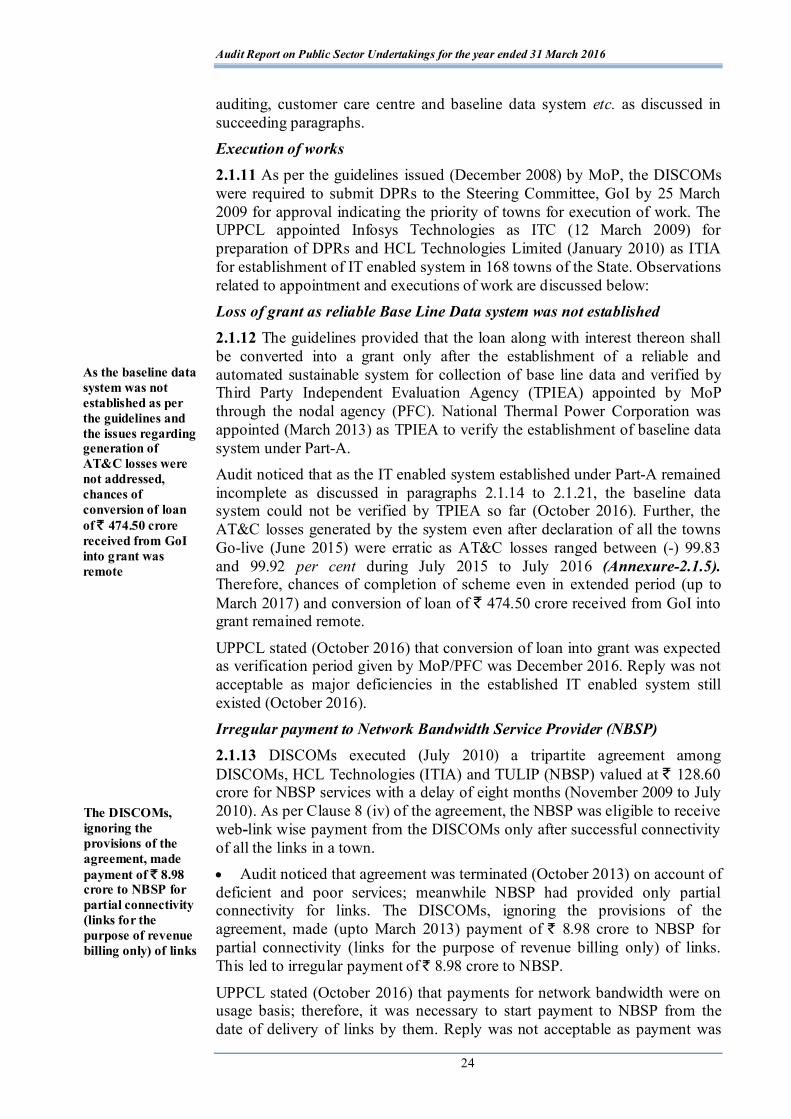
Audit Report on Public Sector Undertakings for the year ended 31 March 2016
24
auditing, customer care centre and baseline data system etc. as discussed in succeeding paragraphs. Execution of works 2.1.11 As per the guidelines issued (December 2008) by MoP, the DISCOMs were required to submit DPRs to the Steering Committee, GoI by 25 March 2009 for approval indicating the priority of towns for execution of work. The UPPCL appointed Infosys Technologies as ITC (12 March 2009) for preparation of DPRs and HCL Technologies Limited (January 2010) as ITIA for establishment of IT enabled system in 168 towns of the State. Observations related to appointment and executions of work are discussed below: Loss of grant as reliable Base Line Data system was not established 2.1.12 The guidelines provided that the loan along with interest thereon shall be converted into a grant only after the establishment of a reliable and automated sustainable system for collection of base line data and verified by Third Party Independent Evaluation Agency (TPIEA) appointed by MoP through the nodal agency (PFC). National Thermal Power Corporation was appointed (March 2013) as TPIEA to verify the establishment of baseline data system under Part-A. Audit noticed that as the IT enabled system established under Part-A remained incomplete as discussed in paragraphs 2.1.14 to 2.1.21, the baseline data system could not be verified by TPIEA so far (October 2016). Further, the AT&C losses generated by the system even after declaration of all the towns Go-live (June 2015) were erratic as AT&C losses ranged between (-) 99.83 and 99.92 per cent during July 2015 to July 2016 (Annexure-2.1.5). Therefore, chances of completion of scheme even in extended period (up to March 2017) and conversion of loan of ` 474.50 crore received from GoI into grant remained remote.
UPPCL stated (October 2016) that conversion of loan into grant was expected as verification period given by MoP/PFC was December 2016. Reply was not acceptable as major deficiencies in the established IT enabled system still existed (October 2016). Irregular payment to Network Bandwidth Service Provider (NBSP) 2.1.13 DISCOMs executed (July 2010) a tripartite agreement among DISCOMs, HCL Technologies (ITIA) and TULIP (NBSP) valued at ` 128.60 crore for NBSP services with a delay of eight months (November 2009 to July 2010). As per Clause 8 (iv) of the agreement, the NBSP was eligible to receive web-link wise payment from the DISCOMs only after successful connectivity of all the links in a town. Audit noticed that agreement was terminated (October 2013) on account of deficient and poor services; meanwhile NBSP had provided only partial connectivity for links. The DISCOMs, ignoring the provisions of the agreement, made (upto March 2013) payment of ` 8.98 crore to NBSP for partial connectivity (links for the purpose of revenue billing only) of links. This led to irregular payment of ` 8.98 crore to NBSP.
UPPCL stated (October 2016) that payments for network bandwidth were on usage basis; therefore, it was necessary to start payment to NBSP from the date of delivery of links by them. Reply was not acceptable as payment was
As the baseline data system was not established as per the guidelines and the issues regarding generation of AT&C losses were not addressed, chances of conversion of loan of ̀ 474.50 crore received from GoI into grant was remote
The DISCOMs, ignoring the provisions of the agreement, made payment of ` 8.98 crore to NBSP for partial connectivity (links for the purpose of revenue billing only) of links
Chapter- II: Performance Audits relating to Government companies and Statutory corporations
25
not to be made before connectivity of all links in a town. The fact regarding partial connectivity of links by NBSP were also confirmed in the feedback received in survey conducted by Audit among CEOs of beneficiary DISCOMs.
Audit noticed that as per Clause 7 of the agreement, DISCOMs should have obtained Performance Bank Guarantee (PBG) for an amount of ` 12.86 crore (DVVNL: ` 2.58 crore, MVVNL: ` 3.41 crore, PVVNL: ` 4.11 crore and PuVVNL: ` 2.76 crore) towards the performance of the contract which was not obtained. In absence of required PBG, NBSP could not be penalised for not performing the agreement. Audit further noticed that DISCOMs (DVVNL and PuVVNL) did not get the BGs renewed from NBSP against the mobilisation advance. As a result, mobilisation advance of ` 5.34 crore (DVVNL: ` 2.58 crore and PuVVNL: ` 2.76 crore) could not be recovered on termination of the agreement.
UPPCL stated (October 2016) that though BGs were not renewed, bills of NBSP for amount in excess of lapsed BGs were withheld by the DISCOMs. Reply was not tenable as the withheld amount was not payable to NBSP as per terms and conditions of the agreement. Further, the failure to obtain PBG resulted in the NBSP escaping penalties for not performing the agreement and the recovery of mobilisation advance from withheld amount could not compensate the loss due to expiry of the BGs. Feeder/Distribution Transformer meters not updated in Meter Data Acquisition System 2.1.14 The main objective of Meter Data Acquisition System (MDAS) is to acquire data automatically from meters by avoiding any human intervention. Audit observed that in 43 test checked towns, the data communication facility
was available only from 462 (82 per cent) sub-stations out of total 557 sub-stations. Out of 5,281 feeders and 74,009 Distribution Transformers (DTs) only 4,888 feeders (92 per cent) and 31,875 DTs (43 per cent) were updated in MDAS. Thus, the objective of MDAS to acquire meter data automatically without human intervention was defeated as 18 per cent sub-stations were not communicating data automatically and eight per cent feeders and 57 per cent DTs were not updated in MDAS as of March 2016. UPPCL accepted the facts and stated (October 2016) that replacement of meters
and updating was a continuous process and efforts were made to gradually improve the status of DT meters and availability of modem. Reply furnished by the Management was not tenable, as updating a system by adopting technological changes in a timely manner was an essential component for sustainable operation of established system in an IT environment, which the Management failed to ensure.
Distribution Transformer not updated in system
Audit Report on Public Sector Undertakings for the year ended 31 March 2016
26
Poor data communication from modems installed on DTs 2.1.15 The scheme provided for installation of meters, modems and GPRS13 SIMs14 at each DT to capture the energy data on a continuous basis. Audit observed that out of 55,751 modems installed on DTs, data communication was being received only from 11,933 modems (16 per cent of DTs) as of 31 March 2016. Thus, due to deficient data communication from the modems, the DISCOMs were compelled to fill the gaps in energy data through manual entries which defeated the objective of eliminating human intervention in energy accounting/auditing. UPPCL accepted the facts and stated (October 2016) that communication deficiencies of these modems were due to de-activation of SIMs and maintenance activities of DT meters.
Deficient User Acceptance Testing 2.1.16 As per good IT practices, User Acceptance Testing (UAT) is a very crucial phase to declare the completion of a project. Therefore, UAT should be compulsorily conducted as specified in the SRS before the issue of UAT completion certificate by DISCOMs to ITIA. As per SRS, tests of modules as well as system tests of total 13 types15 under Part-A were prescribed to be conducted for successful completion of the scheme. Audit noticed that UAT was conducted during 14 May 2012 to 19 May 2012 in 14 of the 17 modules, leaving three modules16 untested. However, DISCOMs issued (May 2012) UAT completion certificate for all the modules. Moreover, recommendations of the ITC, as detailed in Annexure-2.1.6, to address the shortcomings/deficiencies noticed during UAT of eight modules17 were not complied with by the DISCOMs/ITIA. Audit further noticed that none of the 13 system tests prescribed as per SRS was carried out (March 2016) to declare the project as complete. Therefore, UAT completion certificate issued by the DISCOMs without ensuring prescribed 13 tests of modules was not justified. UPPCL stated (October 2016) that functionality changes/additions in software were an ongoing and continuous process and not a one time job and so on the basis of this, the user acceptance of system cannot be termed deficient. Meanwhile, the operational recommendations of committee on the tested modules had been addressed and untested modules had been tested. Reply furnished by the Management was not acceptable, as changes/additions in software by adopting technological changes in a timely manner was an essential component for sustainable operation of established system in an IT environment. Moreover, the Management had not yet (October 2016) carried
13 General packet radio service. 14 Subscriber identity module. 15 Unit Testing, Integration Testing, Incremental Integration Testing, System Testing,
Pre-Production Testing, Regression Testing, Performance Testing, Load Testing, Installation Testing, Security/Penetration Testing, Recovery/Error Testing, Acceptance Testing, Performance Testing.
16 Management Information System, System security and Development of Commercial Database of Consumers. 17 New Connection Module, Disconnection and Dismantling Module, Network Analysis Module, Customer Care Centre, Web Self Service, Billing, Assets Management and Maintenance Management.
DISCOMs issued (May 2012) UAT completion certificates without ensuring prescribed 13 tests of modules for all modules while UAT was conducted in 14 of 17 modules, leaving three modules untested

Chapter- II: Performance Audits relating to Government companies and Statutory corporations
27
out UAT of all 17 modules together which was essential for completion of the project. Deficiencies in Customer Care Centre 2.1.17 As per SRS, a Customer Care Centre (CCC) was to be established in each DISCOM with a view to achieve the objective of increasing consumers’ satisfaction. Audit noticed that the CCCs were not fulfilling the requirements as envisaged in the SRS due to the following reasons:
CCC service module was not able to generate 11 types of periodical summarised report of consumers’ complaints prescribed in SRS. Rather, it generated only three types of report i.e. service request complaints, billing complaints and mobile and email updation requests;
the system was not able to track the action taken at appropriate level of DISCOM against complaints/requests to ensure the status of action taken within the time prescribed in U.P. Electricity Supply Code;
there was no provision of generating report showing time taken by the DISCOMs for disposing off consumer’s complaints; and
the reports showing age-wise pendency of complaints could also not be generated. UPPCL stated (October 2016) that the CCC was integrated for six types of complaints in accordance with existing requirements of input from registered consumers. Design for remaining five types of complaints also existed in system. Reply was not acceptable as only three out of 11 types of reports as per SRS were generated by CCC. The reports prescribed for status, age and level of pendency of complaints were not being generated. Deficiencies in IT enabled system 2.1.18 IT application capable of generating energy bills, conducting energy accounting/auditing was developed by ITIA under Part-A of the scheme. As analysed by audit the following deficiencies were found in the IT system:
the system did not provide the status of working of shunt capacitor;
provision for protective load charges was not made in the system;
password generation, password change and password unlock process were not as per SRS which made the system vulnerable for security attack;
template of Management Information System (MIS) reports of GIS, MDAS, Energy audit, Network analysis, Work and Asset Management modules was not finalised;
poor performance of Customer Care and Billing (CCB) Server was reported in January/February 2014 and the problem aggravated up to March 2015. It was recommended by ITC that UPPCL/DISCOMS should carry out Root Cause Analysis (RCA) for poor performance of CCB servers along with mitigation plan from ITIA so that the problems might not repeat in future. The UPPCL/DISCOMs, however, did not take any corrective action;
IT policy for standardisation and security of R-APDRP system was neither formulated nor implemented in DISCOMs;

Audit Report on Public Sector Undertakings for the year ended 31 March 2016
28
functioning of Disaster Recovery Centre (DRC) in correlation with Data Centre (DC) was not tested. As a result, the billing data of consumers faced the high risk of loss in case of any contingency/disaster; and
Oracle Utility Business Intelligence (OUBI) tools required for MIS was not provided by ITIA. In absence of the same, the Management could not generate MIS and failed to monitor the aforesaid activities to minimise AT&C losses. UPPCL accepted the audit observations and stated (October 2016) that the ITIA was instructed to make the system enabled and updated with regard to password management system and enhancement of capacity of CCB and its sustainability.
Failure in updating Geographic Information System data 2.1.19 Clause 4.1.2 (section G-1) of System Requirements Specification (SRS) provided that vendor would detail their methodology for updation of changes in Geographic Information System (GIS) data.
Audit observed that during the period of implementation of the scheme, there had been huge changes in consumer data as well as in electrical network in the towns selected under the scheme due to new connection, disconnection, construction of new sub-stations and lines. The ITIA/DISCOMs did not update GIS data in any of the towns. In absence of updated data, the objective of correct energy accounting and auditing could not be ensured.
UPPCL stated (October 2016) that GIS could not be completed as a standalone activity but was to be gradually corrected with monthly survey in each billing cycle. The fact, however, remained that no corrective action was taken by the DISCOMs to update the changes in GIS. Assessment based consumption in R-APDRP towns 2.1.20 As per section 55 of the Electricity Act, 2003, the DISCOMs were to provide meters to all service connections before June 2005. Further, the scheme provided for 100 per cent metering to ensure proper energy accounting and auditing. Audit noticed that 3,712 street light consumers pertaining to all DISCOMs having connected load of 68,127 KW were unmetered and billing was done on assessment basis. This defeated the objective of 100 per cent metering under the scheme. UPPCL accepted the facts and stated (October 2016) that planned efforts in phased manner was being made to achieve 100 per cent metering on street lights. Delay in appointment of ITC and technically disqualified ITIA 2.1.21 Audit observed that UPPCL took more than two months in appointing the ITC and submitted (15 May 2009) the DPRs without indicating priority of towns to GoI for approval that too with a delay of 51 days. Audit further noticed that the ITIA appointed by DISCOMs was technically not qualified as its score was 33.65 marks against a minimum of 35 marks prescribed (December 2009) by the Steering Committee. Thus, there was delay in appointment of ITC and ITIA was technically not qualified as per the benchmarks set by Steering Committee. Audit observed that the scheme could not be completed even after lapse of more than six years up to October 2016
Appointment of technically not qualified ITIA and delay of more than two months in appointment of ITC delayed the implementation of the Project
Chapter- II: Performance Audits relating to Government companies and Statutory corporations
29
due to delayed appointment of ITC and deficiencies in the system established by ITIA, as discussed in paragraphs 2.1.16 to 2.1.19. UPPCL stated (October 2016) that bids were evaluated at its level and final marks obtained by all bidders were more than 40 and HCL was selected as ITIA because it was the L1 tenderer. Reply was not acceptable as ITC was appointed as an expert for bid evaluation for appointment of ITIA. But ignoring scores given by the ITC, HCL was appointed as ITIA on the basis of internal evaluation. Thus, purpose for which ITC was appointed was defeated. Moreover, no document in support of evaluation of bids made by UPPCL was furnished to audit. Avoidable expenditure on consultancy services
2.1.22 DISCOMs executed (October 2009) an agreement with ITC (valid for four years) for monitoring execution of projects. As per Clause 1.9 of the contract, payment of contracted amount of ` 1.94 crore was to be made to ITC as per milestones (Annexure 2.1.7) achieved. Audit noticed that only three against the required seven milestones were achieved by the ITC as of October 2013. Three DISCOMs18extended (17 October 2013) the validity of the agreement for two years with an additional amount of ` 2.72 crore, payable on monthly equated installments. The other DISCOM i.e. DVVNL, however, did not extend validity period of agreement and was getting the work done through ITC against the existing agreement without involving any additional payment. Thus, extension of validity of agreement by three DISCOMs19 with an additional payment led to avoidable expenditure of ` 2.72 crore.
UPPCL stated (October 2016) that additional payment was justified in the interest of project to enable the DISCOMs to seek valuable technical help and support from the ITC. Reply was not acceptable as the extension of agreement should have been done without any additional payment as all the agreed milestones had not been achieved by the ITC. Irregular payment to ITIA 2.1.23 Clause 14.1 of the agreement with ITIA provided that all payments for Facility Management Services (FMS) would be made after declaration of DISCOMs ‘wide rollout Go-live’ and submission of the energy audit reports by ITIA.
Audit noticed that the DISCOMs made payment of FMS charges of ` 2.45 crore (up to March 2015) to the ITIA prior to declaration (April 2015 to June 2015) of DISCOMs wide rollout Go-live into all towns and without submission of any energy audit reports by the ITIA. Audit also noticed that energy audit reports were not generated as eight per cent feeder meters and 57 per cent Distribution Transformer (DT) meters were not updated in MDAS and 84 per cent DTs lacked communication facility as of March 2016. Thus, payment of FMS charges to ITIA prior to declaration of DISCOMs ‘wide rollout Go-live’ in all towns and without conducting energy audit led to irregular payment of ` 2.45 crore to the ITIA.
18 PVVNL, MVVNL and PuVVNL. 19 PVVNL, MVVNL and PuVVNL.
DISCOMs made irregular payment of FMS charges of ` 2.45 crore (upto March 2015) to the ITIA prior to declaration of DISCOMs wide rollout Go-live
DISCOMs incurred avoidable expenditure of ` 2.72 crore due to extension of validity of consultancy agreement with an additional payment, despite the fact that out of seven only three milestones were achieved by the ITC
Audit Report on Public Sector Undertakings for the year ended 31 March 2016
30
UPPCL stated (October 2016) that in view of ensuring utility operations; UPPCL took decision to start FMS operations from March 2014 for all Go- live towns under R-APDRP. The fact remained that the payment of FMS charges to ITIA was made before declaring ‘wide rollout Go-live’ by DISCOMs in all towns. Undue favour to ITIA 2.1.24 As per Clause 69 of the agreement with ITIA, if the ITIA failed to perform all the work within the period specified in the contract, the DISCOMs should deduct liquidated damages equivalent to 0.5 per cent per week subject to a maximum of 10 per cent of contract value. Audit noticed that delay in submission of design, not updating the GIS data, not conducting integrated testing of all modules etc. by ITIA led to deficient Go-live of the programme in all towns. Despite these deficiencies, the DISCOMs unduly favoured ITIA by issuing completion certificate for deficient Go-live and by not deducting penalty of ` 77.51 crore from their bills. UPPCL stated (October 2016) that the system implementation works had been completed by the ITIA on their part and all towns were declared Go-live within the extended timeframe. Therefore, not deducting penalty does not amount to any undue favour to the ITIA. Reply was not acceptable as the ITIA did not carry out the steps involved in completion of the project and implemented a defective and incomplete programme that was declared Go-live between April 2015 and June 2015.
Part A (ii) Establishment of SCADA
2.1.25 Part-A (ii) SCADA of the scheme envisaged improvement in system reliability through remote operation. SCADA was to be implemented in 12 towns20 within three years from sanction of the project i.e. June 2009 (extended upto May 2017) as per guidelines of the scheme. SCADA consultant (SDC) was to be appointed by DISCOMs for preparation of DPRs and monitoring of projects and SCADA Implementing Agency (SIA) for implementation of projects.
The sanctioned cost of projects of 12 towns was ` 280.81 crore out of which ` 79.96 crore was received from GoI (September 2012) and ` 17.59 crore was spent on mobilisation advance and payment to consultant. However, as of March 2016, there was no physical progress in the project. The DISCOM-wise breakup of sanctioned cost, receipt and expenditure of fund is given in table 2.1.3.
Table 2.1.3 DISCOM-wise sanctioned cost, receipt and expenditure of fund
(Amount ` in crore) DISCOM DVVNL MVVNL PVVNL PuVVNL Total Overall and Sample Number of Town 3 2 4 3 12 Sanctioned Cost 46.35 47.42 112.93 74.11 280.81 Receipt of Fund 13.91 9.94 33.88 22.23 79.96 Expenditure 2.88 1.74 7.11 5.86 17.59
Source: Information furnished by UPPCL and DISCOMs.
20 Lucknow, Bareilly, Allahabad, Varanasi, Gorakhpur, Meerut, Ghaziabad, Saharanpur, Moradabad, Aligarh, Firozabad and Jhansi.
DISCOMs incurred an expenditure of ` 17.59 crore under SCADA with no physical progress as of March 2016
Chapter- II: Performance Audits relating to Government companies and Statutory corporations
31
As analysed by audit, the SCADA work could not progress after a lapse of more than four years mainly due to the following reasons:
DPRs for SCADA were sanctioned during June to October 2011 but contract with SIA (SIEMENS) for implementation of SCADA was finalised (July 2013) by UPPCL after a period of 20 to 24 months against scheduled time limit of three months from the date of sanction of DPRs. The agreements were belatedly entered into by DISCOMs with SIA during August to October 2014 (to be completed within 18 months) due to delay in finalisation of scope of work of Part-B;
DISCOMs were to provide buildings to SIA for establishment of SCADA Control Centre (SCCs). Seven out of 12 SCC buildings were not completed and handed over to the SIA so far (March 2016); and
The scope of work finalised by UPPCL in July 2013, was subsequently (August 2015) reduced in respect of 10 towns considering no progress in the project. However, reduction in scope of work was not intimated to SIA, hence the work could not be taken up by SIA as of October 2016 as discussed in paragraph 2.1.26. Loss due to curtailment in scope of work 2.1.26 As per scheme guidelines, the DISCOMs should not transfer or abandon the project at any stage without written consent of the nodal agency otherwise entire outstanding dues alongwith interest would have to be refunded by the DISCOMs to nodal agency before any such transfer is effected.
Audit noticed that considering no progress in implementation of the SCADA projects, UPPCL decided (August 2015) to implement two projects with complete scope in Lucknow and Varanasi towns; whereas, in rest of the ten towns with reduced scope up to sub-station automation level only without consent of the nodal agency. Due to reduction in scope of work the Renovation and Modernisation (R&M) of sub-station only was done but online communication facility with auto re-closure was not established. Therefore, the purpose of SCADA to monitor and control the distribution network with establishment of SCCs was defeated in the case of 10 towns. Further, due to establishment of SCADA system without establishing the required communication facility with auto re-closure in 10 towns, the DISCOMs were liable to return ` 82.66 crore (including interest of ` 18.46 crore) to PFC as per provisions of the scheme. Thus, failure to specify the scope of work to the implementing agency resulted in no progress being achieved. Consequently, DISCOMs failed to improve system reliability through remote operation even after lapse of more than seven years since initiation (June 2009) of the project. Thus, DISCOMs not only lost the opportunity to improve system reliability to monitor and reduce AT&C losses, but also loan of ` 79.96 crore could not be converted into grant as there was no progress in the SCADA project so far (October 2016) and also could not be possible to complete in extended period (up to May 2017). UPPCL stated (October 2016) that UPPCL and DISCOMs had worked out a detailed month-wise/ phase-wise plan with SIA to successfully execute the decided scope in 10 towns upto sub-station level and full scope in two towns.
Due to delay in finalisation of scope of work of Part-B, not handing over SCC buildings and failure in specifying the scope of work to the implementing agency, no progress could be achieved in SCADA project
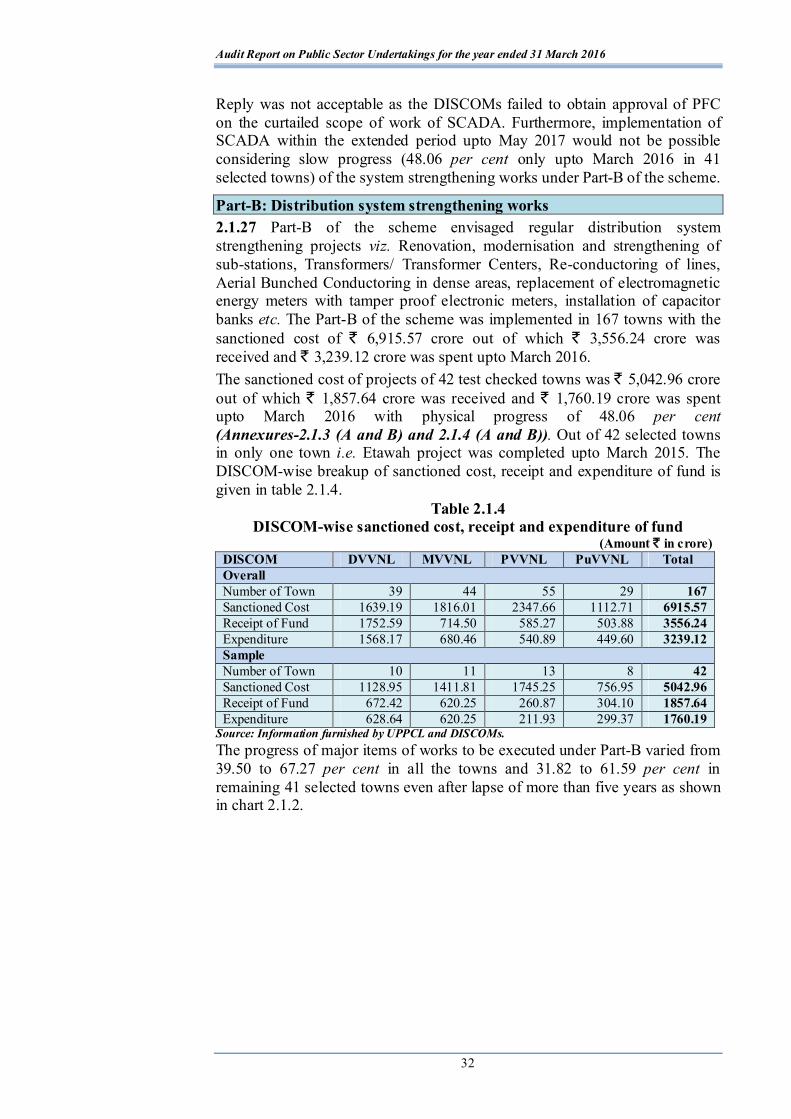
Audit Report on Public Sector Undertakings for the year ended 31 March 2016
32
Reply was not acceptable as the DISCOMs failed to obtain approval of PFC on the curtailed scope of work of SCADA. Furthermore, implementation of SCADA within the extended period upto May 2017 would not be possible considering slow progress (48.06 per cent only upto March 2016 in 41 selected towns) of the system strengthening works under Part-B of the scheme.
Part-B: Distribution system strengthening works 2.1.27 Part-B of the scheme envisaged regular distribution system strengthening projects viz. Renovation, modernisation and strengthening of sub-stations, Transformers/ Transformer Centers, Re-conductoring of lines, Aerial Bunched Conductoring in dense areas, replacement of electromagnetic energy meters with tamper proof electronic meters, installation of capacitor banks etc. The Part-B of the scheme was implemented in 167 towns with the sanctioned cost of ` 6,915.57 crore out of which ` 3,556.24 crore was received and ` 3,239.12 crore was spent upto March 2016. The sanctioned cost of projects of 42 test checked towns was ` 5,042.96 crore out of which ` 1,857.64 crore was received and ` 1,760.19 crore was spent upto March 2016 with physical progress of 48.06 per cent (Annexures-2.1.3 (A and B) and 2.1.4 (A and B)). Out of 42 selected towns in only one town i.e. Etawah project was completed upto March 2015. The DISCOM-wise breakup of sanctioned cost, receipt and expenditure of fund is given in table 2.1.4.
Table 2.1.4 DISCOM-wise sanctioned cost, receipt and expenditure of fund
(Amount ` in crore) DISCOM DVVNL MVVNL PVVNL PuVVNL Total Overall Number of Town 39 44 55 29 167 Sanctioned Cost 1639.19 1816.01 2347.66 1112.71 6915.57 Receipt of Fund 1752.59 714.50 585.27 503.88 3556.24 Expenditure 1568.17 680.46 540.89 449.60 3239.12 Sample Number of Town 10 11 13 8 42 Sanctioned Cost 1128.95 1411.81 1745.25 756.95 5042.96 Receipt of Fund 672.42 620.25 260.87 304.10 1857.64 Expenditure 628.64 620.25 211.93 299.37 1760.19
Source: Information furnished by UPPCL and DISCOMs. The progress of major items of works to be executed under Part-B varied from 39.50 to 67.27 per cent in all the towns and 31.82 to 61.59 per cent in remaining 41 selected towns even after lapse of more than five years as shown in chart 2.1.2.
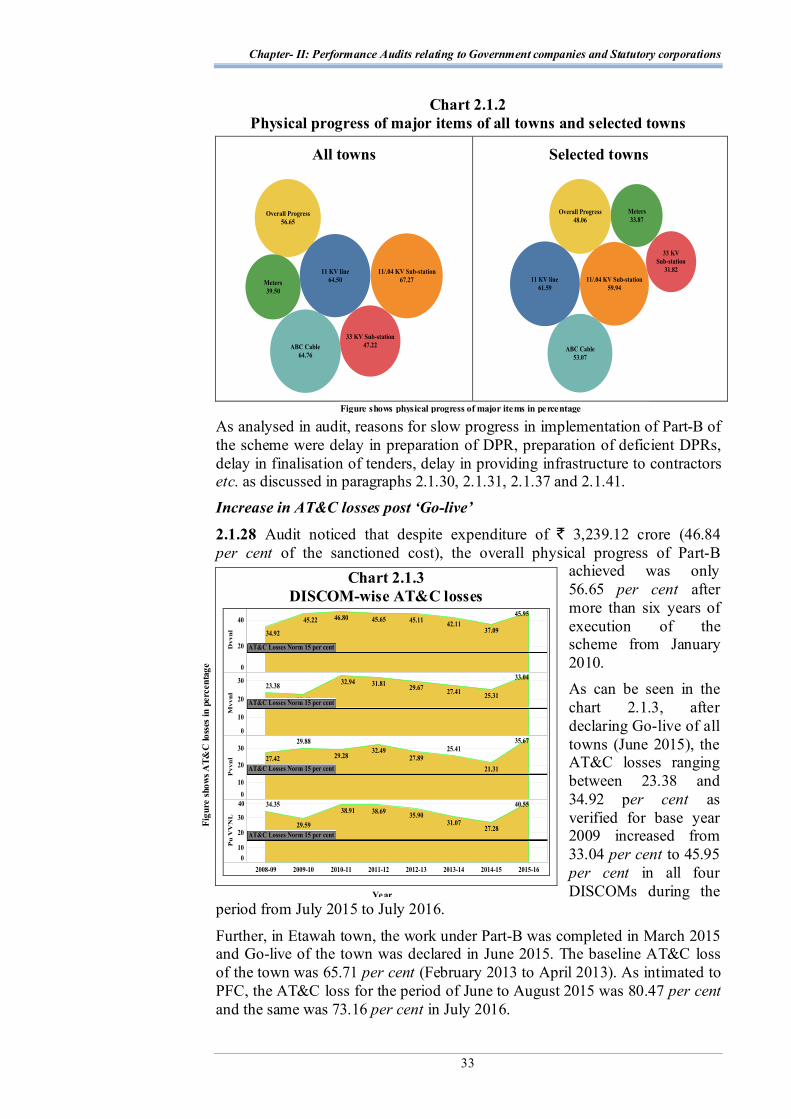
Chapter- II: Performance Audits relating to Government companies and Statutory corporations
33
Chart 2.1.2 Physical progress of major items of all towns and selected towns
All towns
Selected towns
As analysed in audit, reasons for slow progress in implementation of Part-B of the scheme were delay in preparation of DPR, preparation of deficient DPRs, delay in finalisation of tenders, delay in providing infrastructure to contractors etc. as discussed in paragraphs 2.1.30, 2.1.31, 2.1.37 and 2.1.41.
Increase in AT&C losses post ‘Go-live’
2.1.28 Audit noticed that despite expenditure of ` 3,239.12 crore (46.84 per cent of the sanctioned cost), the overall physical progress of Part-B
achieved was only 56.65 per cent after more than six years of execution of the scheme from January 2010. As can be seen in the chart 2.1.3, after declaring Go-live of all towns (June 2015), the AT&C losses ranging between 23.38 and 34.92 per cent as verified for base year 2009 increased from 33.04 per cent to 45.95 per cent in all four DISCOMs during the
period from July 2015 to July 2016.
Further, in Etawah town, the work under Part-B was completed in March 2015 and Go-live of the town was declared in June 2015. The baseline AT&C loss of the town was 65.71 per cent (February 2013 to April 2013). As intimated to PFC, the AT&C loss for the period of June to August 2015 was 80.47 per cent and the same was 73.16 per cent in July 2016.
Chart 2.1.3 DISCOM-wise AT&C losses
Figure shows physical progress of major items in percentage
Year
Figu
re s
how
s AT&
C lo
sses
in p
erce
ntag
e
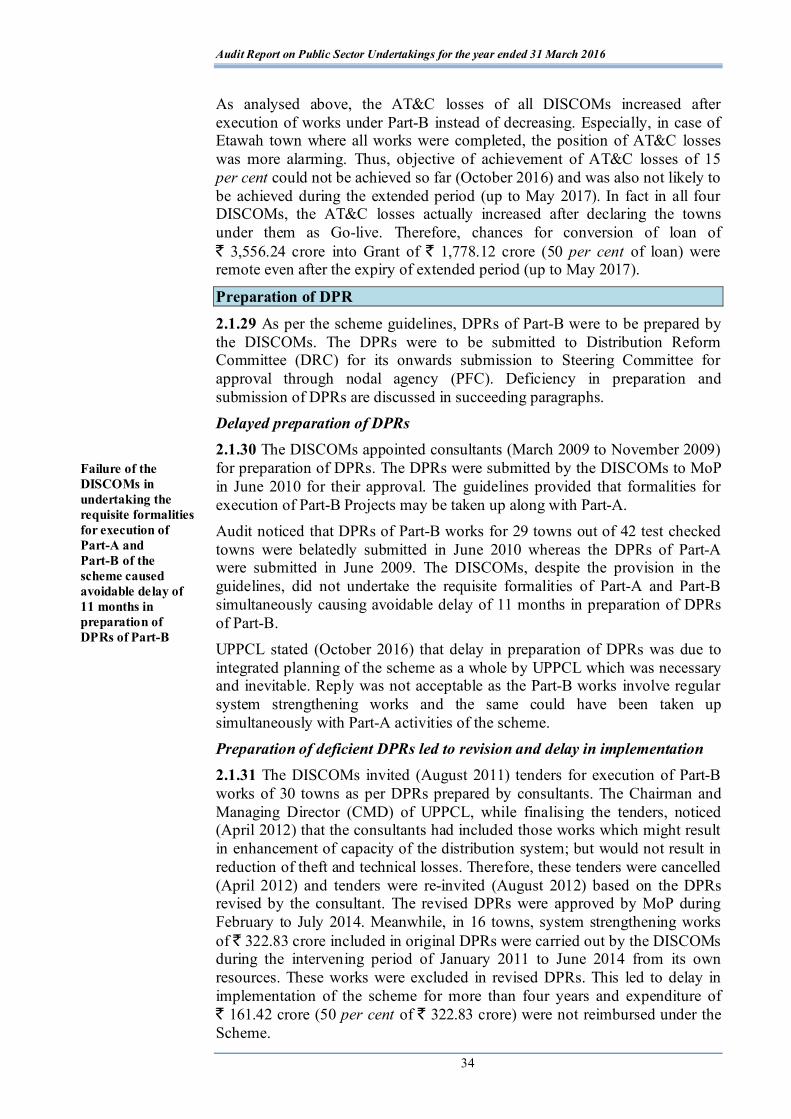
Audit Report on Public Sector Undertakings for the year ended 31 March 2016
34
As analysed above, the AT&C losses of all DISCOMs increased after execution of works under Part-B instead of decreasing. Especially, in case of Etawah town where all works were completed, the position of AT&C losses was more alarming. Thus, objective of achievement of AT&C losses of 15 per cent could not be achieved so far (October 2016) and was also not likely to be achieved during the extended period (up to May 2017). In fact in all four DISCOMs, the AT&C losses actually increased after declaring the towns under them as Go-live. Therefore, chances for conversion of loan of ` 3,556.24 crore into Grant of ` 1,778.12 crore (50 per cent of loan) were remote even after the expiry of extended period (up to May 2017).
Preparation of DPR
2.1.29 As per the scheme guidelines, DPRs of Part-B were to be prepared by the DISCOMs. The DPRs were to be submitted to Distribution Reform Committee (DRC) for its onwards submission to Steering Committee for approval through nodal agency (PFC). Deficiency in preparation and submission of DPRs are discussed in succeeding paragraphs. Delayed preparation of DPRs 2.1.30 The DISCOMs appointed consultants (March 2009 to November 2009) for preparation of DPRs. The DPRs were submitted by the DISCOMs to MoP in June 2010 for their approval. The guidelines provided that formalities for execution of Part-B Projects may be taken up along with Part-A. Audit noticed that DPRs of Part-B works for 29 towns out of 42 test checked towns were belatedly submitted in June 2010 whereas the DPRs of Part-A were submitted in June 2009. The DISCOMs, despite the provision in the guidelines, did not undertake the requisite formalities of Part-A and Part-B simultaneously causing avoidable delay of 11 months in preparation of DPRs of Part-B. UPPCL stated (October 2016) that delay in preparation of DPRs was due to integrated planning of the scheme as a whole by UPPCL which was necessary and inevitable. Reply was not acceptable as the Part-B works involve regular system strengthening works and the same could have been taken up simultaneously with Part-A activities of the scheme. Preparation of deficient DPRs led to revision and delay in implementation 2.1.31 The DISCOMs invited (August 2011) tenders for execution of Part-B works of 30 towns as per DPRs prepared by consultants. The Chairman and Managing Director (CMD) of UPPCL, while finalising the tenders, noticed (April 2012) that the consultants had included those works which might result in enhancement of capacity of the distribution system; but would not result in reduction of theft and technical losses. Therefore, these tenders were cancelled (April 2012) and tenders were re-invited (August 2012) based on the DPRs revised by the consultant. The revised DPRs were approved by MoP during February to July 2014. Meanwhile, in 16 towns, system strengthening works of ` 322.83 crore included in original DPRs were carried out by the DISCOMs during the intervening period of January 2011 to June 2014 from its own resources. These works were excluded in revised DPRs. This led to delay in implementation of the scheme for more than four years and expenditure of ` 161.42 crore (50 per cent of ` 322.83 crore) were not reimbursed under the Scheme.
Failure of the DISCOMs in undertaking the requisite formalities for execution of Part-A and Part-B of the scheme caused avoidable delay of 11 months in preparation of DPRs of Part-B
Chapter- II: Performance Audits relating to Government companies and Statutory corporations
35
UPPCL while accepting the facts stated (October 2016) that motive and prime reason of revising the DPRs were inclusion of works to achieve the very purpose of the scheme.
Short provision for conversion of High Tension lines 2.1.32 Central Electricity Authority (CEA) recommended ideal ratio of 1:1 for HT/LT lines for minimising the line losses. Audit noticed that conversion of LT lines to HT lines in the ratio of 0.25:1 to 0.96:1was proposed in the DPRs of 17 towns out of 42 towns. Thus, DISCOMs made short provision of HT lines in DPRs despite knowing the fact that more HT lines minimise the AT&C losses; therefore, DPRs submitted to MoP were deficient. UPPCL stated (October 2016) that the DISCOMs fixed and installed HT/LT lines as per actual requirement to the extent of its feasibility to cut down the AT&C losses in the areas concerned. Reply was not tenable as the fact remained that DPRs were not prepared as per the recommendation of the CEA as envisaged in the Scheme for reduction in AT&C losses. Avoidable expenditure due to preparation of DPRs without proper survey
2.1.33 The DPR of Lalitpur town was prepared for ` 18.01 crore under R-APDRP scheme with the objective of reducing AT&C losses by conversion of overhead electrical system to underground electrical system, reducing overloading of 11 KV feeders/LT lines etc. Meanwhile, the Board of Directors (BoD) of DVVNL approved (November 2015) the DPR for an amount of ` 46.14 crore of the town under GoUP scheme with similar scope of work (as included in R-APDRP) to reduce high AT&C losses. Thus, the DPR was not prepared after conducting proper survey to decide scope of work under the R-APDRP scheme, which resulted in incurring additional expenditure of ` 46.14 crore to achieve the objective of reduction in AT&C losses. UPPCL stated (October 2016) that the provision of expenditure was made in separate DPR for underground electrical system, which was 100 per cent funded by GoUP and the objective and scope of work in both DPR were different. Reply was not acceptable as similar works under R-APDRP scheme were also proposed with the same objective which was indicative of the fact that scope of work in the DPR of R-APDRP was included without proper survey and planning. Avoidable expenditure on preparation of DPRs 2.1.34 As per scheme guidelines, the appointment of the consultant in case of Part-B was optional and cost of hiring the consultant was not to be funded under the scheme. Further, PFC had prepared the format of DPR in which the data had to be filled up directly through web portal.
Audit noticed that three DISCOMs21 had hired consultants for preparation of DPRs at a cost of ` 17.39 crore. Audit further noticed that all DPRs of test checked towns were revised (July 2014) due to deficiencies observed by the DISCOMs itself. The Bill of Quantity (BOQ) incorporated in the revised DPRs was seen to be on an ad-hoc basis and without proper survey. Huge variations of (-) 100 per cent to 6400 per cent in proposed quantity of items was found when site survey was conducted by the SEs of DISCOMs. Thus, 21 MVVNL, PVVNL and DVVNL.
Audit Report on Public Sector Undertakings for the year ended 31 March 2016
36
the DPRs prepared by the consultants were not of much use and ultimately the work was executed on the basis of BOQ finalised by the engineers of the DISCOMs. Therefore, DISCOMs could have prepared the DPRs themselves and avoided making payment of ` 17.39 crore for hiring the services of consultants.
UPPCL stated (October 2016) that the appointment of consultants was necessary to get expert services for the work. Officers of the DISCOMs coordinated with the consultants to make the DPRs more realistic keeping in mind the needs of the existing system of distribution. Reply was not acceptable as the DPRs prepared by consultants were deficient and the works were ultimately carried out on the basis of survey conducted by concerned SEs.
Execution of works
2.1.35 The works related to strengthening of distribution network (projects) were awarded to different Turnkey Contractors (TKCs) selected through Circle wise open tenders at respective DISCOM Headquarters. SEs of respective Circle, being Chief Executive Officer (CEO), were responsible for making payments against works executed by TKCs and monitoring of execution of Part-B work under their respective jurisdiction. The Part-B of the scheme was implemented in 167 towns with the sanctioned cost of ` 6,915.57 crore out of which ` 3,556.24 crore was received and ` 3,239.12 crore was spent upto March 2016. The sanctioned cost of projects of 42 test checked towns22 was ` 5,042.96 crore out of which ` 1,857.64 crore was received and ` 1,760.19 crore was spent upto March 2016 with physical progress of 48.06 per cent. Out of 42 selected towns, only in one town i.e. Etawah the project was completed as of March 2015. Deficiencies noticed in execution of projects are discussed below:
Cost overrun due to time overrun 2.1.36 The works in respect of 42 towns were awarded (August 2012 to February 2015) to TKCs with a delay of 33 to 63 months23 from the date of sanction of projects (Annexure-2.1.8).
Audit noticed that the works of 33 towns out of 42 towns were awarded to TKC with a delay of 18 to 45 months24 from the date of sanction of DPRs whereas the total period being allowed for execution of projects was only 18 months (as per the executed agreement). This led to variation in scope of work and cost escalation of ` 737.88 crore (Annexure-2.1.9). UPPCL stated (October 2016) that the delay happened due to reasons beyond the control of DISCOMs and cost overrun was due to phased implementation. Reply was not acceptable as the reasons for delay were attributable to deficient preparation of DPRs leading to the revision subsequently and excessive time taken in finalisation of tenders by the DISCOMs.
22 Part-B of the Scheme was not implemented in one town i.e. Noida. 23 Calculated excluding six months from the date of sanction of projects. 24 Calculated excluding three months from the date of sanction of DPRs.
The works of 33 towns out of 42 towns were awarded to TKC with a delay of 18 to 45 months from the date of sanction of DPRs. This led to variation in scope of work and cost escalation of ̀ 737.88 crore

Chapter- II: Performance Audits relating to Government companies and Statutory corporations
37
Loss due to delay in finalisation of tender 2.1.37 MVVNL invited tender in May 2013 for the work in Lucknow town (DPR approved in October 2011) without considering the works already executed during the intervening period. The financial bid was opened in August 2013 having validity of rates up to February 2014. However, the Management decided (March 2014) to reduce the quantity of work already executed valuing ` 309.29 crore and offered (April 2014) TKCs the execution of remaining works at negotiated L-1 rate of ` 590.66 crore25. The firm declined to execute the work at the rates of August 2013 as it was becoming unviable to execute the Project at the quoted rate. As a result, MVVNL had to re-tender the work in June 2014 and the work was awarded (October 2014) at ` 724.99 crore to the same firm but at a higher rates. Thus, due to delay in finalisation of the tender, the MVVNL had to get the work executed at higher rates which resulted in extra financial burden of ` 134.33 crore (` 724.99 crore - ` 590.66 crore) on the scheme.
UPPCL stated (October 2016) that the negotiated L-1 rates of ` 899.95 crore in tender were higher by 52.36 per cent with respect to sanctioned DPR cost i.e. ` 590.66 crore, hence, the rates were not approved. Reply was not acceptable as MVVNL did not offer the work within the validity period of rates quoted by TKC and awarded the work to the same firm at a rate higher by 22.74 per cent with respect to sanctioned cost. Loss due to failure in obtaining valid Bank Guarantee (BG) 2.1.38 As per terms and conditions of the agreement, bank guarantee (BG) of scheduled bank was to be obtained by the PuVVNL against mobilisation advance and performance guarantee. Further, Central Vigilance Commission’s (CVC) guidelines (December 2007) provides that verification of BG should be done before acceptance.
Audit noticed that the nodal officer (Superintending Engineer) of PuVVNL, at the time of agreement (February 2013) accepted BGs of ` 14.32 crore of a non-banking financial company26 (NBFC) from the TKC27 against the performance guarantee and mobilisation advance, without getting it verified from the bank. The TKC was not executing the work satisfactorily; therefore, the PuVVNL invoked (May 2015) the BGs but could not encash as these were fake. The agreement was terminated (July 2015) on account of fake BG. Thus, in absence of required BGs, the amount of ` 14.32 crore could not be recovered. UPPCL stated (October 2016) that all the corrective and remedial measures/steps were taken to recover the financial loss of PuVVNL. Reply was not satisfactory as any specific action taken against TKC had not been intimated to audit. The fact remained that acceptance of BGs of NBFC without verification thereof at the time of acceptance led to loss to PuVVNL for which no action was taken against the defaulter officer of PuVVNL. Further, the same firm had also defaulted in MVVNL. However, no record of BG/PBG obtained from the contractors in respect of any of the towns under the jurisdiction of MVVNL was provided to audit.
25 Negotiated L-1 rate: ` 590.66 crore (` 899.95 crore - ` 309.29 crore) 26 Chartered Mercantile M.B. Limited 27 Biecco Lawrie Limited.
MVVNL failed to offer the work to TKC within the validity period of rates which resulted in extra financial burden of ` 134.33 crore on the scheme
Acceptance of BGs of NBFC without verification led to loss of ̀ 14.32 crore to PuVVNL
Audit Report on Public Sector Undertakings for the year ended 31 March 2016
38
Undue benefit to contractor by allowing a higher rate 2.1.39 As per Scheme guidelines, in Part-B works, 10 per cent variation in sanctioned cost and 20 per cent variation in quantity of works was allowed. Audit noticed (September 2015) that the nodal officer (Superintending Engineer) of DVVNL allowed higher rate than the awarded rate in respect of 14 items of works in executed estimate submitted by TKC of Etawah town (completed in March 2015). The excess payment was compensated by reducing the quantity of six items to keep the total executed cost within the sanctioned DPR cost. Thus, undue benefit of ` 4.53 crore was extended to the TKC. UPPCL stated (October 2016) that the mentioned rates were activity-wise and not item-wise. The items for execution of any activity normally varied during execution due to site requirement. Reply was not acceptable as the cost of activity to be executed under the agreement was based on the item-wise rate given therein. Therefore, payment to the contractors should have been made as per the agreement. Infructuous expenditure on construction of lines
2.1.40 The DPR of Kannauj town included construction of overhead lines at a cost of ` 7.94 crore under Part-B of R-APDRP. The TKC carried out 47 per cent of construction of overhead lines and incurred an expenditure of ` 3.10 crore (upto March 2015). But, the work was closed in April 2015 as GoUP, without assigning any reason, decided (April 2015) for conversion of overhead electrical system into underground system under Twarit Arthik Vikas Yojna of GoUP instead of under R-APDRP. However, BoD of DVVNL, prepared the DPR for the scheme in April 2015 citing political sensitivity of the town as reason for the change. Thus, the improper planning while constructing overhead lines for Kannuaj Town resulted in infructuous expenditure of ` 3.10 crore incurred on construction of overhead lines.
UPPCL stated (October 2016) that expenditure incurred under R-APDRP scheme and subsequently under another scheme of undergrounding of electrical system with 100 per cent equity from the GoUP was fruitful with different objectives. Reply was not tenable as the expenditure on construction of overhead lines could have been avoided, had DVVNL and GoUP planned the laying of underground system/cable at the initial stage itself. Further, the nature of political sensitivity because of which the overhead lines were replaced by underground lines was not clear. Delay in providing infrastructure to the contractor
2.1.41 As per guidelines, the DISCOMs had to ensure timely availability of any other infrastructure or facilities not in the scope of work of the Contractor viz. land, pole location etc. Audit noticed that in six towns28 (works awarded during September 2012 to January 2015), the DISCOMs failed to provide land to TKCs for 20 sub-stations even after lapse of 14 to 37 months from date of award of works so far (March 2016). This resulted in inordinate delay in completion of the Part-B works. This was further substantiated by the findings of joint physical inspection of five towns as detailed in paragraph 2.1.43. 28 Lucknow, Firozabad, Jhansi, Jaunpur, Varanasi and Allahabad.
DVVNL extended undue benefit of ` 4.53 crore in Etawah town to the TKC by allowing higher rate than the awarded rate in respect of 14 items of work in executed estimate
Expenditure of ` 3.10 crore incurred in Kannauj town on construction of overhead lines, which was closed in March 2015 due to conversion into underground electrical system, became infructuous
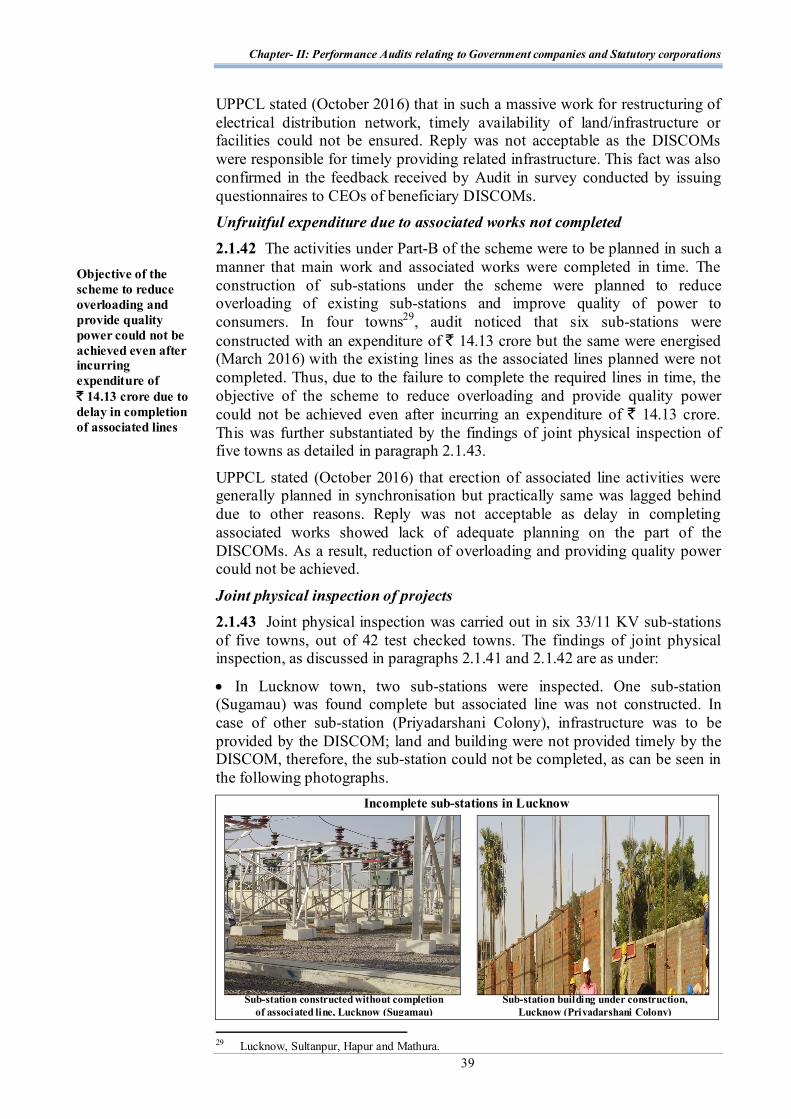
Chapter- II: Performance Audits relating to Government companies and Statutory corporations
39
UPPCL stated (October 2016) that in such a massive work for restructuring of electrical distribution network, timely availability of land/infrastructure or facilities could not be ensured. Reply was not acceptable as the DISCOMs were responsible for timely providing related infrastructure. This fact was also confirmed in the feedback received by Audit in survey conducted by issuing questionnaires to CEOs of beneficiary DISCOMs. Unfruitful expenditure due to associated works not completed 2.1.42 The activities under Part-B of the scheme were to be planned in such a manner that main work and associated works were completed in time. The construction of sub-stations under the scheme were planned to reduce overloading of existing sub-stations and improve quality of power to consumers. In four towns29, audit noticed that six sub-stations were constructed with an expenditure of ` 14.13 crore but the same were energised (March 2016) with the existing lines as the associated lines planned were not completed. Thus, due to the failure to complete the required lines in time, the objective of the scheme to reduce overloading and provide quality power could not be achieved even after incurring an expenditure of ` 14.13 crore. This was further substantiated by the findings of joint physical inspection of five towns as detailed in paragraph 2.1.43.
UPPCL stated (October 2016) that erection of associated line activities were generally planned in synchronisation but practically same was lagged behind due to other reasons. Reply was not acceptable as delay in completing associated works showed lack of adequate planning on the part of the DISCOMs. As a result, reduction of overloading and providing quality power could not be achieved.
Joint physical inspection of projects 2.1.43 Joint physical inspection was carried out in six 33/11 KV sub-stations of five towns, out of 42 test checked towns. The findings of joint physical inspection, as discussed in paragraphs 2.1.41 and 2.1.42 are as under:
In Lucknow town, two sub-stations were inspected. One sub-station (Sugamau) was found complete but associated line was not constructed. In case of other sub-station (Priyadarshani Colony), infrastructure was to be provided by the DISCOM; land and building were not provided timely by the DISCOM, therefore, the sub-station could not be completed, as can be seen in the following photographs.
Incomplete sub-stations in Lucknow
29 Lucknow, Sultanpur, Hapur and Mathura.
Objective of the scheme to reduce overloading and provide quality power could not be achieved even after incurring expenditure of ` 14.13 crore due to delay in completion of associated lines
Sub-station constructed without completion of associated line, Lucknow (Sugamau)
Sub-station building under construction, Lucknow (Priyadarshani Colony)
Audit Report on Public Sector Undertakings for the year ended 31 March 2016
40
UPPCL stated (October 2016) that the 33/11 KV Sugamau sub-station is on load since November 2015 from one source of 33 KV line and the work for the alternate source of 33 KV line got delayed as clearance of Right of Way was not made available by the forest department. Further, the work of 33/11 KV Priyadarshini sub-station was delayed due to delay in availability of land from the district administration. The fact remained that the associated line was not constructed as well as land and building were not timely provided by the DISCOM. Unbalanced current and overloaded DTs
2.1.44 As per sanctioned DPRs of 42 towns, the provision for installation of 7,496 DTs was made to reduce overloading and regulate unbalanced current on the existing DTs. Against which, 4,493 DTs were installed under the scheme as of March 2016. Audit noticed that in test checked towns, out of 31,875 DTs updated in MDAS, 8,164 DTs (25 per cent) were found with unbalanced current and 1,001 DTs (3.14 per cent) were overloaded as of March 2016. Thus, the purpose of reducing over loading and balancing of current was defeated despite installation of additional DTs under the scheme. UPPCL stated (October 2016) that unbalancing and overloading was mainly due to theft and katia connections. DISCOMs were trying to handle the problem with more vigilance, raids and theft proof techniques like ABC and underground cabling. The fact remained that DISCOMs failed to reduce overloading and regulate the current despite installation of additional DTs. Change in location and capacity of sub-station without any approval 2.1.45 The construction and augmentation of 18 sub-stations in 10 towns were undertaken by the DISCOMs in the locations which were not provided for in the approved DPRs. Since the DPRs were approved for sub-stations at specific locations, therefore, in case of change in locations and capacity of the sub-station, the DISCOMs should have taken prior approval of MoP so as to qualify its expenditure for re-imbursement under the scheme. The expenditure of ` 27.89 crore incurred on sub-stations at unapproved places, was liable to be rejected and may have to be borne by the DISCOMs from its own resources. UPPCL stated (October 2016) that the electrical distribution was load dependent and not the place and name dependent; therefore, wide locational and quantitative changes in the work from the proposed DPR during execution were inevitable. Reply was not acceptable as all works approved in DPRs were location specific which should have been adhered to by the DISCOMs. Short closure of project
2.1.46 The work of Part-B in Kannauj town was awarded (September 2012) to TKC for ` 15.04 crore. Meanwhile (March 2015), BoD of DVVNL approved the proposal of conversion of existing Overhead Electrical System (HT/LT Lines) into Underground Electrical System of town under GoUP scheme and the same was approved by GoUP (April 2015). Audit noticed that DVVNL had short closed the work under R-APDRP scheme in May 2015 without written consent of nodal agency. Thus, in view of the provisions of the guidelines DVVNL would have to return ` 9.83 crore (including interest of ` 2.23 crore) to nodal agency.
Chapter- II: Performance Audits relating to Government companies and Statutory corporations
41
UPPCL stated (October 2016) that DVVNL had not short closed the work under R-APDRP scheme, but revised the scope of pending work to avoid further investment on erection of those infrastructures which would become redundant due to proposed undergrounding cabling work. Reply was not acceptable as approved works under the scheme were left incomplete without consent of nodal agency. Failure to install meters in premises of the consumer 2.1.47 To ensure achievement of the objective of the scheme and increase the billing efficiency, 100 per cent metering of the consumers and replacement of electro mechanical meters was to be carried out as per approved DPRs. Audit noticed that the tenders for the 42 test checked towns were awarded during August 2012 to October 2014 with scheduled completion period of 18 months. Against 2,01,846 consumer meters proposed to be installed under the scheme, 68,371 meters (33.87 per cent) could only be installed upto 31 March 2016. Thus, in the absence of 100 per cent metering, the basic objective of the scheme for accurate and reliable energy accounting on sustainable basis was defeated.
UPPCL stated (October 2016) that the work was under progress and expected to be completed by the end of the December 2016. The reply was not acceptable as the DISCOMs failed to get meters installed even after lapse of the scheduled completion period and did not intimate any firm plan to complete 100 per cent metering in the extended period (May 2017). Failure in installation of Capacitor Banks 2.1.48 Installation of Capacitor banks (CBs) improves power factor by regulating the current flow and voltage and save loss of energy. Erstwhile Uttar Pradesh State Electricity Board assessed (July 1993) that installation of one CB of 2.4 Mega Volt Ampere Reactive (MVAR) capacity saves energy of 0.118 MU per annum. Audit noticed that CBs of 1701.19 MVAR capacity was to be installed in 42 towns but CBs of 438.74 MVAR (17 per cent) could be installed in only 15 towns up to March 2016. Thus, the delay in installation of CBs in all towns resulted in dissipation of energy of 73.65 MU valued at ` 287.88 crore every year. UPPCL stated (October 2016) that the installation works were in progress and delay was attributable to some technical issues like space constraints in many sub-stations. Reply was not acceptable as the constraints referred to in reply were to be removed by the DISCOMs.
Undue benefit due to irregular release of mobilisation advances 2.1.49 Para 17 (i) of the CVC guidelines provided that mobilisation advance should be allowed in cases of selected works only and advance should be interest bearing so that the contractor cannot draw undue benefit. BoD of UPPCL in August 2013 also ordered that mobilisation advance should be interest bearing. Audit noticed that the Managing Director and Director (Finance) of the DISCOMs allowed interest free mobilisation advances of ` 74.30 crore to TKCs for the works related to 21 towns during October 2012 to June 2015. This act was not only in violation of the CVC guidelines and order of the BoD
Failure of DISCOMs to adhere to CVC guidelines pertaining to mobilisation advance resulted in loss of interest of ` 12.75 crore

Audit Report on Public Sector Undertakings for the year ended 31 March 2016
42
of UPPCL but also against the financial interest of the DISCOMs as the mobilisation advances were given out of the interest bearing loan (11.5 per cent) obtained under the scheme. This resulted in loss of interest of ` 12.75 crore.
UPPCL stated (October 2016) that mobilisation advances were given to the executing agencies as per the terms and conditions of the tender, which was also recovered as per agreement. Reply was not acceptable as providing interest free mobilisation advances was in contravention of CVC guideline and orders of BoD of UPPCL. Failure in deduction of Labour Cess 2.1.50 As per the provisions of ‘The Building and other Construction Workers’ Welfare Cess Act, 1996” (Act), read with the order of GoUP issued in February 2010, labour cess at the rate of one per cent of project cost was to be recovered from the bills of the contractors.
Audit noticed that DISCOMs entered into agreements for ` 5,228.37 crore with TKCs under Part-B for 42 towns and made payment of ` 1,693.07 crore to the contractors up to March 2016. The DISCOMs did not deduct labour cess of ` 16.33 crore against the due amount of ` 16.93 crore which was to be remitted to Cess authorities. This would also attract penal interest, at the rate of two per cent per month as per Section 8 of the Act ibid, for the period of delay in remitting the Cess to Cess authorities. Also, the contractors were unduly benefitted by not deducting the labour cess from their bills. UPPCL stated (October 2016) that all CEOs had been instructed to comply with the provision of the Act. The fact remained that the labour cess were not deducted from the bill of contractors.
Undue benefit to PMC in contravention to CVC guidelines 2.1.51 Central Vigilance Commission (CVC) guidelines stipulate that selection of consultants should be made in a transparent manner through competitive bidding. It, further, stipulates that the payment of consultant should be based on original contract value and should be correlated with the progress of work.
Audit noticed that in contravention to the CVC guidelines, UPPCL appointed (May/June 2011) WAPCOS Limited as PMC for 161 towns (at the rate of two per cent and 1.67 per cent of DPR cost in respect of 155 towns and six towns respectively) on single quotation basis under Part-B of the scheme. Audit further noticed that PuVVNL invited (November 2013) open tender for PMC work of three other towns and awarded the work to Feedback Infra at 0.43 per cent of DPR cost. In this open tender, WAPCOS Limited also participated and it was found to be technically disqualified/ineligible. It could thus, be seen that UPPCL awarded PMC work of 161 towns at higher rate of 1.24 per cent to 1.57 per cent to a technically ineligible firm mainly because of the award of work on single quotation basis. This led to avoidable expenditure of ` 46.76 crore.
Audit noticed that the agreement entered into with the PMC (WAPCOS) provided payment through fixed monthly installments which was not correlated with the progress of work in violation of the CVC guidelines. Further, despite not completing the work within scheduled period the consultancy agreement was extended for a period of 15 months at additional
Failure in deducting labour cess from the bills of contractors, which was to be remitted to Cess authorities, unduly benefitted the contractors to the extent of ̀ 16.33 crore

Chapter- II: Performance Audits relating to Government companies and Statutory corporations
43
payment at the rate of 0.5 per cent of total DPR cost in the form of monthly installments. Thus, extension of validity of agreement with an additional payment without correlating with the progress of work resulted in undue benefit to the PMC of ` 6.17 crore.
Audit noticed that three DISCOMs made payment of consultancy fee to PMC (WAPCOS) on the basis of original DPR cost, but DVVNL, in contravention to the CVC guidelines, made payment to PMC based on the revised DPR cost, which was higher. This resulted in excess payment of ̀ 0.92 crore to PMC. UPPCL stated (October 2016) that qualitative evaluation of consultant was extremely difficult and WAPCOS being a Government undertaking was found appropriate by the management and given preference in the scheme. Further, extension was given for whole of the agreement. Reply was not acceptable as open tendering process provides an opportunity to award the work to a qualified firm at the competitive rates and in no way restricts participation by a Government Company. Moreover, fixed monthly payment should have been correlated with the progress of the work. Diversion of fund 2.1.52 Clause 12 (g) of the quadripartite agreement provided that funds released to the DISCOMs should not be diverted for any other scheme or purpose.
Audit noticed that a fund of ` 274.76 crore was released (March 2011) by PFC to DISCOMs under the scheme. This fund was diverted instantly and utilised by UPPCL for purchase of power, in contravention to the guidelines of the scheme. Out of ` 274.76 crore utilised by UPPCL, the DISCOMs could not receive back ` 33.79 crore from UPPCL even after five years.
Further, the DISCOMs also did not claim the interest of ` 131.09 crore payable on above loan fund utilised by the UPPCL.
As per Scheme Guidelines, increased quantity/new items of works owing to increase in consumer base during the currency of the contract were to be borne by DISCOMs. Audit noticed that in case of two towns30, PVVNL carried out system strengthening and improvement works of ` 41.92 crore from R-APDRP fund in contravention of the provisions of this scheme guidelines. UPPCL while accepting the fact stated (October 2016) that as funds were idle with DISCOMs it was utilised by them. As and when there was requirement, the fund was transferred to DISCOMs. However, the fact remained that against the requirement of the scheme, funds were diverted for the purposes other than for which it was released.
Interest earned and penalty recovered not credited into the scheme fund 2.1.53 The interest earned on the funds received under the scheme should have been credited to the scheme fund or should have been adjusted in future releases. Interest of ` 31.31 crore earned (up to March 2016) on unutilised R-APDRP funds under Part-A and B and a penalty of ` 0.96 crore imposed (up to March 2016) by MVVNL on ITIA was not adjusted from the reimbursement claims demanded from PFC.
30 Saharanpur and Moradabad.
Contrary to the provisions of the CVC guidelines agreement with the PMC was extended without correlating the additional payment with the progress of work resulting in undue benefit to the PMC to the extent of ` 6.17 crore
Audit Report on Public Sector Undertakings for the year ended 31 March 2016
44
UPPCL stated (October 2016) that all the interest earned was credited in designated bank accounts. All necessary and due adjustments will be ensured on demand of PFC. Reply was not acceptable as the same should have been adjusted by DISCOMs while claiming reimbursement claims from GOI.
Monitoring and Quality Control
2.1.54 As per guideline of the scheme, the implementation of the scheme in the State was to be monitored by Distribution Reforms Committee (DRC) formed to forward scheme related proposals to Steering Committee and to monitor the achievement of milestones and targets. At circle level of the DISCOMs, SEs were responsible to monitor implementation of the scheme. The deficiencies noticed in monitoring of the scheme are discussed below: Lack of monitoring 2.1.55 DRC comprising of nine members of UPPCL/DISCOMs under the Chairmanship of Principal Secretary, Department of Energy, GoUP was constituted in May 2009. DRC was required to hold meeting in last week of every second month. The constitution of DRC showed that it was done in such a manner that implementation of scheme could be monitored at UPPCL level on a regular basis and remedial action to any deficiency could be taken promptly. Audit noticed that total 14 meetings were held by DRC against required 41 meetings during May 2009 to March 2016 and these meetings were held to discuss only the forwarding of the proposals to Steering Committee. This showed that DRC did not pay adequate attention to monitor the achievement of milestones and targets under the scheme. In absence of proper monitoring, the scheme works could not be completed even after the lapse of more than seven years since its initiation in the State.
Further, audit noticed that minutes of the meetings held by SE/CEO at circle level (in DISCOMs) with representative of TKCs and Consultants on monthly basis were not maintained, due to which remedial action, if any suggested by CEO in the monitoring meetings and action taken there against could not be examined in audit. UPPCL stated (October 2016) that DRC committee meetings were convened at UPPCL level for all the DISCOMs to monitor the progress. Further, meetings were regularly held at SE/CEO as well as DISCOMs level and minutes of meeting had also been issued by the concerned authorities. Reply was not acceptable as requisite numbers of meetings were not held and meetings were held to discuss only the proposals being forwarded to Steering Committee. No document in support of minutes of the meetings held at SE level was made available to audit. Lack of quality control 2.1.56 As per Clause 9.1 of the agreement, material purchased by the contractor was to be routed through nearest Store Centre of concerned Store Division of DISCOMs for the purpose of accountal and the material was to be delivered directly at store of TKC. The DISCOMs did not make any provision in the agreement for quality check at the time of receipt of material, procured by TKC. In absence of any mechanism for quality check, chances of utilisation of sub-standard material by TKC could not be ruled out.
Chapter- II: Performance Audits relating to Government companies and Statutory corporations
45
UPPCL stated (October 2016) that there was no compromise with the quality of work/materials used in the project and desired quality was being assured at all events. Reply was not acceptable as mechanism for quality check at the time of receipt of material was not evolved by the DISCOMs.
Conclusions
Audit concluded that:
under Part-A of the Scheme, DISCOMs failed to establish IT enabled system even after a period of more than seven years since initiation of the Scheme in the State. The benefit of the Scheme could not be derived even after incurring an expenditure of ` 508.01 crore on Part-A works, due to appointment of technically weak ITIA and lack of proper planning and coordination with ITIA;
SCADA work could not progress even after a lapse of more than four years due to failure in specifying scope of work to the executing agency. In addition, the scope of work was reduced without consent of the nodal agency (PFC). Thus, DISCOMs failed to improve system reliability through remote operation even after lapse of more than seven years;
for Part-B of the Scheme, DISCOMs failed to prepare the DPRs as per guidelines of the scheme and also could not ensure timely execution of work. In preparation of DPRs, guidelines of the scheme, instruction of CVC and cannons of financial proprietary were not adhered to. As a result, work of Part-B of the scheme could achieve physical progress of 56.65 per cent only after lapse of more than six years since January 2010; and
DRC/DISCOMs failed to monitor the achievement of milestones and targets under the scheme. Further, progress of the scheme could not be monitored as recording the minutes of meetings held at CEO level were not available. Thus, loan of ` 4,110.70 crore received under Part-A and SCADA and Part-B of the scheme would not be admissible for conversion into grant of ` 2,332.58 crore31 and implementation of the scheme did not appear possible even in the extended period up to March 2017.
Recommendations
Audit recommends that:
in respect of Part-A of the Scheme DISCOMs should ensure preparation of DPRs and execution of work as per guidelines of the Scheme and appoint technically qualified ITIA to ensure timely establishment of IT enabled system and achieve objective of the Scheme through better planning, follow-up with the consultants and ITIA;
DISCOMs need to implement SCADA strictly as per guidelines of the Scheme and without curtailing scope of work to derive benefit of the Scheme; 31 Grant of ` 554.46 crore (being 100 per cent of loan amount in case of Part-A and SCADA i.e. ` 474.50 crore and ` 79.96 crore respectively) and grant of ` 1,778.12 crore (being 50 per cent of loan of ` 3,556.24, received in case of Part-B).
Audit Report on Public Sector Undertakings for the year ended 31 March 2016
46
DISCOMs need to comply with the timelines and provisions of the guidelines for framing of DPRs and appointment of consultants under Part B of the Scheme. DISCOMs also need to comply with provisions of scheme and CVC guidelines; and
DRC needs to convene regular meetings to monitor the milestone and targets under the Scheme. DISCOMs also need to record minutes of the meetings held for monitoring to ensure that remedial action on shortcomings noticed/pointed out are followed up.
Chapter- II: Performance Audits relating to Government companies and Statutory corporations
47
2.2 Performance Audit on Working of Electrical Wing of the Uttar Pradesh Rajkiya Nirman Nigam Limited
Executive summary
Uttar Pradesh Rajkiya Nirman Nigam Limited (Company) executes civil and electrical works. There were 26 Electrical Units (Units) which executed 957 electrical works of ` 4,006.83 crore. The eight Units test checked in audit executed 481 works valuing ` 2,303.95 crore out of which 273 works were completed at the cost of ` 804.56 crore and 208 works were under progress on which expenditure of ` 1,499.39 crore was incurred during 2011-12 to 2015-16.
The important audit findings are discussed below:
The Company executed 88 works of sub-station/cable laying awarded by Uttar Pradesh Power Transmission Company Limited (UPPTCL)/Power Distribution Companies (DISCOMs). Out of this 42 works were completed and 46 works were in progress at the end of March 2016 with delays of one month to four years and four months. As a result of delay in completion of the works, expenditure of ` 1,155.12 crore incurred on 88 works remained blocked for the delayed period. The slow pace of execution by the sub-contractors mainly was due to inadequate deployment of manpower by the sub-contractors at site, despite timely release of funds by the clients. These facts were confirmed by the clients during beneficiary survey done by Audit.
In case of 83 works valuing ` 867.30 crore related to electrical works of other deposit works, completion period was not specified and time of two years to 13 years was taken in execution of the works.
(Paragraphs 2.2.9, 2.2.19, 2.2.28, 2.2.36 and 2.2.37)
Due to failure in ensuring the reasonability of rates, the Company incurred avoidable expenditure of ` 78.55 crore on award of sub-contracts at higher rates and extra expenditure of ` 3.71 crore on purchase of material at higher rates during 2011-12 to 2015-16 which caused financial burden on its clients i.e. DISCOMs, UPPTCL and Government Departments.
(Paragraphs 2.2.20, 2.2.38 and 2.2.39) Central Vigilance Commission (CVC) guidelines (October 1997, April 2007 and February 2011) provide that provision of allowing mobilisation advance should be clearly stipulated in the tender document. In case where it is to be provided, it should be interest bearing. Failure of General Manager, Financial Adviser and Controller of Accounts of the Company to oversee the compliance of CVC guidelines and lack of their checks as prescribed in the Manual of the Company resulted in irregular grant of interest free mobilisation advance of ` 142.03 crore to the sub-contractors by the Project Incharge of the eight units causing loss of interest of ` 21.90 crore.
(Paragraph 2.2.21) The Units, in violation of provisions of Manual and GFR awarded two works of sub-station to the sub-contractors without inviting tenders and awarded 81 other works without adhering to proper tender procedures. Further, the Units purchased items of ` 19.67 crore through supply orders and executed 68 works through work orders of ` 173.25 crore during 2011-12 to 2015-16 without inviting open tenders.
Audit Report on Public Sector Undertakings for the year ended 31 March 2016
48
(Paragraphs 2.2.27 and 2.2.42) Joint physical verification revealed that three Units failed to assess correct quantity of the materials as per actual requirement. As a result, control cables, power cables and conductors valuing ` 55.22 lakh were purchased in excess of six to 88 per cent of the actual requirement in construction of five sub-stations.
(Paragraph 2.2.32) The Company did not implement decision of High Level Technical Committee to make provision for cost increase in the estimates for the project period which resulted in cost overrun of ` 216.16 crore in case of 54 works.
(Paragraph 2.2.37)
The Company failed to set and monitor the targets in physical terms. Further, it fixed the financial targets without obtaining inputs from the field units as six to 13 zones out of 15 to 18 zones did not furnish the requisite information during 2011-12 to 2015-16.
(Paragraph 2.2.9) The Company executed 33.17 to 56.51 per cent works through sub-contractors against the prescribed ceiling of 10 to 30 per cent without approval of Managing Director/Board of Directors.
(Paragraph 2. 2.12)
The works were started without obtaining technical sanction. While technical sanctions of 106 works were obtained with a delay of one month to 15 years after the start of the work, it was not obtained so far (March 2016) in respect of other 241works after a lapse of 6 months to 18 years.
(Paragraph 2.2.13)
Eight units incurred an expenditure of ` 59.33 crore in excess of the funds received on 116 works in violation of the provisions of Manual.
(Paragraph 2.2.16) Eight Units failed to close the clients’ accounts after handing over of the work to the client due to which unspent balance of ` 10.77 crore was not refunded to respective clients.
(Paragraph 2.2.49)
Introduction
2.2.1 Uttar Pradesh Rajkiya Nirman Nigam Limited (Company) was incorporated in May 1975 as a wholly owned State Government company with an objective to undertake civil engineering works including electrical installations. Government of Uttar Pradesh (GoUP) and Government departments/ undertakings assign building construction works to the Company as deposit work on cost plus centage basis. The Company earns 12.5 per cent centage on the direct cost of works. It also secures tender works by participating in open tenders invited by the prospective clients. The Company executes the works
Chapter- II: Performance Audits relating to Government companies and Statutory corporations
49
mainly on DCU pattern1, besides, it also executes the works by subletting to sub-contractors.
The Company executed civil and electrical works of ` 18,816.43 crore during 2011-12 to 2015-16. There were 26 Electrical Units (Units) which executed 957 electrical works of ` 4,006.83 crore and it comprised 21.29 per cent of the total value of work done. Of these, 948 works of ` 3,989.64 crore (99.57 per cent) were obtained as deposit works and nine works of ` 17.19 crore (0.43 per cent) were obtained through participation in open tenders. Out of 957 electrical works, the Company executed 934 works of ` 3,272.43 crore (81.67 per cent) on DCU pattern and 23 works of ` 734.40 crore (18.33 per cent) by subletting to sub-contractors. The present Performance Audit has been taken up to evaluate the performance of Electrical Wing of the Company.
Organisational set up
2.2.2 The Management of the Company is vested in a Board of Directors (BoD) comprising a Chairman and seven directors including Managing Director (MD) appointed by the GoUP. The Managing Director is the Chief Executive, who looks after day-to-day affairs of the Company with the assistance of a Chief Architect, a Financial Advisor, eight2 Additional General Managers (AGM) at the Head Office and 12 Zonal AGMs in the field. Execution of electrical works is carried out by 26 Units (as given in Chart 2.2.1), each headed by a Project Manager under the supervisory control of four Zonal AGMs (Electrical).
Chart 2.2.1 Map showing location of 26 Electrical Units
1 Under Departmental Construction Unit (DCU) pattern, the Company procures material
and engages labour (Piece Rated Workers) at the rates recommended by the Purchase Committees.
2 AGM (Personnel), AGM (Commercial), AGM (Technical, Consultancy and Mechanical), AGM (Design), AGM (Contract), AGM (Complaint), AGM (Legal) and AGM (Claim).
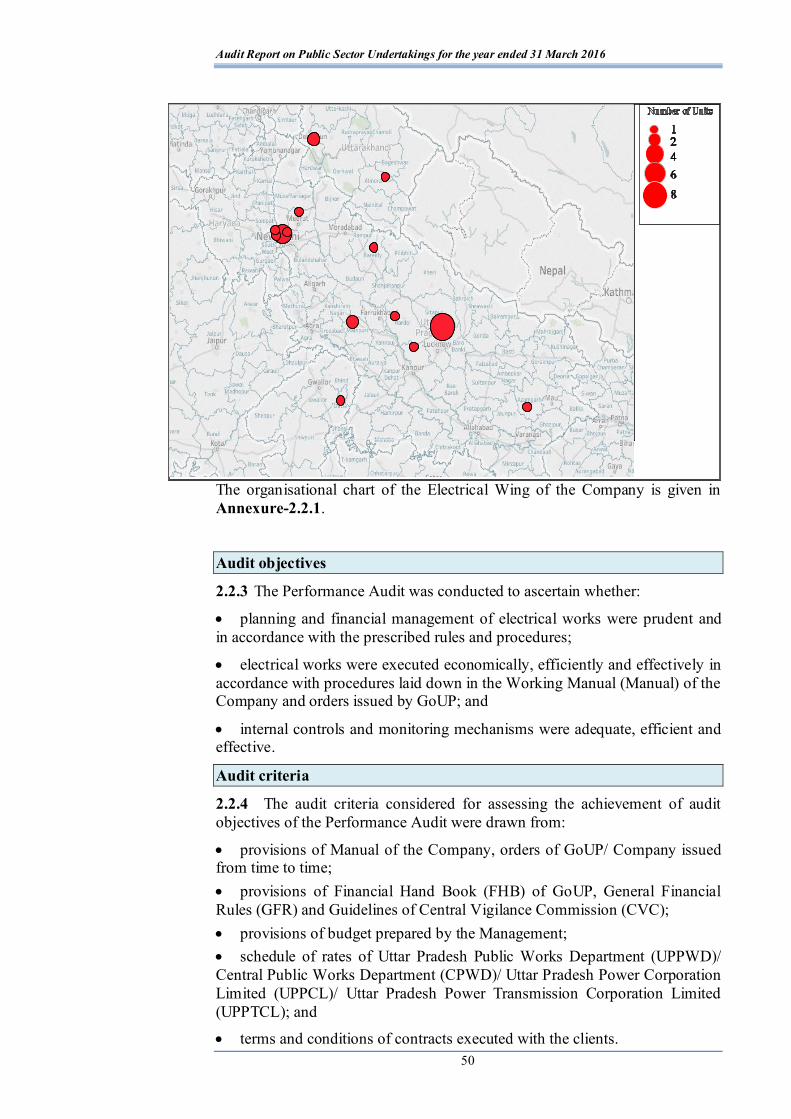
Audit Report on Public Sector Undertakings for the year ended 31 March 2016
50
The organisational chart of the Electrical Wing of the Company is given in Annexure-2.2.1.
Audit objectives
2.2.3 The Performance Audit was conducted to ascertain whether:
planning and financial management of electrical works were prudent and in accordance with the prescribed rules and procedures;
electrical works were executed economically, efficiently and effectively in accordance with procedures laid down in the Working Manual (Manual) of the Company and orders issued by GoUP; and
internal controls and monitoring mechanisms were adequate, efficient and effective.
Audit criteria
2.2.4 The audit criteria considered for assessing the achievement of audit objectives of the Performance Audit were drawn from:
provisions of Manual of the Company, orders of GoUP/ Company issued from time to time; provisions of Financial Hand Book (FHB) of GoUP, General Financial Rules (GFR) and Guidelines of Central Vigilance Commission (CVC); provisions of budget prepared by the Management; schedule of rates of Uttar Pradesh Public Works Department (UPPWD)/ Central Public Works Department (CPWD)/ Uttar Pradesh Power Corporation Limited (UPPCL)/ Uttar Pradesh Power Transmission Corporation Limited (UPPTCL); and
terms and conditions of contracts executed with the clients.
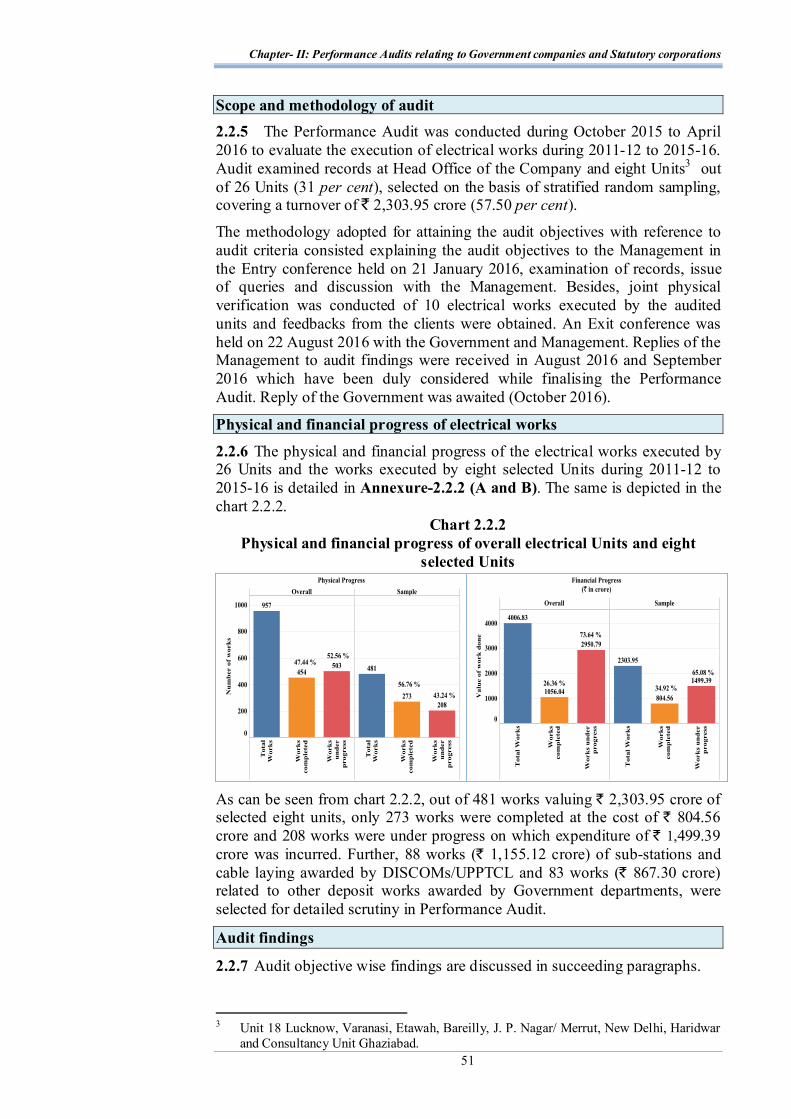
Chapter- II: Performance Audits relating to Government companies and Statutory corporations
51
Scope and methodology of audit 2.2.5 The Performance Audit was conducted during October 2015 to April 2016 to evaluate the execution of electrical works during 2011-12 to 2015-16. Audit examined records at Head Office of the Company and eight Units3 out of 26 Units (31 per cent), selected on the basis of stratified random sampling, covering a turnover of ` 2,303.95 crore (57.50 per cent).
The methodology adopted for attaining the audit objectives with reference to audit criteria consisted explaining the audit objectives to the Management in the Entry conference held on 21 January 2016, examination of records, issue of queries and discussion with the Management. Besides, joint physical verification was conducted of 10 electrical works executed by the audited units and feedbacks from the clients were obtained. An Exit conference was held on 22 August 2016 with the Government and Management. Replies of the Management to audit findings were received in August 2016 and September 2016 which have been duly considered while finalising the Performance Audit. Reply of the Government was awaited (October 2016).
Physical and financial progress of electrical works
2.2.6 The physical and financial progress of the electrical works executed by 26 Units and the works executed by eight selected Units during 2011-12 to 2015-16 is detailed in Annexure-2.2.2 (A and B). The same is depicted in the chart 2.2.2.
Chart 2.2.2 Physical and financial progress of overall electrical Units and eight
selected Units
As can be seen from chart 2.2.2, out of 481 works valuing ` 2,303.95 crore of selected eight units, only 273 works were completed at the cost of ` 804.56 crore and 208 works were under progress on which expenditure of ` 1,499.39 crore was incurred. Further, 88 works (` 1,155.12 crore) of sub-stations and cable laying awarded by DISCOMs/UPPTCL and 83 works (` 867.30 crore) related to other deposit works awarded by Government departments, were selected for detailed scrutiny in Performance Audit.
Audit findings
2.2.7 Audit objective wise findings are discussed in succeeding paragraphs.
3 Unit 18 Lucknow, Varanasi, Etawah, Bareilly, J. P. Nagar/ Merrut, New Delhi, Haridwar
and Consultancy Unit Ghaziabad.
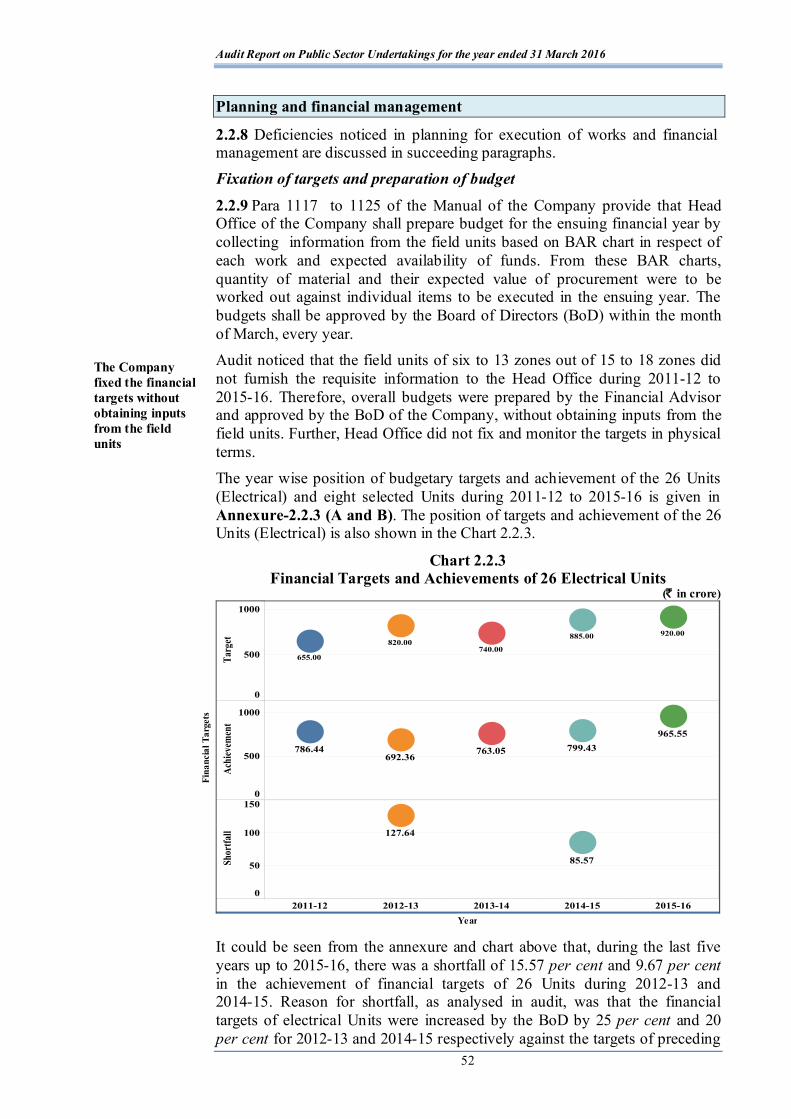
Audit Report on Public Sector Undertakings for the year ended 31 March 2016
52
Planning and financial management
2.2.8 Deficiencies noticed in planning for execution of works and financial management are discussed in succeeding paragraphs. Fixation of targets and preparation of budget
2.2.9 Para 1117 to 1125 of the Manual of the Company provide that Head Office of the Company shall prepare budget for the ensuing financial year by collecting information from the field units based on BAR chart in respect of each work and expected availability of funds. From these BAR charts, quantity of material and their expected value of procurement were to be worked out against individual items to be executed in the ensuing year. The budgets shall be approved by the Board of Directors (BoD) within the month of March, every year. Audit noticed that the field units of six to 13 zones out of 15 to 18 zones did not furnish the requisite information to the Head Office during 2011-12 to 2015-16. Therefore, overall budgets were prepared by the Financial Advisor and approved by the BoD of the Company, without obtaining inputs from the field units. Further, Head Office did not fix and monitor the targets in physical terms. The year wise position of budgetary targets and achievement of the 26 Units (Electrical) and eight selected Units during 2011-12 to 2015-16 is given in Annexure-2.2.3 (A and B). The position of targets and achievement of the 26 Units (Electrical) is also shown in the Chart 2.2.3.
Chart 2.2.3 Financial Targets and Achievements of 26 Electrical Units
(̀ in crore)
It could be seen from the annexure and chart above that, during the last five years up to 2015-16, there was a shortfall of 15.57 per cent and 9.67 per cent in the achievement of financial targets of 26 Units during 2012-13 and 2014-15. Reason for shortfall, as analysed in audit, was that the financial targets of electrical Units were increased by the BoD by 25 per cent and 20 per cent for 2012-13 and 2014-15 respectively against the targets of preceding
The Company fixed the financial targets without obtaining inputs from the field units
Year
Fina
ncia
l Tar
gets
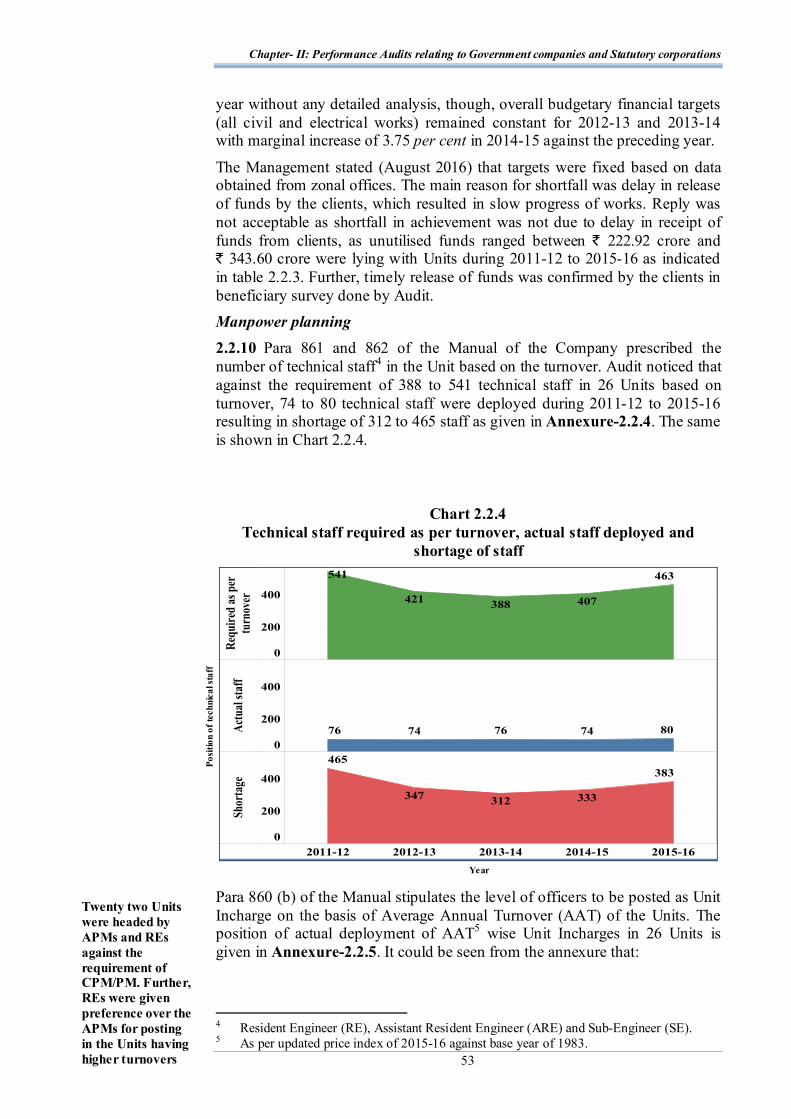
Chapter- II: Performance Audits relating to Government companies and Statutory corporations
53
year without any detailed analysis, though, overall budgetary financial targets (all civil and electrical works) remained constant for 2012-13 and 2013-14 with marginal increase of 3.75 per cent in 2014-15 against the preceding year.
The Management stated (August 2016) that targets were fixed based on data obtained from zonal offices. The main reason for shortfall was delay in release of funds by the clients, which resulted in slow progress of works. Reply was not acceptable as shortfall in achievement was not due to delay in receipt of funds from clients, as unutilised funds ranged between ` 222.92 crore and ` 343.60 crore were lying with Units during 2011-12 to 2015-16 as indicated in table 2.2.3. Further, timely release of funds was confirmed by the clients in beneficiary survey done by Audit. Manpower planning 2.2.10 Para 861 and 862 of the Manual of the Company prescribed the number of technical staff4 in the Unit based on the turnover. Audit noticed that against the requirement of 388 to 541 technical staff in 26 Units based on turnover, 74 to 80 technical staff were deployed during 2011-12 to 2015-16 resulting in shortage of 312 to 465 staff as given in Annexure-2.2.4. The same is shown in Chart 2.2.4.
Chart 2.2.4 Technical staff required as per turnover, actual staff deployed and
shortage of staff
Para 860 (b) of the Manual stipulates the level of officers to be posted as Unit Incharge on the basis of Average Annual Turnover (AAT) of the Units. The position of actual deployment of AAT5 wise Unit Incharges in 26 Units is given in Annexure-2.2.5. It could be seen from the annexure that:
4 Resident Engineer (RE), Assistant Resident Engineer (ARE) and Sub-Engineer (SE). 5 As per updated price index of 2015-16 against base year of 1983.
Twenty two Units were headed by APMs and REs against the requirement of CPM/PM. Further, REs were given preference over the APMs for posting in the Units having higher turnovers and holding
Year
Posi
tion
of te
chni
cal s
taff
Audit Report on Public Sector Undertakings for the year ended 31 March 2016
54
sixteen Units were required to be headed by Chief Project Managers (CPMs) but these Units were headed by APMs6 (six Units) and REs7 (10 Units).
six Units were required to be headed by Project Managers (PMs) but these Units were headed by APMs (three Units) and REs (three Units).
although there was shortage of APMs, one APM was deployed in the Unit where RE was eligible for posting. REs were given preference over the APMs for posting in three Units having AAT eligible for posting of CPMs without any reason on record.
six Units were held under additional charge by two APMs and four REs. Additional charges of the Units were given to four REs, although seven APMs were holding single charge. As a result of inadequate manpower deployment and its deficient utilisation, delays occurred in obtaining technical sanction and execution of works as discussed in paragraphs 2.2.13, 2.2.28 and 2.2.37. The Management accepted in the Exit conference (August 2016) that there was decline in the strength of manpower due to restriction (July 2010) by the GoUP for filling the posts through direct recruitments up to November 2013. Therefore, due to shortage of staff, REs and APMs were posted as Unit Heads. Reply was not acceptable as these posts could have been filled up through deputation as provided in the order (July 2010) of GoUP. Further, the posts could not be filled so far (October 2016) even after relaxation (November 2013) by the GoUP for recruitment. Imprudent allocation of work among Units
2.2.11 Para 17 (B) of the Manual provides that the MD shall organise and adopt yardsticks for distribution of works to the Units, for the best advantage of the Company keeping in view cost consideration. Further, Para 861 provides that a Unit Incharge may have a territorial area jurisdiction over job sites falling in a circle with a diameter below 80 km. Audit noticed that eight Units executed 143 works of which sites were located at the distance of 101 to 504 km from the respective Units. As analysed in audit, allocation of works at distant locations, by and large, resulted in poor monitoring by the Unit Heads. Audit inferred delays of 10 to 46 months from the scheduled date of completion in 17 works of sub-stations and cable laying. Also, 63 to 243 months were taken in execution of 11 works other than sub-stations and cable laying, where the scheduled dates of completion were not fixed, as shown in table 2.2.1.
Table 2.2.1 Imprudent allocation of works among Units
Sl. No.
Name of the Unit
No. of works
(S/s8 and OW9)
Distance of sites from the unit (Km)
Range of delay in case of S/S and
actual time taken in case of OW (In months)
Name of the Unit nearer to the work site
(No. of works)
6 Additional Project Managers. 7 Resident Engineers. 8 S/s indicates Sub-station and cable laying works. 9 OW indicates works other than sub-station and cable laying.
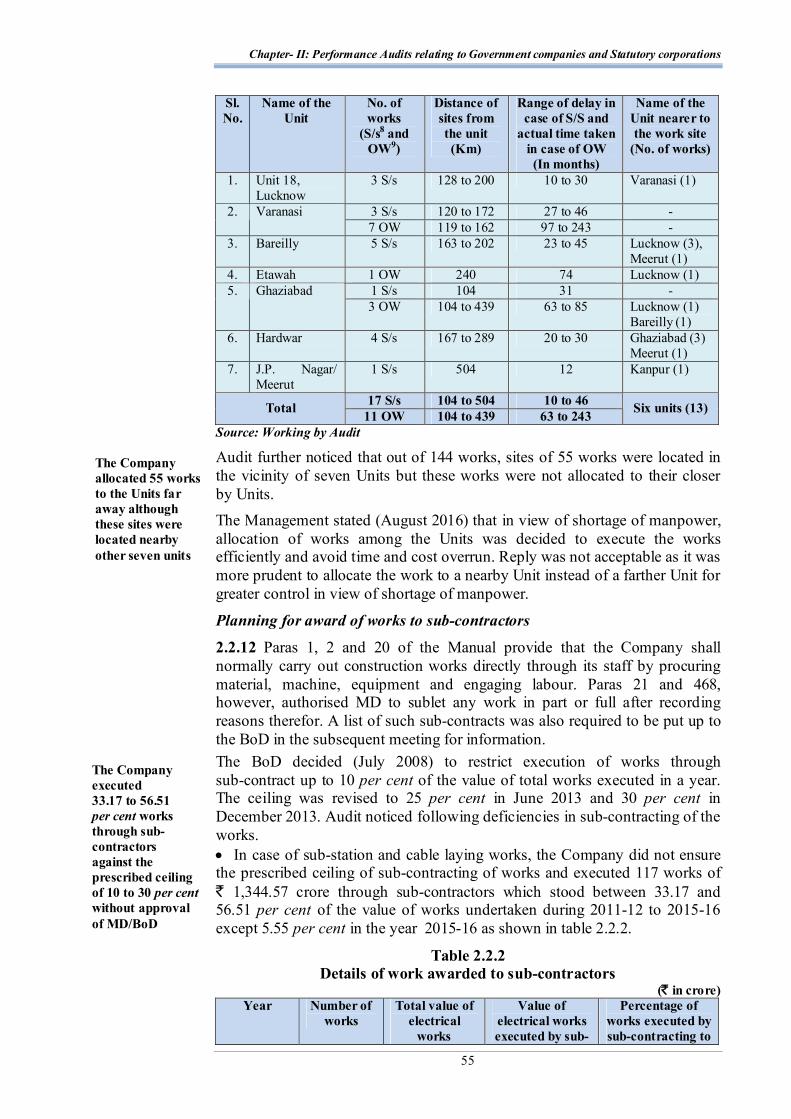
Chapter- II: Performance Audits relating to Government companies and Statutory corporations
55
Sl. No.
Name of the Unit
No. of works
(S/s8 and OW9)
Distance of sites from the unit (Km)
Range of delay in case of S/S and
actual time taken in case of OW (In months)
Name of the Unit nearer to the work site
(No. of works)
1. Unit 18, Lucknow
3 S/s 128 to 200 10 to 30 Varanasi (1)
3 S/s 120 to 172 27 to 46 - 2. Varanasi 7 OW 119 to 162 97 to 243 -
3. Bareilly 5 S/s 163 to 202 23 to 45 Lucknow (3), Meerut (1)
4. Etawah 1 OW 240 74 Lucknow (1) 1 S/s 104 31 - 5. Ghaziabad 3 OW 104 to 439 63 to 85 Lucknow (1)
Bareilly (1) 6. Hardwar 4 S/s 167 to 289 20 to 30 Ghaziabad (3)
Meerut (1) 7. J.P. Nagar/
Meerut 1 S/s 504 12 Kanpur (1)
17 S/s 104 to 504 10 to 46 Total 11 OW 104 to 439 63 to 243 Six units (13)
Source: Working by Audit
Audit further noticed that out of 144 works, sites of 55 works were located in the vicinity of seven Units but these works were not allocated to their closer by Units. The Management stated (August 2016) that in view of shortage of manpower, allocation of works among the Units was decided to execute the works efficiently and avoid time and cost overrun. Reply was not acceptable as it was more prudent to allocate the work to a nearby Unit instead of a farther Unit for greater control in view of shortage of manpower.
Planning for award of works to sub-contractors
2.2.12 Paras 1, 2 and 20 of the Manual provide that the Company shall normally carry out construction works directly through its staff by procuring material, machine, equipment and engaging labour. Paras 21 and 468, however, authorised MD to sublet any work in part or full after recording reasons therefor. A list of such sub-contracts was also required to be put up to the BoD in the subsequent meeting for information. The BoD decided (July 2008) to restrict execution of works through sub-contract up to 10 per cent of the value of total works executed in a year. The ceiling was revised to 25 per cent in June 2013 and 30 per cent in December 2013. Audit noticed following deficiencies in sub-contracting of the works. In case of sub-station and cable laying works, the Company did not ensure the prescribed ceiling of sub-contracting of works and executed 117 works of ` 1,344.57 crore through sub-contractors which stood between 33.17 and 56.51 per cent of the value of works undertaken during 2011-12 to 2015-16 except 5.55 per cent in the year 2015-16 as shown in table 2.2.2.
Table 2.2.2 Details of work awarded to sub-contractors
(` in crore) Year Number of
works Total value of
electrical works
Value of electrical works executed by sub-
Percentage of works executed by sub-contracting to
The Company allocated 55 works to the Units far away although these sites were located nearby other seven units
The Company executed 33.17 to 56.51 per cent works through sub-contractors against the prescribed ceiling of 10 to 30 per cent without approval of MD/BoD
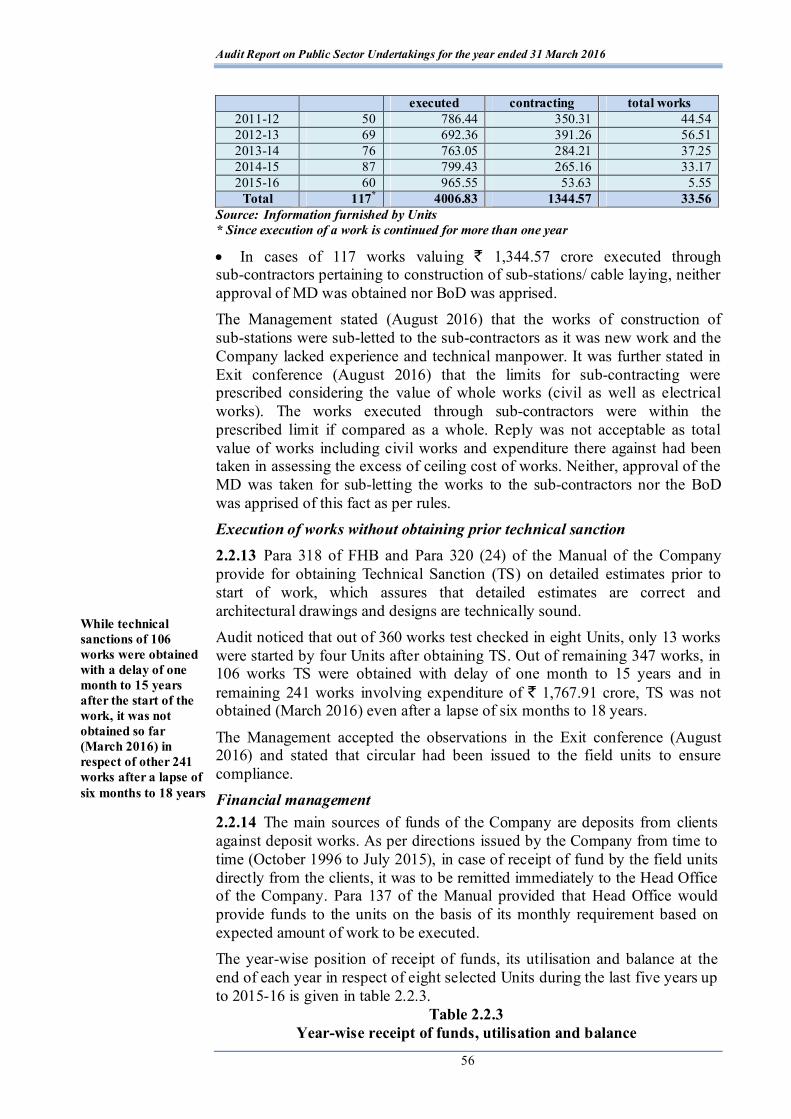
Audit Report on Public Sector Undertakings for the year ended 31 March 2016
56
executed contracting total works 2011-12 50 786.44 350.31 44.54 2012-13 69 692.36 391.26 56.51 2013-14 76 763.05 284.21 37.25 2014-15 87 799.43 265.16 33.17 2015-16 60 965.55 53.63 5.55
Total 117* 4006.83 1344.57 33.56 Source: Information furnished by Units * Since execution of a work is continued for more than one year
In cases of 117 works valuing ` 1,344.57 crore executed through sub-contractors pertaining to construction of sub-stations/ cable laying, neither approval of MD was obtained nor BoD was apprised. The Management stated (August 2016) that the works of construction of sub-stations were sub-letted to the sub-contractors as it was new work and the Company lacked experience and technical manpower. It was further stated in Exit conference (August 2016) that the limits for sub-contracting were prescribed considering the value of whole works (civil as well as electrical works). The works executed through sub-contractors were within the prescribed limit if compared as a whole. Reply was not acceptable as total value of works including civil works and expenditure there against had been taken in assessing the excess of ceiling cost of works. Neither, approval of the MD was taken for sub-letting the works to the sub-contractors nor the BoD was apprised of this fact as per rules. Execution of works without obtaining prior technical sanction 2.2.13 Para 318 of FHB and Para 320 (24) of the Manual of the Company provide for obtaining Technical Sanction (TS) on detailed estimates prior to start of work, which assures that detailed estimates are correct and architectural drawings and designs are technically sound. Audit noticed that out of 360 works test checked in eight Units, only 13 works were started by four Units after obtaining TS. Out of remaining 347 works, in 106 works TS were obtained with delay of one month to 15 years and in remaining 241 works involving expenditure of ` 1,767.91 crore, TS was not obtained (March 2016) even after a lapse of six months to 18 years.
The Management accepted the observations in the Exit conference (August 2016) and stated that circular had been issued to the field units to ensure compliance. Financial management 2.2.14 The main sources of funds of the Company are deposits from clients against deposit works. As per directions issued by the Company from time to time (October 1996 to July 2015), in case of receipt of fund by the field units directly from the clients, it was to be remitted immediately to the Head Office of the Company. Para 137 of the Manual provided that Head Office would provide funds to the units on the basis of its monthly requirement based on expected amount of work to be executed. The year-wise position of receipt of funds, its utilisation and balance at the end of each year in respect of eight selected Units during the last five years up to 2015-16 is given in table 2.2.3.
Table 2.2.3 Year-wise receipt of funds, utilisation and balance
While technical sanctions of 106 works were obtained with a delay of one month to 15 years after the start of the work, it was not obtained so far (March 2016) in respect of other 241 works after a lapse of six months to 18 years
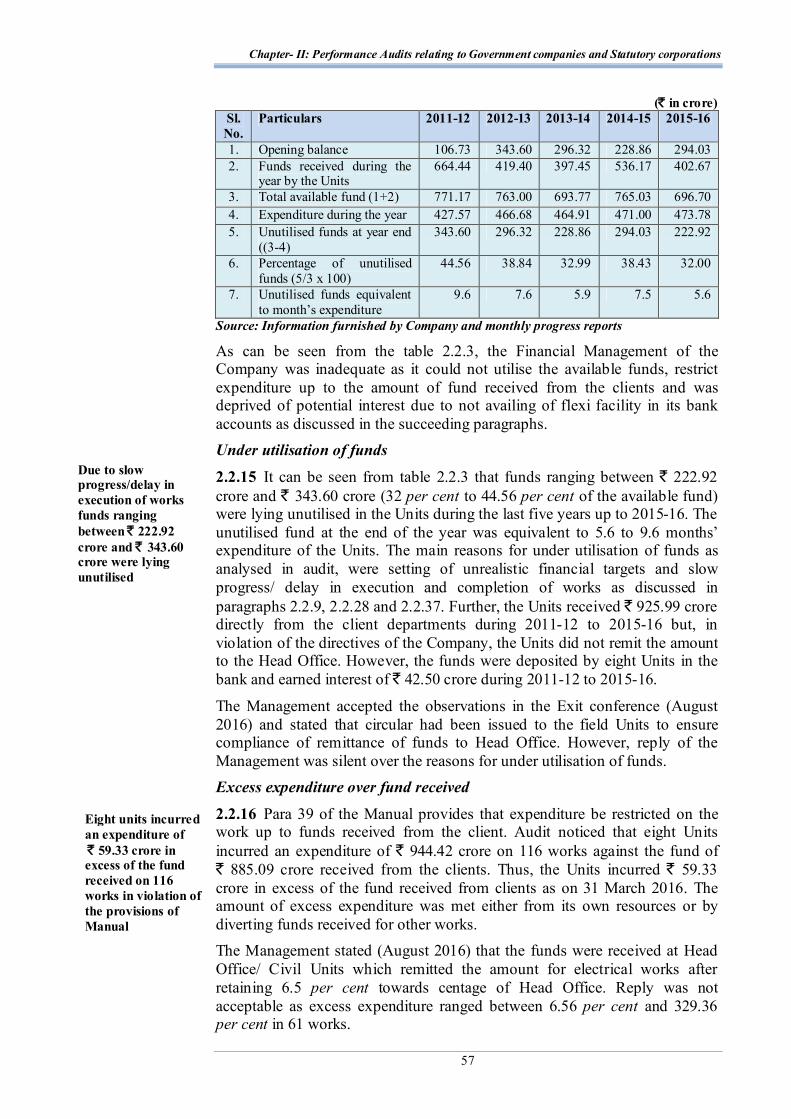
Chapter- II: Performance Audits relating to Government companies and Statutory corporations
57
(` in crore) Sl. No.
Particulars 2011-12 2012-13 2013-14 2014-15 2015-16
1. Opening balance 106.73 343.60 296.32 228.86 294.03 2. Funds received during the
year by the Units 664.44 419.40 397.45 536.17 402.67
3. Total available fund (1+2) 771.17 763.00 693.77 765.03 696.70 4. Expenditure during the year 427.57 466.68 464.91 471.00 473.78 5. Unutilised funds at year end
((3-4) 343.60 296.32 228.86 294.03 222.92
6. Percentage of unutilised funds (5/3 x 100)
44.56 38.84 32.99 38.43 32.00
7. Unutilised funds equivalent to month’s expenditure
9.6 7.6 5.9 7.5 5.6
Source: Information furnished by Company and monthly progress reports
As can be seen from the table 2.2.3, the Financial Management of the Company was inadequate as it could not utilise the available funds, restrict expenditure up to the amount of fund received from the clients and was deprived of potential interest due to not availing of flexi facility in its bank accounts as discussed in the succeeding paragraphs. Under utilisation of funds
2.2.15 It can be seen from table 2.2.3 that funds ranging between ` 222.92 crore and ` 343.60 crore (32 per cent to 44.56 per cent of the available fund) were lying unutilised in the Units during the last five years up to 2015-16. The unutilised fund at the end of the year was equivalent to 5.6 to 9.6 months’ expenditure of the Units. The main reasons for under utilisation of funds as analysed in audit, were setting of unrealistic financial targets and slow progress/ delay in execution and completion of works as discussed in paragraphs 2.2.9, 2.2.28 and 2.2.37. Further, the Units received ` 925.99 crore directly from the client departments during 2011-12 to 2015-16 but, in violation of the directives of the Company, the Units did not remit the amount to the Head Office. However, the funds were deposited by eight Units in the bank and earned interest of ` 42.50 crore during 2011-12 to 2015-16.
The Management accepted the observations in the Exit conference (August 2016) and stated that circular had been issued to the field Units to ensure compliance of remittance of funds to Head Office. However, reply of the Management was silent over the reasons for under utilisation of funds. Excess expenditure over fund received
2.2.16 Para 39 of the Manual provides that expenditure be restricted on the work up to funds received from the client. Audit noticed that eight Units incurred an expenditure of ` 944.42 crore on 116 works against the fund of ` 885.09 crore received from the clients. Thus, the Units incurred ` 59.33 crore in excess of the fund received from clients as on 31 March 2016. The amount of excess expenditure was met either from its own resources or by diverting funds received for other works. The Management stated (August 2016) that the funds were received at Head Office/ Civil Units which remitted the amount for electrical works after retaining 6.5 per cent towards centage of Head Office. Reply was not acceptable as excess expenditure ranged between 6.56 per cent and 329.36 per cent in 61 works.
Eight units incurred an expenditure of ̀ 59.33 crore in excess of the fund received on 116 works in violation of the provisions of Manual
Due to slow progress/delay in execution of works funds ranging between ̀ 222.92 crore and ` 343.60 crore were lying unutilised
Audit Report on Public Sector Undertakings for the year ended 31 March 2016
58
Auto sweep/ flexi facility not availed 2.2.17 Banks provide minimal interest on savings accounts but extend auto sweep/ flexi facility to its customers of savings/ current accounts on their demand; wherein automatic investment of surplus funds lying in saving/ current accounts is made into term deposits which earn interest applicable for term deposits. It also allows automatic encashment of term deposits when funds are required to meet an impending expenditure.
Audit noticed that huge balances upto ` 28.83 crore were lying in savings/ current accounts in eight Units during 2011-12 to 2015-16. These Units did not avail auto sweep/ flexi facility on the saving/ current accounts. As a result, the Company was deprived of potential interest of ` 9.57 crore10 on the balances of 31 bank accounts test checked. The Management accepted the observations in the Exit conference (August 2016) and stated that circular had been issued to the field units to ensure compliance.
Execution of works
2.2.18 The Company executes electrical works which are part of civil works. Besides, it also executes electrical works relating to sub-stations and cable laying of Uttar Pradesh Power Transmission Corporation Limited (UPPTCL)/ Uttar Pradesh Power Corporation Limited (UPPCL).
Out of total 957 electrical works of ` 4,006.83 crore executed by 26 Units during 2011-12 to 2015-16, 117 works of ` 1,344.57 crore (33.56 per cent) of sub-stations and cable laying were assigned by UPPTCL and Distribution Companies (DISCOMs) of Uttar Pradesh. These works were executed through sub-contractors.
Remaining 840 electrical works of ` 2,662.26 crore11 executed during 2011-12 to 2015-16 related to electrical parts of the building construction works (other than sub-stations and cable laying works). These works were mainly executed under DCU pattern. Deficiencies noticed in execution of sub-station/ cable laying works and other works are discussed in succeeding paragraphs.
Execution of sub-stations and cable laying works of UPPTCL/DISCOMs
2.2.19 Eight selected Units executed 103 works of ` 1,175.98 crore of sub-stations/ cable laying during 2011-12 to 2015-16 out of which Audit examined 88 works of ` 1,155.12 crore. All the 88 works were executed through turnkey contracts with sub-contractors, selected on the basis of open tenders. Separate letter of intents (LoIs) were issued to sub-contractors for supply of materials, erection and civil works. The agreements were, however, not executed with the sub-contractors except in case of one work12 in violation of the provisions of para 468 of the Manual.
10 At the rate of four per cent per annum. 11 ` 2,662.26 crore does not include cost of civil works. 12 220 KV sub-station, Debai, Bulandshahar executed by Consultancy Unit, Ghaziabad.
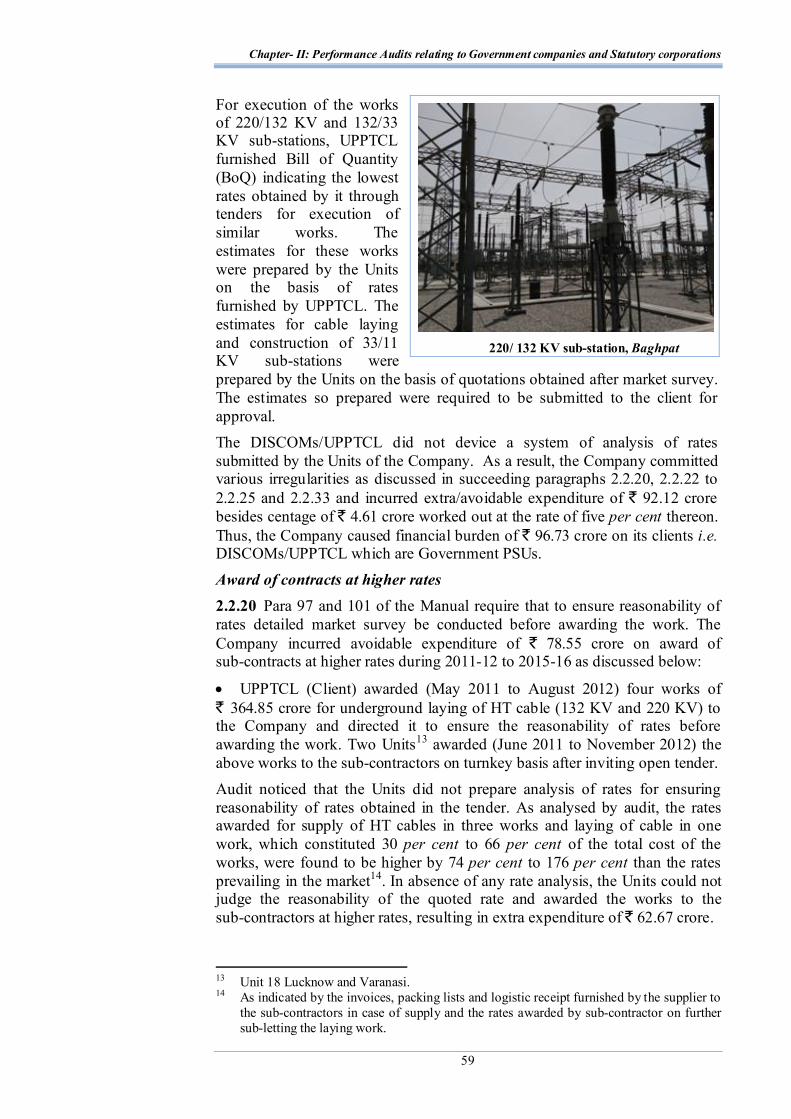
Chapter- II: Performance Audits relating to Government companies and Statutory corporations
59
For execution of the works of 220/132 KV and 132/33 KV sub-stations, UPPTCL furnished Bill of Quantity (BoQ) indicating the lowest rates obtained by it through tenders for execution of similar works. The estimates for these works were prepared by the Units on the basis of rates furnished by UPPTCL. The estimates for cable laying and construction of 33/11 KV sub-stations were prepared by the Units on the basis of quotations obtained after market survey. The estimates so prepared were required to be submitted to the client for approval. The DISCOMs/UPPTCL did not device a system of analysis of rates submitted by the Units of the Company. As a result, the Company committed various irregularities as discussed in succeeding paragraphs 2.2.20, 2.2.22 to 2.2.25 and 2.2.33 and incurred extra/avoidable expenditure of ` 92.12 crore besides centage of ` 4.61 crore worked out at the rate of five per cent thereon. Thus, the Company caused financial burden of ` 96.73 crore on its clients i.e. DISCOMs/UPPTCL which are Government PSUs. Award of contracts at higher rates 2.2.20 Para 97 and 101 of the Manual require that to ensure reasonability of rates detailed market survey be conducted before awarding the work. The Company incurred avoidable expenditure of ` 78.55 crore on award of sub-contracts at higher rates during 2011-12 to 2015-16 as discussed below:
UPPTCL (Client) awarded (May 2011 to August 2012) four works of ` 364.85 crore for underground laying of HT cable (132 KV and 220 KV) to the Company and directed it to ensure the reasonability of rates before awarding the work. Two Units13 awarded (June 2011 to November 2012) the above works to the sub-contractors on turnkey basis after inviting open tender. Audit noticed that the Units did not prepare analysis of rates for ensuring reasonability of rates obtained in the tender. As analysed by audit, the rates awarded for supply of HT cables in three works and laying of cable in one work, which constituted 30 per cent to 66 per cent of the total cost of the works, were found to be higher by 74 per cent to 176 per cent than the rates prevailing in the market14. In absence of any rate analysis, the Units could not judge the reasonability of the quoted rate and awarded the works to the sub-contractors at higher rates, resulting in extra expenditure of ̀ 62.67 crore.
13 Unit 18 Lucknow and Varanasi. 14 As indicated by the invoices, packing lists and logistic receipt furnished by the supplier to
the sub-contractors in case of supply and the rates awarded by sub-contractor on further sub-letting the laying work.
220/ 132 KV sub-station, Baghpat
Audit Report on Public Sector Undertakings for the year ended 31 March 2016
60
Similarly, five Units15 awarded (April 2009 to October 2013) construction of 11 sub-stations to the sub-contractors on turnkey basis for ` 289.93 crore without preparing any analysis of rate. As a result, the rates awarded for supply of 22 transformers being one of the major items were found higher by 21 per cent to 81 per cent of the rates prevailing in market after allowing 10 per cent Contractor’s profit. This also led to extra expenditure of ` 10.94 crore on construction of sub-stations.
The Management stated (August 2016) that materials were procured after proper rate analysis. It further stated that the cost of transportation, insurance, loading, unloading, road clearance charges, performance guarantee charges for five years and contractor’s profit at the rate of 10 per cent were not considered by Audit. Reply was not acceptable as the excess expenditure had been calculated after allowing contractors profit of ten per cent on the cost of the materials. As regards the analysis of rates, the Company had not prepared any rate analysis before awarding the contracts for supply to the sub-contractors but in one case (each for cable and transformer) analysis was prepared later on to justify the rates already awarded as indicated by the fact that the rate analysis was signed by the present APM who was different from the then APM issuing the letter of award.
Rural Electrification and Secondary System Planning Organisation (RESSPO), a wing of UPPCL, prepares cost schedule for construction of electrical works.
Varanasi Unit submitted (September 2013) estimates for construction of 31 sub-stations16 of 33/11 KV along with connected lines to Purvanchal Vidyut Vitran Nigam Limited (Client) based on the rates higher by 22 per cent to 28 per cent than the prevailing rates of RESSPO which were approved (September 2013) by the client. The Unit, however, awarded (November 2013) the work of these sub-stations to the sub-contractors at the rates higher by nine per cent to 12 per cent than the rates approved by the client. This resulted in excess expenditure of ` 4.20 crore over the financial sanction of the client, which will be borne by the Company from its own sources. The Management stated (September 2016) that the cost of transformers included in the cost schedule of RESSPO did not include VAT. Reply was not acceptable as VAT was included in the cost schedule of RESSPO.
Varanasi and Bareilly Units awarded the works of one (Jhoosi) and two (Rampur and Khair) 220/132 KV sub-stations respectively at the rates higher than the rates awarded by it for other sub-stations of similar capacity at the same time. This resulted in avoidable expenditure of ` 74.10 lakh.
The Management stated (August 2016) that the scope and quantity of items of work were different for the sub-stations. Reply was not acceptable as the sub-stations of similar capacities within the same Units were compared and the comparison was made with the unit rate of items of the quantity actually executed. Irregular release of mobilisation advance
15 Unit 18 Lucknow, Etawah, J.P. Nagar/ Meerut, New Delhi and Haridwar. 16 29 sub-stations of 1x5 MVA transformers and 2 sub-stations of 2x5 MVA transformers.
The Company failed to ensure reasonability of rates and incurred avoidable expenditure of ` 78.55 crore on award of sub-contracts at higher rates

Chapter- II: Performance Audits relating to Government companies and Statutory corporations
61
2.2.21 CVC Guidelines (October 1997, April 2007 and February 2011) provide that provision of allowing mobilisation advance should be clearly stipulated in the tender document. In case where it is to be provided, it should be need based, restricted up to 10 per cent of the contract cost, against submission of bank guarantee equivalent to 110 per cent, interest bearing and it should not be allowed on erection portion. Recovery of the mobilisation advance should be time based and not be linked with progress of work.
Further, as per provisions of Paras 241(3), 242(12) and 243(9) of the Manual of the Company, the General Manager (GM) was required to works as guide or advisor to the Unit Incharge; Financial Advisor (FA) was responsible to see that advances of various types were kept to a minimum; and Controller of Accounts (CA) was required to watch position of advances in the Unit and bring it to the notice of FA with suggestive action each month.
The Project Incharge of eight Units, at their own level, provided interest free mobilisation advances of ` 142.03 crore to the sub-contractors during 2011-12 to 2015-16 for construction works of 47 sub-stations/cable laying. Since condition was not laid in the tender documents for providing mobilisation advances for the works, releasing interest free mobilisation advances to the sub-contractors vitiated the tendering process and was tantamount to undue benefit of interest of ` 21.90 crore17 to the sub-contractors. Audit noticed that the GM, FA and CA of the Company failed to exercise checks as prescribed in Paras 241(3), 242(12) and 243(9) of the Manual; therefore, the Project Incharge granted irregular mobilisation advances to sub-contractors. This further facilitated the following deficiencies relating to release of the mobilisation advances:
Advances of ` 48.28 crore were allowed in excess of ten per cent of the cost in 47 contracts including ` 10.35 crore allowed on the erection portion of the contract;
Two Units18 allowed advances of ` 7.15 crore against three sub-stations, prior (four months to two years and 10 months) to ensuring availability of land for construction;
As against requirement of bank guarantee of ` 156.23 crore (110 per cent of mobilisation advance), the selected Units obtained bank guarantees of ` 139.83 crore from the sub-contractors which resulted in short receipt of bank guarantee of ` 16.40 crore in 47 works;
Recoveries of mobilisation advances were based on progress of work instead of the time. As a result, the Company extended undue benefit of interest of ` 5.74 crore to the sub-contractors on delay in recovery of mobilisation advances due to delayed completion of work by the sub-contractors. The Management accepted the irregularities in the Exit conference (August 2016) and stated that corrective action would be taken to adhere the provisions in case of new works. However, no action was proposed to be taken against the defaulting officers.
17 Calculated at the rate of 12 per cent per annum followed by the Company as per
provisions of the agreements where this rate of interest is provided. 18 Unit 18 Lucknow and Varanasi.
Eight units extended undue benefit of interest of ̀ 21.90 crore by allowing interest free mobilisation advance although it was not provided in the tender documents
Audit Report on Public Sector Undertakings for the year ended 31 March 2016
62
Excess payment to sub-contractors 2.2.22 The Management of Varanasi Unit, made payment to the sub-contractor for supply of equipment at the rates higher than that awarded (December 2012) in the LoI for the work of 132/33 KV sub-station at Gurudevnagar. This resulted in excess payment of ` 27.35 lakh to the sub-contractor. The Management stated (August and September 2016) that excess payment had been worked out by Audit without considering difference of excise duty provided in LoI. Reply was not acceptable as the LoI for supply of material was issued to the sub-contractor for ` 8.79 crore which were inclusive of insurance, excise duty and UP VAT. The same amount was sanctioned by the client. Therefore, any amount towards excise duty was not payable separately. 2.2.23 The Management of Six19 Units awarded (July 2011 to April 2013) 10 works of construction of 132/33 KV sub-stations to sub-contractors on turnkey basis which included supply of material for ` 77.89 crore. Audit noticed that in all the cases, the sub-contractors had quoted the rates inclusive of all taxes. Varanasi Unit, however, allowed for VAT separately in the LoIs issued to the sub-contractors for construction of two sub-stations20 over and above the quoted rates. In respect of remaining eight sub-stations, although the terms and conditions of LoIs issued to the sub-contractors provided for VAT inclusive in the rates, the payment of VAT was made over and above the awarded rates. Thus, the above Units made an excess payment of ` 7.19 crore to the sub-contractors during 2011-12 to 2015-16. The Management stated (August and September 2016) that the client clarified (April 2011) that VAT was payable extra. Accordingly, LoI was issued which provided for VAT extra and was paid. Reply was not acceptable as in all the above cases the bids were invited after April 2011 and were inclusive of VAT.
Undue benefit to the sub-contractor 2.2.24 New Delhi Unit, invited (5 March 2011) tenders for supply and erection of 220/132 KV sub-station at RC Green, New Delhi. The last date of submission of bids was 25 March 2011 with stipulation that the bids would be opened on the same day. Three firms submitted their bids; amongst them, Safety Plus Power Limited (SPPL) had submitted their bid for supply on 18 March 2011 and that of erection on 24 March 2011 for ` 22.92 crore and ` 24 lakh respectively. The bids were opened on 25 March 2011 and LoI for ` 22.92 crore in respect of supply and other LoI for ` 24 lakh in respect of erection were issued on 20 May 2011 and 8 August 2011 respectively. In the meantime, after closure of bid, SPPL submitted (4 April 2011) another bid for higher amount of ` 2.37 crore for erection.
Audit noticed that the later bid was submitted after the opening of bids i.e. 25 March 2011, hence should have been rejected. The Project Incharge of the Unit, however, after obtaining approval of the Zonal GM, issued another LoI bearing the same date and number21 (8 August 2011) for ` 2.37 crore for erection of the same work for which LoI was issued for ` 24 lakh. Thus, the 19 Unit 18 Lucknow, Varanasi, Bareilly, J.P. Nagar/ Meerut, Etawah and Haridwar. 20 Koraon and Katghar Mahalu. 21 LoI no. 253/EUD/SS-RCG/RNN/2011 dated 8 August 2011.
The Company made excess payment of ` 7.46 crore over and above the quoted/ awarded rates
Chapter- II: Performance Audits relating to Government companies and Statutory corporations
63
Project Incharge extended undue benefit of ` 2.13 crore22 to SPPL by awarding the work on higher rates of ` 2.37 crore, after opening of the bid.
The Management stated (August 2016) that the last date of submission of bids was extended up to 6 April 2011 and the sub-contractor had quoted lesser rates in the earlier bid due to typographical mistake. Reply was incorrect as separate bids for supply and erection were called through the same Notice Inviting Quotation which were opened on 25 March 2011. Therefore, extension of last date of submission of bids was not possible. In the Exit conference (August 2016), MD and Special Secretary directed the GM concerned/ Financial Advisor to conduct an enquiry into the matter. However, any action initiated against defaulter was not intimated to Audit so far (October 2016). 2.2.25 Rule 204 of General Financial Rules (GFR) provides for allowing price variation in long term contracts, where the delivery period extends beyond one year and six months. In short term contracts, it provides for firm and fixed prices.
Audit noticed that tenders invited (March 2009/March 2011) by the two23 Units for construction of three 220/132 KV sub-stations did not stipulate any price variation clause as the scheduled period of supply was within one year and six months and the sub-contractors also did not ask for it. However, the Units 24 while issuing LOIs, inserted the clause of price variation based on Indian Electrical and Electronics Manufacturers’ Association (IEEMA) formula and paid price variation of ` 3.23 crore to the sub-contractors on supply of 60 MVA transformers. Thus, the Units, in violation of provisions of GFR and tender documents, extended undue favour of ` 3.23 crore to the sub-contractors.
The Management accepted the issue of price variation for contract period of less than 18 months in the Exit conference (August 2016).
Financial sanctions not obtained 2.2.26 As per LoIs issued by UPPTCL (client), the Company was required to submit detailed estimate and obtain financial sanction (FS) before executing the works.
Audit noticed that the Units started execution of work through sub-contractors without preparing the detailed estimates and only on the basis of BoQ furnished by the clients. In test check of 13 cases, Audit noticed that FS was obtained after 14 to 58 months from the date of start of work. As a result of not preparing detailed estimates and obtaining FS before start of work, the clients reduced FS in two cases25 to the extent of ` 91.91 lakh, the extra cost of which was borne by the Company from its own sources. The Management agreed with audit observation in the Exit conference (August 2016) and assured to recover the excess paid amount from the sub-contractors.
Tendering procedures not adhered
22 ` 2.37 crore - ̀ 0.24 crore. 23 J.P. Nagar/ Meerut and New Delhi. 24 J.P. Nagar/ Meerut and New Delhi. 25 132/33 KV sub-station, Shyamli-Shyamla, Muzaffar Nagar executed by J. P. Nagar/
Meerut and 132/33 KV sub-station Baghauli executed by Bareilly.
The Company extended undue favour of ̀ 5.36 crore to the sub-contractors by allowing them to work at higher rates and allowing irregular price variation
Audit Report on Public Sector Undertakings for the year ended 31 March 2016
64
2.2.27 Paras 468, 473 and 480 of the Manual provide for inviting sealed tenders in an open and public manner by advertising in four leading Hindi/ English dailies allowing at least one month for submission of bids.
CVC guidelines (November 2002) provide to obtain performance bank guarantee of reasonable amount valid up to defect liability period for due performance of the contract. CVC guidelines (September 2003) provide for inviting the bids in two parts viz. technical bid and financial bid. Financial bids of only those bidders, who qualify in technical bid, should be opened and considered.
Audit noticed that:
Unit 18, Lucknow awarded two works of sub-stations for ` 21.97 crore to sub-contractors on nomination basis without inviting tender and specifying any reason thereof.
The 81 works were executed by inviting tenders where only financial bids were called for works of sub-station. As a result, technical competency of the bidders in respect of 81 works was not ensured before awarding works to the sub-contractors.
Audit noticed that out of 81 works, 38 works of ` 772.37 crore were executed by 13 sub-contractors and each sub-contractor executed two to seven works of sub-stations for ` 17.86 crore to ` 143.76 crore simultaneously with the delay of one to 52 months up to March 2016.
Against the provision for allowing one month time for submission of bids, six to 20 days were allowed in 83 cases (excluding three cases where 33 days were allowed).
Notice for Inviting Quotations (NIQ) were published in two to three news papers instead of four Hindi/English dailies. The NIQs were not published in Indian Trade Journal, Calcutta, as required in CVC guidelines.
Neither conditions were laid in bid documents/ LoI for bidders to deposit earnest money and performance guarantee for due completion of contracts nor actually obtained to safeguard financial interest of the Company. The Management accepted the irregularities in the Exit conference (August 2016) and stated that corrective action would be taken to adhere to the provisions in case of new works. Delay in execution of works 2.2.28 As per the terms and conditions agreed with UPPTCL and DISCOMs, the works of construction of sub-stations and cable laying were to be completed within eight months to one year and six months. The position of progress of 88 works examined in audit as on 31 March 2016 is shown in table 2.2.4.
Table 2.2.4 Progress of works
Sl. No.
Particulars of works Position (as on 31 March
2016) 1 No. of works Completed 42 2 No. of works in progress (WIP) 46 3 Total works 88
The Units awarded two works to the sub-contractors without inviting tenders and awarded 81 other works without adhering to the proper tender procedures
Chapter- II: Performance Audits relating to Government companies and Statutory corporations
65
4 Scheduled period of completion of works (in months) 8 to 18 5 Actual time taken in completion/ up to March 2016 in case of
works under progress (in months) 13 to 64
6 Delay in completion of works (in months) 1 to 52 Source: Working done by Audit
It could be seen from table 2.2.4 that 42 works of the sub-stations/cable laying were completed during 2011-12 to 2015-16 and 46 works were in progress at the end of March 2016. Audit noticed that delay of one month to four years and four months occurred in completed and works which were in progress (WIP).
Reasons for delay, as analysed by audit, were the following:
Delay of one month to one year and six months occurred in providing the construction sites of 29 works by UPPTCL;
Delay of one month to one year and two months occurred in award of 43 works by the Company to sub-contractors which was mainly due to delay of seven days to eight months and 28 days in finalisation of tenders in 26 cases (after considering 15 days normal time); and
Slow pace of execution by the sub-contractors was mainly due to inadequate deployment of manpower by the sub-contractors at site. This was also confirmed by the client during beneficiary survey done by Audit.
As a result of delay in completion of the works, expenditure of ` 1,155.12 crore incurred on 88 works remained blocked for the delayed period and the sub-stations could not be put to use. The Management stated (August 2016) that works were delayed due to late receipt of fund from the clients, delay in sanction of estimates, financial sanction and providing connecting line by UPPTCL. Reply was not acceptable as funds were released by the clients which was more than the expenditure incurred during the period 2011-12 to 2015-16. As regards delay in sanction of estimates, the Company itself submitted estimates with delay to the clients for approval. Further, connecting lines were required to be provided by the clients only after completion of the sub-stations. Liquidated damages not levied
2.2.29 The terms and conditions of LoI issued (April 2009 to November 2013) by the Company to the sub-contractors for construction of sub-stations/ cable laying provided scheduled period of completion of four months to one year and six months. Audit noticed that LoIs issued by eight selected Units in respect of 39 out of 88 works of constructions of sub-stations/cable laying, stipulated levy of liquidated damages (LD) for delay in completion of works, at the rate of 0.5 per cent per week of incomplete work subject to maximum of five to 10 per cent of value of contract. The Units, however, did not levy LD of ` 40.28 crore on the sub-contractors for delay in completion of the works by one month to four years and four months. Extensions for time were neither applied by the sub-contractors nor granted by the Company till date (March 2016).

Audit Report on Public Sector Undertakings for the year ended 31 March 2016
66
Further, the LOIs issued by the Units26 in respect of remaining 49 works, did not stipulate the levy of LD. In absence of such condition in the LOIs, the Units could not levy LD of ` 9.28 crore for delay of one month to three years and eight months in completion of the works by the sub-contractors. The Management stated (August 2016) that LD was not levied as there was delay/ not release of fund by the clients to the sub-contractors besides delays in providing the land, transformers and connecting lines by the clients. As regards not including LD clause in few agreements, it stated that corrective action had been taken by including the above clause in the LoIs of the works to be executed in future. Reply was not acceptable as unutilised funds remained with the Units during the period of audit as indicated in table 2.2.3 and this was also confirmed by the clients during beneficiary survey. Further, cases relating to delay in providing land to the sub-contractors were not considered while calculating the LD and connecting lines were required to be provided only after completion of the sub-stations.
Irregular release of advances 2.2.30 Para 553 of the Manual provides that secured advance up to 75 per cent of the value of material brought at site as assessed and certified by Unit Incharge, in the prescribed form, can be allowed to the sub-contractor after securing lien on such material. Audit noticed that although the LoIs did not contain any clause for providing secured advances, selected Units provided advances of ` 109.45 crore to the sub-contractors on their requests without receipt of material at site and securing lien on the material, which was irregular. The Management stated (August 2016) that advances were given against the works already executed by the PRWs/ sub-contractors and material supplied on the basis of certificates given by the concerned SE/ARE after proper valuation of work. Reply did not address the issue as Audit had considered the advances against supply portion only and that too without receipt of material.
Poor workmanship 2.2.31 UPPTCL (client) awarded (July 2010) work of diversion of 220 KV cable of Badarpur-Ghazipur line to the Company at the cost of ` 39.16 crore excluding centage and labour cess. New Delhi Unit executed the work by awarding the work to sub-contractors for ` 39.16 crore in October 2010. The work was completed in December 2011 and handed over to the client in the same month. The Unit had made payment of ` 28.19 crore to the sub-contractor as of December 2011. On energisation of the line, frequent faults occurred as pointed (June 2012 to October 2013) out by the client. The Unit incurred ` 13.63 crore on rectification of the defects in the line (repairs: ` 1.80 crore and replacement of line: ` 11.83 crore) on behalf of the sub-contractors. Out of ` 13.63 crore incurred on rectification of line, ` 10.97 crore was adjusted from the pending bills of the sub-contractors, ` 87 lakh by forfeiting security and ` 1.29 crore by invoking bank guarantee of the sub-contractors. Remaining amount of ` 50 lakh could not be recouped. The Unit, however, did not take any action against
26 J.P. Nagar/ Meerut, Varanasi and New Delhi.
The Company did not levy liquidated damages of ̀ 40.28 crore on the sub-contractors for delay in completion of the works
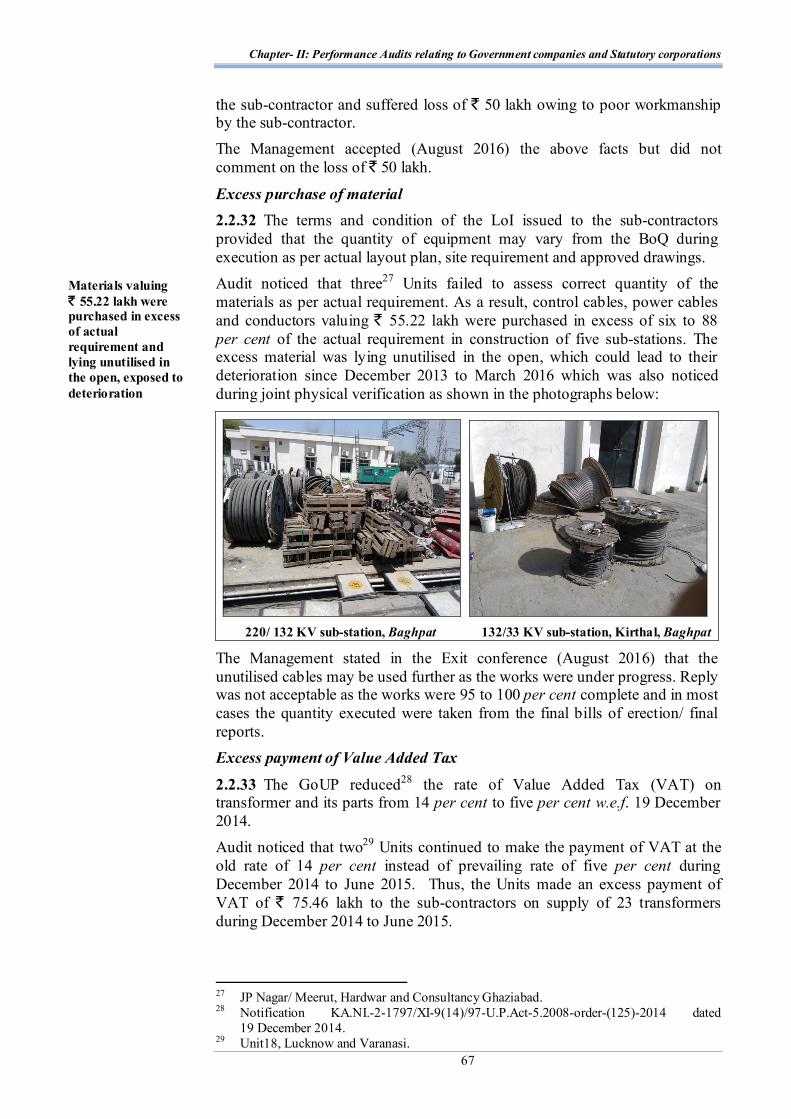
Chapter- II: Performance Audits relating to Government companies and Statutory corporations
67
the sub-contractor and suffered loss of ` 50 lakh owing to poor workmanship by the sub-contractor. The Management accepted (August 2016) the above facts but did not comment on the loss of ` 50 lakh.
Excess purchase of material 2.2.32 The terms and condition of the LoI issued to the sub-contractors provided that the quantity of equipment may vary from the BoQ during execution as per actual layout plan, site requirement and approved drawings. Audit noticed that three27 Units failed to assess correct quantity of the materials as per actual requirement. As a result, control cables, power cables and conductors valuing ` 55.22 lakh were purchased in excess of six to 88 per cent of the actual requirement in construction of five sub-stations. The excess material was lying unutilised in the open, which could lead to their deterioration since December 2013 to March 2016 which was also noticed during joint physical verification as shown in the photographs below:
220/ 132 KV sub-station, Baghpat 132/33 KV sub-station, Kirthal, Baghpat
The Management stated in the Exit conference (August 2016) that the unutilised cables may be used further as the works were under progress. Reply was not acceptable as the works were 95 to 100 per cent complete and in most cases the quantity executed were taken from the final bills of erection/ final reports. Excess payment of Value Added Tax
2.2.33 The GoUP reduced28 the rate of Value Added Tax (VAT) on transformer and its parts from 14 per cent to five per cent w.e.f. 19 December 2014. Audit noticed that two29 Units continued to make the payment of VAT at the old rate of 14 per cent instead of prevailing rate of five per cent during December 2014 to June 2015. Thus, the Units made an excess payment of VAT of ` 75.46 lakh to the sub-contractors on supply of 23 transformers during December 2014 to June 2015.
27 JP Nagar/ Meerut, Hardwar and Consultancy Ghaziabad. 28 Notification KA.NI.-2-1797/XI-9(14)/97-U.P.Act-5.2008-order-(125)-2014 dated
19 December 2014. 29 Unit18, Lucknow and Varanasi.
Materials valuing ` 55.22 lakh were purchased in excess of actual requirement and lying unutilised in the open, exposed to deterioration
Audit Report on Public Sector Undertakings for the year ended 31 March 2016
68
The Management accepted (September 2016) and issued letter for recovery of ` 36.90 lakh in respect of one transformer at Behraich sub-station. In respect of other 22 transformers, it stated that the transformers were supplied by the sub-contractors before the date of notification. Reply was not acceptable as the actual recovery was still pending in case of Behraich sub-station and in remaining 22 cases, Audit had considered only the transformers which were supplied after the date of notification. Payment of UPVAT without obtaining tax invoice 2.2.34 Section 22 (1) of Uttar Pradesh Value Added Tax Act, 2008 stipulates that every registered dealer (except a dealer who opts for payment of tax on lump sum under section 6) is required to issue a tax invoice to the purchaser in the prescribed form while making sale of a taxable goods.
Audit noticed that two Units30 made payment of ` 49.91 crore including VAT of ` 5.77 crore to the sub-contractors against LoI for supply of equipments (inclusive of VAT) for the construction of six sub-stations without obtaining the tax invoice or certificate issued under section 6 by Commercial Tax Department. In absence of tax invoice, chances of tax evasion could not be ruled out. The Management stated (August 2016) that the payment of VAT was made after obtaining tax invoices from the contractors/ suppliers. Reply was not acceptable as tax invoices were obtained in case of sub-stations other than above six sub-stations. Service Tax not deducted/deposited 2.2.35 Notification31 (June 2012) relating to deposit of Service Tax, applicable from July 2012, provided that in case of the services provided by other than body corporate, both the service provider and receiver were liable to deposit 50 per cent of the Service Tax each. In case of these services being provided by a corporate body, the service provider was liable to deposit the full amount of Service Tax. The Company, being a Government body, was also required to ensure the deposit of Service Tax as the liability to deposit was with the service provider. Audit noticed that:
Eight Units did not deduct ` 1.25 crore, (50 per cent of the Service Tax) from bills of the sub-contractors (other than corporate body) submitted for erection and commissioning (services) and civil construction (works contract) of sub-stations during July 2012 to March 2016.
The Units failed to ensure that 17 sub-contractors (corporate body) deposited Service Tax of ` 6.60 crore paid to them during July 2012 to March 2016.
The Units also failed to deposit Service Tax of ` 47.60 lakh with Excise Department, payable by the Units on the amount of centage (` 8.77 crore) received from the clients during 2011-12 to 2015-16.
30 Varanasi and Haridwar. 31 30/ 2012-ST dated 20 June 2012.
The Company failed to deduct service tax of ̀ 1.25 crore from the bills of the sub-contractors and ensure the deposit of service tax of ̀ 6.60 crore by the sub-contractors
Two units made payment of VAT of ` 5.77 crore to the sub-contractors without obtaining tax invoices and thus chances of tax evasion could not be ruled out
Chapter- II: Performance Audits relating to Government companies and Statutory corporations
69
The Management stated (August 2016) that as per notification32 issued by Government of India (GoI), service tax is not applicable on the works sanctioned before March 2015. Reply was not acceptable as the above works of sub stations were not exempt from service tax even earlier.
Execution of electrical parts of other deposit work
2.2.36 Twenty six Units executed 840 works of ` 2,662.26 crore, other than sub-stations and cable laying works during 2011-12 to 2015-16. Out of these, 378 works of ` 1,127.97 crore were executed by eight selected Units.
Audit examined 83 works of ` 867.30 crore executed by eight Units and findings related thereto are discussed in succeeding paragraphs. Time and cost overrun 2.2.37 A High Level Technical Committee (HLTC) constituted under the Chairmanship of Chief Secretary of GoUP directed (November 2008) that in the cases of the works where construction period was more than one year, a suitable provision for cost increase for the project period was required to be inbuilt in the estimate based on the cost index of last ten years so as to avoid cost overrun and revision of estimates. The GoUP reiterated (January 2011) the fact for making provision for cost increase in case of projects involving construction period of more than one year. Audit noticed that the Company did not make provision for cost increase in the estimates submitted to the GoUP for sanction despite directions of HLTC and GoUP. As a result, estimates of 54 works (Completed: 27 and WIP: 27) were revised during 2011-12 to 2015-16, from ` 531.06 crore to ` 747.22 crore involving cost overrun of ` 216.16 crore. The cost overrun was necessitated due to the time overrun of two years to 13 years taken in execution of the works.
The Management accepted in the Exit conference (August 2016) that HLTC directives of incorporating expected cost increase was not implemented by the Company. Procurement of material at higher rate
2.2.38 Para 30 of the Manual provides that Commercial section in the Head Office shall collect every quarter, prices in Lucknow of all common bought out items like electrical cables, wires and electrical goods. The price list of all such bought out items shall be printed in a booklet and circulated to all the field units. The Purchase Committee of the Units were required to compare the prices collected in market survey with the prices of Lucknow circulated in the booklet and record both the rates in the Purchase Committee Report (PCR) to ensure reasonability of rates. Audit noticed that rates of the electrical items were not collected and circulated by the Commercial section to the field units. In absence of the price list, the Units could not judge reasonability of rates to be awarded by them and incurred an extra expenditure of ` 2.67 crore due to purchase of electrical items at higher rate as discussed below:
The field units purchased electrical items at the rates finalised by the Joint Purchase Committee (JPC) at the zonal levels. On comparison of the rates 32 9/2016 dated 1 March 2016.
Commercial section in the Head Office did not collect and circulate rates of electrical items to ensure reasonability of rates, in absence of which the Units incurred an extra expenditure of ` 2.67 crore on purchase of material at higher rates
Audit Report on Public Sector Undertakings for the year ended 31 March 2016
70
awarded by the zones, Audit noticed that the rates awarded by JPC of Etawah zone and JPC of Haridwar and Srinagar Units for power cables and HT Power cables were higher by 6.82 per cent to 28.72 per cent than the rates of JPC of Lucknow zone. Due to this, three Units33 purchased the above material valuing ` 5.58 crore at higher rates during 2014-15 to 2015-16 and incurred extra expenditure of ` 69.57 lakh on the procurement of material.
JPCs were constituted first time in February 2014 by Etawah zone and in August 2014 by Lucknow zone for purchase of electrical items. Prior to this, purchases were made by the respective units at the rates decided by the Unit Purchase Committees. Other two electrical zones of Delhi (except Haridwar and Srinagar Units which prepared a joint PCR in June 2013) and Kanpur zones had not prepared JPCR so far (May 2016).
Since JPCs in the zones were not constituted up to February 2014/ August 2014, four Units34 purchased flexible wiring, power cables, control cables and HT Power cables valuing ` 9.72 crore during 2011-12 to January 2014 at rates higher by 0.84 per cent to 60.36 per cent than the rates subsequently finalised by JPC. This resulted in avoidable expenditure of ` 1.54 crore.
Havells, the manufacturer, reduced the rates of copper flexible wire with effect from 20 January 2015. Haridwar Unit, however, continued to purchase the above item at the old rates during February 2015 to January 2016 and incurred extra expenditure of ` 4.40 lakh on the purchase of 2,069 coils of copper flexible wire at higher rates. Audit further noticed that the Unit purchased 8,303 coils of copper flexible wires of brands Havells and KEI valuing of ` 1.90 crore during August 2014 to January 2016; whereas the wire of brand Polycab, which was of equivalent quality was available at lower rate. The purchase of wire of Havells and KEI make instead of Ploycab which were costlier resulted in extra expenditure of ` 38.94 lakh. The Management stated (August 2016) that electrical materials were purchased at the rates finalised by the purchase committee as per the procedure laid in the manual. It further stated that the rates of JPC at Lucknow were not comparable with Dehradun which was at distance of 600 km from Lucknow. Reply of the Management was not acceptable as the provisions of manual regarding collection of rates of electrical items centrally at Head Office and its circulation to the field Units for ensuring reasonability of rates were not complied with. As regards the comparability of rates between Lucknow zone and Haridwar Unit at Dehradun, the rates of Seiko make cables were same for both the places. Further, transportation was paid extra for the cables purchased by Haridwar Unit. 2.2.39 Para 101 of the Manual provides that the rates for procurement of material shall be decided on the basis of market survey. UPPCL notifies yearly stock issue rate of electrical items including transformers used for framing estimate for construction of 33 KV line and sub-station.
Audit noticed that two35 Units purchased six36 33/11 KV transformers during November 2010 to January 2015 at the rates higher than the prevailing stock 33 Etawah, Bareilly and Haridwar. 34 Varanasi, Bareilly, J.P. Nagar/ Meerut and Consultancy Unit, Ghaziabad. 35 Unit 18 Lucknow and J.P. Nagar/ Meerut.
Chapter- II: Performance Audits relating to Government companies and Statutory corporations
71
issue rates of UPPCL. The Units while evaluating the quoted rates did not ensure the reasonability of rates by comparing the rates with stock issue rates of UPPCL, which resulted in extra expenditure of ` 1.04 crore.
The Management stated (August 2016) that RESSPO rates did not include VAT. Reply was not acceptable as RESSPO rates included VAT. Inadmissible payment to sub-contractor 2.2.40 Employee’s State Insurance Corporation (Client) awarded (23 June 2011) the work of construction of ESIC Medical College, Alwar, Rajasthan with stipulated period of completion of 30 months from the date of start (10 July 2011). Therefore, the scheduled date of completion was 9 January 2014. The Company engaged J. Kumar Infraprojects Limited as sub-contractor for execution of the work at par with value of the BoQ. Audit noticed that although the client sanctioned (13 August 2015) time extension of 558 days from 10 January 2014 to 21 June 2016 with the condition that escalation would be admissible up to 342 days (10 January 2014 to 17 December 2014), the Unit claimed escalation of ` 3.09 crore from the client for the period from January 2015 to April 2015 and this was paid to the sub-contractor. Thus, the Unit made excess payment of escalation of ` 3.09 crore to the sub-contractor for a period of work which was inadmissible. The Management stated (August 2016) that ESIC approved the time extension for the completion of project and paid the escalation bills accordingly. Reply was not acceptable as time extension was allowed up to June 2016 with the restriction to pay escalation up to December 2014. In the Exit conference (August 2016), MD directed the GM concerned to check the issue and make recovery. 2.2.41 GoUP accorded (August 2007) administrative and financial sanction of ` 236.26 crore for construction of Government Allopathic Medical College, Ambedkar Nagar which was revised (March 2010) to ` 384.63 crore. The revised sanction included electrical works of ` 78.26 crore for internal electrification of the residential/ not residential buildings and other additional electrical works. The work of internal electrification was executed by awarding it to sub-contractor.
The terms of the agreement (7 October 2008) entered into with the sub-contractor provided that payment would be made for the actual plinth area executed at the Plinth Area Rates (PAR) approved by EFC, GoUP. It also provided for price escalation on the basis of revision of PAR by UPPWD subject to approval by the GoUP for the project. The escalation was to be provided upto the scheduled date of completion.
Audit noticed that Unit 18, Lucknow did not ascertain the actual executed plinth area of the buildings from the concerned civil unit and made the payment on the plinth area indicated in the sanctioned estimate. The Unit paid inadmissible escalation of ` 2.25 crore for the works executed during the period (October 2010 to December 2015) beyond the scheduled date of completion (September 2010) which was not to be paid as per provisions of the agreements. 36 Four 5 MVA and two 10 MVA.
The Company made inadmissible payment of escalation of ̀ 5.34 crore to the sub-contractors
Audit Report on Public Sector Undertakings for the year ended 31 March 2016
72
The Management stated (August 2016) that the escalation was paid according to the terms of the LoI. Reply was incorrect as LOI as well as agreement provided for payment of escalation at the revised PAR upto the scheduled date of completion. Procurement of high value items and award of works without inviting open tender
2.2.42 Rules 146 and 150 of GFR, 2005 provide that goods valuing ` 25 lakh and above should be purchased through advertised tenders. Rule 181 of GFR provides that the works of ` 10 lakh and above should be awarded through advertised tenders. Further, Para 468 and 473 of the Manual provide that in case of specialised work which the Company is not in a position to take up directly, the works of high value may be executed through sub-contract by inviting tenders in the most open and public manner. Audit noticed that eight Units, instead of inviting open tenders, purchased items of ` 19.67 crore through supply orders of ` 26 lakh to ` 1.99 crore and executed 68 works through 273 work orders of ` 173.25 crore ranging from ` 10 lakh to ` 6.28 crore on the basis of sealed quotations/ limited tenders during 2011-12 to 2015-16. The Management stated in the Exit conference (August 2016) that corrective actions had been taken to procure material/ execution of work after due tendering process.
Scheduled date of completion not fixed 2.2.43 Para 76 and 244 of the Manual provide for preparation of Bar chart based Programme Evaluation and Review Technique (PERT) for scheduling the activities, speedy completion and monitoring of the activities. It also helps in fixing of the scheduled date of completion. Audit noticed that the Company did not prepare BAR chart based PERT for the works. The scheduled date for completion of the works were neither prescribed by the client department nor fixed by the Company in consultation with the client on the basis of PERT. As a result, the Company was not able to monitor the required pace of work in absence of any scheduled targets.
The Management stated (August 2016) that completion of each work depends on the flow of funds by the Government/clients against the sanctioned cost of the work. Further, as far as possible, BAR Chart/ PERT chart were prepared and submitted by each unit to its Zone. Reply was not acceptable as the Company or its zonal office did not have any construction plan supported with BAR chart approved by the competent authority.
Irregular charge of centage 2.2.44 As per order issued (February 2009 and January 2011) by GoUP, centage was not payable on the bought out items. Audit noticed that in spite of the administrative and financial sanction accorded by GoUP after disallowing centage on bought out items, five Units37 charged centage of ` 5.68 crore on the bought out items of ` 45.46 crore and booked in eight works during the year 2011-12 to 2015-16.
37 Unit 18 Lucknow, Etawah, Varanasi, Bareilly and Haridwar.
In contravention to the GoUP orders, the company charged inadmissible centage of ̀ 5.68 crore on bought out items
Eight Units purchased items of ` 19.67 crore through supply orders and executed 68 works through work orders of ̀ 173.25 crore without inviting open tenders

Chapter- II: Performance Audits relating to Government companies and Statutory corporations
73
The Management stated in Exit conference (August 2016) that the matter was being pursued with the GoUP to make a policy decision for identifying bought out items for applicability of centage.
Excess payment of Value Added Tax 2.2.45 The GoUP reduced38 the rate of VAT on transformers and parts thereof from 14 per cent to 5 per cent effective from 19 December 2014. Audit noticed that two39 Units continued to make payment of VAT at the rate of 14 per cent instead of prevailing rate of five per cent during June 2015 to December 2015 which resulted in excess payment of VAT of ` 10.45 lakh on purchase of five transformers in two works during the period June 2015 to December 2015.
The Management stated (August 2016) that in case of Etawah unit, the transformers were supplied before the notification date and hence the reduced rate of VAT was not applicable. Reply was factually incorrect as the transformers were supplied after the notification date.
Internal control system and monitoring mechanism
2.2.46 Internal Control is a process designed to provide reasonable assurance about the efficiency of operations, reliability of financial reporting and compliance with applicable rules and regulations. Audit noticed that the internal control mechanism prevalent in the Company was deficient as instances were noticed of not remitting the amount by the field units to the Head Office of the Company, excess expenditure over fund received from the clients, execution of works without obtaining prior TS, not adhering to the prescribed tender procedures, irregular release of mobilisation and other advances, excess payment of VAT and payment of VAT without obtaining tax invoices and not deducting Service Tax from the bills of the sub-contractors as discussed in paragraphs 2.2.13, 2.2.15, 2.2.16, 2.2.21, 2.2.27, 2.2.30, 2.2.33, 2.2.34, 2.2.35 and 2.2.45.
Besides these, the following other deficiencies were also found in the internal control system.
Material consumption statements not prepared 2.2.47 Para 159 of the Manual requires that material consumption statements be prepared at the end of every financial year and at the close of the work. Audit noticed that all the eight Units did not prepare material consumption statements at the end of the financial year and also at the close of the work resulting in excess/short consumption of materials which could not be detected. The Head Office of the Company also failed to monitor and ensure preparation of material consumption statements which was indicative of weak internal control.
38 KA.NI.-2-1797/XI-9(14)/97-U.P. Act-5.2008-order-(125)-2014 dated 19 December 2014. 39 Etawah and Bareilly.
Units failed to prepare material consumption statements at the end of the financial year and at the close of the work due to which the excess/ short consumption could not be detected
Audit Report on Public Sector Undertakings for the year ended 31 March 2016
74
The Management stated (August 2016) that due to shortage of technical staff and heavy work load, the annual consumption statements were not prepared; however, instructions had been issued to the field Units for the compliance.
Clients’ accounts not closed 2.2.48 Paras 589 and 591 of the Manual provide that soon after the completion of the deposit works, the account of the concerned work shall be closed and sent to the Head Office for merger with Head Office account.
Audit noticed that although 111 works were handed over to the clients by eight Units during 2011-12 to 2015-16, its accounts were not closed so far (March 2016). Consequently, unspent balance of ` 10.77 crore was not refunded to the respective clients. The Management stated (August 2016) that the closures of accounts were under process as the units were running short of accounts staff. Reply confirmed the audit findings. Weak internal control due to shortage of manpower 2.2.49 The Manual prescribes different set of posts with different job responsibilities. The internal control weakens when the job responsibilities of different posts are performed by one officer holding multiple charges. Audit noticed that due to shortage of manpower, the internal control system was not adequate as compared to turnover and size of the Company as:
the separate job responsibilities were prescribed in the Manual for the posts of Financial Advisor, Controller of Accounts and Company Secretary. Audit noticed that responsibilities of these posts were being performed by one officer i.e. Financial Advisor; the Sub-Engineers in the field units were additionally performing the store-keeping functions due to which the internal checks of taking the material from stores after presenting proper indents were not documented; and no RE/ARE was posted in Almora and Srinagar Units to supervise the work of one to five Sub-Engineers during 2011-12 to 2015-16 and one to three Sub-Engineers in Bareilly Unit during 2011-12 to 2014-15. Internal Audit
2.2.50 Internal audit is a system designed to ensure proper functioning as well as effectiveness of the internal control system/ mechanism in the Company. The internal audit of the Company is conducted by Chartered/ Cost Accountants engaged for the purpose.
Audit noticed that the internal audit was not adequate and effective as: the percentage of internal audit of the electrical Units ranged between 9.52 per cent and 73.68 per cent during 2011-12 to 2013-14. Further, internal audit of the Head Office was not conducted during the above years out of total 347 paras pointed out in the internal audit reports, only 42 paras (12.10 per cent) were settled by the Company and 305 paras40 were outstanding as replies were not received from the field Units. This indicates lack of monitoring on the part of higher Management.
40 2011-12: 1 para; 2012-14: 67 paras: 2014-15: 237 paras.
Chapter- II: Performance Audits relating to Government companies and Statutory corporations
75
five Units41 did not furnish records in 2012-13 and 2013-14 and two Units42 did not furnish records in 2014-15 to the Internal Auditors due to which the internal audit of these Units could not be conducted. No action was taken against these Units for not furnishing the records. ‘Exception Report’ highlighting major discrepancies and serious irregularities noticed in internal audit were required to be put up to the MD under the provisions of para 156 of the Manual. The same was not prepared.
The Management stated (August 2016) that progress of compliance of internal audit paras were discussed in the audit committee meeting at regular intervals. The fact, however, remained that large numbers of paras were outstanding.
Conclusions
Audit concluded that:
planning of the Company was deficient as the Company failed to fix the targets and prepare budget in accordance with provisions of Manual, ensure subletting of works within the prescribed limit, obtain TS prior to start of the works, allocate the works to the units prudently and recruit the required manpower. The Financial Management was also weak as the Company could not utilise the available funds, restrict expenditure up to the amount of fund received from the clients and was deprived of potential interest of ` 9.57 crore due to not availing of flexi facility in its bank accounts;
the Company started the works without obtaining financial sanctions of the clients and did not adhere to the provisions of the Manual, CVC guidelines and provided undue benefits of interest of ` 21.90 crore to sub-contractors by allowing interest free mobilisation advance, providing inadmissible price escalations of ` 5.36 crore and procurement of material and award of works at higher rates by ` 87.62 crore;
the Company did not make provision for cost increase in the estimates despite directions of HLTC and GoUP. As a result, estimates of 54 works were revised during 2011-12 to 2015-16 involving cost overrun of ` 216.16 crore. The cost overrun was necessitated due to the excessive time of two years to 13 years taken in execution of the works; and
the internal control and monitoring system was inadequate and ineffective as the Company failed to deduct Service Tax of ` 1.25 crore from the bills of the sub-contractors. It also failed to ensure preparation of material consumption statements and closure of accounts by the field units. Internal audit was not adequate and effective as it did not cover audit of the Head Office and of all units.
Recommendations
Audit recommends that:
the Company should adhere to the provisions of the Manual for fixing of targets and preparation of budget, subletting of works up to the prescribed limit, obtaining technical sanction, allocation of work among 41 Electrical Units 17 Lucknow, 17 A Lucknow, 1 Lucknow, Varanasi and J.P. Nagar/
Meerut. 42 Electrical Unit Noida-2 and Faridabad.
Audit Report on Public Sector Undertakings for the year ended 31 March 2016
76
units prudently keeping in view the distance of the sites, recruit adequate manpower, utilise the available funds optimally, restrict expenditure up to the amount of fund received from the clients and avail flexi facility for the bank accounts;
the Company should start the works after obtaining financial sanctions of the clients and adhere to the provisions of the Manual and CVC guidelines for allowing interest free mobilisation advance, providing price escalations, conduct market survey and do a proper analysis prior to procurement of material and award of contracts and comply with directives of HLTC to avoid time and cost overrun; and
the Company should ensure that the field units adhere to the provisions of the Manual for preparation of material consumption statements and closure of accounts. Internal audit should cover the audit of Head Office and of all field units and corrective action should be taken on the observations of internal audits.
Audit Report on Public Sector Undertakings for the year ended 31 March 2016
76
2.3 Audit on Metering System in Dakshinanchal Vidyut Vitran Nigam Limited
Introduction
2.3.1 Dakshinanchal Vidyut Vitran Nigam Limited (Company), incorporated in August 2003 under the Companies Act, 1956, works with an objective of distribution of electricity in 21 districts of Uttar Pradesh under the functional control of Uttar Pradesh Power Corporation Limited (UPPCL).
In power distribution system, ensuring metered supply of power is of utmost importance to prevent pilferage/theft of energy. This also helps in the correct assessment of revenue to be realised from the consumers. The Electricity Act, 2003 provides that no licensee shall supply electricity except through installation of a correct meter. The Company had total 22.80 lakh consumers at the end of March 2012 which increased to 32.29 lakh consumers at the end of March 2016. With a view to assess whether procurement, installation, periodical checking of meters and assessment of revenue based on the consumption recorded in the meter have been done efficiently, effectively and economically, an audit was conducted (November 2015 to April 2016) covering the period from 2011-12 to 2015-16.
The system for procurement, installation, checking of meter, its reading and bill generation has been detailed in Annexure 2.3.1.
The records related to procurement of meters were examined at Material Management (MM) wing and four Electricity Store Divisions (ESDs) of the Company. The records related to installation, performance of meters and assessment of energy were examined in selected four Electricity Distribution Circles1 (EDCs), four Electricity Test Divisions (ETDs)2, and 12 Electricity Distribution Divisions (EDDs)3, out of total 16 EDCs, 18 ETDs, and 58 EDDs respectively. The units were selected on the basis of Stratified Simple Random Sampling Method. The methodology adopted for attaining the audit objectives consisted of explaining audit objectives to top management in the Entry conference held on 22 February 2016 and raising of audit queries. An Exit conference was held on 29 July 2016 with the Management and replies of the Management were received in July 2016 which had been duly considered. Reply of the Government was awaited (October 2016).
Audit findings
2.3.2 On the basis of detailed audit scrutiny of the records of MM wing and selected Circles/Divisions of the Company, the audit findings are discussed in the succeeding paragraphs. 1 Electricity Distribution Circles Agra, Kanpur, Mainpuri and Etawah. 2 Electricity Test Divisions Agra, Kanpur, Mainpuri and Etawah. 3 Electricity Distribution Divisions (EDD) I Agra, EDD II Agra, EDD Fatehabad, EDD Akabarpur, EDD Chaubepur, EDD I Mainpuri, EDD II Mainpuri, EDD II Etawah, EDD Auraiya, EDD I Hathras, EDD II Hathras and EDD III Hathras.
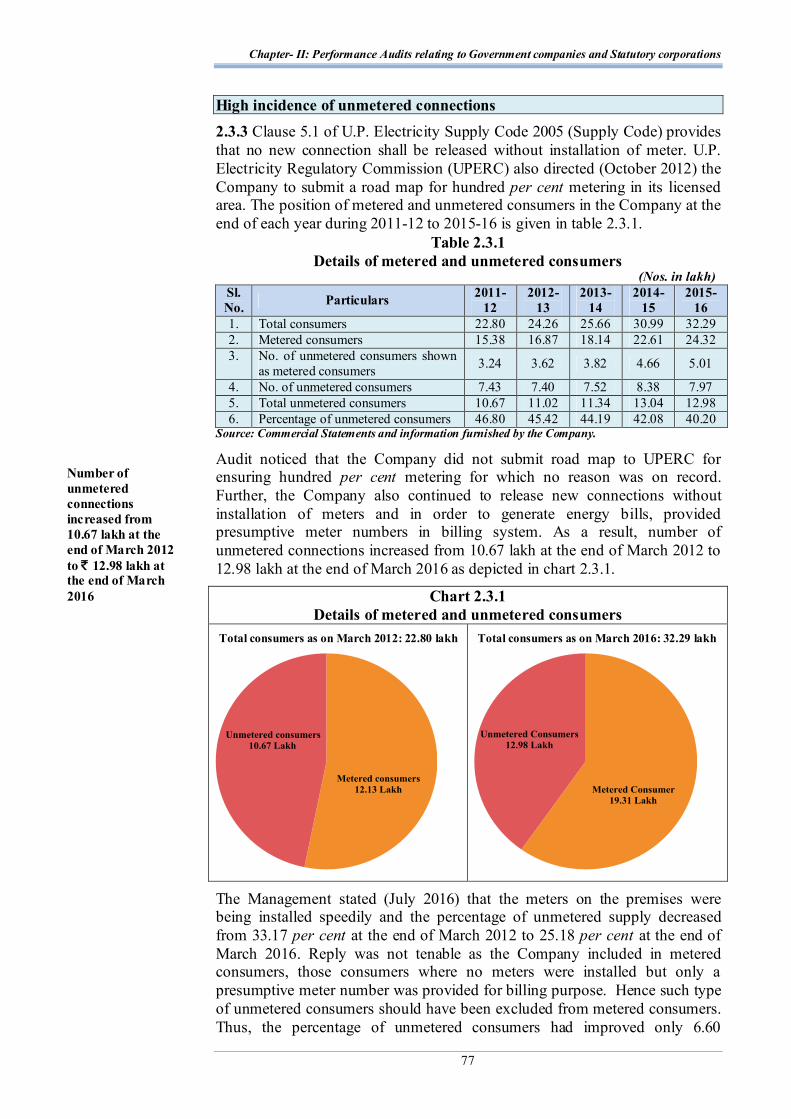
Chapter- II: Performance Audits relating to Government companies and Statutory corporations
77
High incidence of unmetered connections 2.3.3 Clause 5.1 of U.P. Electricity Supply Code 2005 (Supply Code) provides that no new connection shall be released without installation of meter. U.P. Electricity Regulatory Commission (UPERC) also directed (October 2012) the Company to submit a road map for hundred per cent metering in its licensed area. The position of metered and unmetered consumers in the Company at the end of each year during 2011-12 to 2015-16 is given in table 2.3.1.
Table 2.3.1 Details of metered and unmetered consumers
(Nos. in lakh) Sl. No. Particulars 2011-
12 2012-
13 2013-
14 2014-
15 2015-
16 1. Total consumers 22.80 24.26 25.66 30.99 32.29 2. Metered consumers 15.38 16.87 18.14 22.61 24.32 3. No. of unmetered consumers shown
as metered consumers 3.24 3.62 3.82 4.66 5.01
4. No. of unmetered consumers 7.43 7.40 7.52 8.38 7.97 5. Total unmetered consumers 10.67 11.02 11.34 13.04 12.98 6. Percentage of unmetered consumers 46.80 45.42 44.19 42.08 40.20
Source: Commercial Statements and information furnished by the Company.
Audit noticed that the Company did not submit road map to UPERC for ensuring hundred per cent metering for which no reason was on record. Further, the Company also continued to release new connections without installation of meters and in order to generate energy bills, provided presumptive meter numbers in billing system. As a result, number of unmetered connections increased from 10.67 lakh at the end of March 2012 to 12.98 lakh at the end of March 2016 as depicted in chart 2.3.1.
Chart 2.3.1 Details of metered and unmetered consumers
Total consumers as on March 2012: 22.80 lakh
Total consumers as on March 2016: 32.29 lakh
The Management stated (July 2016) that the meters on the premises were being installed speedily and the percentage of unmetered supply decreased from 33.17 per cent at the end of March 2012 to 25.18 per cent at the end of March 2016. Reply was not tenable as the Company included in metered consumers, those consumers where no meters were installed but only a presumptive meter number was provided for billing purpose. Hence such type of unmetered consumers should have been excluded from metered consumers. Thus, the percentage of unmetered consumers had improved only 6.60
Number of unmetered connections increased from 10.67 lakh at the end of March 2012 to ̀ 12.98 lakh at the end of March 2016
Audit Report on Public Sector Undertakings for the year ended 31 March 2016
78
per cent over a period of five years. Further, reply of the Management was silent about not submitting the roadmap to UPERC.
Procurement of meters 2.3.4 The MM wing of the Company assesses the total quantity of meters to be procured based on the annual requirement (AR) of meters received from ESC. After approval of the Board of Directors (BOD) for procurement of meters, the MM wing invites open tenders and finalises the same with the approval of Corporate Stores Purchase Committee (CSPC) of the Company.
The Company had (March 2016) 15 categories of 32.29 lakh consumers, out of which 12.98 lakh consumers were unmetered. Of these unmetered consumers, 12.80 lakh consumers (99 per cent) pertained to LMV-1 (domestic), LMV-2 (commercial) and LMV-5 (private tube well). The audit, therefore, focused on procurement of meters (single phase and three phase meters) required for these three categories of consumers.
The Company invited 18 tenders for procurement of 9.90 lakh meters during 2011-12 to 2015-16. Out of this, eight tenders were finalised for procurement of 9.56 lakh (98 per cent) single and three phase meters. The deficiencies noticed in audit regarding procurement of meters are discussed in succeeding paragraphs. Deficient planning for procurement of meters
2.3.5 As per the provisions of Supply Code and directives of UPERC, all connections should have been metered. It is also imperative in view of the fact that the Company recovers full cost of meter from the consumers at the time of release of connection. In order to achieve the target of 100 per cent metering, proper assessment of quantity of meters to be purchased was of utmost importance and should have been based on the number of existing unmetered connections, likely defective meters and new connections to be released. The year-wise position of total requirement of meters, planned for procurement, actually procured and short procurement is as per Annexure-2.3.2. The summarised position of the requirement, planned and short procurement is as shown in table 2.3.2.
Table 2.3.2 Total requirement of meters and planned for procurement
(in numbers)
Year Total requirement
Planned for procurement
Actually Procured
Short procurement against total requirement
2011-12 1315925 45000 355204 960721 2012-13 1153911 180000 222568 931343 2013-14 1116948 98005 200235 916713 2014-15 1484964 185689 442214 1042750 2015-16 1371956 525000 561326 810630
Source: Figures worked out by Audit and information furnished by the Company.
Analysis of Annexure-2.3.2 and table 2.3.2 revealed as under:
the planning for procurement of meters was deficient as MM wing and Store Circle of the Company assessed the requirement of meters to be procured without working out the number of existing unmetered consumers, defective meters to be replaced and also new connections. Against the total

Chapter- II: Performance Audits relating to Government companies and Statutory corporations
79
requirement of 11.17 lakh to 14.85 lakh, the Company planned the procurement of 0.45 lakh and 5.25 lakh meters during 2011-12 to 2015-16 without specifying any reasons as depicted in chart 2.3.2.
Chart 2.3.2 Requirement, planning and shortfall in procurement of meters
though the actual procurement of meters was more than the planned number of meters, it was always less than the actual requirement leading to short procurement of meters ranging between 8.11 lakh and 10.43 lakh during the five years ending March 2016. Consequently, 12.80 lakh consumers of LMV-1, 2 and 5 categories were lying unmetered as of March 2016.
The Management stated (July 2016) that meters ranging between 0.56 lakh and 2.38 lakh were in stock at the end of each year during 2011-12 to 2015-16 and installation and replacement of meters were cyclic processes going on throughout the year. Reply did not address the issue and the reasons for failure to plan leading short procurement of meters against the requirement.
Delay in finalisation of tenders 2.3.6 As per prudent practice for procurement, the Company should ensure that tenders are finalised before start of the financial year so that required quantity of meters can be procured timely to meet out the annual requirement.
Audit noticed that the Company invited eight tenders for procurement of 9.56 lakh single and three phase meters during 2013-14 to 2015-16, out of which only two tenders for 2,75,000 meters were invited before start of the financial year 2015-16 and finalised timely. In respect of remaining six tenders, the Company initiated the tender invitation process with delay of three to four months without any reasons on record. This resulted in delayed finalisation of tenders by six to nine months after start of each financial year (Annexure-2.3.3).
Deficient planning in procurement led to short procurement of meters ranging between 8.11 lakh and 10.43 lakh during the five years ending March 2016
Audit Report on Public Sector Undertakings for the year ended 31 March 2016
80
The Management stated (July 2016) that before finalising the tender, sample meters were to be sent for testing in accredited meter test lab which took time for 10 to 15 days. Reply did not address the issue as to why the Management delayed initiating the tender invitation process, which was the main reason for delay in finalisation of tenders. Procurement of meters at higher rate 2.3.7 The Company finalised the tender and issued (November 2013) purchase orders for procurement of 90,000 single phase meters at the rate of ` 936 per meter against tendered quantity of 1.50 lakh meters which were valid up to May 2014. The Company further placed (1 July 2014) supplementary orders on the existing firms for supply of 1.35 lakh single phase meters at the same rates after expiry of validity period of the tender finalised in November 2013. Audit noticed that the trend of the prevailing market price of the single phase meter was declining as it reduced from ` 1,036 in June 2012 to ` 936 in November 2013 and ` 909 per meter in May 2014. Considering the declining trend of rates, the Company should have purchased the meters after inviting fresh tenders to get competitive rates instead of placing the order for purchase of 1.35 lakh single phase meters at the old rates of seven months before. Audit further noticed that the Company finalised (September 2014) a rate of ` 884 per meter against the tender invited in July 2014. It established the fact that the rates further declined to ` 884 per meter in July 2014 when the Company had placed the order for 1.35 lakh meters at the rate of ` 936 per meter. This led to purchase of meters at higher rate.
Similarly in another case, the Company placed (August 2015) a supplementary order for purchase of 1.25 lakh single phase meters at old rate of ` 855 per meter against tender finalised in May 2015. Audit noticed that the Company again, ignoring the prevailing market price of ` 783 per meter as finalised (June 2015) by the sister concern i.e. Paschimanchal Vidyut Vitran Nigam Limited (PVVNL) placed the order for purchase of 1.25 lakh single phase meters at old higher rate whereas the Company was in process to finalise (August 2015) a fresh tender. As per the price bid opened in September 2015, the lowest rate found was ` 762 per meter. Thus, due to placing supplementary orders for purchase of 2.60 lakh single phase meters at old rates instead of inviting fresh tenders to get benefit of declining market trend led to procurement of meters at higher rates and ultimately loss to the Company for ` 1.86 crore4. The Management stated (July 2016) that the Company had finalised the tender prior to date of tender being finalised by the sister concern (PVVNL). Reply did not address the issue as the Company failed to consider the decreasing trend in meter prices which was vindicated by the lower rate finalised in tender called for at the time of issue of supplementary orders.
Failure in replacement of the damaged meters under guarantee period 2.3.8 The terms and conditions of the agreements executed by the MM wing upto 2015-16 for supply of meters provided that the manufacturer shall undertake guarantee to replace the meters found defective/inoperative within a 4 [1,35,000 single phase meters X ` 52 per meter] + [1,25,000 single phase meters X ` 93 per meter] = ` 1.86 crore.
Placing supplementary orders for purchase of 2.60 lakh single phase meters at old rates led to loss to the Company for ` 1.86 crore
Chapter- II: Performance Audits relating to Government companies and Statutory corporations
81
period of 66 months from the date of supply or 60 months from the date of commissioning whichever is earlier. Audit noticed in selected ETDs that 20,525 single phase meters and 2,932 three phase meters (Annexure-2.3.4) valuing ` 2.44 crore5 were taken out from the consumers’ premises during 2007-08 to 2013-14 and declared as damaged as these meters showed defect of “No Display”. The meters were found defective within the guarantee period of five years but the ETDs did not take any action to get the damaged meters replaced from the supplier firms. This resulted in loss of ` 2.44 crore to the Company.
The Management stated (July 2016) that the meters got defective due to external fault and the cost of defective meters was charged from the consumers. Reply was not tenable as audit had pointed out only those meters which got defective due to internal fault and were covered under guarantee. Further, recovery of cost of these defective meters from the consumers was undue burden on consumers. Therefore, these defective meters should have been got replaced from the firms instead of charging the repair cost to consumers. Meters lying unutilised 2.3.9 The Company purchased 24,011 static single phase meters valuing ` 1.84 crore and 23,742 three phase meters valuing ` 4.59 crore during 2002 to 2005. In the meantime, U.P. Power Corporation Limited (holding Company) directed (September 2004) that electronic meters be installed; hence, these meters could not be used and are lying in ESDs. Audit noticed that the Company, even after a lapse of more than 10 years, did not take any decision to make alternate use of such meters like its installation in the rural areas where huge numbers of unmetered connections were existing and ad-hoc billing was being done. Thus, due to the failure to take any action for disposal/making alternate use of the meters, they remained unused for more than ten years and led to blockade of fund of ` 6.43 crore.
The Management stated (July 2016) that the meters could not be utilised due to old technology. Reply was not tenable as the Management did not specify the reasons for not initiating any action for disposal/alternate use of these meters even after lapse of ten years. Loss due to not procuring replaceable covers for meters 2.3.10 The Company has been procuring single and three phase meters with covers. At the time of installation of meter, the cover is locked and then it becomes un-detachable. In case cable is disconnected from the meter due to any reason, cover has to be invariably broken to connect the cable and meter cover needs to be replaced with new one.
Audit noticed that the Company had taken out 2,92,398 single phase and 10,640 three phase meters during 2011-12 to 2015-16 and declared it as damaged despite these being in functional condition because replaceable covers were not being purchased by the Company. However, the Company started procuring the replaceable covers from October 2015.
5 Single phase meters = 20525 nos. X ` 855 per meter = ` 1.76 crore. Three phase meters
= 2932 nos. X ` 2327.76 per meter = ` 0.68 crore.
Due to not having a system for procurement of replaceable meter covers for damaged covers despite meters being functional, an avoidable expenditure of ̀ 21.64 crore was incurred on replacement of 3,03,038 single/three phase meters
Audit Report on Public Sector Undertakings for the year ended 31 March 2016
82
Thus, due to not procuring replaceable meter covers, an avoidable expenditure of ` 21.64 crore (after adjusting ` 6.12 crore being value of covers) was incurred on replacement of 3,03,038 single/three phase meters. The Management stated (July 2016) that replaceable covers had been procured and meters so removed were being reused by using replaceable covers. Reply did not address the issue as to why procuring replaceable coveres were not procured for damaged meters up to October 2015.
Installation, replacement and testing of meters 2.3.11 The work of installation of meters in the premises of consumers and replacement of defective meters with new ones is performed by ETDs on the advice of EDDs. Deficiencies in respect of installation and replacement of meters are discussed in succeeding paragraphs.
Installation of meters on distribution transformers 2.3.12 The UPERC directed (2012) the Distribution companies (DISCOMs) to install meters on Distribution Transformers (DTs) for identifying theft prone areas and to take corrective measures to reduce line losses. Deficiencies noticed in respect of meters on DTs are discussed below:
Out of 26,133 DTs in selected Test Divisions, 17,846 DTs (68 per cent) were without meters as of March 2016, which indicated that the concerted efforts were not made by the Company to comply with the orders of UPPCL to mitigate line losses.
In case of 8,287 DTs, where meters were installed, monthly readings of only 468 DTs (six per cent) were being taken and in respect of other 7,819 meters, no arrangement was made for taking meter reading and making use of these readings. Thus, the expenditure of ` 1.54 crore incurred on installation of 7,819 meters did not yield any result. The Management did not furnish any reply on this issue. Deficiencies in double metering system
2.3.13 UPPCL directed (August 2005) the DISCOMs to install a meter (referred to as double meter) outside the premises of the consumers (having load of 10 KVA and above) in addition to the meter installed in the premise of the consumer (main meter) to ensure accuracy of reading of main meter. Audit noticed that out of total 5,135 consumers (having load of 10 KVA and above) in selected ETDs as of March 2016, double meters were installed for 4,208 consumers (82 per cent). However, meter readings were being taken only for 2,955 consumers (70 per cent). Therefore, the very purpose of installation of double meters to prevent line losses/theft of energy could not be achieved. The Management stated (July 2016) that the work of double metering was in progress. Reply was self explanatory that double metering had not been completed so far (August 2016). Further, the Management did not furnish any reason for not taking reading of all consumers where double meters had been installed.
Chapter- II: Performance Audits relating to Government companies and Statutory corporations
83
Slow replacement of defective meters 2.3.14 Clause 5.6 (C) (ii) of Supply Code provides that, in case the meter is found defective by the Licensee, the meter shall be replaced by a new meter within 15 days and a provisional bill may be issued on the basis of the average consumption of the previous three billing cycles. However, provisional billing should not extend to more than two billing cycles at a stretch. Audit noticed that 38,845 meters of LMV-1, 2 and 6 category of consumers of selected EDDs were found to be defective at the end of March 2012 which increased to 77,587 at the end of March 2016. The main reason attributable to slow replacement of defective meters was insufficient procurement of meters as discussed in paragraph 2.3.5. This indicated that the Company failed to comply with the provisions of Supply Code regarding timely replacement of defective meters and to restrict the provisional billing. The Management stated (July 2016) that due to shortage of staff the work of replacement could not be done. Reply was not tenable as the work of replacement of meters was also awarded to outside agencies, hence, shortage of staff was not an issue.
Cost of replacement of meters not realised 2.3.15 As per Clause 5.4 (C) of the Supply Code, if meter is supplied by the Licensee, including replacement of electromechanical meters, the cost of meter may be realised as specified in cost data book. As the installation/ replacement of meters is entrusted with the ETDs and billing with EDDs, the cost of meters was to be charged by EDDs on the advice of ETDs. Audit noticed that 32,003 electromechanical meters were replaced with new electronic meters by the selected ETDs during 2011-12 to 2015-16. However, the cost of only 2,931 meters against 32,003 replaced meters was recovered by the EDDs as the ETDs did not advise for recovery of cost of remaining 29,072 replaced meters. Thus, due to failure of the communication by the ETDs, recovery of ` 3.34 crore6 in respect of replacement of 29,072 electromechanical meters could not be made from the consumers. The Management stated (July 2016) that the electromechanical meters were replaced by the Department for system improvement and charges were recovered in case where the meters were found defective. Reply was not tenable as the cost for replacement of electromechanical meters was to be recovered from the consumers as per the provisions of Supply Code.
Periodical inspection of meters 2.3.16 Clause 5.5 of the Supply Code provides for inspection of single phase meters once in five years, three phase LT meters once in two years and HT meters once in a year to monitor the accuracy of meters and prevent the line losses. Audit noticed that the selected ETDs carried out periodical checking of 841 single phase LT meters (0.26 per cent), 444 three phase LT meters (1.21 per cent) and 1,451 HT meters (27.66 per cent) against required number of 3,22,367, 36,669 and 5,245 meters respectively to be checked during 2011-12 to 2015-16 (Annexure-2.3.5). This indicated that monitoring of meters to
6 29072 X `1150 per meter cost = ` 3.34 crore.
Out of 32,003 electromechanical meters replaced with new electronic meters, the cost of only 2,931 meters was recovered
Audit Report on Public Sector Undertakings for the year ended 31 March 2016
84
judge the accuracy of meters was ignored by the Company whereas the inspection mechanism needed to be strengthened by the Company in view of huge line losses.
The Management stated (July 2016) that due to shortage of staff periodical testing of consumers’ meters could not be done. Reply was not tenable as the issue of shortage of staff was to be addressed by the Management. Testing of meters by outside agencies
2.3.17 The MM wing of the Company placed (July 2014) work order on Yadav Measurement Private Limited (YMPL), Udaipur for testing/checking of 1,00,000 single phase meters at the rate of ` 205 each and 14,300 three phase meters at the rate of ` 340 each.
Audit noticed that:
the UPERC in its tariff order for 2013-14 prescribed ` 50 per meter for recovery from the consumer as meter checking and testing charges from the consumer. The Company, however, without considering the rate prescribed by the UPERC, finalised the tender and awarded the work of meter testing/checking to YMPL at exorbitantly higher rate of ` 205 (300 per cent) for each single phase meter and ` 340 (580 per cent) for each three phase meter. Reason for not considering the rates prescribed by the UPERC, while finalising the rate for outside agency, were not mentioned. Thus, award of work to an agency without considering the rate prescribed by the UPERC for meter testing led to extra expenditure of ` 1.96 crore7.
the Company awarded (July 2014) the work of meter testing of 1.14 lakh consumers against 14.32 lakh metered consumers as of March 2014 without specifying any basis for selecting the consumers to be checked. In absence of any basis/criteria, YMPL on the basis of master data of the consumers checked the consumers randomly on its own and reported 94 per cent meters as OK. For a more correct assessment, the Company should have specified to the firm the criteria, consumer list or high risk meters/consumers to be tested.
The Management stated (July 2016) that the charges prescribed by UPERC were for testing of new meters which could not be compared with the rates awarded for checking and testing of existing meters installed at consumers’ premises. Reply was not acceptable as the charges prescribed for checking and testing of meters by UPERC in tariff order were not applicable only for checking and testing of new meters.
Meter reading and bill generation 2.3.18 The generation of monthly bills as per correct meter reading and accountal of actual consumption of energy is the prime objective of an effective metering system. The Company has been carrying out the work of meter reading through the departmental staff and outside agencies. The deficiencies related to meter reading and bill generation are discussed below: High incidence of ad-hoc billing of metered consumers 2.3.19 Clause 5.6 and 6.2 of the Supply Code provide that provisional billing should not extend to more than two billing cycles at a stretch in case of meter 7 Higher rate of single phase meters = 1,00,000 X higher rate of ` 155 = ` 1.55 crore Higher rate of single phase meters = 14,300 X higher rate of ` 290 = ̀ 0.41 crore.
Award of work for meter testing and checking to an agency without considering the rate prescribed by the UPERC led to extra expenditure of ` 1.96 crore

Chapter- II: Performance Audits relating to Government companies and Statutory corporations
85
being defective or when meter reading was not available/accessible so as to minimise provisional billing. The status of billing based on meter reading and on ad-hoc basis of domestic (LMV-1), commercial (LMV-2) and small and medium power consumers (LMV-6) in respect of 12 EDDs during 2011-12 to 2015-16 is shown in Annexure-2.3.6. Audit noticed that the provisional billing against meters shown as defective or not available/accessible was as high as 93,002 (40 per cent) against 2,32,323 metered consumers in 2011-12 which further increased to 2,06,298 (46 per cent) against 4,43,703 metered consumer in 2015-16. Audit further noticed that billing of consumers based on actual consumption of energy recorded by the meter was as low as 25.13 per cent in 2011-12 and 34.89 per cent in 2015-16 when compared with the total 5,54,291 (metered and unmetered) consumers in 2011-12 and 6,80,419 in 2015-16. The high incidence of ad-hoc billing by the Company was indicative of failure of adequate procurement of meters and monitoring. Besides, it was also a violation of the provisions of Supply Code for correct billing of consumers on actual consumption basis. The Management accepted (July 2016) the audit observation and stated that the work of replacement of defective meters was in progress. Award of the work at higher rate
2.3.20 The MM wing of the Company invited (November 2012) Circle wise open tenders for awarding the work of door to door meter reading by handheld machines and bill generation etc. in the area of EDC Etawah, Hathras, Mathura, Aligarh, EUDC, Aligarh and EUDC, Mathura. The LOIs were issued to the firms during May 2013 to August 2013. The particulars of invitation of tenders, its finalisation and rates awarded are summarised in table 2.3.3.
Table 2.3.3 Details of award of work
Sl. No.
Name of the circles
Date of inviting tender
Date of opening price bid
Date of LOIs issued
Tendered quantity (in nos.)
Rate awarded (̀ per unit)
Extra Expenditure (in `)
1 EDC Etawah 10-11-12 27-02-13 08-08-13 -- 6.23 (Lowest
rate)
--
2 EDC Hathras 27-12-12 07-03-13 15-05-13 2937600 8.40 6374592 3 EDC Mathura 08-12-12 07-03-13 31-07-13 2712600 8.50 6157602 4 EDC Aligarh 10-11-12 27-02-13 19-08-13 711000 8.50 1613970 5 EUDC Aligarh 10-11-12 27-02-13 29-08-13 3594924 8.50 8160477 6 EUDC
Mathura 10-11-12 07-03-13 31-07-13 2987532 7.95 5138623
Total 12943656 27445264 Source- Information furnished by the Company.
Audit noticed that the scope of the work in all Circles was same but the rates awarded were higher by 28 per cent to 36 per cent when compared with the lowest rate of ` 6.23 per unit awarded for EDC Etawah. The MM wing, however, did not make inter-Circle comparison of the rates while evaluating the tenders so as to get the work done at economical rates.

Audit Report on Public Sector Undertakings for the year ended 31 March 2016
86
Thus, failure of the MM wing in making inter-Circle comparison of offered rates and negotiating with L-1 firms in the light of the rate (` 6.23 per unit) finalised for EDC Etawah, led to award of work at higher rates. This resulted in extra expenditure of ` 2.74 crore on 1,29,43,656 bills raised by the firms during the period from April 2013 to March 2016. The Management stated (July 2016) that the rates of billing actually depend on various conditions such as geographical area, density of consumers etc. Reply was not tenable as the reasons stated above were not recorded while awarding the work at higher rate. Rather, the higher rates were awarded due to absence of inter-Circle comparison of rates offered by the tenderers. Excess payment to the contractor for bill generation
2.3.21 The work of door to door meter reading and bill generation etc. was awarded (August 2013) to Vaibhu Infratech Private Limited in the area of EDC, Kanpur and Tera Software Limited in the area of EDC Etawah and Mainpuri for the contract period of 36 months. Clause 5.26.1 of the agreement stipulated that the payment per consumer would be made based on complete activities and in case of defective meters reported or meter not installed, payment at the rate of 50 per cent of the rate awarded for meter reading (` 6.23 to ` 7 per consumer ) would be made.
Audit noticed that 40,71,500 consumers out of total 54,11,228 consumers were billed by the firms in six EDDs on provisional basis as either their meters were defective or meters were not installed. As per terms of the agreement, payment to the firms was to be made at half of the rates awarded for meter reading. The EDDs, however, made the payment at full rates resulting in excess payment of ` 1.48 crore (Annexure-2.3.7) during the period from 2013-14 to 2015-16.
The Management stated (July 2016) that the excess payment made to contractor was being recovered from the contractors. Reply was not tenable as recovery of excess payment made to the contractor had not been done so far (October 2016). Deficiencies in billing of metered consumers under LMV-7 2.3.22 The various connections of Tank Type Stand Post (TTSP) under Pay Jal Yojna (having load of 2 KW per connection) were released by EDDs during 2011-12 to 2015-16. Audit noticed that:
there were 2,708 consumers of TTSP in four EDDs where the supply was being fed as per urban schedule. These consumers were shown as metered consumers but meters were not installed. Due to not installation of meters the consumers were provisionally billed on the basis of 100 units/KW per month only during April 2014 to March 2016. The Company, however, did not take any action to install the meters in premises of 2,708 consumers even after lapse of two years so that correct bill on actual consumption could be raised and revenue realised. The Management stated (July 2016) that the billing of TTSP consumers was being done under metered category. Reply was not tenable as the billing was being done under metered category by booking provisional units as meters were not installed.
the 161 metered consumers of TTSP in EDD, Auraiya were energised during 2013-14 but the ledgerisation and billing of these consumers was not
Failure to make inter-circle comparison of offered rates by MM wing led to extra expenditure of ` 2.74 crore
The payment made at full rates for provisional meter reading and bill generation resulted in excess payment of ` 1.48 crore
Chapter- II: Performance Audits relating to Government companies and Statutory corporations
87
started so far (March 2016). Consequently, the Company suffered loss of revenue of ` 50.77 lakh during 2014-15 and 2015-16. The Management accepted (July 2016) the audit observation and stated that the ledgerisation and billing of the TTSP consumers of EDD Auraiya was under progress. Billing of private tube well consumers under rural schedule instead of urban schedule 2.3.23 Rate Schedule LMV-5 applicable to private tube well (PTW) consumers provided separate rate of charge for consumers getting supply as per rural schedule8 and other consumers getting supply as per urban schedule1 (metered supply). The rate of charge for consumers getting supply as per urban schedule was higher than that prescribed for consumers getting supply as per rural schedule. Audit noticed that 8,462 to 9,301 consumers under the jurisdiction of EDD-I and II, Mainpuri were getting supply as per urban schedule during April 2013 to March 2016. The consumers, however, were billed as per rate applicable to rural schedule, whereas, these consumers should have been billed as per rate applicable to urban schedule.
As a result, the consumers were short assessed by ` 17.81 crore9 (Annexure-2.3.8) during the period from April 2013 to March 2016. The Management stated (July 2016) that the consumers in the area of Mainpuri were getting extra supply but through rural feeders. Reply was not tenable as the consumers were getting supply as per urban schedule, hence, the consumers should have been billed at the rates prescribed for urban schedule in rate schedule.
Conclusion
Audit concluded that:
the Company continued to release new connections without installation of meters in contravention of provision of the Electricity Act, 2003 as a result 12.98 lakh consumers (40.20 per cent) remained unmetered as of March 2016; the Company considered many unmetered consumers also as metered after providing presumptive meter numbers; the Company declared 3.03 lakh functional meters as damaged for want of meter covers and incurred avoidable expenditure of ` 21.64 crore on replacement of these meters; the Company failed to replace the meters valuing ` 2.44 crore damaged under guarantee period; the Company placed the orders for procurement of meters, awarded work of meter testing and meter reading without considering the prevailing market price, the rates of which were lower which led to loss of ` 6.56 crore;
8 Rural schedule means the supply of electricity through feeders restricted to ten hours
a day and if supply of electricity is more than ten hours a day is considered as urban schedule.
9 Worked out at differential rates applicable to rural schedule and urban schedule
PTW consumers getting supply as per urban schedule were short assessed by ` 17.81 crore due to levy of charges applicable for rural schedule
Audit Report on Public Sector Undertakings for the year ended 31 March 2016
88
the periodical inspection of meters carried out by the Company was as low as 0.26 per cent to 1.21 per cent of prescribed quantum which led to huge number of defective meters and high incidence of ad-hoc billing; and excess payment to contractors for the work of meter reading and bill generation and incorrect billing of private tube well consumers led to loss of ` 22.03 crore. Recommendations Audit recommends that: the Company should plan the procurement of meters to comply with the requirement of the Electricity Act, 2003 to provide hundred per cent metering and procure accordingly so that the meters could be installed for all connections; the Company should procure sufficient quantity of replaceable covers for meters to avoid declaration of meters damaged for want of such covers; the Company should take necessary action to return and replace the meters damaged under guarantee period; the Company, while placing the additional orders for procurement of meters and awarding the work of meter reading, should take the notice of decreasing price trend and do inter-Circle comparison of rates so that benefit of lower prices can be availed; the mechanism for periodical inspection of meters should be strengthened in the light of provisions in Supply Code to avoid high incidence of ad-hoc billing and reduce line losses; and the excess payment to the contractors should be recovered and billing of private tube well consumers should be done under applicable tariff to avoid loss of revenue.

Chapter- II: Performance Audits relating to Government companies and Statutory corporations
89
2.4 Audit on Construction of solid waste management system in selected cities by Construction and Design Services wing of Uttar Pradesh Jal Nigam
Introduction
2.4.1 Uttar Pradesh Jal Nigam (Nigam) was incorporated in June 1975 as a Statutory Corporation under the Uttar Pradesh Water Supply and Sewerage Act, 1975 with the basic objectives of development and regulation of water supply and sewerage services and for matters connected therewith in the State. The administrative control of the Nigam is with the Urban Development Department, Government of Uttar Pradesh (GoUP). The Nigam, with a view to diversify its activities, set up a commercial wing named “Construction and Design Services” (C&DS) in April 1989. The C&DS was declared as an approved construction agency by the GoUP in June 1991. The organisational structure of C&DS is given in Annexure-2.4.1. The Municipal Solid Waste (Management and Handling) Rules, 2000 notified (September 2000) by the Government of India (GoI) designated the Urban Local Bodies (ULBs) to regulate management and handling of municipal waste in their areas. The GoI sanctioned (September 2006 to January 2011) ` 419.61 crore, under Jawaharlal Nehru National Urban Renewal Mission (JNNURM), for construction of 271 Municipal Solid Waste Management (MSWM) projects in the State of Uttar Pradesh. The Government of Uttar Pradesh (GoUP) nominated (December 2007) Uttar Pradesh Jal Nigam as the executing agency for execution of these projects. The Nigam decided (March 2008) that these projects would be executed by its C&DS wing. The C&DS decided (April 2008) to execute the MSWM projects on Public-Private-Partnership (PPP) model. The execution of MSWM projects on PPP model required involvement of GoUP, ULBs, C&DS and developers. Approval of the GoUP was required for selection of developers. Land for construction of the MSWM projects was to be provided by concerned ULBs. The C&DS was required to select developers by inviting tenders, enter into agreements with the selected developers and supervise construction works undertaken by the developers. The developers were required to construct, operate and maintain the MSWM projects. The C&DS had no role in operation and maintenance of the MSWM projects and the same was to be done by the developers under the supervision of concerned ULBs. The role of various agencies involved in execution of the MSWM projects is discussed in detail in Annexure-2.4.2.
As the role of C&DS was pivotal in execution of the MSWM projects, the present audit was conducted during November 2015 to May 2016 covering the period from 2011-12 to 2015-16 with focus on the activities undertaken by the C&DS in execution of the MSWM projects.
1 Seven projects (Agra, Allahabad, Kanpur, Lucknow, Mathura, Meerut and Varanasi) at a
cost of ` 241.60 crore under Urban Infrastructure and Governance (UIG), 19 projects (Aligarh, Badaun, Ballia, Barabanki, Basti, Etawah, Fatehpur, Firozabad, Gorakhpur, Jaunpur, Jhansi, Kannauj, Loni, Mainpuri, Mirzapur, Moradabad, Muzaffarnagar, Raebareli and Sambhal) at a cost of ` 169.03 crore under Urban Infrastructure Development Scheme for Small and Medium Towns (UIDSSMT) and one project (Pilkhuwa) at a cost of ` 8.98 crore under Urban Infrastructure Development Scheme for Satellite Towns (UIDSST).

Audit Report on Public Sector Undertakings for the year ended 31 March 2016
90
The objectives of the audit were to assess whether the bidding process adopted to select the developers was fair, transparent and adhered to the prescribed rules/ regulations/guidelines of the GoUP regarding execution of projects on PPP model; supervision of construction activities, processing of claims of capital grant and other related activities were carried out efficiently and effectively; and the MSWM projects were completed within the scheduled time frame.
Audit examination involved scrutiny of records at the Headquarters of C&DS and of 15 MSWM projects2, out of total 27 MSWM projects, selected on the basis of highest expenditure incurred. The methodology adopted for attaining the audit objectives consisted of explaining audit objectives to top management in the Entry conference held on 28 January 2016, raising of audit queries and joint physical inspection of the MSWM projects. An Exit conference was held on 22 July 2016 with the Management and Government and replies of the Management were received in September 2016 which had been duly considered. Reply of the Government was awaited (October 2016).
Financial and physical status of the MSWM projects Financial status
2.4.2 The MSWM projects were to be financed by the GoI, GoUP and concerned ULBs in the ratio of 80:10:10 in case of 21 MSWM projects3 and 50:20:30 in case of six MSWM projects4. The funds were released by the GoI and GoUP to the concerned ULBs which after including its share released it to the C&DS.
The ULBs had released ` 364.38 crore5 to the C&DS for execution of the 27 MSWM projects against sanctioned cost of ` 419.61 crore6 till March 2016. The C&DS incurred expenditure of ` 307.57 crore on execution of the 27 MSWM projects against the funds of ` 364.38 crore received till March 2016. Savings/ unspent balance of ` 56.81 crore were lying with the C&DS as on 31 March 2016. The financial status of the 27 MSWM projects and sampled 15 MSWM projects is depicted in chart 2.4.1.
2 Agra, Allahabad, Kanpur, Lucknow, Varanasi, Aligarh, Barabanki, Etawah, Fatehpur,
Jhansi, Mirzapur, Moradabad, Muzaffarnagar, Raebareli and Pilkhuwa. 3 Aligarh, Badaun, Ballia, Barabanki, Basti, Etawah, Fatehpur, Firozabad, Gorakhpur,
Jaunpur, Jhansi, Kannauj, Loni, Mainpuri, Mathura, Mirzapur, Moradabad, Muzaffarnagar, Raebareli, Sambhal and Pilkhuwa.
4 Agra, Allahabad, Kanpur, Lucknow, Meerut and Varanasi. 5 GoI – ` 222.24 crore; GoUP - ` 58.17 crore and ULBs - ` 83.97 crore. 6 GoI - ` 266.18 crore; GoUP - ` 65.13 crore and ULBs - ` 88.30 crore.

Chapter- II: Performance Audits relating to Government companies and Statutory corporations
91
Chart 2.4.1 Financial status of MSWM projects
As can be seen from chart 2.4.1, out of 27 MSWM projects for which ` 364.38 crore was received by C&DS, only 11 MSWM projects7 were completed after incurring expenditure of ` 133.99 crore against funds received of ` 139.21 crore. Savings of ` 5.22 crore in respect of completed MSWM projects was still lying with the C&DS even after lapse of more than two to four years since completion of the MSWM projects instead of returning it to GoI/GoUP/ULBs. The remaining 16 MSWM projects8, on which expenditure of ` 173.58 crore was incurred against funds received of ` 225.17 crore, were still incomplete as on March 2016 despite lapse of more than five to nine years since sanction.
Thus, ` 173.58 crore invested in 16 incomplete MSWM projects remained blocked/ unfruitful and the intended objective of the MSWM projects i.e. to dispose off 18.31 lakh tonne MSW per annum, in 16 cities, in a scientific manner could not be achieved even after five to nine years of sanction of the MSWM projects. Physical Status 2.4.3 As per the Detailed Project Reports9 (DPRs), the MSWM projects were to be completed within 12 months of sanction of DPR. Audit noticed inordinate delay in completion of MSWM projects, not starting of MSWM projects, abandonment of incomplete MSWM projects and MSWM projects still under progress as discussed in detail in paragraphs 2.4.9 to 2.4.12.
7 Aligarh, Barabanki, Etawah, Fatehpur, Kannauj, Kanpur, Mainpuri, Mathura, Moradabad,
Muzaffarnagar and Raebareli. 8 Agra, Allahabad, Badaun, Ballia, Basti, Firozabad, Gorakhpur, Jaunpur, Jhansi, Loni,
Lucknow, Meerut, Mirzapur, Pilkhuwa, Sambhal and Varanasi. 9 DPRs of the MSWM projects were prepared by ‘Regional Centre for Urban and
Environmental Studies’ an agency established by the Ministry of Urban Development, Government of India.
(̀ in
cro
re)
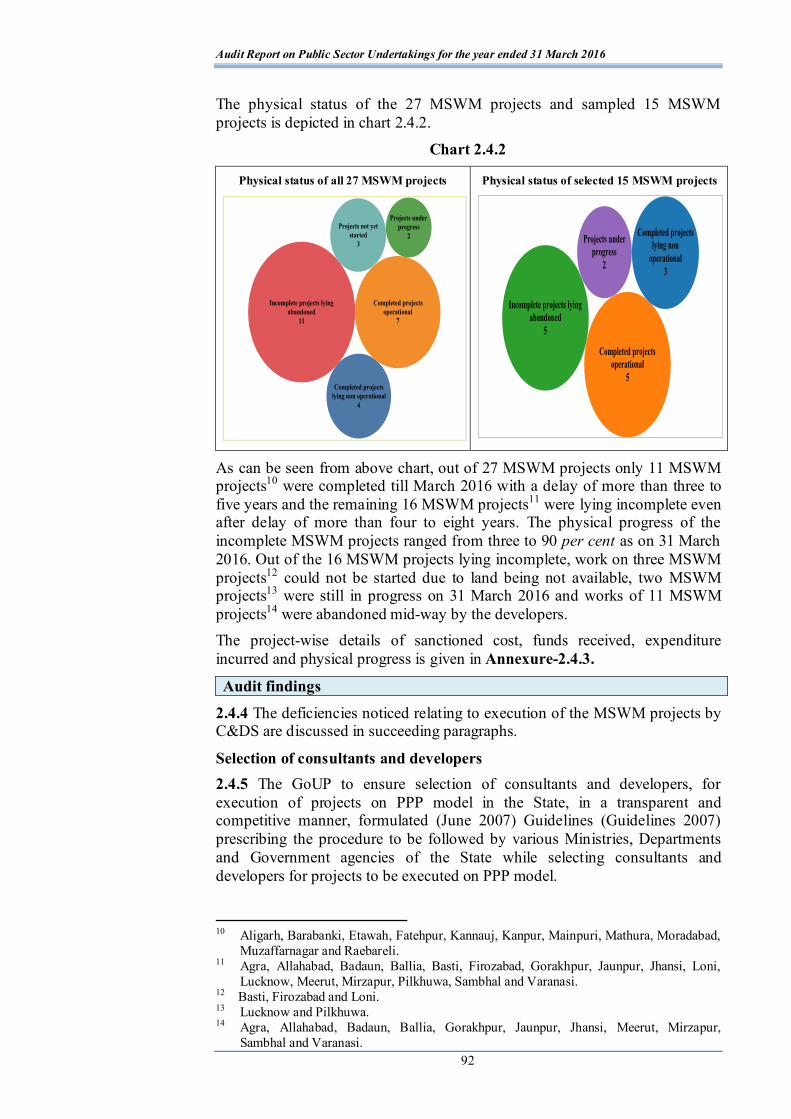
Audit Report on Public Sector Undertakings for the year ended 31 March 2016
92
The physical status of the 27 MSWM projects and sampled 15 MSWM projects is depicted in chart 2.4.2.
Chart 2.4.2
Physical status of all 27 MSWM projects
Physical status of selected 15 MSWM projects
As can be seen from above chart, out of 27 MSWM projects only 11 MSWM projects10 were completed till March 2016 with a delay of more than three to five years and the remaining 16 MSWM projects11 were lying incomplete even after delay of more than four to eight years. The physical progress of the incomplete MSWM projects ranged from three to 90 per cent as on 31 March 2016. Out of the 16 MSWM projects lying incomplete, work on three MSWM projects12 could not be started due to land being not available, two MSWM projects13 were still in progress on 31 March 2016 and works of 11 MSWM projects14 were abandoned mid-way by the developers. The project-wise details of sanctioned cost, funds received, expenditure incurred and physical progress is given in Annexure-2.4.3.
Audit findings
2.4.4 The deficiencies noticed relating to execution of the MSWM projects by C&DS are discussed in succeeding paragraphs.
Selection of consultants and developers 2.4.5 The GoUP to ensure selection of consultants and developers, for execution of projects on PPP model in the State, in a transparent and competitive manner, formulated (June 2007) Guidelines (Guidelines 2007) prescribing the procedure to be followed by various Ministries, Departments and Government agencies of the State while selecting consultants and developers for projects to be executed on PPP model.
10 Aligarh, Barabanki, Etawah, Fatehpur, Kannauj, Kanpur, Mainpuri, Mathura, Moradabad,
Muzaffarnagar and Raebareli. 11 Agra, Allahabad, Badaun, Ballia, Basti, Firozabad, Gorakhpur, Jaunpur, Jhansi, Loni,
Lucknow, Meerut, Mirzapur, Pilkhuwa, Sambhal and Varanasi. 12 Basti, Firozabad and Loni. 13 Lucknow and Pilkhuwa. 14 Agra, Allahabad, Badaun, Ballia, Gorakhpur, Jaunpur, Jhansi, Meerut, Mirzapur,
Sambhal and Varanasi.
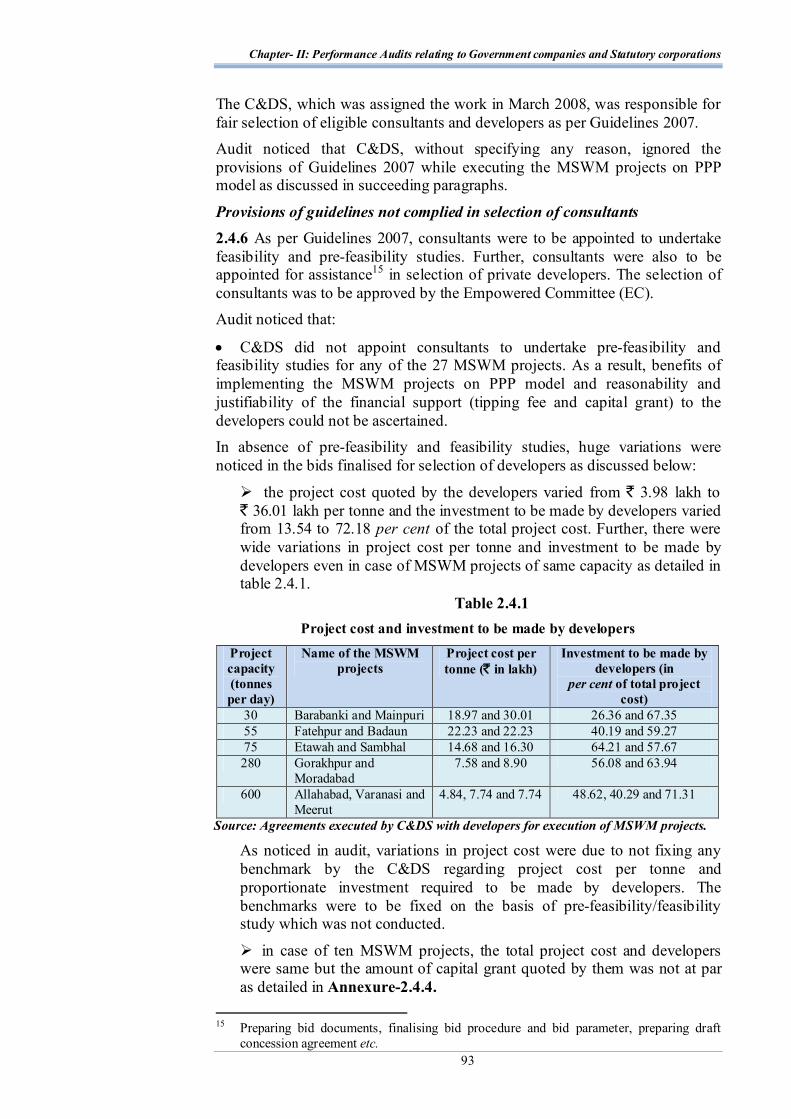
Chapter- II: Performance Audits relating to Government companies and Statutory corporations
93
The C&DS, which was assigned the work in March 2008, was responsible for fair selection of eligible consultants and developers as per Guidelines 2007. Audit noticed that C&DS, without specifying any reason, ignored the provisions of Guidelines 2007 while executing the MSWM projects on PPP model as discussed in succeeding paragraphs.
Provisions of guidelines not complied in selection of consultants 2.4.6 As per Guidelines 2007, consultants were to be appointed to undertake feasibility and pre-feasibility studies. Further, consultants were also to be appointed for assistance15 in selection of private developers. The selection of consultants was to be approved by the Empowered Committee (EC). Audit noticed that:
C&DS did not appoint consultants to undertake pre-feasibility and feasibility studies for any of the 27 MSWM projects. As a result, benefits of implementing the MSWM projects on PPP model and reasonability and justifiability of the financial support (tipping fee and capital grant) to the developers could not be ascertained. In absence of pre-feasibility and feasibility studies, huge variations were noticed in the bids finalised for selection of developers as discussed below:
the project cost quoted by the developers varied from ` 3.98 lakh to ` 36.01 lakh per tonne and the investment to be made by developers varied from 13.54 to 72.18 per cent of the total project cost. Further, there were wide variations in project cost per tonne and investment to be made by developers even in case of MSWM projects of same capacity as detailed in table 2.4.1.
Table 2.4.1 Project cost and investment to be made by developers
Project capacity (tonnes per day)
Name of the MSWM projects
Project cost per tonne (` in lakh)
Investment to be made by developers (in
per cent of total project cost)
30 Barabanki and Mainpuri 18.97 and 30.01 26.36 and 67.35 55 Fatehpur and Badaun 22.23 and 22.23 40.19 and 59.27 75 Etawah and Sambhal 14.68 and 16.30 64.21 and 57.67 280 Gorakhpur and
Moradabad 7.58 and 8.90 56.08 and 63.94
600 Allahabad, Varanasi and Meerut
4.84, 7.74 and 7.74 48.62, 40.29 and 71.31
Source: Agreements executed by C&DS with developers for execution of MSWM projects.
As noticed in audit, variations in project cost were due to not fixing any benchmark by the C&DS regarding project cost per tonne and proportionate investment required to be made by developers. The benchmarks were to be fixed on the basis of pre-feasibility/feasibility study which was not conducted.
in case of ten MSWM projects, the total project cost and developers were same but the amount of capital grant quoted by them was not at par as detailed in Annexure-2.4.4.
15 Preparing bid documents, finalising bid procedure and bid parameter, preparing draft
concession agreement etc.

Audit Report on Public Sector Undertakings for the year ended 31 March 2016
94
in case of three16 MSWM projects, operation and maintenance cost of sanitary landfill was approved at the rate of ` 75 to ` 95 per tonne whereas, no operation and maintenance cost was demanded by developers in other four17 similar MSWM projects.
C&DS appointed Deloitte Touche Tohmatsu India Private Limited (Deloitte) as consultant for assistance in selection of developers for 19 MSWM projects18 whereas in case of eight MSWM projects19, the C&DS directly invited bids from developers during April to July 2008 without appointment of consultants. As consultants were not appointed in case of above eight MSWM projects, various deficiencies were noticed in tender process viz. no financial requirement/parameter i.e. minimum net worth, average turnover, net cash accruals etc was prescribed in the eligibility/qualification criteria for selection of developers. As a result, financial soundness of the participating bidders could not be ascertained. Further, the agreements were deficient as they did not contain provisions regarding (i) release of capital grant only after obtaining proof of investment made by developers in the MSWM projects; (ii) releasing capital grant in proportion to the total capital expenditure incurred vis-à-vis the total project cost quoted by the developers; (iii) rights and obligations of both parties in case of termination of agreement by either party; and (iv) dilution of interests of selected bidder/members of selected consortium in the MSWM projects. Deficient agreements resulted in release of capital grant (CG) of ` 51.16 crore without ascertaining the admissibility of due CG as discussed in paragraph 2.4.17. Approval of Empowered Committee (EC) for appointment of Deloitte as consultant for 19 MSWM projects20 was not obtained. Therefore, the terms and conditions of appointment and remuneration payable to the consultant vis-à-vis scope of work could not be appraised by GoUP.
The Management stated (September 2016) that they were not aware of the Guidelines 2007, hence, requirements prescribed in the Guidelines 2007 for selection of consultants could not be complied with. Reply was not acceptable as the Guidelines 2007 were circulated to all departmental heads in June 2007, therefore, C&DS should have complied with the provisions of Guidelines 2007.
Provisions of guidelines not complied in selection of developers 2.4.7 As per Guidelines 2007, initial in-principle approval of Cabinet/ Department of Infrastructure Development (DID) was to be obtained on the draft concept of each project as well as the broad Terms of Reference (TOR) for detailed studies on the proposed PPP project. The Techno Economic Feasibility Reports (TEFRs) prepared on the basis of pre-feasibility and
16 Agra, Kanpur and Muzaffarnagar. 17 Etawah, Kannauj, Mainpuri and Raebareli. 18 Allahabad, Aligarh, Badaun, Ballia, Barabanki, Basti, Fatehpur, Gorakhpur, Jaunpur,
Jhansi, Loni, Lucknow, Mathura, Meerut, Mirzapur, Moradabad, Pilkhuwa, Sambhal and Varanasi.
19 Agra, Etawah, Firozabad, Kanpur, Kannauj, Mainpuri, Muzaffarnagar and Raebareli. 20 Allahabad, Aligarh, Badaun, Ballia, Barabanki, Basti, Fatehpur, Gorakhpur, Jaunpur,
Jhansi, Loni, Lucknow, Mathura, Meerut, Mirzapur, Moradabad, Pilkhuwa, Sambhal and Varanasi.
Chapter- II: Performance Audits relating to Government companies and Statutory corporations
95
feasibility studies were to be put up before the Cabinet for final in-principle approval for selection of developers. Two stage bidding process was to be adopted for selection of developers. In the first stage, prospective developers were to be shortlisted as per pre-qualification criteria fixed by C&DS and in the second stage, the shortlisted developers were to be invited to submit detailed technical and financial bids. Bids were to be evaluated by PPP Bid Evaluation Committee of GoUP and recommendations of the Committee were to be put up to Cabinet for final approval for selection of developers. Audit noticed that:
all 27 MSWM projects were taken up by C&DS on PPP model without obtaining in-principle approval of Cabinet/DID. As a result, the need and justification for implementation of the MSWM projects on PPP model with reference to possible alternatives was not appraised by or to Cabinet/DID.
C&DS, without specifying any reason, selected developers for all 27 MSWM projects by adopting single stage bidding process, wherein both technical and financial bids were invited simultaneously, instead of two stage bidding. Two-stage bidding encourages competition and ensures that invitations are extended only to those who have adequate capabilities and resources. Adoption of single stage bidding not only resulted in violation of the provisions of the Guidelines 2007 but also compromised participation by a large number of eligible bidders to obtain the best possible terms. bids of all 27 MSWM projects were evaluated by Tender Committee of C&DS instead of PPP Bid Evaluation Committee. Further, final approval for selection of developers was not obtained from the Cabinet. As a result, reasonability of the procedure adopted for selection of developers, terms and conditions of appointment of developers and financial support (tipping fee and capital grant) to developer could not be assessed by the Cabinet. The Management stated (September 2016) that they were not aware of the Guidelines 2007, hence, requirements prescribed in the Guidelines 2007 for selection of developers could not be complied with. Reply was not acceptable as the Guidelines 2007 were circulated to all departmental heads in June 2007, therefore, C&DS should have complied with the provisions of Guidelines 2007.
Execution of MSWM projects 2.4.8 As per DPRs sanctioned by GoI/GoUP, the MSWM projects were to be completed within 12 months from the date of sanction of DPR which included a period of five months for completion of tender process. After award of work to the selected developers, the C&DS had to supervise the construction works, to be undertaken by the developers and ensure that the MSWM projects were completed within the stipulated time frame. However, none of the 27 MSWM projects could be completed within the stipulated period of 12 months. The main reasons for delay, as analysed by audit, were delay in nomination of executing agency by GoUP (eight to 23 months); delay in finalisation of tenders (three to 30 months); delay in obtaining land (two to 55 months); slackness on the part of developer in executing the works (nine to 34 months) and abandonment of MSWM projects by the developers (26 to 44 months21). 21 From the month of abandonment
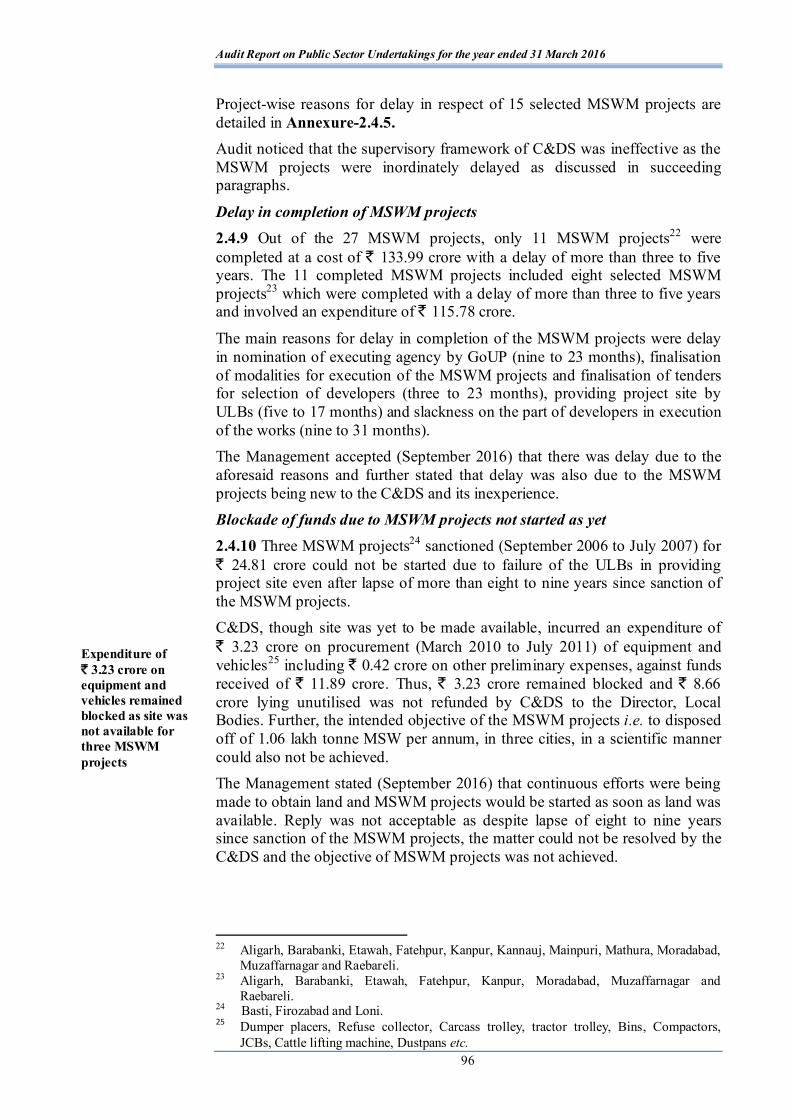
Audit Report on Public Sector Undertakings for the year ended 31 March 2016
96
Project-wise reasons for delay in respect of 15 selected MSWM projects are detailed in Annexure-2.4.5. Audit noticed that the supervisory framework of C&DS was ineffective as the MSWM projects were inordinately delayed as discussed in succeeding paragraphs.
Delay in completion of MSWM projects 2.4.9 Out of the 27 MSWM projects, only 11 MSWM projects22 were completed at a cost of ` 133.99 crore with a delay of more than three to five years. The 11 completed MSWM projects included eight selected MSWM projects23 which were completed with a delay of more than three to five years and involved an expenditure of ` 115.78 crore.
The main reasons for delay in completion of the MSWM projects were delay in nomination of executing agency by GoUP (nine to 23 months), finalisation of modalities for execution of the MSWM projects and finalisation of tenders for selection of developers (three to 23 months), providing project site by ULBs (five to 17 months) and slackness on the part of developers in execution of the works (nine to 31 months). The Management accepted (September 2016) that there was delay due to the aforesaid reasons and further stated that delay was also due to the MSWM projects being new to the C&DS and its inexperience. Blockade of funds due to MSWM projects not started as yet 2.4.10 Three MSWM projects24 sanctioned (September 2006 to July 2007) for ` 24.81 crore could not be started due to failure of the ULBs in providing project site even after lapse of more than eight to nine years since sanction of the MSWM projects. C&DS, though site was yet to be made available, incurred an expenditure of ` 3.23 crore on procurement (March 2010 to July 2011) of equipment and vehicles25 including ` 0.42 crore on other preliminary expenses, against funds received of ` 11.89 crore. Thus, ` 3.23 crore remained blocked and ` 8.66 crore lying unutilised was not refunded by C&DS to the Director, Local Bodies. Further, the intended objective of the MSWM projects i.e. to disposed off of 1.06 lakh tonne MSW per annum, in three cities, in a scientific manner could also not be achieved. The Management stated (September 2016) that continuous efforts were being made to obtain land and MSWM projects would be started as soon as land was available. Reply was not acceptable as despite lapse of eight to nine years since sanction of the MSWM projects, the matter could not be resolved by the C&DS and the objective of MSWM projects was not achieved.
22 Aligarh, Barabanki, Etawah, Fatehpur, Kanpur, Kannauj, Mainpuri, Mathura, Moradabad,
Muzaffarnagar and Raebareli. 23 Aligarh, Barabanki, Etawah, Fatehpur, Kanpur, Moradabad, Muzaffarnagar and
Raebareli. 24 Basti, Firozabad and Loni. 25 Dumper placers, Refuse collector, Carcass trolley, tractor trolley, Bins, Compactors,
JCBs, Cattle lifting machine, Dustpans etc.
Expenditure of ` 3.23 crore on equipment and vehicles remained blocked as site was not available for three MSWM projects

Chapter- II: Performance Audits relating to Government companies and Statutory corporations
97
Unfruitful expenditure due to abandonment of incomplete MSWM projects 2.4.11 Out of 27 MSWM projects, 13 MSWM projects26 wherein expenditure of ` 178.31 crore had been incurred up to March 2016 were still (March 2016) lying incomplete even after more than five to nine years of sanction. Of the aforesaid 13 incomplete MSWM projects, 11 MSWM projects27 involving expenditure of ` 126.50 crore were abandoned by the developers. Out of total 11 abandoned MSWM projects, break-up of expenditure of ` 99.54 crore in five selected MSWM projects28 is detailed in table 2.4.2.
Table 2.4.2
Break-up of expenditure in selected MSWM projects (` in crore)
Expenditure upto March 2016 Sl. No.
Name of the
project
Name of developer on
construction of compost plant and sanitary landfill
on procurement
of equipment
and vehicles
other miscellaneous expenditure
Total
Project abandoned
1 Agra Hanjer Biotech Energies Pvt. Ltd., Mumbai
11.47 3.84 7.03 22.34
2 Allahabad Subhash Projects & Marketing Ltd., New Delhi
13.62 13.55 2.34 29.51
3 Jhansi APR Projects Pvt. Ltd., Hyderabad
4.74 1.13 0.21 6.08
4 Mirzapur A2Z Maintenance and Engineering Services Pvt. Ltd., Gurgaon
5.38 0.90 0.18 6.46
5 Varanasi A2Z Maintenance and Engineering Services Pvt. Ltd., Gurgaon
14.8 17.54 2.81 35.15
Total 50.01 36.96 12.57 99.54
Audit noticed that six MSWM projects29 (including two selected MSWM projects30) were abandoned by the developers due to stoppage of payments by C&DS and imposition of arbitrary condition of release of payment only upon construction of power generation plant which was not a part of scope of work provided in the agreement. The main reasons for abandonment of other three selected MSWM projects31 were dispute with C&DS/ULBs, over payment of capital grant/tipping fee and not financially viable MSWM projects.
Due to imposition of arbitrary condition for release of payments due and not making concerted efforts to resolve the dispute with the developers, ` 126.50 crore incurred on 11 abandoned MSWM projects remained unfruitful and 12.34 lakh tonne MSW per annum, in 11 cities, could not be disposed off in scientific manner, as envisaged in the scheme. 26 Agra, Allahabad, Badaun, Ballia, Gorakhpur, Jaunpur, Jhansi, Lucknow, Meerut,
Mirzapur, Pilkhuwa, Sambhal and Varanasi. 27 Agra, Allahabad, Badaun, Ballia, Gorakhpur, Jaunpur, Jhansi, Meerut, Mirzapur,
Sambhal and Varanasi. 28 Agra, Allahabad, Jhansi, Mirzapur and Varanasi. 29 Badaun, Ballia, Meerut, Mirzapur, Sambhal and Varanasi. 30 Mirzapur and Varanasi. 31 Agra, Allahabad and Jhansi.
Expenditure of ` 126.50 crore remained unfruitful due to abandonment of 11 MSWM projects by the developers
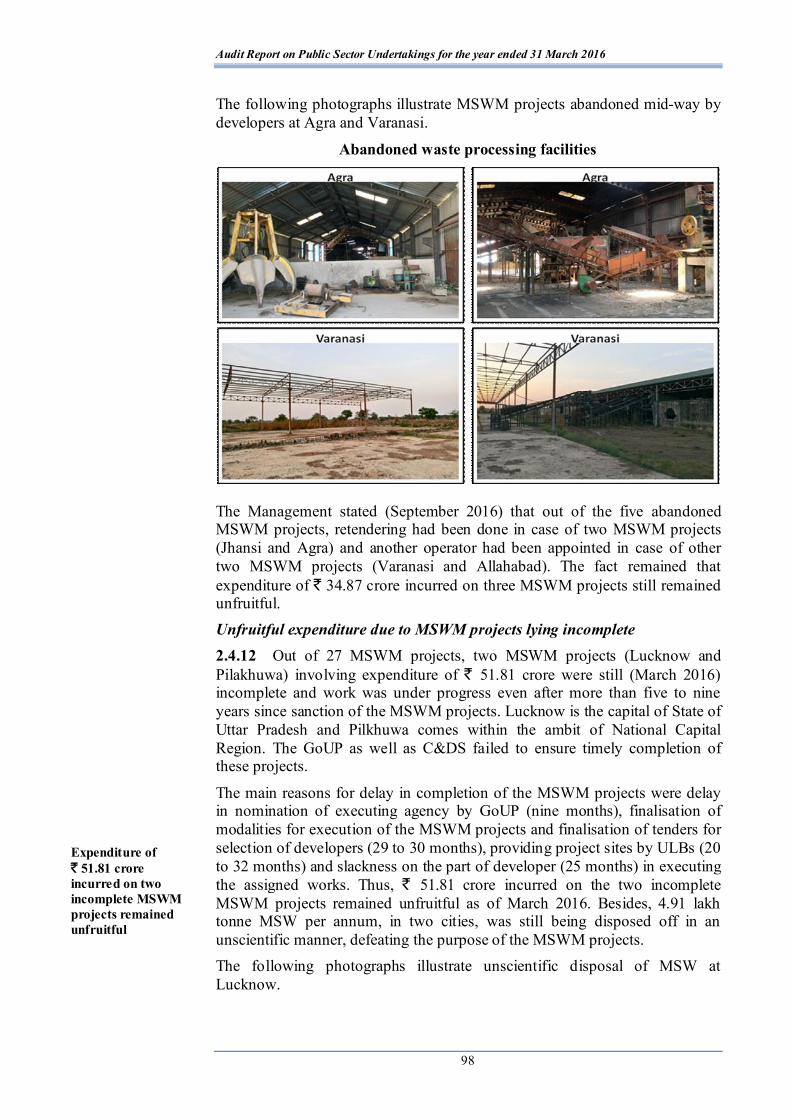
Audit Report on Public Sector Undertakings for the year ended 31 March 2016
98
The following photographs illustrate MSWM projects abandoned mid-way by developers at Agra and Varanasi.
Abandoned waste processing facilities
The Management stated (September 2016) that out of the five abandoned MSWM projects, retendering had been done in case of two MSWM projects (Jhansi and Agra) and another operator had been appointed in case of other two MSWM projects (Varanasi and Allahabad). The fact remained that expenditure of ` 34.87 crore incurred on three MSWM projects still remained unfruitful. Unfruitful expenditure due to MSWM projects lying incomplete 2.4.12 Out of 27 MSWM projects, two MSWM projects (Lucknow and Pilakhuwa) involving expenditure of ` 51.81 crore were still (March 2016) incomplete and work was under progress even after more than five to nine years since sanction of the MSWM projects. Lucknow is the capital of State of Uttar Pradesh and Pilkhuwa comes within the ambit of National Capital Region. The GoUP as well as C&DS failed to ensure timely completion of these projects.
The main reasons for delay in completion of the MSWM projects were delay in nomination of executing agency by GoUP (nine months), finalisation of modalities for execution of the MSWM projects and finalisation of tenders for selection of developers (29 to 30 months), providing project sites by ULBs (20 to 32 months) and slackness on the part of developer (25 months) in executing the assigned works. Thus, ` 51.81 crore incurred on the two incomplete MSWM projects remained unfruitful as of March 2016. Besides, 4.91 lakh tonne MSW per annum, in two cities, was still being disposed off in an unscientific manner, defeating the purpose of the MSWM projects. The following photographs illustrate unscientific disposal of MSW at Lucknow.
Expenditure of ` 51.81 crore incurred on two incomplete MSWM projects remained unfruitful
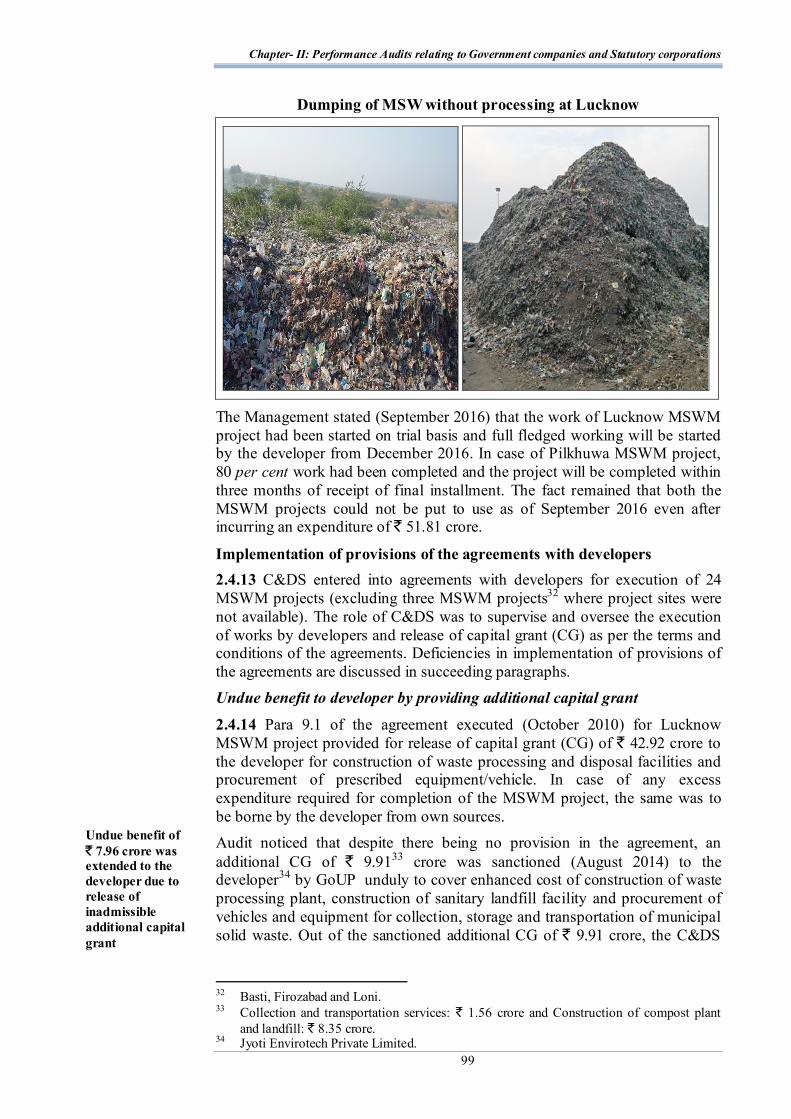
Chapter- II: Performance Audits relating to Government companies and Statutory corporations
99
Dumping of MSW without processing at Lucknow
The Management stated (September 2016) that the work of Lucknow MSWM project had been started on trial basis and full fledged working will be started by the developer from December 2016. In case of Pilkhuwa MSWM project, 80 per cent work had been completed and the project will be completed within three months of receipt of final installment. The fact remained that both the MSWM projects could not be put to use as of September 2016 even after incurring an expenditure of ` 51.81 crore.
Implementation of provisions of the agreements with developers 2.4.13 C&DS entered into agreements with developers for execution of 24 MSWM projects (excluding three MSWM projects32 where project sites were not available). The role of C&DS was to supervise and oversee the execution of works by developers and release of capital grant (CG) as per the terms and conditions of the agreements. Deficiencies in implementation of provisions of the agreements are discussed in succeeding paragraphs. Undue benefit to developer by providing additional capital grant
2.4.14 Para 9.1 of the agreement executed (October 2010) for Lucknow MSWM project provided for release of capital grant (CG) of ` 42.92 crore to the developer for construction of waste processing and disposal facilities and procurement of prescribed equipment/vehicle. In case of any excess expenditure required for completion of the MSWM project, the same was to be borne by the developer from own sources. Audit noticed that despite there being no provision in the agreement, an additional CG of ` 9.9133 crore was sanctioned (August 2014) to the developer34 by GoUP unduly to cover enhanced cost of construction of waste processing plant, construction of sanitary landfill facility and procurement of vehicles and equipment for collection, storage and transportation of municipal solid waste. Out of the sanctioned additional CG of ` 9.91 crore, the C&DS
32 Basti, Firozabad and Loni. 33 Collection and transportation services: ` 1.56 crore and Construction of compost plant
and landfill: ` 8.35 crore. 34 Jyoti Envirotech Private Limited.
Undue benefit of ` 7.96 crore was extended to the developer due to release of inadmissible additional capital grant
Audit Report on Public Sector Undertakings for the year ended 31 March 2016
100
had released ` 7.96 crore to the developer up to March 2016. Thus, an undue benefit was extended to the developer by providing additional CG. The Management stated (September 2016) that in view of the enhancement in cost of the MSWM project due to delay in obtaining suitable land and changes required in transportation system due to change in project site, the GoUP sanctioned additional CG of ` 9.91 crore. Reply was not acceptable because as per agreement the amount of CG was fixed and any enhancement in cost was to be borne by the developer and not by the GoUP. Excess payment of capital grant to developers 2.4.15 The MSWM projects were to be financed through Capital Grant (CG) payable by C&DS to the developers and investment by developers in proportion stipulated in the agreements. Therefore, the C&DS was required to release proportionate CG only in respect of work done by the developer.
Audit noticed that in case of Fatehpur and Mirzapur MSWM projects, the developers had executed works of ` 13.98 crore against which CG of ` 10.49 crore was due to be paid to the developers. The Project Manager of the C&DS, however, paid (January 2011 to December 2013) CG of ` 13.53 crore to the developers resulting in excess payment of ` 3.04 crore to the developers. Premature release of capital grant to developers
2.4.16 Agreements executed (March 2010 to February 2011) for five MSWM projects35 provided for release of CG to the developers at the rate of 15 per cent on signing of the agreement, 75 per cent at the time of submission of monthly claims and balance 10 per cent after the date of commercial operation. Thus, only 90 per cent of the total sanctioned CG was to be paid with the running bills and balance 10 per cent was to be paid on completion of the MSWM project. Further, as per agreement executed (November 2008) for construction of waste processing and disposal facilities of Agra MSWM project, security at the rate of five per cent was to be deducted from each running bill which was payable three months after completion of the MSWM project. Audit noticed that in case of the aforesaid five incomplete MSWM projects the C&DS released (February 2009 to December 2014) premature payments in excess of 90/95 per cent of the value of work done (ranging between ` 0.34 crore and ` 3.52 crore) resulting in premature release of ` 6.02 crore to the developers upto March 2016 (Annexure-2.4.6). Premature release of CG led to undue benefit of interest of ` 2.84 crore36 (Annexure-2.4.6) to the developers.
The Management stated (September 2016) that ` 4.95 crore in respect of four MSWM projects had since been recovered from bank guarantees. However, reason had not been put forth in reply for not recovery of CG of ` 1.07 crore and interest of ` 2.84 crore.
35 Agra (agreement for procurement of equipment and vehicles for collection and
transportation of MSW), Allahabad, Jhansi, Mirzapur and Varanasi. 36 Calculated at the rate of 12 per cent per annum being the interest rate charged by other
Government construction agencies on advances released to contractors.
Excess payment of ` 3.04 crore was made to the developers due to not releasing proportionate capital grant
Undue benefit of ` 2.84 crore was extended to the developers due to irregular release of capital grant of ` 6.02 crore
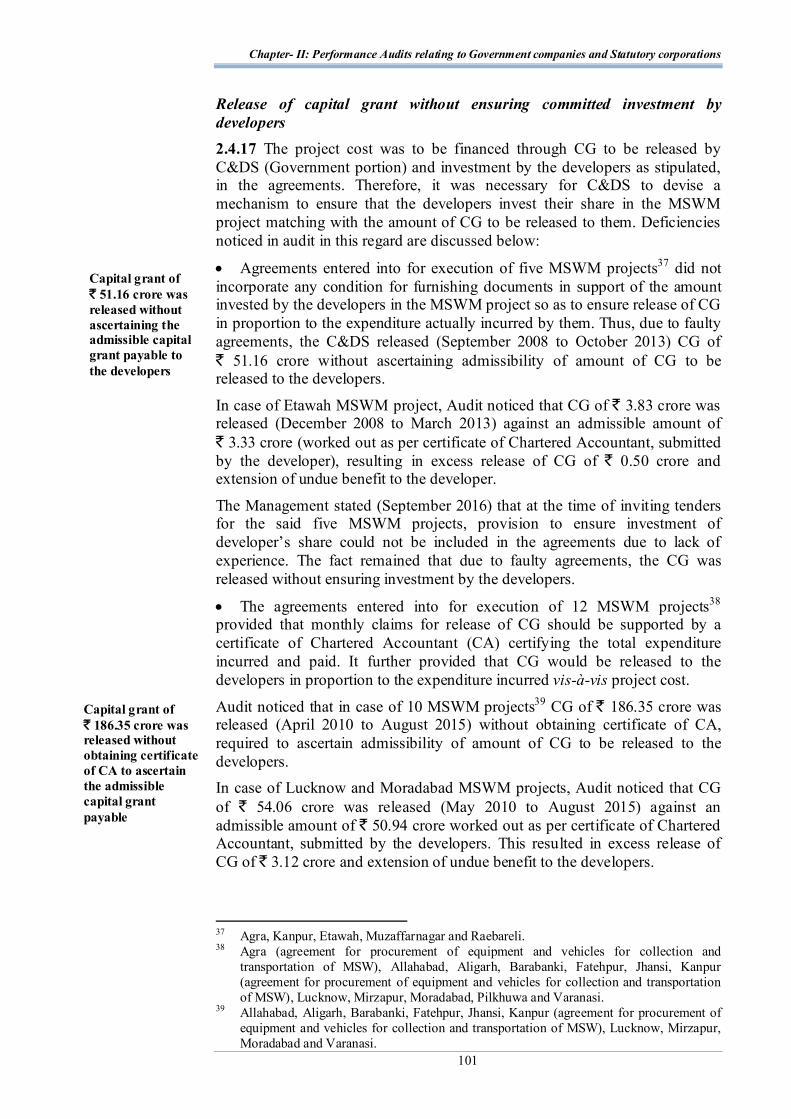
Chapter- II: Performance Audits relating to Government companies and Statutory corporations
101
Release of capital grant without ensuring committed investment by developers 2.4.17 The project cost was to be financed through CG to be released by C&DS (Government portion) and investment by the developers as stipulated, in the agreements. Therefore, it was necessary for C&DS to devise a mechanism to ensure that the developers invest their share in the MSWM project matching with the amount of CG to be released to them. Deficiencies noticed in audit in this regard are discussed below:
Agreements entered into for execution of five MSWM projects37 did not incorporate any condition for furnishing documents in support of the amount invested by the developers in the MSWM project so as to ensure release of CG in proportion to the expenditure actually incurred by them. Thus, due to faulty agreements, the C&DS released (September 2008 to October 2013) CG of ` 51.16 crore without ascertaining admissibility of amount of CG to be released to the developers.
In case of Etawah MSWM project, Audit noticed that CG of ` 3.83 crore was released (December 2008 to March 2013) against an admissible amount of ` 3.33 crore (worked out as per certificate of Chartered Accountant, submitted by the developer), resulting in excess release of CG of ` 0.50 crore and extension of undue benefit to the developer.
The Management stated (September 2016) that at the time of inviting tenders for the said five MSWM projects, provision to ensure investment of developer’s share could not be included in the agreements due to lack of experience. The fact remained that due to faulty agreements, the CG was released without ensuring investment by the developers.
The agreements entered into for execution of 12 MSWM projects38 provided that monthly claims for release of CG should be supported by a certificate of Chartered Accountant (CA) certifying the total expenditure incurred and paid. It further provided that CG would be released to the developers in proportion to the expenditure incurred vis-à-vis project cost.
Audit noticed that in case of 10 MSWM projects39 CG of ` 186.35 crore was released (April 2010 to August 2015) without obtaining certificate of CA, required to ascertain admissibility of amount of CG to be released to the developers. In case of Lucknow and Moradabad MSWM projects, Audit noticed that CG of ` 54.06 crore was released (May 2010 to August 2015) against an admissible amount of ` 50.94 crore worked out as per certificate of Chartered Accountant, submitted by the developers. This resulted in excess release of CG of ` 3.12 crore and extension of undue benefit to the developers.
37 Agra, Kanpur, Etawah, Muzaffarnagar and Raebareli. 38 Agra (agreement for procurement of equipment and vehicles for collection and
transportation of MSW), Allahabad, Aligarh, Barabanki, Fatehpur, Jhansi, Kanpur (agreement for procurement of equipment and vehicles for collection and transportation of MSW), Lucknow, Mirzapur, Moradabad, Pilkhuwa and Varanasi.
39 Allahabad, Aligarh, Barabanki, Fatehpur, Jhansi, Kanpur (agreement for procurement of equipment and vehicles for collection and transportation of MSW), Lucknow, Mirzapur, Moradabad and Varanasi.
Capital grant of ` 51.16 crore was released without ascertaining the admissible capital grant payable to the developers
Capital grant of ` 186.35 crore was released without obtaining certificate of CA to ascertain the admissible capital grant payable
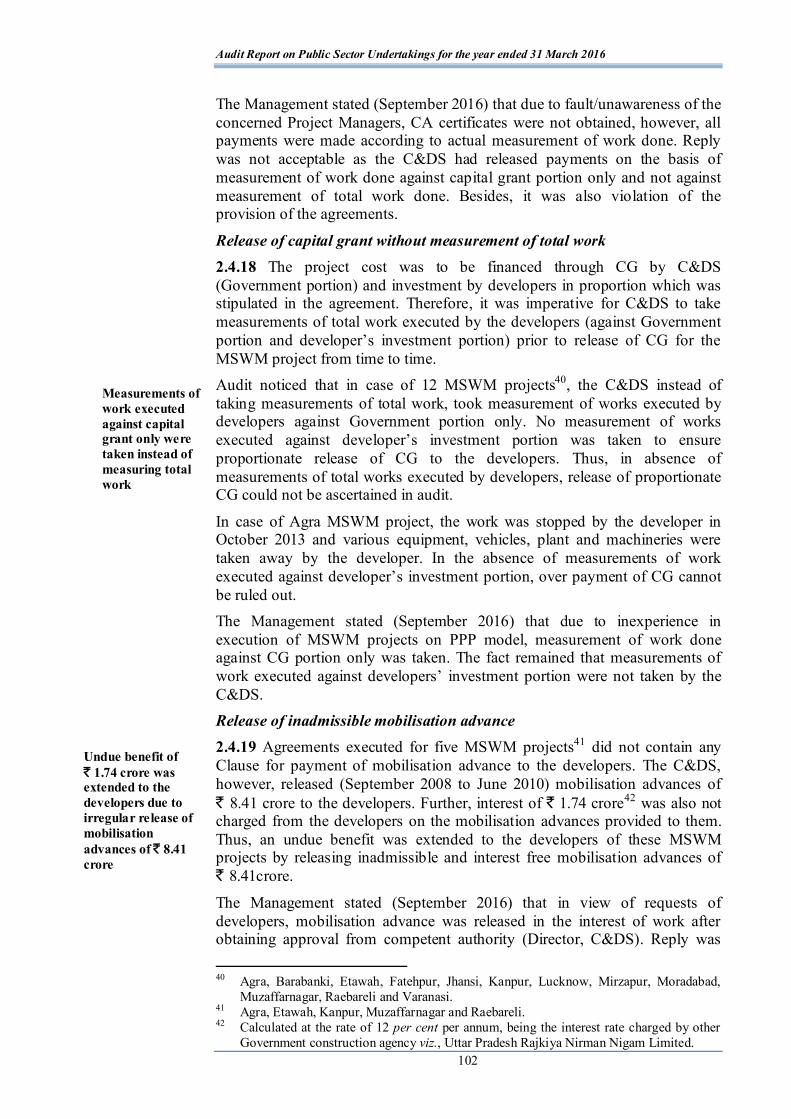
Audit Report on Public Sector Undertakings for the year ended 31 March 2016
102
The Management stated (September 2016) that due to fault/unawareness of the concerned Project Managers, CA certificates were not obtained, however, all payments were made according to actual measurement of work done. Reply was not acceptable as the C&DS had released payments on the basis of measurement of work done against capital grant portion only and not against measurement of total work done. Besides, it was also violation of the provision of the agreements.
Release of capital grant without measurement of total work 2.4.18 The project cost was to be financed through CG by C&DS (Government portion) and investment by developers in proportion which was stipulated in the agreement. Therefore, it was imperative for C&DS to take measurements of total work executed by the developers (against Government portion and developer’s investment portion) prior to release of CG for the MSWM project from time to time. Audit noticed that in case of 12 MSWM projects40, the C&DS instead of taking measurements of total work, took measurement of works executed by developers against Government portion only. No measurement of works executed against developer’s investment portion was taken to ensure proportionate release of CG to the developers. Thus, in absence of measurements of total works executed by developers, release of proportionate CG could not be ascertained in audit.
In case of Agra MSWM project, the work was stopped by the developer in October 2013 and various equipment, vehicles, plant and machineries were taken away by the developer. In the absence of measurements of work executed against developer’s investment portion, over payment of CG cannot be ruled out. The Management stated (September 2016) that due to inexperience in execution of MSWM projects on PPP model, measurement of work done against CG portion only was taken. The fact remained that measurements of work executed against developers’ investment portion were not taken by the C&DS. Release of inadmissible mobilisation advance 2.4.19 Agreements executed for five MSWM projects41 did not contain any Clause for payment of mobilisation advance to the developers. The C&DS, however, released (September 2008 to June 2010) mobilisation advances of ` 8.41 crore to the developers. Further, interest of ` 1.74 crore42 was also not charged from the developers on the mobilisation advances provided to them. Thus, an undue benefit was extended to the developers of these MSWM projects by releasing inadmissible and interest free mobilisation advances of ` 8.41crore.
The Management stated (September 2016) that in view of requests of developers, mobilisation advance was released in the interest of work after obtaining approval from competent authority (Director, C&DS). Reply was 40 Agra, Barabanki, Etawah, Fatehpur, Jhansi, Kanpur, Lucknow, Mirzapur, Moradabad,
Muzaffarnagar, Raebareli and Varanasi. 41 Agra, Etawah, Kanpur, Muzaffarnagar and Raebareli. 42 Calculated at the rate of 12 per cent per annum, being the interest rate charged by other
Government construction agency viz., Uttar Pradesh Rajkiya Nirman Nigam Limited.
Measurements of work executed against capital grant only were taken instead of measuring total work
Undue benefit of ` 1.74 crore was extended to the developers due to irregular release of mobilisation advances of ̀ 8.41 crore

Chapter- II: Performance Audits relating to Government companies and Statutory corporations
103
not acceptable as mobilisation advance was released despite there being no provision in the tender documents/agreement. Short recovery of liquidated damages 2.4.20 Agreements executed with the developers provided for levy of liquidated damages (LD), at the rates specified therein, for delay in completion of the MSWM projects. Audit noticed that there was delay of 15 to 50 months in completion of five selected MSWM projects43 by the developers for which time extension was not granted by the C&DS till date (March 2016). The C&DS, however, without assigning any reason, recovered LD of ` 1.62 crore only against the recoverable amount of ` 20.81 crore from the developers which resulted in short recovery of LD of ` 19.19 crore and, thus, undue benefit to the developers. The Management stated (September 2016) that in case of Agra, Jhansi and Mirzapur MSWM projects, necessary action against the developers would be taken after finalisation of pending arbitration cases. The Management, however, did not furnish reasons for short levy of LD in case of Lucknow and Varanasi MSWM projects. Purchase of equipment and vehicles in advance
2.4.21 Para 9.1 of the agreements executed for six MSWM projects44 provided that the developers would procure the equipment/vehicles in a manner so that delivery of the same would be made not before 45 days prior to date of commercial operation, unless otherwise agreed to by the C&DS. Audit noticed that in case of four incomplete MSWM projects45 the developers, violating the provisions of agreements, supplied (December 2010 to August 2015) to the concerned ULBs, equipment and vehicles46 valuing ` 49.92 crore in advance by seven to 63 months as of March 2016. Further, in case of remaining two completed MSWM projects (Aligarh and Moradabad), the developers had supplied to the concerned ULBs the required equipment/vehicles valuing ` 3.10 crore in advance by 14 to 30 months of completion of the MSWM projects.
Procurement of equipment and vehicles of ` 53.02 crore in advance by seven to 63 months of completion of MSWM projects was not justified, as these equipment/vehicles were to be utilised after completion of the MSWM projects.
The following photographs illustrate unutilised vehicles lying at Varanasi:
43 Agra, Jhansi, Lucknow, Mirzapur and Varanasi. 44 Allahabad, Aligarh, Jhansi, Lucknow, Moradabad and Varanasi. 45 Allahabad, Jhansi, Lucknow and Varanasi. 46 Dumper placers, Refuse collector, Carcass trolley, tractor trolley, Bins, Compactors,
JCB’s, Cattle lifting machine, Dustpans etc.
Undue benefit of ` 19.19 crore was extended to the developers due to short recovery of liquidated damages
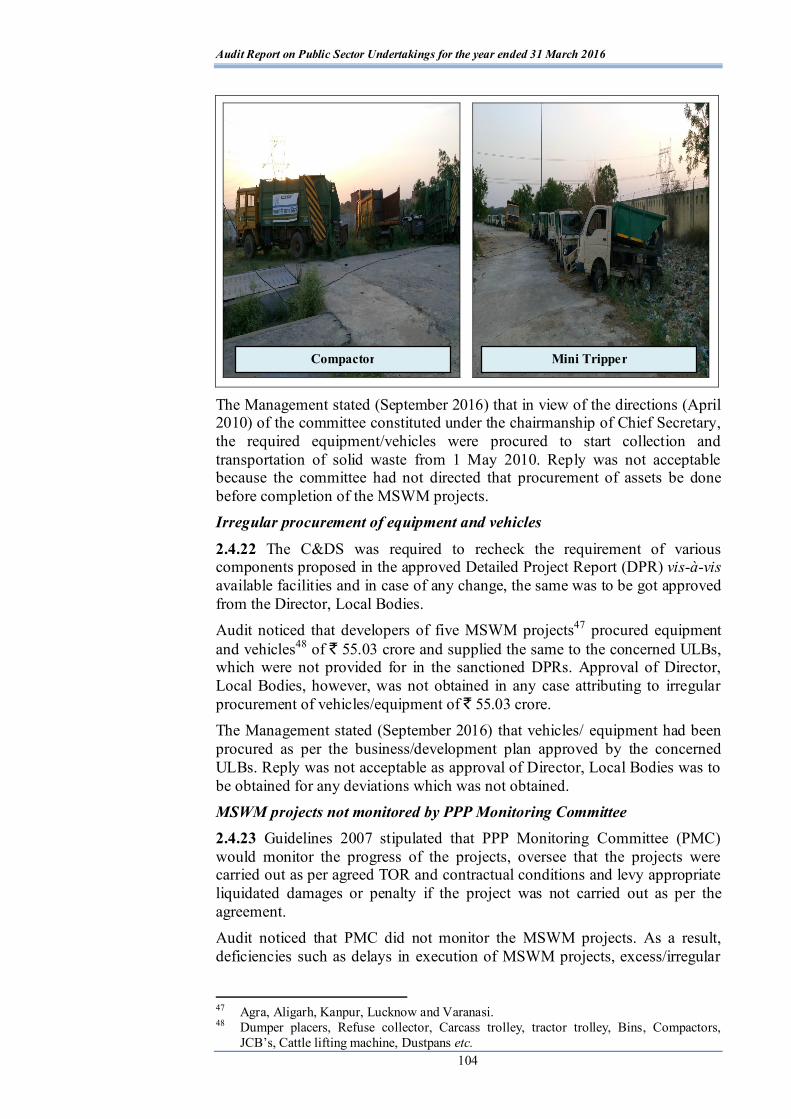
Audit Report on Public Sector Undertakings for the year ended 31 March 2016
104
The Management stated (September 2016) that in view of the directions (April 2010) of the committee constituted under the chairmanship of Chief Secretary, the required equipment/vehicles were procured to start collection and transportation of solid waste from 1 May 2010. Reply was not acceptable because the committee had not directed that procurement of assets be done before completion of the MSWM projects. Irregular procurement of equipment and vehicles
2.4.22 The C&DS was required to recheck the requirement of various components proposed in the approved Detailed Project Report (DPR) vis-à-vis available facilities and in case of any change, the same was to be got approved from the Director, Local Bodies. Audit noticed that developers of five MSWM projects47 procured equipment and vehicles48 of ` 55.03 crore and supplied the same to the concerned ULBs, which were not provided for in the sanctioned DPRs. Approval of Director, Local Bodies, however, was not obtained in any case attributing to irregular procurement of vehicles/equipment of ` 55.03 crore. The Management stated (September 2016) that vehicles/ equipment had been procured as per the business/development plan approved by the concerned ULBs. Reply was not acceptable as approval of Director, Local Bodies was to be obtained for any deviations which was not obtained. MSWM projects not monitored by PPP Monitoring Committee 2.4.23 Guidelines 2007 stipulated that PPP Monitoring Committee (PMC) would monitor the progress of the projects, oversee that the projects were carried out as per agreed TOR and contractual conditions and levy appropriate liquidated damages or penalty if the project was not carried out as per the agreement. Audit noticed that PMC did not monitor the MSWM projects. As a result, deficiencies such as delays in execution of MSWM projects, excess/irregular
47 Agra, Aligarh, Kanpur, Lucknow and Varanasi. 48 Dumper placers, Refuse collector, Carcass trolley, tractor trolley, Bins, Compactors,
JCB’s, Cattle lifting machine, Dustpans etc.
Compactor Mini Tripper
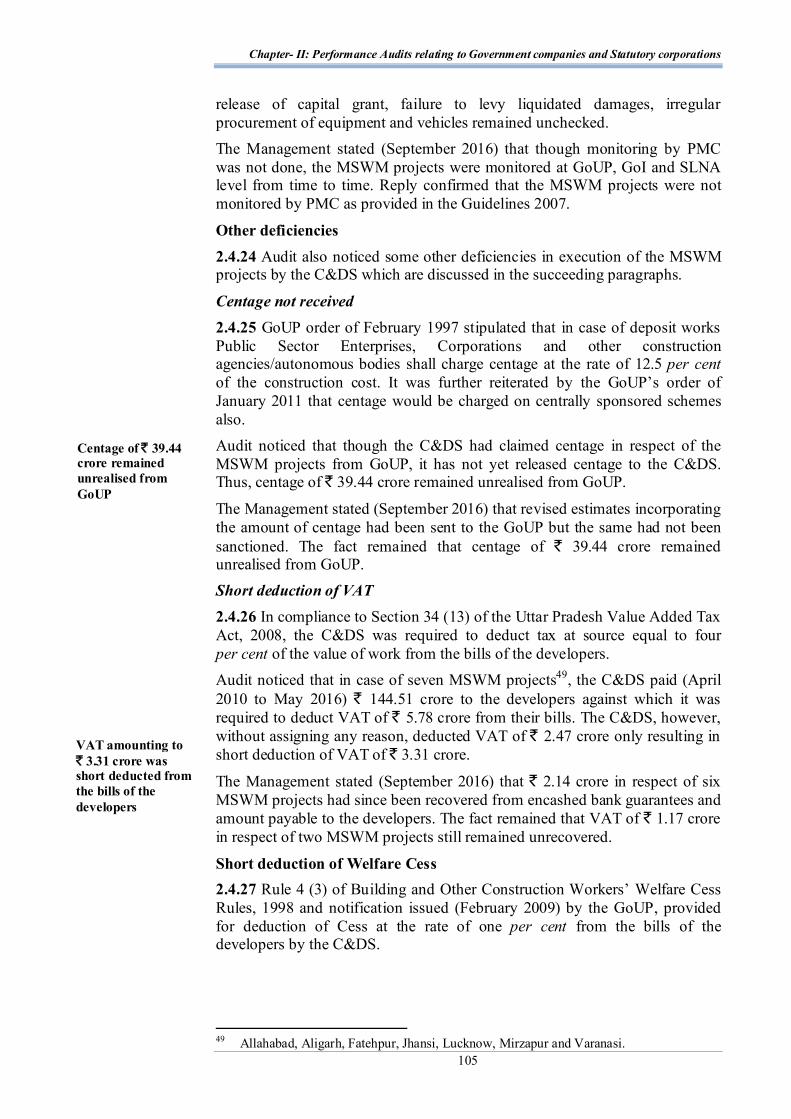
Chapter- II: Performance Audits relating to Government companies and Statutory corporations
105
release of capital grant, failure to levy liquidated damages, irregular procurement of equipment and vehicles remained unchecked. The Management stated (September 2016) that though monitoring by PMC was not done, the MSWM projects were monitored at GoUP, GoI and SLNA level from time to time. Reply confirmed that the MSWM projects were not monitored by PMC as provided in the Guidelines 2007.
Other deficiencies 2.4.24 Audit also noticed some other deficiencies in execution of the MSWM projects by the C&DS which are discussed in the succeeding paragraphs.
Centage not received 2.4.25 GoUP order of February 1997 stipulated that in case of deposit works Public Sector Enterprises, Corporations and other construction agencies/autonomous bodies shall charge centage at the rate of 12.5 per cent of the construction cost. It was further reiterated by the GoUP’s order of January 2011 that centage would be charged on centrally sponsored schemes also. Audit noticed that though the C&DS had claimed centage in respect of the MSWM projects from GoUP, it has not yet released centage to the C&DS. Thus, centage of ` 39.44 crore remained unrealised from GoUP.
The Management stated (September 2016) that revised estimates incorporating the amount of centage had been sent to the GoUP but the same had not been sanctioned. The fact remained that centage of ` 39.44 crore remained unrealised from GoUP. Short deduction of VAT 2.4.26 In compliance to Section 34 (13) of the Uttar Pradesh Value Added Tax Act, 2008, the C&DS was required to deduct tax at source equal to four per cent of the value of work from the bills of the developers. Audit noticed that in case of seven MSWM projects49, the C&DS paid (April 2010 to May 2016) ` 144.51 crore to the developers against which it was required to deduct VAT of ` 5.78 crore from their bills. The C&DS, however, without assigning any reason, deducted VAT of ` 2.47 crore only resulting in short deduction of VAT of ` 3.31 crore.
The Management stated (September 2016) that ` 2.14 crore in respect of six MSWM projects had since been recovered from encashed bank guarantees and amount payable to the developers. The fact remained that VAT of ` 1.17 crore in respect of two MSWM projects still remained unrecovered.
Short deduction of Welfare Cess 2.4.27 Rule 4 (3) of Building and Other Construction Workers’ Welfare Cess Rules, 1998 and notification issued (February 2009) by the GoUP, provided for deduction of Cess at the rate of one per cent from the bills of the developers by the C&DS.
49 Allahabad, Aligarh, Fatehpur, Jhansi, Lucknow, Mirzapur and Varanasi.
Centage of ̀ 39.44 crore remained unrealised from GoUP
VAT amounting to ` 3.31 crore was short deducted from the bills of the developers

Audit Report on Public Sector Undertakings for the year ended 31 March 2016
106
Audit noticed that C&DS paid (April 2010 to November 2015) ` 194.18 crore to the developers of 12 MSWM projects50 and deducted Cess of ` 5.60 lakh only from the bills of the developers, against deductible amount of ` 1.94 crore, resulting in short deduction of Cess of ` 1.88 crore. The Management stated (September 2016) that the MSWM projects were approved before applicability of Cess. Reply was not acceptable, as in the cases pointed out by audit, tenders were invited and finalised after notification by the GoUP in February 2009, hence, provision regarding deduction of Cess was applicable and the C&DS was required to deduct the same from the bills of the developers. Loss of interest due to not availing flexi/auto sweep facility
2.4.28 Banks provide flexi/auto sweep facility to their customers, on their request which carries higher rate of interest than the rate applicable to savings bank accounts. Audit noticed that the funds received for execution of seven MSWM projects51 were kept by the Units of C&DS in savings bank accounts without availing auto sweep/flexi facility; whereas, in case of other eight MSWM projects, auto sweep/flexi facility was availed. Thus, not availing auto sweep/flexi facility resulted in loss of interest of ` 1.34 crore52 on project funds.
The Management stated (September 2016) that accounts of Etawah and Muzaffarangar MSWM projects had been closed and flexi/auto sweep facility had been obtained in remaining MSWM projects. The fact remained that not availing auto sweep/flexi facility resulted in loss of interest of ` 1.34 crore on project funds.
Conclusion
Audit concluded that: Selection of eligible consultants and developers in a transparent and competitive manner was compromised as provisions of PPP Guidelines 2007 regarding selection of consultants and developers were not followed by C&DS;
Due to ineffective supervision by C&DS, MSWM projects were delayed and only 11 MSWM projects out of 27 MSWM projects could be completed by the C&DS and that too with a delay of three to five years. The remaining 16 MSWM projects were still incomplete despite a lapse of more than five to nine years resulting in blockade of ` 173.58 crore. Thus, the intended objective of the MSWM projects i.e. to dispose off 18.31 lakh tonne MSW per annum in a scientific manner in 16 cities, could not be achieved even after five to nine years since the sanction of these projects; and
50 Agra, Aligarh, Allahabad, Barabanki, Fatehpur, Jhansi, Kanpur, Lucknow, Mirzapur,
Moradabad, Pilkhuwa and Varanasi. 51 Allahabad, Etawah, Fatehpur, Jhansi, Kanpur, Lucknow and Muzaffarnagar. 52 Calculated at the rate of 2.5 per cent per annum being difference between interest rate
applicable on flexi/auto sweep facility and savings bank account.
Welfare Cess of ` 1.88 crore was short deducted from the bills of the developers
Chapter- II: Performance Audits relating to Government companies and Statutory corporations
107
C&DS failed to ensure compliance of provisions of the agreements regarding release of capital grant to developers, levy of liquidated damages and procurement of equipment/vehicles.
Recommendations Audit recommends that the C&DS should:
adhere to the provisions of PPP Guidelines 2007 for selection of eligible consultants and developers in a transparent and competitive manner;
devise an effective supervision framework to ensure completion of the MSWM projects within specified timelines to achieve the intended objective of the projects i.e. disposal of MSW in a scientific manner; and
develop suitable mechanism to ensure strict compliance with the terms and conditions of the agreements executed with developers.
Audit Report on Public Sector Undertakings for the year ended 31 March 2016
108
2.5 Audit on Recovery of dues by Uttar Pradesh Financial Corporation
Introduction
2.5.1 Uttar Pradesh Financial Corporation (Corporation) was established as a Statutory corporation on 1 November 1954 under Section 3 (1) of the State Financial Corporations (SFCs) Act, 1951 for providing loan assistance to small and medium scale industrial units in the State of Uttar Pradesh. Managing Director (MD) is the Chief Executive of the Corporation who looks after the day-to-day affairs with the assistance of two Chief Managers (CM) at the Headquarters and 12 Regional Managers (RM) in the field offices responsible for effecting recovery of dues. The detailed organisational set up and role of MD, CM and RM has been depicted in Organisational chart (Annexure-2.5.1). The total investment in the Corporation in the form of equity and loans was ` 929.48 crore (Equity: ` 179.28 crore and Long/short term borrowings: ` 750.20 crore) and its turnover1 was ` 15.58 crore as of March 2015. The Corporation had accumulated losses of ` 883.72 crore and external liabilities of ` 750.20 crore as on 31 March 2015.
It disbursed loans of ` 3,248 crore to 41,330 borrowers up to September 2007, out of which principal amount of ` 294.95 crore was pending for recovery from 5,812 borrowers besides interest of ` 29,762.372 crore as on 31 March 2016. SIDBI had been refinancing the loans given by the Corporation to industrial units but due to default in repayment of dues by the Corporation, SIDBI stopped refinancing of loan in June 2007. Resultantly, the Corporation also stopped (September 2007) disbursement of loan to the units. Total dues of SIDBI amounted ` 544.14 crore (including interest of ` 173.14 crore) in November 2007. The Corporation approached SIDBI (December 2008) for OTS which offered (March 2009) OTS at ` 275 crore i.e. 74 per cent of the principal payable in five equal yearly installments. The Corporation accepted the offer although it did not have funds to make the payment which was evident from the fact that total bank balance and investments of the Corporation ranged between ` 22.59 crore and ` 43.22 crore during the five years from 2009-10 to 2013-14 and the total profit of the Corporation was ` 58.98 crore during the same period. To meet out OTS obligation, the Corporation approached (March 2009) the State Government for providing funds but could not get funds from the Government. The Corporation, however, paid (July 2010) ` 2.10 crore to SIDBI with the request to reschedule the payment period from five to 15 years, again without obtaining firm commitment of funds from any source. The request was not acceded to by the SIDBI. Ultimately, the Appellate Authority of Debt Recovery Tribunal ordered (February 2016) the Corporation to deposit entire dues of ` 661.48 crore within two months failing which the movable and immovable property of the Corporation would be attached. The Corporation had filed (April 2016) a review petition in the Appellate Authority of the Debt Recovery Tribunal which was still pending (September 2016). 1 Turnover represents interest recovered on non-performing assets (NPA) accounts. 2 Interest of ` 29762.37 crore as on 31 December 2015.

Chapter- II: Performance Audits relating to Government companies and Statutory corporations
109
The Corporation had, however, not paid any amount to SIDBI against this order so far nor had its properties been sold (September 2016). Although the financial position of the Corporation had deteriorated in 2007, concerted efforts were not made by the Corporation until 2013 to get financial support from the GoUP. The Corporation forwarded (December 2013) a revival package to the GoUP only after a period of more than six years which was pending before the GoUP as of March 2016. It may be mentioned that SFCs of West Bengal and Odisha had resumed disbursing activity with the financial support of their respective State Governments.
Thus, due to failure of the Corporation in settling the dues of SIDBI at a reasonable amount, delay in approaching GoUP for revival of the Corporation and lack of response of GoUP to the Corporation, the Corporation, entrusted with the objective of promoting industrial units of the State, was on the verge of closure. A Performance Audit on “Liquidation of Non-Performing Assets” of the Corporation had featured in the Audit Report (Commercial) for the year 2007-08. The Performance Audit was not discussed so far (October 2016) by the Committee on Public Undertakings. As the sanction of loan was stopped by the Corporation from September 2007, recovery of dues remained the main activity of the Corporation. Therefore, this audit was conducted with the objective to assess whether action taken for recovery of dues was as per the provisions of SFCs Act and OTS guidelines and the Corporation had an effective internal control and monitoring mechanism. Audit examination involved scrutiny of records at the Headquarters of the Corporation and of five regions3, out of total 12 regions, selected on the basis of highest recovery. The methodology adopted for attaining the audit objectives consisted of explaining audit objectives to top management in the Entry conference held on 3 February 2016 and raising of audit queries. An Exit conference was held on 26 August 2016 with the Management and replies of the Management and Government were received in August and September 2016 respectively which had been duly considered.
Audit findings 2.5.2 The audit findings relating to recovery of dues, internal control and monitoring mechanism are discussed in succeeding paragraphs. Portfolio of outstanding loans 2.5.3 As per SIDBI guidelines 2005, Non-Performing Assets (NPA) are the loans against which installment of interest or principal remains due for more than 90 days. The NPA is further categorised as Sub-standard (default in payment continue up to 15 months), Doubtful-1 (default period ranges from 15 to 27 months), Doubtful-2 (default period ranges from 27 to 51 months), Doubtful-3 (default period continues for more than 51 months) and Loss category (loans against which no mortgaged asset is available). The assets-wise classification of dues of the Corporation as on 31 March 2016 is detailed in table 2.5.1.
3 Kanpur, Varanasi, Bareilly, Meerut and Noida.
Due to failure in settling dues of SIDBI, delay in approaching GoUP for revival of the Corporation and lack of response of GoUP to the Corporation, the Corporation was on the verge of closure
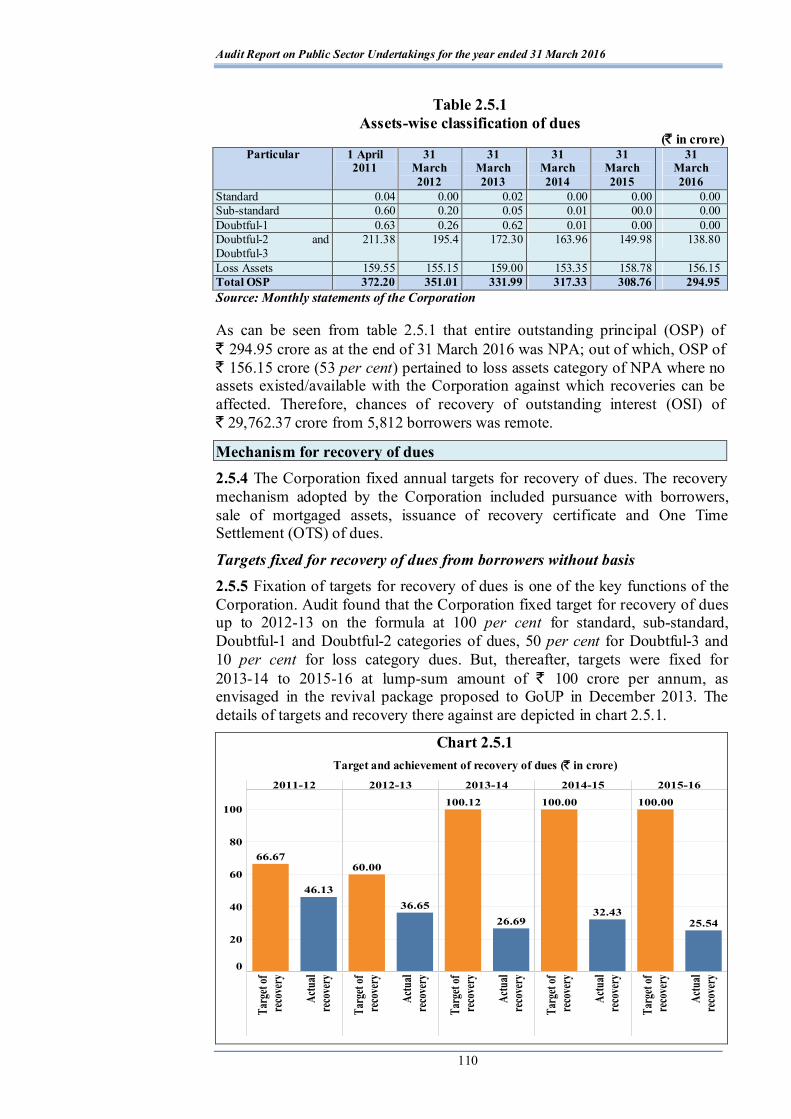
Audit Report on Public Sector Undertakings for the year ended 31 March 2016
110
Table 2.5.1 Assets-wise classification of dues
(` in crore) Particular 1 April
2011 31
March 2012
31 March 2013
31 March 2014
31 March 2015
31 March 2016
Standard 0.04 0.00 0.02 0.00 0.00 0.00 Sub-standard 0.60 0.20 0.05 0.01 00.0 0.00 Doubtful-1 0.63 0.26 0.62 0.01 0.00 0.00 Doubtful-2 and Doubtful-3
211.38 195.4 172.30 163.96 149.98 138.80
Loss Assets 159.55 155.15 159.00 153.35 158.78 156.15 Total OSP 372.20 351.01 331.99 317.33 308.76 294.95 Source: Monthly statements of the Corporation
As can be seen from table 2.5.1 that entire outstanding principal (OSP) of ` 294.95 crore as at the end of 31 March 2016 was NPA; out of which, OSP of ` 156.15 crore (53 per cent) pertained to loss assets category of NPA where no assets existed/available with the Corporation against which recoveries can be affected. Therefore, chances of recovery of outstanding interest (OSI) of ` 29,762.37 crore from 5,812 borrowers was remote.
Mechanism for recovery of dues 2.5.4 The Corporation fixed annual targets for recovery of dues. The recovery mechanism adopted by the Corporation included pursuance with borrowers, sale of mortgaged assets, issuance of recovery certificate and One Time Settlement (OTS) of dues.
Targets fixed for recovery of dues from borrowers without basis 2.5.5 Fixation of targets for recovery of dues is one of the key functions of the Corporation. Audit found that the Corporation fixed target for recovery of dues up to 2012-13 on the formula at 100 per cent for standard, sub-standard, Doubtful-1 and Doubtful-2 categories of dues, 50 per cent for Doubtful-3 and 10 per cent for loss category dues. But, thereafter, targets were fixed for 2013-14 to 2015-16 at lump-sum amount of ` 100 crore per annum, as envisaged in the revival package proposed to GoUP in December 2013. The details of targets and recovery there against are depicted in chart 2.5.1.
Chart 2.5.1 Target and achievement of recovery of dues (̀ in crore)
Chapter- II: Performance Audits relating to Government companies and Statutory corporations
111
The main activity of the Corporation was recovery of dues and hence, fixation of targets for recovery of dues should have been based on availability of manpower and realisability of dues. Audit noticed that the targets fixed were not based on any logical assessment and without considering constraints of the Corporation such as shortage of manpower, salary as per fourth pay commission, low rate of travelling allowance/dearness allowance for staff, lack of facilities like office vehicle, telephones etc. as also confirmed by the officers of the Corporation in feedback questionnaire issued by Aduit. Further, no incentive/disincentive was prescribed for achievement/ not achieving the targets. As a result, in none of the years the Corporation could achieve its target of recovery of dues. In fact the achievement of target declined from ` 46.13 crore (69.19 per cent) in 2011-12 to ` 25.54 crore (25.54 per cent) in 2015-16.
Process of recovery of dues
2.5.6 In case of defaults in repayment, the Regional Manager (RM) issues demand notice to borrower in pursuance of repayment of the dues. As per Sale Guidelines, after continuing default of two quarters, a notice under section 29 of SFCs Act is issued for attachment of prime/collateral securities giving a time of 15 days. If there is no positive response from borrower, RM advertises within one month of notice for sale of borrower’s unit. In case dues are not recovered by way of sale of assets, RC is issued by the Corporation for recovery of dues through District Revenue Authorities. Further, the Corporation has also introduced One Time Settlement (OTS) scheme to expedite recovery of dues. The role of Managing Director, Chief Manager and Regional Managers in following the process of recovery is discussed in Annexure-2.5.1. The deficiencies on the part of the Management in following the recovery process are discussed below: Delay in issuing notices 2.5.7 The first step in the process of recovery is issue of demand notice. The loan agreements entered into with the borrowers provide that in case of default in repayment, the Corporation shall issue demand show cause notice to borrowers/guarantors and persuade them to repay the dues. In case borrower does not pay the dues on pursuance, the Corporation shall issue notice under section 29 of the SFCs Act to take possession of the assets of the borrower and take action for sale of assets.
Audit noticed that in 10 cases (OSP: ` 5.25 crore and OSI: ` 385.45 crore) out of 182 cases test checked, show cause notices were issued with delay of two months to 24 years and notice under section 29 were issued with delay of seven months to 24 years in 25 cases (OSP: ` 12.19 crore and OSI: ` 849.20 crore) out of 182 selected cases as detailed in Annexures-2.5.2 and 2.5.3. The delay in issuing show-cause notices and notices under section 29 of SFCs Act, in turn, caused delay in recovery of the dues. The main reasons, as analysed by audit, were lack of system of reviewing severe default cases at regular intervals by Headquarters of the Corporation and lack of vigorous pursuance with the borrowers by the Regional offices.
The Corporation failed to achieve recovery targets in all the five years and recovery of dues declined from ` 46.13 crore in 2011-12 to ` 25.54 crore in 2015-16
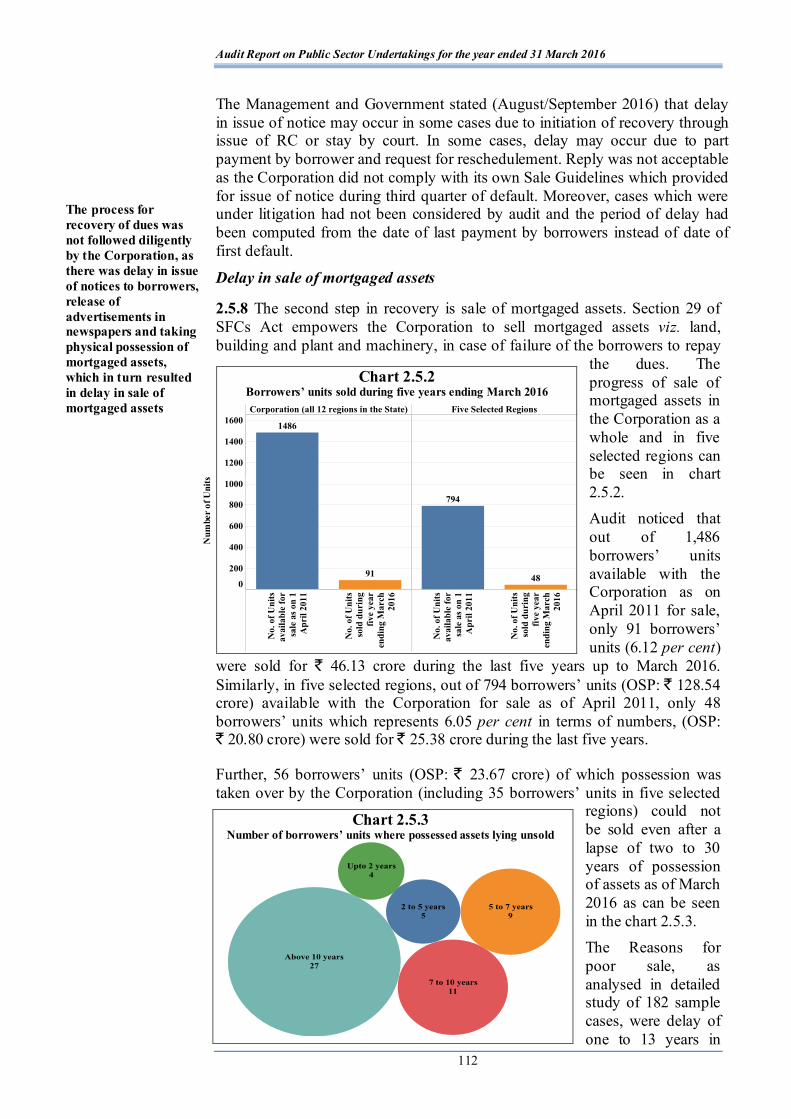
Audit Report on Public Sector Undertakings for the year ended 31 March 2016
112
The Management and Government stated (August/September 2016) that delay in issue of notice may occur in some cases due to initiation of recovery through issue of RC or stay by court. In some cases, delay may occur due to part payment by borrower and request for reschedulement. Reply was not acceptable as the Corporation did not comply with its own Sale Guidelines which provided for issue of notice during third quarter of default. Moreover, cases which were under litigation had not been considered by audit and the period of delay had been computed from the date of last payment by borrowers instead of date of first default.
Delay in sale of mortgaged assets
2.5.8 The second step in recovery is sale of mortgaged assets. Section 29 of SFCs Act empowers the Corporation to sell mortgaged assets viz. land, building and plant and machinery, in case of failure of the borrowers to repay
the dues. The progress of sale of mortgaged assets in the Corporation as a whole and in five selected regions can be seen in chart 2.5.2. Audit noticed that out of 1,486 borrowers’ units available with the Corporation as on April 2011 for sale, only 91 borrowers’ units (6.12 per cent)
were sold for ` 46.13 crore during the last five years up to March 2016. Similarly, in five selected regions, out of 794 borrowers’ units (OSP: ` 128.54 crore) available with the Corporation for sale as of April 2011, only 48 borrowers’ units which represents 6.05 per cent in terms of numbers, (OSP: ` 20.80 crore) were sold for ` 25.38 crore during the last five years.
Further, 56 borrowers’ units (OSP: ` 23.67 crore) of which possession was taken over by the Corporation (including 35 borrowers’ units in five selected
regions) could not be sold even after a lapse of two to 30 years of possession of assets as of March 2016 as can be seen in the chart 2.5.3. The Reasons for poor sale, as analysed in detailed study of 182 sample cases, were delay of one to 13 years in
Chart 2.5.2 Borrowers’ units sold during five years ending March 2016
Chart 2.5.3 Number of borrowers’ units where possessed assets lying unsold
The process for recovery of dues was not followed diligently by the Corporation, as there was delay in issue of notices to borrowers, release of advertisements in newspapers and taking physical possession of mortgaged assets, which in turn resulted in delay in sale of mortgaged assets
Num
ber
of U
nits
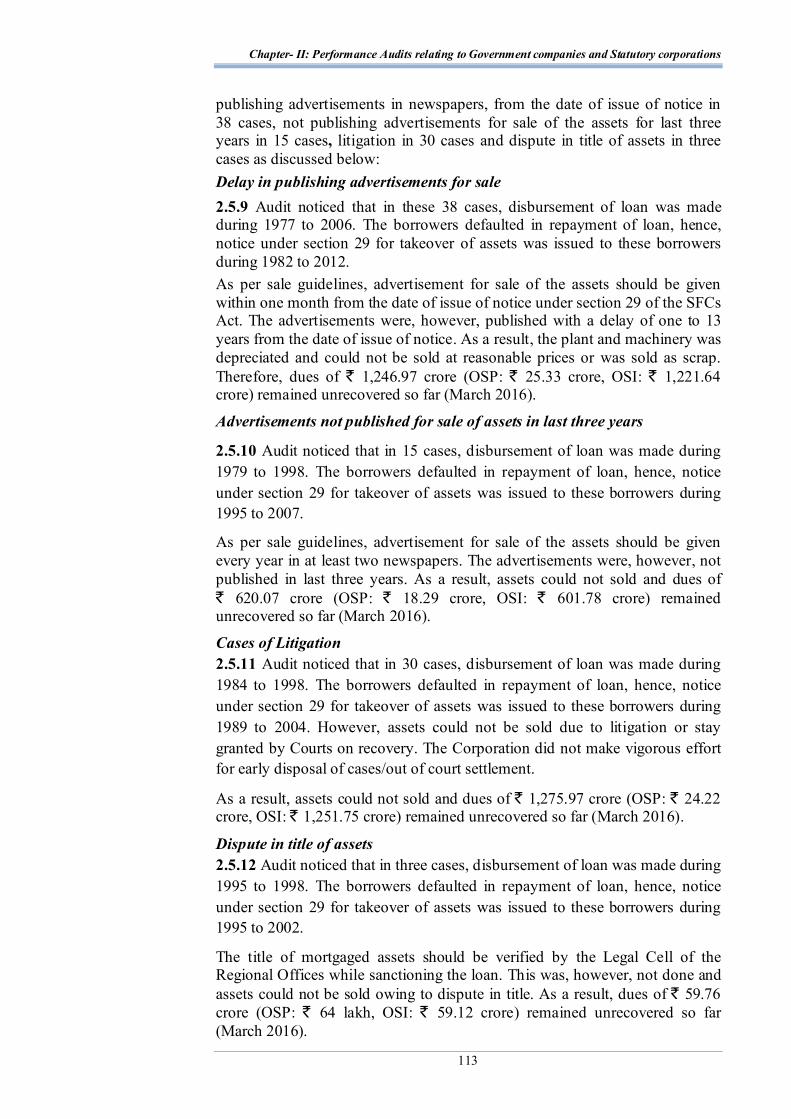
Chapter- II: Performance Audits relating to Government companies and Statutory corporations
113
publishing advertisements in newspapers, from the date of issue of notice in 38 cases, not publishing advertisements for sale of the assets for last three years in 15 cases, litigation in 30 cases and dispute in title of assets in three cases as discussed below: Delay in publishing advertisements for sale 2.5.9 Audit noticed that in these 38 cases, disbursement of loan was made during 1977 to 2006. The borrowers defaulted in repayment of loan, hence, notice under section 29 for takeover of assets was issued to these borrowers during 1982 to 2012. As per sale guidelines, advertisement for sale of the assets should be given within one month from the date of issue of notice under section 29 of the SFCs Act. The advertisements were, however, published with a delay of one to 13 years from the date of issue of notice. As a result, the plant and machinery was depreciated and could not be sold at reasonable prices or was sold as scrap. Therefore, dues of ` 1,246.97 crore (OSP: ` 25.33 crore, OSI: ` 1,221.64 crore) remained unrecovered so far (March 2016).
Advertisements not published for sale of assets in last three years
2.5.10 Audit noticed that in 15 cases, disbursement of loan was made during 1979 to 1998. The borrowers defaulted in repayment of loan, hence, notice under section 29 for takeover of assets was issued to these borrowers during 1995 to 2007.
As per sale guidelines, advertisement for sale of the assets should be given every year in at least two newspapers. The advertisements were, however, not published in last three years. As a result, assets could not sold and dues of ` 620.07 crore (OSP: ` 18.29 crore, OSI: ` 601.78 crore) remained unrecovered so far (March 2016).
Cases of Litigation 2.5.11 Audit noticed that in 30 cases, disbursement of loan was made during 1984 to 1998. The borrowers defaulted in repayment of loan, hence, notice under section 29 for takeover of assets was issued to these borrowers during 1989 to 2004. However, assets could not be sold due to litigation or stay granted by Courts on recovery. The Corporation did not make vigorous effort for early disposal of cases/out of court settlement.
As a result, assets could not sold and dues of ` 1,275.97 crore (OSP: ` 24.22 crore, OSI: ` 1,251.75 crore) remained unrecovered so far (March 2016).
Dispute in title of assets 2.5.12 Audit noticed that in three cases, disbursement of loan was made during 1995 to 1998. The borrowers defaulted in repayment of loan, hence, notice under section 29 for takeover of assets was issued to these borrowers during 1995 to 2002.
The title of mortgaged assets should be verified by the Legal Cell of the Regional Offices while sanctioning the loan. This was, however, not done and assets could not be sold owing to dispute in title. As a result, dues of ` 59.76 crore (OSP: ` 64 lakh, OSI: ` 59.12 crore) remained unrecovered so far (March 2016).
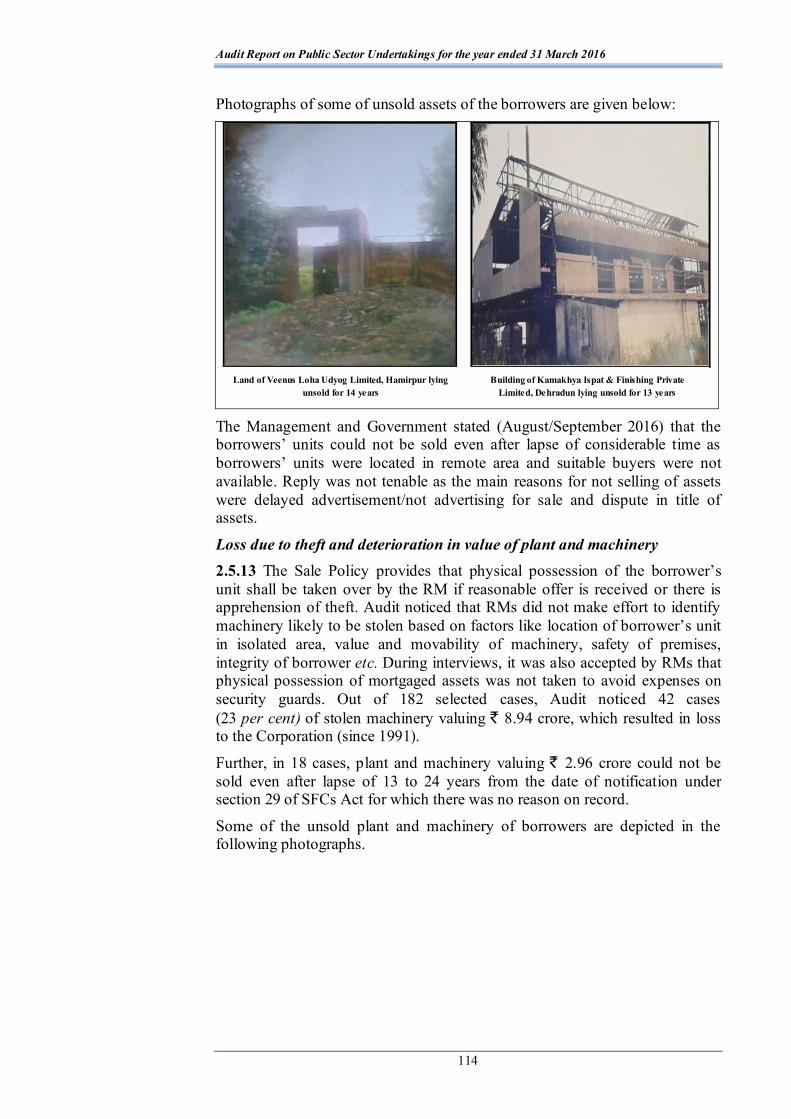
Audit Report on Public Sector Undertakings for the year ended 31 March 2016
114
Photographs of some of unsold assets of the borrowers are given below:
The Management and Government stated (August/September 2016) that the borrowers’ units could not be sold even after lapse of considerable time as borrowers’ units were located in remote area and suitable buyers were not available. Reply was not tenable as the main reasons for not selling of assets were delayed advertisement/not advertising for sale and dispute in title of assets.
Loss due to theft and deterioration in value of plant and machinery 2.5.13 The Sale Policy provides that physical possession of the borrower’s unit shall be taken over by the RM if reasonable offer is received or there is apprehension of theft. Audit noticed that RMs did not make effort to identify machinery likely to be stolen based on factors like location of borrower’s unit in isolated area, value and movability of machinery, safety of premises, integrity of borrower etc. During interviews, it was also accepted by RMs that physical possession of mortgaged assets was not taken to avoid expenses on security guards. Out of 182 selected cases, Audit noticed 42 cases (23 per cent) of stolen machinery valuing ` 8.94 crore, which resulted in loss to the Corporation (since 1991).
Further, in 18 cases, plant and machinery valuing ` 2.96 crore could not be sold even after lapse of 13 to 24 years from the date of notification under section 29 of SFCs Act for which there was no reason on record.
Some of the unsold plant and machinery of borrowers are depicted in the following photographs.
Land of Veenus Loha Udyog Limited, Hamirpur lying unsold for 14 years
Building of Kamakhya Ispat & Finishing Private Limited, Dehradun lying unsold for 13 years
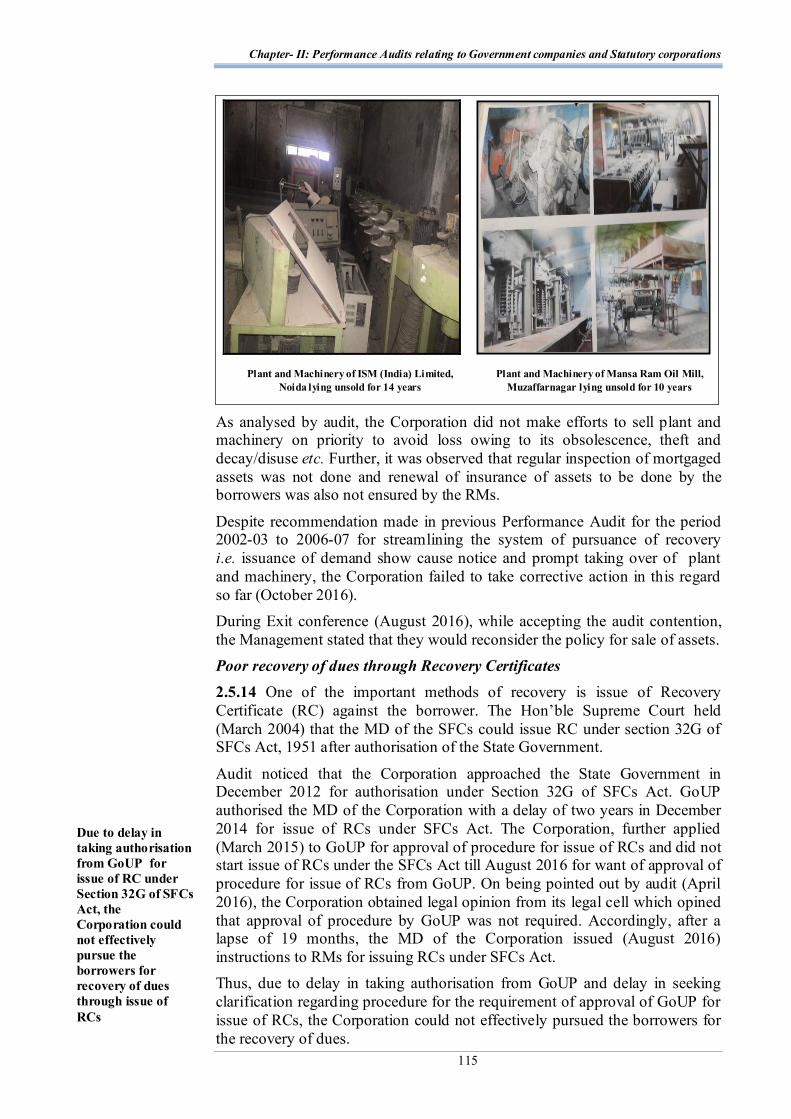
Chapter- II: Performance Audits relating to Government companies and Statutory corporations
115
As analysed by audit, the Corporation did not make efforts to sell plant and machinery on priority to avoid loss owing to its obsolescence, theft and decay/disuse etc. Further, it was observed that regular inspection of mortgaged assets was not done and renewal of insurance of assets to be done by the borrowers was also not ensured by the RMs.
Despite recommendation made in previous Performance Audit for the period 2002-03 to 2006-07 for streamlining the system of pursuance of recovery i.e. issuance of demand show cause notice and prompt taking over of plant and machinery, the Corporation failed to take corrective action in this regard so far (October 2016). During Exit conference (August 2016), while accepting the audit contention, the Management stated that they would reconsider the policy for sale of assets. Poor recovery of dues through Recovery Certificates 2.5.14 One of the important methods of recovery is issue of Recovery Certificate (RC) against the borrower. The Hon’ble Supreme Court held (March 2004) that the MD of the SFCs could issue RC under section 32G of SFCs Act, 1951 after authorisation of the State Government.
Audit noticed that the Corporation approached the State Government in December 2012 for authorisation under Section 32G of SFCs Act. GoUP authorised the MD of the Corporation with a delay of two years in December 2014 for issue of RCs under SFCs Act. The Corporation, further applied (March 2015) to GoUP for approval of procedure for issue of RCs and did not start issue of RCs under the SFCs Act till August 2016 for want of approval of procedure for issue of RCs from GoUP. On being pointed out by audit (April 2016), the Corporation obtained legal opinion from its legal cell which opined that approval of procedure by GoUP was not required. Accordingly, after a lapse of 19 months, the MD of the Corporation issued (August 2016) instructions to RMs for issuing RCs under SFCs Act. Thus, due to delay in taking authorisation from GoUP and delay in seeking clarification regarding procedure for the requirement of approval of GoUP for issue of RCs, the Corporation could not effectively pursued the borrowers for the recovery of dues.
Due to delay in taking authorisation from GoUP for issue of RC under Section 32G of SFCs Act, the Corporation could not effectively pursue the borrowers for recovery of dues through issue of RCs
Plant and Machinery of ISM (India) Limited, Noida lying unsold for 14 years
Plant and Machinery of Mansa Ram Oil Mill, Muzaffarnagar lying unsold for 10 years
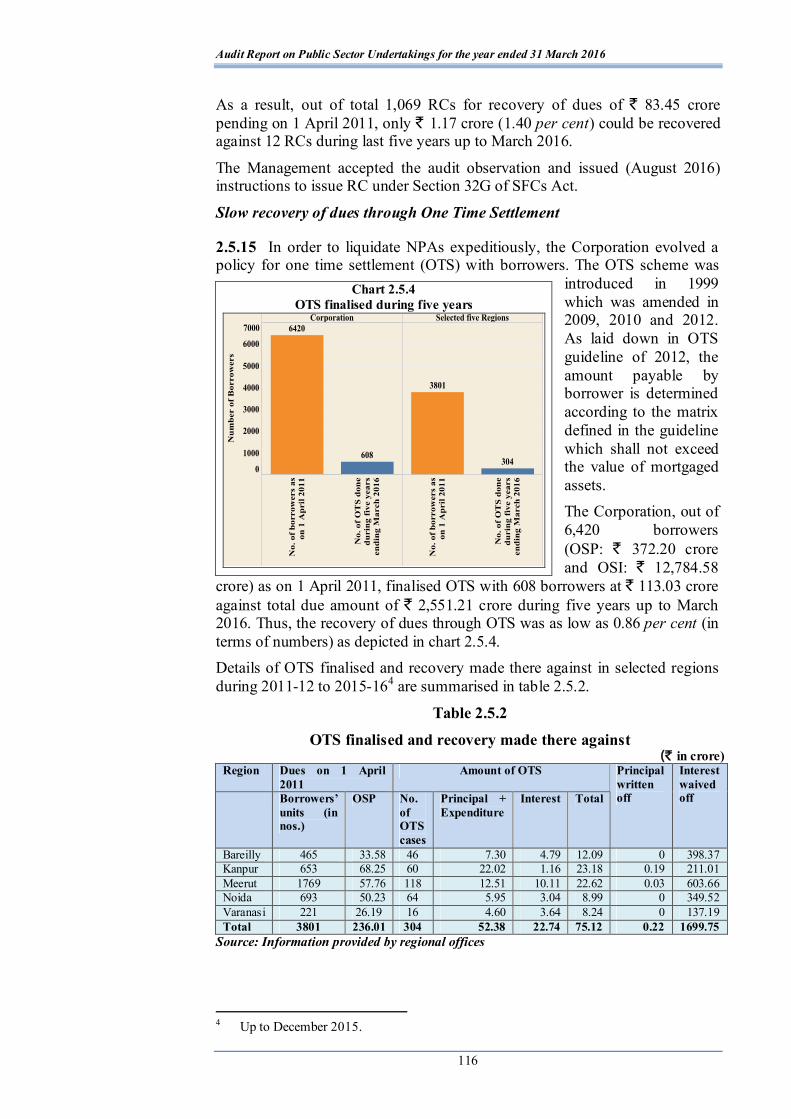
Audit Report on Public Sector Undertakings for the year ended 31 March 2016
116
As a result, out of total 1,069 RCs for recovery of dues of ` 83.45 crore pending on 1 April 2011, only ` 1.17 crore (1.40 per cent) could be recovered against 12 RCs during last five years up to March 2016.
The Management accepted the audit observation and issued (August 2016) instructions to issue RC under Section 32G of SFCs Act.
Slow recovery of dues through One Time Settlement
2.5.15 In order to liquidate NPAs expeditiously, the Corporation evolved a policy for one time settlement (OTS) with borrowers. The OTS scheme was
introduced in 1999 which was amended in 2009, 2010 and 2012. As laid down in OTS guideline of 2012, the amount payable by borrower is determined according to the matrix defined in the guideline which shall not exceed the value of mortgaged assets. The Corporation, out of 6,420 borrowers (OSP: ` 372.20 crore and OSI: ` 12,784.58
crore) as on 1 April 2011, finalised OTS with 608 borrowers at ` 113.03 crore against total due amount of ` 2,551.21 crore during five years up to March 2016. Thus, the recovery of dues through OTS was as low as 0.86 per cent (in terms of numbers) as depicted in chart 2.5.4. Details of OTS finalised and recovery made there against in selected regions during 2011-12 to 2015-164 are summarised in table 2.5.2.
Table 2.5.2
OTS finalised and recovery made there against (` in crore)
Region Dues on 1 April 2011
Amount of OTS
Borrowers’ units (in nos.)
OSP No. of OTS cases
Principal + Expenditure
Interest Total
Principal written off
Interest waived off
Bareilly 465 33.58 46 7.30 4.79 12.09 0 398.37 Kanpur 653 68.25 60 22.02 1.16 23.18 0.19 211.01 Meerut 1769 57.76 118 12.51 10.11 22.62 0.03 603.66 Noida 693 50.23 64 5.95 3.04 8.99 0 349.52 Varanasi 221 26.19 16 4.60 3.64 8.24 0 137.19 Total 3801 236.01 304 52.38 22.74 75.12 0.22 1699.75
Source: Information provided by regional offices
4 Up to December 2015.
Chart 2.5.4 OTS finalised during five years
Chapter- II: Performance Audits relating to Government companies and Statutory corporations
117
It may be seen from table 2.5.2 that out of 3,801 outstanding cases as of April 2011, only 304 cases (eight per cent) were settled during five years. Further, against total interest of ` 1,722.49 crore pending against these 304 cases, recovery of interest through OTS was only ` 22.74 crore (1.32 per cent) and ` 1,699.75 crore (98.68 per cent) was waived off.
The main reasons for slow recovery through OTS, as analysed by audit, were that coercive action could not be taken by regional offices to pressurise the borrowers for OTS in absence of authority of the Corporation to issue RC under SFCs Act. There was absence of mechanism such as cross check with other Government Departments like Income Tax Department, Sales/Trade Tax Department, Pollution Control Board etc. to identify and pursue defaulting borrowers with high net worth and having potential to pay for OTS. In addition, OTS guidelines itself were cumbersome, wide publicity of OTS scheme was not done and limited period special drives were also not undertaken by the Corporation for encouraging borrowers for OTS and ensure speedy clearance of dues. This was also stressed upon (September 2016) by the RMs, Recovery Officers and borrowers in their feedback. The Management and Government stated (August/September 2016) that the Corporation already had a mechanism to determine high net worth borrowers through field offices. Reply was not acceptable as net worth of the borrower was estimated only at the time of OTS and the Corporation did not have mechanism to pursue the high net worth borrowers to pay their OTS. Inaction against defaulters of OTS
2.5.16 Clause 11 and Clause 20 (iii) of OTS Guidelines- 2012 provide that in case the OTS applicant defaults to pay 25 per cent of OTS amount within one month from the date of approval of the OTS or fails to deposit at least 50 per cent of OTS amount within scheduled period (maximum two years), the OTS will be cancelled and amount deposited shall be adjusted towards interest.
Audit noticed that in six out of 304 OTS cases, out of OTS amount of ` 1.05 crore, only ` 30.01 lakh was paid by the borrowers within the stipulated period. The Regional offices did not initiate any action for cancellation of OTS and for sale of assets of the defaulted borrowers as per guidelines. This resulted in dues of ` 74.99 lakh remaining unrecovered.
The Management and Government stated (August/September 2016) that there was inbuilt provision in sanction letter of OTS for automatic cancellation of OTS in case borrower failed to adhere to the terms and conditions of OTS. Reply was not acceptable as delay in cancellation of OTS resulted in delay in initiation of sale process of mortgaged assets. Loss due to finalisation of OTS below the value of mortgaged assets 2.5.17 In cases, where value of mortgaged assets is more than OTS amount computed as per OTS guidelines, it would be in the interest of the Corporation that recovery is made by sale of mortgaged asset of the borrower instead of OTS so that maximum amount is recovered.
It was observed that in five cases, the OTS was finalised for ` 2.16 crore against total dues of ` 3.88 crore despite the value of mortgaged assets being ` 11.36 crore. This resulted in loss of ` 1.72 crore to the Corporation (Annexure 2.5.4).
Audit Report on Public Sector Undertakings for the year ended 31 March 2016
118
Further, in three cases, involving total dues of ` 59.30 crore, OTS was finalised for ` 6.57 crore against which value of mortgaged assets was ` 7.53 crore resulting in loss of ` 96 lakh (Annexure 2.5.4).
Thus, despite being aware that the value of mortgaged assets was more than the amount of dues/OTS amount, the regional offices accepted OTS instead of sale of mortgaged assets. This resulted in loss of ` 2.68 crore to the Corporation. Despite the recommendation made in previous Performance Audit that OTS should be done in accordance with the valuation of available mortgaged security, no corrective action was taken. The Management and Government stated (August/September 2016) that the Corporation being a developmental institution, recovered more than principal plus expenses plus simple interest amount in OTS which covered the borrowing cost of the Corporation. Reply was not acceptable as sale of assets instead of OTS was more beneficial for the Corporation in these cases as value of mortgaged assets was significantly higher than the total dues/OTS amount. Failure in recovery of interest on outstanding loans 2.5.18 The main source of earning of the Corporation was recovery of interest on loans given to borrowers. Due to delay in initiation of recovery proceedings and not taking timely action for realisation of dues, the Corporation could recover interest of only ` 79.85 crore during 2011-12 to 2015-16 against total outstanding interest of ` 12,784.58 crore from 6,420 borrowers as on 1 April 2011. The main reason for negligible recovery against interest was lack of monitoring of interest recovery by Headquarters as details of interest due were neither maintained at Headquarters nor reported by regional offices in their monthly statements submitted to Headquarters. Delay in recovery procedure also contributed to accumulation of interest and its meager recovery. Because of the failure to recover the interest amount, the Corporation suffered financial loss and had to stop its main activity of lending from September 2007. The Management and Government stated (August/September 2016) that the recovery of the interest amount appeared to be on lower side because 70 to 75 per cent of the interest amount was penal and compound interest which was notional and not recoverable. Reply was not tenable as agreement with borrowers provided for recovery of penal and compound interest in case of default. Moreover, accumulation of interest was due to delay in recovery of dues.
Internal Control and Monitoring mechanism
2.5.19 The Corporation has not framed recovery manual in order to streamline the recovery process and specify the course of action to be taken for regular monitoring and pursuance of defaulting cases. Audit noticed weakness in internal control with regard to following:
The monthly statements submitted by Regional offices to Headquarter did not contain information regarding outstanding OSI and number of borrowers. In absence of updated outstanding position of dues of individual borrowers,
Finalisation of OTS below value of mortgaged assets in eight cases resulted in loss of ` 2.68 crore to the Corporation
Chapter- II: Performance Audits relating to Government companies and Statutory corporations
119
the Headquarter could not monitor the recovery of interest which was the main source of its income.
The Corporation did not evolve any system for verification of addresses of borrowers at regular intervals. Out of 182 cases test checked, in 39 cases, borrowers (OSP: ` 18.90 crore and OSI: ` 1022.86 crore) were not traceable at their given addresses.
Out of 182 cases test checked, there was no communication with 25 borrowers (OSP: ` 3.37 crore and OSI: ` 306.07 crore) for three years.
The Internal Audit wing at Headquarters with present staff position of one officer and seven officials, was defunct as no internal audit was conducted since the last 10 years. The position of outstanding previous reports of internal audit as well as compliance to the same was not produced to audit.
The Udyog Bandhu (UB) was created as a society in the State by Government of Uttar Pradesh to facilitate investment in industrial and service sector, besides solving various problems of existing and upcoming industries related to different Government Departments. UB had lost its role after discontinuance of sanction/disbursement of loan to industrial units by the Corporation from September 2007 but due to ineffective internal control, the Corporation continued to contribute to UB and made avoidable payment of ` 70 lakh between 2008-09 and 2014-15.
Conclusion
Audit concluded that:
the Corporation failed to settle the dues of SIDBI at a reasonable amount as OTS was accepted without ascertaining source of fund. This, along with the delay in approaching GoUP for revival of the Corporation and lack of response of GoUP brought the Corporation on the verge of closure;
the Corporation failed to achieve recovery targets in all the five years due to ineffective efforts regarding recovery of dues at every stage viz, pursuance with borrowers, sale of mortgaged assets, issuance of RC and one time settlement. As a result, recovery of dues declined from ` 46.13 crore (69.19 per cent) in 2011-12 to ` 25.54 crore (25.54 per cent) in 2015-16; and
the Corporation did not develop any mechanism to ensure follow-up of the recommendations made by audit. Irregularities/shortcomings commented upon in previous Performance Audit still existed.
Recommendations
Audit recommends that:
the Corporation should vigorously pursue with GoUP for revival of Corporation in line with other States, for lifting of restriction on disbursement of loan and for settlement of dues with SIDBI; and
the Corporation should revise sale and OTS policies from time to time for quick liquidation of NPAs; limited period drives may be introduced; willful defaulters may be identified and efforts for recovery be made from them.
Audit Report on Public Sector Undertakings for the year ended 31 March 2016
120
2.6 Follow-up Audit of Performance Audit on Functioning of Uttar Pradesh State Road Transport Corporation
Introduction
2.6.1 Performance Audit on “Functioning of Uttar Pradesh State Road Transport Corporation” covering the period from April 2004 to March 2009 was featured as paragraph 3.1 of Chapter-III of the Audit Report (Commercial) of the Comptroller and Auditor General of India for the year ended 31 March 2009, Government of Uttar Pradesh (GoUP). The Audit Report was laid in the State Legislature in February 2010. The Performance Audit has not been discussed by the Committee on Public Undertaking (COPU) so far (October 2016).
The following recommendations of the performance audit were accepted by the Uttar Pradesh Road Transport Corporation (Corporation)/GoUP.
For the Corporation expand its operation on routes not nationalised by increasing hired buses to provide adequate, economical and effective service in the State;
take steps to frame action plan with the State Government for timely recovery of dues;
Speed up the efforts for tapping other than conventional sources of Revenue on a large scale under Public Private Partnership (PPP) which will result in steady inflow of revenue without additional investment; and
Top management should monitor the important operational parameters and take remedial measures for improvement.
For the Government formulate State Transport Policy on the lines of National Transport Policy;
appoint Chief Executive of the Corporation for a considerable period in view of consistency and continuity for the purpose of formulation and execution of Corporate Plan; and
appoint an independent regulator to regulate fares and formulate standards for transport services in the State.
Scope of Audit and Methodology 2.6.2 The main objective of conducting a follow-up audit was to assess the progress made towards implementation of the accepted recommendations of the previous performance audit by the Corporation/GoUP. The audit was conducted during October 2015 to March 2016.
Audit methodology included examination of the records of Headquarters, five selected Regional Offices1 and seven related Depots2 that were previously covered during the performance audit in the year 2009 and records of the transport department of GoUP for the period 2009-10 to 2015-16. In order to explain the objectives of the follow-up audit, its methodology, scope and elicit views of the Corporation/GoUP, an Entry conference was held
1 Ghaziabad, Agra, Moradabad, Azamgarh and Varanasi. 2 Sahibabad, Kaushabmi, Idgah, Peetal Nagari, Dr. Ambedkar, Kashi and Varanasi Cantt.
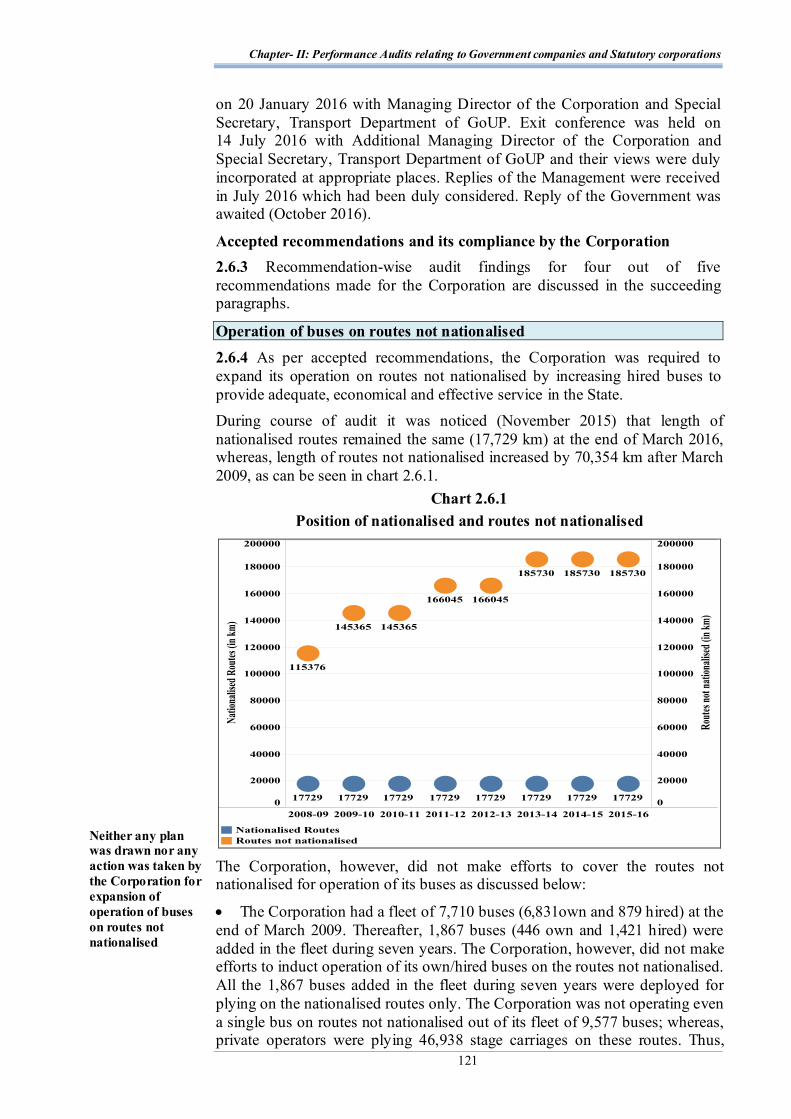
Chapter- II: Performance Audits relating to Government companies and Statutory corporations
121
on 20 January 2016 with Managing Director of the Corporation and Special Secretary, Transport Department of GoUP. Exit conference was held on 14 July 2016 with Additional Managing Director of the Corporation and Special Secretary, Transport Department of GoUP and their views were duly incorporated at appropriate places. Replies of the Management were received in July 2016 which had been duly considered. Reply of the Government was awaited (October 2016).
Accepted recommendations and its compliance by the Corporation 2.6.3 Recommendation-wise audit findings for four out of five recommendations made for the Corporation are discussed in the succeeding paragraphs.
Operation of buses on routes not nationalised 2.6.4 As per accepted recommendations, the Corporation was required to expand its operation on routes not nationalised by increasing hired buses to provide adequate, economical and effective service in the State. During course of audit it was noticed (November 2015) that length of nationalised routes remained the same (17,729 km) at the end of March 2016, whereas, length of routes not nationalised increased by 70,354 km after March 2009, as can be seen in chart 2.6.1.
Chart 2.6.1 Position of nationalised and routes not nationalised
The Corporation, however, did not make efforts to cover the routes not nationalised for operation of its buses as discussed below:
The Corporation had a fleet of 7,710 buses (6,831own and 879 hired) at the end of March 2009. Thereafter, 1,867 buses (446 own and 1,421 hired) were added in the fleet during seven years. The Corporation, however, did not make efforts to induct operation of its own/hired buses on the routes not nationalised. All the 1,867 buses added in the fleet during seven years were deployed for plying on the nationalised routes only. The Corporation was not operating even a single bus on routes not nationalised out of its fleet of 9,577 buses; whereas, private operators were plying 46,938 stage carriages on these routes. Thus,
Neither any plan was drawn nor any action was taken by the Corporation for expansion of operation of buses on routes not nationalised
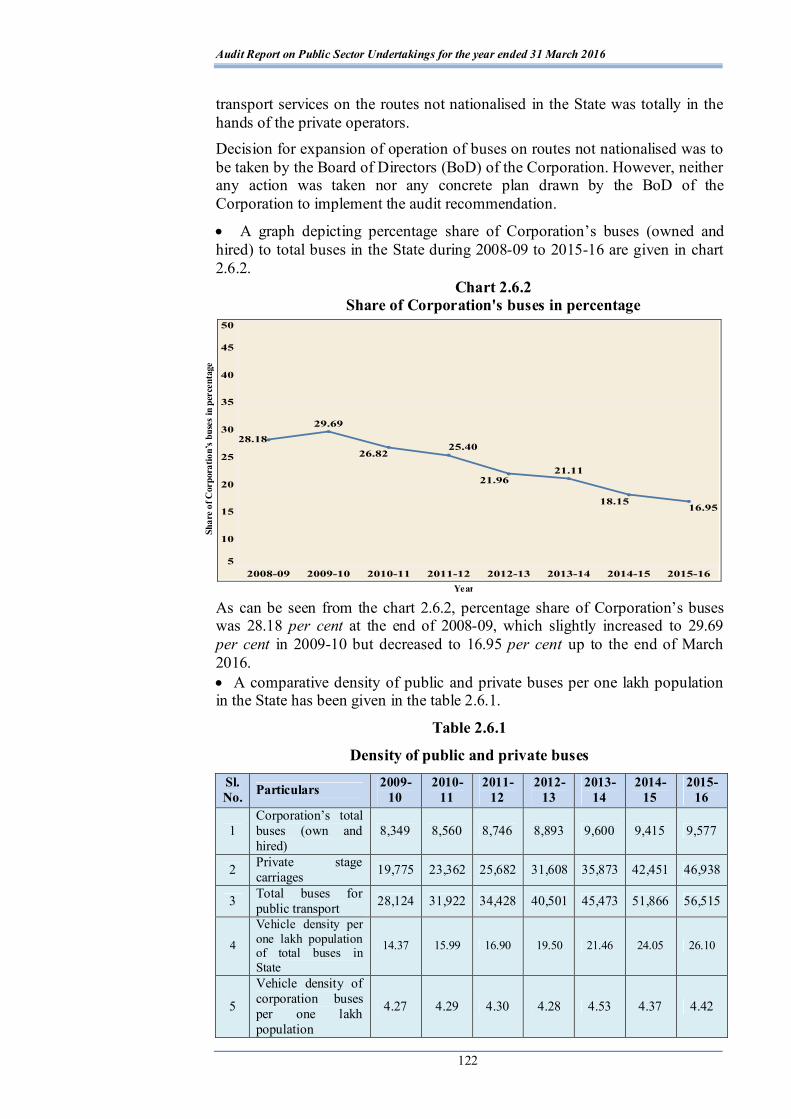
Audit Report on Public Sector Undertakings for the year ended 31 March 2016
122
transport services on the routes not nationalised in the State was totally in the hands of the private operators. Decision for expansion of operation of buses on routes not nationalised was to be taken by the Board of Directors (BoD) of the Corporation. However, neither any action was taken nor any concrete plan drawn by the BoD of the Corporation to implement the audit recommendation.
A graph depicting percentage share of Corporation’s buses (owned and hired) to total buses in the State during 2008-09 to 2015-16 are given in chart 2.6.2.
Chart 2.6.2 Share of Corporation's buses in percentage
As can be seen from the chart 2.6.2, percentage share of Corporation’s buses was 28.18 per cent at the end of 2008-09, which slightly increased to 29.69 per cent in 2009-10 but decreased to 16.95 per cent up to the end of March 2016. A comparative density of public and private buses per one lakh population in the State has been given in the table 2.6.1.
Table 2.6.1
Density of public and private buses Sl. No. Particulars 2009-
10 2010-
11 2011-
12 2012-
13 2013-
14 2014-
15 2015-
16
1 Corporation’s total buses (own and hired)
8,349 8,560 8,746 8,893 9,600 9,415 9,577
2 Private stage carriages 19,775 23,362 25,682 31,608 35,873 42,451 46,938
3 Total buses for public transport 28,124 31,922 34,428 40,501 45,473 51,866 56,515
4
Vehicle density per one lakh population of total buses in State
14.37 15.99 16.90 19.50 21.46 24.05 26.10
5
Vehicle density of corporation buses per one lakh population
4.27 4.29 4.30 4.28 4.53 4.37 4.42
Shar
e of
Cor
pora
tion’
s bu
ses
in p
erce
ntag
e
Year
Chapter- II: Performance Audits relating to Government companies and Statutory corporations
123
Sl. No. Particulars 2009-
10 2010-
11 2011-
12 2012-
13 2013-
14 2014-
15 2015-
16
6 Vehicle density of private buses per one lakh population
10.10 11.70 12.60 15.22 16.93 19.68 21.68
As can be seen from table 2.6.1, the density level of vehicles of the Corporation remained stagnant between 4.27 and 4.53 buses in the subsequent seven years after recommendation made in the previous performance audit. Whereas, Maharashtra State Road Transport Corporation, which was serving in less populous State of Maharashtra, had vehicle density of 15.53 buses per one lakh population in 2016. Thus, the Corporation was not able to keep pace with the growing demand for public transport.
Thus, the recommendation made in previous performance audit to expand its operation on routes not nationalised by increasing hired buses has not been complied with. The Management stated (July 2016) that request had been sent (August 2015) to the Transport Commissioner of GoUP for issuing permits of private buses in favour of the Corporation for operation on routes not nationalised. Reply was not acceptable as 54 permits were issued by the Transport Department for operation of busses on routes not nationalised but the Corporation failed to operate even a single bus on routes not nationalised as of August 2016.
Action plan for timely recovery of dues
2.6.5 As per accepted recommendation, the Corporation needed to take steps to frame action plan with State Government for timely recovery of dues.
To analyse response of the Corporation to this recommendation, Audit checked (November 2015) the position of dues in the Corporation. However, the observation reflected the dismal position as the outstanding dues have risen from ` 40.74 crore in 2009-10 to ` 83.02 crore as end of the March 2016.
Some of the chronic cases pending of dues are discussed below:
On account of claims for losses on operation of buses in area of NOIDA/Greater NOIDA Authorities, ` 7.65 crore was pending at the end of March 2009 which increased to ` 9.56 crore at the end of March 2016.
In Varanasi, Moradabad and Agra regions, an amount of ` 44.79 lakh was pending against a political party {Congress-(I)} since 1982.
During test check of five regions, it was noticed that the bills amounting to ` 3.74 crore sent to various Government departments up to March 2016 (age-wise details not available) were not got verified from the Government departments (Annexure-2.6.1).
Inspite of heavy dues pending with NOIDA/Greater NOIDA Authorities, the Corporation continued providing services of operation of buses on loss. Further, the Corporation neither pursued the realisation of dues nor took any action to write it off.
The Management stated (July 2016) that out of pending dues of ` 83.02 crore, proposal for re-appropriation of ` 30.25 crore had been sent (June 2016) to the Finance Department of GoUP. It was further stated that efforts were being made for recovery of balance dues of NOIDA, dues pertaining to political party could not be recovered due to sub-judice case, bills of ` 2.02 crore were
The Corporation did not frame action plan for timely recovery of dues. Due to this, outstanding dues of ` 46.58 crore could be recovered against total dues of out of ̀ 83.02 crore
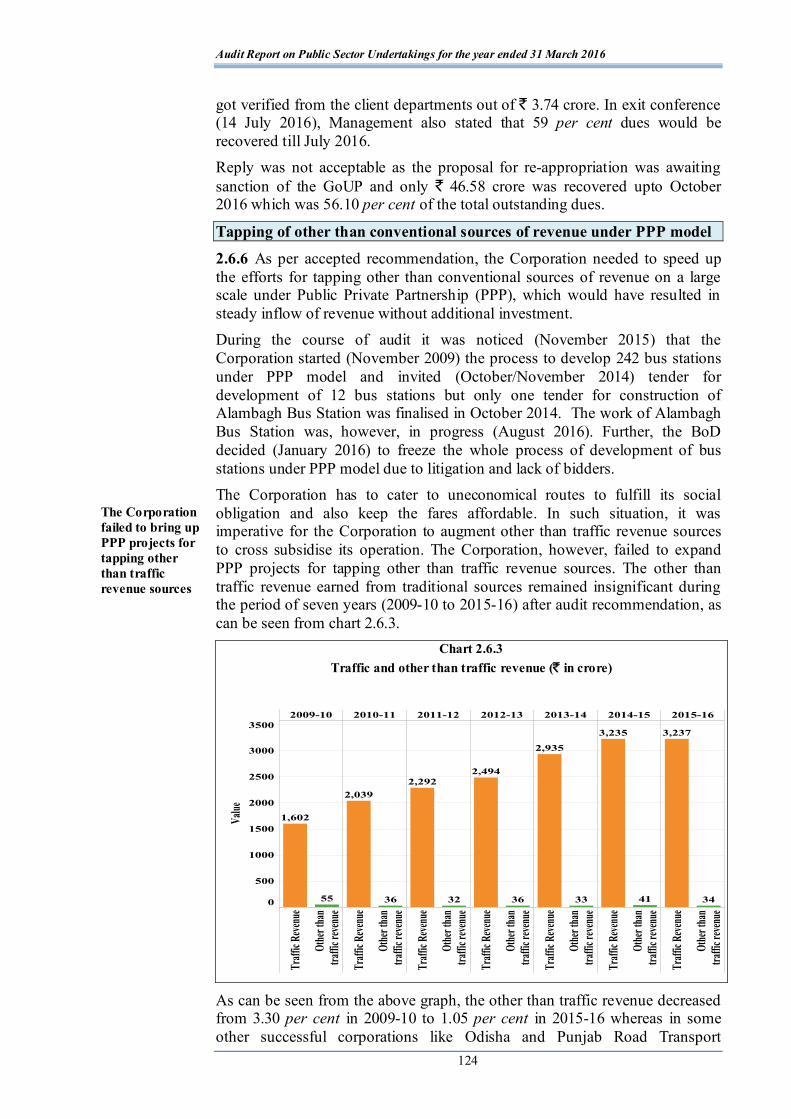
Audit Report on Public Sector Undertakings for the year ended 31 March 2016
124
got verified from the client departments out of ` 3.74 crore. In exit conference (14 July 2016), Management also stated that 59 per cent dues would be recovered till July 2016. Reply was not acceptable as the proposal for re-appropriation was awaiting sanction of the GoUP and only ` 46.58 crore was recovered upto October 2016 which was 56.10 per cent of the total outstanding dues.
Tapping of other than conventional sources of revenue under PPP model
2.6.6 As per accepted recommendation, the Corporation needed to speed up the efforts for tapping other than conventional sources of revenue on a large scale under Public Private Partnership (PPP), which would have resulted in steady inflow of revenue without additional investment. During the course of audit it was noticed (November 2015) that the Corporation started (November 2009) the process to develop 242 bus stations under PPP model and invited (October/November 2014) tender for development of 12 bus stations but only one tender for construction of Alambagh Bus Station was finalised in October 2014. The work of Alambagh Bus Station was, however, in progress (August 2016). Further, the BoD decided (January 2016) to freeze the whole process of development of bus stations under PPP model due to litigation and lack of bidders. The Corporation has to cater to uneconomical routes to fulfill its social obligation and also keep the fares affordable. In such situation, it was imperative for the Corporation to augment other than traffic revenue sources to cross subsidise its operation. The Corporation, however, failed to expand PPP projects for tapping other than traffic revenue sources. The other than traffic revenue earned from traditional sources remained insignificant during the period of seven years (2009-10 to 2015-16) after audit recommendation, as can be seen from chart 2.6.3.
Chart 2.6.3 Traffic and other than traffic revenue (` in crore)
As can be seen from the above graph, the other than traffic revenue decreased from 3.30 per cent in 2009-10 to 1.05 per cent in 2015-16 whereas in some other successful corporations like Odisha and Punjab Road Transport
The Corporation failed to bring up PPP projects for tapping other than traffic revenue sources
Chapter- II: Performance Audits relating to Government companies and Statutory corporations
125
Corporation3, other than traffic revenue ranged between 11.68 and 16.46 per cent and 4.29 and 5.05 per cent respectively during 2009-10 to 2015-16. This indicated that the Corporation failed to tap other than traffic revenue. Thus, the Corporation incurred losses in the range between ` 34.57 crore and ` 131.54 crore during six years due to uneconomical operations, which could not be given set off from other than traffic revenue to be earned from PPP projects, as was recommended in performance audit. The Management stated (July 2016) that process to develop 242 bus stations under PPP mode was started by the Nigam in November 2009 but due to litigation and lack of bidders, the BOD decided (January 2016) to freeze the whole process. Thus, the reply confirmed the fact that Corporation had failed to implement the audit recommendation.
Monitoring of important operational parameters by top management
2.6.7 As per accepted recommendation, top management of corporation needed to monitor important operational parameters. During course of audit it was noticed (November 2015) that important operational parameters were satisfactorily monitored as discussed below:
At the depot and region level, important parameters such as revenue earned, kilometres done, bus utilisation, load factor, fuel average were monitored on daily basis. This was also monitored against the same dates and month of previous year to assess decrease/increase and requisite measures, directions, explanation, appreciation, etc. were issued.
At the Headquarters level, monthly meetings of regional managers/service managers are convened. In the monthly meetings, detailed monitoring of all important parameters viz. profitability, bus utilisation, load factor, fuel average, spare parts and tyre consumption, production of tyre shops, addressing disciplinary and legal cases, hiring of buses and permits, etc. were carried out.
Quarterly/half yearly and annual performance on all important parameters was placed for review before the Board of Directors.
Accepted recommendations and their compliance by the Government 2.6.8 Recommendation-wise audit findings are discussed in the succeeding paragraphs.
Formulation of State Transport Policy
2.6.9 As per accepted recommendation, the Transport Department of the Government of Uttar Pradesh was required to frame a policy on the lines of National Transport Policy. The Transport Department of the GoUP was required to frame a policy for modal mix of Public Transport focusing on increasing mass transport option viz. buses, metro and commuter rail etc. Audit noticed (November 2015) that even after lapse of seven years, the State Government has neither formulated any policy for modal mix of public transport nor taken any initiative to do so. Further, State Transport Authority (STA) is authorised for fixation of tariff in the State for public and private operators. STA had fixed and revised the tariff for public operator from time to time, but for private operators it had fixed 3Information of other than traffic revenue for the year 2014-15 and 2015-16 was not provided.
GoUP neither formulated any State transport policy on the lines of National Transport Policy nor taken any initiative to do so
Audit Report on Public Sector Undertakings for the year ended 31 March 2016
126
tariff only in November 2012 and thereafter no revision in the tariff was made till date (October 2016). In the State of Uttar Pradesh, approximately 40,000 private individual operators operated 46,938 buses which constitute 83.05 per cent of the total buses being operated in the State but due to not revising tariff from November 2012, STA failed to provide economic transport facility to the public. Thus, the audit recommendation has not been carried out by the Government and the State has no transport policy to regulate the services for the private operators. The Special Secretary, Transport Department in Exit conference (14 July 2016) confirmed that no State transport policy has been separately issued on the lines of National Transport Policy. Rather, as and when required time to time, instructions for policy/rules are issued under the Central Motor Vehicles Act, 1988 and Central Motor Vehicles Rules, 1989. Fact remains that reasons for not formulating State transport policy on the lines of National Transport Policy was not stated by the Government.
Appointment of Chief Executive for a considerable period and execution of Corporate Plan 2.6.10 As per accepted recommendation, Government needed to appoint the Chief Executive of the Corporation for a period of at least three years as prescribed by the State Government in the policy document issue in 1994 in view of consistency and continuity for the purpose of formulation and execution of Corporate Plan. During course of audit it was noticed (November 2015) that the Government posted 11 Managing Directors during the period of seven years (2009-10 to 2015-16). The tenure of each Managing Director varied from 18 days to one year nine months and 19 days. Thus, the Government did not implement its own policy. Audit is of the opinion that short duration of Chief Executive adversely affects the overall performance of the organisation. In the case of the Corporation, indicative adverse impact can be interpreted as below:
During 2009-10 to 2013-14, Managing Directors were changed two to three times in each of all the five financial years. The Corporation incurred loss throughout five years which aggregated to ` 339.17 crore.
The whole financial year 2014-15 was monitored and controlled by one Managing Director during which the Corporation showed some improved result and yielded profit of ` 2.48 crore4.
Reply of the Government was awaited (October 2016).
Appointment of independent transport regulator
2.6.11 As per accepted recommendation, the Transport Department of the State Government was required to appoint an independent transport regulator in the State.
During course of audit it was noticed (November 2015) that earlier the Corporation was revising the fare considering increase in the price of the
4 As per provisional account of 2014-15.
GoUP did not follow the provisions of policy document issued in 1994 as the tenure of the Managing Director of the Corporation varied from 18 days to one year nine months and 19 days
Chapter- II: Performance Audits relating to Government companies and Statutory corporations
127
diesel only. The Government, however, by Notification in November 2012, authorised the Chairman of the State Transport Authority (STA) to revise the fare keeping in view the increase in cost of operation (fuel, salary and allowances only), number of passenger based on average load factor in accordance with the formula prescribed in the Notification. Audit observed that the Government has not taken up the audit recommendation in its spirit as discussed below: The formula of revision of the fare had been streamlined to some extent but not fully. The formula considers the fuel, salary and allowances but does not consider other factors such as depreciation of buses, fixed expenses and interest on capital expenditure etc. This indicates that the formula proved ineffective to compensate the financial losses of the Corporation ranged between ` 34.57 crore and ` 131.54 crore during 2009-10 to 2013-14.
The revised fares fixed by STA still cannot be implemented without approval of the Government; therefore, STA is not independent for revision of fare in an objective and transparent manner. Audit further observed that there had been decreasing trend in Corporation’s share of total buses and increasing share of private buses. Therefore, the Government should have a policy for fixation of fare transparently and regulation of transport services in the State through an independent transport regulating body. Reply of the Government was awaited (October 2016).
Conclusion
The Follow-up audit disclosed that one recommendation has been complied by the Corporation and six accepted audit recommendations were yet to be implemented by the Corporation as well as GoUP as the shortcomings noticed earlier still persist as detailed below:
the Corporation did not induct operation of even a single bus on the routes not nationalised of 1,85,730 km in the State. Whereas, 46,938 private stage carriages (91 per cent of the total buses in the State) were plying on routes not nationalised; the Corporation did not make sincere efforts to realise the old dues. As a result, dues of ` 36.44 crore remained pending at the end of October 2016; the Corporation failed to implement Audit recommendation to speed up PPP projects for tapping other than traffic revenue sources for cross subsidisation of uneconomical operation of buses. As a result, the Corporation’s net loss of ` 34.57 crore to ` 131.54 crore during last six years could not be set off from other than traffic revenue; the Government did not formulate its own transport policy on the line of National transport policy; the Government continued posting of Managing Directors for very short periods of 18 days to one year nine months; and the Government had not appointed independent transport regulator for the Corporation.
GoUP did not appoint independent transport regulator though recommendation made by Audit in this regard was accepted by the GoUP

CHAPTER–III Transaction Audit Observations

CHAPTER-III 3. Transaction Audit Observations relating to Government companies
and Statutory corporations
Important audit findings noticed as a result of test check of transactions made by the State Government companies/Statutory corporations are included in this Chapter.
Purvanchal Vidyut Vitran Nigam Limited
3.1 Undue benefit to consumer
The Company extended undue benefit of ` 24.96 crore to the consumer by allowing adjustment of banked energy in contravention to the provisions of CNCE Regulations
The sale of electricity from the Captive Power Generation Plants to Electricity Distribution Licensee (Licensee) in the State is governed by the Captive and Non-Conventional Energy Generating Plants Regulation1 (CNCE Regulations) issued by Uttar Pradesh Electricity Regulatory Commission (UPERC). Captive generating plant means a power plant set up by any person or co-operative society or association of persons for generating electricity primarily for its own use. Banking of power is the process under which a generating plant supplies power to the grid not with the intention of selling it to either a third party or to the Licensee, but with the intention of exercising its eligibility to draw back this power from the grid. The Uttar Pradesh Power Corporation Limited (UPPCL), on behalf of Purvanchal Vidyut Vitran Nigam Limited (Company), entered (July 2009) into a Power Purchase Agreement (PPA) with the consumer for supply2 of electric energy to the consumer as well as for supply3 of electric energy by the consumer from its captive power plant (75 per cent banking with the Company and 25 per cent sale to the Company basis) for a period of five years ending March 2014. The PPA was extended (March 2014) initially for two months which was further extended4 (May 2014) till the notification of new regulations. The terms and conditions of the PPA regarding withdrawal of the banked units by the consumer, its adjustment from the energy sold by the Company to the consumer and raising of bill after adjustment of banked units were as under:
the rates, terms and conditions of the PPA would be governed by the new policy (CNCE Regulations as issued by UPERC); Clause 13 (a) of PPA provided that the Company would send bill each month to the consumer for net energy supplied by the Company after adjustment of banked energy; and
1 Regulations came into force in July 2005 and subsequently revised in 2009 and 2014. 2 2,222.20 KVA as main supply and 42,222.20 KVA as standby and emergency assistance
supply. 3 60,000 KW. 4 PPA for the period April 2014 to March 2019 could not be signed till date (October
2016).
Audit Report on Public Sector Undertakings for the year ended 31 March 2016
130
Clause 22 (A) of PPA provided that the consumer could consume upto 75 per cent of banked energy during current financial year and 25 per cent during subsequent financial years. Further, CNCE Regulations, 2005 notified (March 2006) by UPERC, which came in force from July 2005, inter-alia provided the following: as per Regulation 39 (B) (vi), the consumer was allowed to withdraw banked power either in the same financial year or during the following financial year i.e. within a maximum period of two years; and as per Regulation 39 (B) (vii), the banked energy remaining unutilised on the expiry of the following year was to be treated as sale to the Company at the rate specified by UPERC for the year during which the power was banked.
Thus, the Regulations 2005 provided for adjustment of banked units, from the units sold by the Company to the consumer, within a maximum period of two financial years; whereas PPA (Clause 22 A) provided for adjustment of banked units even beyond two years.
Audit noticed (February 2016) that the PPA, entered into by UPPCL, were not in consonance with provisions of the CNCE Regulations (Regulation 39 (B) (vi) and (vii) of 2005) which restricted the adjustment of banked units within two years. Further, the Electricity Distribution Division-Pipri, Sonebhadra of the Company ignoring the provisions of the clauses of PPA which provided that the rates, terms and conditions of PPA were to be governed by the new policy (CNCE Regulations), allowed adjustment of 14.05 million units (MU), violating the provisions of applicable Regulations, banked during 2010-11 to 2011-12 against the units sold during 2014-15. This led to undue benefit of ` 5.78 crore5 (Annexure-3.1) to the consumer.
Besides, the Company did not raise the bill of ` 19.18 crore6 (Annexure-3.1) for 31.94 MU sold to the consumer during 2014-15 and allowed the adjustment in the name of banked units though no banked units were available. Thus, by not applying the provisions of Regulations 2005, as was provided for in the PPA, the Company extended undue benefit aggregating ` 24.96 crore to the consumer. The Management accepted audit observation (October 2016) and stated that energy bill, based on the CNCE Regulations, had been issued (October 2016) to the consumer for the period from April 2011 to March 2015. The fact remained that amount of ` 24.96 crore had not been recovered from the consumer so far (October 2016). The matter was reported to Government in June 2016; reply was awaited (October 2016). 3.2 Delay in change of category of consumer
The Company suffered loss of revenue of ` 1.38 crore due to inordinate delay in migration of the consumer to HV-2 category
Uttar Pradesh Electricity Supply Code 2005 (Supply Code) in clause 4.40 (Change of category) provides that when a consumer applies for change of category from one tariff rate schedule to another, the Licensee shall inspect the 5 ` 8.44 crore minus ` 2.66 crore. 6 ` 27.62 crore minus ` 2.66 crore minus ` 5.78 crore.
Chapter–III: Transaction Audit Observations
131
premises to verify and change the category within 10 working days from the date of acceptance of application. It further provided that the change of category shall be effective from next billing cycle. However, in case sanction of new category is not permitted under any law in force, the Licensee shall inform the consumer within 15 days from the date of acceptance of application. General provisions of tariff order, approved by Uttar Pradesh Electricity Regulatory Commission, for financial year 2009-10 provided an option to migrate to a High Voltage (HV)-2 category; that is, consumer under LMV-1, LMV-2, LMV-4 and LMV-6 with contracted load above 50 KW and getting supply at 11 kV and above voltage shall continue to have an option to migrate to HV-2 category. The tariff further provided that the consumers shall have an option of migrating back to the original category, if he so desired.
Audit noticed (July 2015) that consumer7 took over (October 2006) the assets of U.P. State Cement Corporation Limited (UPSCCL) consequent upon winding up of the plant. At that time an electricity connection under LMV-1 category in the name of Production Manager, UPSCCL, Churk, with the load of 850 KW and supply at 33 KV voltage, continued to remain in existence for giving power supply to the residents who were occupying the accommodation of the corporation. It was further noticed that the consumer requested (October 2009) to the Company to allow migration from LMV-1 to HV-2 category stating that power would be used for industrial as well as domestic purposes in plant and lighting of the colony. The Company, however, did not initiate any action to migrate the consumer to higher tariff within 10 working days as prescribed in clause 4.40 of the Supply Code. The Consumer was allowed to migrate to higher tariff of HV-2 category belatedly in February 2013. Thus, due to inordinate delay of three years and three months in migration of consumer to HV-2 category, the Company suffered a loss of revenue amounting to ` 1.38 crore during the period from November 2009 to January 2013. Audit was informed (September 2016) in reply that the directives of CE (February 2010) to ensure to change in category of the consumer had been communicated to the consumer. However, record of any such communication was not made available to audit. Thus, the veracity of the communication could not be verified by audit.
The matter was reported to Government in June 2016; reply was awaited (October 2016).
3.3 Fixed charges not recovered due to delay in release of connection
The Company failed to release the connection within seven days of completion of work in compliance to the provisions of the Supply Code and was deprived of recovery of fixed charges of ` 1.05 crore from the consumer
Clause 4.1 of the Supply Code provides that the licensee shall give supply of electricity to such premises within one month after receipt of completed
7 Jaiprakash Associates Limited.
Audit Report on Public Sector Undertakings for the year ended 31 March 2016
132
application and payments, provided where such supply requires extension of distribution mains and commission of sub-station, the distribution licensee shall supply the electricity to such premises immediately after such extension or within such period as specified in Clause 4.8 of the Supply Code. Clause 4.8 of the Supply Code provides that the licensee shall execute the work expeditiously within 300 days for loads to be connected at 132 KV from the date of deposit of estimated charges. Further, Clause 4.8 (h) of the Supply Code provided that licensee shall intimate the date (later than seven days from the date of completion of works) on which connection shall be energised. Audit noticed (August 2015) that the Chief Project Manager, Railway Electrification, Lucknow (consumer) applied (November 2007/January 2008) to the Electricity Urban Distribution Division (EUDD)-I, Gorakhpur of the Company to release the load of 5 MVA under HV-3 category to feed the proposed North East Railway Grid sub-station traction from 132 KV sub-station Mohaddipur, Gorakhpur for railway traction from June 2008. The Company sanctioned (December 2008) the load of the consumer. Since, 132 KV transmission line and 132 KV bay was to be constructed for releasing the load, Uttar Pradesh Power Transmission Corporation Limited (UPPTCL) prepared (December 2007) tentative estimate of the work amounting to ` 1.39 crore which was revised (December 2011) to ` 2.46 crore against which consumer deposited ` 1.39 crore (June 2008) and ` 1.07 crore (December 2012). The consumer requested (June 2013) UPPTCL to complete the work at the earliest. UPPTCL completed the works on 6 August 2014 but it did not intimate the Company so that the connection to consumer could be released immediately. Audit further noticed that the Company did not coordinate with UPPTCL to follow the progress of construction work to ensure prompt release of connection. The Company enquired (July 2015) about the progress of work from UPPTCL which intimated (21 July 2015) that the work was already completed on 06 August 2014. The Company immediately released the connection to consumer on 24 July 2015. Thus, due to lack of coordination between the UPPTCL and the Company, it failed to release the connection within seven days of completion of works as per requirement of Supply Code. The connection was released with a delay of ten months resulting in loss of opportunity to recover fixed charges of ` 1.05 crore8 for the period September 2014 to June 2015.
The Management stated (June 2016) that the work of construction of line was not completed till 14 July 2015 as the shifting of tower number four was in progress. After completion of the work by UPPTCL and on getting the permission of Railway Authorities the line was energised on 27 July 2015. Reply was not tenable as the work was completed in August 2014 as was certified by UPPTCL, Gorakhpur, hence, the connection should have been released immediately. The matter was reported to Government in May 2016; reply was awaited (October 2016).
8 Demand charges of ` 280/KVA/month X Load; 3750 KVA (75 per cent of 5000 KVA) X
10 months= ` 1.05 crore.
Chapter–III: Transaction Audit Observations
133
Purvanchal Vidyut Vitran Nigam Limited and Uttar Pradesh Power Transmission Corporation Limited
3.4 Undue favour to contractors
The Companies, violating the provisions of Welfare Cess Act/Rules, did not deduct and deposit Cess of ` 5.12 crore from the bills of contractors and extended undue benefit to them
The Government of India (GoI) enacted the Building and Other Construction Workers’ Welfare Cess Act, 1996 (Cess Act) and framed the Building and Other Construction Workers’ Welfare Cess Rules, 1998 (Cess Rules). The Government of Uttar Pradesh (GoUP) implemented the aforesaid Cess Act and Rules in the State vide notification dated 4 February 2009. The GoUP also constituted (November 2009) the ‘Uttar Pradesh Building and Other Construction Worker’s Welfare Board (Welfare Board).
Welfare Board may provide immediate assistance to a beneficiary in case of accident; make payment of pension and sanction loans and advances to a beneficiary for construction of a house; pay premia for Group Insurance Scheme of the beneficiaries; give financial assistance for the education of children of the beneficiaries; and meet medical expenses for treatment of major ailments of a beneficiary/dependant etc.
Section 3 of the Cess Act provides that Cess, at the rate of one per cent of the cost of construction incurred by an employer, shall be levied and collected from the employer and deposited with Welfare Board constituted for the purpose. Further, Rule 4 (3) of Cess Rules framed by GoI provides that, where the levy of Cess pertains to building and other construction work of a Government or of a Public Sector Undertaking (PSU), such Government or the PSU shall deduct the Cess payable at the notified rates i.e. one per cent from the bills paid for such works. Audit noticed (August 2015/September 2015) that the Companies made payment of ` 654.90 crore9 to 19 contractors who executed the work of construction of sub-stations and lines during 2013-14, 2014-15 and 2015-16. The Companies were required to deduct Cess of ` 6.55 crore10 from their bills for onward deposit of the same with the Welfare Board. The Companies did not deduct Cess of ` 6.30 crore from the bills of the contractors without any reason on records except one Company11 which deducted Cess only of ` 25 lakh.
Audit further noticed that the Company11 also executed the work of construction of 220 KV and 132 KV sub-stations and lines departmentally incurring ` 41.09 crore during February 2010 to July 2015. On the work executed departmentally, the Company11 was required to deposit Cess of ` 41 lakh with the Welfare Board but the Company did not deposit any amount of Cess.
9 ` 478.61 crore to nine contractors by Purvanchal Vidyut Vitran Nigam Limited (PuVVNL) and ` 176.29 crore to 10 contractors by Uttar Pradesh Power Transmission Corporation Limited (UPPTCL). 10 ` 4.79 crore by PuVVNL and ` 1.76 crore by UPPTCL. 11 UPPTCL.
Audit Report on Public Sector Undertakings for the year ended 31 March 2016
134
Thus, the Companies failed to deduct Cess of ` 6.30 crore as per requirement of the Cess Act/Rules leading to undue favour to the contractors and did not deposit Cess of ` 6.71 crore leading to loss to the Welfare Board to that extent. The Management of the Companies accepted the audit observation and stated (June 2016) that the cess amounting to ` 1.59 crore12 had been deducted and deposited with the Welfare Board. The necessary instructions had been issued to comply with the provision of Cess Act and deduction of cess had been started. The fact remained that recovery of Cess amounting to ` 5.12 crore13 was pending (October 2016).
The matter was reported to Government in May 2016; reply was awaited (October 2016).
Uttar Pradesh Rajkiya Nirman Nigam Limited 3.5 Loss due to undue benefit to contractor
The Company extended undue benefit to the contractor by providing advances on ad-hoc basis without actual measurement of work which resulted in advances of ` 5.03 crore and interest of ` 6.72 crore remained unrecovered
The Uttar Pradesh Rajkiya Nirman Nigam (Company) entered (7 July 2010) into an agreement with a contractor14 for construction of District Jail at Ambedkar Nagar at a contract value of ` 65.97 crore. Faizabad Unit (Unit) of the Company was assigned (September 2010) to execute the work. As per clause 24 of the agreement, contractor was to be provided mobilisation advance up to the maximum limit of 10 per cent of the contract value against a bank guarantee of equal amount which was to be valid up to six months after completion of the work. The mobilisation advance was to be adjusted against running bills of the contractor. Further, interest at the rate of 12 per cent per annum was payable by the contractor on the mobilisation advance. Audit noticed (August 2015) that as per clause 24 of the agreement, the contractor was to be provided mobilisation advance only of ` 6.60 crore (10 per cent of contract value). The Project Manager of the Unit, however, provided advances aggregating ` 26.83 crore (Mobilisation Advance: ` 6.50 crore and advances against labour and material: ` 20.33 crore) to the contractor during August 2010 to February 2012, against the bank guarantee of ` eight crore only. The advances were given on the request of the contractor without actual measurement of the work executed. Thus, advances provided to the contractor were not only in excess of the admissible amount but was also unsecured (to the extent of ` 18.83 crore) due to deficient amount of bank guarantee.
Audit further noticed that the financial advisor of the Company failed to check the release of excessive advances and the contractor left the work incomplete in January 2014. Against the advances of ` 26.83 crore, the Unit could recover
` 6.71 crore included ̀6.30 crore plus ` 41 lakh to be deposited by UPPTCL on departmental works. 12 ` 68 lakh by PuVVNL and ̀91 lakh by UPPTCL. 13 ` 4.11 crore by PuVVNL and ̀1.01 crore UPPTCL. 14 Sai Nath Estate Private Limited, Hyderabad.
Chapter–III: Transaction Audit Observations
135
` 21.80 crore15 through adjustment from the pending bills, forfeiting bank guarantee and securities during March 2011 to August 2015. So advances of ` 5.03 crore remained unrecovered so far (March 2016) besides, interest of ` 6.72 crore recoverable as per terms of the agreement, also could not be recovered.
Thus, in contravention to the provisions of the agreement, the Unit extended undue benefit to the contractor by providing advances on ad-hoc basis without actual measurement of work, in excess of the admissible amount and that too against deficient bank guarantee which led to loss of ` 11.75 crore16 to the Company. The Management stated (September 2016) that the then Project Manager was responsible for providing excess advances and not levying interest thereon as per enquiry report of 18 May 2016 and action against Project Manager was under progress. Further, legal opinion had been sought for taking legal action against contractor. Reply was not acceptable as the responsible Project Manager had retired from service in June 2015 and enquiry, which was initiated in August 2013, was finalised (May 2016) only after his retirement. Further, no legal action was initiated against the contractor by the Company even after a lapse of more than two years since the abandonment of work.
The matter was reported to Government in June 2016; reply was awaited (October 2016).
3.6 Loss due to payment to contractor without ensuring actual value of work
The Company suffered loss of ` 6.63 crore due to payment of more than the actual value of work executed to the contractor
The Government of Uttar Pradesh (GoUP) accorded (February 2010) administrative and financial sanction for construction of District Jail at Kanshiram Nagar at a cost of ` 58.88 crore. The Company was nominated as executing agency for construction of the District Jail. The Company assigned execution of this work to its Kasganj unit. The work of construction of District Jail was awarded (July 2010) by the Company to Sainath Estates Private Limited, Hyderabad (Contractor) for ` 58.88 crore against the tender invited in March 2010. The work was started by the contractor in September 2010. As per Clause 24 of the agreement, interest bearing (12 per cent per annum) mobilisation advance of 10 per cent of the project cost was to be given to the contractor. Further, as per Clause 17 of the agreement, the contractor had to submit monthly bill (detailed measurements and item-wise Bill of Quantity) for the work executed by him. Field Engineer (Unit) of the Company, prior to release of payment to contractor, had to take measurements of work to assess value of work actually executed by the contractor. Audit noticed (October 2015) that the financial advisor of the Company failed to check the release of excessive advances and the Unit released payments to the contractor without assessing value of work actually executed by the
15 Adjusted ` 13.11 crore from pending bills of the contractor during March 2011 to April
2014, forfeited bank guarantee of ` eight crore (July/August 2014) and security of ` 0.69 crore (August 2015).
16 Unrecovered advances: ` 5.03 crore and interest: ` 6.72 crore.
Audit Report on Public Sector Undertakings for the year ended 31 March 2016
136
contractor and without considering earlier payments released and amounts lying unadjusted with the contractor. As a result, payment of ` 41.28 crore was released to the contractor during August 2010 to July 2011 against total value of work of ` 32.22 crore assessed as per the fourth bill (July 2011) of the contractor. Thus, undue favour of ` 9.06 crore was extended to the contractor by releasing inadmissible payments in violation of clause 17 of the agreement.
Audit further noticed that the value of work done of ` 32.22 crore assessed as per fourth bill was incorrect as the actual value of work done was ` 19.72 crore only as per measurements subsequently taken by the Unit during September/October 2012. This led to excess payment of ` 12.50 crore to the contractor.
Thus, the contractor was unduly benefitted for total payments of ` 21.56 crore (` 9.06 crore and ` 12.50 crore) due to the failure to adhere to the provision of Clause 17 of the agreement and because of incorrect assessment of value of work done. The contractor abandoned the work mid-way in September 2013. The Company initiated (March 2013) enquiry against nine employees of the rank of General Manager, Additional Project Manager, Unit Incharge, Sub-Engineers and Assistant Accountant; served charge sheet to three employees and lodged (September 2014) FIR against three out of nine employees. The enquiry has not been finalised so far (August 2016). The Company at the instance of Audit lodged (May 2016) FIR against the contractor for recovery of excess amount released.
The Company could recover (up to August 2016) ` 14.93 crore17 only from the contractor against excess payment of ` 21.56 crore. Thus, due to release of inadmissible/excess payments to the contractor, the Company suffered loss of ` 6.63 crore (` 21.56 crore less ` 14.93 crore).
The Management accepted the audit observation and stated (September 2016) that action for recovery of balance amount was in progress. The matter was reported to Government in July 2016; reply was awaited (October 2016).
3.7 Avoidable payment of Income Tax
The Company accounted for centage at the rate of 11.50 per cent instead of 6.875 per cent on the expenditure incurred on the works. As a result, it paid Income Tax of ` 5.39 crore on inadmissible centage income
The Company executes works of various departments of the Government of Uttar Pradesh (GoUP) on deposit basis i.e. actual cost plus centage. It engages piece rate workers (PRWs) for execution of the construction works.
The order (February 1997) of GoUP provides for calculation of centage at the rate of 12.50 per cent on the cost of work arrived at after deducting five per cent of the cost estimated on the basis of the Schedule of Rate (SOR) of U. P. Public Works Department (UPPWD). Accordingly, the total cost of
17 ` 10.93 crore recovered up to September 2015 + ` 4 crore recovered on the order of the
court.

Chapter–III: Transaction Audit Observations
137
work including centage works out to be 106.87518 per cent of the cost estimated as per SOR of UPPWD. Thus, the admissible centage worked out to be 6.875 per cent of the cost estimated on SOR of UPPWD basis (without deducting five per cent).
The Company was assigned construction of residential houses in Meerut under two centrally sponsored schemes19. The cost estimates of the works of these schemes were prepared considering centage at the rate of 12.50 per cent instead of 6.875 per cent of the estimated cost as also communicated by the State Urban Development Authority (SUDA).
Audit noticed (October 2015) that SUDA Unit-1, Meerut of the Company accounted for centage at the rate of 11.50 per cent instead of 6.875 per cent on the expenditure incurred on the works. This resulted in accountal of inadmissible centage income amounting to ` 17.44 core during the period from 2008-09 to 2014-15, on which the Company paid Income Tax of ` 5.39 crore worked out at the rate 30.9 per cent (including cess of 3 per cent).
The Management stated (September 2016) that excess charged centage income pertaining to years 2008-09 to 2011-12 had been reversed in the account of 2012-13 and centage had correctly been charged at the rate of 6.875 per cent in the accounts for the year 2012-13 to 2015-16. Further, for Income Tax Assessment for 2011-12 and 2012-13, returns had been filed and refund/adjustment for excess deposit of Income Tax would be made by Income Tax department after finalisation of assessment by them.
Reply was not acceptable as the Company had already paid income tax for the years 2008-09 to 2014-15 on accrued centage income and revised income tax return, for refund/adjustment of excess paid income tax, could only be filed within a period of one year from the end of relevant assessment year or before completion of the assessment, whichever was earlier as per provision of section 139 of Income Tax Act, 1961, which was not done by the Company till date (October 2016).Therefore, no refund was likely to be received from the Income Tax Department. Further, reversal of centage income is only rectification of Company’s account which did not affect the status of payment of income tax. Moreover, assessment order of the Company for the years 2011-12 and 2012-13 had been finalised by the Income Tax Department on 23 February 2015 and 30 January 2015 respectively. The matter was reported to Government in June 2016; reply was awaited (October 2016).
3.8 Loss due to inadmissible expenditure on quality control tests
The Company suffered loss of ` 1.37 crore due to incurring expenditure on quality control tests, not provided for in the DPR
The Company executes works of various Government departments on deposit work basis i.e. actual cost plus centage. The centage at the rate of 12.5 per cent available on the cost of work does not include expenses incurred on quality control tests. Therefore, expenses to be incurred on quality control 18 Cost of work= 100 minus five per cent= 95. Centage on 95 at the rate of 12.5
per cent=11.875. Thus, total cost of work= 106.875 (95 +11.875). 19 Basic Services for Urban Poor (BSUP) Scheme and Integrated Housing and Slum
Development Programme (IHSDP).
Audit Report on Public Sector Undertakings for the year ended 31 March 2016
138
tests carried out by third parties should have been included in the Detailed Project Report (DPR) of the concerned work so that cost of quality control test may be recovered from the client.
SUDA Units, Agra and Meerut of the Company were allotted deposit work by State Urban Development Agency (SUDA) for construction of residential houses in different areas under two centrally sponsored schemes20. DPRs for each area were prepared (February 2009) by these Units in which cost of laboratory and testing charges to be incurred for quality control purposes were not included. The DPRs were approved by SUDA and works were started from February 2009. The Managing Director of the Company also reiterated (January 2011) that for maintaining quality in the works being executed by the Company, third party quality control tests by Indian Institute of Technologies (IITs) or renowned firms of the country was compulsory besides establishment of own quality control cell at each site.
The Project Managers of the above two Units engaged various private and semi Government agencies for carrying out quality control tests and incurred expenditure of ` 1.37 crore21 during 2009-10 to 2014-2015 on account of laboratory and testing charges.
Audit noticed (October 2015) that SUDA denied (March 2015) the claim of laboratory and testing charges on the ground that there was no provision in the DPRs for incurring expenditure on laboratory and testing charges. Thus, due to deficient provision in the DPRs, the Company could not get the reimbursement of the expenditure incurred on laboratory and testing and so suffered a loss of ` 1.37 crore.
The Management while accepting the fact stated (September 2016) that provision regarding third party quality control mechanism was made in the DPR. Hence, a letter was sent in August 2016 to SUDA for payment of expenses incurred on third party quality control. Reply was factually incorrect as SUDA rejected the claim of third party quality control expenses as no such provision was included in the DPR. The matter was reported to Government in June 2016; reply was awaited (October 2016).
Dakshinanchal Vidyut Vitran Nigam Limited 3.9 Loss due to not-levy of Regulatory Surcharge
The Company suffered loss of revenue of ` 52.53 lakh due to not-levying/short levy of regulatory surcharge on LMV-8 consumers
Uttar Pradesh Power Corporation Limited (UPPCL) issued notifications for recovery of regulatory surcharge and additional regulatory surcharge from consumers in compliance with the orders issued by Uttar Pradesh Electricity Regulatory Commission (UPERC) from time to time. As per the notifications
20 Basic Services for Urban Poor (BSUP) Scheme and Integrated Housing and Slum Development Programme (IHSDP). 21 UPRNN SUDA Unit, Agra: ` 37.87 lakh and UPRNN SUDA Unit, Meerut: ` 98.91 lakh.
Chapter–III: Transaction Audit Observations
139
(June 2013 and June 2014), regulatory surcharge was to be charged at the rate of 3.71 per cent and 2.84 per cent of the rate of charge during the period 10 June 2013 to 31 March 2014 and 6 June 2014 and onwards respectively. An additional regulatory surcharge at the rate of 2.38 per cent of the rate of charge to be levied from 12 October 2014 was further notified (October 2014) which was revised (June 2015) to 4.28 per cent from 28 June 2015. Audit noticed (September 2015) that Electricity Distribution Division (EDD)-I, EDD-II and EDD-III, Aligarh of Dakshinanchal Vidyut Vitran Nigam Limited (Company) did not levy/short levied the regulatory surcharge/additional regulatory surcharge of ` 52.53 lakh on four State Tube well consumers (LMV-8) as detailed in table 3.1.
Table 3.1 Details of levy/short levied the regulatory surcharge
(` in lakh) Divisions Consumers
(Category) Period Regulatory
surcharge due
Regulatory surcharge charged
Short charged
EDD-I, Aligarh
Executive Engineer, Tube Well Division I, Aligarh
July 2013 to March 2015
28.37 - 28.37
EDD-II, Aligarh
Executive Engineer, Tube Well Division II, Aligarh
November 2014 to March 2015
20.05 10.91 9.14
EDD-III, Aligarh
Executive Engineer, Tube Well Division I and II, Aligarh
August 2013 to March 2015
21.05 6.03 15.02
Total 69.47 16.94 52.53 Source: Information furnished by the Divisions
Thus, despite the orders of UPERC/UPPCL, EDD-I Aligarh did not charge regulatory surcharge of ` 28.37 lakh from consumer during July 2013 to March 2015 and EDD-II and EDD-III, Aligarh short charged regulatory surcharge of ` 24.16 lakh from the consumers during August 2013 to March 2015 without any reason on records. Thereafter, bills were issued by the EDDs charging regulatory surcharge as notified by UPPCL.
As a result, the Company suffered revenue loss of ` 52.53 lakh due to not levying/short levy of regulatory surcharge on the consumers billing during July 2013 to March 2015. The Management accepted the fact and stated (September 2016) that bills had been raised but no payment from the consumer had been received. The matter was reported to Government in May 2016; reply was awaited (October 2016).
Uttar Pradesh Jal Nigam
3.10 Infructuous expenditure The Nigam spent ` 66.90 lakh on illegal construction work adjoining the prohibited monument area, which had to be abandoned later
The Construction Divisions of the Nigam are engaged in construction of water supply systems in rural and urban areas of the State under various schemes of the Central and State Governments.
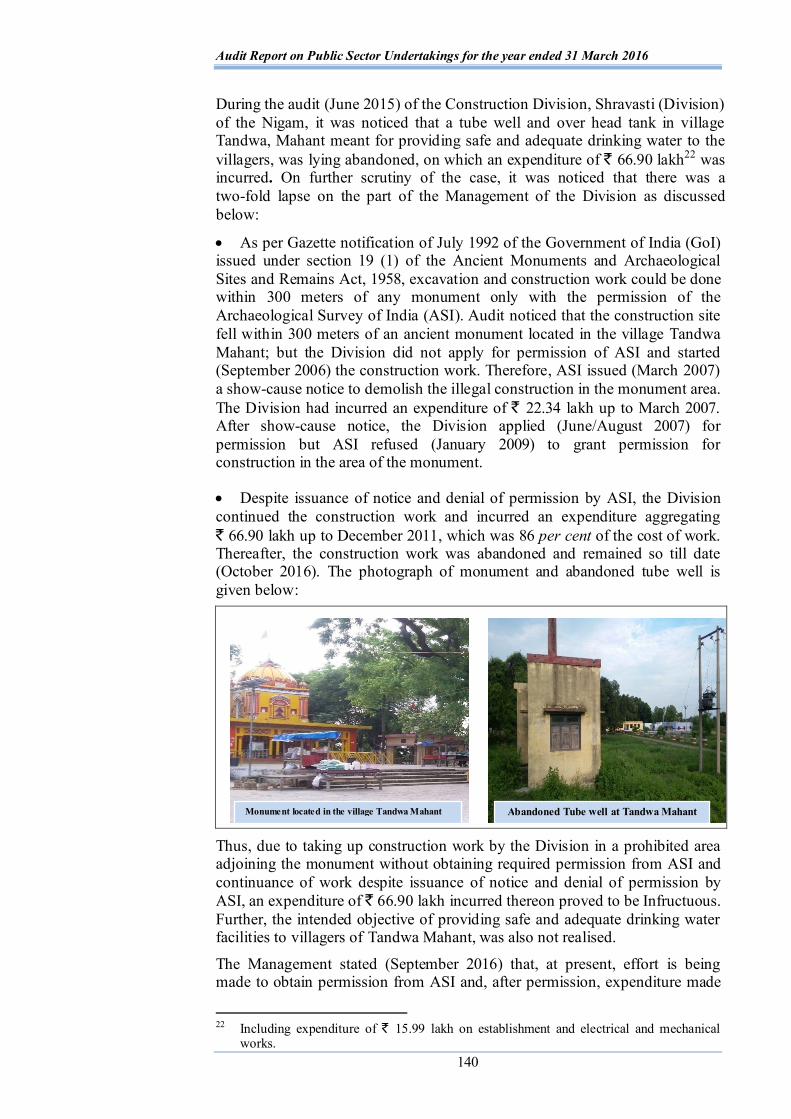
Audit Report on Public Sector Undertakings for the year ended 31 March 2016
140
During the audit (June 2015) of the Construction Division, Shravasti (Division) of the Nigam, it was noticed that a tube well and over head tank in village Tandwa, Mahant meant for providing safe and adequate drinking water to the villagers, was lying abandoned, on which an expenditure of ` 66.90 lakh22 was incurred. On further scrutiny of the case, it was noticed that there was a two-fold lapse on the part of the Management of the Division as discussed below:
As per Gazette notification of July 1992 of the Government of India (GoI) issued under section 19 (1) of the Ancient Monuments and Archaeological Sites and Remains Act, 1958, excavation and construction work could be done within 300 meters of any monument only with the permission of the Archaeological Survey of India (ASI). Audit noticed that the construction site fell within 300 meters of an ancient monument located in the village Tandwa Mahant; but the Division did not apply for permission of ASI and started (September 2006) the construction work. Therefore, ASI issued (March 2007) a show-cause notice to demolish the illegal construction in the monument area. The Division had incurred an expenditure of ` 22.34 lakh up to March 2007. After show-cause notice, the Division applied (June/August 2007) for permission but ASI refused (January 2009) to grant permission for construction in the area of the monument.
Despite issuance of notice and denial of permission by ASI, the Division continued the construction work and incurred an expenditure aggregating ` 66.90 lakh up to December 2011, which was 86 per cent of the cost of work. Thereafter, the construction work was abandoned and remained so till date (October 2016). The photograph of monument and abandoned tube well is given below:
Thus, due to taking up construction work by the Division in a prohibited area adjoining the monument without obtaining required permission from ASI and continuance of work despite issuance of notice and denial of permission by ASI, an expenditure of ` 66.90 lakh incurred thereon proved to be Infructuous. Further, the intended objective of providing safe and adequate drinking water facilities to villagers of Tandwa Mahant, was also not realised.
The Management stated (September 2016) that, at present, effort is being made to obtain permission from ASI and, after permission, expenditure made
22 Including expenditure of ` 15.99 lakh on establishment and electrical and mechanical works.
Monument located in the village Tandwa Mahant Abandoned Tube well at Tandwa Mahant
Chapter–III: Transaction Audit Observations
141
on the work would not be infructuous. However, no documentary evidence was furnished by the Management in support of reply that efforts were being made to obtain the required permission. The fact remained that the Division continued to incur expenditure on the work till December 2011 even after ASI had refused (January 2009) the grant of No Objection Certificate which resulted in expenditure of ` 66.90 lakh being rendered Infructuous. The matter was reported to Government in May 2016; reply was awaited (October 2016).
3.11 Avoidable expenditure on disposal of surplus earth
The Nigam failed to provide for the sale of earth on the spot and incurred an avoidable expenditure of ` 2.93 crore on disposal of earth. It also lost opportunity to earn revenue from sale of earth to the extent of ` 75.23 lakh
The Uttar Pradesh Jal Nigam (Nigam) prepares schemes for disposal of sewages in the State. In execution of scheme viz. development of sewerage/drainage system, earth is excavated for making drains. After the process of constructing drains and backfilling is completed, voluminous surplus earth remains for disposal.
As per Minor and Mineral (Development and Regulation) Act, 1957, ordinary earth (used for filling or leveling purpose) is a minor mineral. Thus, the earth, remained after backfilling, is a minor mineral and can be sold on the spot after deposit of due royalty. The sale of the earth on spot serves a two-fold purpose as it eliminates the need for incurring disposal costs and also could earn revenue. Even if given free of cost after deposit of due royalty, it will eliminate the cost of disposal from the total work estimate.
The Nigam was assigned by the Government of India (GOI) the work of execution of sewerage system under Jawahar Lal Nehru National Urban Renewal Mission (JNNURM). The Nigam executed (September 2009) an agreement with Contractor for construction of new/remodeled drains (Part-I), repair of existing drains (Part-II), laying of rising main (Part-III) and Civil and Electrical and Mechanical construction of pumping stations (Part-IV) at the aggregated cost of ` 93.87 crore under the project of storm water drainage for Mathura town. General specification of the agreement provided that the contractor would dispose off the extra/surplus earth from the site of work to the places specified by the Engineer. The measurement shall be recorded on the basis of volume of earth disposed off by the contractor by preparing contour plan or by mechanical means.
The details of estimated work and actual work done for excavation and disposal of surplus earth/silt/sand etc. under all Parts (excluding Part-IV involving no excavation) of the agreement is given in table 3.2.
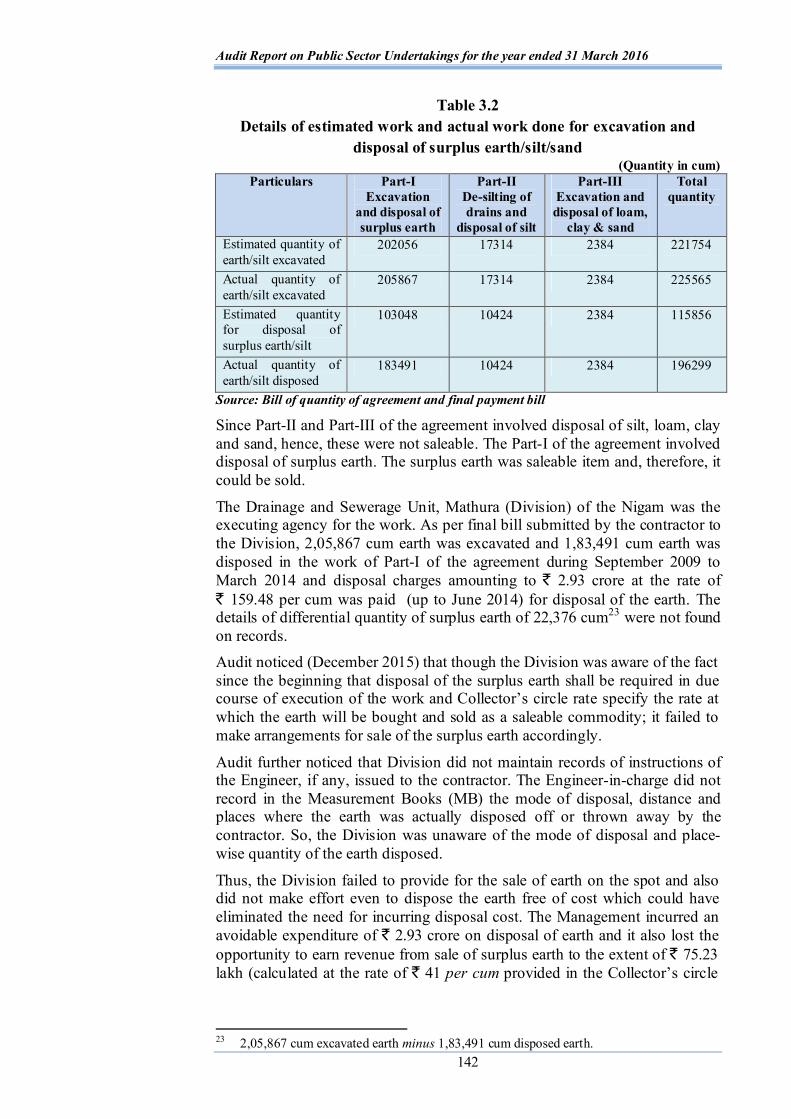
Audit Report on Public Sector Undertakings for the year ended 31 March 2016
142
Table 3.2 Details of estimated work and actual work done for excavation and
disposal of surplus earth/silt/sand (Quantity in cum)
Particulars Part-I Excavation
and disposal of surplus earth
Part-II De-silting of drains and
disposal of silt
Part-III Excavation and disposal of loam,
clay & sand
Total quantity
Estimated quantity of earth/silt excavated
202056 17314 2384 221754
Actual quantity of earth/silt excavated
205867 17314 2384 225565
Estimated quantity for disposal of surplus earth/silt
103048 10424 2384 115856
Actual quantity of earth/silt disposed
183491 10424 2384 196299
Source: Bill of quantity of agreement and final payment bill
Since Part-II and Part-III of the agreement involved disposal of silt, loam, clay and sand, hence, these were not saleable. The Part-I of the agreement involved disposal of surplus earth. The surplus earth was saleable item and, therefore, it could be sold.
The Drainage and Sewerage Unit, Mathura (Division) of the Nigam was the executing agency for the work. As per final bill submitted by the contractor to the Division, 2,05,867 cum earth was excavated and 1,83,491 cum earth was disposed in the work of Part-I of the agreement during September 2009 to March 2014 and disposal charges amounting to ` 2.93 crore at the rate of ` 159.48 per cum was paid (up to June 2014) for disposal of the earth. The details of differential quantity of surplus earth of 22,376 cum23 were not found on records. Audit noticed (December 2015) that though the Division was aware of the fact since the beginning that disposal of the surplus earth shall be required in due course of execution of the work and Collector’s circle rate specify the rate at which the earth will be bought and sold as a saleable commodity; it failed to make arrangements for sale of the surplus earth accordingly.
Audit further noticed that Division did not maintain records of instructions of the Engineer, if any, issued to the contractor. The Engineer-in-charge did not record in the Measurement Books (MB) the mode of disposal, distance and places where the earth was actually disposed off or thrown away by the contractor. So, the Division was unaware of the mode of disposal and place-wise quantity of the earth disposed.
Thus, the Division failed to provide for the sale of earth on the spot and also did not make effort even to dispose the earth free of cost which could have eliminated the need for incurring disposal cost. The Management incurred an avoidable expenditure of ` 2.93 crore on disposal of earth and it also lost the opportunity to earn revenue from sale of surplus earth to the extent of ` 75.23 lakh (calculated at the rate of ` 41 per cum provided in the Collector’s circle
23 2,05,867 cum excavated earth minus 1,83,491 cum disposed earth.


Annexures

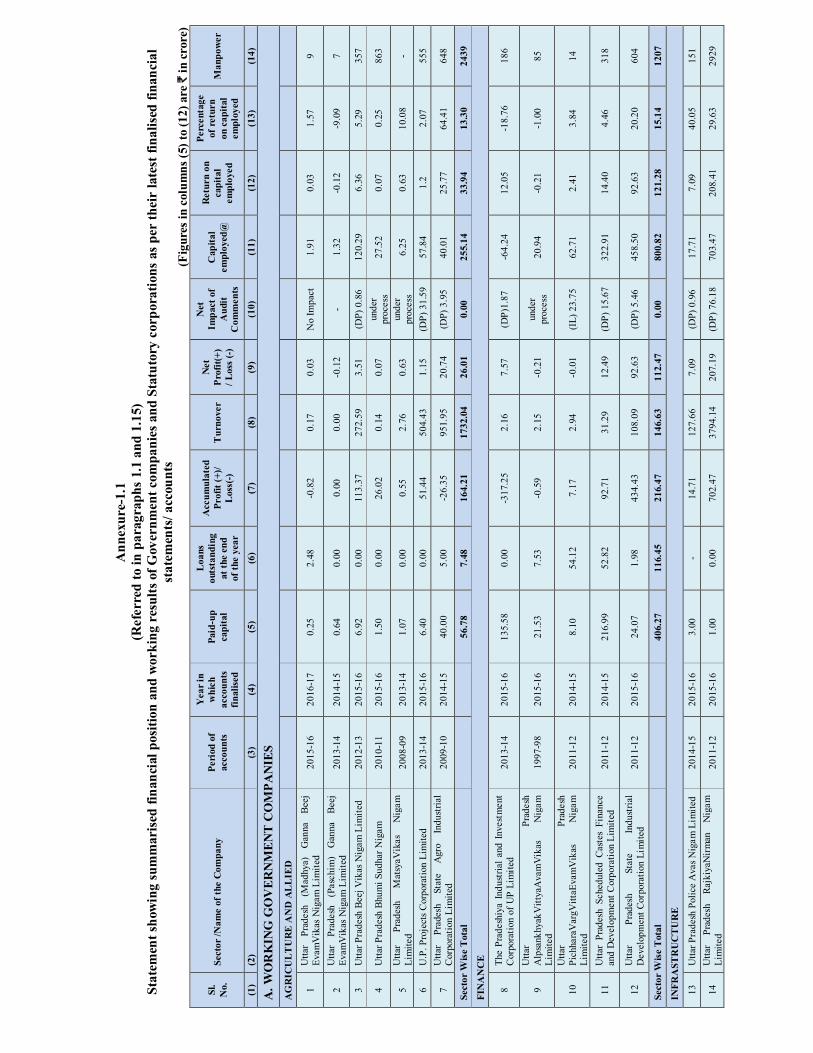
A
nnex
ure-
1.1
(Ref
erre
d to
in p
arag
raph
s 1.
1 an
d 1.
15)
Stat
emen
t sho
win
g su
mm
aris
ed fi
nanc
ial p
ositi
on a
nd w
orki
ng r
esul
ts o
f Gov
ernm
ent c
ompa
nies
and
Sta
tuto
ry c
orpo
ratio
ns a
s per
thei
r la
test
fina
lised
fina
ncia
l st
atem
ents
/ acc
ount
s (F
igur
es in
col
umns
(5) t
o (1
2) a
re `
in c
rore
)
Sl.
No.
Se
ctor
/Nam
e of
the
Com
pany
Pe
riod
of
acco
unts
Yea
r in
whi
ch
acco
unts
fin
alise
d
Paid
-up
capi
tal
Loa
ns
outs
tand
ing
at th
e en
d of
the
year
Acc
umul
ated
Pr
ofit
(+)/
Los
s(-)
T
urno
ver
Net
Pr
ofit(
+)
/ Los
s (-)
Net
Im
pact
of
Aud
it C
omm
ents
Cap
ital
empl
oyed
@
Ret
urn
on
capi
tal
empl
oyed
Perc
enta
ge
of r
etur
n on
cap
ital
empl
oyed
Man
pow
er
(1)
(2)
(3)
(4)
(5)
(6)
(7)
(8)
(9)
(10)
(1
1)
(12)
(1
3)
(14)
A. W
OR
KIN
G G
OV
ERN
MEN
T C
OM
PAN
IES
AG
RIC
UL
TU
RE
AN
D A
LL
IED
1
Utta
r Pr
ades
h (M
adhy
a)
Gan
na
Beej
Ev
amV
ikas
Nig
am L
imite
d 20
15-1
6 20
16-1
7 0.
25
2.48
-0
.82
0.17
0.
03
No
Impa
ct
1.91
0.
03
1.57
9
2 U
ttar
Prad
esh
(Pas
chim
) G
anna
Be
ej
Evam
Vik
as N
igam
Lim
ited
2013
-14
2014
-15
0.64
0.
00
0.00
0.
00
-0.1
2 -
1.32
-0
.12
-9.0
9 7
3 U
ttar P
rade
sh B
eej V
ikas
Nig
am L
imite
d 20
12-1
3 20
15-1
6 6.
92
0.00
11
3.37
27
2.59
3.
51
(DP)
0.8
6 12
0.29
6.
36
5.29
35
7
4 U
ttar P
rade
sh B
hum
i Sud
har N
igam
20
10-1
1 20
15-1
6 1.
50
0.00
26
.02
0.14
0.
07
unde
r pr
oces
s 27
.52
0.07
0.
25
863
5 U
ttar
Prad
esh
Mat
syaV
ikas
N
igam
Li
mite
d 20
08-0
9 20
13-1
4 1.
07
0.00
0.
55
2.76
0.
63
unde
r pr
oces
s 6.
25
0.63
10
.08
-
6 U
.P. P
roje
cts C
orpo
ratio
n Li
mite
d 20
13-1
4 20
15-1
6 6.
40
0.00
51
.44
504.
43
1.15
(D
P) 3
1.59
57
.84
1.2
2.07
55
5
7 U
ttar
Prad
esh
Stat
e A
gro
Indu
stria
l C
orpo
ratio
n Li
mite
d 20
09-1
0 20
14-1
5 40
.00
5.00
-2
6.35
95
1.95
20
.74
(DP)
3.9
5 40
.01
25.7
7 64
.41
648
Sect
or W
ise
Tot
al
56.7
8 7.
48
164.
21
1732
.04
26.0
1 0.
00
255.
14
33.9
4 13
.30
2439
FIN
AN
CE
8 Th
e Pr
ades
hiya
Ind
ustri
al a
nd I
nves
tmen
t C
orpo
ratio
n of
UP
Lim
ited
2013
-14
2015
-16
135.
58
0.00
-3
17.2
5 2.
16
7.57
(D
P)1.
87
-64.
24
12.0
5 -1
8.76
18
6
9 U
ttar
Prad
esh
Alp
sank
hyak
Vitt
yaA
vam
Vik
as
Nig
am
Lim
ited
1997
-98
2015
-16
21.5
3 7.
53
-0.5
9 2.
15
-0.2
1 un
der
proc
ess
20.9
4 -0
.21
-1.0
0 85
10
Utta
r Pr
ades
h Pi
chha
raV
argV
ittaE
vam
Vik
as
Nig
am
Lim
ited
2011
-12
2014
-15
8.10
54
.12
7.17
2.
94
-0.0
1 (I
L) 2
3.75
62
.71
2.41
3.
84
14
11
Utta
r Pr
ades
h Sc
hedu
led
Cas
tes
Fina
nce
and
Dev
elop
men
t Cor
pora
tion
Lim
ited
2011
-12
2014
-15
216.
99
52.8
2 92
.71
31.2
9 12
.49
(DP)
15.
67
322.
91
14.4
0 4.
46
318
12
Utta
r Pr
ades
h St
ate
Indu
stria
l D
evel
opm
ent C
orpo
ratio
n Li
mite
d 20
11-1
2 20
15-1
6 24
.07
1.98
43
4.43
10
8.09
92
.63
(DP)
5.4
6 45
8.50
92
.63
20.2
0 60
4
Sect
or W
ise
Tot
al
406.
27
116.
45
216.
47
146.
63
112.
47
0.00
80
0.82
12
1.28
15
.14
1207
INFR
AST
RU
CT
UR
E
13
Utta
r Pra
desh
Pol
ice
Ava
s Nig
am L
imite
d 20
14-1
5 20
15-1
6 3.
00
- 14
.71
127.
66
7.09
(D
P) 0
.96
17.7
1 7.
09
40.0
5 15
1
14
Utta
r Pr
ades
h Ra
jkiy
aNir
man
N
igam
Li
mite
d 20
11-1
2 20
15-1
6 1.
00
0.00
70
2.47
37
94.1
4 20
7.19
(D
P) 7
6.18
70
3.47
20
8.41
29
.63
2929
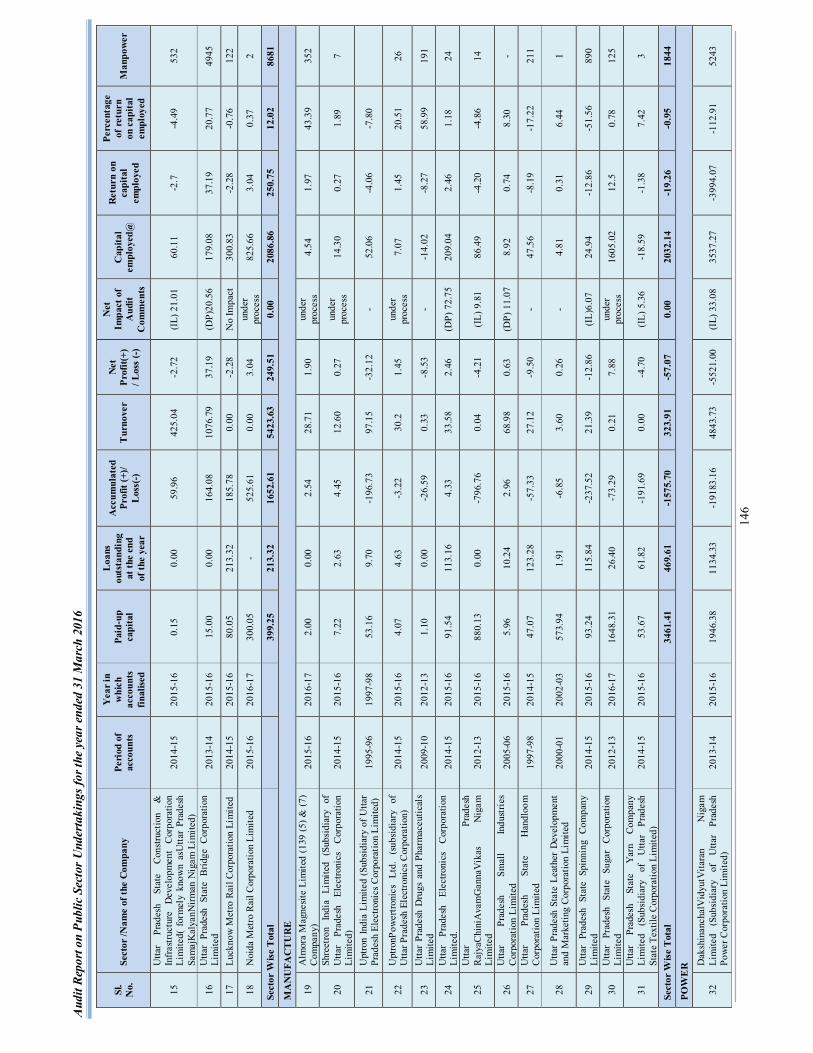
Aud
it Re
port
on P
ublic
Sec
tor U
nder
taki
ngs f
or th
e ye
ar e
nded
31
Mar
ch 2
016
146
Sl.
No.
Se
ctor
/Nam
e of
the
Com
pany
Pe
riod
of
acco
unts
Yea
r in
whi
ch
acco
unts
fin
alise
d
Paid
-up
capi
tal
Loa
ns
outs
tand
ing
at th
e en
d of
the
year
Acc
umul
ated
Pr
ofit
(+)/
Los
s(-)
T
urno
ver
Net
Pr
ofit(
+)
/ Los
s (-)
Net
Im
pact
of
Aud
it C
omm
ents
Cap
ital
empl
oyed
@
Ret
urn
on
capi
tal
empl
oyed
Perc
enta
ge
of r
etur
n on
cap
ital
empl
oyed
Man
pow
er
15
Utta
r Pr
ades
h St
ate
Cons
truct
ion
&
Infr
astru
ctur
e D
evel
opm
ent
Cor
pora
tion
Lim
ited(
for
mel
y kn
own
asU
ttar
Prad
esh
Sam
ajK
alya
nNirm
an N
igam
Lim
ited)
2014
-15
2015
-16
0.15
0.
00
59.9
6 42
5.04
-2
.72
(IL)
21.
01
60.1
1 -2
.7
-4.4
9 53
2
16
Utta
r Pr
ades
h St
ate
Brid
ge C
orpo
ratio
n Li
mite
d 20
13-1
4 20
15-1
6 15
.00
0.00
16
4.08
10
76.7
9 37
.19
(DP)
20.5
6 17
9.08
37
.19
20.7
7 49
45
17
Luck
now
Met
ro R
ail C
orpo
ratio
n Li
mite
d 20
14-1
5 20
15-1
6 80
.05
213.
32
185.
78
0.00
-2
.28
No
Impa
ct
300.
83
-2.2
8 -0
.76
122
18
Noi
da M
etro
Rai
l Cor
pora
tion
Lim
ited
2015
-16
2016
-17
300.
05
- 52
5.61
0.
00
3.04
un
der
proc
ess
825.
66
3.04
0.
37
2
Sect
or W
ise
Tot
al
399.
25
213.
32
1652
.61
5423
.63
249.
51
0.00
20
86.8
6 25
0.75
12
.02
8681
MA
NU
FAC
TU
RE
19
Alm
ora
Mag
nesit
e Li
mite
d (1
39 (5
) & (7
) C
ompa
ny)
2015
-16
2016
-17
2.00
0.
00
2.54
28
.71
1.90
un
der
proc
ess
4.54
1.
97
43.3
9 35
2
20
Shre
etro
n In
dia
Lim
ited
(Sub
sidi
ary
of
Utta
r Pr
ades
h El
ectro
nics
C
orpo
ratio
n Li
mite
d)
2014
-15
2015
-16
7.22
2.
63
4.45
12
.60
0.27
un
der
proc
ess
14.3
0 0.
27
1.89
7
21
Upt
ron
Indi
a Li
mite
d (S
ubsi
diar
y of
Utta
r Pr
ades
h El
ectro
nics
Cor
pora
tion
Lim
ited)
19
95-9
6 19
97-9
8 53
.16
9.70
-1
96.7
3 97
.15
-32.
12
- 52
.06
-4.0
6 -7
.80
22
Upt
ronP
ower
troni
cs
Ltd.
(s
ubsi
diar
y of
U
ttar P
rade
sh E
lect
roni
cs C
orpo
ratio
n)
2014
-15
2015
-16
4.07
4.
63
-3.2
2 30
.2
1.45
un
der
proc
ess
7.07
1.
45
20.5
1 26
23
Utta
r Pr
ades
h D
rugs
and
Pha
rmac
eutic
als
Lim
ited
2009
-10
2012
-13
1.10
0.
00
-26.
59
0.33
-8
.53
- -1
4.02
-8
.27
58.9
9 19
1
24
Utta
r Pr
ades
h El
ectro
nics
C
orpo
ratio
n Li
mite
d.
2014
-15
2015
-16
91.5
4 11
3.16
4.
33
33.5
8 2.
46
(DP)
72.
75
209.
04
2.46
1.
18
24
25
Utta
r Pr
ades
h R
ajya
Chi
niA
vam
Gan
naV
ikas
N
igam
Li
mite
d 20
12-1
3 20
15-1
6 88
0.13
0.
00
-796
.76
0.04
-4
.21
(IL)
9.8
1 86
.49
-4.2
0 -4
.86
14
26
Utta
r Pr
ades
h Sm
all
Indu
strie
s C
orpo
ratio
n Li
mite
d 20
05-0
6 20
15-1
6 5.
96
10.2
4 2.
96
68.9
8 0.
63
(DP)
11.
07
8.92
0.
74
8.30
-
27
Utta
r Pr
ades
h St
ate
Han
dloo
m
Cor
pora
tion
Lim
ited
1997
-98
2014
-15
47.0
7 12
3.28
-5
7.33
27
.12
-9.5
0 -
47.5
6 -8
.19
-17.
22
211
28
Utta
r Pr
ades
h St
ate
Leat
her
Dev
elop
men
t an
d M
arke
ting
Corp
orat
ion
Lim
ited
2000
-01
2002
-03
573.
94
1.91
-6
.85
3.60
0.
26
- 4.
81
0.31
6.
44
1
29
Utta
r Pr
ades
h St
ate
Spin
ning
Com
pany
Li
mite
d 20
14-1
5 20
15-1
6 93
.24
115.
84
-237
.52
21.3
9 -1
2.86
(I
L)6.
07
24.9
4 -1
2.86
-5
1.56
89
0
30
Utta
r Pr
ades
h St
ate
Suga
r C
orpo
ratio
n Li
mite
d 20
12-1
3 20
16-1
7 16
48.3
1 26
.40
-73.
29
0.21
7.
88
unde
r pr
oces
s 16
05.0
2 12
.5
0.78
12
5
31
Utta
r Pr
ades
h St
ate
Yar
n Co
mpa
ny
Lim
ited
(Sub
sidi
ary
of
Utta
r Pr
ades
h St
ate
Text
ile C
orpo
ratio
n Li
mite
d)
2014
-15
2015
-16
53.6
7 61
.82
-191
.69
0.00
-4
.70
(IL)
5.3
6 -1
8.59
-1
.38
7.42
3
Sect
or W
ise
Tot
al
3461
.41
469.
61
-157
5.70
32
3.91
-5
7.07
0.
00
2032
.14
-19.
26
-0.9
5 18
44
POW
ER
32
Dak
shin
anch
alV
idyu
tVita
ran
Nig
am
Lim
ited
(Sub
sidi
ary
of
Utta
r Pr
ades
h Po
wer C
orpo
ratio
n Li
mite
d)
2013
-14
2015
-16
1946
.38
1134
.33
-191
83.1
6 48
43.7
3 -5
521.
00
(IL)
33.
08
3537
.27
-399
4.07
-1
12.9
1 52
43

Anne
xure
s
147
Sl.
No.
Se
ctor
/Nam
e of
the
Com
pany
Pe
riod
of
acco
unts
Yea
r in
whi
ch
acco
unts
fin
alise
d
Paid
-up
capi
tal
Loa
ns
outs
tand
ing
at th
e en
d of
the
year
Acc
umul
ated
Pr
ofit
(+)/
Los
s(-)
T
urno
ver
Net
Pr
ofit(
+)
/ Los
s (-)
Net
Im
pact
of
Aud
it C
omm
ents
Cap
ital
empl
oyed
@
Ret
urn
on
capi
tal
empl
oyed
Perc
enta
ge
of r
etur
n on
cap
ital
empl
oyed
Man
pow
er
33
Kan
pur
Elec
trici
ty
Supp
ly
Com
pany
Li
mite
d 20
13-1
4 20
15-1
6 16
3.15
15
22.2
2 -3
320.
86
1545
.24
-674
.00
- -9
0.80
-3
79.6
6 41
8.13
16
74
34
Mad
hyan
chal
V
idyu
tVita
ran
Nig
am
Lim
ited
(Sub
sidi
ary
of
Utta
r Pr
ades
h Po
wer C
orpo
ratio
n Li
mite
d)
2013
-14
2015
-16
2780
.44
1053
1.41
-1
1733
.15
4495
.74
-326
2.77
(D
L) 3
3.78
35
75.4
0 -2
440.
12
-68.
25
6961
35
Pasc
him
anch
alV
idyu
tVita
ran
Nig
am
Lim
ited
(Sub
sidi
ary
of
Utta
r Pr
ades
h Po
wer
C
orpo
ratio
n Li
mite
d)
2013
-14
2015
-16
2478
.2
9564
.76
-107
54.4
3 89
26.7
2 -3
171.
51
(IL)
0.3
9 34
34.1
5 -2
190.
59
-63.
79
5708
36
Purv
anch
alV
idyu
tVita
ran
Nig
am L
imite
d (S
ubsi
diar
y of
U
ttar
Prad
esh
Pow
er
Cor
pora
tion
Lim
ited)
20
13-1
4 20
15-1
6 30
86.1
2 62
5.47
-1
5110
.38
4960
.65
-409
4.62
-
2547
.86
-285
6.51
-1
12.1
1 77
86
37
Sone
bhad
ra P
ower
Gen
erat
ion
Com
pany
Li
mite
d 20
11-1
2 20
15-1
6 0.
07
0.00
-3
.68
0.04
-0
.71
- -3
.61
-0.7
1 19
.67
-
38
UCM
Coa
l Com
pany
Lim
ited
2014
-15
2016
-17
0.16
0.
50
0.08
0.
00
0.00
-
0.74
0.
00
0.00
-
39
UPS
IDC
Po
wer
Co
mpa
ny
Lim
ited
(Sub
sidi
ary
of
Utta
r Pr
ades
h St
ate
Indu
stria
l D
evel
opm
ent
Cor
pora
tion
Lim
ited)
2012
-13
2014
-15
0.05
0.
00
-0.2
4 0.
00
-0.0
2 -
-0.1
9 -0
.02
10.5
3 0
40
Utta
r Pra
desh
Jal
Vid
yut N
igam
Lim
ited
2013
-14
2015
-16
434.
53
149.
86
-308
.28
103.
32
10.3
8 (D
P) 0
.67
278.
33
32.9
1 11
.82
543
41
Utta
r Pra
desh
Pow
er C
orpo
ratio
n Li
mite
d 20
13-1
4 20
14-1
5 35
690.
22
3037
8.80
-3
4679
.69
3652
1.05
-1
489.
77
(IL)
18.
76
5552
9.32
-1
338.
84
-2.4
1 16
85
42
Utta
r Pr
ades
h Po
wer
Tr
ansm
issi
on
Cor
pora
tion
Lim
ited
20
14-1
5 20
16-1
7 86
41.2
83
97.6
5 -3
88.4
9 13
04.9
1 -7
1.87
un
der
proc
ess
1469
2.10
32
4.87
2.
21
6094
43
Utta
r Pr
ades
h R
ajya
Vid
yutU
tpad
an
Nig
am L
imite
d 20
14-1
5 20
15-1
6 80
43.0
5 11
223.
47
908.
23
8251
.26
98.7
1 (D
P) 2
.35
1879
7.19
87
1.06
4.
63
8425
44
Jaw
ahar
Vid
yutU
tpad
an N
igam
Lim
ited
2013
-14
2015
-16
0.05
0.
00
-0.7
6 -
0.00
-
-0.7
1 0.
00
0.00
-
45
Yam
una
Pow
er G
ener
atio
n C
orpo
ratio
n Li
mite
d (In
corp
orat
ed w
.e.f.
20-
04-1
0)
2010
-11
2015
-16
0.05
0.
00
0.00
0.
00
-1.2
1 un
der
proc
ess
0.05
-1
.21
-242
0.00
0
Sect
or W
ise
Tot
al
6326
3.67
73
528.
47
-945
74.8
0 70
952.
66
-181
78.3
9 0.
00
1022
97.1
0 -1
1972
.89
-11.
70
4411
9
SER
VIC
E
46
Utta
r Pr
ades
h D
evel
opm
ent
Syst
ems
Cor
pora
tion
Lim
ited
2014
-15
2015
-16
1.00
0.
00
5.18
7.
78
2.66
(D
P) 0
.24
6.18
2.
66
43.0
4 75
47
Utta
r Pr
ades
h H
andi
craf
t &
M
arke
ting
Dev
elop
men
t C
orpo
ratio
n Li
mite
d(Fo
rmer
ly U
ttar
Prad
esh
Expo
rt C
orpo
ratio
n Li
mite
d)
2006
-07
2014
-15
7.24
7.
44
21.9
2 7.
48
-0.7
0 -
7.51
-0
.70
-9.3
2 70
48
Utta
r Pr
ades
h Fo
od
and
Esse
ntia
l C
omm
oditi
es C
orpo
ratio
n Li
mite
d 20
07-0
8 20
15-1
6 5.
50
11.8
8 23
.61
877.
4 4.
17
(DP)
0.2
5 10
5.87
4.
87
4.60
66
1
49
Utta
r Pra
desh
Sta
te T
ouris
m D
evel
opm
ent
Cor
pora
tion
Lim
ited
2013
-14
2015
-16
18.6
0 0.
96
-14.
22
33.0
9 -0
.45
(IL)
0.33
5.
70
-0.4
3 -7
.54
490
Sect
or W
ise
Tot
al
32.3
4 20
.28
36.4
9 92
5.75
5.
68
0.00
12
5.26
6.
40
5.11
12
96
MIS
CEL
LE
NE
OU
S
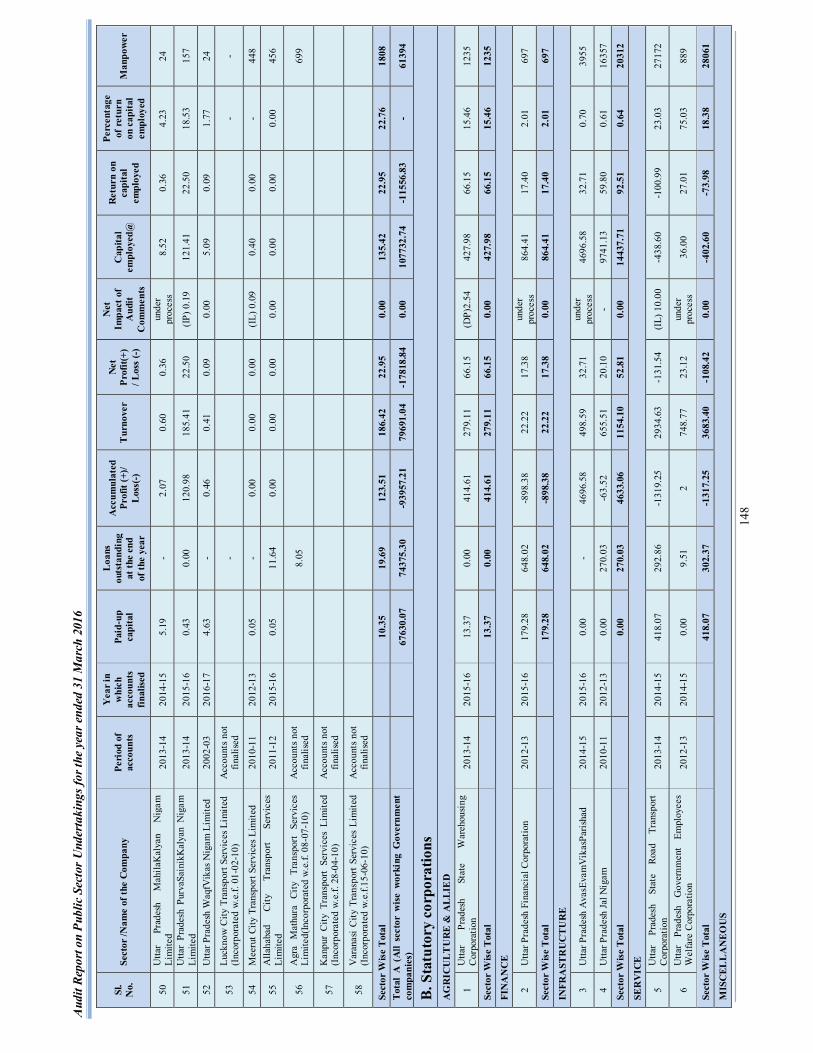
Aud
it Re
port
on P
ublic
Sec
tor U
nder
taki
ngs f
or th
e ye
ar e
nded
31
Mar
ch 2
016
148
Sl.
No.
Se
ctor
/Nam
e of
the
Com
pany
Pe
riod
of
acco
unts
Yea
r in
whi
ch
acco
unts
fin
alise
d
Paid
-up
capi
tal
Loa
ns
outs
tand
ing
at th
e en
d of
the
year
Acc
umul
ated
Pr
ofit
(+)/
Los
s(-)
T
urno
ver
Net
Pr
ofit(
+)
/ Los
s (-)
Net
Im
pact
of
Aud
it C
omm
ents
Cap
ital
empl
oyed
@
Ret
urn
on
capi
tal
empl
oyed
Perc
enta
ge
of r
etur
n on
cap
ital
empl
oyed
Man
pow
er
50
Utta
r Pr
ades
h M
ahila
Kal
yan
Nig
am
Lim
ited
2013
-14
2014
-15
5.19
-
2.07
0.
60
0.36
un
der
proc
ess
8.52
0.
36
4.23
24
51
Utta
r Pr
ades
h Pu
rvaS
aini
kKal
yan
Nig
am
Lim
ited
2013
-14
2015
-16
0.43
0.
00
120.
98
185.
41
22.5
0 (IP
) 0.1
9 12
1.41
22
.50
18.5
3 15
7
52
Utta
r Pra
desh
Waq
fVik
as N
igam
Lim
ited
2002
-03
2016
-17
4.63
-
0.46
0.
41
0.09
0.
00
5.09
0.
09
1.77
24
53
Luck
now
City
Tra
nspo
rt Se
rvic
es L
imite
d (I
ncor
pora
ted
w.e.
f. 01
-02-
10)
Acc
ount
s not
fin
alis
ed
-
-
-
54
Mee
rut C
ity T
rans
port
Serv
ices
Lim
ited
2010
-11
2012
-13
0.05
-
0.00
0.
00
0.00
(I
L) 0
.09
0.40
0.
00
- 44
8
55
Alla
haba
d C
ity
Tran
spor
t Se
rvic
es
Lim
ited
2011
-12
2015
-16
0.05
11
.64
0.00
0.
00
0.00
0.
00
0.00
0.
00
0.00
45
6
56
Agr
a M
athu
ra
City
Tr
ansp
ort
Serv
ices
Li
mite
d(In
corp
orat
ed w
.e.f.
08-
07-1
0)
Acc
ount
s not
fin
alis
ed
8.05
699
57
Kan
pur
City
Tra
nspo
rt Se
rvic
es L
imite
d (I
ncor
pora
ted
w.e.
f. 28
-04-
10)
Acc
ount
s not
fin
alis
ed
58
Var
anas
i City
Tra
nspo
rt Se
rvic
es L
imite
d (I
ncor
pora
ted
w.e.
f.15-
06-1
0)
Acc
ount
s not
fin
alis
ed
Sect
or W
ise
Tot
al
10.3
5 19
.69
123.
51
186.
42
22.9
5 0.
00
135.
42
22.9
5 22
.76
1808
T
otal
A (
All
sect
or w
ise
wor
king
Gov
ernm
ent
com
pani
es)
6763
0.07
74
375.
30
-939
57.2
1 79
691.
04
-178
18.8
4 0.
00
1077
32.7
4 -1
1556
.83
- 61
394
B. S
tatu
tory
cor
pora
tions
A
GR
ICU
LT
UR
E &
AL
LIE
D
1 U
ttar
Prad
esh
Stat
e W
areh
ousi
ng
Cor
pora
tion
2013
-14
2015
-16
13.3
7 0.
00
414.
61
279.
11
66.1
5 (D
P)2.
54
427.
98
66.1
5 15
.46
1235
Sect
or W
ise
Tot
al
13.3
7 0.
00
414.
61
279.
11
66.1
5 0.
00
427.
98
66.1
5 15
.46
1235
FIN
AN
CE
2 U
ttar P
rade
sh F
inan
cial
Cor
pora
tion
2012
-13
2015
-16
179.
28
648.
02
-898
.38
22.2
2 17
.38
unde
r pr
oces
s 86
4.41
17
.40
2.01
69
7
Sect
or W
ise
Tot
al
179.
28
648.
02
-898
.38
22.2
2 17
.38
0.00
86
4.41
17
.40
2.01
69
7
INFR
AST
RU
CT
UR
E
3 U
ttar P
rade
sh A
vasE
vam
Vik
asPa
risha
d 20
14-1
5 20
15-1
6 0.
00
- 46
96.5
8 49
8.59
32
.71
unde
r pr
oces
s 46
96.5
8 32
.71
0.70
39
55
4 U
ttar P
rade
sh J
al N
igam
20
10-1
1 20
12-1
3 0.
00
270.
03
-63.
52
655.
51
20.1
0 -
9741
.13
59.8
0 0.
61
1635
7
Sect
or W
ise
Tot
al
0.00
27
0.03
46
33.0
6 11
54.1
0 52
.81
0.00
14
437.
71
92.5
1 0.
64
2031
2
SER
VIC
E
5 U
ttar
Prad
esh
Stat
e Ro
ad
Tran
spor
t C
orpo
ratio
n 20
13-1
4 20
14-1
5 41
8.07
29
2.86
-1
319.
25
2934
.63
-131
.54
(IL)
10.
00
-438
.60
-100
.99
23.0
3 27
172
6 U
ttar
Prad
esh
Gov
ernm
ent
Empl
oyee
s W
elfa
re C
orpo
ratio
n 20
12-1
3 20
14-1
5 0.
00
9.51
2
748.
77
23.1
2 un
der
proc
ess
36.0
0 27
.01
75.0
3 88
9
Sect
or W
ise
Tot
al
418.
07
302.
37
-131
7.25
36
83.4
0 -1
08.4
2 0.
00
-402
.60
-73.
98
18.3
8 28
061
MIS
CEL
LA
NE
OU
S
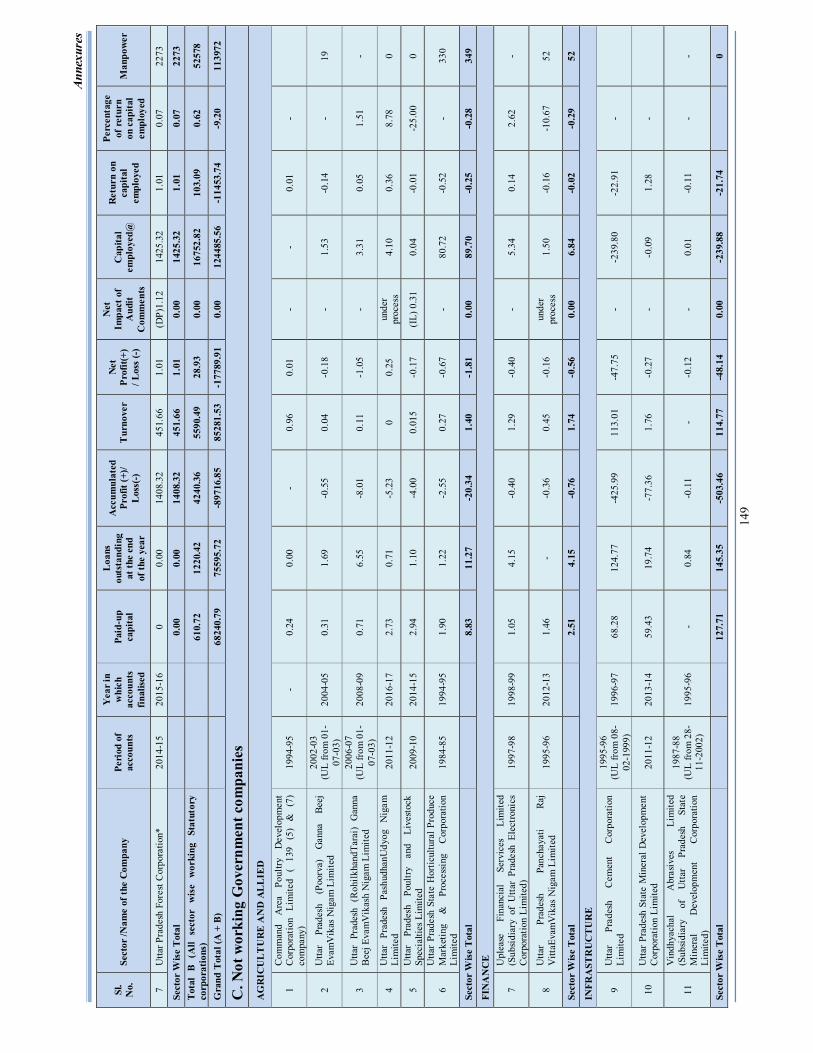
Anne
xure
s
149
Sl.
No.
Se
ctor
/Nam
e of
the
Com
pany
Pe
riod
of
acco
unts
Yea
r in
whi
ch
acco
unts
fin
alise
d
Paid
-up
capi
tal
Loa
ns
outs
tand
ing
at th
e en
d of
the
year
Acc
umul
ated
Pr
ofit
(+)/
Los
s(-)
T
urno
ver
Net
Pr
ofit(
+)
/ Los
s (-)
Net
Im
pact
of
Aud
it C
omm
ents
Cap
ital
empl
oyed
@
Ret
urn
on
capi
tal
empl
oyed
Perc
enta
ge
of r
etur
n on
cap
ital
empl
oyed
Man
pow
er
7 U
ttar P
rade
sh F
ores
t Cor
pora
tion*
20
14-1
5 20
15-1
6 0
0.00
14
08.3
2 45
1.66
1.
01
(DP)
1.12
14
25.3
2 1.
01
0.07
22
73
Sect
or W
ise
Tot
al
0.00
0.
00
1408
.32
451.
66
1.01
0.
00
1425
.32
1.01
0.
07
2273
T
otal
B
(A
ll se
ctor
w
ise
wor
king
St
atut
ory
corp
orat
ions
)
61
0.72
12
20.4
2 42
40.3
6 55
90.4
9 28
.93
0.00
16
752.
82
103.
09
0.62
52
578
Gra
nd T
otal
(A +
B)
6824
0.79
75
595.
72
-897
16.8
5 85
281.
53
-177
89.9
1 0.
00
1244
85.5
6 -1
1453
.74
-9.2
0 11
3972
C. N
ot w
orki
ng G
over
nmen
t com
pani
es
AG
RIC
UL
TU
RE
AN
D A
LL
IED
1 C
omm
and
Are
a Po
ultry
D
evel
opm
ent
Cor
pora
tion
Lim
ited
( 13
9 (5
) &
(7
) co
mpa
ny)
1994
-95
- 0.
24
0.00
-
0.96
0.
01
- -
0.01
-
2 U
ttar
Prad
esh
(Poo
rva)
G
anna
Be
ej
Evam
Vik
as N
igam
Lim
ited
2002
-03
(U
L fr
om 0
1-07
-03)
20
04-0
5 0.
31
1.69
-0
.55
0.04
-0
.18
- 1.
53
-0.1
4 -
19
3 U
ttar
Prad
esh
(Roh
ilkha
ndTa
rai)
Gan
na
Bee
j Eva
mV
ikas
h N
igam
Lim
ited
2006
-07
(U
L fr
om 0
1-07
-03)
20
08-0
9 0.
71
6.55
-8
.01
0.11
-1
.05
- 3.
31
0.05
1.
51
-
4 U
ttar
Prad
esh
Pash
udha
nUdy
og
Nig
am
Lim
ited
2011
-12
2016
-17
2.73
0.
71
-5.2
3 0
0.25
un
der
proc
ess
4.10
0.
36
8.78
0
5 U
ttar
Prad
esh
Poul
try
and
Live
stoc
k Sp
ecia
lties
Lim
ited
2009
-10
2014
-15
2.94
1.
10
-4.0
0 0.
015
-0.1
7 (I
L) 0
.31
0.04
-0
.01
-25.
00
0
6 U
ttar
Prad
esh
Stat
e H
ortic
ultu
ral P
rodu
ce
Mar
ketin
g &
Pr
oces
sing
C
orpo
ratio
n Li
mite
d 19
84-8
5 19
94-9
5 1.
90
1.22
-2
.55
0.27
-0
.67
- 80
.72
-0.5
2 -
330
Sect
or W
ise
Tot
al
8.83
11
.27
-20.
34
1.40
-1
.81
0.00
89
.70
-0.2
5 -0
.28
349
FIN
AN
CE
7 U
plea
se
Fina
ncia
l Se
rvic
es
Lim
ited
(Sub
sidi
ary
of U
ttar
Prad
esh
Elec
troni
cs
Cor
pora
tion
Lim
ited)
19
97-9
8 19
98-9
9 1.
05
4.15
-0
.40
1.29
-0
.40
- 5.
34
0.14
2.
62
-
8 U
ttar
Prad
esh
Panc
haya
ti Ra
j V
ittaE
vam
Vik
as N
igam
Lim
ited
1995
-96
2012
-13
1.46
-
-0.3
6 0.
45
-0.1
6 un
der
proc
ess
1.50
-0
.16
-10.
67
52
Sect
or W
ise
Tot
al
2.51
4.
15
-0.7
6 1.
74
-0.5
6 0.
00
6.84
-0
.02
-0.2
9 52
INFR
AST
RU
CT
UR
E
9 U
ttar
Prad
esh
Cem
ent
Cor
pora
tion
Lim
ited
1995
-96
(U
L fr
om 0
8-02
-199
9)
1996
-97
68.2
8 12
4.77
-4
25.9
9 11
3.01
-4
7.75
-
-239
.80
-22.
91
-
10
Utta
r Pr
ades
h St
ate
Min
eral
Dev
elop
men
t C
orpo
ratio
n Li
mite
d 20
11-1
2 20
13-1
4 59
.43
19.7
4 -7
7.36
1.
76
-0.2
7 -
-0.0
9 1.
28
-
11
Vin
dhya
chal
A
bras
ives
Li
mite
d (S
ubsi
diar
y of
U
ttar
Prad
esh
Stat
e M
iner
al
Dev
elop
men
t C
orpo
ratio
n Li
mite
d)
1987
-88
(U
L fr
om 2
8-11
-200
2)
1995
-96
- 0.
84
-0.1
1 -
-0.1
2 -
0.01
-0
.11
- -
Sect
or W
ise
Tot
al
127.
71
145.
35
-503
.46
114.
77
-48.
14
0.00
-2
39.8
8 -2
1.74
0

Aud
it Re
port
on P
ublic
Sec
tor U
nder
taki
ngs f
or th
e ye
ar e
nded
31
Mar
ch 2
016
150
Sl.
No.
Se
ctor
/Nam
e of
the
Com
pany
Pe
riod
of
acco
unts
Yea
r in
whi
ch
acco
unts
fin
alise
d
Paid
-up
capi
tal
Loa
ns
outs
tand
ing
at th
e en
d of
the
year
Acc
umul
ated
Pr
ofit
(+)/
Los
s(-)
T
urno
ver
Net
Pr
ofit(
+)
/ Los
s (-)
Net
Im
pact
of
Aud
it C
omm
ents
Cap
ital
empl
oyed
@
Ret
urn
on
capi
tal
empl
oyed
Perc
enta
ge
of r
etur
n on
cap
ital
empl
oyed
Man
pow
er
MA
NU
FAC
TU
RE
12
Aut
o Tr
acto
rs L
imite
d 19
91-9
2
(UL
from
14-
02-2
003)
19
95-9
6 7.
50
0.38
-
6.31
0.
11
- 11
.14
0.37
3.
32
-
13
Bha
dohi
Woo
llens
Lim
ited
(Sub
sidia
ry o
f U
ttar
Prad
esh
Stat
e Te
xtile
Cor
pora
tion
Ltd.
)
1994
-95
(U
L fr
om 2
0-02
-96)
-
3.76
0.
00
-11.
95
0.27
-1
.66
- -0
.49
0.85
-1
73.4
7 -
14
Chh
ata
Suga
r C
ompa
ny
Lim
ited
(Sub
sidi
ary
of U
ttar
Prad
esh
Stat
e Su
gar
Cor
pora
tion
Lim
ited)
20
13-1
4 20
15-1
6 81
.38
0.23
-1
05.4
1 0.
00
-3.2
8 (I
L)0.
10
11.1
9 -1
.19
-10.
63
7
15
Con
tinen
tal F
loat
Gla
ss L
imite
d 19
97-9
8
(UL
from
01-
04-2
002)
20
02-0
3 46
.24
138.
85
- -
- -
83.8
7
Com
pany
w
ent i
nto
Liqu
idat
ion
(sin
ce
ince
ptio
n)
-
16
Elec
troni
cs
and
Com
pute
rs
(Ind
ia)
Lim
ited
(139
(5)
& (7
) C
ompa
ny)
(UL
from
(14-
07-1
981)
-
- 0.
00
- -
- -
- -
-
17
Gha
tam
pur
Suga
r C
ompa
ny
Lim
ited
(Sub
sidi
ary
of U
ttar
Prad
esh
Stat
e Su
gar
Cor
pora
tion
Lim
ited
2014
-15
2015
-16
147.
71
2.16
-1
55.5
6 0.
00
0.31
(D
P)0.
37
147.
80
0.31
0.
21
11
18
Kan
pur
Com
pone
nts
Lim
ited
(Sub
sidi
ary
of U
ttar
Prad
esh
Elec
troni
cs C
orpo
ratio
n Li
mite
d)
(UL
from
10
-06-
1996
) -
- 0.
00
- 0.
05
- -
- -
-
19
Nan
dgan
j-Sih
ori S
ugar
Com
pany
Lim
ited
(Sub
sidi
ary
of U
ttar
Prad
esh
Stat
e Su
gar
Cor
pora
tion
Lim
ited)
20
12-1
3 20
15-1
6 25
6.80
7.
69
-250
.31
0.00
-3
.43
(DL)
1.67
25
6.84
-2
.94
-1.1
4 80
20
The
Indi
an
Turp
entin
e an
d Ro
sin
Com
pany
Lim
ited
2010
-11
2012
-13
0.22
7.
21
-32.
93
0.03
-0
.60
- -2
5.54
-0
.50
- -
21
Utta
r Pr
ades
h A
bsco
tt Pr
ivat
e Li
mite
d
(Sub
sidi
ary
of
Utta
r Pr
ades
h Sm
all
Indu
strie
s Cor
pora
tion
Lim
ited)
1975
-76
(U
L fr
om 1
9-04
-199
6)
0.
05
0.00
-
- -0
.02
- 0.
12
-0.0
1 -
-
22
Utta
r Pr
ades
h Ca
rbid
e an
d C
hem
ical
s Li
mite
d
(Sub
sidi
ary
of
Utta
r Pr
ades
h St
ate
Min
eral
Dev
elop
men
t C
orpo
ratio
n Li
mite
d)
1992
-93
(U
L fr
om 1
9-02
-94)
-
6.58
11
.02
-35.
32
2.26
-6
.18
- -1
8.45
-0
.51
-
23
Utta
r Pr
ades
h In
strum
ents
Li
mite
d (S
ubsi
diar
y of
U
ttar
Prad
esh
Stat
e In
dust
rial
Dev
elop
men
t C
orpo
ratio
n Li
mite
d)
2001
-02
2005
-06
1.93
17
.04
-38.
75
0.16
-0
.29
- 0.
35
-0.2
7 -
259
24
Utta
r Pra
desh
Pla
nt P
rote
ctio
n A
pplia
nces
(P
rivat
e)
Lim
ited
(Sub
sidi
ary
of
Utta
r Pr
ades
h Sm
all
Indu
strie
s C
orpo
ratio
n Li
mite
d)
1974
-75
(U
L fr
om
11/2
003)
19
84-8
5 0.
01
0.00
0.
01
0.04
-0
.01
- -0
.34
-0.0
1 -
-
25
Utta
r Pr
ades
h St
ate
Bra
ssw
are
Cor
pora
tion
Lim
ited
1997
-98
2007
-08
5.38
1.
94
-6.0
4 0.
53
2.39
-
3.59
2.
51
69.9
2
26
Utta
r Pr
ades
h St
ate
Text
ile C
orpo
ratio
n Li
mite
d 20
14-1
5 20
15-1
6 16
0.79
0.
00
-503
.03
0.00
-8
.48
(DL)
7.7
-3
42.2
4 -1
.62
0.47
0
Sect
or W
ise
Tot
al
718.
35
186.
52
-113
9.29
9.
65
-21.
14
0.00
12
7.84
-3
.01
- 35
7
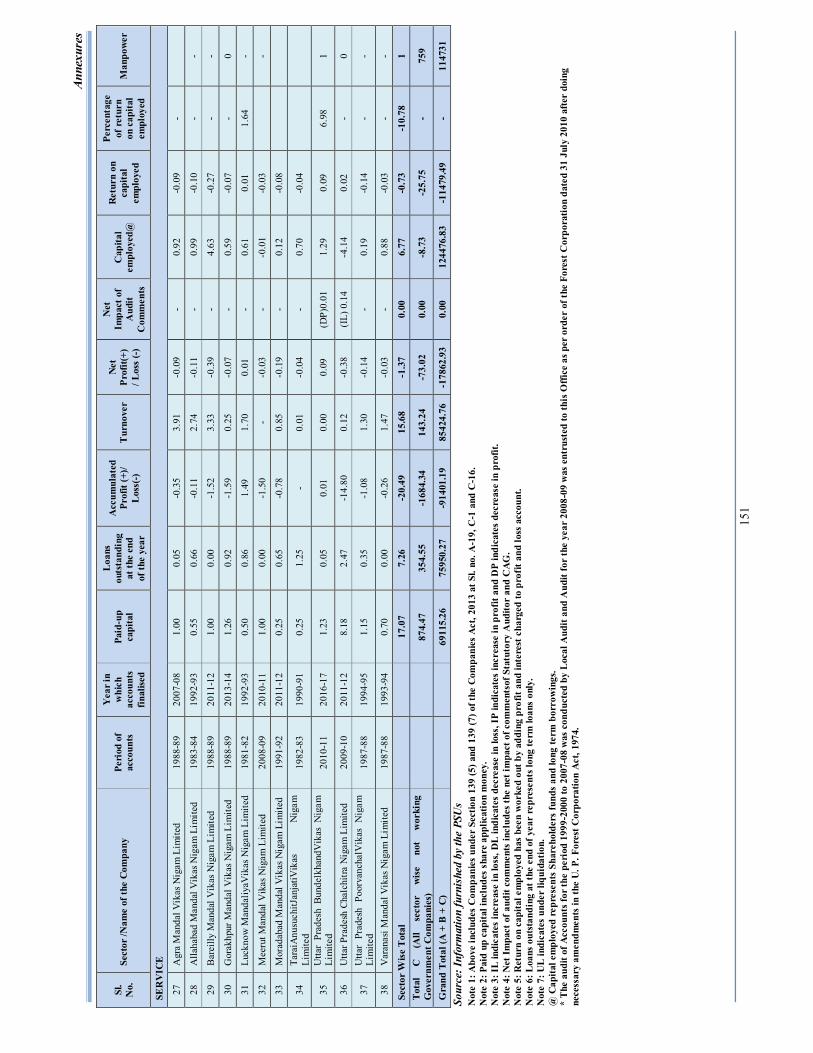
Anne
xure
s
151
Sl.
No.
Se
ctor
/Nam
e of
the
Com
pany
Pe
riod
of
acco
unts
Yea
r in
whi
ch
acco
unts
fin
alise
d
Paid
-up
capi
tal
Loa
ns
outs
tand
ing
at th
e en
d of
the
year
Acc
umul
ated
Pr
ofit
(+)/
Los
s(-)
T
urno
ver
Net
Pr
ofit(
+)
/ Los
s (-)
Net
Im
pact
of
Aud
it C
omm
ents
Cap
ital
empl
oyed
@
Ret
urn
on
capi
tal
empl
oyed
Perc
enta
ge
of r
etur
n on
cap
ital
empl
oyed
Man
pow
er
SER
VIC
E
27
Agr
a M
anda
l Vik
as N
igam
Lim
ited
1988
-89
2007
-08
1.00
0.
05
-0.3
5 3.
91
-0.0
9 -
0.92
-0
.09
-
28
Alla
haba
d M
anda
l Vik
as N
igam
Lim
ited
1983
-84
1992
-93
0.55
0.
66
-0.1
1 2.
74
-0.1
1 -
0.99
-0
.10
- -
29
Bar
eilly
Man
dal V
ikas
Nig
am L
imite
d 19
88-8
9 20
11-1
2 1.
00
0.00
-1
.52
3.33
-0
.39
- 4.
63
-0.2
7 -
-
30
Gor
akhp
ur M
anda
l Vik
as N
igam
Lim
ited
1988
-89
2013
-14
1.26
0.
92
-1.5
9 0.
25
-0.0
7 -
0.59
-0
.07
- 0
31
Luck
now
Man
daliy
aVik
as N
igam
Lim
ited
1981
-82
1992
-93
0.50
0.
86
1.49
1.
70
0.01
-
0.61
0.
01
1.64
-
32
Mee
rut M
anda
l Vik
as N
igam
Lim
ited
2008
-09
2010
-11
1.00
0.
00
-1.5
0 -
-0.0
3 -
-0.0
1 -0
.03
-
33
Mor
adab
ad M
anda
l Vik
as N
igam
Lim
ited
1991
-92
2011
-12
0.25
0.
65
-0.7
8 0.
85
-0.1
9 -
0.12
-0
.08
34
Tara
iAnu
such
itJan
jatiV
ikas
N
igam
Li
mite
d 19
82-8
3 19
90-9
1 0.
25
1.25
-
0.01
-0
.04
- 0.
70
-0.0
4
35
Utta
r Pr
ades
h Bu
ndel
khan
dVik
as N
igam
Li
mite
d 20
10-1
1 20
16-1
7 1.
23
0.05
0.
01
0.00
0.
09
(DP)
0.01
1.
29
0.09
6.
98
1
36
Utta
r Pra
desh
Cha
lchi
tra N
igam
Lim
ited
2009
-10
2011
-12
8.18
2.
47
-14.
80
0.12
-0
.38
(IL)
0.1
4 -4
.14
0.02
-
0
37
Utta
r Pr
ades
h Po
orva
ncha
lVik
as N
igam
Li
mite
d 19
87-8
8 19
94-9
5 1.
15
0.35
-1
.08
1.30
-0
.14
- 0.
19
-0.1
4 -
-
38
Var
anas
i Man
dal V
ikas
Nig
am L
imite
d 19
87-8
8 19
93-9
4 0.
70
0.00
-0
.26
1.47
-0
.03
- 0.
88
-0.0
3 -
-
Sect
or W
ise
Tot
al
17.0
7 7.
26
-20.
49
15.6
8 -1
.37
0.00
6.
77
-0.7
3 -1
0.78
1
Tot
al
C
(All
sect
or
wis
e no
t w
orki
ng
Gov
ernm
ent C
ompa
nies
)
87
4.47
35
4.55
-1
684.
34
143.
24
-73.
02
0.00
-8
.73
-25.
75
- 75
9
Gra
nd T
otal
(A +
B +
C)
6911
5.26
75
950.
27
-914
01.1
9 85
424.
76
-178
62.9
3 0.
00
1244
76.8
3 -1
1479
.49
- 11
4731
So
urce
: Inf
orm
atio
n fu
rnis
hed
by th
e PS
Us
Not
e 1:
Abo
ve in
clud
es C
ompa
nies
und
er S
ectio
n 13
9 (5
) and
139
(7) o
f the
Com
pani
es A
ct, 2
013
at S
l. no
. A-1
9, C
-1 a
nd C
-16.
N
ote
2: P
aid
up c
apita
l inc
lude
s sha
re a
pplic
atio
n m
oney
. N
ote
3: I
L in
dica
tes
incr
ease
in lo
ss, D
L in
dica
tes
decr
ease
in lo
ss, I
P in
dica
tes
incr
ease
in p
rofit
and
DP
indi
cate
s de
crea
se in
pro
fit.
Not
e 4:
Net
Im
pact
of a
udit
com
men
ts in
clud
es th
e ne
t im
pact
of c
omm
ents
of S
tatu
tory
Aud
itor
and
CA
G.
Not
e 5:
Ret
urn
on c
apita
l em
ploy
ed h
as b
een
wor
ked
out b
y ad
ding
pro
fit a
nd in
tere
st c
harg
ed to
pro
fit a
nd lo
ss a
ccou
nt.
Not
e 6:
Loa
ns o
utst
andi
ng a
t the
end
of y
ear
repr
esen
ts lo
ng te
rm lo
ans
only
. N
ote
7: U
L in
dica
tes
unde
r liq
uida
tion.
@
Cap
ital e
mpl
oyed
rep
rese
nts
Shar
ehol
ders
fund
s an
d lo
ng te
rm b
orro
win
gs.
* T
he a
udit
of A
ccou
nts f
or th
e pe
riod
199
9-20
00 to
200
7-08
was
con
duct
ed b
y L
ocal
Aud
it an
d A
udit
for
the
year
200
8-09
was
ent
rust
ed to
this
Offi
ce a
s per
ord
er o
f the
For
est C
orpo
ratio
n da
ted
31 J
uly
2010
afte
r do
ing
nece
ssar
y am
endm
ents
in th
e U
. P. F
ores
t Cor
pora
tion
Act
, 197
4.
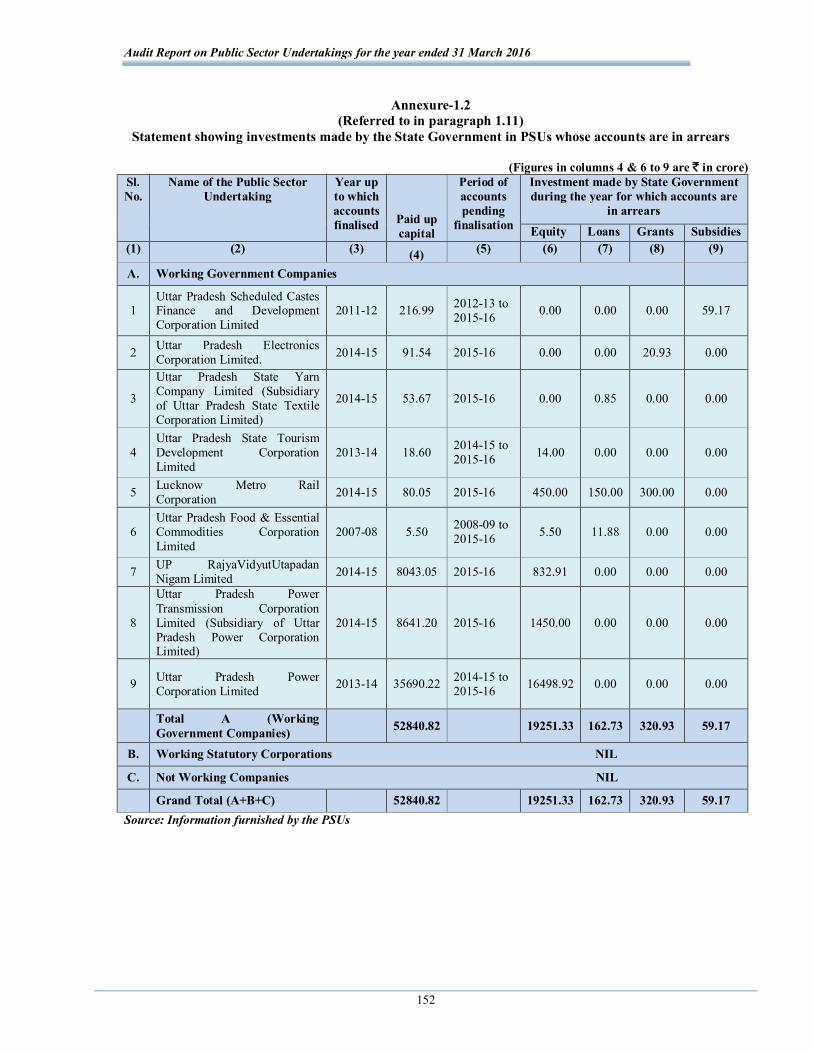
Audit Report on Public Sector Undertakings for the year ended 31 March 2016
152
Annexure-1.2
(Referred to in paragraph 1.11) Statement showing investments made by the State Government in PSUs whose accounts are in arrears
(Figures in columns 4 & 6 to 9 are ` in crore)
Sl. No.
Name of the Public Sector Undertaking
Year up to which accounts finalised Paid up
capital
Period of accounts pending
finalisation
Investment made by State Government during the year for which accounts are
in arrears Equity Loans Grants Subsidies
(1) (2) (3) (4) (5) (6) (7) (8) (9)
A. Working Government Companies
1 Uttar Pradesh Scheduled Castes Finance and Development Corporation Limited
2011-12 216.99 2012-13 to 2015-16 0.00 0.00 0.00 59.17
2 Uttar Pradesh Electronics Corporation Limited. 2014-15 91.54 2015-16 0.00 0.00 20.93 0.00
3
Uttar Pradesh State Yarn Company Limited (Subsidiary of Uttar Pradesh State Textile Corporation Limited)
2014-15 53.67 2015-16 0.00 0.85 0.00 0.00
4 Uttar Pradesh State Tourism Development Corporation Limited
2013-14 18.60 2014-15 to 2015-16 14.00 0.00 0.00 0.00
5 Lucknow Metro Rail Corporation 2014-15 80.05 2015-16 450.00 150.00 300.00 0.00
6 Uttar Pradesh Food & Essential Commodities Corporation Limited
2007-08 5.50 2008-09 to 2015-16 5.50 11.88 0.00 0.00
7 UP RajyaVidyutUtapadan Nigam Limited 2014-15 8043.05 2015-16 832.91 0.00 0.00 0.00
8
Uttar Pradesh Power Transmission Corporation Limited (Subsidiary of Uttar Pradesh Power Corporation Limited)
2014-15 8641.20 2015-16 1450.00 0.00 0.00 0.00
9 Uttar Pradesh Power Corporation Limited 2013-14 35690.22 2014-15 to
2015-16 16498.92 0.00 0.00 0.00
Total A (Working Government Companies) 52840.82 19251.33 162.73 320.93 59.17
B. Working Statutory Corporations NIL
C. Not Working Companies NIL
Grand Total (A+B+C) 52840.82 19251.33 162.73 320.93 59.17 Source: Information furnished by the PSUs
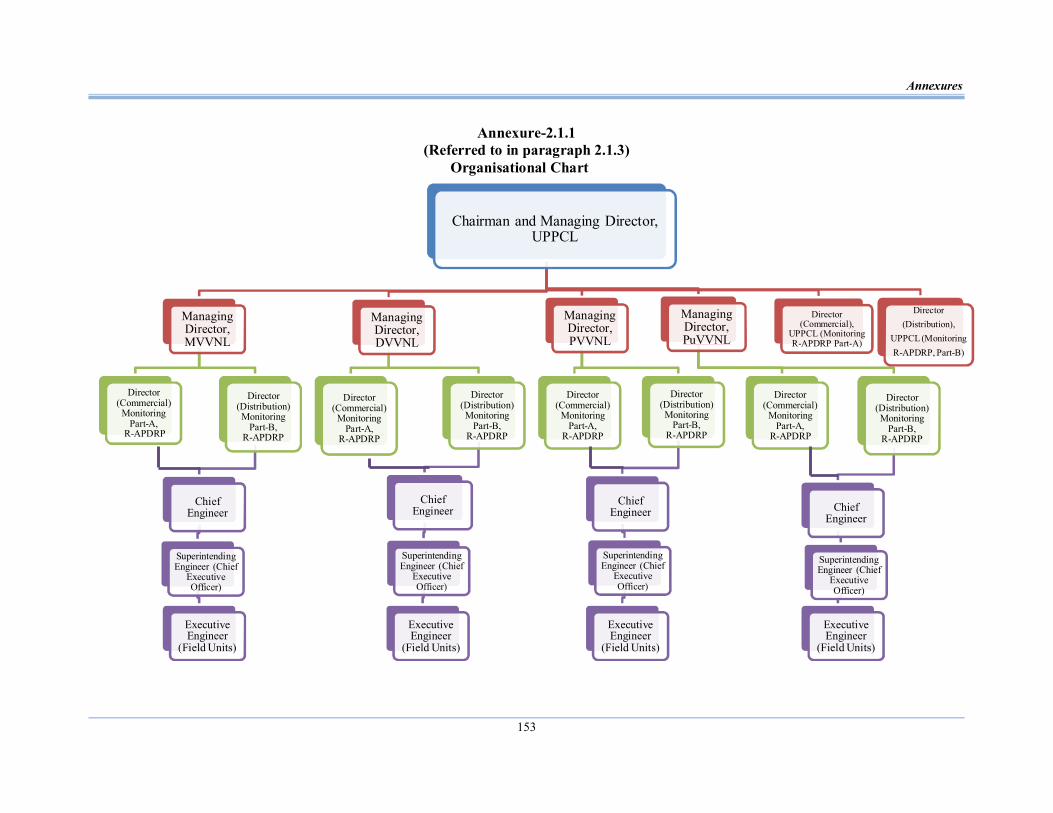
Annexures
153
Annexure-2.1.1 (Referred to in paragraph 2.1.3)
Organisational Chart
Chairman and Managing Director, UPPCL
Managing Director, MVVNL
Director (Commercial)
Monitoring Part-A,
R-APDRP
Director (Distribution) Monitoring
Part-B, R-APDRP
Chief Engineer
Superintending Engineer (Chief
Executive Officer)
Executive Engineer
(Field Units)
Managing Director, DVVNL
Director (Commercial)
Monitoring Part-A,
R-APDRP
Director (Distribution) Monitoring
Part-B, R-APDRP
Chief Engineer
Superintending Engineer (Chief
Executive Officer)
Executive Engineer
(Field Units)
Managing Director, PVVNL
Director (Commercial)
Monitoring Part-A,
R-APDRP
Director (Distribution) Monitoring
Part-B, R-APDRP
Chief Engineer
Superintending Engineer (Chief
Executive Officer)
Executive Engineer
(Field Units)
Managing Director, PuVVNL
Director (Commercial)
Monitoring Part-A,
R-APDRP
Director (Distribution) Monitoring
Part-B, R-APDRP
Chief Engineer
Superintending Engineer (Chief
Executive Officer)
Executive Engineer
(Field Units)
Director (Commercial),
UPPCL (Monitoring R-APDRP Part-A)
Director (Distribution),
UPPCL (Monitoring R-APDRP, Part-B)
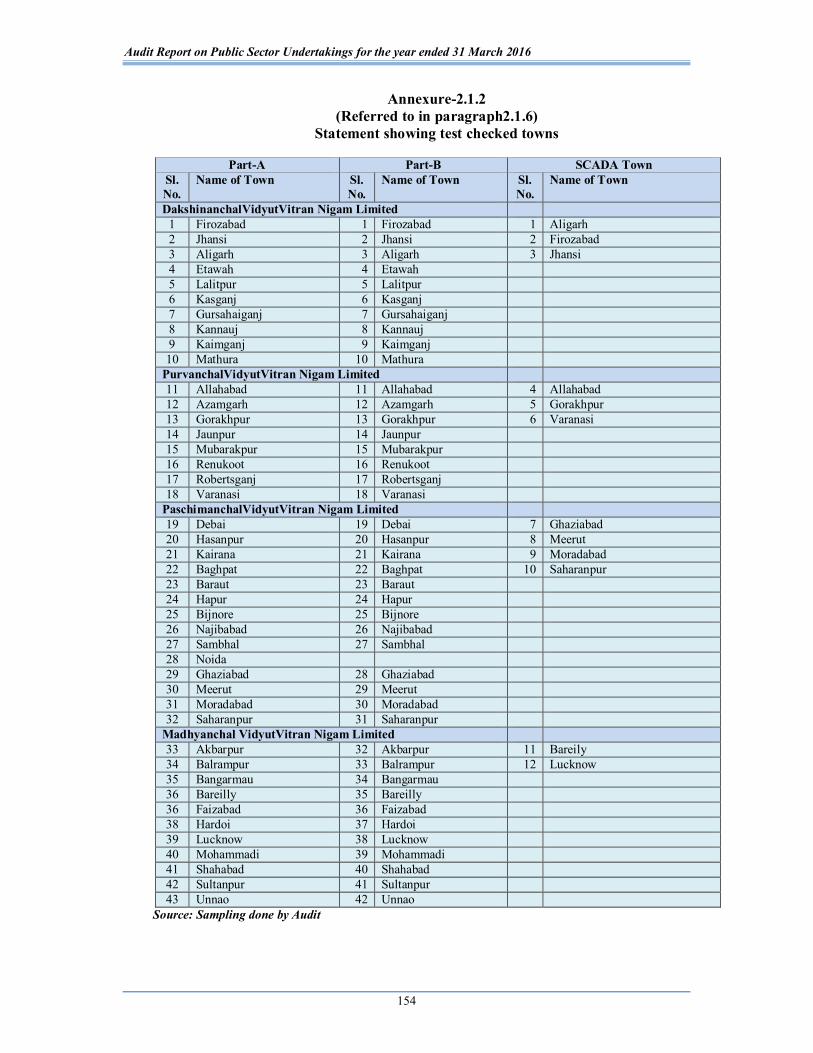
Audit Report on Public Sector Undertakings for the year ended 31 March 2016
154
Annexure-2.1.2 (Referred to in paragraph2.1.6)
Statement showing test checked towns
Part-A Part-B SCADA Town Sl. No.
Name of Town Sl. No.
Name of Town Sl. No.
Name of Town
DakshinanchalVidyutVitran Nigam Limited 1 Firozabad 1 Firozabad 1 Aligarh 2 Jhansi 2 Jhansi 2 Firozabad 3 Aligarh 3 Aligarh 3 Jhansi 4 Etawah 4 Etawah 5 Lalitpur 5 Lalitpur 6 Kasganj 6 Kasganj 7 Gursahaiganj 7 Gursahaiganj 8 Kannauj 8 Kannauj 9 Kaimganj 9 Kaimganj 10 Mathura 10 Mathura
PurvanchalVidyutVitran Nigam Limited 11 Allahabad 11 Allahabad 4 Allahabad 12 Azamgarh 12 Azamgarh 5 Gorakhpur 13 Gorakhpur 13 Gorakhpur 6 Varanasi 14 Jaunpur 14 Jaunpur 15 Mubarakpur 15 Mubarakpur 16 Renukoot 16 Renukoot 17 Robertsganj 17 Robertsganj 18 Varanasi 18 Varanasi
PaschimanchalVidyutVitran Nigam Limited 19 Debai 19 Debai 7 Ghaziabad 20 Hasanpur 20 Hasanpur 8 Meerut 21 Kairana 21 Kairana 9 Moradabad 22 Baghpat 22 Baghpat 10 Saharanpur 23 Baraut 23 Baraut 24 Hapur 24 Hapur 25 Bijnore 25 Bijnore 26 Najibabad 26 Najibabad 27 Sambhal 27 Sambhal 28 Noida 29 Ghaziabad 28 Ghaziabad 30 Meerut 29 Meerut 31 Moradabad 30 Moradabad 32 Saharanpur 31 Saharanpur
Madhyanchal VidyutVitran Nigam Limited 33 Akbarpur 32 Akbarpur 11 Bareily 34 Balrampur 33 Balrampur 12 Lucknow 35 Bangarmau 34 Bangarmau 36 Bareilly 35 Bareilly 36 Faizabad 36 Faizabad 38 Hardoi 37 Hardoi 39 Lucknow 38 Lucknow 40 Mohammadi 39 Mohammadi 41 Shahabad 40 Shahabad 42 Sultanpur 41 Sultanpur 43 Unnao 42 Unnao
Source: Sampling done by Audit
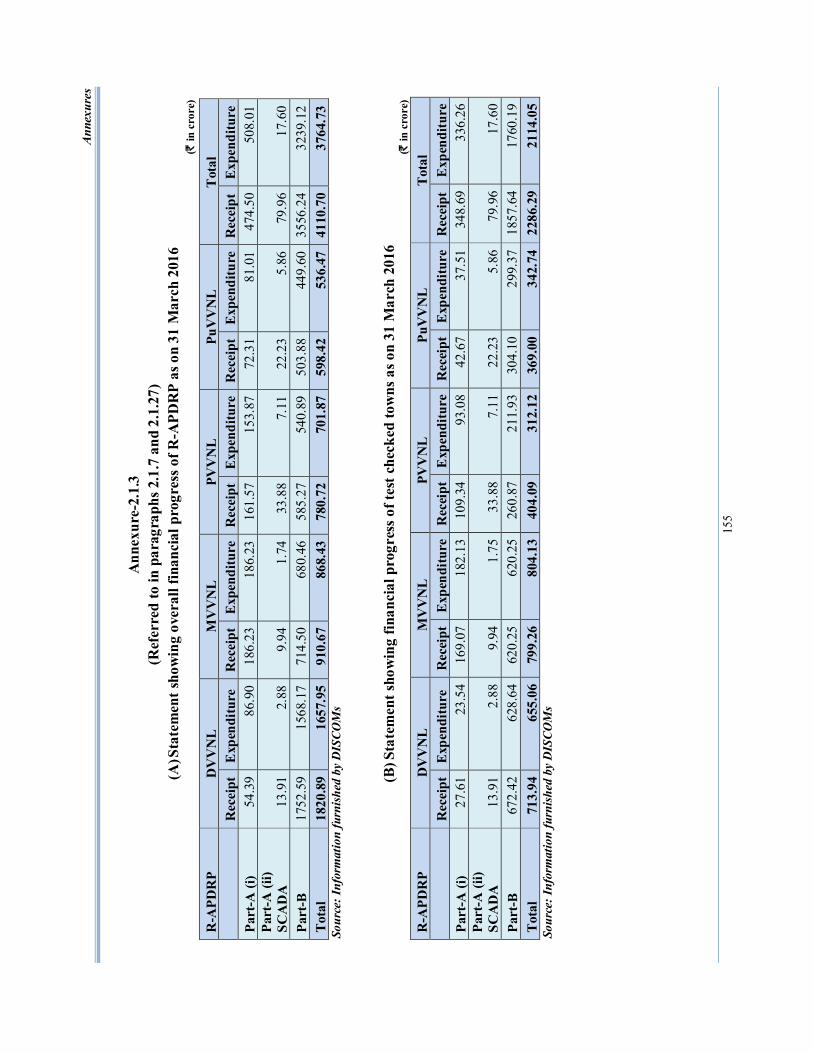
Anne
xure
s
155
Ann
exur
e-2.
1.3
(Ref
erre
d to
in p
arag
raph
s 2.1
.7 a
nd 2
.1.2
7)
(A) S
tate
men
t sho
win
g ov
eral
l fin
anci
al p
rogr
ess o
f R-A
PDR
P as
on
31 M
arch
201
6 (`
in c
rore
)
R-A
PDR
P D
VV
NL
M
VV
NL
PVV
NL
Pu
VV
NL
Tot
al
R
ecei
pt
Exp
endi
ture
R
ecei
pt
Exp
endi
ture
R
ecei
pt
Exp
endi
ture
R
ecei
pt
Exp
endi
ture
R
ecei
pt
Exp
endi
ture
Pa
rt-A
(i)
54.3
9 86
.90
186.
23
186.
23
161.
57
153.
87
72.3
1 81
.01
474.
50
508.
01
Part
-A (i
i) SC
AD
A
13.9
1 2.
88
9.94
1.
74
33.8
8 7.
11
22.2
3 5.
86
79.9
6 17
.60
Part
-B
1752
.59
1568
.17
714.
50
680.
46
585.
27
540.
89
503.
88
449.
60
3556
.24
3239
.12
Tot
al
1820
.89
1657
.95
910.
67
868.
43
780.
72
701.
87
598.
42
536.
47
4110
.70
3764
.73
Sour
ce: I
nfor
mat
ion
furn
ished
by
DIS
COM
s
(B
) Sta
tem
ent s
how
ing
finan
cial
pro
gres
s of t
est c
heck
ed to
wns
as o
n 31
Mar
ch 2
016
(` in
cro
re)
R-A
PDR
P D
VV
NL
M
VV
NL
PV
VN
L
PuV
VN
L T
otal
Rec
eipt
E
xpen
ditu
re
Rec
eipt
E
xpen
ditu
re
Rec
eipt
E
xpen
ditu
re
Rec
eipt
E
xpen
ditu
re
Rec
eipt
E
xpen
ditu
re
Part
-A (i
) 27
.61
23.5
4 16
9.07
18
2.13
10
9.34
93
.08
42.6
7 37
.51
348.
69
336.
26
Part
-A (i
i) SC
AD
A
13.9
1 2.
88
9.94
1.
75
33.8
8 7.
11
22.2
3 5.
86
79.9
6 17
.60
Part
-B
672.
42
628.
64
620.
25
620
.25
260.
87
211.
93
304.
10
299.
37
1857
.64
1760
.19
Tot
al
713.
94
655.
06
799.
26
804.
13
404.
09
312.
12
369.
00
342.
74
2286
.29
2114
.05
Sour
ce: I
nfor
mat
ion
furn
ished
by
DIS
COM
s
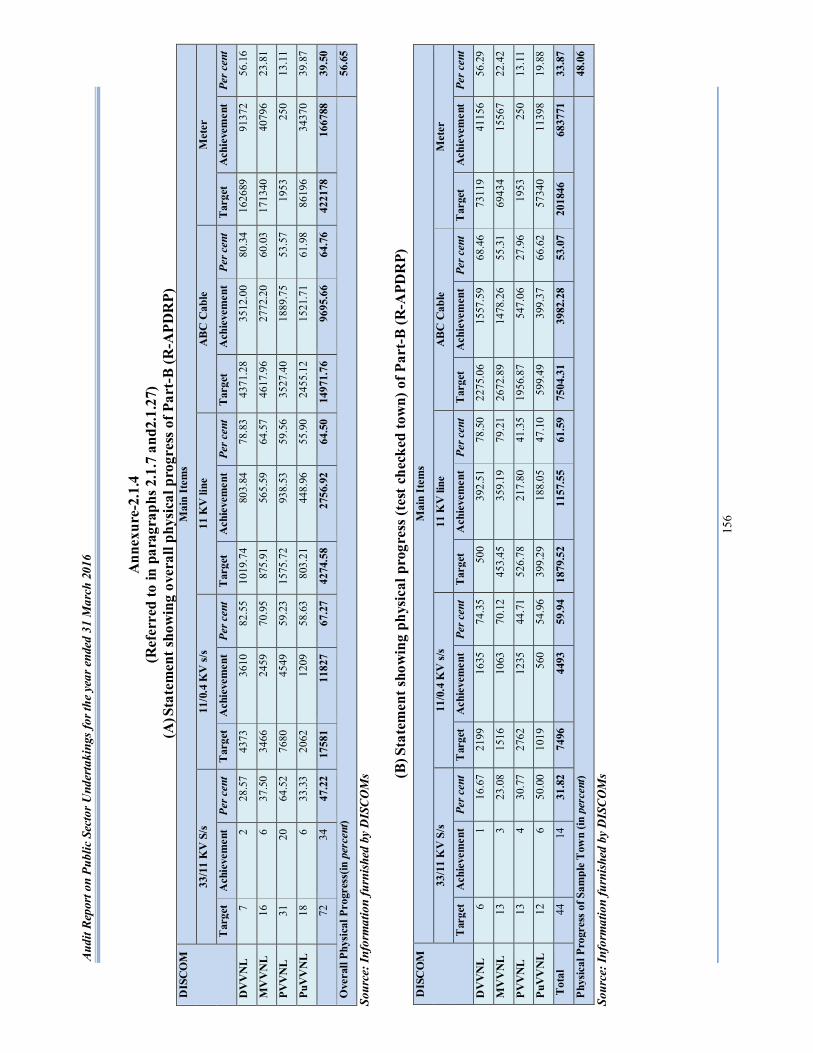
Audi
t Rep
ort o
n Pu
blic
Sec
tor U
nder
taki
ngs f
or th
e ye
ar e
nded
31
Mar
ch 2
016
156
Ann
exur
e-2.
1.4
(Ref
erre
d to
in p
arag
raph
s 2.1
.7 a
nd2.
1.27
) (A
) Sta
tem
ent s
how
ing
over
all p
hysic
al p
rogr
ess o
f Par
t-B
(R-A
PDR
P)
DIS
CO
M
Mai
n It
ems
33/1
1 K
V S
/s 11
/0.4
KV
s/s
11 K
V li
ne
AB
C C
able
M
eter
Tar
get
Ach
ieve
men
t Pe
r cen
t T
arge
t A
chie
vem
ent
Per c
ent
Tar
get
Ach
ieve
men
t Pe
r cen
t T
arge
t A
chie
vem
ent
Per c
ent
Tar
get
Ach
ieve
men
t Pe
r cen
t
DV
VN
L
7 2
28.5
7 43
73
3610
82
.55
1019
.74
803.
84
78.8
3 43
71.2
8 35
12.0
0 80
.34
1626
89
9137
2 56
.16
MV
VN
L 16
6
37.5
0 34
66
2459
70
.95
875.
91
565.
59
64.5
7 46
17.9
6 27
72.2
0 60
.03
1713
40
4079
6 23
.81
PVV
NL
31
20
64
.52
7680
45
49
59.2
3 15
75.7
2 93
8.53
59
.56
3527
.40
1889
.75
53.5
7 19
53
250
13.1
1
PuV
VN
L
18
6 33
.33
2062
12
09
58.6
3 80
3.21
44
8.96
55
.90
2455
.12
1521
.71
61.9
8 86
196
3437
0 39
.87
7
2 3
4 47
.22
1758
1 11
827
67.2
7 42
74.5
8 27
56.9
2 64
.50
1497
1.76
96
95.6
6 64
.76
4221
78
1667
88
39.5
0
Ove
rall
Phys
ical
Pro
gres
s(in
per
cent
) 56
.65
Sour
ce: I
nfor
mat
ion
furn
ished
by
DIS
CO
Ms
(B) S
tate
men
t sho
win
g ph
ysic
al p
rogr
ess (
test
che
cked
tow
n) o
f Par
t-B
(R-A
PDR
P)
DIS
CO
M
Mai
n It
ems
33/1
1 K
V S
/s 11
/0.4
KV
s/s
11 K
V li
ne
AB
C C
able
M
eter
Tar
get
Ach
ieve
men
t Pe
r cen
t T
arge
t A
chie
vem
ent
Per c
ent
Tar
get
Ach
ieve
men
t Pe
r cen
t T
arge
t A
chie
vem
ent
Per c
ent
Tar
get
Ach
ieve
men
t Pe
r cen
t
DV
VN
L 6
1 16
.67
2199
16
35
74.3
5 50
0 39
2.51
78
.50
2275
.06
1557
.59
68.4
6 73
119
4115
6 56
.29
MV
VN
L
13
3 23
.08
1516
10
63
70.1
2 45
3.45
35
9.19
79
.21
2672
.89
1478
.26
55.3
1 69
434
1556
7 22
.42
PVV
NL
13
4
30.7
7 27
62
1235
44
.71
526.
78
217.
80
41.3
5 19
56.8
7 54
7.06
27
.96
1953
25
0 13
.11
PuV
VN
L 12
6
50.0
0 10
19
560
54.9
6 39
9.29
18
8.05
47
.10
599.
49
399.
37
66.6
2 57
340
1139
8 19
.88
Tot
al
44
14
31.8
2 7
496
449
3 59
.94
1879
.52
1157
.55
61.5
9 75
04.3
1 39
82.2
8 53
.07
2018
46
6837
71
33.8
7
Phys
ical
Pro
gres
s of S
ampl
e T
own
(in p
erce
nt)
48.0
6
Sour
ce: I
nfor
mat
ion
furn
ished
by
DIS
CO
Ms
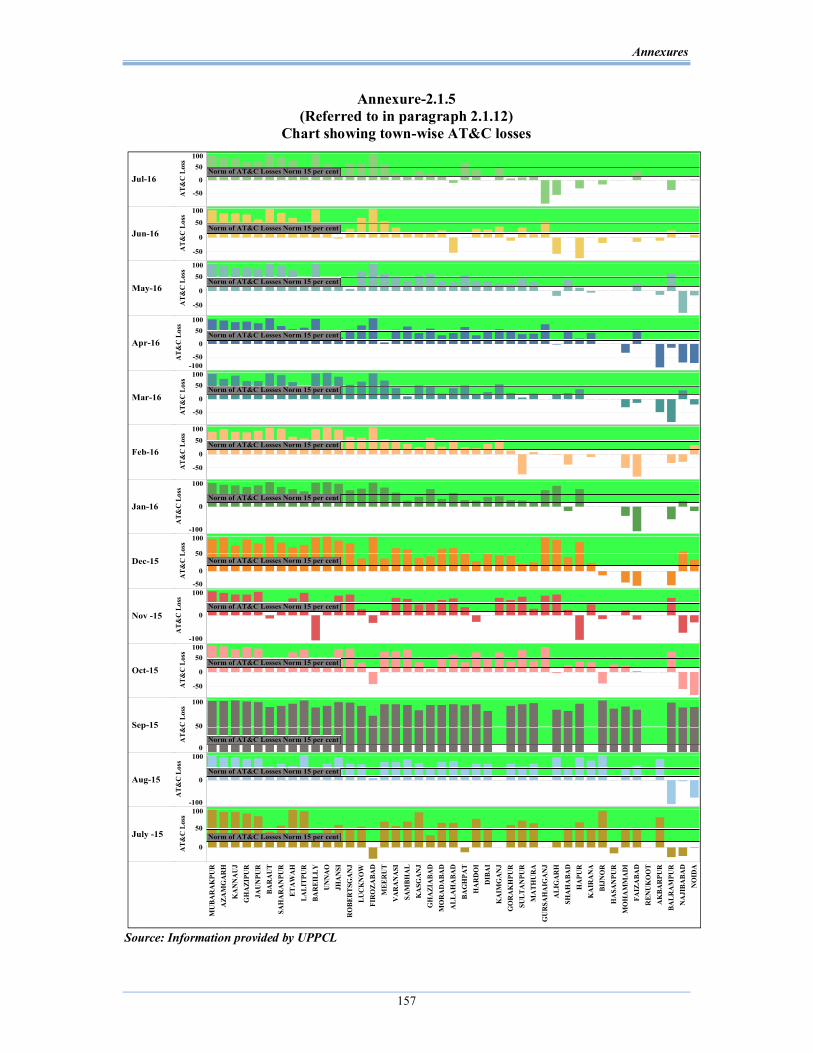
Annexures
157
Annexure-2.1.5 (Referred to in paragraph 2.1.12)
Chart showing town-wise AT&C losses
Source: Information provided by UPPCL
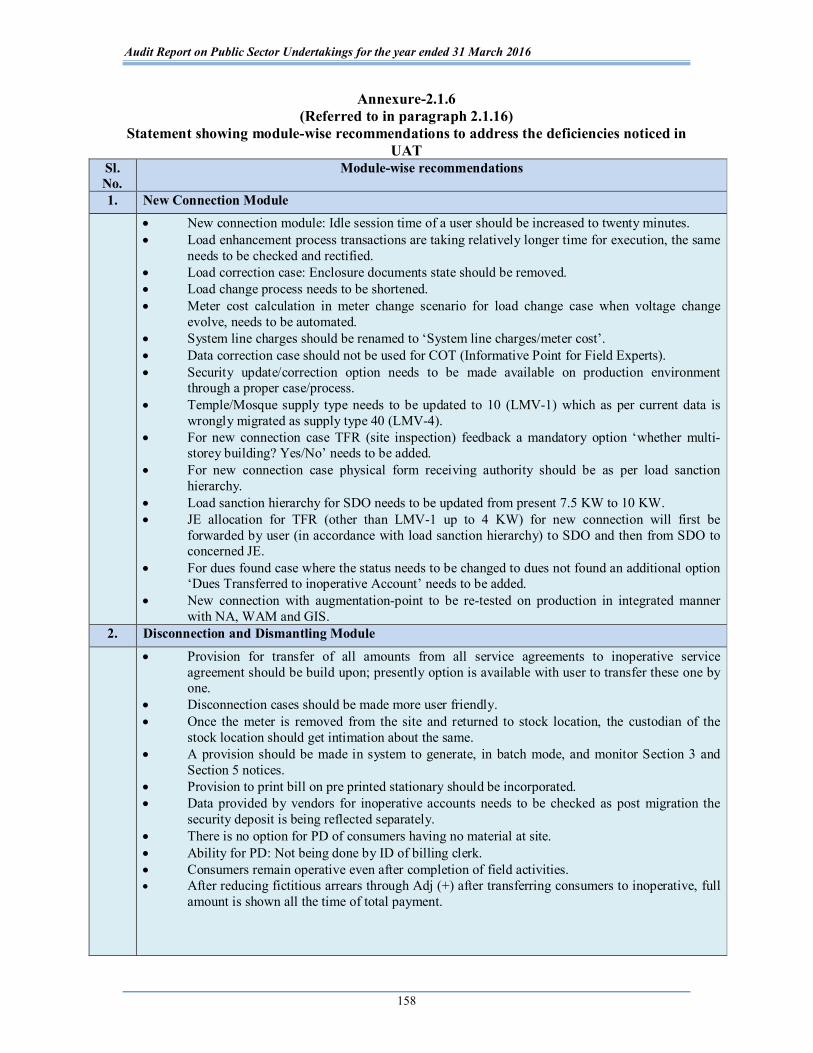
Audit Report on Public Sector Undertakings for the year ended 31 March 2016
158
Annexure-2.1.6 (Referred to in paragraph 2.1.16)
Statement showing module-wise recommendations to address the deficiencies noticed in UAT
Sl. No.
Module-wise recommendations
1. New Connection Module New connection module: Idle session time of a user should be increased to twenty minutes.
Load enhancement process transactions are taking relatively longer time for execution, the same needs to be checked and rectified.
Load correction case: Enclosure documents state should be removed. Load change process needs to be shortened. Meter cost calculation in meter change scenario for load change case when voltage change
evolve, needs to be automated. System line charges should be renamed to ‘System line charges/meter cost’. Data correction case should not be used for COT (Informative Point for Field Experts). Security update/correction option needs to be made available on production environment
through a proper case/process. Temple/Mosque supply type needs to be updated to 10 (LMV-1) which as per current data is
wrongly migrated as supply type 40 (LMV-4). For new connection case TFR (site inspection) feedback a mandatory option ‘whether multi-
storey building? Yes/No’ needs to be added. For new connection case physical form receiving authority should be as per load sanction
hierarchy. Load sanction hierarchy for SDO needs to be updated from present 7.5 KW to 10 KW. JE allocation for TFR (other than LMV-1 up to 4 KW) for new connection will first be
forwarded by user (in accordance with load sanction hierarchy) to SDO and then from SDO to concerned JE.
For dues found case where the status needs to be changed to dues not found an additional option ‘Dues Transferred to inoperative Account’ needs to be added.
New connection with augmentation-point to be re-tested on production in integrated manner with NA, WAM and GIS.
2. Disconnection and Dismantling Module Provision for transfer of all amounts from all service agreements to inoperative service
agreement should be build upon; presently option is available with user to transfer these one by one.
Disconnection cases should be made more user friendly. Once the meter is removed from the site and returned to stock location, the custodian of the
stock location should get intimation about the same. A provision should be made in system to generate, in batch mode, and monitor Section 3 and
Section 5 notices. Provision to print bill on pre printed stationary should be incorporated. Data provided by vendors for inoperative accounts needs to be checked as post migration the
security deposit is being reflected separately. There is no option for PD of consumers having no material at site. Ability for PD: Not being done by ID of billing clerk. Consumers remain operative even after completion of field activities. After reducing fictitious arrears through Adj (+) after transferring consumers to inoperative, full
amount is shown all the time of total payment.
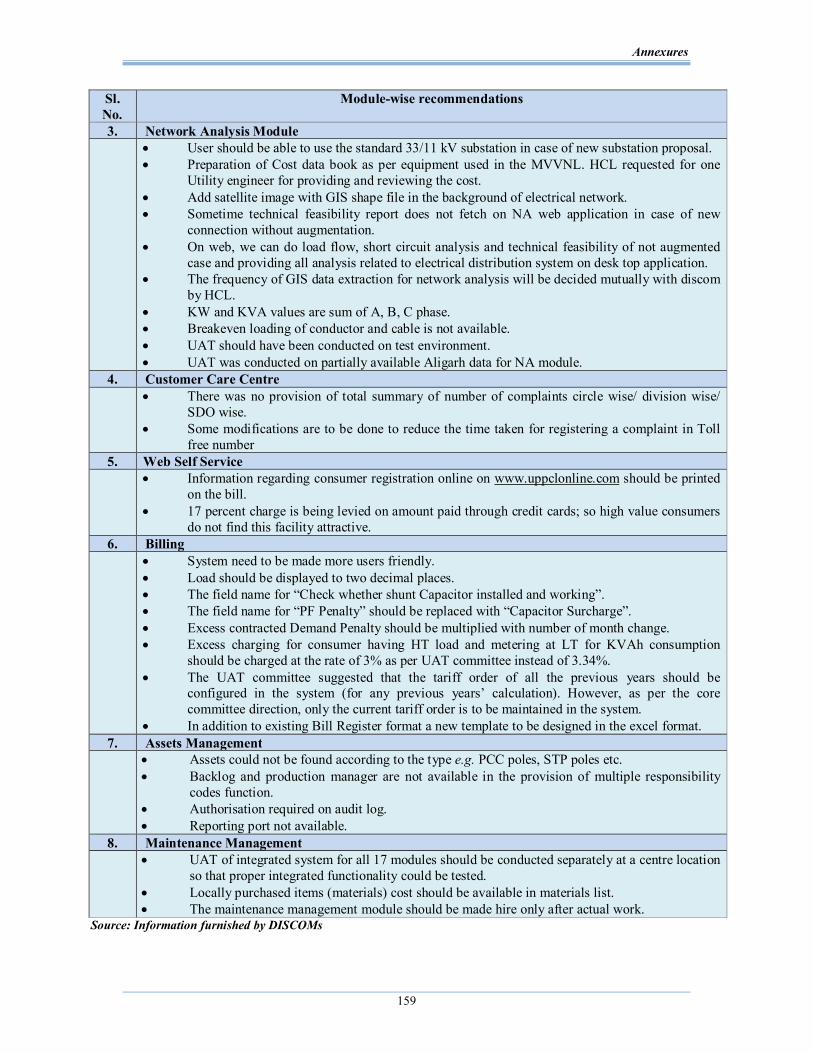
Annexures
159
Sl. No.
Module-wise recommendations
3. Network Analysis Module User should be able to use the standard 33/11 kV substation in case of new substation proposal.
Preparation of Cost data book as per equipment used in the MVVNL. HCL requested for one Utility engineer for providing and reviewing the cost.
Add satellite image with GIS shape file in the background of electrical network. Sometime technical feasibility report does not fetch on NA web application in case of new
connection without augmentation. On web, we can do load flow, short circuit analysis and technical feasibility of not augmented
case and providing all analysis related to electrical distribution system on desk top application. The frequency of GIS data extraction for network analysis will be decided mutually with discom
by HCL. KW and KVA values are sum of A, B, C phase. Breakeven loading of conductor and cable is not available. UAT should have been conducted on test environment. UAT was conducted on partially available Aligarh data for NA module.
4. Customer Care Centre There was no provision of total summary of number of complaints circle wise/ division wise/
SDO wise. Some modifications are to be done to reduce the time taken for registering a complaint in Toll
free number 5. Web Self Service Information regarding consumer registration online on www.uppclonline.com should be printed
on the bill. 17 percent charge is being levied on amount paid through credit cards; so high value consumers
do not find this facility attractive. 6. Billing System need to be made more users friendly.
Load should be displayed to two decimal places. The field name for “Check whether shunt Capacitor installed and working”. The field name for “PF Penalty” should be replaced with “Capacitor Surcharge”. Excess contracted Demand Penalty should be multiplied with number of month change. Excess charging for consumer having HT load and metering at LT for KVAh consumption
should be charged at the rate of 3% as per UAT committee instead of 3.34%. The UAT committee suggested that the tariff order of all the previous years should be
configured in the system (for any previous years’ calculation). However, as per the core committee direction, only the current tariff order is to be maintained in the system.
In addition to existing Bill Register format a new template to be designed in the excel format. 7. Assets Management Assets could not be found according to the type e.g. PCC poles, STP poles etc.
Backlog and production manager are not available in the provision of multiple responsibility codes function.
Authorisation required on audit log. Reporting port not available.
8. Maintenance Management UAT of integrated system for all 17 modules should be conducted separately at a centre location
so that proper integrated functionality could be tested. Locally purchased items (materials) cost should be available in materials list. The maintenance management module should be made hire only after actual work.
Source: Information furnished by DISCOMs
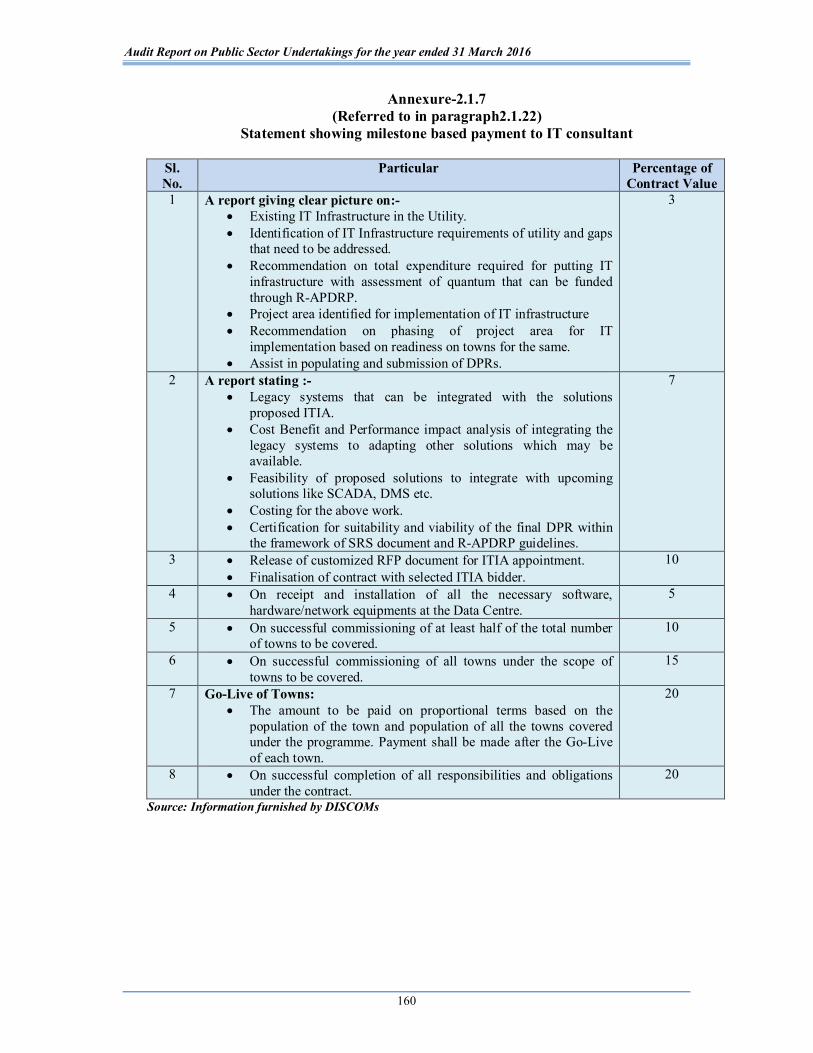
Audit Report on Public Sector Undertakings for the year ended 31 March 2016
160
Annexure-2.1.7 (Referred to in paragraph2.1.22)
Statement showing milestone based payment to IT consultant
Sl. No.
Particular Percentage of Contract Value
1 A report giving clear picture on:- Existing IT Infrastructure in the Utility. Identification of IT Infrastructure requirements of utility and gaps
that need to be addressed. Recommendation on total expenditure required for putting IT
infrastructure with assessment of quantum that can be funded through R-APDRP.
Project area identified for implementation of IT infrastructure Recommendation on phasing of project area for IT
implementation based on readiness on towns for the same. Assist in populating and submission of DPRs.
3
2 A report stating :- Legacy systems that can be integrated with the solutions
proposed ITIA. Cost Benefit and Performance impact analysis of integrating the
legacy systems to adapting other solutions which may be available.
Feasibility of proposed solutions to integrate with upcoming solutions like SCADA, DMS etc.
Costing for the above work. Certification for suitability and viability of the final DPR within
the framework of SRS document and R-APDRP guidelines.
7
3 Release of customized RFP document for ITIA appointment. Finalisation of contract with selected ITIA bidder.
10
4 On receipt and installation of all the necessary software, hardware/network equipments at the Data Centre.
5
5 On successful commissioning of at least half of the total number of towns to be covered.
10
6 On successful commissioning of all towns under the scope of towns to be covered.
15
7 Go-Live of Towns: The amount to be paid on proportional terms based on the
population of the town and population of all the towns covered under the programme. Payment shall be made after the Go-Live of each town.
20
8 On successful completion of all responsibilities and obligations under the contract.
20
Source: Information furnished by DISCOMs
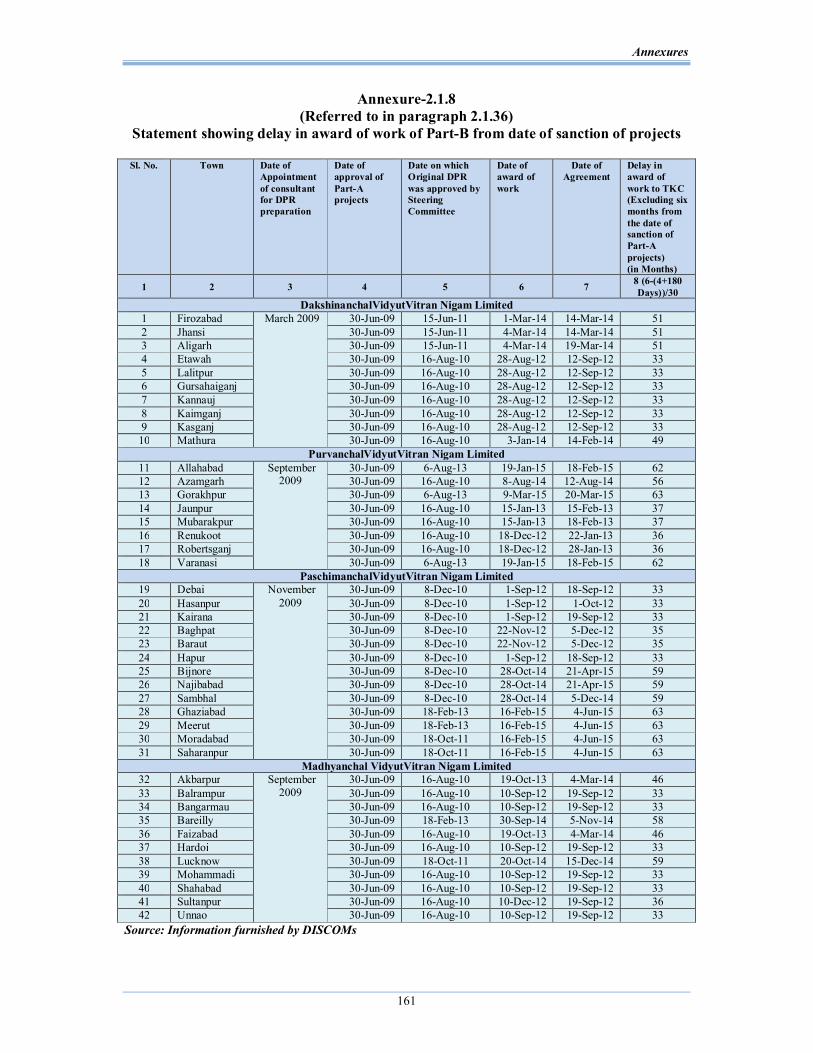
Annexures
161
Annexure-2.1.8 (Referred to in paragraph 2.1.36)
Statement showing delay in award of work of Part-B from date of sanction of projects
Sl. No. Town Date of Appointment of consultant for DPR preparation
Date of approval of Part-A projects
Date on which Original DPR was approved by Steering Committee
Date of award of work
Date of Agreement
Delay in award of work to TKC (Excluding six months from the date of sanction of Part-A projects) (in Months)
1 2 3 4 5 6 7 8 (6-(4+180 Days))/30
DakshinanchalVidyutVitran Nigam Limited 1 Firozabad March 2009 30-Jun-09 15-Jun-11 1-Mar-14 14-Mar-14 51 2 Jhansi 30-Jun-09 15-Jun-11 4-Mar-14 14-Mar-14 51 3 Aligarh 30-Jun-09 15-Jun-11 4-Mar-14 19-Mar-14 51 4 Etawah 30-Jun-09 16-Aug-10 28-Aug-12 12-Sep-12 33 5 Lalitpur 30-Jun-09 16-Aug-10 28-Aug-12 12-Sep-12 33 6 Gursahaiganj 30-Jun-09 16-Aug-10 28-Aug-12 12-Sep-12 33 7 Kannauj 30-Jun-09 16-Aug-10 28-Aug-12 12-Sep-12 33 8 Kaimganj 30-Jun-09 16-Aug-10 28-Aug-12 12-Sep-12 33 9 Kasganj 30-Jun-09 16-Aug-10 28-Aug-12 12-Sep-12 33
10 Mathura 30-Jun-09 16-Aug-10 3-Jan-14 14-Feb-14 49 PurvanchalVidyutVitran Nigam Limited
11 Allahabad September 2009
30-Jun-09 6-Aug-13 19-Jan-15 18-Feb-15 62 12 Azamgarh 30-Jun-09 16-Aug-10 8-Aug-14 12-Aug-14 56 13 Gorakhpur 30-Jun-09 6-Aug-13 9-Mar-15 20-Mar-15 63 14 Jaunpur 30-Jun-09 16-Aug-10 15-Jan-13 15-Feb-13 37 15 Mubarakpur 30-Jun-09 16-Aug-10 15-Jan-13 18-Feb-13 37 16 Renukoot 30-Jun-09 16-Aug-10 18-Dec-12 22-Jan-13 36 17 Robertsganj 30-Jun-09 16-Aug-10 18-Dec-12 28-Jan-13 36 18 Varanasi 30-Jun-09 6-Aug-13 19-Jan-15 18-Feb-15 62
PaschimanchalVidyutVitran Nigam Limited 19 Debai November
2009 30-Jun-09 8-Dec-10 1-Sep-12 18-Sep-12 33
20 Hasanpur 30-Jun-09 8-Dec-10 1-Sep-12 1-Oct-12 33 21 Kairana 30-Jun-09 8-Dec-10 1-Sep-12 19-Sep-12 33 22 Baghpat 30-Jun-09 8-Dec-10 22-Nov-12 5-Dec-12 35 23 Baraut 30-Jun-09 8-Dec-10 22-Nov-12 5-Dec-12 35 24 Hapur 30-Jun-09 8-Dec-10 1-Sep-12 18-Sep-12 33 25 Bijnore 30-Jun-09 8-Dec-10 28-Oct-14 21-Apr-15 59 26 Najibabad 30-Jun-09 8-Dec-10 28-Oct-14 21-Apr-15 59 27 Sambhal 30-Jun-09 8-Dec-10 28-Oct-14 5-Dec-14 59 28 Ghaziabad 30-Jun-09 18-Feb-13 16-Feb-15 4-Jun-15 63 29 Meerut 30-Jun-09 18-Feb-13 16-Feb-15 4-Jun-15 63 30 Moradabad 30-Jun-09 18-Oct-11 16-Feb-15 4-Jun-15 63 31 Saharanpur 30-Jun-09 18-Oct-11 16-Feb-15 4-Jun-15 63
Madhyanchal VidyutVitran Nigam Limited 32 Akbarpur September
2009 30-Jun-09 16-Aug-10 19-Oct-13 4-Mar-14 46
33 Balrampur 30-Jun-09 16-Aug-10 10-Sep-12 19-Sep-12 33 34 Bangarmau 30-Jun-09 16-Aug-10 10-Sep-12 19-Sep-12 33 35 Bareilly 30-Jun-09 18-Feb-13 30-Sep-14 5-Nov-14 58 36 Faizabad 30-Jun-09 16-Aug-10 19-Oct-13 4-Mar-14 46 37 Hardoi 30-Jun-09 16-Aug-10 10-Sep-12 19-Sep-12 33 38 Lucknow 30-Jun-09 18-Oct-11 20-Oct-14 15-Dec-14 59 39 Mohammadi 30-Jun-09 16-Aug-10 10-Sep-12 19-Sep-12 33 40 Shahabad 30-Jun-09 16-Aug-10 10-Sep-12 19-Sep-12 33 41 Sultanpur 30-Jun-09 16-Aug-10 10-Dec-12 19-Sep-12 36 42 Unnao 30-Jun-09 16-Aug-10 10-Sep-12 19-Sep-12 33
Source: Information furnished by DISCOMs
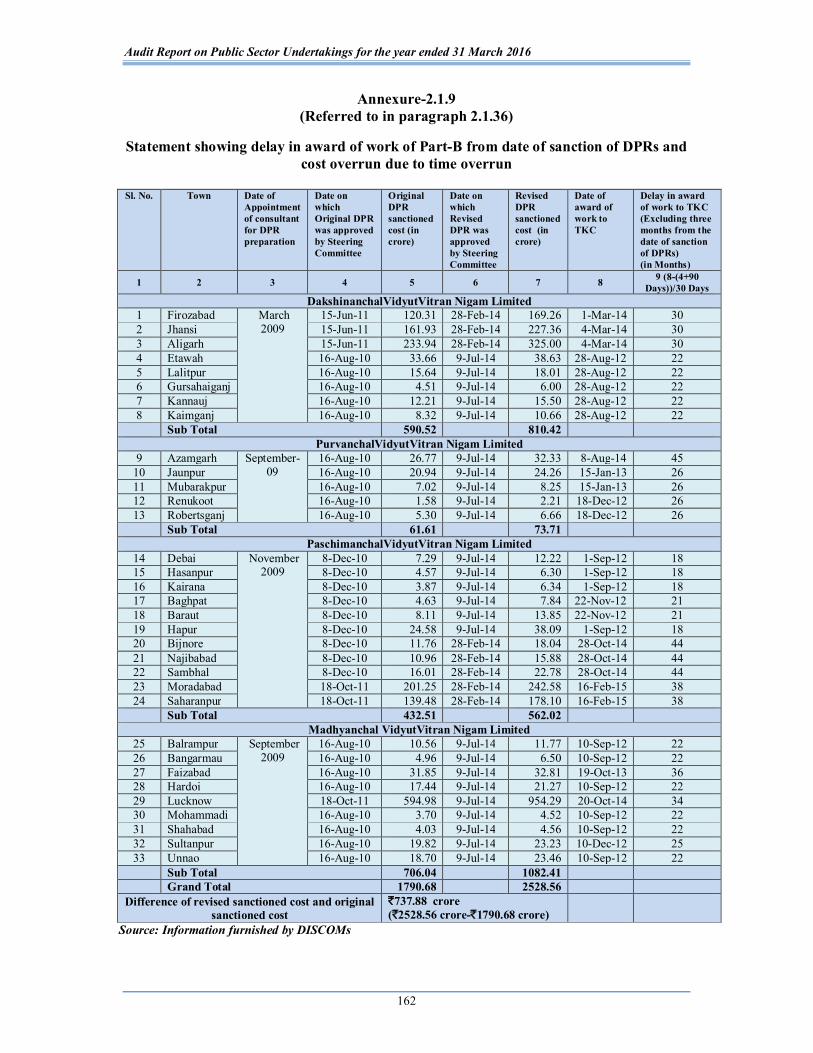
Audit Report on Public Sector Undertakings for the year ended 31 March 2016
162
Annexure-2.1.9 (Referred to in paragraph 2.1.36)
Statement showing delay in award of work of Part-B from date of sanction of DPRs and
cost overrun due to time overrun
Sl. No. Town Date of Appointment of consultant for DPR preparation
Date on which Original DPR was approved by Steering Committee
Original DPR sanctioned cost (in crore)
Date on which Revised DPR was approved by Steering Committee
Revised DPR sanctioned cost (in crore)
Date of award of work to TKC
Delay in award of work to TKC (Excluding three months from the date of sanction of DPRs) (in Months)
1 2 3 4 5 6 7 8 9 (8-(4+90 Days))/30 Days
DakshinanchalVidyutVitran Nigam Limited 1 Firozabad March
2009 15-Jun-11 120.31 28-Feb-14 169.26 1-Mar-14 30
2 Jhansi 15-Jun-11 161.93 28-Feb-14 227.36 4-Mar-14 30 3 Aligarh 15-Jun-11 233.94 28-Feb-14 325.00 4-Mar-14 30 4 Etawah 16-Aug-10 33.66 9-Jul-14 38.63 28-Aug-12 22 5 Lalitpur 16-Aug-10 15.64 9-Jul-14 18.01 28-Aug-12 22 6 Gursahaiganj 16-Aug-10 4.51 9-Jul-14 6.00 28-Aug-12 22 7 Kannauj 16-Aug-10 12.21 9-Jul-14 15.50 28-Aug-12 22 8 Kaimganj 16-Aug-10 8.32 9-Jul-14 10.66 28-Aug-12 22
Sub Total 590.52 810.42 PurvanchalVidyutVitran Nigam Limited
9 Azamgarh September-09
16-Aug-10 26.77 9-Jul-14 32.33 8-Aug-14 45 10 Jaunpur 16-Aug-10 20.94 9-Jul-14 24.26 15-Jan-13 26 11 Mubarakpur 16-Aug-10 7.02 9-Jul-14 8.25 15-Jan-13 26 12 Renukoot 16-Aug-10 1.58 9-Jul-14 2.21 18-Dec-12 26 13 Robertsganj 16-Aug-10 5.30 9-Jul-14 6.66 18-Dec-12 26
Sub Total 61.61 73.71 PaschimanchalVidyutVitran Nigam Limited
14 Debai November 2009
8-Dec-10 7.29 9-Jul-14 12.22 1-Sep-12 18 15 Hasanpur 8-Dec-10 4.57 9-Jul-14 6.30 1-Sep-12 18 16 Kairana 8-Dec-10 3.87 9-Jul-14 6.34 1-Sep-12 18 17 Baghpat 8-Dec-10 4.63 9-Jul-14 7.84 22-Nov-12 21 18 Baraut 8-Dec-10 8.11 9-Jul-14 13.85 22-Nov-12 21 19 Hapur 8-Dec-10 24.58 9-Jul-14 38.09 1-Sep-12 18 20 Bijnore 8-Dec-10 11.76 28-Feb-14 18.04 28-Oct-14 44 21 Najibabad 8-Dec-10 10.96 28-Feb-14 15.88 28-Oct-14 44 22 Sambhal 8-Dec-10 16.01 28-Feb-14 22.78 28-Oct-14 44 23 Moradabad 18-Oct-11 201.25 28-Feb-14 242.58 16-Feb-15 38 24 Saharanpur 18-Oct-11 139.48 28-Feb-14 178.10 16-Feb-15 38
Sub Total 432.51 562.02 Madhyanchal VidyutVitran Nigam Limited
25 Balrampur September 2009
16-Aug-10 10.56 9-Jul-14 11.77 10-Sep-12 22 26 Bangarmau 16-Aug-10 4.96 9-Jul-14 6.50 10-Sep-12 22 27 Faizabad 16-Aug-10 31.85 9-Jul-14 32.81 19-Oct-13 36 28 Hardoi 16-Aug-10 17.44 9-Jul-14 21.27 10-Sep-12 22 29 Lucknow 18-Oct-11 594.98 9-Jul-14 954.29 20-Oct-14 34 30 Mohammadi 16-Aug-10 3.70 9-Jul-14 4.52 10-Sep-12 22 31 Shahabad 16-Aug-10 4.03 9-Jul-14 4.56 10-Sep-12 22 32 Sultanpur 16-Aug-10 19.82 9-Jul-14 23.23 10-Dec-12 25 33 Unnao 16-Aug-10 18.70 9-Jul-14 23.46 10-Sep-12 22
Sub Total 706.04 1082.41 Grand Total 1790.68 2528.56 Difference of revised sanctioned cost and original
sanctioned cost `737.88 crore (`2528.56 crore-`1790.68 crore)
Source: Information furnished by DISCOMs

Anne
xure
s
163
Ann
exur
e-2.
2.1
(Ref
erre
d to
in p
arag
raph
2.2
.2)
O
rgan
isatio
nal C
hart
of E
lect
rica
l Win
g of
UPR
NN
Chi
ef A
rchi
tect
Boa
rd o
f Dir
ecto
rs
Cha
irm
an
Ass
ista
nt C
ontr
olle
r of
A
ccou
nts
Proj
ect M
anag
ers
(Ele
ctri
cal)
(26
units
)
Fina
ncia
l Adv
isor
A
dditi
onal
Gen
eral
M
anag
er (C
ontr
act)
A
dditi
onal
Gen
eral
M
anag
er (T
echn
ical
) A
dditi
onal
Gen
eral
M
anag
ers (
Ele
ctri
cal)
(4
Zon
es)
Man
agin
g D
irec
tor
Add
ition
al G
ener
al
Man
ager
(C
omm
erci
al)
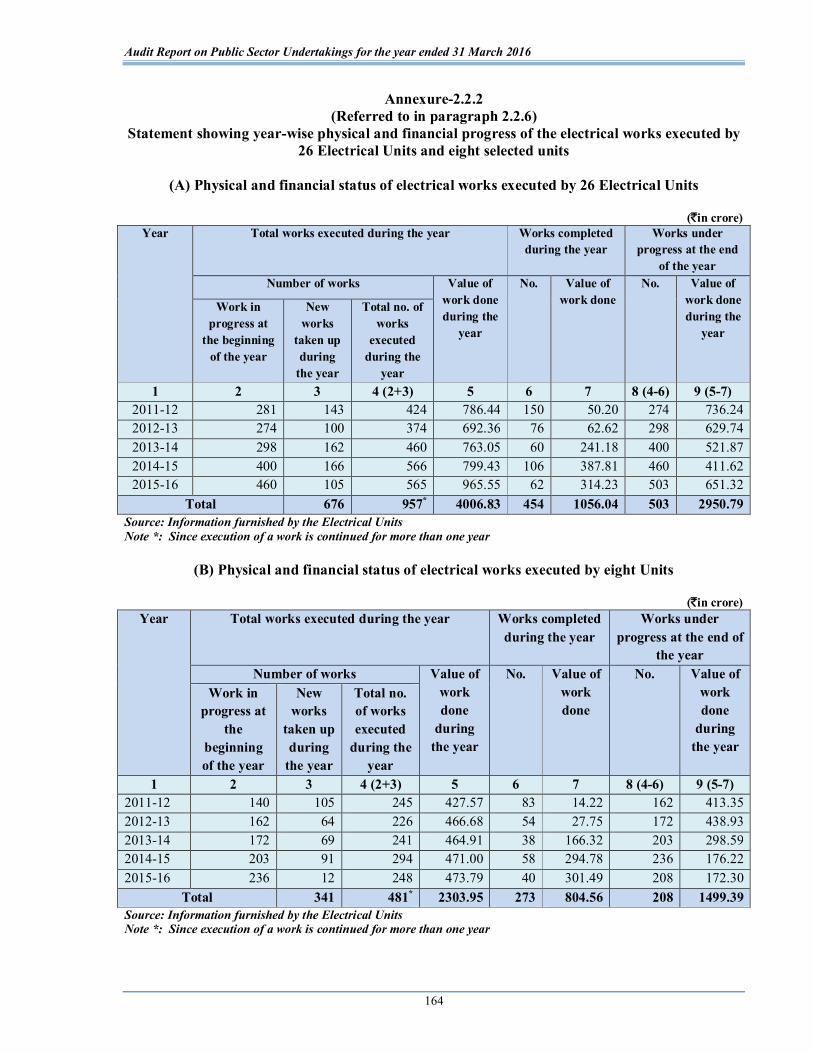
Audit Report on Public Sector Undertakings for the year ended 31 March 2016
164
Annexure-2.2.2 (Referred to in paragraph 2.2.6)
Statement showing year-wise physical and financial progress of the electrical works executed by 26 Electrical Units and eight selected units
(A) Physical and financial status of electrical works executed by 26 Electrical Units
(`in crore)
Year Total works executed during the year Works completed during the year
Works under progress at the end
of the year Number of works Value of
work done during the
year
No. Value of work done
No. Value of work done during the
year
Work in progress at
the beginning of the year
New works
taken up during
the year
Total no. of works
executed during the
year 1 2 3 4 (2+3) 5 6 7 8 (4-6) 9 (5-7)
2011-12 281 143 424 786.44 150 50.20 274 736.24 2012-13 274 100 374 692.36 76 62.62 298 629.74 2013-14 298 162 460 763.05 60 241.18 400 521.87 2014-15 400 166 566 799.43 106 387.81 460 411.62 2015-16 460 105 565 965.55 62 314.23 503 651.32
Total 676 957* 4006.83 454 1056.04 503 2950.79 Source: Information furnished by the Electrical Units Note *: Since execution of a work is continued for more than one year
(B) Physical and financial status of electrical works executed by eight Units
(`in crore)
Year Total works executed during the year Works completed during the year
Works under progress at the end of
the year Number of works Value of
work done
during the year
No. Value of work done
No. Value of work done
during the year
Work in progress at
the beginning of the year
New works
taken up during
the year
Total no. of works executed
during the year
1 2 3 4 (2+3) 5 6 7 8 (4-6) 9 (5-7) 2011-12 140 105 245 427.57 83 14.22 162 413.35 2012-13 162 64 226 466.68 54 27.75 172 438.93 2013-14 172 69 241 464.91 38 166.32 203 298.59 2014-15 203 91 294 471.00 58 294.78 236 176.22 2015-16 236 12 248 473.79 40 301.49 208 172.30
Total 341 481* 2303.95 273 804.56 208 1499.39 Source: Information furnished by the Electrical Units Note *: Since execution of a work is continued for more than one year

Annexures
165
Annexure-2.2.3 (Referred to in paragraph 2.2.9)
Statement showing year-wise financial target and achievement of 26 Electrical Units and eight selected units
(A) Year-wise financial target and achievement of 26 electrical Units
(`in crore) Year Target Achievement Shortfall
Percentage of
shortfall
Overall for Civil and Electrical
works
Only for Electrical
works
1 2 3 4 5 (3-4) 6(5/3*100) 2011-12 4000 655 786.44 - - 2012-13 4000 8201 692.36 127.64 15.57 2013-14 4000 740 763.05 - - 2014-15 41502 8853 799.43 85.57 9.67 2015-16 4200 920 965.55 - -
Total 20350 4020 4006.83 213.21 - Source: Board minutes, agenda and information furnished by Units
(B) Year-wise financial target and achievement of eight selected electrical Units (`in crore)
Year Target Achievement Shortfall
Percentage of shortfall
1 2 3 4 (2-3) 5 (4/ 2*100)
2011-12 299.50 427.57 -128.07 -42.76 2012-13 407.00 466.68 -59.68 -14.66 2013-14 310.00 464.91 -154.91 -49.97 2014-15 347.00 471.00 -124.00 -35.73 2015-16 356.00 473.79 -117.79 -33.09
Total 1719.50 2303.95 -584.45 -33.99 Source: Information furnished by Units
1 25.19 per cent (820-655)*100/655. 2 3.75 per cent (4150-4000)*100/4000. 3 19.59 per cent (885-740)*100/740.
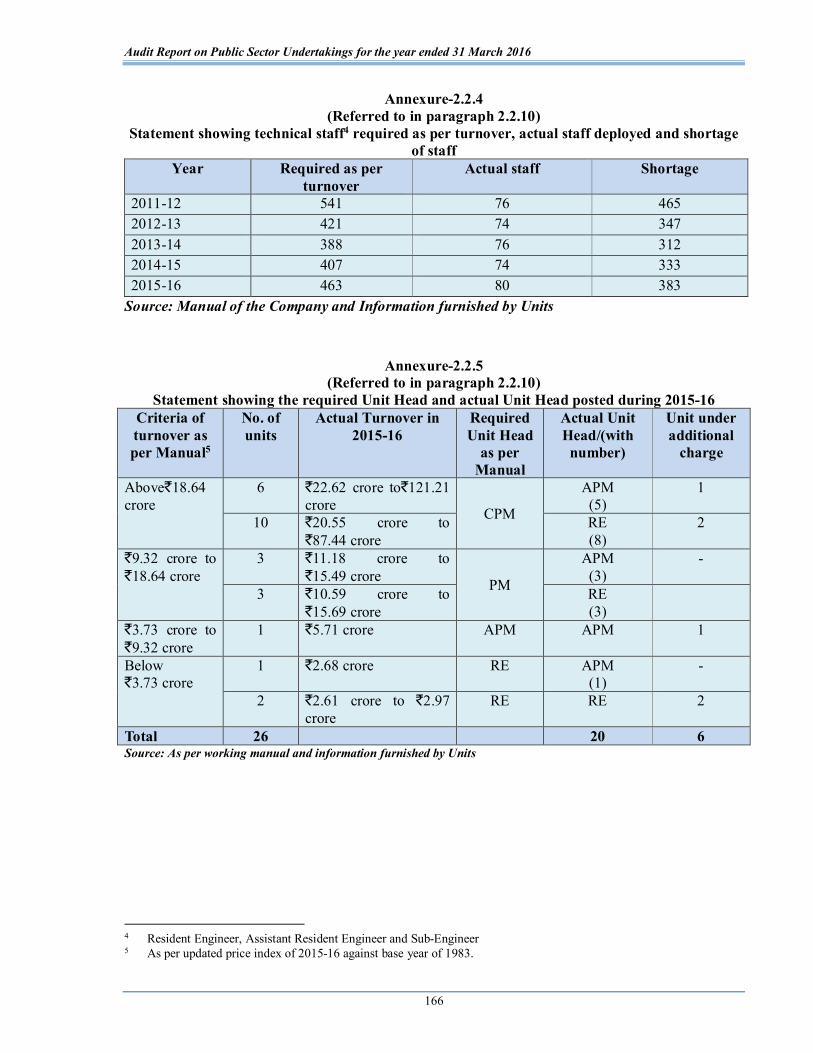
Audit Report on Public Sector Undertakings for the year ended 31 March 2016
166
Annexure-2.2.4 (Referred to in paragraph 2.2.10)
Statement showing technical staff4 required as per turnover, actual staff deployed and shortage of staff
Year Required as per turnover
Actual staff Shortage
2011-12 541 76 465 2012-13 421 74 347 2013-14 388 76 312 2014-15 407 74 333 2015-16 463 80 383
Source: Manual of the Company and Information furnished by Units
Annexure-2.2.5 (Referred to in paragraph 2.2.10)
Statement showing the required Unit Head and actual Unit Head posted during 2015-16 Criteria of turnover as per Manual5
No. of units
Actual Turnover in 2015-16
Required Unit Head
as per Manual
Actual Unit Head/(with
number)
Unit under additional
charge
Above`18.64 crore
6 `22.62 crore to`121.21 crore CPM
APM (5)
1
10 `20.55 crore to `87.44 crore
RE (8)
2
`9.32 crore to `18.64 crore
3 `11.18 crore to `15.49 crore PM
APM (3)
-
3 `10.59 crore to `15.69 crore
RE (3)
`3.73 crore to `9.32 crore
1 `5.71 crore APM APM 1
Below `3.73 crore
1 `2.68 crore RE APM (1)
-
2 `2.61 crore to `2.97 crore
RE RE 2
Total 26 20 6 Source: As per working manual and information furnished by Units
4 Resident Engineer, Assistant Resident Engineer and Sub-Engineer 5 As per updated price index of 2015-16 against base year of 1983.
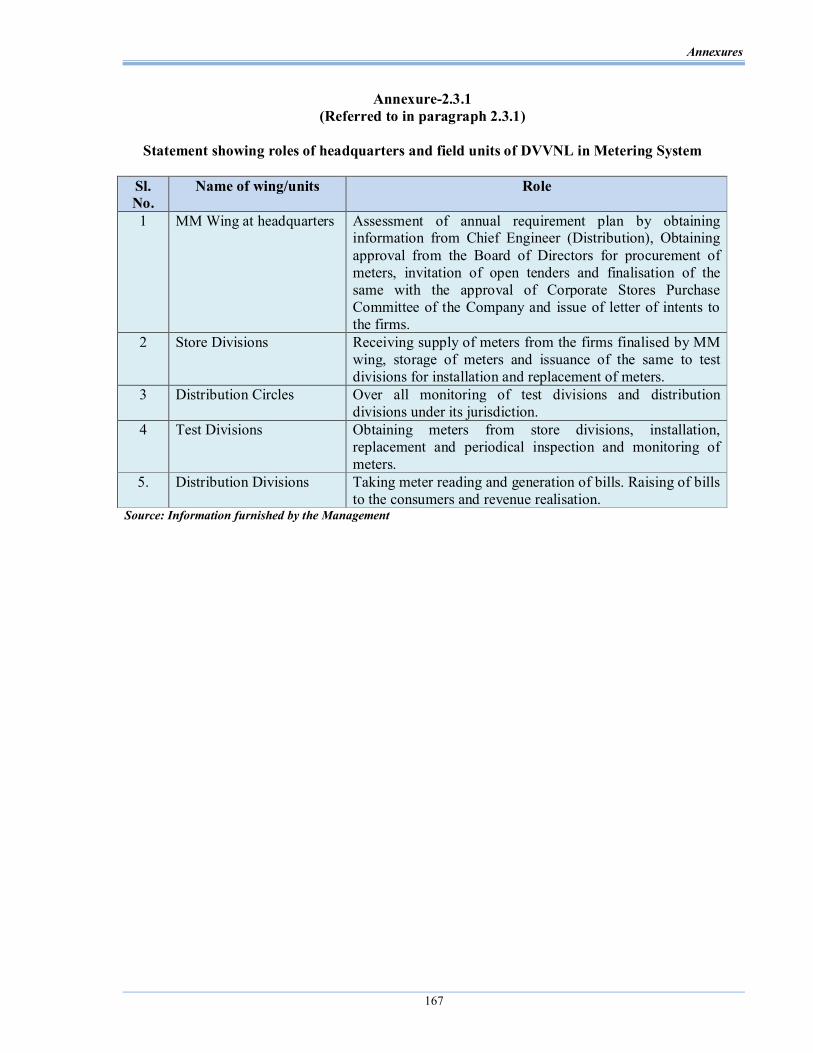
Annexures
167
Annexure-2.3.1 (Referred to in paragraph 2.3.1)
Statement showing roles of headquarters and field units of DVVNL in Metering System
Sl. No.
Name of wing/units Role
1 MM Wing at headquarters Assessment of annual requirement plan by obtaining information from Chief Engineer (Distribution), Obtaining approval from the Board of Directors for procurement of meters, invitation of open tenders and finalisation of the same with the approval of Corporate Stores Purchase Committee of the Company and issue of letter of intents to the firms.
2 Store Divisions Receiving supply of meters from the firms finalised by MM wing, storage of meters and issuance of the same to test divisions for installation and replacement of meters.
3 Distribution Circles Over all monitoring of test divisions and distribution divisions under its jurisdiction.
4 Test Divisions Obtaining meters from store divisions, installation, replacement and periodical inspection and monitoring of meters.
5. Distribution Divisions Taking meter reading and generation of bills. Raising of bills to the consumers and revenue realisation.
Source: Information furnished by the Management
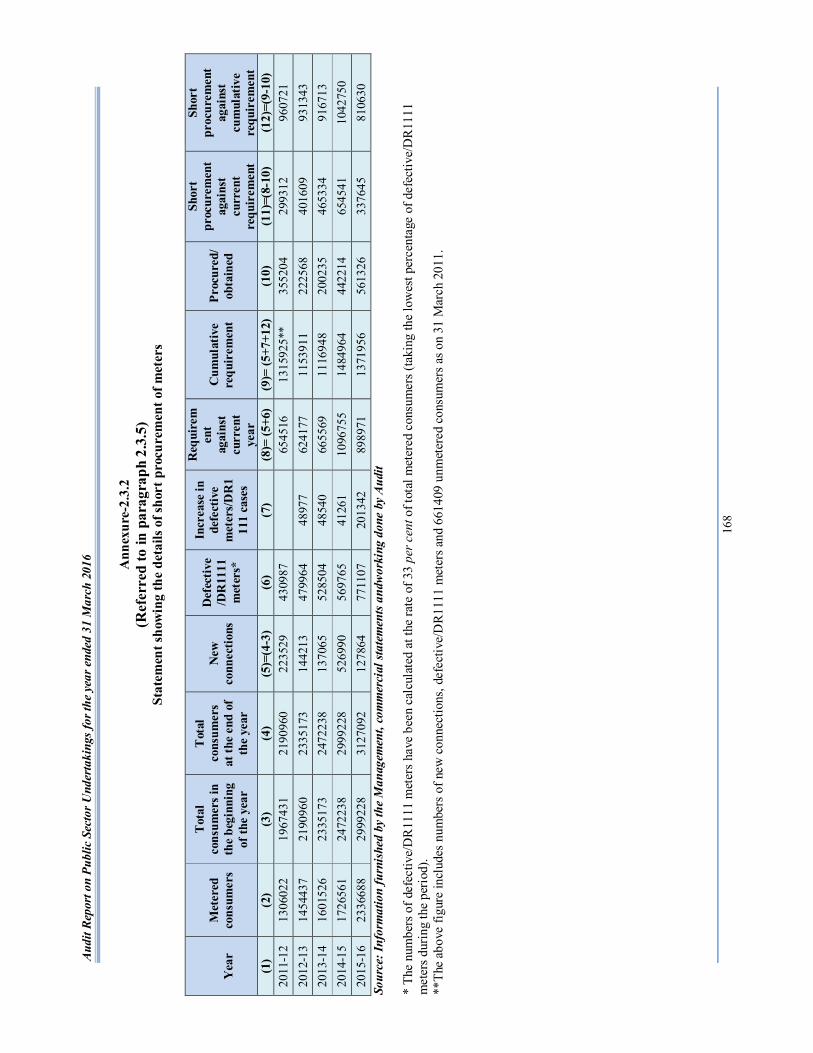
Audi
t Rep
ort o
n Pu
blic
Sec
tor U
nder
taki
ngs f
or th
e ye
ar e
nded
31
Mar
ch 2
016
168
Ann
exur
e-2.
3.2
(Ref
erre
d to
in p
arag
raph
2.3
.5)
Stat
emen
t sho
win
g th
e de
tails
of s
hort
pro
cure
men
t of m
eter
s
Y
ear
Met
ered
co
nsum
ers
Tot
al
cons
umer
s in
the
begi
nnin
g of
the
year
Tot
al
cons
umer
s at
the
end
of
the
year
New
co
nnec
tions
Def
ectiv
e/D
R11
11
met
ers*
Incr
ease
in
defe
ctiv
e m
eter
s/DR
111
1 ca
ses
Req
uire
men
t ag
ains
t cu
rren
t ye
ar
Cum
ulat
ive
requ
irem
ent
Proc
ured
/ob
tain
ed
Shor
t pr
ocur
emen
t ag
ains
t cu
rren
t re
quir
emen
t
Shor
t pr
ocur
emen
t ag
ains
t cu
mul
ativ
e re
quir
emen
t (1
) (2
) (3
) (4
) (5
)=(4
-3)
(6)
(7)
(8)=
(5+6
) (9
)= (5
+7+1
2)
(10)
(1
1)=(
8-10
) (1
2)=(
9-10
) 20
11-1
2 13
0602
2 19
6743
1 21
9096
0 22
3529
43
0987
6545
16
1315
925*
* 35
5204
29
9312
96
0721
20
12-1
3 14
5443
7 21
9096
0 23
3517
3 14
4213
47
9964
48
977
6241
77
1153
911
2225
68
4016
09
9313
43
2013
-14
1601
526
2335
173
2472
238
1370
65
5285
04
4854
0 66
5569
11
1694
8 20
0235
46
5334
91
6713
20
14-1
5 17
2656
1 24
7223
8 29
9922
8 52
6990
56
9765
41
261
1096
755
1484
964
4422
14
6545
41
1042
750
2015
-16
2336
688
2999
228
3127
092
1278
64
7711
07
2013
42
8989
71
1371
956
5613
26
3376
45
8106
30
Sour
ce: I
nfor
mat
ion
furn
ishe
d by
the
Man
agem
ent,
com
mer
cial
stat
emen
ts an
dwor
king
don
e by
Aud
it
* Th
e nu
mbe
rs o
f def
ectiv
e/D
R11
11 m
eter
s hav
e be
en c
alcu
late
d at
the
rate
of 3
3 pe
r cen
t of t
otal
met
ered
con
sum
ers (
taki
ng th
e lo
wes
t per
cent
age
of d
efec
tive/
DR
1111
m
eter
s dur
ing
the
perio
d).
**Th
e ab
ove
figur
e in
clud
es n
umbe
rs o
f new
con
nect
ions
, def
ectiv
e/D
R111
1 m
eter
s and
661
409
unm
eter
ed c
onsu
mer
s as o
n 31
Mar
ch 2
011.
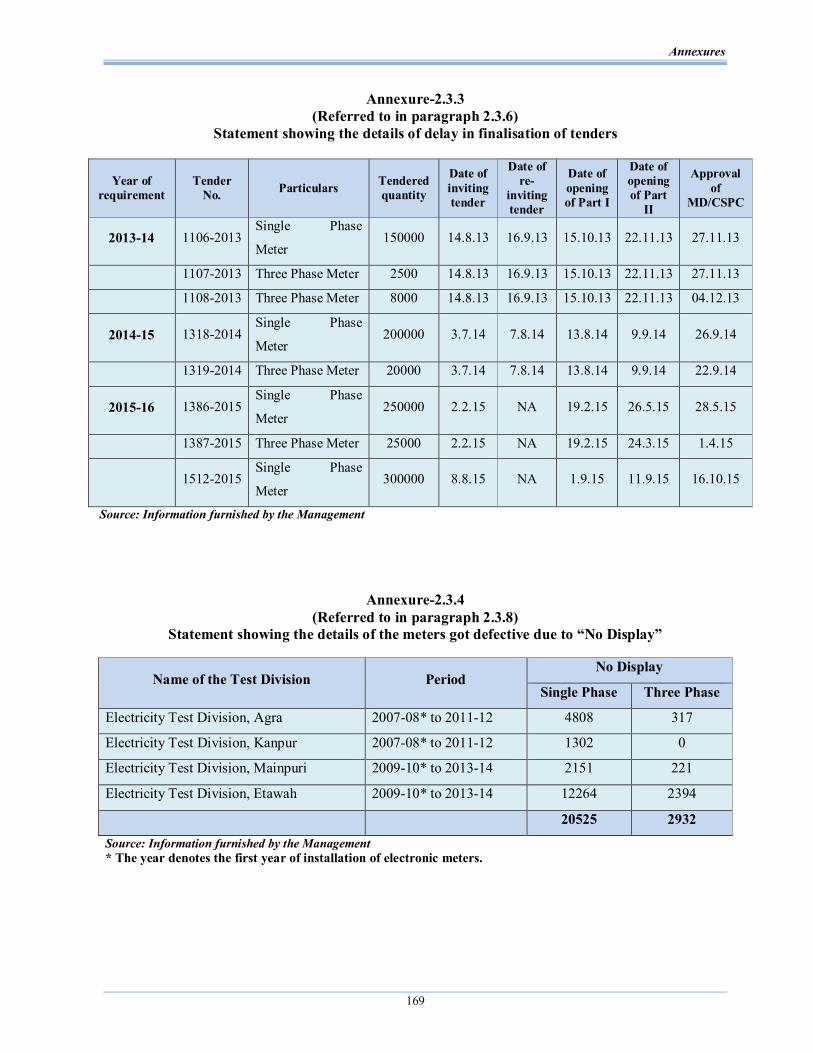
Annexures
169
Annexure-2.3.3 (Referred to in paragraph 2.3.6)
Statement showing the details of delay in finalisation of tenders
Year of requirement
Tender No. Particulars Tendered
quantity
Date of inviting tender
Date of re-
inviting tender
Date of opening of Part I
Date of opening of Part
II
Approval of
MD/CSPC
2013-14 1106-2013 Single Phase
Meter 150000 14.8.13 16.9.13 15.10.13 22.11.13 27.11.13
1107-2013 Three Phase Meter 2500 14.8.13 16.9.13 15.10.13 22.11.13 27.11.13
1108-2013 Three Phase Meter 8000 14.8.13 16.9.13 15.10.13 22.11.13 04.12.13
2014-15 1318-2014 Single Phase
Meter 200000 3.7.14 7.8.14 13.8.14 9.9.14 26.9.14
1319-2014 Three Phase Meter 20000 3.7.14 7.8.14 13.8.14 9.9.14 22.9.14
2015-16 1386-2015 Single Phase
Meter 250000 2.2.15 NA 19.2.15 26.5.15 28.5.15
1387-2015 Three Phase Meter 25000 2.2.15 NA 19.2.15 24.3.15 1.4.15
1512-2015 Single Phase
Meter 300000 8.8.15 NA 1.9.15 11.9.15 16.10.15
Source: Information furnished by the Management
Annexure-2.3.4 (Referred to in paragraph 2.3.8)
Statement showing the details of the meters got defective due to “No Display”
Name of the Test Division Period No Display
Single Phase Three Phase
Electricity Test Division, Agra 2007-08* to 2011-12 4808 317
Electricity Test Division, Kanpur 2007-08* to 2011-12 1302 0
Electricity Test Division, Mainpuri 2009-10* to 2013-14 2151 221
Electricity Test Division, Etawah 2009-10* to 2013-14 12264 2394
20525 2932 Source: Information furnished by the Management * The year denotes the first year of installation of electronic meters.
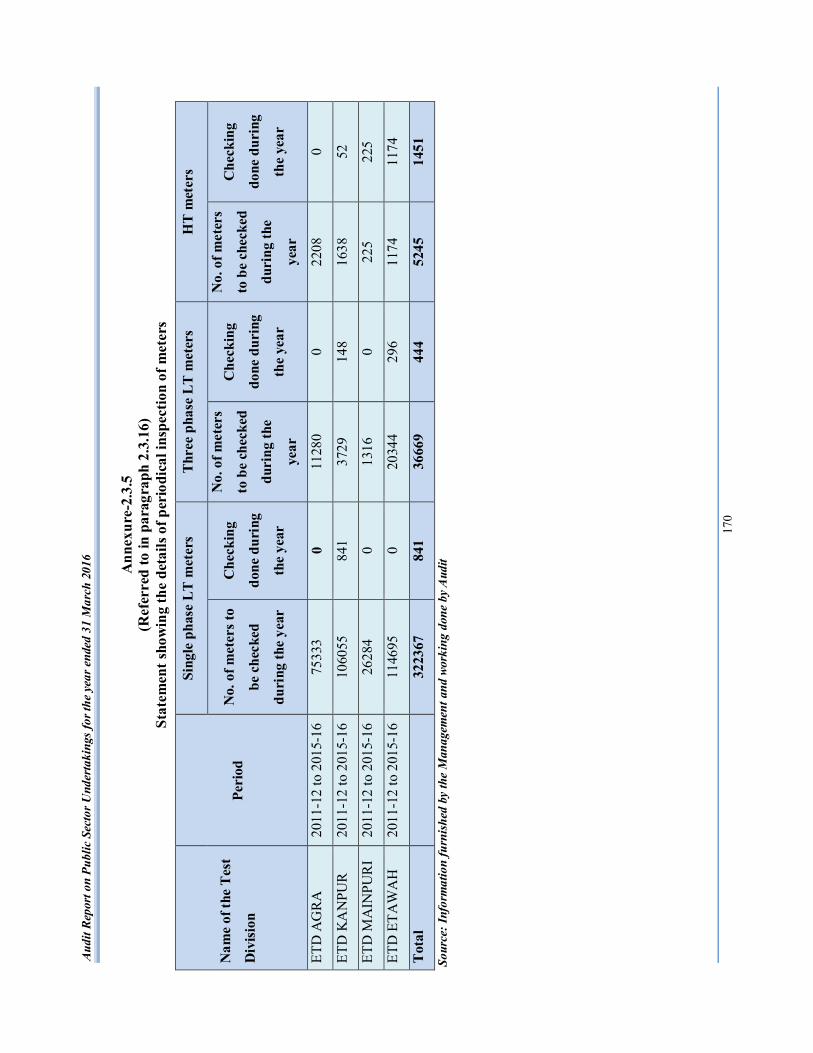
Audi
t Rep
ort o
n Pu
blic
Sec
tor U
nder
taki
ngs f
or th
e ye
ar e
nded
31
Mar
ch 2
016
170
A
nnex
ure-
2.3.
5 (R
efer
red
to in
par
agra
ph 2
.3.1
6)
Stat
emen
t sho
win
g th
e de
tails
of p
erio
dica
l ins
pect
ion
of m
eter
s
Nam
e of
the
Tes
t
Div
isio
n Pe
riod
Sing
le p
hase
LT
met
ers
Thr
ee p
hase
LT
met
ers
HT
met
ers
No.
of m
eter
s to
be c
heck
ed
duri
ng th
e ye
ar
Che
ckin
g
done
dur
ing
the
year
No.
of m
eter
s
to b
e ch
ecke
d
duri
ng th
e
year
Che
ckin
g
done
dur
ing
the
year
No.
of m
eter
s
to b
e ch
ecke
d
duri
ng th
e
year
Che
ckin
g
done
dur
ing
the
year
ETD
AG
RA
20
11-1
2 to
201
5-16
75
333
0 11
280
0 22
08
0
ETD
KA
NPU
R
2011
-12
to 2
015-
16
1060
55
841
3729
14
8 16
38
52
ETD
MA
INPU
RI
2011
-12
to 2
015-
16
2628
4 0
1316
0
225
225
ETD
ETA
WA
H
2011
-12
to 2
015-
16
1146
95
0 20
344
296
1174
11
74
Tot
al
32
2367
84
1 36
669
444
5245
14
51
Sour
ce: I
nfor
mat
ion
furn
ished
by
the
Man
agem
ent a
nd w
orki
ng d
one
by A
udit
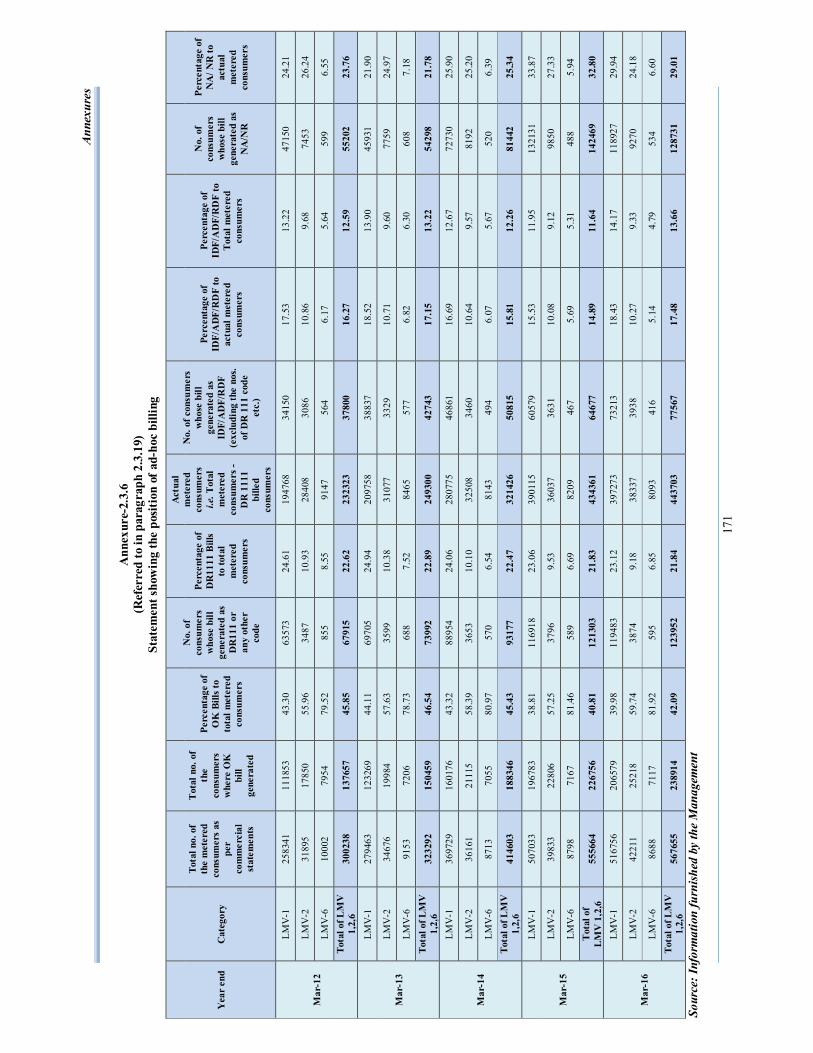
Anne
xure
s
171
Ann
exur
e-2.
3.6
(Ref
erre
d to
in p
arag
raph
2.3
.19)
St
atem
ent s
how
ing
the
posit
ion
of a
d-ho
c bi
lling
Yea
r en
d C
ateg
ory
Tota
l no.
of
the
met
ered
co
nsum
ers
as
per
com
mer
cial
st
atem
ents
Tot
al n
o. o
f th
e co
nsum
ers
whe
re O
K
bill
gene
rate
d
Perc
enta
ge o
f O
K B
ills t
o to
tal m
eter
ed
cons
umer
s
No.
of
cons
umer
s w
hose
bill
ge
nera
ted
as
DR
111
or
any
othe
r co
de
Perc
enta
ge o
f D
R11
11 B
ills
to to
tal
met
ered
co
nsum
ers
Act
ual
met
ered
co
nsum
ers
i.e. T
otal
m
eter
ed
cons
umer
s -
DR
111
1 bi
lled
cons
umer
s
No.
of c
onsu
mer
s w
hose
bill
ge
nera
ted
as
IDF/
AD
F/R
DF
(exc
ludi
ng th
e no
s. of
DR
111
cod
e et
c.)
Perc
enta
ge o
f ID
F/A
DF/
RD
F to
ac
tual
met
ered
co
nsum
ers
Perc
enta
ge o
f ID
F/A
DF/
RD
F to
T
otal
met
ered
co
nsum
ers
No.
of
cons
umer
s w
hose
bill
ge
nera
ted
as
NA
/NR
Perc
enta
ge o
f N
A/ N
R to
ac
tual
m
eter
ed
cons
umer
s
Mar
-12
LMV
-1
2583
41
1118
53
43.3
0 63
573
24.6
1 19
4768
34
150
17.5
3 13
.22
4715
0 24
.21
LMV
-2
3189
5 17
850
55.9
6 34
87
10.9
3 28
408
3086
10
.86
9.68
74
53
26.2
4
LMV
-6
1000
2 79
54
79.5
2 85
5 8.
55
9147
56
4 6.
17
5.64
59
9 6.
55
Tota
l of L
MV
1,
2,6
3002
38
1376
57
45.8
5 67
915
22.6
2 23
2323
37
800
16.2
7 12
.59
5520
2 23
.76
Mar
-13
LMV
-1
2794
63
1232
69
44.1
1 69
705
24.9
4 20
9758
38
837
18.5
2 13
.90
4593
1 21
.90
LMV
-2
3467
6 19
984
57.6
3 35
99
10.3
8 31
077
3329
10
.71
9.60
77
59
24.9
7
LMV
-6
9153
72
06
78.7
3 68
8 7.
52
8465
57
7 6.
82
6.30
60
8 7.
18
Tota
l of L
MV
1,
2,6
3232
92
1504
59
46.5
4 73
992
22.8
9 24
9300
42
743
17.1
5 13
.22
5429
8 21
.78
Mar
-14
LMV
-1
3697
29
1601
76
43.3
2 88
954
24.0
6 28
0775
46
861
16.6
9 12
.67
7273
0 25
.90
LMV
-2
3616
1 21
115
58.3
9 36
53
10.1
0 32
508
3460
10
.64
9.57
81
92
25.2
0
LMV
-6
8713
70
55
80.9
7 57
0 6.
54
8143
49
4 6.
07
5.67
52
0 6.
39
Tota
l of L
MV
1,
2,6
4146
03
1883
46
45.4
3 93
177
22.4
7 32
1426
50
815
15.8
1 12
.26
8144
2 25
.34
Mar
-15
LMV
-1
5070
33
1967
83
38.8
1 11
6918
23
.06
3901
15
6057
9 15
.53
11.9
5 13
2131
33
.87
LMV
-2
3983
3 22
806
57.2
5 37
96
9.53
36
037
3631
10
.08
9.12
98
50
27.3
3
LMV
-6
8798
71
67
81.4
6 58
9 6.
69
8209
46
7 5.
69
5.31
48
8 5.
94
Tot
al o
f L
MV
1,2
,6
5556
64
2267
56
40.8
1 12
1303
21
.83
4343
61
6467
7 14
.89
11.6
4 14
2469
32
.80
Mar
-16
LMV
-1
5167
56
2065
79
39.9
8 11
9483
23
.12
3972
73
7321
3 18
.43
14.1
7 11
8927
29
.94
LMV
-2
4221
1 25
218
59.7
4 38
74
9.18
38
337
3938
10
.27
9.33
92
70
24.1
8
LMV
-6
8688
71
17
81.9
2 59
5 6.
85
8093
41
6 5.
14
4.79
53
4 6.
60
Tota
l of L
MV
1,
2,6
5676
55
2389
14
42.0
9 12
3952
21
.84
4437
03
7756
7 17
.48
13.6
6 12
8731
29
.01
Sour
ce: I
nfor
mat
ion
furn
ished
by
the
Man
agem
ent
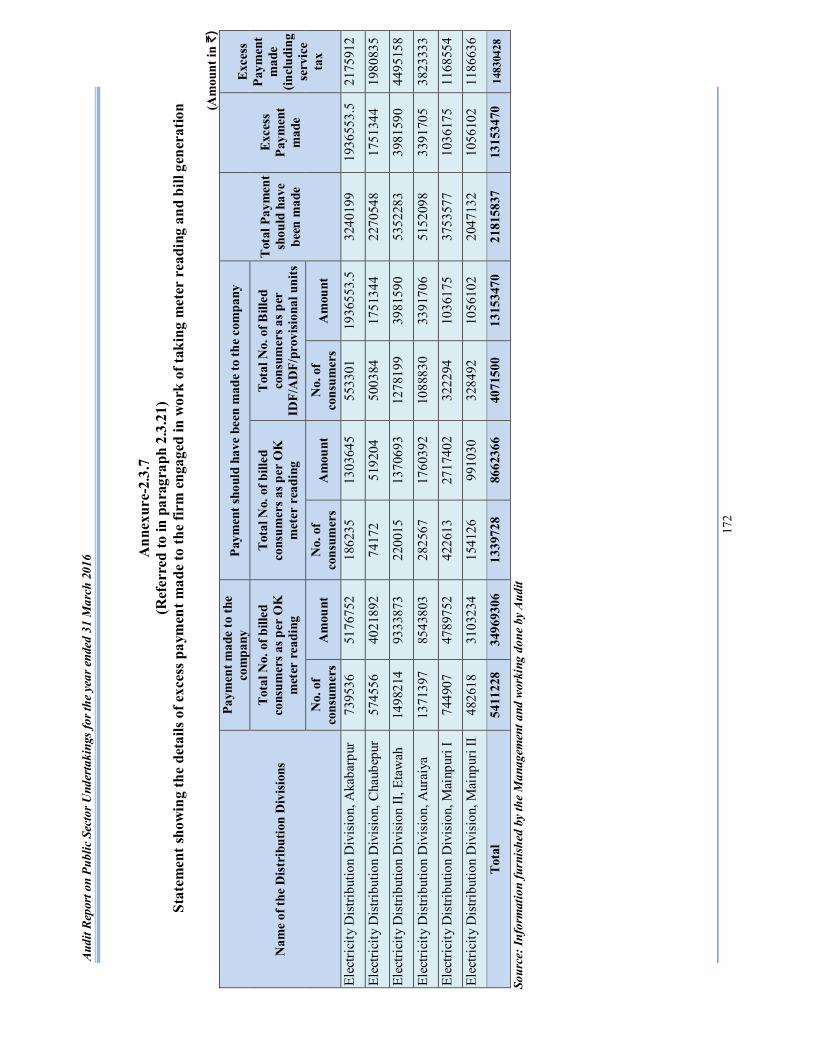
Audi
t Rep
ort o
n Pu
blic
Sec
tor U
nder
taki
ngs f
or th
e ye
ar e
nded
31
Mar
ch 2
016
172
A
nnex
ure-
2.3.
7 (R
efer
red
to in
par
agra
ph 2
.3.2
1)
Stat
emen
t sho
win
g th
e de
tails
of e
xces
s pay
men
t mad
e to
the
firm
eng
aged
in w
ork
of ta
king
met
er r
eadi
ng a
nd b
ill g
ener
atio
n
(A
mou
nt in
`)
Nam
e of
the
Dist
ribu
tion
Div
ision
s
Paym
ent m
ade
to th
e co
mpa
ny
Paym
ent s
houl
d ha
ve b
een
mad
e to
the
com
pany
Tot
al P
aym
ent
shou
ld h
ave
been
mad
e
Exce
ss
Paym
ent
mad
e
Exce
ss
Paym
ent
mad
e (in
clud
ing
serv
ice
tax
Tota
l No.
of b
illed
co
nsum
ers a
s per
OK
m
eter
rea
ding
Tota
l No.
of b
illed
co
nsum
ers a
s per
OK
m
eter
rea
ding
Tot
al N
o. o
f Bill
ed
cons
umer
s as p
er
IDF/
AD
F/pr
ovisi
onal
uni
ts
No.
of
cons
umer
s A
mou
nt
No.
of
cons
umer
s A
mou
nt
No.
of
cons
umer
s A
mou
nt
Elec
trici
ty D
istri
butio
n D
ivis
ion,
Aka
barp
ur
7395
36
5176
752
1862
35
1303
645
5533
01
1936
553.
5 32
4019
9 19
3655
3.5
2175
912
Elec
trici
ty D
istri
butio
n D
ivis
ion,
Cha
ubep
ur
5745
56
4021
892
7417
2 51
9204
50
0384
17
5134
4 22
7054
8 17
5134
4 19
8083
5
Elec
trici
ty D
istri
butio
n D
ivis
ion
II, E
taw
ah
1498
214
9333
873
2200
15
1370
693
1278
199
3981
590
5352
283
3981
590
4495
158
Elec
trici
ty D
istri
butio
n D
ivis
ion,
Aur
aiya
13
7139
7 85
4380
3 28
2567
17
6039
2 10
8883
0 33
9170
6 51
5209
8 33
9170
5 38
2333
3
Elec
trici
ty D
istri
butio
n D
ivis
ion,
Mai
npur
i I
7449
07
4789
752
4226
13
2717
402
3222
94
1036
175
3753
577
1036
175
1168
554
Elec
trici
ty D
istri
butio
n D
ivis
ion,
Mai
npur
i II
4826
18
3103
234
1541
26
9910
30
3284
92
1056
102
2047
132
1056
102
1186
636
Tota
l 54
1122
8 34
9693
06
1339
728
8662
366
4071
500
1315
3470
21
8158
37
1315
3470
14
8304
28
Sour
ce: I
nfor
mat
ion
furn
ished
by
the
Man
agem
ent a
nd w
orki
ng d
one
by A
udit
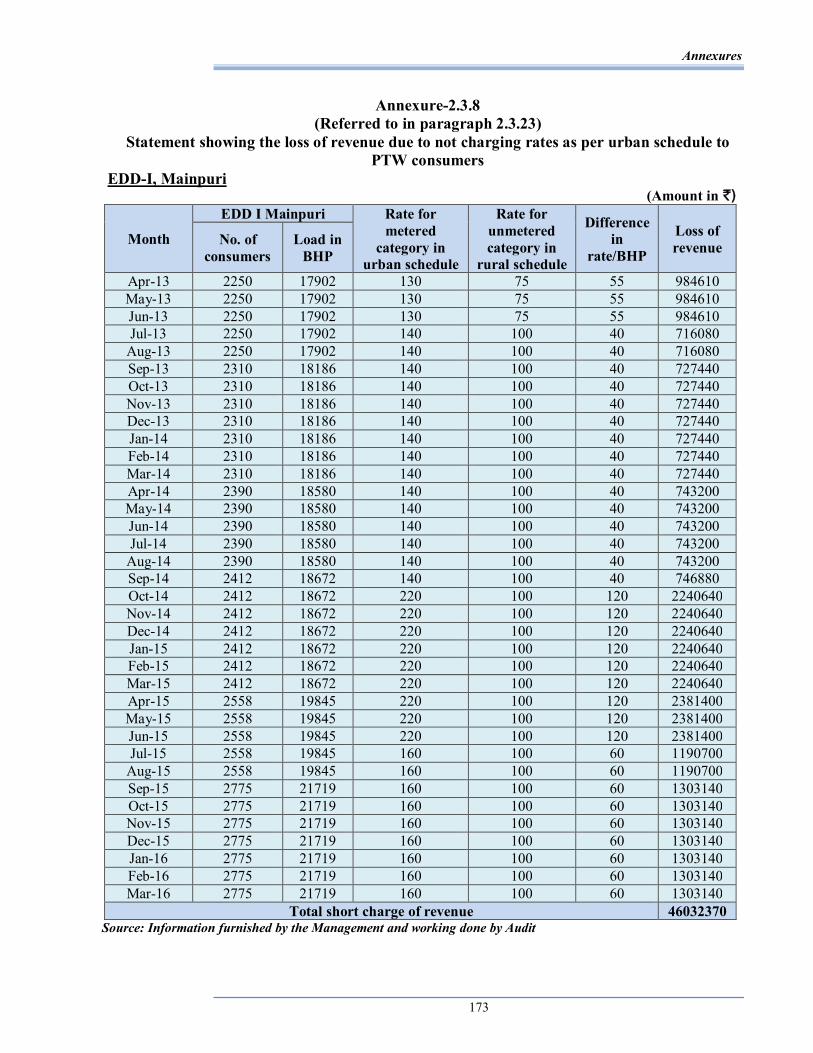
Annexures
173
Annexure-2.3.8 (Referred to in paragraph 2.3.23)
Statement showing the loss of revenue due to not charging rates as per urban schedule to PTW consumers
EDD-I, Mainpuri (Amount in `)
Month
EDD I Mainpuri Rate for metered
category in urban schedule
Rate for unmetered category in
rural schedule
Difference in
rate/BHP
Loss of revenue No. of
consumers Load in
BHP
Apr-13 2250 17902 130 75 55 984610 May-13 2250 17902 130 75 55 984610 Jun-13 2250 17902 130 75 55 984610 Jul-13 2250 17902 140 100 40 716080
Aug-13 2250 17902 140 100 40 716080 Sep-13 2310 18186 140 100 40 727440 Oct-13 2310 18186 140 100 40 727440 Nov-13 2310 18186 140 100 40 727440 Dec-13 2310 18186 140 100 40 727440 Jan-14 2310 18186 140 100 40 727440 Feb-14 2310 18186 140 100 40 727440 Mar-14 2310 18186 140 100 40 727440 Apr-14 2390 18580 140 100 40 743200 May-14 2390 18580 140 100 40 743200 Jun-14 2390 18580 140 100 40 743200 Jul-14 2390 18580 140 100 40 743200
Aug-14 2390 18580 140 100 40 743200 Sep-14 2412 18672 140 100 40 746880 Oct-14 2412 18672 220 100 120 2240640 Nov-14 2412 18672 220 100 120 2240640 Dec-14 2412 18672 220 100 120 2240640 Jan-15 2412 18672 220 100 120 2240640 Feb-15 2412 18672 220 100 120 2240640 Mar-15 2412 18672 220 100 120 2240640 Apr-15 2558 19845 220 100 120 2381400 May-15 2558 19845 220 100 120 2381400 Jun-15 2558 19845 220 100 120 2381400 Jul-15 2558 19845 160 100 60 1190700
Aug-15 2558 19845 160 100 60 1190700 Sep-15 2775 21719 160 100 60 1303140 Oct-15 2775 21719 160 100 60 1303140 Nov-15 2775 21719 160 100 60 1303140 Dec-15 2775 21719 160 100 60 1303140 Jan-16 2775 21719 160 100 60 1303140 Feb-16 2775 21719 160 100 60 1303140 Mar-16 2775 21719 160 100 60 1303140
Total short charge of revenue 46032370 Source: Information furnished by the Management and working done by Audit
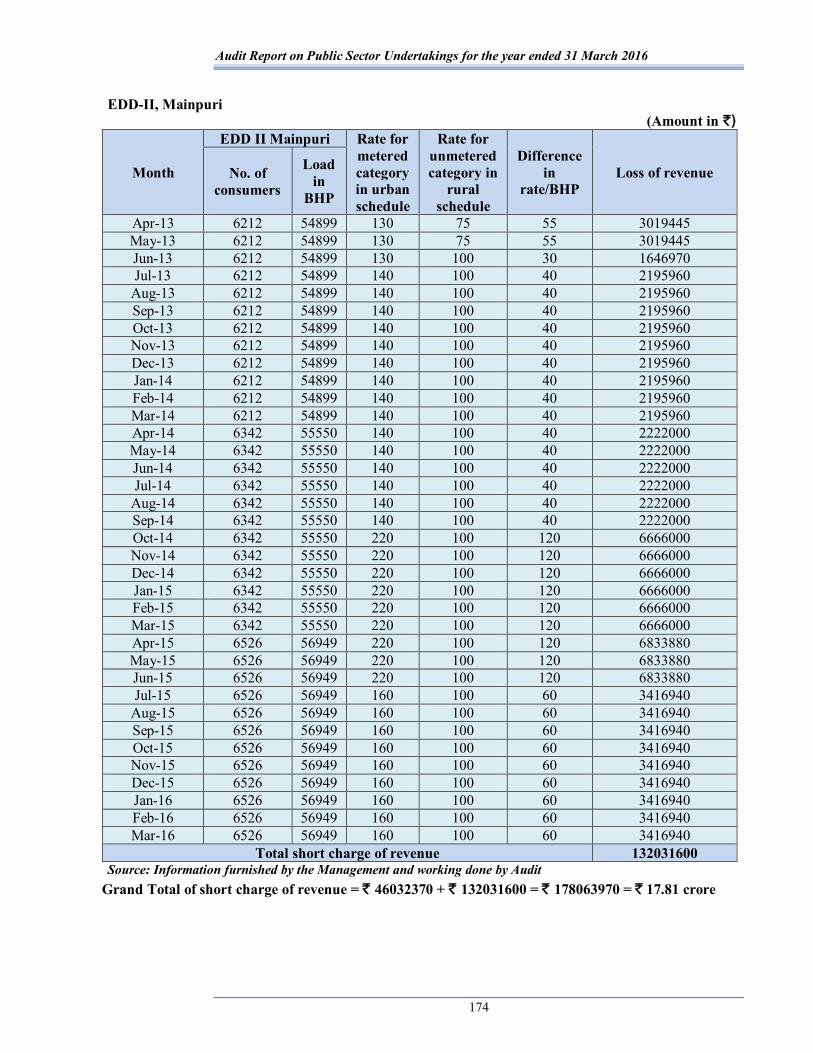
Audit Report on Public Sector Undertakings for the year ended 31 March 2016
174
EDD-II, Mainpuri (Amount in `)
Month
EDD II Mainpuri Rate for metered category in urban schedule
Rate for unmetered category in
rural schedule
Difference in
rate/BHP Loss of revenue No. of
consumers
Load in
BHP
Apr-13 6212 54899 130 75 55 3019445 May-13 6212 54899 130 75 55 3019445 Jun-13 6212 54899 130 100 30 1646970 Jul-13 6212 54899 140 100 40 2195960
Aug-13 6212 54899 140 100 40 2195960 Sep-13 6212 54899 140 100 40 2195960 Oct-13 6212 54899 140 100 40 2195960 Nov-13 6212 54899 140 100 40 2195960 Dec-13 6212 54899 140 100 40 2195960 Jan-14 6212 54899 140 100 40 2195960 Feb-14 6212 54899 140 100 40 2195960 Mar-14 6212 54899 140 100 40 2195960 Apr-14 6342 55550 140 100 40 2222000 May-14 6342 55550 140 100 40 2222000 Jun-14 6342 55550 140 100 40 2222000 Jul-14 6342 55550 140 100 40 2222000
Aug-14 6342 55550 140 100 40 2222000 Sep-14 6342 55550 140 100 40 2222000 Oct-14 6342 55550 220 100 120 6666000 Nov-14 6342 55550 220 100 120 6666000 Dec-14 6342 55550 220 100 120 6666000 Jan-15 6342 55550 220 100 120 6666000 Feb-15 6342 55550 220 100 120 6666000 Mar-15 6342 55550 220 100 120 6666000 Apr-15 6526 56949 220 100 120 6833880 May-15 6526 56949 220 100 120 6833880 Jun-15 6526 56949 220 100 120 6833880 Jul-15 6526 56949 160 100 60 3416940
Aug-15 6526 56949 160 100 60 3416940 Sep-15 6526 56949 160 100 60 3416940 Oct-15 6526 56949 160 100 60 3416940 Nov-15 6526 56949 160 100 60 3416940 Dec-15 6526 56949 160 100 60 3416940 Jan-16 6526 56949 160 100 60 3416940 Feb-16 6526 56949 160 100 60 3416940 Mar-16 6526 56949 160 100 60 3416940
Total short charge of revenue 132031600 Source: Information furnished by the Management and working done by Audit
Grand Total of short charge of revenue = ` 46032370 + ` 132031600 = ` 178063970 = ` 17.81 crore

Annexures
175
Annexure-2.4.1 (Referred to in paragraph 2.4.1)
Organisational chart of Construction and Design Services Wing
Director
Chief General Manager (I&III)
Lucknow
8 nos. General Managers
28 nos. Project Managers
Chief General Manager (II&IV)
Ghaziabad
8 nos. General Managers
24 nos. Project Managers
Sr. Accounts Officer
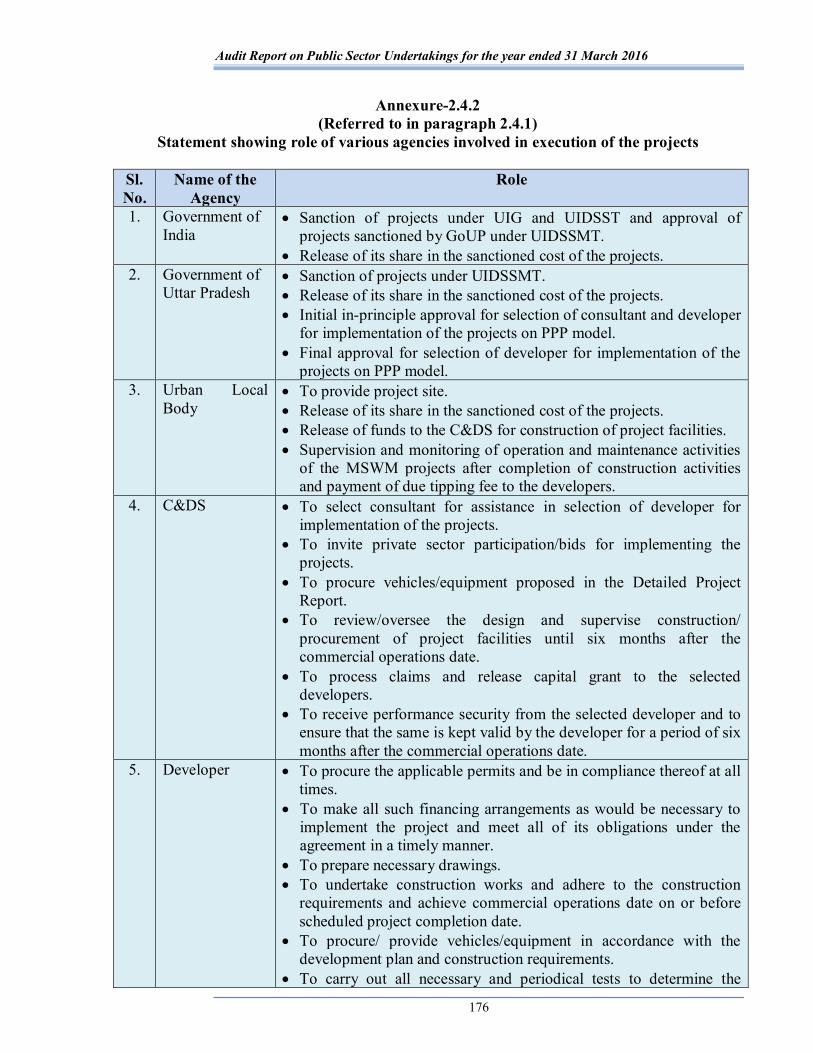
Audit Report on Public Sector Undertakings for the year ended 31 March 2016
176
Annexure-2.4.2 (Referred to in paragraph 2.4.1)
Statement showing role of various agencies involved in execution of the projects
Sl. No.
Name of the Agency
Role
1. Government of India
Sanction of projects under UIG and UIDSST and approval of projects sanctioned by GoUP under UIDSSMT.
Release of its share in the sanctioned cost of the projects. 2. Government of
Uttar Pradesh Sanction of projects under UIDSSMT. Release of its share in the sanctioned cost of the projects. Initial in-principle approval for selection of consultant and developer
for implementation of the projects on PPP model. Final approval for selection of developer for implementation of the
projects on PPP model. 3. Urban Local
Body
To provide project site. Release of its share in the sanctioned cost of the projects. Release of funds to the C&DS for construction of project facilities. Supervision and monitoring of operation and maintenance activities
of the MSWM projects after completion of construction activities and payment of due tipping fee to the developers.
4. C&DS To select consultant for assistance in selection of developer for implementation of the projects.
To invite private sector participation/bids for implementing the projects.
To procure vehicles/equipment proposed in the Detailed Project Report.
To review/oversee the design and supervise construction/ procurement of project facilities until six months after the commercial operations date.
To process claims and release capital grant to the selected developers.
To receive performance security from the selected developer and to ensure that the same is kept valid by the developer for a period of six months after the commercial operations date.
5. Developer To procure the applicable permits and be in compliance thereof at all times.
To make all such financing arrangements as would be necessary to implement the project and meet all of its obligations under the agreement in a timely manner.
To prepare necessary drawings. To undertake construction works and adhere to the construction
requirements and achieve commercial operations date on or before scheduled project completion date.
To procure/ provide vehicles/equipment in accordance with the development plan and construction requirements.
To carry out all necessary and periodical tests to determine the
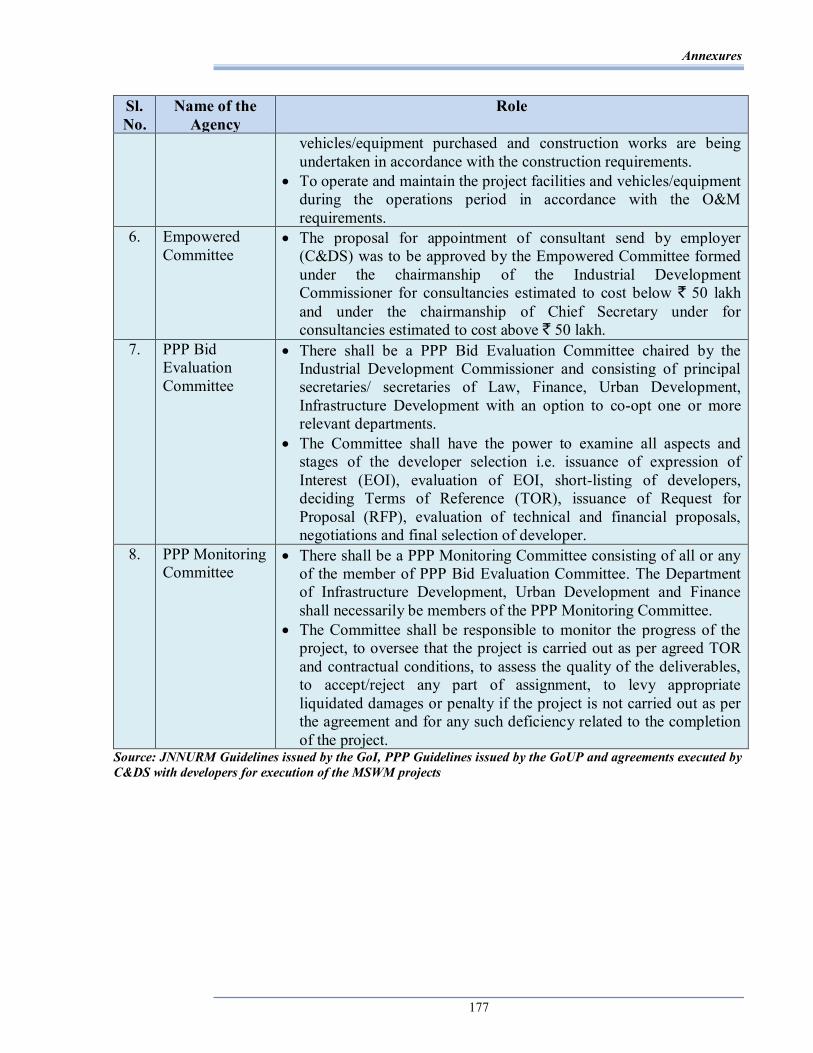
Annexures
177
Sl. No.
Name of the Agency
Role
vehicles/equipment purchased and construction works are being undertaken in accordance with the construction requirements.
To operate and maintain the project facilities and vehicles/equipment during the operations period in accordance with the O&M requirements.
6. Empowered Committee
The proposal for appointment of consultant send by employer (C&DS) was to be approved by the Empowered Committee formed under the chairmanship of the Industrial Development Commissioner for consultancies estimated to cost below ` 50 lakh and under the chairmanship of Chief Secretary under for consultancies estimated to cost above ` 50 lakh.
7. PPP Bid Evaluation Committee
There shall be a PPP Bid Evaluation Committee chaired by the Industrial Development Commissioner and consisting of principal secretaries/ secretaries of Law, Finance, Urban Development, Infrastructure Development with an option to co-opt one or more relevant departments.
The Committee shall have the power to examine all aspects and stages of the developer selection i.e. issuance of expression of Interest (EOI), evaluation of EOI, short-listing of developers, deciding Terms of Reference (TOR), issuance of Request for Proposal (RFP), evaluation of technical and financial proposals, negotiations and final selection of developer.
8. PPP Monitoring Committee
There shall be a PPP Monitoring Committee consisting of all or any of the member of PPP Bid Evaluation Committee. The Department of Infrastructure Development, Urban Development and Finance shall necessarily be members of the PPP Monitoring Committee.
The Committee shall be responsible to monitor the progress of the project, to oversee that the project is carried out as per agreed TOR and contractual conditions, to assess the quality of the deliverables, to accept/reject any part of assignment, to levy appropriate liquidated damages or penalty if the project is not carried out as per the agreement and for any such deficiency related to the completion of the project.
Source: JNNURM Guidelines issued by the GoI, PPP Guidelines issued by the GoUP and agreements executed by C&DS with developers for execution of the MSWM projects
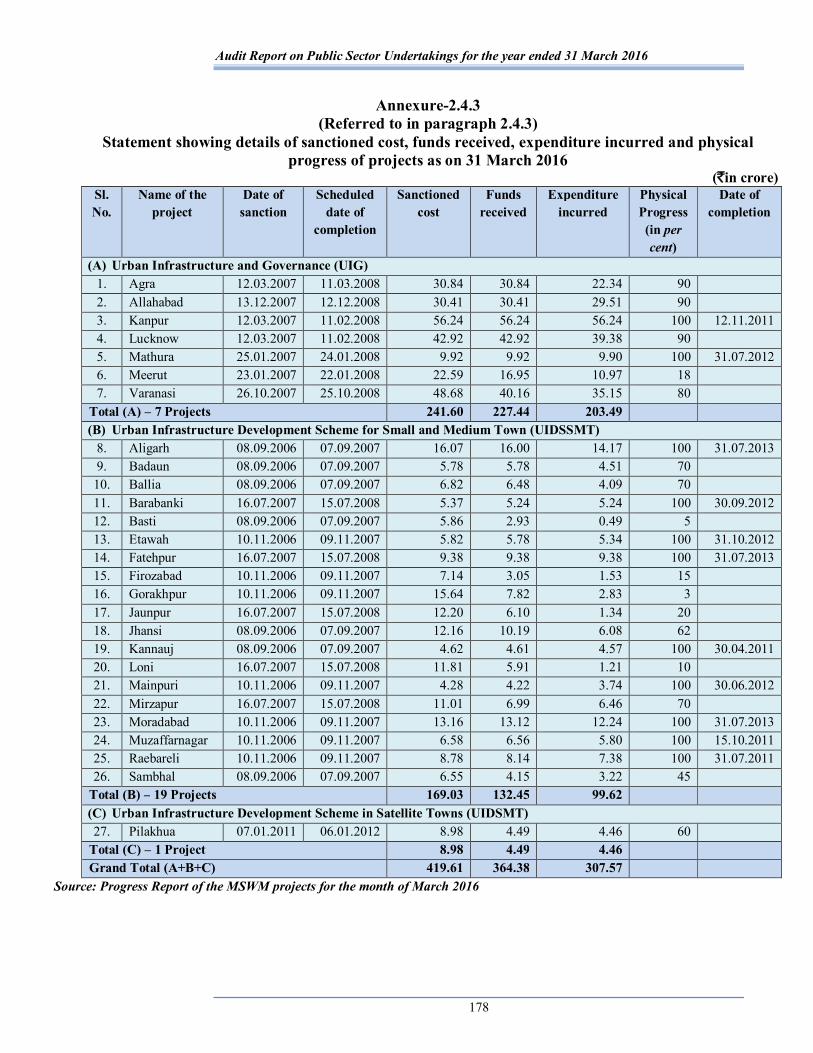
Audit Report on Public Sector Undertakings for the year ended 31 March 2016
178
Annexure-2.4.3 (Referred to in paragraph 2.4.3)
Statement showing details of sanctioned cost, funds received, expenditure incurred and physical progress of projects as on 31 March 2016
(`in crore) Sl. No.
Name of the project
Date of sanction
Scheduled date of
completion
Sanctioned cost
Funds received
Expenditure incurred
Physical Progress (in per cent)
Date of completion
(A) Urban Infrastructure and Governance (UIG) 1. Agra 12.03.2007 11.03.2008 30.84 30.84 22.34 90 2. Allahabad 13.12.2007 12.12.2008 30.41 30.41 29.51 90 3. Kanpur 12.03.2007 11.02.2008 56.24 56.24 56.24 100 12.11.2011 4. Lucknow 12.03.2007 11.02.2008 42.92 42.92 39.38 90 5. Mathura 25.01.2007 24.01.2008 9.92 9.92 9.90 100 31.07.2012 6. Meerut 23.01.2007 22.01.2008 22.59 16.95 10.97 18 7. Varanasi 26.10.2007 25.10.2008 48.68 40.16 35.15 80
Total (A) – 7 Projects 241.60 227.44 203.49 (B) Urban Infrastructure Development Scheme for Small and Medium Town (UIDSSMT)
8. Aligarh 08.09.2006 07.09.2007 16.07 16.00 14.17 100 31.07.2013 9. Badaun 08.09.2006 07.09.2007 5.78 5.78 4.51 70 10. Ballia 08.09.2006 07.09.2007 6.82 6.48 4.09 70 11. Barabanki 16.07.2007 15.07.2008 5.37 5.24 5.24 100 30.09.2012 12. Basti 08.09.2006 07.09.2007 5.86 2.93 0.49 5 13. Etawah 10.11.2006 09.11.2007 5.82 5.78 5.34 100 31.10.2012 14. Fatehpur 16.07.2007 15.07.2008 9.38 9.38 9.38 100 31.07.2013 15. Firozabad 10.11.2006 09.11.2007 7.14 3.05 1.53 15 16. Gorakhpur 10.11.2006 09.11.2007 15.64 7.82 2.83 3 17. Jaunpur 16.07.2007 15.07.2008 12.20 6.10 1.34 20 18. Jhansi 08.09.2006 07.09.2007 12.16 10.19 6.08 62 19. Kannauj 08.09.2006 07.09.2007 4.62 4.61 4.57 100 30.04.2011 20. Loni 16.07.2007 15.07.2008 11.81 5.91 1.21 10 21. Mainpuri 10.11.2006 09.11.2007 4.28 4.22 3.74 100 30.06.2012 22. Mirzapur 16.07.2007 15.07.2008 11.01 6.99 6.46 70 23. Moradabad 10.11.2006 09.11.2007 13.16 13.12 12.24 100 31.07.2013 24. Muzaffarnagar 10.11.2006 09.11.2007 6.58 6.56 5.80 100 15.10.2011 25. Raebareli 10.11.2006 09.11.2007 8.78 8.14 7.38 100 31.07.2011 26. Sambhal 08.09.2006 07.09.2007 6.55 4.15 3.22 45
Total (B) – 19 Projects 169.03 132.45 99.62 (C) Urban Infrastructure Development Scheme in Satellite Towns (UIDSMT) 27. Pilakhua 07.01.2011 06.01.2012 8.98 4.49 4.46 60
Total (C) – 1 Project 8.98 4.49 4.46 Grand Total (A+B+C) 419.61 364.38 307.57
Source: Progress Report of the MSWM projects for the month of March 2016

Annexures
179
Annexure-2.4.4
(Referred to in paragraph 2.4.6)
Statement showing details of projects wherein project cost is same but capital grant is not at par
Sl. No.
Name of the projects
Total project cost (` in lakh)
Capital grant (` in lakh)
1. Kannauj 900.33 336.00 2. Mainpuri 900.33 294.00 3. Raebareli 1100.76 640.00 4. Etawah 1100.76 394.00 5. Fatehpur 1222.75 731.31 6. Badaun 1222.75 498.00 7. Sambhal 1222.75 517.60 8. Jaunpur 1222.75 1057.15 9. Varanasi 4644.75 2773.27 10. Meerut 4644.75 1332.70
Source: Agreements executed by C&DS with developers for execution of the MSWM projects
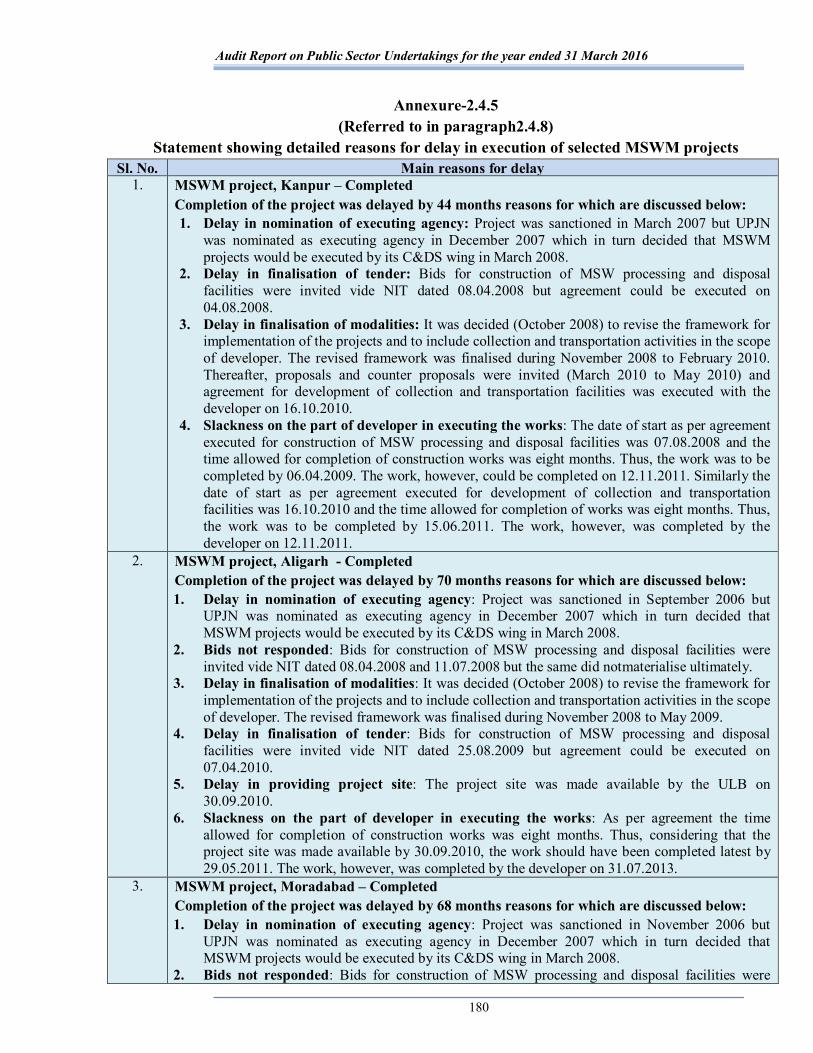
Audit Report on Public Sector Undertakings for the year ended 31 March 2016
180
Annexure-2.4.5 (Referred to in paragraph2.4.8)
Statement showing detailed reasons for delay in execution of selected MSWM projects Sl. No. Main reasons for delay
1. MSWM project, Kanpur – Completed Completion of the project was delayed by 44 months reasons for which are discussed below: 1. Delay in nomination of executing agency: Project was sanctioned in March 2007 but UPJN
was nominated as executing agency in December 2007 which in turn decided that MSWM projects would be executed by its C&DS wing in March 2008.
2. Delay in finalisation of tender: Bids for construction of MSW processing and disposal facilities were invited vide NIT dated 08.04.2008 but agreement could be executed on 04.08.2008.
3. Delay in finalisation of modalities: It was decided (October 2008) to revise the framework for implementation of the projects and to include collection and transportation activities in the scope of developer. The revised framework was finalised during November 2008 to February 2010. Thereafter, proposals and counter proposals were invited (March 2010 to May 2010) and agreement for development of collection and transportation facilities was executed with the developer on 16.10.2010.
4. Slackness on the part of developer in executing the works: The date of start as per agreement executed for construction of MSW processing and disposal facilities was 07.08.2008 and the time allowed for completion of construction works was eight months. Thus, the work was to be completed by 06.04.2009. The work, however, could be completed on 12.11.2011. Similarly the date of start as per agreement executed for development of collection and transportation facilities was 16.10.2010 and the time allowed for completion of works was eight months. Thus, the work was to be completed by 15.06.2011. The work, however, was completed by the developer on 12.11.2011.
2. MSWM project, Aligarh - Completed Completion of the project was delayed by 70 months reasons for which are discussed below: 1. Delay in nomination of executing agency: Project was sanctioned in September 2006 but
UPJN was nominated as executing agency in December 2007 which in turn decided that MSWM projects would be executed by its C&DS wing in March 2008.
2. Bids not responded: Bids for construction of MSW processing and disposal facilities were invited vide NIT dated 08.04.2008 and 11.07.2008 but the same did notmaterialise ultimately.
3. Delay in finalisation of modalities: It was decided (October 2008) to revise the framework for implementation of the projects and to include collection and transportation activities in the scope of developer. The revised framework was finalised during November 2008 to May 2009.
4. Delay in finalisation of tender: Bids for construction of MSW processing and disposal facilities were invited vide NIT dated 25.08.2009 but agreement could be executed on 07.04.2010.
5. Delay in providing project site: The project site was made available by the ULB on 30.09.2010.
6. Slackness on the part of developer in executing the works: As per agreement the time allowed for completion of construction works was eight months. Thus, considering that the project site was made available by 30.09.2010, the work should have been completed latest by 29.05.2011. The work, however, was completed by the developer on 31.07.2013.
3. MSWM project, Moradabad – Completed Completion of the project was delayed by 68 months reasons for which are discussed below: 1. Delay in nomination of executing agency: Project was sanctioned in November 2006 but
UPJN was nominated as executing agency in December 2007 which in turn decided that MSWM projects would be executed by its C&DS wing in March 2008.
2. Bids not responded: Bids for construction of MSW processing and disposal facilities were
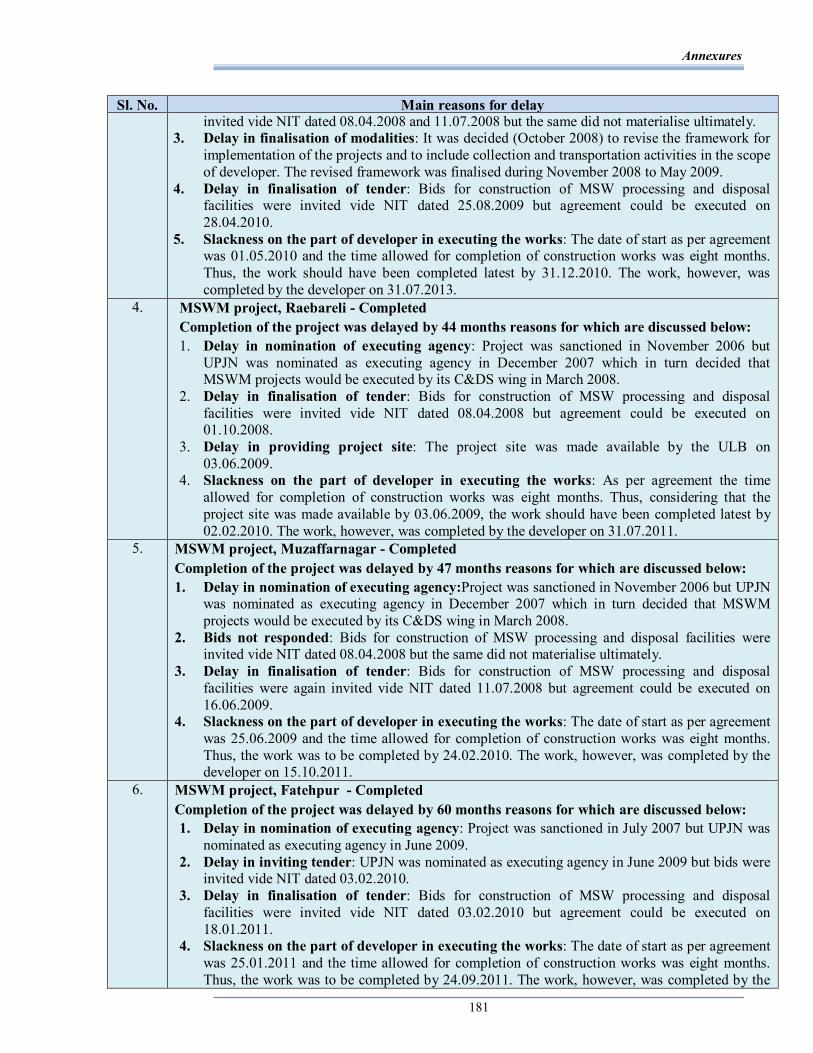
Annexures
181
Sl. No. Main reasons for delay invited vide NIT dated 08.04.2008 and 11.07.2008 but the same did not materialise ultimately.
3. Delay in finalisation of modalities: It was decided (October 2008) to revise the framework for implementation of the projects and to include collection and transportation activities in the scope of developer. The revised framework was finalised during November 2008 to May 2009.
4. Delay in finalisation of tender: Bids for construction of MSW processing and disposal facilities were invited vide NIT dated 25.08.2009 but agreement could be executed on 28.04.2010.
5. Slackness on the part of developer in executing the works: The date of start as per agreement was 01.05.2010 and the time allowed for completion of construction works was eight months. Thus, the work should have been completed latest by 31.12.2010. The work, however, was completed by the developer on 31.07.2013.
4. MSWM project, Raebareli - Completed Completion of the project was delayed by 44 months reasons for which are discussed below: 1. Delay in nomination of executing agency: Project was sanctioned in November 2006 but
UPJN was nominated as executing agency in December 2007 which in turn decided that MSWM projects would be executed by its C&DS wing in March 2008.
2. Delay in finalisation of tender: Bids for construction of MSW processing and disposal facilities were invited vide NIT dated 08.04.2008 but agreement could be executed on 01.10.2008.
3. Delay in providing project site: The project site was made available by the ULB on 03.06.2009.
4. Slackness on the part of developer in executing the works: As per agreement the time allowed for completion of construction works was eight months. Thus, considering that the project site was made available by 03.06.2009, the work should have been completed latest by 02.02.2010. The work, however, was completed by the developer on 31.07.2011.
5. MSWM project, Muzaffarnagar - Completed Completion of the project was delayed by 47 months reasons for which are discussed below: 1. Delay in nomination of executing agency:Project was sanctioned in November 2006 but UPJN
was nominated as executing agency in December 2007 which in turn decided that MSWM projects would be executed by its C&DS wing in March 2008.
2. Bids not responded: Bids for construction of MSW processing and disposal facilities were invited vide NIT dated 08.04.2008 but the same did not materialise ultimately.
3. Delay in finalisation of tender: Bids for construction of MSW processing and disposal facilities were again invited vide NIT dated 11.07.2008 but agreement could be executed on 16.06.2009.
4. Slackness on the part of developer in executing the works: The date of start as per agreement was 25.06.2009 and the time allowed for completion of construction works was eight months. Thus, the work was to be completed by 24.02.2010. The work, however, was completed by the developer on 15.10.2011.
6. MSWM project, Fatehpur - Completed Completion of the project was delayed by 60 months reasons for which are discussed below: 1. Delay in nomination of executing agency: Project was sanctioned in July 2007 but UPJN was
nominated as executing agency in June 2009. 2. Delay in inviting tender: UPJN was nominated as executing agency in June 2009 but bids were
invited vide NIT dated 03.02.2010. 3. Delay in finalisation of tender: Bids for construction of MSW processing and disposal
facilities were invited vide NIT dated 03.02.2010 but agreement could be executed on 18.01.2011.
4. Slackness on the part of developer in executing the works: The date of start as per agreement was 25.01.2011 and the time allowed for completion of construction works was eight months. Thus, the work was to be completed by 24.09.2011. The work, however, was completed by the

Audit Report on Public Sector Undertakings for the year ended 31 March 2016
182
Sl. No. Main reasons for delay developer on 31.07.2013.
7. MSWM project, Barabanki - Completed Completion of the project was delayed by 50 months reasons for which are discussed below: 1. Delay in nomination of executing agency: Project was sanctioned in July 2007 but UPJN was
nominated as executing agency in June 2009. 2. Delay in inviting tender: UPJN was nominated as executing agency in June 2009 but bids were
invited vide NIT dated 03.02.2010. 3. Bids not responded: Bids for construction of MSW processing and disposal facilities were
invited vide NIT dated 03.02.2010 but the same did not materialise ultimately. 4. Delay in finalisation of tender: Bids for construction of MSW processing and disposal
facilities were again invited vide NIT dated 28.10.2010 but agreement could be executed on 07.05.2011.
5. Slackness on the part of developer in executing the works: The date of start as per agreement was 25.04.2011 and the time allowed for completion of construction works was eight months. Thus, the work was to be completed by 24.12.2011. The work, however, was completed by the developer on 30.09.2012.
8. MSWM project, Etawah – Completed Completion of the project was delayed by 59 months reasons for which are discussed below: 1. Delay in nomination of executing agency: Project was sanctioned in November 2006 but
UPJN was nominated as executing agency in December 2007 which in turn decided that MSWM projects would be executed by its C&DS wing in March 2008.
2. Delay in finalisation of tender: Bids for construction of MSW processing and disposal facilities were invited vide NIT dated 08.04.2008 but agreement could be executed on 01.10.2008.
3. Delay in providing project site: The project site was made available by the ULB on 29.03.2010.
4. Slackness on the part of developer in executing the works:The revised date of start as per agreement was 11.08.2010 and the time allowed for completion of construction works was eight months. Thus, the work was to be completed by 10.04.2011. The work, however, was completed by the developer on 31.10.2012.
9. MSWM project, Lucknow – Incomplete and work-in-progress
Completion of the project was delayed by 96 months reasons for which are discussed below:
1. Delay in nomination of executing agency: Project was sanctioned in March 2007 but UPJN was nominated as executing agency in December 2007 which in turn decided that MSWM projects would be executed by its C&DS wing in March 2008.
2. Bids not responded: Bids for construction of MSW processing and disposal facilities were invited vide NIT dated 11.07.2008 but the same did not materialise ultimately.
3. Delay in finalisation of modalities: It was decided (October 2008) to revise the framework for implementation of the projects and to include collection and transportation activities in the scope of developer. The revised framework was finalised during November 2008 to May 2009.
4. Delay in finalisation of tender: Bids for construction of MSW processing and disposal facilities were invited vide NIT dated 25.08.2009 but agreement could be executed on 23.10.2010.
5. Delay in providing project site: The project site was made available during 08.04.2011 to 13.06.2013.
6. Slackness on the part of developer in executing the works: As per agreement the time allowed for completion of construction works was eight months. Thus, considering that the project site was made available by 13.06.2013 the work should have been completed latest by 12.02.2014. The work, however, was still under progress and the same was lying incomplete.
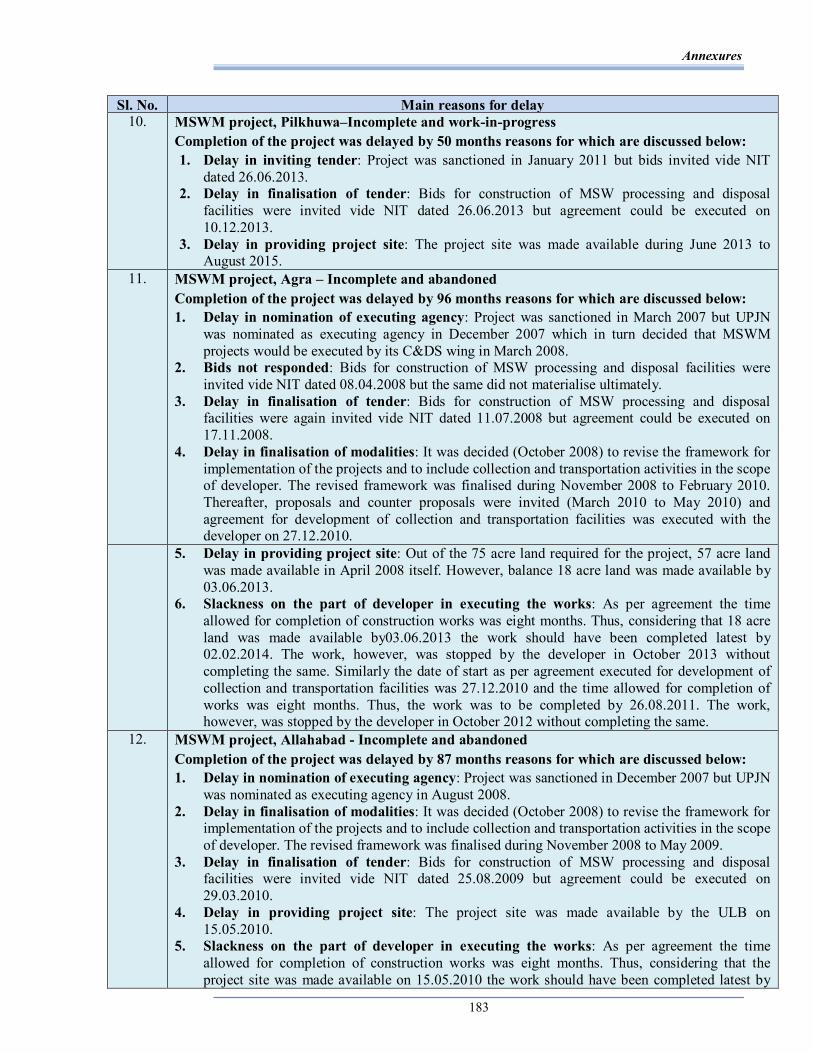
Annexures
183
Sl. No. Main reasons for delay 10. MSWM project, Pilkhuwa–Incomplete and work-in-progress
Completion of the project was delayed by 50 months reasons for which are discussed below: 1. Delay in inviting tender: Project was sanctioned in January 2011 but bids invited vide NIT
dated 26.06.2013. 2. Delay in finalisation of tender: Bids for construction of MSW processing and disposal
facilities were invited vide NIT dated 26.06.2013 but agreement could be executed on 10.12.2013.
3. Delay in providing project site: The project site was made available during June 2013 to August 2015.
11. MSWM project, Agra – Incomplete and abandoned Completion of the project was delayed by 96 months reasons for which are discussed below: 1. Delay in nomination of executing agency: Project was sanctioned in March 2007 but UPJN
was nominated as executing agency in December 2007 which in turn decided that MSWM projects would be executed by its C&DS wing in March 2008.
2. Bids not responded: Bids for construction of MSW processing and disposal facilities were invited vide NIT dated 08.04.2008 but the same did not materialise ultimately.
3. Delay in finalisation of tender: Bids for construction of MSW processing and disposal facilities were again invited vide NIT dated 11.07.2008 but agreement could be executed on 17.11.2008.
4. Delay in finalisation of modalities: It was decided (October 2008) to revise the framework for implementation of the projects and to include collection and transportation activities in the scope of developer. The revised framework was finalised during November 2008 to February 2010. Thereafter, proposals and counter proposals were invited (March 2010 to May 2010) and agreement for development of collection and transportation facilities was executed with the developer on 27.12.2010.
5. Delay in providing project site: Out of the 75 acre land required for the project, 57 acre land was made available in April 2008 itself. However, balance 18 acre land was made available by 03.06.2013.
6. Slackness on the part of developer in executing the works: As per agreement the time allowed for completion of construction works was eight months. Thus, considering that 18 acre land was made available by03.06.2013 the work should have been completed latest by 02.02.2014. The work, however, was stopped by the developer in October 2013 without completing the same. Similarly the date of start as per agreement executed for development of collection and transportation facilities was 27.12.2010 and the time allowed for completion of works was eight months. Thus, the work was to be completed by 26.08.2011. The work, however, was stopped by the developer in October 2012 without completing the same.
12. MSWM project, Allahabad - Incomplete and abandoned Completion of the project was delayed by 87 months reasons for which are discussed below: 1. Delay in nomination of executing agency: Project was sanctioned in December 2007 but UPJN
was nominated as executing agency in August 2008. 2. Delay in finalisation of modalities: It was decided (October 2008) to revise the framework for
implementation of the projects and to include collection and transportation activities in the scope of developer. The revised framework was finalised during November 2008 to May 2009.
3. Delay in finalisation of tender: Bids for construction of MSW processing and disposal facilities were invited vide NIT dated 25.08.2009 but agreement could be executed on 29.03.2010.
4. Delay in providing project site: The project site was made available by the ULB on 15.05.2010.
5. Slackness on the part of developer in executing the works: As per agreement the time allowed for completion of construction works was eight months. Thus, considering that the project site was made available on 15.05.2010 the work should have been completed latest by
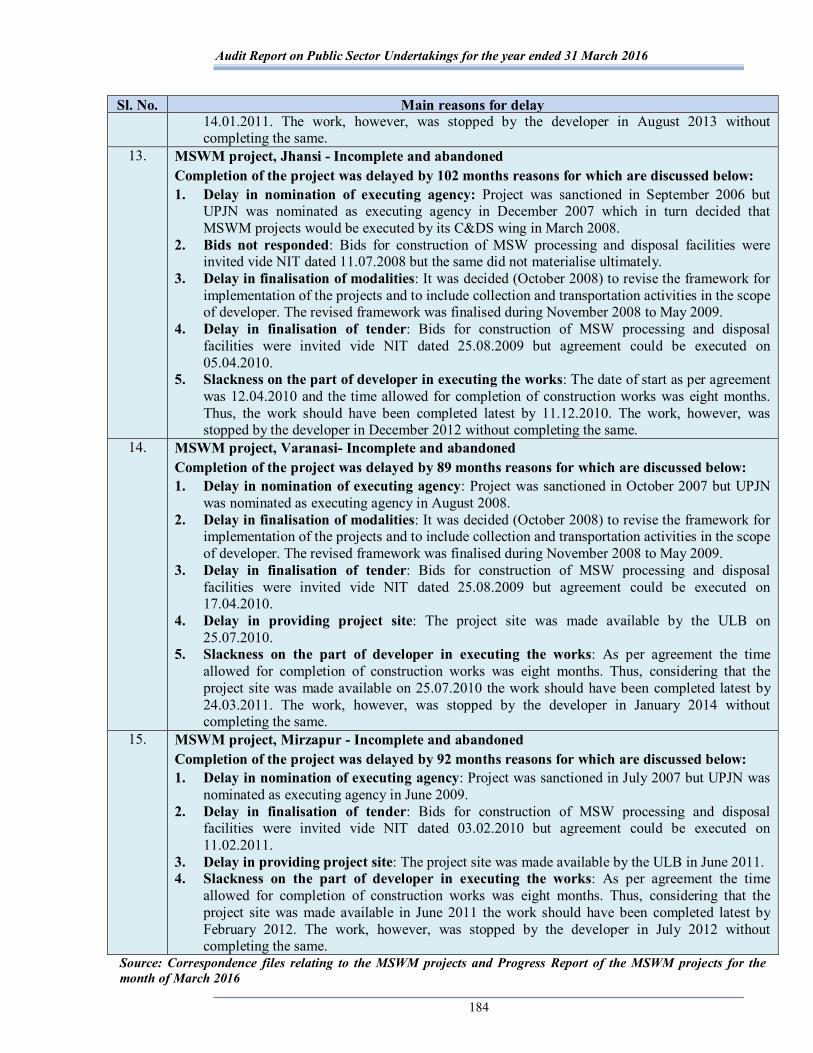
Audit Report on Public Sector Undertakings for the year ended 31 March 2016
184
Sl. No. Main reasons for delay 14.01.2011. The work, however, was stopped by the developer in August 2013 without completing the same.
13. MSWM project, Jhansi - Incomplete and abandoned Completion of the project was delayed by 102 months reasons for which are discussed below: 1. Delay in nomination of executing agency: Project was sanctioned in September 2006 but
UPJN was nominated as executing agency in December 2007 which in turn decided that MSWM projects would be executed by its C&DS wing in March 2008.
2. Bids not responded: Bids for construction of MSW processing and disposal facilities were invited vide NIT dated 11.07.2008 but the same did not materialise ultimately.
3. Delay in finalisation of modalities: It was decided (October 2008) to revise the framework for implementation of the projects and to include collection and transportation activities in the scope of developer. The revised framework was finalised during November 2008 to May 2009.
4. Delay in finalisation of tender: Bids for construction of MSW processing and disposal facilities were invited vide NIT dated 25.08.2009 but agreement could be executed on 05.04.2010.
5. Slackness on the part of developer in executing the works: The date of start as per agreement was 12.04.2010 and the time allowed for completion of construction works was eight months. Thus, the work should have been completed latest by 11.12.2010. The work, however, was stopped by the developer in December 2012 without completing the same.
14. MSWM project, Varanasi- Incomplete and abandoned Completion of the project was delayed by 89 months reasons for which are discussed below: 1. Delay in nomination of executing agency: Project was sanctioned in October 2007 but UPJN
was nominated as executing agency in August 2008. 2. Delay in finalisation of modalities: It was decided (October 2008) to revise the framework for
implementation of the projects and to include collection and transportation activities in the scope of developer. The revised framework was finalised during November 2008 to May 2009.
3. Delay in finalisation of tender: Bids for construction of MSW processing and disposal facilities were invited vide NIT dated 25.08.2009 but agreement could be executed on 17.04.2010.
4. Delay in providing project site: The project site was made available by the ULB on 25.07.2010.
5. Slackness on the part of developer in executing the works: As per agreement the time allowed for completion of construction works was eight months. Thus, considering that the project site was made available on 25.07.2010 the work should have been completed latest by 24.03.2011. The work, however, was stopped by the developer in January 2014 without completing the same.
15. MSWM project, Mirzapur - Incomplete and abandoned Completion of the project was delayed by 92 months reasons for which are discussed below: 1. Delay in nomination of executing agency: Project was sanctioned in July 2007 but UPJN was
nominated as executing agency in June 2009. 2. Delay in finalisation of tender: Bids for construction of MSW processing and disposal
facilities were invited vide NIT dated 03.02.2010 but agreement could be executed on 11.02.2011.
3. Delay in providing project site: The project site was made available by the ULB in June 2011. 4. Slackness on the part of developer in executing the works: As per agreement the time
allowed for completion of construction works was eight months. Thus, considering that the project site was made available in June 2011 the work should have been completed latest by February 2012. The work, however, was stopped by the developer in July 2012 without completing the same.
Source: Correspondence files relating to the MSWM projects and Progress Report of the MSWM projects for the month of March 2016
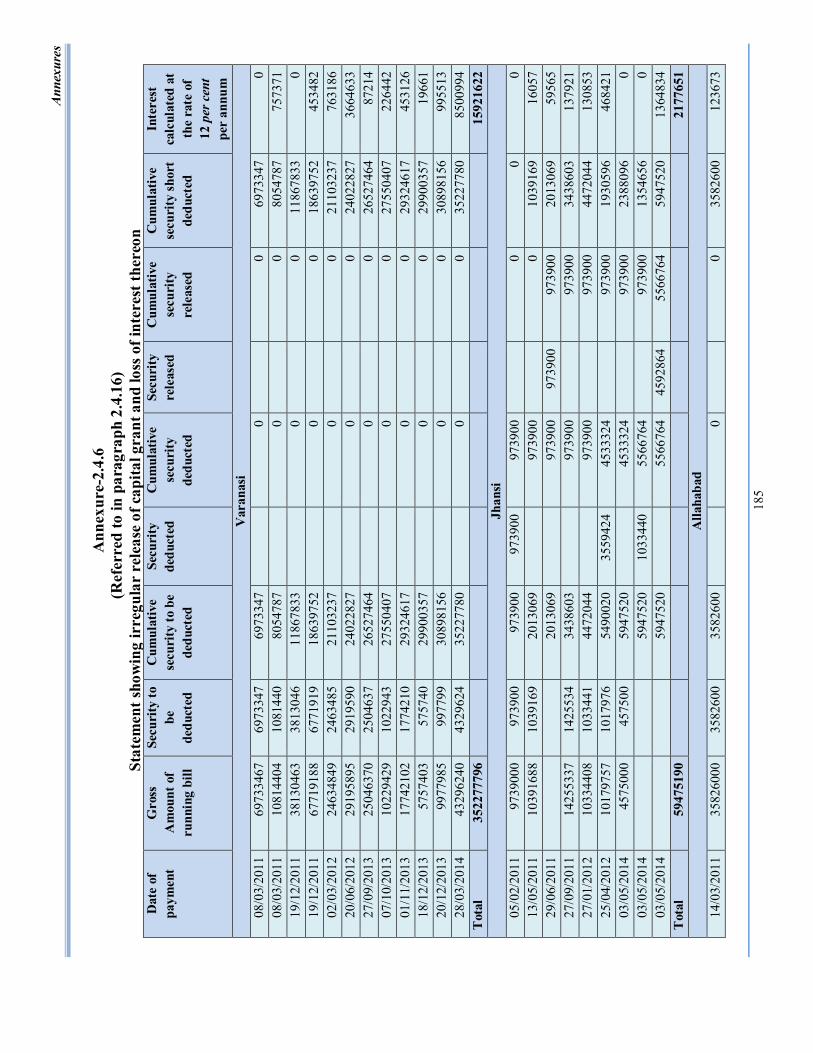
Ann
exur
es
185
Ann
exur
e-2.
4.6
(Ref
erre
d to
in p
arag
raph
2.4
.16)
St
atem
ent s
how
ing
irre
gula
r re
leas
e of
cap
ital g
rant
and
loss
of i
nter
est t
here
on
Dat
e of
pa
ymen
t G
ross
A
mou
nt o
f ru
nnin
g bi
ll
Secu
rity
to
be
dedu
cted
Cum
ulat
ive
secu
rity
to b
e de
duct
ed
Secu
rity
de
duct
ed
Cum
ulat
ive
secu
rity
de
duct
ed
Secu
rity
re
leas
ed
Cum
ulat
ive
secu
rity
re
leas
ed
Cum
ulat
ive
secu
rity
sho
rt
dedu
cted
Inte
rest
ca
lcul
ated
at
the
rate
of
12 p
er c
ent
per
annu
m
Var
anas
i 08
/03/
2011
69
7334
67
6973
347
6973
347
0
0
6973
347
0 08
/03/
2011
10
8144
04
1081
440
8054
787
0
0
8054
787
7573
71
19/1
2/20
11
3813
0463
38
1304
6 11
8678
33
0
0
1186
7833
0
19/1
2/20
11
6771
9188
67
7191
9 18
6397
52
0
0
1863
9752
45
3482
02
/03/
2012
24
6348
49
2463
485
2110
3237
0
0 21
1032
37
7631
86
20/0
6/20
12
2919
5895
29
1959
0 24
0228
27
0
0
2402
2827
36
6463
3 27
/09/
2013
25
0463
70
2504
637
2652
7464
0
0 26
5274
64
8721
4 07
/10/
2013
10
2294
29
1022
943
2755
0407
0
0 27
5504
07
2264
42
01/1
1/20
13
1774
2102
17
7421
0 29
3246
17
0
0
2932
4617
45
3126
18
/12/
2013
57
5740
3 57
5740
29
9003
57
0
0
2990
0357
19
661
20/1
2/20
13
9977
985
9977
99
3089
8156
0
0 30
8981
56
9955
13
28/0
3/20
14
4329
6240
43
2962
4 35
2277
80
0
0
3522
7780
85
0099
4 T
otal
35
2277
796
15
9216
22
Jhan
si
05/0
2/20
11
9739
000
9739
00
9739
00
9739
00
9739
00
0
0 0
13/0
5/20
11
1039
1688
10
3916
9 20
1306
9
9739
00
0
1039
169
1605
7 29
/06/
2011
20
1306
9
9739
00
9739
00
9739
00
2013
069
5956
5 27
/09/
2011
14
2553
37
1425
534
3438
603
97
3900
9739
00
3438
603
1379
21
27/0
1/20
12
1033
4408
10
3344
1 44
7204
4
9739
00
97
3900
44
7204
4 13
0853
25
/04/
2012
10
1797
57
1017
976
5490
020
3559
424
4533
324
97
3900
19
3059
6 46
8421
03
/05/
2014
45
7500
0 45
7500
59
4752
0
4533
324
97
3900
23
8809
6 0
03/0
5/20
14
5947
520
1033
440
5566
764
97
3900
13
5465
6 0
03/0
5/20
14
5947
520
55
6676
4 45
9286
4 55
6676
4 59
4752
0 13
6483
4 T
otal
59
4751
90
21
7765
1 A
llaha
bad
14/0
3/20
11
3582
6000
35
8260
0 35
8260
0
0
0 35
8260
0 12
3673
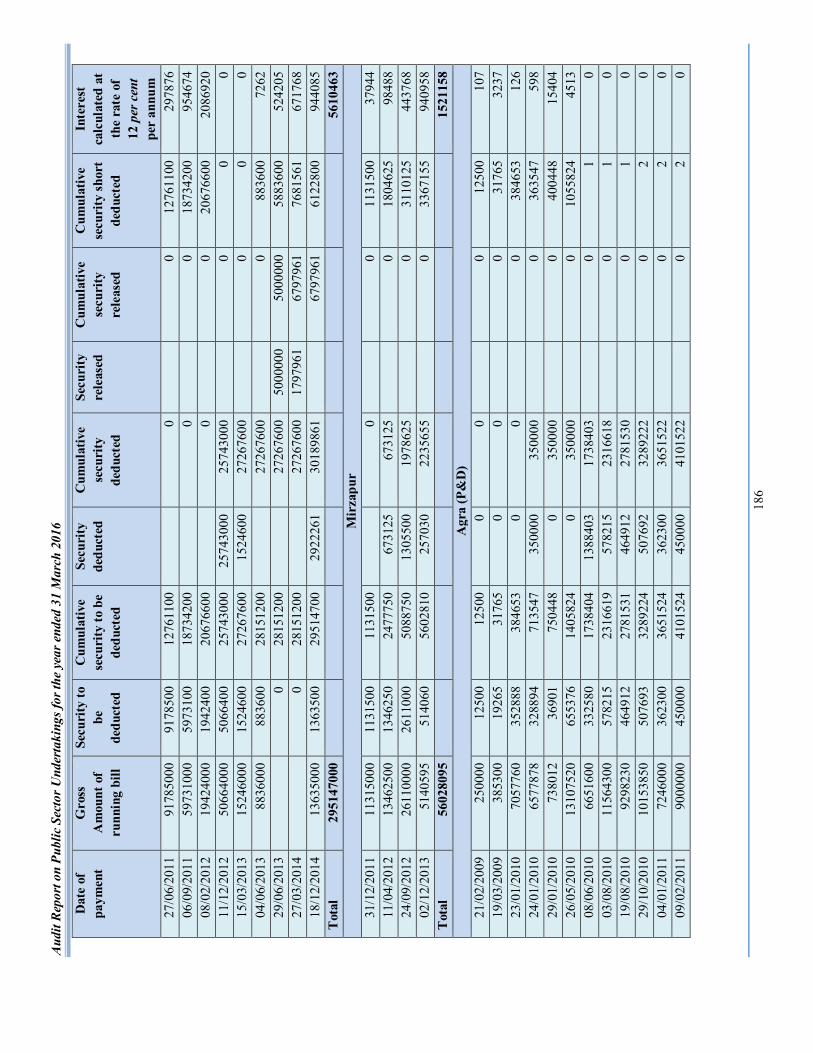
Aud
it R
epor
t on
Publ
ic S
ecto
r Und
erta
king
s for
the
year
end
ed 3
1 M
arch
201
6
186
Dat
e of
pa
ymen
t G
ross
A
mou
nt o
f ru
nnin
g bi
ll
Secu
rity
to
be
dedu
cted
Cum
ulat
ive
secu
rity
to b
e de
duct
ed
Secu
rity
de
duct
ed
Cum
ulat
ive
secu
rity
de
duct
ed
Secu
rity
re
leas
ed
Cum
ulat
ive
secu
rity
re
leas
ed
Cum
ulat
ive
secu
rity
sho
rt
dedu
cted
Inte
rest
ca
lcul
ated
at
the
rate
of
12 p
er c
ent
per
annu
m
27/0
6/20
11
9178
5000
91
7850
0 12
7611
00
0
0
1276
1100
29
7876
06
/09/
2011
59
7310
00
5973
100
1873
4200
0
0 18
7342
00
9546
74
08/0
2/20
12
1942
4000
19
4240
0 20
6766
00
0
0
2067
6600
20
8692
0 11
/12/
2012
50
6640
00
5066
400
2574
3000
25
7430
00
2574
3000
0 0
0 15
/03/
2013
15
2460
00
1524
600
2726
7600
15
2460
0 27
2676
00
0
0 0
04/0
6/20
13
8836
000
8836
00
2815
1200
2726
7600
0 88
3600
72
62
29/0
6/20
13
0
2815
1200
2726
7600
50
0000
0 50
0000
0 58
8360
0 52
4205
27
/03/
2014
0 28
1512
00
27
2676
00
1797
961
6797
961
7681
561
6717
68
18/1
2/20
14
1363
5000
13
6350
0 29
5147
00
2922
261
3018
9861
6797
961
6122
800
9440
85
Tot
al
2951
4700
0
5610
463
Mir
zapu
r 31
/12/
2011
11
3150
00
1131
500
1131
500
0
0
1131
500
3794
4 11
/04/
2012
13
4625
00
1346
250
2477
750
6731
25
6731
25
0
1804
625
9848
8 24
/09/
2012
26
1100
00
2611
000
5088
750
1305
500
1978
625
0
3110
125
4437
68
02/1
2/20
13
5140
595
5140
60
5602
810
2570
30
2235
655
0
3367
155
9409
58
Tot
al
5602
8095
1521
158
Agr
a (P
&D
) 21
/02/
2009
25
0000
12
500
1250
0 0
0
0 12
500
107
19/0
3/20
09
3853
00
1926
5 31
765
0 0
0
3176
5 32
37
23/0
1/20
10
7057
760
3528
88
3846
53
0 0
0
3846
53
126
24/0
1/20
10
6577
878
3288
94
7135
47
3500
00
3500
00
0
3635
47
598
29/0
1/20
10
7380
12
3690
1 75
0448
0
3500
00
0
4004
48
1540
4 26
/05/
2010
13
1075
20
6553
76
1405
824
0 35
0000
0 10
5582
4 45
13
08/0
6/20
10
6651
600
3325
80
1738
404
1388
403
1738
403
0
1 0
03/0
8/20
10
1156
4300
57
8215
23
1661
9 57
8215
23
1661
8
0 1
0 19
/08/
2010
92
9823
0 46
4912
27
8153
1 46
4912
27
8153
0
0 1
0 29
/10/
2010
10
1538
50
5076
93
3289
224
5076
92
3289
222
0
2 0
04/0
1/20
11
7246
000
3623
00
3651
524
3623
00
3651
522
0
2 0
09/0
2/20
11
9000
000
4500
00
4101
524
4500
00
4101
522
0
2 0
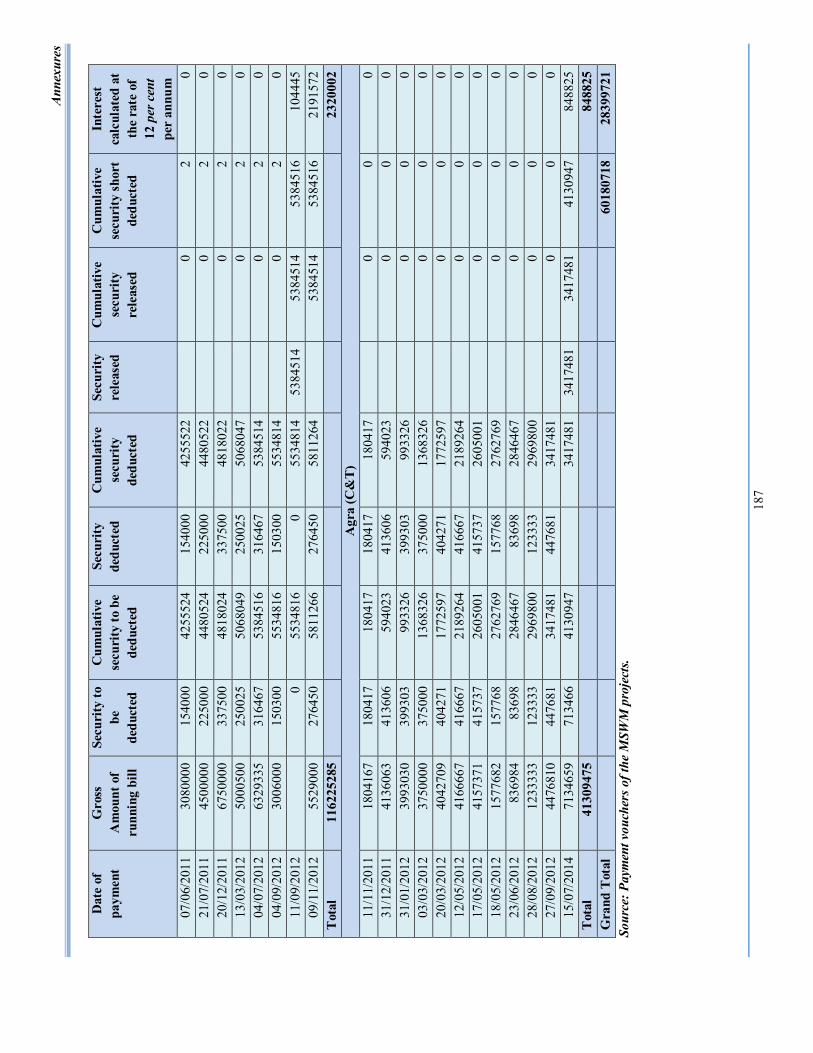
Ann
exur
es
187
Dat
e of
pa
ymen
t G
ross
A
mou
nt o
f ru
nnin
g bi
ll
Secu
rity
to
be
dedu
cted
Cum
ulat
ive
secu
rity
to b
e de
duct
ed
Secu
rity
de
duct
ed
Cum
ulat
ive
secu
rity
de
duct
ed
Secu
rity
re
leas
ed
Cum
ulat
ive
secu
rity
re
leas
ed
Cum
ulat
ive
secu
rity
sho
rt
dedu
cted
Inte
rest
ca
lcul
ated
at
the
rate
of
12 p
er c
ent
per
annu
m
07/0
6/20
11
3080
000
1540
00
4255
524
1540
00
4255
522
0
2 0
21/0
7/20
11
4500
000
2250
00
4480
524
2250
00
4480
522
0
2 0
20/1
2/20
11
6750
000
3375
00
4818
024
3375
00
4818
022
0
2 0
13/0
3/20
12
5000
500
2500
25
5068
049
2500
25
5068
047
0
2 0
04/0
7/20
12
6329
335
3164
67
5384
516
3164
67
5384
514
0
2 0
04/0
9/20
12
3006
000
1503
00
5534
816
1503
00
5534
814
0
2 0
11/0
9/20
12
0
5534
816
0 55
3481
4 53
8451
4 53
8451
4 53
8451
6 10
4445
09
/11/
2012
55
2900
0 27
6450
58
1126
6 27
6450
58
1126
4
5384
514
5384
516
2191
572
Tot
al
1162
2528
5
2320
002
Agr
a (C
&T
) 11
/11/
2011
18
0416
7 18
0417
18
0417
18
0417
18
0417
0 0
0 31
/12/
2011
41
3606
3 41
3606
59
4023
41
3606
59
4023
0 0
0 31
/01/
2012
39
9303
0 39
9303
99
3326
39
9303
99
3326
0 0
0 03
/03/
2012
37
5000
0 37
5000
13
6832
6 37
5000
13
6832
6
0 0
0 20
/03/
2012
40
4270
9 40
4271
17
7259
7 40
4271
17
7259
7
0 0
0 12
/05/
2012
41
6666
7 41
6667
21
8926
4 41
6667
21
8926
4
0 0
0 17
/05/
2012
41
5737
1 41
5737
26
0500
1 41
5737
26
0500
1
0 0
0 18
/05/
2012
15
7768
2 15
7768
27
6276
9 15
7768
27
6276
9
0 0
0 23
/06/
2012
83
6984
83
698
2846
467
8369
8 28
4646
7
0 0
0 28
/08/
2012
12
3333
3 12
3333
29
6980
0 12
3333
29
6980
0
0 0
0 27
/09/
2012
44
7681
0 44
7681
34
1748
1 44
7681
34
1748
1
0 0
0 15
/07/
2014
71
3465
9 71
3466
41
3094
7
3417
481
3417
481
3417
481
4130
947
8488
25
Tot
al
4130
9475
8488
25
Gra
nd T
otal
6018
0718
28
3997
21
Sour
ce: P
aym
ent v
ouch
ers o
f the
MSW
M p
roje
cts.
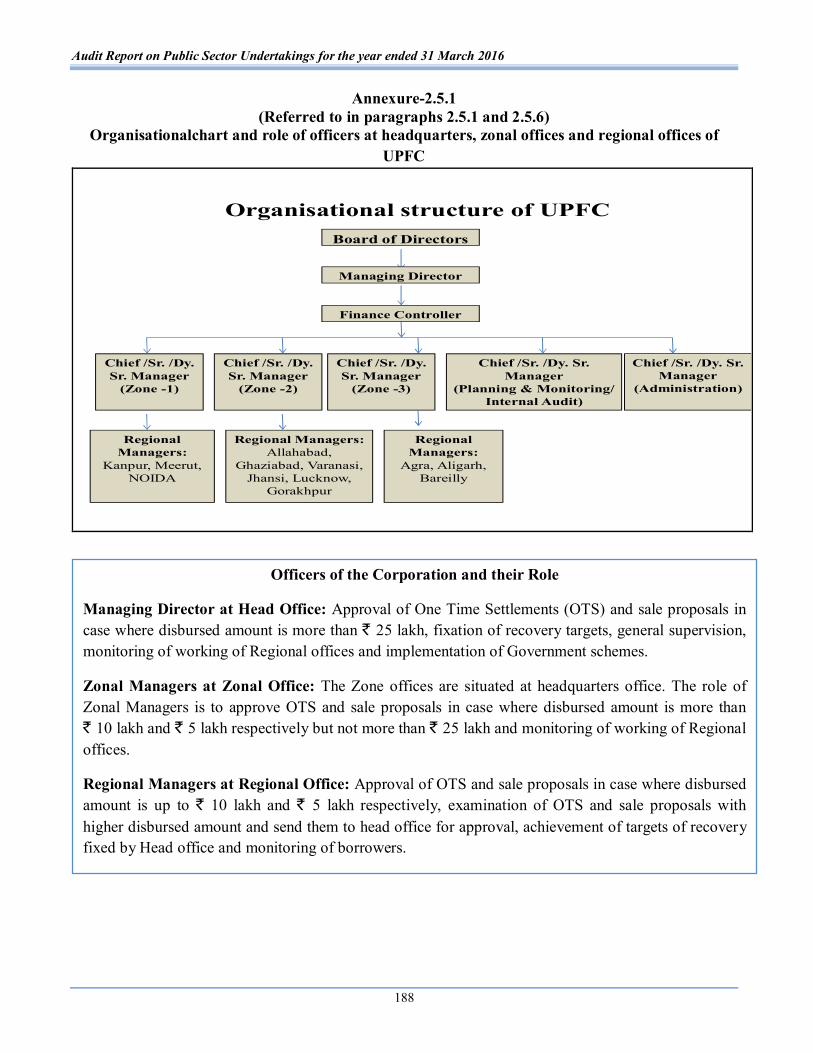
Audit Report on Public Sector Undertakings for the year ended 31 March 2016
188
Annexure-2.5.1
(Referred to in paragraphs 2.5.1 and 2.5.6) Organisationalchart and role of officers at headquarters, zonal offices and regional offices of
UPFC
Organisational structure of UPFCBoard of Directors
Managing Director
Chief /Sr. /Dy. Sr. Manager
(Zone -1)
Regional Managers:
Kanpur, Meerut, NOIDA
Regional Managers:
Agra, Aligarh, Bareilly
Chief /Sr. /Dy. Sr. Manager
(Zone -2)
Chief /Sr. /Dy. Sr. Manager
(Zone -3)
Chief /Sr. /Dy. Sr. Manager
(Planning & Monitoring/ Internal Audit)
Chief /Sr. /Dy. Sr. Manager
(Administration)
Finance Controller
Regional Managers:Allahabad,
Ghaziabad, Varanasi, Jhansi, Lucknow,
Gorakhpur
Officers of the Corporation and their Role
Managing Director at Head Office: Approval of One Time Settlements (OTS) and sale proposals in case where disbursed amount is more than ` 25 lakh, fixation of recovery targets, general supervision, monitoring of working of Regional offices and implementation of Government schemes.
Zonal Managers at Zonal Office: The Zone offices are situated at headquarters office. The role of Zonal Managers is to approve OTS and sale proposals in case where disbursed amount is more than ` 10 lakh and ` 5 lakh respectively but not more than ` 25 lakh and monitoring of working of Regional offices.
Regional Managers at Regional Office: Approval of OTS and sale proposals in case where disbursed amount is up to ` 10 lakh and ` 5 lakh respectively, examination of OTS and sale proposals with higher disbursed amount and send them to head office for approval, achievement of targets of recovery fixed by Head office and monitoring of borrowers.
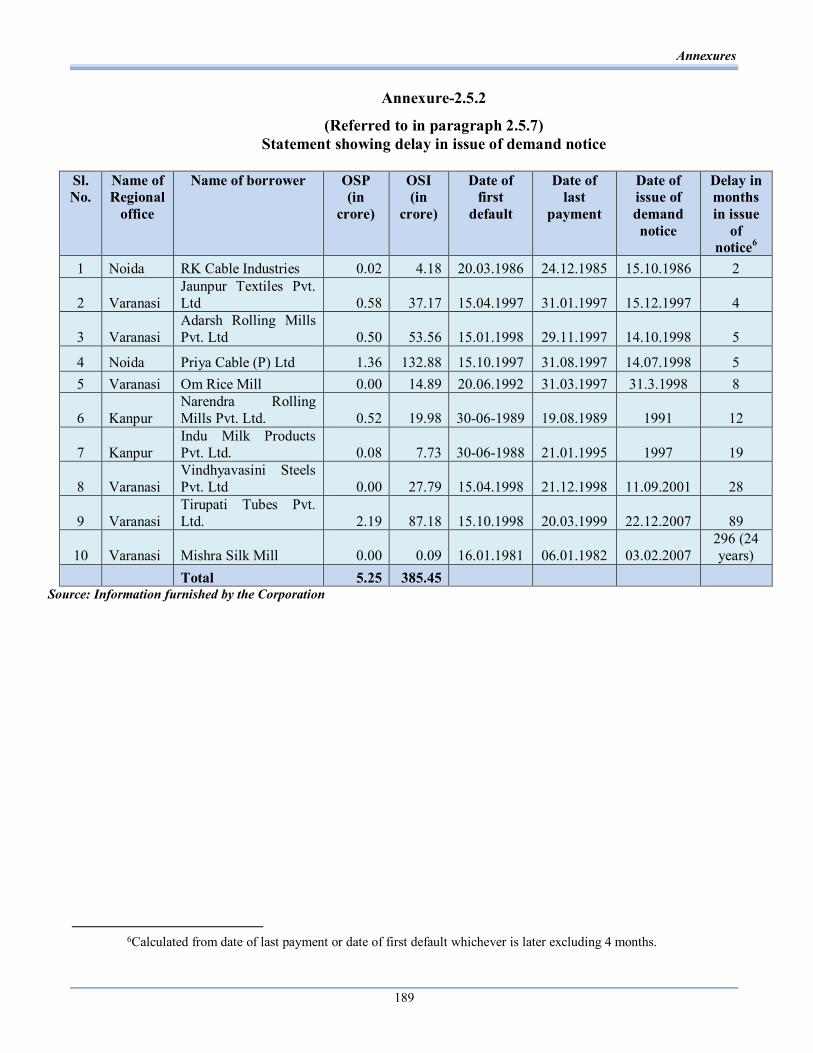
Annexures
189
Annexure-2.5.2
(Referred to in paragraph 2.5.7) Statement showing delay in issue of demand notice
Sl. No.
Name of Regional
office
Name of borrower OSP (in
crore)
OSI (in
crore)
Date of first
default
Date of last
payment
Date of issue of demand notice
Delay in months in issue
of notice6
1 Noida RK Cable Industries 0.02 4.18 20.03.1986 24.12.1985 15.10.1986 2
2 Varanasi Jaunpur Textiles Pvt. Ltd 0.58 37.17 15.04.1997 31.01.1997 15.12.1997 4
3 Varanasi Adarsh Rolling Mills Pvt. Ltd 0.50 53.56 15.01.1998 29.11.1997 14.10.1998 5
4 Noida Priya Cable (P) Ltd 1.36 132.88 15.10.1997 31.08.1997 14.07.1998 5 5 Varanasi Om Rice Mill 0.00 14.89 20.06.1992 31.03.1997 31.3.1998 8
6 Kanpur Narendra Rolling Mills Pvt. Ltd. 0.52 19.98 30-06-1989 19.08.1989 1991 12
7 Kanpur Indu Milk Products Pvt. Ltd. 0.08 7.73 30-06-1988 21.01.1995 1997 19
8 Varanasi Vindhyavasini Steels Pvt. Ltd 0.00 27.79 15.04.1998 21.12.1998 11.09.2001 28
9 Varanasi Tirupati Tubes Pvt. Ltd. 2.19 87.18 15.10.1998 20.03.1999 22.12.2007 89
10 Varanasi Mishra Silk Mill 0.00 0.09 16.01.1981 06.01.1982 03.02.2007 296 (24 years)
Total 5.25 385.45 Source: Information furnished by the Corporation
6Calculated from date of last payment or date of first default whichever is later excluding 4 months.
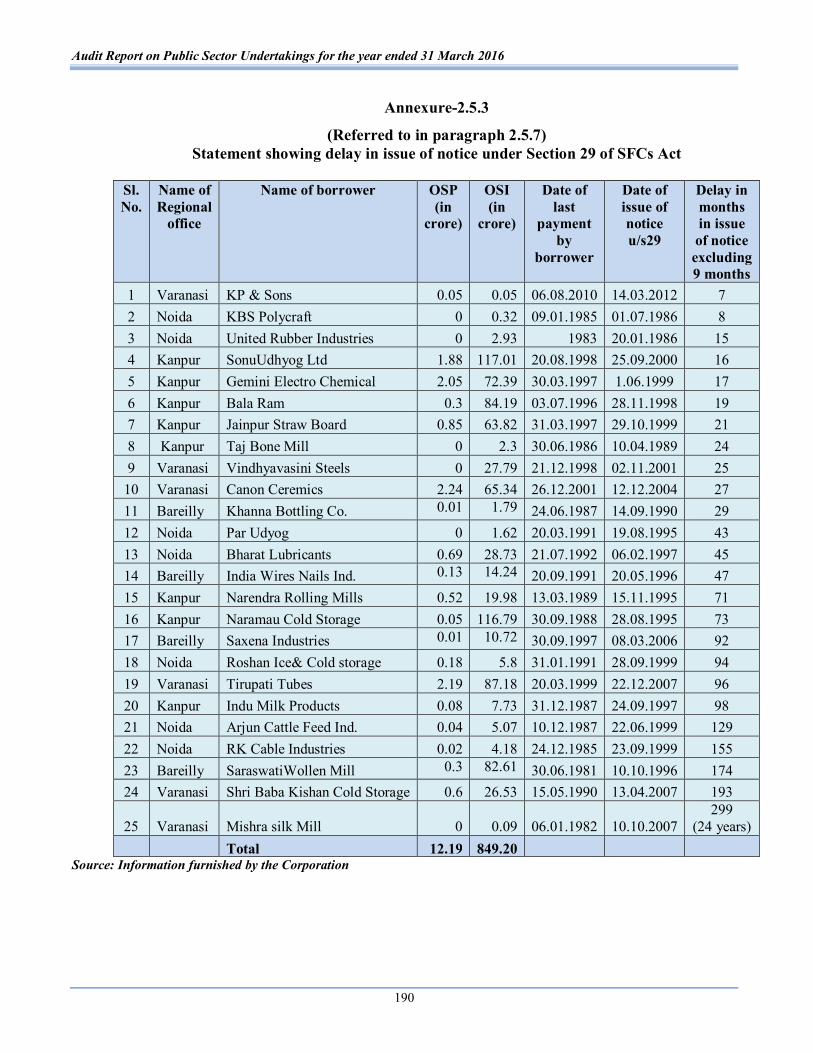
Audit Report on Public Sector Undertakings for the year ended 31 March 2016
190
Annexure-2.5.3
(Referred to in paragraph 2.5.7) Statement showing delay in issue of notice under Section 29 of SFCs Act
Sl. No.
Name of Regional
office
Name of borrower OSP (in
crore)
OSI (in
crore)
Date of last
payment by
borrower
Date of issue of notice u/s29
Delay in months in issue of notice excluding 9 months
1 Varanasi KP & Sons 0.05 0.05 06.08.2010 14.03.2012 7 2 Noida KBS Polycraft 0 0.32 09.01.1985 01.07.1986 8 3 Noida United Rubber Industries 0 2.93 1983 20.01.1986 15 4 Kanpur SonuUdhyog Ltd 1.88 117.01 20.08.1998 25.09.2000 16 5 Kanpur Gemini Electro Chemical 2.05 72.39 30.03.1997 1.06.1999 17 6 Kanpur Bala Ram 0.3 84.19 03.07.1996 28.11.1998 19 7 Kanpur Jainpur Straw Board 0.85 63.82 31.03.1997 29.10.1999 21 8 Kanpur Taj Bone Mill 0 2.3 30.06.1986 10.04.1989 24 9 Varanasi Vindhyavasini Steels 0 27.79 21.12.1998 02.11.2001 25
10 Varanasi Canon Ceremics 2.24 65.34 26.12.2001 12.12.2004 27 11 Bareilly Khanna Bottling Co. 0.01 1.79 24.06.1987 14.09.1990 29 12 Noida Par Udyog 0 1.62 20.03.1991 19.08.1995 43 13 Noida Bharat Lubricants 0.69 28.73 21.07.1992 06.02.1997 45 14 Bareilly India Wires Nails Ind. 0.13 14.24 20.09.1991 20.05.1996 47 15 Kanpur Narendra Rolling Mills 0.52 19.98 13.03.1989 15.11.1995 71 16 Kanpur Naramau Cold Storage 0.05 116.79 30.09.1988 28.08.1995 73 17 Bareilly Saxena Industries 0.01 10.72 30.09.1997 08.03.2006 92 18 Noida Roshan Ice& Cold storage 0.18 5.8 31.01.1991 28.09.1999 94 19 Varanasi Tirupati Tubes 2.19 87.18 20.03.1999 22.12.2007 96 20 Kanpur Indu Milk Products 0.08 7.73 31.12.1987 24.09.1997 98 21 Noida Arjun Cattle Feed Ind. 0.04 5.07 10.12.1987 22.06.1999 129 22 Noida RK Cable Industries 0.02 4.18 24.12.1985 23.09.1999 155 23 Bareilly SaraswatiWollen Mill 0.3 82.61 30.06.1981 10.10.1996 174 24 Varanasi Shri Baba Kishan Cold Storage 0.6 26.53 15.05.1990 13.04.2007 193
25 Varanasi Mishra silk Mill 0 0.09 06.01.1982 10.10.2007 299
(24 years) Total 12.19 849.20
Source: Information furnished by the Corporation
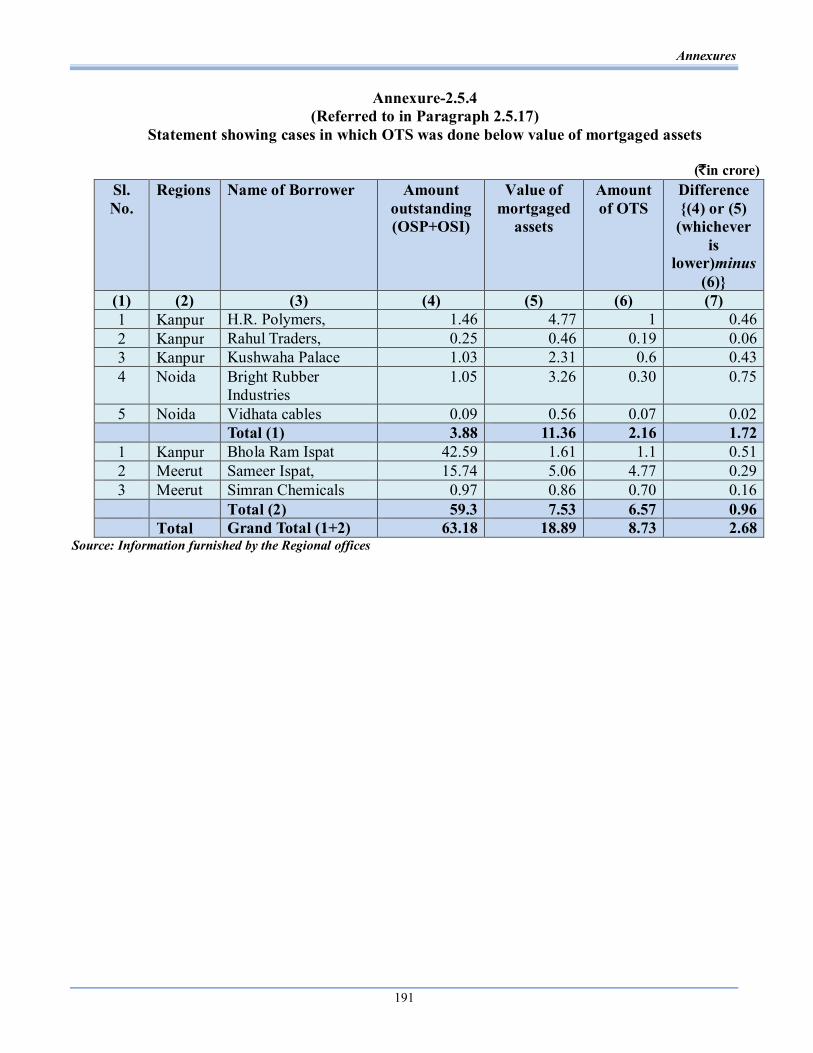
Annexures
191
Annexure-2.5.4 (Referred to in Paragraph 2.5.17)
Statement showing cases in which OTS was done below value of mortgaged assets
(`in crore)
Source: Information furnished by the Regional offices
Sl. No.
Regions
Name of Borrower
Amount outstanding (OSP+OSI)
Value of mortgaged
assets
Amount of OTS
Difference {(4) or (5)
(whichever is
lower)minus (6)}
(1) (2) (3) (4) (5) (6) (7) 1 Kanpur H.R. Polymers, 1.46 4.77 1 0.46 2 Kanpur Rahul Traders, 0.25 0.46 0.19 0.06 3 Kanpur Kushwaha Palace 1.03 2.31 0.6 0.43 4 Noida Bright Rubber
Industries 1.05 3.26 0.30 0.75
5 Noida Vidhata cables 0.09 0.56 0.07 0.02 Total (1) 3.88 11.36 2.16 1.72 1 Kanpur Bhola Ram Ispat 42.59 1.61 1.1 0.51 2 Meerut Sameer Ispat, 15.74 5.06 4.77 0.29 3 Meerut Simran Chemicals 0.97 0.86 0.70 0.16 Total (2) 59.3 7.53 6.57 0.96 Total Grand Total (1+2) 63.18 18.89 8.73 2.68
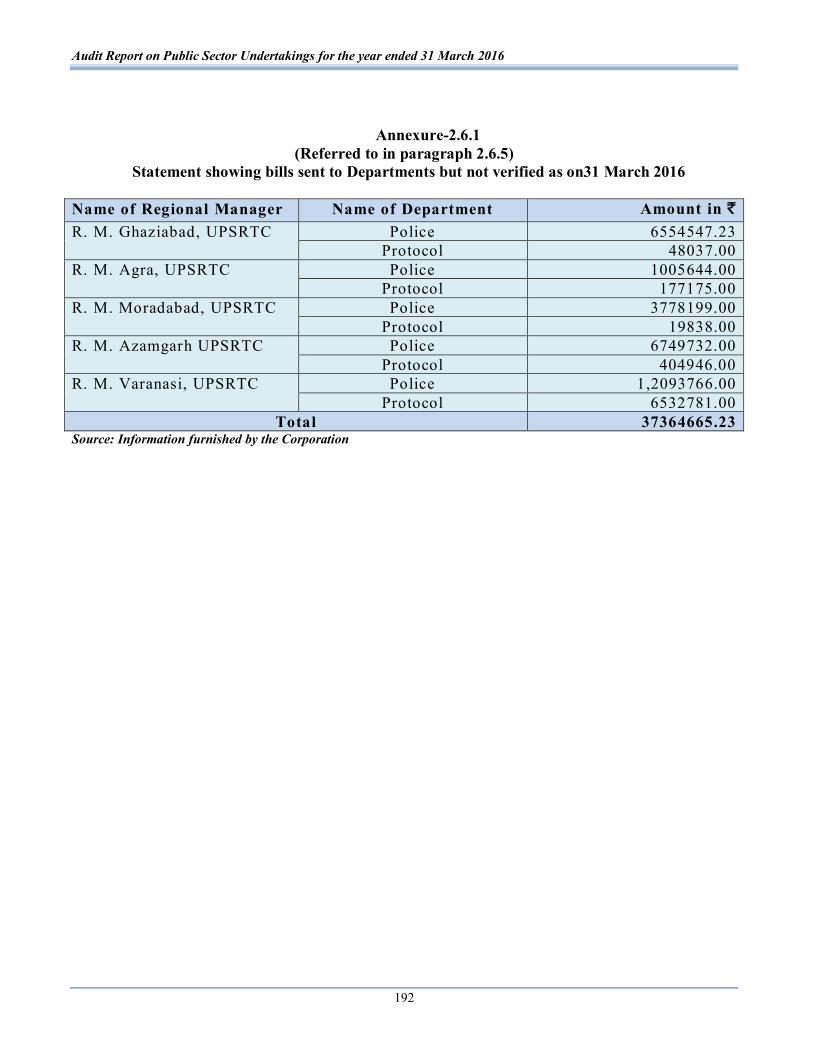
Audit Report on Public Sector Undertakings for the year ended 31 March 2016
192
Annexure-2.6.1 (Referred to in paragraph 2.6.5)
Statement showing bills sent to Departments but not verified as on31 March 2016
Name of Regional Manager Name of Department Amount in ` R. M. Ghaziabad, UPSRTC Police 6554547.23
Protocol 48037.00 R. M. Agra, UPSRTC Police 1005644.00
Protocol 177175.00 R. M. Moradabad, UPSRTC Police 3778199.00
Protocol 19838.00 R. M. Azamgarh UPSRTC Police 6749732.00
Protocol 404946.00 R. M. Varanasi, UPSRTC Police 1,2093766.00
Protocol 6532781.00 Total 37364665.23
Source: Information furnished by the Corporation
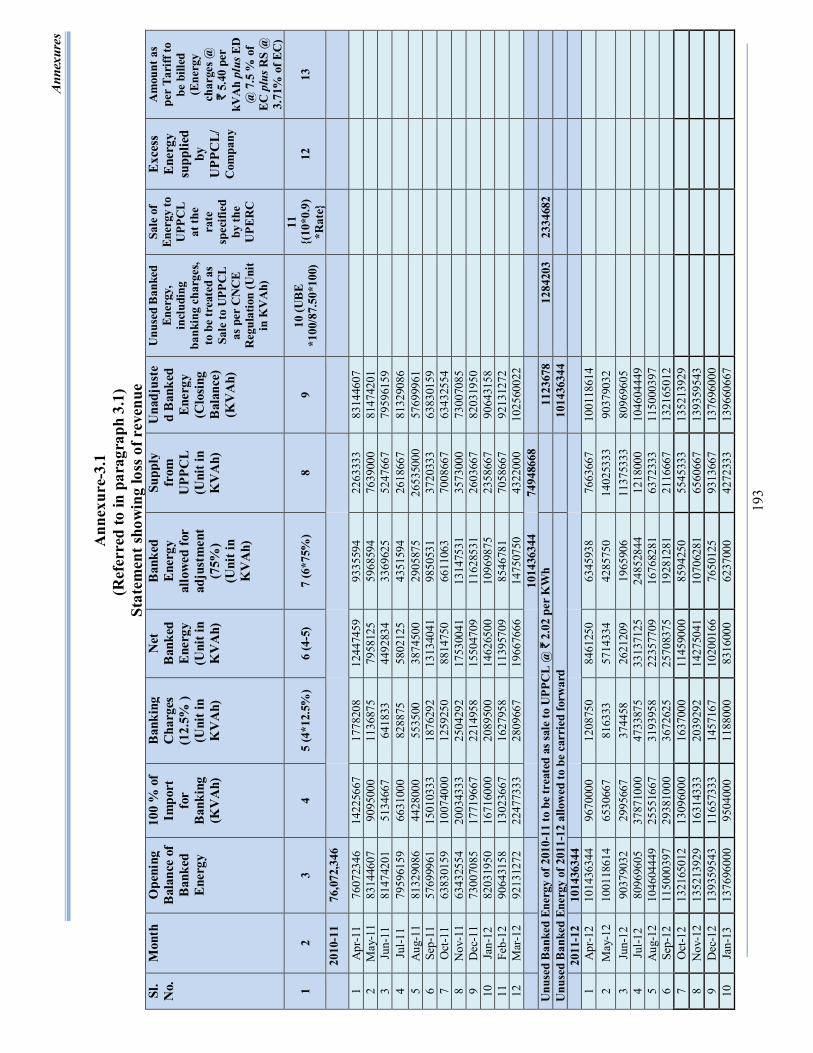
Ann
exur
es
193
Ann
exur
e-3.
1 (R
efer
red
to in
par
agra
ph 3
.1)
Stat
emen
t sho
win
g lo
ss o
f rev
enue
Sl
. N
o.
Mon
th
Ope
ning
B
alan
ce o
f B
anke
d E
nerg
y
100
% o
f Im
port
fo
r B
anki
ng
(KV
Ah)
Ban
king
C
harg
es
(1
2.5%
)
(Uni
t in
KV
Ah)
Net
B
anke
d E
nerg
y
(U
nit i
n K
VA
h)
Ban
ked
Ene
rgy
allo
wed
for
adju
stm
ent
(75%
)
(Uni
t in
KV
Ah)
Supp
ly
from
U
PPC
L
(U
nit i
n K
VA
h)
Una
djus
ted
Ban
ked
Ene
rgy
(C
losi
ng
Bal
ance
) (K
VA
h)
Unu
sed
Ban
ked
Ener
gy,
incl
udin
g ba
nkin
g ch
arge
s, to
be
trea
ted
as
Sale
to U
PPC
L as
per
CN
CE
Reg
ulat
ion
(Uni
t in
KV
Ah)
Sale
of
Ener
gy to
U
PPC
L at
the
rate
sp
ecifi
ed
by th
e U
PER
C
Exc
ess
Ene
rgy
supp
lied
by
UPP
CL/
Com
pany
Am
ount
as
per
Tari
ff to
be
bill
ed
(Ene
rgy
char
ges @
`
5.40
per
kV
Ah
plus
ED
@
7.5
% o
f EC
plu
s RS
@
3.71
% o
f EC
)
1 2
3 4
5 (4
*12.
5%)
6 (4
-5)
7 (6
*75%
) 8
9 10
(UB
E *1
00/8
7.50
*100
)
11
{(10
*0.9
)*R
ate}
12
13
20
10-1
1 76
,072
,346
1 A
pr-1
1 76
0723
46
1422
5667
17
7820
8 12
4474
59
9335
594
2263
333
8314
4607
2
May
-11
8314
4607
90
9500
0 11
3687
5 79
5812
5 59
6859
4 76
3900
0 81
4742
01
3 Ju
n-11
81
4742
01
5134
667
6418
33
4492
834
3369
625
5247
667
7959
6159
4
Jul-1
1 79
5961
59
6631
000
8288
75
5802
125
4351
594
2618
667
8132
9086
5
Aug
-11
8132
9086
44
2800
0 55
3500
38
7450
0 29
0587
5 26
5350
00
5769
9961
6
Sep-
11
5769
9961
15
0103
33
1876
292
1313
4041
98
5053
1 37
2033
3 63
8301
59
7 O
ct-1
1 63
8301
59
1007
4000
12
5925
0 88
1475
0 66
1106
3 70
0866
7 63
4325
54
8 N
ov-1
1 63
4325
54
2003
4333
25
0429
2 17
5300
41
1314
7531
35
7300
0 73
0070
85
9 D
ec-1
1 73
0070
85
1771
9667
22
1495
8 15
5047
09
1162
8531
26
0366
7 82
0319
50
10
Jan-
12
8203
1950
16
7160
00
2089
500
1462
6500
10
9698
75
2358
667
9064
3158
11
Fe
b-12
90
6431
58
1302
3667
16
2795
8 11
3957
09
8546
781
7058
667
9213
1272
12
M
ar-1
2 92
1312
72
2247
7333
28
0966
7 19
6676
66
1475
0750
43
2200
0 10
2560
022
1014
3634
4 74
9486
68
U
nuse
d B
anke
d En
ergy
of 2
010-
11 to
be t
reat
ed a
s sal
e to
UPP
CL
@ `
2.0
2 pe
r KW
h
1123
678
1284
203
2334
682
Unu
sed
Ban
ked
Ener
gy o
f 201
1-12
allo
wed
to b
e ca
rrie
d fo
rwar
d
1014
3634
4
2011
-12
1014
3634
4
1
Apr
-12
1014
3634
4 96
7000
0 12
0875
0 84
6125
0 63
4593
8 76
6366
7 10
0118
614
2 M
ay-1
2 10
0118
614
6530
667
8163
33
5714
334
4285
750
1402
5333
90
3790
32
3 Ju
n-12
90
3790
32
2995
667
3744
58
2621
209
1965
906
1137
5333
80
9696
05
4 Ju
l-12
8096
9605
37
8710
00
4733
875
3313
7125
24
8528
44
1218
000
1046
0444
9
5
Aug
-12
1046
0444
9 25
5516
67
3193
958
2235
7709
16
7682
81
6372
333
1150
0039
7
6
Sep-
12
1150
0039
7 29
3810
00
3672
625
2570
8375
19
2812
81
2116
667
1321
6501
2
7
Oct
-12
1321
6501
2 13
0960
00
1637
000
1145
9000
85
9425
0 55
4533
3 13
5213
929
8 N
ov-1
2 13
5213
929
1631
4333
20
3929
2 14
2750
41
1070
6281
65
6066
7 13
9359
543
9 D
ec-1
2 13
9359
543
1165
7333
14
5716
7 10
2001
66
7650
125
9313
667
1376
9600
0
10
Ja
n-13
13
7696
000
9504
000
1188
000
8316
000
6237
000
4272
333
1396
6066
7
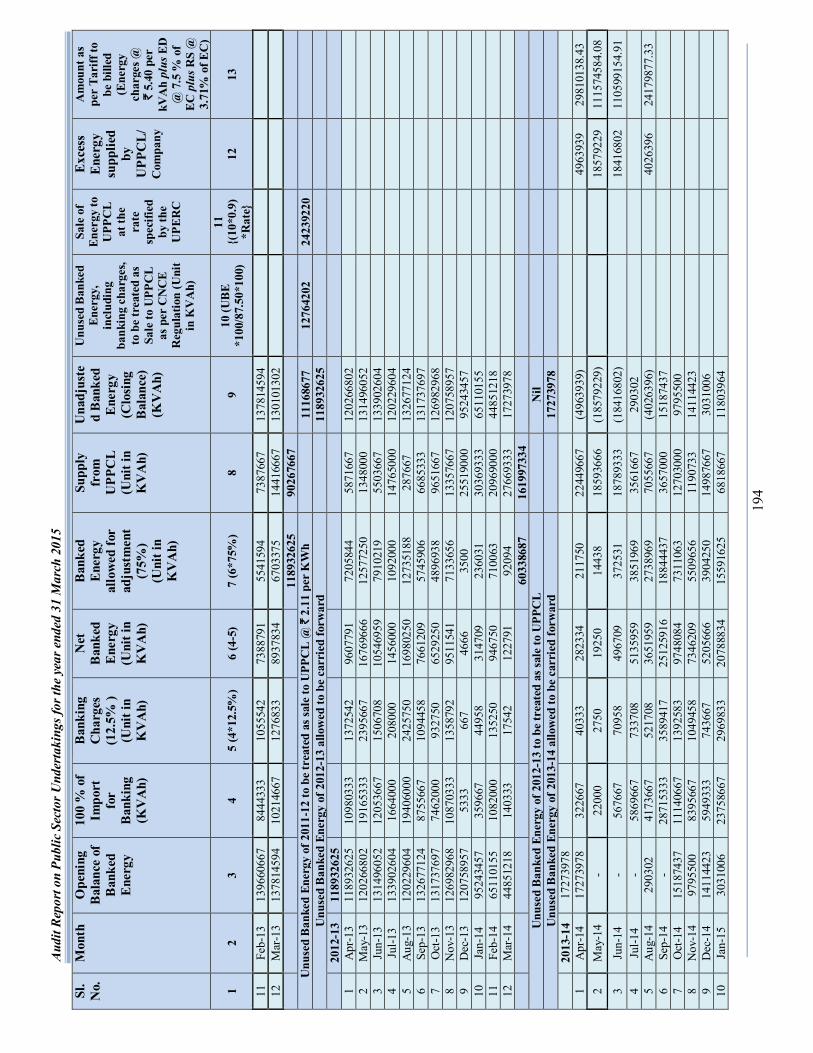
Aud
it R
epor
t on
Publ
ic S
ecto
r Und
erta
king
s for
the
year
end
ed 3
1 M
arch
201
5
194
Sl.
No.
M
onth
O
peni
ng
Bal
ance
of
Ban
ked
Ene
rgy
100
% o
f Im
port
fo
r B
anki
ng
(KV
Ah)
Ban
king
C
harg
es
(1
2.5%
)
(Uni
t in
KV
Ah)
Net
B
anke
d E
nerg
y
(U
nit i
n K
VA
h)
Ban
ked
Ene
rgy
allo
wed
for
adju
stm
ent
(75%
)
(Uni
t in
KV
Ah)
Supp
ly
from
U
PPC
L
(U
nit i
n K
VA
h)
Una
djus
ted
Ban
ked
Ene
rgy
(C
losi
ng
Bal
ance
) (K
VA
h)
Unu
sed
Ban
ked
Ener
gy,
incl
udin
g ba
nkin
g ch
arge
s, to
be
trea
ted
as
Sale
to U
PPC
L as
per
CN
CE
Reg
ulat
ion
(Uni
t in
KV
Ah)
Sale
of
Ener
gy to
U
PPC
L at
the
rate
sp
ecifi
ed
by th
e U
PER
C
Exc
ess
Ene
rgy
supp
lied
by
UPP
CL/
Com
pany
Am
ount
as
per
Tari
ff to
be
bill
ed
(Ene
rgy
char
ges @
`
5.40
per
kV
Ah
plus
ED
@
7.5
% o
f EC
plu
s RS
@
3.71
% o
f EC
)
1 2
3 4
5 (4
*12.
5%)
6 (4
-5)
7 (6
*75%
) 8
9 10
(UB
E *1
00/8
7.50
*100
)
11
{(10
*0.9
)*R
ate}
12
13
11
Feb-
13
1396
6066
7 84
4433
3 10
5554
2 73
8879
1 55
4159
4 73
8766
7 13
7814
594
12
Mar
-13
1378
1459
4 10
2146
67
1276
833
8937
834
6703
375
1441
6667
13
0101
302
1189
3262
5 90
2676
67
U
nuse
d B
anke
d En
ergy
of 2
011-
12 to
be t
reat
ed a
s sal
e to
UPP
CL
@ `
2.1
1 pe
r KW
h
1116
8677
12
7642
02
2423
9220
U
nuse
d B
anke
d En
ergy
of 2
012-
13 a
llow
ed to
be
carr
ied
forw
ard
11
8932
625
20
12-1
3 11
8932
625
1 A
pr-1
3 11
8932
625
1098
0333
13
7254
2 96
0779
1 72
0584
4 58
7166
7 12
0266
802
2 M
ay-1
3 12
0266
802
1916
5333
23
9566
7 16
7696
66
1257
7250
13
4800
0 13
1496
052
3 Ju
n-13
13
1496
052
1205
3667
15
0670
8 10
5469
59
7910
219
5503
667
1339
0260
4
4
Jul-1
3 13
3902
604
1664
000
2080
00
1456
000
1092
000
1476
5000
12
0229
604
5 A
ug-1
3 12
0229
604
1940
6000
24
2575
0 16
9802
50
1273
5188
28
7667
13
2677
124
6 Se
p-13
13
2677
124
8755
667
1094
458
7661
209
5745
906
6685
333
1317
3769
7
7
Oct
-13
1317
3769
7 74
6200
0 93
2750
65
2925
0 48
9693
8 96
5166
7 12
6982
968
8 N
ov-1
3 12
6982
968
1087
0333
13
5879
2 95
1154
1 71
3365
6 13
3576
67
1207
5895
7
9
Dec
-13
1207
5895
7 53
33
667
4666
35
00
2551
9000
95
2434
57
10
Jan-
14
9524
3457
35
9667
44
958
3147
09
2360
31
3036
9333
65
1101
55
11
Feb-
14
6511
0155
10
8200
0 13
5250
94
6750
71
0063
20
9690
00
4485
1218
12
M
ar-1
4 44
8512
18
1403
33
1754
2 12
2791
92
094
2766
9333
17
2739
78
6033
8687
16
1997
334
U
nuse
d B
anke
d En
ergy
of 2
012-
13 to
be t
reat
ed a
s sal
e to
UPP
CL
N
il
U
nuse
d B
anke
d En
ergy
of 2
013-
14 a
llow
ed to
be
carr
ied
forw
ard
17
2739
78
20
13-1
4 17
2739
78
1 A
pr-1
4 17
2739
78
3226
67
4033
3 28
2334
21
1750
22
4496
67
(496
3939
)
49
6393
9 29
8101
38.4
3 2
May
-14
- 22
000
2750
19
250
1443
8 18
5936
66
(185
7922
9)
1857
9229
11
1574
584.
08
3 Ju
n-14
-
5676
67
7095
8 49
6709
37
2531
18
7893
33
(184
1680
2)
1841
6802
11
0599
154.
91
4 Ju
l-14
- 58
6966
7 73
3708
51
3595
9 38
5196
9 35
6166
7 29
0302
5
Aug
-14
2903
02
4173
667
5217
08
3651
959
2738
969
7055
667
(402
6396
)
40
2639
6 24
1798
77.3
3 6
Sep-
14
- 28
7153
33
3589
417
2512
5916
18
8444
37
3657
000
1518
7437
7
Oct
-14
1518
7437
11
1406
67
1392
583
9748
084
7311
063
1270
3000
97
9550
0
8
Nov
-14
9795
500
8395
667
1049
458
7346
209
5509
656
1190
733
1411
4423
9
Dec
-14
1411
4423
59
4933
3 74
3667
52
0566
6 39
0425
0 14
9876
67
3031
006
10
Jan-
15
3031
006
2375
8667
29
6983
3 20
7888
34
1559
1625
68
1866
7 11
8039
64
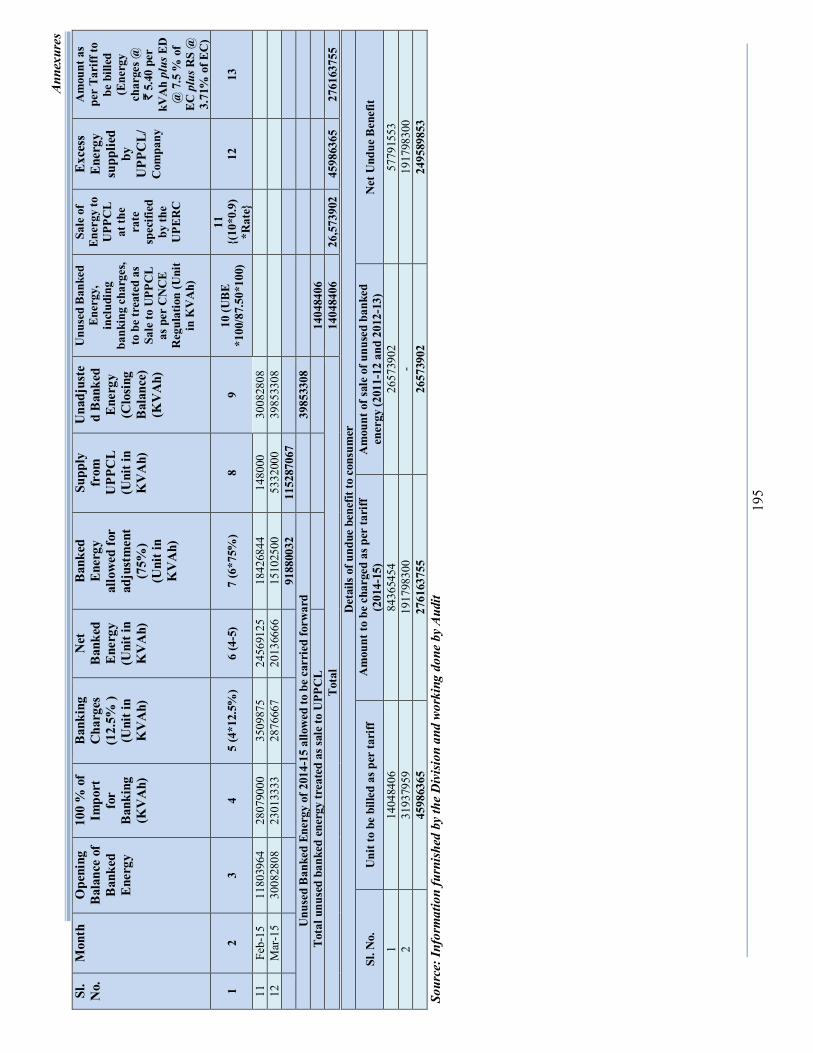
Ann
exur
es
195
Sl.
No.
M
onth
O
peni
ng
Bal
ance
of
Ban
ked
Ene
rgy
100
% o
f Im
port
fo
r B
anki
ng
(KV
Ah)
Ban
king
C
harg
es
(1
2.5%
)
(Uni
t in
KV
Ah)
Net
B
anke
d E
nerg
y
(U
nit i
n K
VA
h)
Ban
ked
Ene
rgy
allo
wed
for
adju
stm
ent
(75%
)
(Uni
t in
KV
Ah)
Supp
ly
from
U
PPC
L
(U
nit i
n K
VA
h)
Una
djus
ted
Ban
ked
Ene
rgy
(C
losi
ng
Bal
ance
) (K
VA
h)
Unu
sed
Ban
ked
Ener
gy,
incl
udin
g ba
nkin
g ch
arge
s, to
be
trea
ted
as
Sale
to U
PPC
L as
per
CN
CE
Reg
ulat
ion
(Uni
t in
KV
Ah)
Sale
of
Ener
gy to
U
PPC
L at
the
rate
sp
ecifi
ed
by th
e U
PER
C
Exc
ess
Ene
rgy
supp
lied
by
UPP
CL/
Com
pany
Am
ount
as
per
Tari
ff to
be
bill
ed
(Ene
rgy
char
ges @
`
5.40
per
kV
Ah
plus
ED
@
7.5
% o
f EC
plu
s RS
@
3.71
% o
f EC
)
1 2
3 4
5 (4
*12.
5%)
6 (4
-5)
7 (6
*75%
) 8
9 10
(UB
E *1
00/8
7.50
*100
)
11
{(10
*0.9
)*R
ate}
12
13
11
Feb-
15
1180
3964
28
0790
00
3509
875
2456
9125
18
4268
44
1480
00
3008
2808
12
M
ar-1
5 30
0828
08
2301
3333
28
7666
7 20
1366
66
1510
2500
53
3200
0 39
8533
08
9188
0032
11
5287
067
U
nuse
d B
anke
d En
ergy
of 2
014-
15 a
llow
ed to
be
carr
ied
forw
ard
39
8533
08
Tota
l unu
sed
bank
ed e
nerg
y tr
eate
d as
sale
to U
PPC
L
1404
8406
Tota
l 14
0484
06
26,5
7390
2 45
9863
65
2761
6375
5
Det
ails
of u
ndue
ben
efit
to c
onsu
mer
Sl. N
o.
Uni
t to
be b
illed
as p
er ta
riff
Am
ount
to b
e ch
arge
d as
per
tari
ff
(2
014-
15)
Am
ount
of s
ale
of u
nuse
d ba
nked
en
ergy
(201
1-12
and
201
2-13
) N
et U
ndue
Ben
efit
1 14
0484
06
8436
5454
26
5739
02
5779
1553
2
3193
7959
19
1798
300
- 19
1798
300
45
9863
65
2761
6375
5 26
5739
02
2495
8985
3 So
urce
: Inf
orm
atio
n fu
rnis
hed
by th
e D
ivis
ion
and
wor
king
don
e by
Aud
it

Related Documents