Utilization of Agricultural Waste for the Production of Xylooligosaccharides Using Response Surface Methodology and Their In Vitro Prebiotic Eィcacy Nagamani Kathiresan ( [email protected] ) The Gandhigram Rural Institute Deemed University https://orcid.org/0000-0001-9676-9444 Lingesh Gopal The Gandhigram Rural Institute Deemed University Vijay Karuppiah Alagappa University Renuka Naveenethan The Gandhigram Rural Institute Deemed University David Ravindran Abraham The Gandhigram Rural Institute Deemed University Kavitha Thangavel Alagappa University Research Article Keywords: Xylooligosaccharide, Xylan, Sugarcane bagasse, prebiotic, probiotic, Fermented foods, bacteriocin Posted Date: September 14th, 2021 DOI: https://doi.org/10.21203/rs.3.rs-748907/v2 License: This work is licensed under a Creative Commons Attribution 4.0 International License. Read Full License

Welcome message from author
This document is posted to help you gain knowledge. Please leave a comment to let me know what you think about it! Share it to your friends and learn new things together.
Transcript
Utilization of Agricultural Waste for the Productionof Xylooligosaccharides Using Response SurfaceMethodology and Their In Vitro Prebiotic E�cacyNagamani Kathiresan ( [email protected] )
The Gandhigram Rural Institute Deemed University https://orcid.org/0000-0001-9676-9444Lingesh Gopal
The Gandhigram Rural Institute Deemed UniversityVijay Karuppiah
Alagappa UniversityRenuka Naveenethan
The Gandhigram Rural Institute Deemed UniversityDavid Ravindran Abraham
The Gandhigram Rural Institute Deemed UniversityKavitha Thangavel
Alagappa University
Research Article
Keywords: Xylooligosaccharide, Xylan, Sugarcane bagasse, prebiotic, probiotic, Fermented foods,bacteriocin
Posted Date: September 14th, 2021
DOI: https://doi.org/10.21203/rs.3.rs-748907/v2
License: This work is licensed under a Creative Commons Attribution 4.0 International License. Read Full License
UTILIZATION OF AGRICULTURAL WASTE FOR THE PRODUCTION OF 1
XYLOOLIGOSACCHARIDES USING RESPONSE SURFACE METHODOLOGY AND THEIR 2
IN VITRO PREBIOTIC EFFICACY 3
Nagamani Kathiresan1, Lingesh Gopal1, Vijay Karuppiah2, Renuka Naveenethan1, David Ravindran Abraham1* 4
and Kavitha Thangavel2 5
1Department of Biology, The Gandhigram Rural Institute Deemed to be university, Gandhigram, Dindigul 6
624302, Tamil Nadu, India. 7
2Department of Microbiology, Molecular biology lab, Alagappa University, Karaikudi, Tamil Nadu, India. 8
* Corresponding author 9
Dr.A.David Ravindran M.Sc., PhD, 10
Professor (Retd), 11
The Gandhigram Rural Insitute- Deemed to be University, 12
Gandhigram 624302, Dindigul, Tamil Nadu, India, 13
[email protected], 9245171248 14
ORCiDs 15
Author 1: https://orcid.org/0000-0001-9676-9444 16
Author 3: https://orcid.org/0000-0001-7950-7899 17
Author 6: https://orcid.org/0000-0002-7554-3080 18
19
20
21
22
23
24
25
26
27
28
29
30
31
32
33
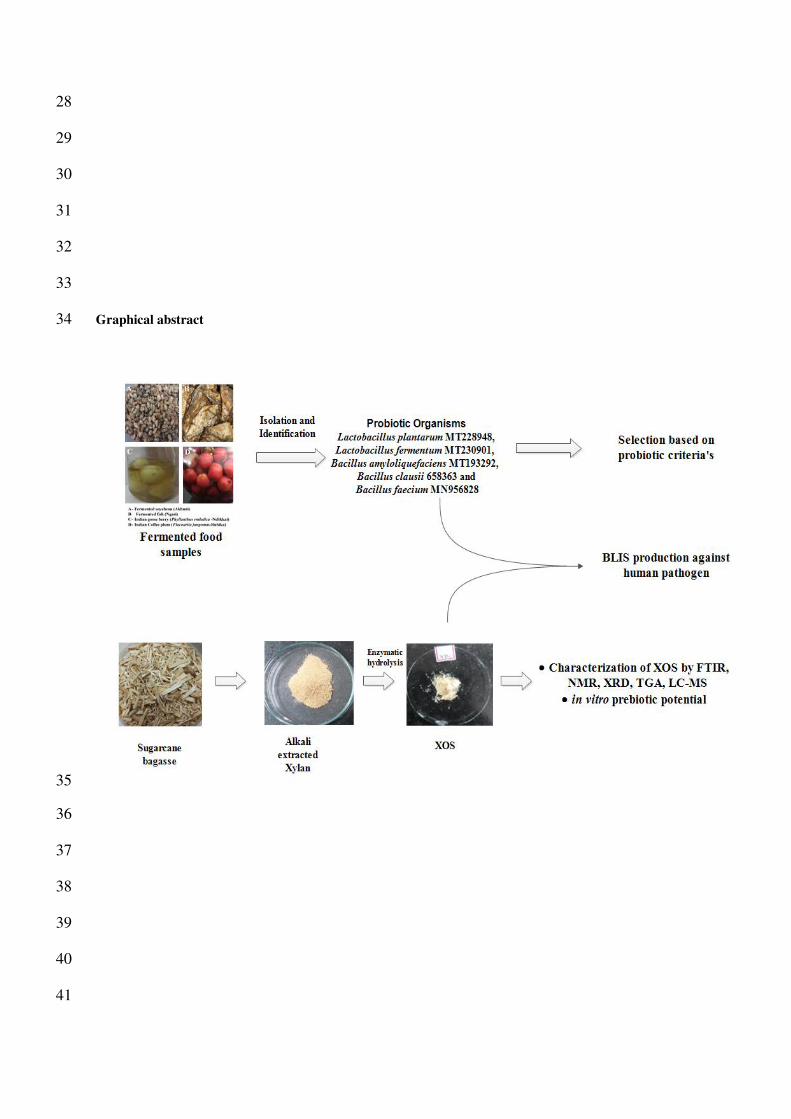
Graphical abstract 34
35
36
37
38
39
40
41
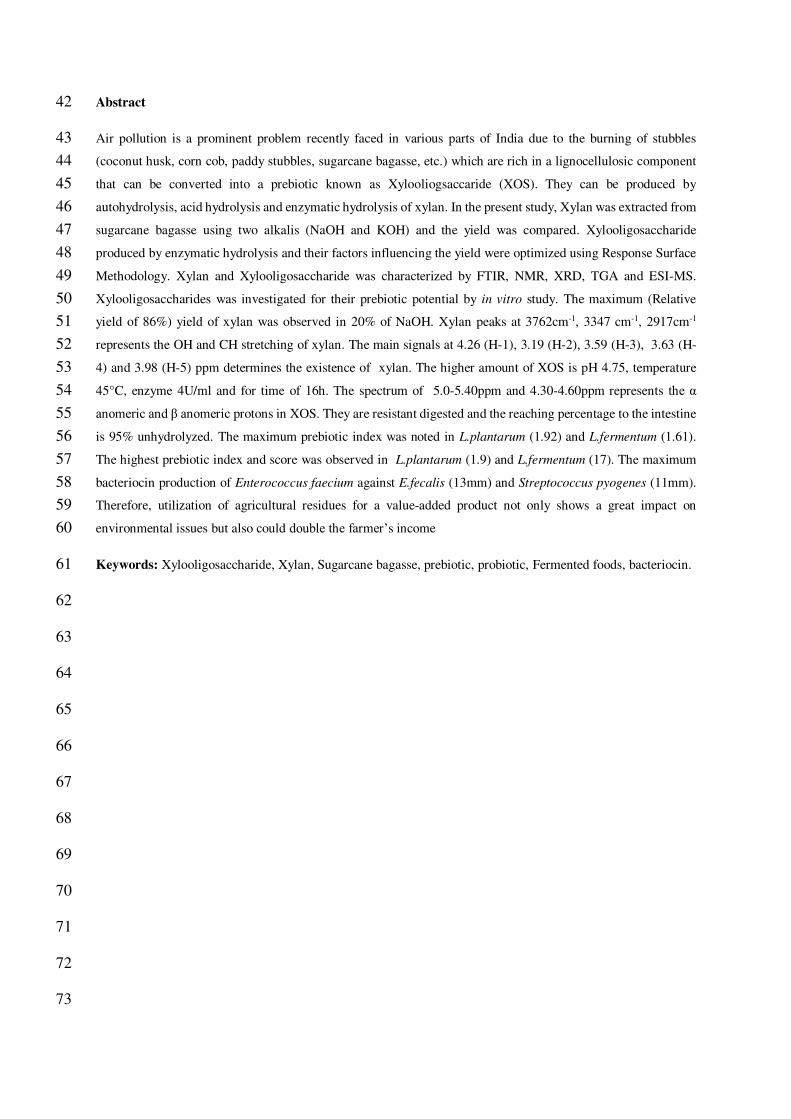
Abstract 42
Air pollution is a prominent problem recently faced in various parts of India due to the burning of stubbles 43
(coconut husk, corn cob, paddy stubbles, sugarcane bagasse, etc.) which are rich in a lignocellulosic component 44
that can be converted into a prebiotic known as Xylooliogsaccaride (XOS). They can be produced by 45
autohydrolysis, acid hydrolysis and enzymatic hydrolysis of xylan. In the present study, Xylan was extracted from 46
sugarcane bagasse using two alkalis (NaOH and KOH) and the yield was compared. Xylooligosaccharide 47
produced by enzymatic hydrolysis and their factors influencing the yield were optimized using Response Surface 48
Methodology. Xylan and Xylooligosaccharide was characterized by FTIR, NMR, XRD, TGA and ESI-MS. 49
Xylooligosaccharides was investigated for their prebiotic potential by in vitro study. The maximum (Relative 50
yield of 86%) yield of xylan was observed in 20% of NaOH. Xylan peaks at 3762cm-1, 3347 cm-1, 2917cm-1 51
represents the OH and CH stretching of xylan. The main signals at 4.26 (H-1), 3.19 (H-2), 3.59 (H-3), 3.63 (H-52
4) and 3.98 (H-5) ppm determines the existence of xylan. The higher amount of XOS is pH 4.75, temperature 53
45°C, enzyme 4U/ml and for time of 16h. The spectrum of 5.0-5.40ppm and 4.30-4.60ppm represents the α 54
anomeric and β anomeric protons in XOS. They are resistant digested and the reaching percentage to the intestine 55
is 95% unhydrolyzed. The maximum prebiotic index was noted in L.plantarum (1.92) and L.fermentum (1.61). 56
The highest prebiotic index and score was observed in L.plantarum (1.9) and L.fermentum (17). The maximum 57
bacteriocin production of Enterococcus faecium against E.fecalis (13mm) and Streptococcus pyogenes (11mm). 58
Therefore, utilization of agricultural residues for a value-added product not only shows a great impact on 59
environmental issues but also could double the farmer’s income 60
Keywords: Xylooligosaccharide, Xylan, Sugarcane bagasse, prebiotic, probiotic, Fermented foods, bacteriocin. 61
62
63
64
65
66
67
68
69
70
71
72
73

1. Introduction 74
Sugarcane (Saccharum officinarum L.) is a perennial crop that grows predominantly in subtropical and tropical 75
regions. Sugarcane bagasse (SB) is a fibrous residue of cane stalk left after the crushing and extraction of juices. 76
Sugarcane bagasse is one of the most abundant lignocellulosic materials in the agro-industrial residues (Cardona 77
et al. 2010) consisting of cellulose, hemicellulose and lignin. A total of 54x108 dry tons of sugarcane is processed 78
annually around the world and 1 ton of sugarcane generates 280 kgs of bagasse (Cerqueira et al. 2007). About 79
50% of these residues are used for generating power and heat to run the sugar, ethanol and distillery plants. The 80
remaining bagasse are piled up which may cause spontaneous combustion of stored bagasse (Lavarack et al. 2000 81
and Pandey et al. 2000). Xylooligosaccharides (XOS) are the prebiotic component obtained from the plant 82
biomass. Biomass of plant origin is one of the renewable and cheapest raw materials for sustainable development. 83
That could be a promising initiator for the production of biofuel and bioenergy along with value-added 84
biomolecule (Prebiotic). Prebiotics, as the name, implies “Pre- before; bio-life” it is evolved before life evolved. 85
But it came to light in 1995 with the definition given by Gibson and Roberfroid (1995) as “Nondigestible food 86
ingredients that beneficially affect the host by selectively stimulating the growth and or activity of one of the 87
limited number of bacteria in the colon” (Samanta et al. 2014). 88
XOS is the synthesized prebiotics from various agricultural residues viz., corncob sugarcane bagasse, stalks of 89
cotton, tobacco and shells of pistachios, walnut and groundnut, etc., they are hydrolyzed products of xylan a 90
polysaccharide which is synthesized by various methods. These agricultural wastes are dumped in the field or 91
burned after harvesting (Agrupis and Markawa 1999). By utilizing these wastes will protect the environment from 92
pollution as well as increases the economic status of farmers and generates employment (Akpinar et al. 2009). 93
From a nutritional point of view, XOS is known as nondigestable (ND) as they are not degraded in the stomach 94
and reaches the lower bowel, to be utilized by the microbiota residing there (Okazaki et al. 1990; Roberfroid 1999; 95
Collins and Gibson 1999; Vazquez et al.2000). They have also helped in reducing cholesterol and maintains gut 96
health. They are moderately sweet, inhibit the retrogradation of starch, and improves the sensory and nutritional 97
properties of food and are stable for a wide range of pH and temperature (Vorgen 1998). XOS is noncarcinogenic 98
and regulates insulin secretion from the pancreas, besides increasing mineral absorption from the large intestine. 99
It affects bowel function through its mild laxative ability. The prebiotic consumption gradually raises the ability 100
to stimulate the growth of indigenous Bifidobacterium and Lactobacillus in the hindgut which in turn suppress 101
the growth and activity of harmful or putrefactive bacteria and reduces the concentration of toxic substances in 102
the gastrointestinal tract (Samanta et al. 2007, 2010). XOS predominantly increases the population of 103
Bifidobacterium and Lactobacillus which results in the production of SCFA by the prebiotic fermentation which 104
helps in important physical events viz., Calcium absorption, bowel function, lipid metabolism and reduces the risk 105
of colon cancer (Rycroft et al. 2001). 106
The Prebiotic potential is attributed by the utilization and nourishment of probiotic via fermentation thrive to 107
maintain the gut microflora diversity by eliminating the harmful pathogen (Gibson et al. 2004). The prebiotic 108
index and score can be calculated by comparing the stimulated growth by prebiotic on beneficial microbial 109
diversity and other intestinal pathogens (Huebner et al. 2007). 110

Bacteriocins can be defined as extracellularly released peptides or protein molecules which have low molecular 111
weight with a bacteriostatic mode of action of closely related species. Bacteriocins are classified into three classes 112
based on their structure and function (Klaenhammer 1993). The action or effectiveness of the probiotics depends 113
mainly on the type of strain and the amount consumed. Prevention of growth of the pathogenic organisms by 114
occupying all the adhesion sites as pathogenic organisms also need to adhere and attach to the epithelial cells of 115
the intestine. The action might also be due to the synthesis of the acids and generating the acidic environment and 116
prevents the growth of pathogens. The immunological benefits conferred by probiotics are by prevention of 117
allergies due to activation of macrophages and thereby increasing antigen presentation and increases secretion of 118
immunoglobulin A. 119
In this research, the xylan was extracted from the sugarcane bagasse by alkali extraction and xylooligosaccharides 120
has been produced by enzymatic hydrolysis and studied for its in vitro prebiotic potential and their bacteriocin 121
activity against pathogens 122
2. Materials and methods 123
2.1 Strains used 124
The probiotic organisms were isolated from fermented foods viz., fish (Ngari), soyabean (Akhuni), Indian goose 125
berry and Indian coffee plum, identified and submitted in NCBI were used in this study viz., Lactobacillus 126
plantarum MT228948, Lactobacillus fermentum MT230901, Bacillus amyloliquefaciens MT193292, Bacillus 127
clausii 658363 and Bacillus faecium MN956828. 128
2.2 Sample collection and processing of the sample 129
Sugarcane bagasse was collected from the local Chinnalapatti market, Dindigul district, Tamil Nadu. The 130
collected Sugarcane Bagasse was washed with hot water to remove the dirt and dried in a hot air oven at 60±2°C. 131
The dried sample was powdered with a mechanical blender and stored in an airtight container until further usage. 132
2.3 Compositional analysis of Sugarcane bagasse 133
The composition of sugarcane bagasse (Cellulose, Hemicellulose and Lignin) was analyzed gravimetrically 134
(Ayeni 2015). The physicochemical parameters Moisture analysis (ASTM D2216 1993), Ash content (ASTM 135
D2866, 2000) and Lipid content (Soxhlet method) of sugarcane bagasse were quantified. All estimations were 136
carried out in triplicates. 137
2.4 Extraction of xylan by alkali (KOH and NaOH) treatment. 138
Xylan was extracted from sugarcane bagasse by alkali treatment coupled with steam treatment according to 139
Samanta et al. (2012) with slight modification. The sugarcane bagasse was treated with alkaline viz., KOH and 140
NaOH in a series of concentrations from 4% to 40%. Sugarcane bagasse was soaked overnight in alkali with a 141
solid to liquid ratio of (10: 1) and they are autoclaved for 20 min at 121°C. The solid-liquid fractions were 142
centrifuged at x10000 rpm for 15 min. The supernatant was neutralized to pH6 using 1N glacial acetic acid and 2 143
volumes of ice-cold ethanol (70%) were added and allowed for precipitation. The aliquots were centrifuged at 144
x10000 rpm for 20 min and the pellets were washed twice with distilled water, lyophilized, homogenized and 145
stored at 20°C until further usage. The maximum recovery of xylan from the sample (True yield) and 146
hemicellulose (Relative yield) can be calculated using the following formulae (Jnawali et al. 2018) 147
𝐓𝐫𝐮𝐞 𝐑𝐞𝐜𝐨𝐯𝐞𝐫𝐲(%) = 𝐃𝐫𝐲 𝐰𝐞𝐢𝐠𝐡𝐭 𝐨𝐟 𝐞𝐱𝐭𝐫𝐚𝐜𝐭𝐞𝐝 𝐱𝐲𝐥𝐚𝐧 (𝐠)𝐖𝐞𝐢𝐠𝐡𝐭 𝐨𝐟 𝐭𝐡𝐞 𝐬𝐚𝐦𝐩𝐥𝐞 (𝐠) 𝐱 𝟏𝟎𝟎 148
𝐑𝐞𝐥𝐚𝐭𝐢𝐯𝐞 𝐘𝐢𝐞𝐥𝐝 (%) = 𝐓𝐫𝐮𝐞 𝐲𝐢𝐞𝐥𝐝 (%)𝐗𝐲𝐥𝐚𝐧 𝐜𝐨𝐧𝐭𝐞𝐧𝐭𝐬 𝐩𝐫𝐞𝐬𝐞𝐧𝐭 𝐢𝐧 𝐨𝐫𝐢𝐠𝐢𝐧𝐚𝐥 𝐬𝐚𝐦𝐩𝐥𝐞𝐬 (%) 𝐗𝟏𝟎𝟎 149
2.5 Optimization of Xylooligosaccharides (XOSs) by Response Surface Methodology (RSM) 150
The optimization of XOS production was carried out by Response Surface Model (RSM) -Central Composite 151
Design (CCD). The extracted sugarcane bagasse xylan was subjected to enzymatic hydrolysis using commercial 152
xylanase enzyme extracted from T. viridae (Sigma, Bangalore). The experiments were carried out in triplicates 153
with 29 runs by varying pH (4 to 5.5), temperature (40°C to 55°C), enzyme (4U to 20U) and incubation time (8 154
to 24 hours). Two percent of substrates were added to 10ml of sodium citrate buffer and 1ml of enzyme and 155
incubated in shaking waterbath at x150g for appropriate temperature and time. The aliquots were drawn from the 156
enzymatic hydrolysis and the mixture was heated to 100°C to inactivate the enzyme and the hydrolysate was 157
filtered with Whatman No1 filter paper. Three volumes of ice-cold ethanol were added to the filtrate to precipitate 158
the traces of unhydrolyzed xylan (Samanta et al. 2014) and it was vacuum filtered using G3 sintered crucible filter 159
and the filtrate was analyzed for its non-reducing sugar (XOS) by Lane and Eyon chemical method The 160
optimization study was designed using by Design expert software version 11. 161
2.6 Detection and purification of Xylooligosaccharides 162
The crude xylooligosaccharide was purified by the Activated charcoal column chromatography method according 163
to Chapla et al. (2012) with slight modification. Briefly, the activated charcoal was added to the crude XOS with 164
a solid to liquid ratio of 1:10 and they were incubated at 25°C for 30 min at 150 rpm in a cooling shaking incubator. 165
After incubation, the charcoal mixture was washed with 5 volumes of distilled water by vacuum filtration, as the 166
monosaccharides in the mixture solution get washed off and the XOS adheres to the pores of activated charcoal. 167
The charcoal containing XOS mixture is packed into the column with bed volume 1-2 cm length with 2.3cm width 168
as the stationary phase and 90% ethanol was used as the eluent. Elution was carried out at room temperature with 169
gravitational force at a flow rate of 5ml/hour. 6 fractions of 5ml each were collected and Thin Layer 170
Chromatography (TLC) was performed. The desired fractions were pooled together and concentrated using a 171
Rotary Vacuum evaporator and lyophilized and stored at 4°C until further use. 172
2.7 Characterization of Xylan and Xylooligosaccharides 173
2.7.1 Fourier Transform Infra-Red (FTIR) analysis 174
Surface functional groups of Xylan and Xylooligosaccharides extracted from Sugarcane bagasse were unraveled 175
by FTIR (Perkin-Elmer infrared spectrophotometer, India). The xylan and Xylooligosaccharides were mixed with 176
KBr (spectroscopic grade) separately and pellets were prepared in the size of about 10-30 mm diameter and 1 mm 177
in thickness (Jayapal et al. 2013). The samples were scanned in transmission mode with a resolution of 4cm-1 in 178
the 4000-400 cm-1 range and the functional groups were compared with previously published works of literature. 179
2.7.2 X-ray Powder Diffractions for Xylan and XOS 180
To determine the physical nature of Xylan and Xylooligosaccharides, X-ray diffraction (XRD) was analyzed using 181
a powder diffractometer (PANalytical/XPert 3, New York). The structural property of Xylan and 182

Xylooligosaccharides was identified using Bragg’s law by measuring the line spacing in diffraction pattern (d) 183
and angle of incidence (θ) where λ is the wavelength of the monochromatic X-ray beam. 184 𝐝 = 𝛌𝐧 𝐬𝐢𝐧𝛉 188
The crystallinity index (CI) of Xylan and Xylooligosaccharides was also evaluated by calculating the ratio of area 185
under the crystalline peaks and total area of the scattered diffractogram using followed formulae (Singh et al. 186
2011). 187 𝐂𝐈 = 𝛆𝐀𝐂𝐫𝐲𝐬𝐭𝐚𝐥𝛆𝐀𝐂𝐫𝐲𝐬𝐭𝐚𝐥 + 𝛆𝐀𝐚𝐦𝐨𝐫𝐩𝐡𝐨𝐮𝐬 189
2.7.3 NMR analysis for XOS 190
Approximately 10mg of xylan and Xylooligosaccharides samples were dispersed in Dimethyl Sulfoxide (DMSO) 191
and Deionized water (Peng et al. 2010) and these solutions were used to record the 1H and 13C spectra. The 192
Acquired time (AQ) is 4.089 seconds. The number of scans was 16 (NS) and the delay between transients was 2 193
seconds. Data were processed using the Bruker Topsin NMR software ( Bruker, Avance III HD Nanobay 400 194
MHz FT-NMR SPECTROMETER, California) 195
2.7.4 Thermogravimetric Analysis (TGA) 196
The thermal stability of the xylan and Xylooligosaccharides component was determined by Thermogravimetric 197
analysis ( NETZSCH, NJA – STA 2500 Regulus, Germany) (Bian et al. 2010). 10 mg of dried xylan and 198
Xylooligosaccharides samples were dried in a desiccator before experimenting. 2mg of samples were loaded in 199
the crucible and heated up to 600°C from room temperature at a rate of 10°C/min with a continuous flow of 200
nitrogen. 201
2.7.5 Liquid Chromatography-Mass Spectroscopy (LC-MS) 202
The macromolecules in the sample were analyzed by 6530Q-TOF LCMS (Agilent, United States). 2µl of XOS 203
sample diluted in methanol was injected into the column and ionized by electron spray ionization source in a 204
positive ion charge mode. The scan was performed for the mass charge range (m/z) between 100-1000 205
(Xiao et al. 2018). 206
2.8 Prebiotic attributes 207
2.8.1 Resistance to acid hydrolysis 208
The resistance to gastrointestinal tract fluids was studied according to Wang (2009) and Winchienchot et al. 209
(2010). Artificial human gastric juice was mimicked by using hydrochloric acid buffer containing (in g/L) NaCl, 210
8; KCL, 0.2; Na2HPO4.2H2O, 8.25; NaHPO4, 14.35; CaCl2.2H2O, 0.1; MgCl2.6H2O, 0.18. This buffer was adjusted 211
to pH 1 to 5 using 5 M HCl. This buffer (5 ml at each pH) was added to the sample solution (1% w/v, 5 ml) and 212
incubated in a water bath (37 ± 1°C) for 6 hours. Sample (1ml) was taken periodically at 0, 0.5, 1, 2, 4 and 6 hours 213
and tested for reducing sugar content using the dinitrosalicylic acid (DNS) and also total sugar content using the 214
Anthrone method. In this experiment, Inulin was used as a control. Percentage of the sample was calculated based 215
on reducing sugar released and total sugar content of the sample as below: 216

% hydrolysis = 𝐑𝐞𝐝𝐮𝐜𝐢𝐧𝐠 𝐒𝐮𝐠𝐚𝐫 𝐫𝐞𝐥𝐞𝐚𝐬𝐞𝐝 𝐓𝐨𝐭𝐚𝐥 𝐬𝐮𝐠𝐚𝐫 𝐜𝐨𝐧𝐭𝐞𝐧𝐭−𝐈𝐧𝐢𝐭𝐢𝐚𝐥 𝐫𝐞𝐝𝐮𝐜𝐢𝐧𝐠 𝐬𝐮𝐠𝐚𝐫 𝐜𝐨𝐧𝐭𝐞𝐧𝐭 𝐗𝟏𝟎𝟎 217
2.8.2 Prebiotic efficiency 218
The capability of probiotics to utilize prebiotics for their growth as a carbon source was determined according to 219
Agte et al. (2010) protocol with slight modification. Probiotic cultures Lactobacillus sp. and Bacillus sp. were 220
grown in their specific medium viz., Lactobacillus- MRS broth and Bacillus-Nutrient broth by altering the carbon 221
source of the synthetic medium with XOS and EPS each. The utilization of prebiotics was analyzed by the growth 222
of probiotic cultures using the visible spectrophotometer at 600nm every 12 hours after incubation for a day. 223
2.8.3 Prebiotic Index 224
The prebiotic index is a growth comparison of probiotic on control media and prebiotic substituted media was 225
analyzed according to Rodriguez et al. (2019). Probiotics were inoculated into the sterilized control media and 226
carbon sources substituted with prebiotic and incubated at 37 ±2°C for 24 hours and it was calculated using the 227
following formula by reading the growth at 600nm 228
𝑃𝑟𝑒𝑏𝑖𝑜𝑡𝑖𝑐 𝐼𝑛𝑑𝑒𝑥 = 𝐴600𝑛𝑚 𝑜𝑓 𝑝𝑟𝑜𝑏𝑖𝑜𝑡𝑖𝑐 𝑔𝑟𝑜𝑤𝑡ℎ 𝑖𝑛 𝑝𝑟𝑒𝑏𝑖𝑜𝑡𝑖𝑐 𝑠𝑢𝑏𝑡𝑖𝑡𝑢𝑡𝑒𝑑 𝑚𝑒𝑑𝑖𝑢𝑚𝐴600𝑛𝑚 𝑜𝑓 𝑝𝑟𝑜𝑏𝑖𝑜𝑡𝑖𝑐 𝑔𝑟𝑜𝑤𝑡ℎ 𝑖𝑛 𝑐𝑜𝑛𝑡𝑟𝑜𝑙 𝑚𝑒𝑑𝑖𝑢𝑚 229
2.8.4 Prebiotic activity score 230
The utilization of prebiotics by probiotic cultures and an indicator E. coli were determined following the protocol 231
of Huebner et al. (2007) by comparing their growth at 0th and 24 hours of incubation using UV- Visible 232
spectrophotometer at 600nm. The cultures grown in media without prebiotics were used as control. The prebiotic 233
score was calculated using the following formula: 234 𝑷𝒓𝒆𝒃𝒊𝒐𝒕𝒊𝒄 𝒂𝒄𝒕𝒊𝒗𝒊𝒕𝒚 𝒔𝒄𝒐𝒓𝒆235 = 𝐩𝐫𝐨𝐛𝐢𝐨𝐭𝐢𝐜 𝐠𝐫𝐨𝐰𝐭𝐡 𝐚𝐭 𝟐𝟒𝐭𝐡 𝐡𝐫𝐬 𝐰𝐢𝐭𝐡 𝐏𝐫𝐞𝐛𝐢𝐨𝐭𝐢𝐜𝐬 − 𝐏𝐫𝐨𝐛𝐢𝐨𝐭𝐢𝐜 𝐠𝐫𝐨𝐰𝐭𝐡 𝐚𝐭 𝟎𝐭𝐡 𝐡𝐫 𝐰𝐢𝐭𝐡 𝐏𝐫𝐞𝐛𝐢𝐨𝐭𝐢𝐜𝐬𝐩𝐫𝐨𝐛𝐢𝐨𝐭𝐢𝐜 𝐠𝐫𝐨𝐰𝐭𝐡 𝐚𝐭 𝟐𝟒𝐭𝐡 𝐡𝐫𝐬 𝐰𝐢𝐭𝐡 𝐠𝐥𝐮𝐜𝐨𝐬𝐞 − 𝐏𝐫𝐨𝐛𝐢𝐨𝐭𝐢𝐜 𝐠𝐫𝐨𝐰𝐭𝐡 𝐚𝐭 𝟎𝐭𝐡 𝐡𝐫 𝐰𝐢𝐭𝐡 𝐠𝐥𝐮𝐜𝐨𝐬𝐞 236
− 𝑬. 𝒄𝒐𝒍𝒊 𝐠𝐫𝐨𝐰𝐭𝐡 𝐚𝐭 𝟐𝟒𝐭𝐡 𝐡𝐫𝐬 𝐰𝐢𝐭𝐡 𝐏𝐫𝐞𝐛𝐢𝐨𝐭𝐢𝐜𝐬 − 𝐄. 𝐜𝐨𝐥𝐢 𝐠𝐫𝐨𝐰𝐭𝐡 𝐚𝐭 𝟎𝐭𝐡 𝐡𝐫 𝐰𝐢𝐭𝐡 𝐏𝐫𝐞𝐛𝐢𝐨𝐭𝐢𝐜𝐬 𝑬. 𝒄𝒐𝒍𝒊 𝐠𝐫𝐨𝐰𝐭𝐡 𝐚𝐭 𝟐𝟒𝐭𝐡 𝐡𝐫𝐬 𝐰𝐢𝐭𝐡 𝐠𝐥𝐮𝐜𝐨𝐬𝐞 − 𝐄. 𝐜𝐨𝐥𝐢 𝐠𝐫𝐨𝐰𝐭𝐡 𝐚𝐭 𝟎𝐭𝐡 𝐡𝐫 𝐰𝐢𝐭𝐡 𝐠𝐥𝐮𝐜𝐨𝐬𝐞 237
2.9 Bacteriocin production from probiotic with prebiotic 238
The probiotic cultures grown in prebiotics substituted medium were screened for its bacteriocin activity using the 239
agar well diffusion method. Briefly, the isolates were inoculated in 50ml of respective prebiotic substituted 240
medium and incubated overnight at 37°C for 24 hours. The isolates were centrifuged in the cooling centrifuge at 241
4°C at the rate of x5000g for 20 minutes. The supernatant was filtered through a 0.22µm membrane filter to 242
remove the bacterial cell to obtain Cell-Free Supernatant (CFS) and adjust to pH 6. The pathogens were swabbed 243
onto the nutrient agar plate and 6mm diameter wells were cut using a sterile well diffuser. Consequently, 100µl 244
of pH neutralized CFS were added to wells and plates were incubated at 37°C for 12 hours and examined for the 245
presence of zone, measured zone using zone scale. 246
247
248
3. Results and Discussion 249
3.1 Compositional Analysis of Sugarcane bagasse 250
Agricultural residues being dumped dumped or burned in fields, both activities lead to environmental problems; 251
hence these residues can be potentially converted into a value-added prebiotic component Xylooligosaccharide. 252
The Plant biomass are mainly composed of cellulose, hemicellulose and lignin components. In this research, the 253
composition of sugarcane bagasse was analyzed and composed of cellulose (36±0.02%); hemicellulose 254
(25±0.03%), lignin (20.23±0.04%), Ash content (1.23±0.15%) and wax less than 1 (Fig. 1). Similarly analysis of 255
sugarcane bagasse had been carried out by Ayeni et al. (2015) and Bon and Ferrara (2007). 256
3.2 Alkali extraction of xylan from sugarcane bagasse 257
Treating lignocellulose-rich agricultural residues to alkali results in swelling of cellulose and rupturing of cell 258
walls and high temperature softens the protective shielding lignin layer (Lavarack et al. 2002). Extraction of xylan 259
with alkali like NaOH and KOH does not require any special instrument and it is an affordable and simple method. 260
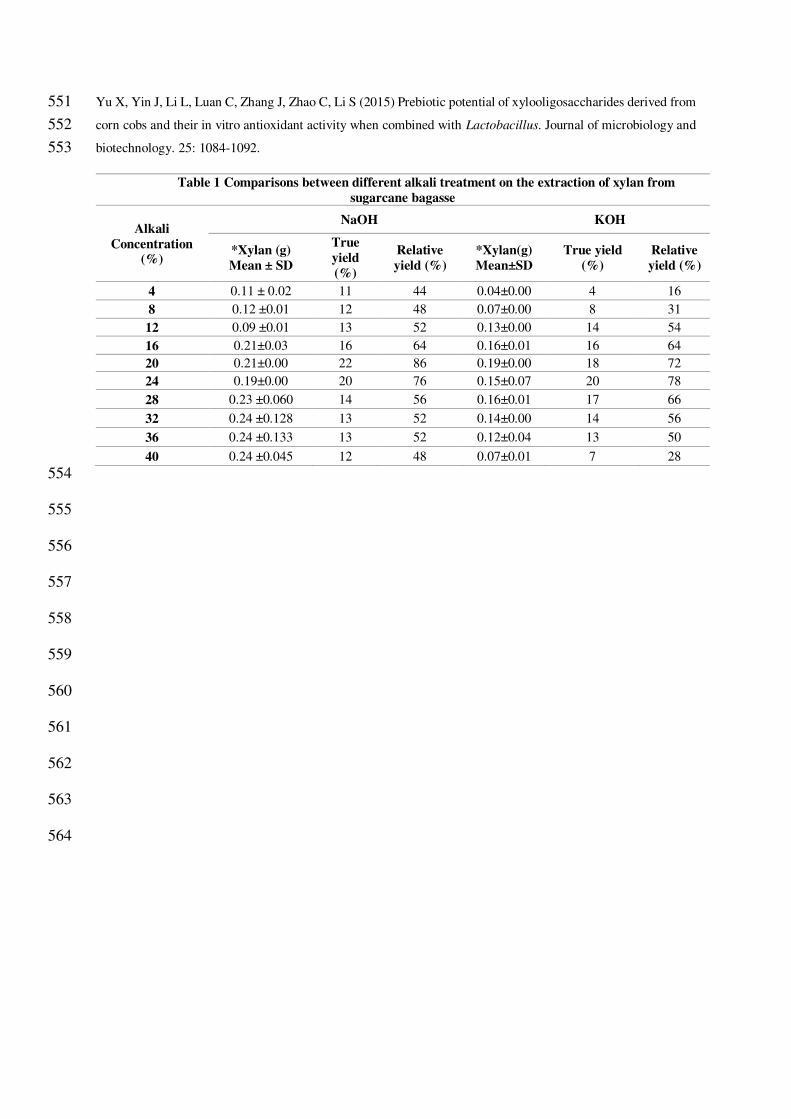
The xylan has been steadily increased when incrementing of concentration up to 20% of NaOH or KOH giving 261
a true yield of 22 % and 20% and relative yield of 86% and 78%. By comparing the xylan yield among the alkali 262
used, the maximum xylan yield was observed in 20% NaOH combined with steam-treated sugarcane bagasse 263
(Table 1). Jayapal et al. 2013 have compared the xylan extraction with two different alkali. The relative recovery 264
for KOH is 6 to 53% and 12 to 85% for NaOH. Samanta et al., 2012 also compared the alkali extraction of xylan 265
from natural grass (Sehima nervosum) and the true yield of KOH is 2.47% to 16.52% and NaOH is 3.75 to 25.12% 266
and the maximum relative yield for KOH is 23.43% and 83.38% for NaOH. 267
3.3 Optimization and Production of XOS from xylan using Response Surface Model (RSM). 268
RSM quadratic model was adopted to maximize the yield of XOS production and minimize the undesirable 269
product (xylose) formation. The XOS production was estimated by standard chemical method (Lane and Eyon 270
1923). The correlation and interaction of the independent variables were determined by the Box Bohnken method 271
(Table 2). The effect of the model was analyzed by regression coefficient, Analysis of variance (ANOVA) and 272
response surface plots (Fig 2). 273
The coefficient of the factors was determined by the R2 value, this value has to be above 0.80 to good fit a model 274
and they elucidate the accuracy of the response of the model. The regression coefficient for XOS production was 275
significant (P<0.05) with an R2 value of 0.925 that determines the 92.5% accuracy. The results recommend the 276
quadratic equation for XOS recovery from Sugarcane bagasse xylan as follow: 277 XOS = 0.6244 − 0.0143A − 0.00206B − 0.1766C − 0.0264D − 0.0295AB + 0.0050AC + 0.0493BC278 + 0.0328BD + 0.0088CD − 0.0059A2 − 0.0071B2 + 0.2073C2 + 0.0000D2 279
Where A- pH, B- Temperature, C- Enzyme, D- Time 280
Analysis of variance for the current model is significant with p<0.001and the lack of fit Not significant (0.4087) 281
as the designed model perfectly fits the yield of the XOS. The maximum yield was observed in the following runs 282
12, 19, 20, 26 and 29 with 1.57±0.29, 0.99±0.24, 0.95±0.21, 0.98±0.31 and 1.04±0.33 respectively. 283

Response surface plots elucidate the interaction between independent variables by plotting 3D surface curves 284
against two variables by keeping the other two variables at their central level. The central level for the independent 285
variables is pH (4.75), temperature (45°C), enzyme (4 U/ml) and time (16 h). When the pH and temperature are 286
decreased to (40 to 4°C) the XOS yield was a maximum of 0.634 mg/ml (Figure 2A). The low pH (4) and enzyme 287
concentration (4 U/ml) enhances the XOS yield 1.013mg/ml and the yield declines when the enzyme concentration 288
has increased (Figure 2B). The interaction between pH and Time doesn’t have much impact on the production of 289
XOS (Figure 2C). The XOS yield was gradually decreased when the temperature is decreased and the enzyme 290
concentration increased (Figure 2D). When the time and enzyme concentration increased, the XOS yield has been 291
reduced (Figure 2E). Interaction between the temperature and time has shown less impact in enhancing the XOS 292
production. Hence the ideal condition concluded for the maximum yield of XOS is pH 4.75, temperature 45°C, 293
enzyme 4 U/ml and Time 16 h. Jayapal et al. (2013) have produced XOS at pH 4, using enzyme at 2.65 U/ml, 294
time 8 hours and temperature 40°C whereas Samanta et al. (2014) produced XOS at pH 3.53, Temperature 295
51.46°C, enzyme 24.7 U/ml and time 12 hours. 296
3.4 Characterization of Xylan and XOS 297
3.4.1 Fourier Transform Infra Red (FTIR) analysis of xylan and XOS 298
FTIR was employed to study the functional groups present in the Xylan and XOS which corresponds to a signature 299
molecule (Fig. 3). The FTIR spectrum for the sugarcane bagasse xylan peaks at 3762cm-1, 3347 cm-1, 2917 cm-1 300
represents the OH and CH stretching of xylan (Peng et al. 2010, Samanta et al. 2012, Jayapal et al. 2013, and 301
Hesam et al. 2020). The short narrow bend denotes the o acetyl group in the hemicelluloses chain, 1640 cm-1 due 302
to the presence of residual water. 1373 cm-1 and 1219cm-1are due to the CH, OH, or CO stretching and bending 303
vibrations of the hemicelluloses. 1033 cm-1 and 896 cm-1 denotes the1-4 β configuration of xylan (Hasem et al. 304
2020). The spectrum at 1635cm-1 represents the CH streaking of Xylooligosaccarides (Peng et al. 2010). 305
Asymmetric and symmetric (C=O) stretching vibration of the Carbohydrate groups made small vibration at 306
3289 cm-1. A peak at 1286 cm-1 elucidates the C=O and C-O stretching. A small vibration at 1054 cm-1 is due to 307
the presence of 4-O methyglucuronoxylan type oligo and polymers (Kacurakova et al. 1998). 308
3.4.2 XRD analysis of xylan and XOS 309
The XRD profile for xylan was represented in Fig 4. Various peaks 2 theta values ranging from 4 to 90 spectrum 310
were observed. The narrow sharp and short broad peaks represent crystalline and amorphous phases. 9.35, 8.99, 311
11.14, 18.72, 18.90, 22.6, 22.34, 26.64, 26.65, 29.7, 29.36, 30.82, 33.88, 36.42, 40.89 and 44.68 implies the 312
interplanar spacing (d spacing) of 9.60, 7.81, 4.64, 4.12, 3.97, 3.80, 3.56, 3.33, 3.177, 3.01, 2.8, 2.75, 2.72, 2.67, 313
2.53, 2.46, and 2.43. The CI index of xylan is 0.45 (45%). Xylan consists of nearly equal proportions of a 314
crystalline and amorphous phase. The 2theta values of XOS are 9.35, 18.9 and 28.4 represents the d spacing values 315
9.49, 4.71 and 3.13 respectively. The CI index of the XOS is 0.030 (3%). XOS has a majorly amorphous phase 316
with a trace of crystalline structure. Lyophilization (freeze-dried) method was adopted for processing the XOS 317
into powder. During the process, they may let the sample absorb water leads to crystals formations in an 318
amorphous sample (Zhang et al. 2019) 319

3.4.3 1H and 13 C NMR spectrum characterization of XOS 320
The protons in the xylan were analyzed by 1H NMR and illustrated in Fig. 5A The main signals at 4.26 (H-1), 321
3.19 (H-2), 3.59 (H-3), 3.63 (H-4) and 3.98 (H-5) ppm imply the β- D xylopyranosyl residues originated from 4-322
o-methyl α-D GlycpA acid (12). The protons of arabinofuranosyl determine the 5.1 to 5.4ppm and the minor 323
signal at 5.40ppm illustrates the Xylopyranosyl residues. The strong signal at 2.5ppm and 1.630ppm state the 324
Methylene and groups in the solvent (methanol). The 13C NMR spectrum of Xylan (Fig. 5B) represents the (1-325
4)linked β-xylan. Peaks at 102.2 (C-1), 73.04(C-2), 74.43(C-3), 75.78(C-4), 63.98 (C-5) ppm. 102.2ppm peak 326
represents the β configuration of the backbone of the xylan confirmed by 1H NMR. 327
The spectral region ranging between 4.30-5.40ppm in 1H NMR confirms the presence of XOS in the sample (Fig 328
5C). The spectrum of 5.0-5.40ppm and 4.30-4.60ppm represent the α anomeric and β anomeric protons. 5.32 329
ppm is the characteristic signal of α-L-arabiofuranosyl (α-L-Araf) residue (1-2) linked with the monosubstituted 330
β-D xylopyranose residue. The signals at 5.07ppm and 4.50 ppm illustrate the reducing end of X α and X β. 331
5.20ppm was due to the attachment of 4-o-methyl glucuronic acid to xylose through α(1-2) linkage. 4.45 -332
4.35ppm is due to the protons in the internal and nonreducing end of xylosyl residues. The heterogeneity structure 333
of the XOS was analyzed by 13C NMR. The signals at 91.67 ppm and 96.54 ppm determine the reducing end of α 334
and β C-1. The major four signals at 72.74 (C-2), 73.48 (C-3), 76.39 (C-4), 63.05 (C-5) represent the nonreducing 335
end of the β D xyl residues (Fig 5D). 80.76, 77.47, 84.82, 62.8ppm represents the C-2, C-3, C-4, C-5 of αL-Ara 336
units. The signals at 101.4 and 101.7 ppm represent the internal and non-reducing terminals confirmed by 1H 337
NMR. 338
3.4.4 LC-MS/MS Analysis of XOS 339
LC-MS/MS data elucidate the structure, molecular weight and distributions of acetyl groups in the XOS (Fig 6 340
and Table 3). The sharp narrow peak at 305 m/z and 317 m/z indicates the presence of disaccharide(xylobiose-341
C10H18O9) of two pentoses with Na+ ions respectively. The peak at 361 m/z indicates the two pentoses with acetyl 342
and Na+ ions presence. The spectrum at 462 m/z indicates the trisaccharide-xylotriose (C15H26O13) with 3 pentose 343
units with Na+ ions. 615 m/z peak represents the tetrasaccharides -xylotetrose (C20H34O17) made up of four pentose 344
units with Na+ ions and 672 m/z represents the presence of four pentose units with two acetyl groups in the XOS 345
(Xiao et al. 2018). 346
3.4.5 TGA analsyis of XOS 347
In the TGA profile of XOS, the gradient temperature increase elucidates the difference in sample weight due to 348
the presence of volatile groups. For XOS, a weight loss of 17.11% was observed between 100°C -300°C due to 349
the evaporation of water vapors in the sample. After this, the sample may undergo a pyrolysis process where the 350
sample is partially decomposed into ash and the sample loses its weight of 17.90% between 300°C -400°C and 351
the sample would have completely decomposed (14.04%) between 500°C to 600° C into ash by the combustion 352
process (Fig 7). Differential Thermogravimetric analysis (DTG) represents the maximum degradation (Td) at a 353
temperature that determines the stability of the sample. The maximum degradation of the sample was observed at 354
147°C. 355

3.5 Selection attributes of Prebiotics 356
3.5.1 Acid Indigestability 357
The development of prebiotics has focused on the non-digestibility of oligosaccharides (Wang 2009) and to ensure 358
them to reach the colon to benefits the diversity of niche and probiotic microorganisms residing there (Gibson et 359
al. 2004). Prebiotics extracted from sugarcane bagasse were hydrolyzed with artificial gastric juice, the degree of 360
hydrolysis decreased when the pH of the juice increases. Hydrolysis percentage of prebiotics was compared with 361
reference prebiotic (inulin). The hydrolysis of prebiotics ranges from 5.3%, 3.9%, 3.89%, 2.43%, 2%, 1.4% in 362
varied pH (1-6) whereas, the hydrolyzed percentage of Inulin is 52%, 34%, 21.5%, 18% and 15.3%. Maximum 363
hydrolysis (5.3%) was observed in pH 1 at 6 hours of incubation in gastric juice. Hence when comparing with the 364
reference prebiotic, XOS is less digested and the percentage of prebiotic reaching to the intestine is 95% 365
unhydrolyzed and the results are shown in Fig. 8. The degree of hydrolysis at pH 1, 2, 3 and 5 was 4.08%, 2.3%, 366
1.66%, 0.85% and 0.02% in oligosaccharides extracted from Pitaya fruits (Wichenchot et al. 2010). 367
3.5.2 Prebiotic efficiency on Probiotics 368
The efficacy of prebiotic is determined by the selective stimulation of probiotic growth and their metabolism when 369
other commensal microorganisms are available in the intestinal region The growth of all probiotic organisms has 370
increased when the incubation time increases (Fig. 9). In 24 hours L.plantarum, L.fermentum and 371
B.amyloliquefaciens are showed maximum XOS utilization in optical density of 0.99, 0.97, 0.89. Madhukumar 372
and Muralikrishna 2012, evaluated the optical density (A600nm) growth 0.296 and 0.604 of L.plantarum NDRI 373
strain 184 in Bengal gram husk and wheat bran XOS at 24 h incubation. Yu et al. 2015 have also reported that the 374
corncob utilization by L. plantarum QH251 and SC52 was 0.62 and 0.62 at 600nm. 375
3.5.3 Prebiotic Index and Score 376
The prebiotic index is the measurement of growth comparison of probiotic bacteria utilizing the prebiotics and 377
the MRS medium containing glucose as the carbon source in 24 hours of incubation (Table 3A). The value below 378
and near to one is determined as the low efficiency of prebiotic on probiotic utilization. The maximum prebiotic 379
index was noted in L.plantarum (1.92), L.fermentum (1.37) and B.amyloliquefaciens (1.61) and the minimum was 380
observed in B.clausii (0.21). Huebner et al. (2007) derived a prebiotic activity score based on the cell density 381
values of probiotics on prebiotic. 382
The prebiotic score can be calculated by comparing the growth difference between probiotic bacteria in media 383
with glucose and substituted with prebiotics and Reference bacteria (E.coli) in media with glucose and prebiotic 384
substituted media (Table 3B). The score below or near one elucidates that E.coli dominates the growth of probiotic 385
bacteria. The score above one implies that the probiotic bacteria has suppressed the growth of other commensals 386
bacteria with prebiotic as carbon source. L.plantarum and L.fermentum have highest prebiotic score of 12 and 17 387
whereas least was observed in B.clausii (0.9) and E.faecium (0.57) 388
3.6 Bacteriocin produced by probiotics on utilizing the XOS as a carbon source 389
Bacteriocin produced by the probiotic organisms on growing in MRS media (Table 4A. Media substituted with 390
XOS (Table 4B and Fig. 10) as a carbon source were tested against the pathogens. Comparatively, the bacteriocin 391
produced on utilization of prebiotic has the high ability to inhibit the pathogen. Maximum growth inhibition was 392

observed by Enterococcus faecium against E.fecalis (13mm) and Streptococcus pyogenes (11mm). Lactobacillus 393
plantarum against E.fecalis (11mm) and L. monocytogenes (12mm). Bacillus clausii have shown growth 394
inhibition against L.monocytogenes (12mm). All probiotic bacteriocins produced, have shown inhibition against 395
E.coli. Yu et al. (2015) have reported that bacteriocin from Lactobacillus plantarum S2 shown antibacterial 396
activity against Shigella flexneri and E.coli moderately (3-6mm in diameter). Least growth inhibition (0-3mm in 397
diameter) against Salmonella typhimurium and Staphylococcus aureus in all the triplicates. 398
4. Conclusion 399
Xylooligosaccharides can be produced in a single step method by autohydrolysis. But we adopted alkali extraction 400
and enzymatic hydrolysis of xylan that is advantageous as it does not leave any toxic traces in the environment, 401
minimal production of xylose (undesirable component) and cheap method (not laborious). Upon comparing 402
various alkali, NaOH has a greater effect on xylan extraction from sugarcane bagasse. Bio process variables such 403
as temperature, pH, enzyme concentration and reaction time have been optimized for XOS production using RSM. 404
As it is known that XOS is an emerging prebiotic component these days, utilization of agricultural wastes as a 405
source for its production shall open new insights for zero waste technology that can improve gut health with 406
proliferation of residential and probiotic flora. Production of XOS from agricultural residues shall improve socio 407
economic status globally by converting the trash into cash. 408
5. Declarations 409
Ethics approval and consent to participate: Not applicable 410
Consent for publication: All the authors have read the manuscript and approved for its submission 411
Availability of data and materials: All the datasets are included in the manuscript 412
Competing interests: The authors declare that they have no competing interests 413
Funding: This research received no specific grants from any funding agency 414
Author’s Contributions 415
NK has conceptualized and designed the experiments. NK, LG and AN carried out the experiment. VK have 416
helped in analyzing the data. Wrote the manuscript with support from KT and DRA. DRA have supervised the 417
whole experiment. 418
Acknowledgements 419
Authors are thankful to the Department of Biology, The Gandhigram Rural institute-Deemed to be University, 420
Dindigul and Deparmtent of Microbiology, Alagappa University, Karaikudi for providing the necessary laboratory 421
facilities to carry out the experiments. 422
423
424

Figure captions 425
Figure 1 Compositional analysis of Sugarcane bagasse 426
Figure2 Optimization of external factors for the enzymatic production of Xylooligosaccharides using Response 427
Surface Methodology 428
Figure 3 FTIR characterization for alkali extracted xylan and enzymatically produced Xylooliogsaccharide 429
Figure 4 XRD pattern of alkali extracted xylan and enzymatically cleaved Xylooligosaccharide products 430
Figure 5 1H and 13C NMR spectra for alkali extracted xylan (A, B) and its enzymatically cleaved 431
Xylooligosaccharides (C, D) 432
Figure 6 ESI-MS/MS characterization of enzymatically produced Xylooliogsaccharides 433
Figure 7 TGA characterization of enzymatically produced Xylooliogsaccharides 434
Figure 8 Acid Indigestability of XOS 435
Figure 9 Prebiotic efficacy of XOS produced from sugarcane bagasse and Inulin (Commercial prebiotic) 436
Figure 10 Bacteriocin activity from probiotic bacteria grown in prebiotic substituted medium against human 437
pathogens 438
439
440
441
442
443
444
445
446
447
448
449
450
451
452
453
454

6. Reference 455
Agrupis SC, Shirley C, Maekawa E (1999) Industrail utilization of tobacco stalks (I) preliminary evaluation for 456
biomass resources. 53(1): 29-32. https://doi.org/10.1515/HF.1999.005. 457
Akpinar O, Erdogan K, Bostanci, S (2009) Enzymatic production of xylooligosaccharide from selected 458
agricultural wastes. Food and Bioproducts Processing. 87: 145-151. 459
Ayeni AO, Adeeyo OA, Oresegun, Oyinlola M, Oladimeji, Temitayo E (2015) Compositional Analysis of 460
Lignocellulosic Materials: Evaluation of an Economically Viable Method Suitable for Woody and Non-woody 461
Biomass. American Journal of Engineering Research (AJER), 4 (4): 14-19. ISSN e-ISSN: 2320-0847 p-ISSN : 462
2320-0936. 463
Bian J, Peng F, Peng P, Xu F, Sun RC (2010) Isolation and fractionation of hemicelluloses by graded ethanol 464
precipitation from Caragana korshinskii. Carbohydrate research. 345: 802-809. 465
Bon EP, Ferrara MA (2007) Bioethanol production via enzymatic hydrolysis of cellulosic biomass. In FAO 466
Seminar on The Role of Agricultural Biotechnologies for Production of Bioenergy in Developing Countries, 467
Rome. 468
Cardona CA, Quintero JA, Paz IC (2010) Production of bioethanol from sugarcane bagasse: status and 469
perspectives. Bioresource technology. 101: 4754-4766. 470
Carvalho DM, MartínezAbad A, Evtuguin DV, Colodette JL, Lindström ME, Vilaplana F, Sevastyanova O (2017) 471
Isolation and characterization of acetylated glucuronoarabinoxylan from sugarcane bagasse and 472
straw. Carbohydrate polymers. 156: 223-234. 473
Cerqueira DA, Rodrigues, Filho G, Silva MC (2007) Optimization of sugarcane bagasse cellulose 474
acetylation. Carbohydrate Polymers. 69: 579-582. 475
Chaikumpollert O, Methacanon P, Suchiva K (2004) Structural elucidation of hemicelluloses from Vetiver 476
grass. Carbohydrate Polymers. 57: 191-196. 477
Chandrasekharaiah M, Thulasi A, Sampath KT, Prasad CS, Samanta AK, Kolte AP (2007) Prebiotics: the rumen 478
modulator for enhancing the productivity of dairy animals. Indian Dairyman 59(8): 58-61. 479
Chapla D, Pandit P, Shah A (2012) Production of xylooligosaccharaides from corncob xylan by fungal xylanase 480
and their utilization by probiotics. Bioresour. Techol., 115: 215-221. 481
Collins MD, Gibson GR (1999) Probiotics, prebiotics, and synbiotics: approaches for modulating the microbial 482
ecology of the gut. The American journal of clinical nutrition. 69: 1052-1057. 483
Gibson GR, Probert HM, Van Loo J, Rastall RA, Roberfroid MB (2004) Dietary modulation of the human colonic 484
microbiota: updating the concept of prebiotics. Nutrition research reviews. 17: 259-275. 485

Gibson GR, Roberfroid MB (1995) Dietary modulation of the human colonic microbiota: introducing the concept 486
of prebiotics. The Journal of nutrition. 125(6): 1401-1412. 487
Hesam F, Tarzi BG, Honarvar M, Jahadi M (2021) Pistachio (Pistacia vera) shell as a new candidate for enzymatic 488
production of xylooligosaccharides. Journal of Food Measurement and Characterization. 15: 33-45. 489
Huebner J, Wehling RL, Hutkins RW (2007) Functional activity of commercial prebiotics. International Dairy 490
Journal. 17: 770-775. 491
Jayapal N, Samanta AK, Kolte AP, Senani S, Sridhar M, Suresh KP, Sampath KT (2013) Value addition to 492
sugarcane bagasse: xylan extraction and its process optimization for xylooligosaccharides production. Industrial 493
Crops and Products 42: 14-24. 494
Jnawali P, Kumar V, Tanwar B, Hirdyani H, Gupta P (2018) Enzymatic production of xylooligosaccharides from 495
brown coconut husk treated with sodium hydroxide. Waste and Biomass Valorization, 10: 1757-1766. 496
Kačuráková M, Belton PS, Wilson RH, Hirsch J, Ebringerová A (1998) Hydration properties of xylan‐type 497
structures: an FTIR study of xylooligosaccharides. Journal of the Science of Food and Agriculture. 77(1): 38-44. 498
Klaenhammer TR, Kullen MJ (1999) Selection and design of probiotics. International journal of food 499
microbiology. 50: 45-57. 500
Lane JH, Eynon L (1923) Methods for Determination of Reducing and Non-Reducing Sugars. Journal of Sciences. 501
42: 32-37. 502
Lavarack BP, Griffin GJ, Rodman D (2000) Measured kinetics of the acid-catalysed hydrolysis of sugar cane 503
bagasse to produce xylose Catalysis Today. 63: 257-265. 504
Lavarack BP, Griffin GJ, Rodman D (2002) The acid hydrolysis of sugarcane bagasse hemicellulose to produce 505
xylose, arabinose, glucose and other products. Biomass and bioenergy. 23: 367-380. 506
Madhukumar MS, Muralikrishna G (2012) Fermentation of xylo-oligosaccharides obtained from wheat bran and 507
Bengal gram husk by lactic acid bacteria and bifidobacteria. Journal of food science and technology.49: 745-752. 508
Okazaki M, Fujikawa S, Matsumoto N (1990) Effect of xylooligosaccharide on the growth of 509
bifidobacteria. Bifidobacteria and Microflora. 9: 77-86. 510
Pandey A, Soccol CR, Nigam P, Soccol VT (2000). Biotechnological potential of agro-industrial residues. I: 511
sugarcane bagasse. Bioresource technology. 74: 69-80. 512
Peng F, Ren JL, Xu F, Bian J, Peng P, Sun RC (2010) Fractional study of alkali-soluble hemicelluloses obtained 513
by graded ethanol precipitation from sugar cane bagasse. Journal of agricultural and food chemistry. 58: 1768-514
1776. 515
Roberfroid MB (1999) Dietary fiber properties and health benefits of non-digestible oligosaccharides. CRC Press 516
1st edition. EISBN 9780429221941 517

Rodriguez SG, Gomez RL , Garcia GM., Cruz GA (2019) Prebiotic effect of commercial saccharides on probiotic 518
bacteria isolated from commercial products Food Science and Technology. 39(3): 747-753. 519
Rycroft CE, Jones MR, Gibson GR, Rastall RA (2001) A comparative in vitro evaluation of the fermentation 520
properties of prebiotic oligosaccharides. Journal of applied microbiology. 91: 878-887. 521
Samanta AK, Jayapal N, Kelte AP, Senani S, Sridhar M, Dhali A, suresh KP, Jayaram C and Prasad CD (2014) 522
Process for enzymatic production of xylooligosaccharides from the xylan of corn cobs. I. food precessing and 523
preservation. doI: 10. 1111/ifpp. 12282. 524
Samanta AK, Jayapal N, Kolte AP, Senani S, Sridhar M, Dhali A, Prasad CS (2015) Process for enzymatic 525
production of xylooligosaccharides from the xylan of corn cobs. Journal of Food Processing and 526
Preservation. 39:729-736. 527
Samanta AK, Jayapal N, Kolte AP, Senani S, Sridhar M, Suresh KP, Sampath KT (2012) Enzymatic production 528
of xylooligosaccharides from alkali solubilized xylan of natural grass (Sehima nervosum). Bioresource 529
Technology. 112: 199-205. 530
Samanta AK, Senani SS, Kolte AP, Sridhar M, Jayapal N, Devi A (2010) Optimization of condition for extraction 531
of xylan from corn byproducts. In: Proceedings of International Conference on Environmental Pollution, Water 532
Conservation and Health held at Bangalore from July 29–31 141. 533
Singh RP, Shukla MK, Mishra A, Kumari P, Reddy CRK, Jha B (2011) Isolation and characterization of 534
exopolysaccharides from seaweed associated bacteria Bacillus licheniformis. Carbohydrate Polymers. 84:1019-535
1026. 536
Supriya A. Yadav, Snehal S. Gite, Vikram B. Lanjekar, Smita S. Nilegaonkar* and Vaishali V. Agte In vitro 537
screening of indigenous plant materials for prebiotic potential. Int.J.Curr.Microbiol.App.Sci (2014) 3(11) 137-538
150 539
Vazquez MJ, Alonso JL, Domınguez H, Parajo JC (2000) Xylooligosaccharides: manufacture and 540
applications. Trends in Food Science & Technology, 11: 387-393. 541
Voragen AG (1998) Technological aspects of functional food-related carbohydrates. Trends in Food Science & 542
Technology. 9: 328-335. 543
Wang Y (2009) Prebiotics: Present and future in food science and technology. Food Research International, 42: 544
8-12. 545
Wichienchot S, Jatupornpipat M, Rastall RA (2010) Oligosaccharides of Pitaya (dragon fruit) flesh and their 546
prebiotic properties. Food chemistry. 120: 850-857. 547
Xiao X, Wen JY, Wang YY, Bian J, Li MF, Peng F, Sun RC (2018) NMR and ESI–MS spectrometry 548
characterization of autohydrolysis xylo-oligosaccharides separated by gel permeation 549
chromatography. Carbohydrate polymers, 195: 303-310. 550
Yu X, Yin J, Li L, Luan C, Zhang J, Zhao C, Li S (2015) Prebiotic potential of xylooligosaccharides derived from 551
corn cobs and their in vitro antioxidant activity when combined with Lactobacillus. Journal of microbiology and 552
biotechnology. 25: 1084-1092. 553
554
555
556
557
558
559
560
561
562
563
564
Table 1 Comparisons between different alkali treatment on the extraction of xylan from
sugarcane bagasse
Alkali
Concentration (%)
NaOH KOH
*Xylan (g)
Mean ± SD
True
yield
(%)
Relative
yield (%)
*Xylan(g)
Mean±SD
True yield
(%)
Relative
yield (%)
4 0.11 ± 0.02 11 44 0.04±0.00 4 16
8 0.12 ±0.01 12 48 0.07±0.00 8 31
12 0.09 ±0.01 13 52 0.13±0.00 14 54
16 0.21±0.03 16 64 0.16±0.01 16 64
20 0.21±0.00 22 86 0.19±0.00 18 72
24 0.19±0.00 20 76 0.15±0.07 20 78
28 0.23 ±0.060 14 56 0.16±0.01 17 66
32 0.24 ±0.128 13 52 0.14±0.00 14 56
36 0.24 ±0.133 13 52 0.12±0.04 13 50
40 0.24 ±0.045 12 48 0.07±0.01 7 28

565
566
567
568
Table 2 Optimization of external factors for the enzymatic production of Xylooligosaccharides
using Response Surface Methodology (RSM)
Factors Xylooligosaccharides
(mg/ml)
A: pH B:Temperature
(°C)
C:Enzyme
(U/ml)
D: Time
(h) Observed Value Predicted Value
4.00 45 12 8 0.65 0.66
4.00 40 12 12 0.662 0.65
4.75 45 12 12 0.74 0.64
4.75 45 4 24 0.96 0.98
4.75 45 20 8 0.69 0.68
4.75 45 20 24 0.63 0.64
4.75 45 12 12 0.53 0.64
4.75 40 12 8 0.67 0.69
4.75 45 12 12 0.56 0.63
4.75 50 12 8 0.58 0.59
4.75 40 12 24 0.53 0.58
4.75 40 4 12 1.16 1.11
4.75 45 12 12 0.69 0.63
5.5 45 20 12 0.63 0.64
4.75 50 12 24 0.56 0.60
5.50 45 12 8 0.66 0.63
4.00 50 12 12 0.67 0.63
4.00 45 12 24 0.66 0.60
4.00 45 4 12 0.99 1.04
4.75 50 4 12 0.95 0.93
5.50 40 12 12 0.64 0.67
5.50 50 12 12 0.53 0.54
4.75 50 20 12 0.68 0.66
5.50 45 12 24 0.64 0.58
4.75 45 12 12 0.67 0.63
5.50 45 4 12 0.98 1.00
4.00 45 20 12 0.62 0.6671
4.75 40 20 12 0.69 0.6446
4.75 45 4 12 1.04 1.03

569
570
571
572
573
574
575
576
577
578
579
580
581
582
583
584
585
Table 3 LC MS/MS analysis for XOS
Peak No Compounds other
than XOS (m/z)
XOS
(m/z)
No.of Pentose
units
Na+adducted
XOS (m/z)
Acetyl
Adducted
XOS
(m/z)
1 294 2 (Xylobiose) 305
2 294 2(Xylobiose) 317
3 294 2(Xylobiose) 305 361
4 406 - - - -
5 436 - - - -
6 441 3(Xylotriose) 462
7 569 - - - -
8 588 4(Xylotetrose) 615 -
9 588 4(Xylotetrose) 672
10 701 - - - -
Table 4A Evaluation of prebiotic index of Xylooligosaccharides
Probiotic organisms Prebiotic Index ± SD* for XOS
Lactobacillus plantarum MT228948 1.926829 ±0.24
Lactobacillus fermentum MT230901 1.372263±0.33
Bacillus amyloliquefaciens MT193292 1.619565±0.37
Bacillus clausii MN658363 0.21148±0.42
Enterococcus faecium MN956828 1.426702±0.53

586
587
588
589
590
591
592
593
594
595
596
597
598
Table 4B Evaluation of Prebiotic Score by comparing the growth of Probiotics and E. coli in the
prebiotic (XOS) substituted and synthetic medium
Probiotic organisms
Prebiotic Score ± SD*
24 h 48 h
Lactobacillus plantarum MT228948 12.437±0.64 00.737±0.59
Lactobacillus fermentum MT230901 17.289±0.34 00.979±0.52
Bacillus amyloliquefaciens MT193292 04.210±0.40 00.905±0.72
Bacillus clausii MN658363 00.900±0.43 01.021±0.57
Enterococcus faecium MN956828 00.575±0.25 00.634±0.65
Table 5A Bacteriocin activity from probiotic bacteria grown in synthetic medium
Test Pathogens
Zone of growth inhibition (mm in diameter)
Lactobacillus
plantarum
MT228948
Lactobacillus
fermentum
MT230901
Bacillus
amyloliquefaciens
MT193292
Bacillus
clausii
MN658363
Enterococcus
faecium
MN956828
Escherichia coli
MTCC 2622 - - - 17.5±0.073
11.5±
0.0053
Staphylococcus
aureus
MTCC 7278
16.5±0.045 - 16.5± 0.020 13±0.067 15.5±0.0075
Enterococcus
faecalis MTCC 439 - 12.6± 0.057 - 17.5±0.039 15±0.00
Listeria
monocytogenes
MTCC 657
- - 18.5±0.065 12.5±0.049 -
Streptococcus
pyogenes MTCC
442
5.5±0.070 4.9±0.820 - - 5±0.034

599
600
601
602
603
604
605
606
607
608
Table 5B Bacteriocin activity from probiotic bacteria grown in prebiotic substituted medium
Test
Pathogens
Zone of growth inhibition (mm in diameter)
Lactobacillus
plantarum
MT228948
Lactobacillus
fermentum
MT230901
Bacillus
amyloliquefaciens
MT193292
Bacillus
clausii
MN658363
Enterococcus
faecium
MN956828
Escherichia
coli
MTCC 2622
11±0.63 11±0.57 7±0.28 8±0.08 10±0.57
Staphylococcus
aureus
MTCC 7278
10.2±0.12 9.5±0.045 10.5±0.02 0 0
Enterococcus
faecalis
MTCC 439
11±0.57 10±1.52 12±0.52 0 13±0.04
Listeria
monocytogenes
MTCC 657
12±0.72 11±0.57 0 12±0.5 0
Streptococcus
pyogenes
MTCC 442
6±0.22 - - 7±0.03 11±0.034

609
610
611
612
613

Figures
Figure 1
Compositional analysis of Sugarcane bagasse

Figure 2
Optimization of external factors for the enzymatic production of Xylooligosaccharides using ResponseSurface Methodology

Figure 3
FTIR characterization for alkali extracted xylan and enzymatically produced Xylooliogsaccharide

Figure 4
XRD pattern of alkali extracted xylan and enzymatically cleaved Xylooligosaccharide products

Figure 5
1H and 13C NMR spectra for alkali extracted xylan (A, B) and its enzymatically cleavedXylooligosaccharides (C, D)
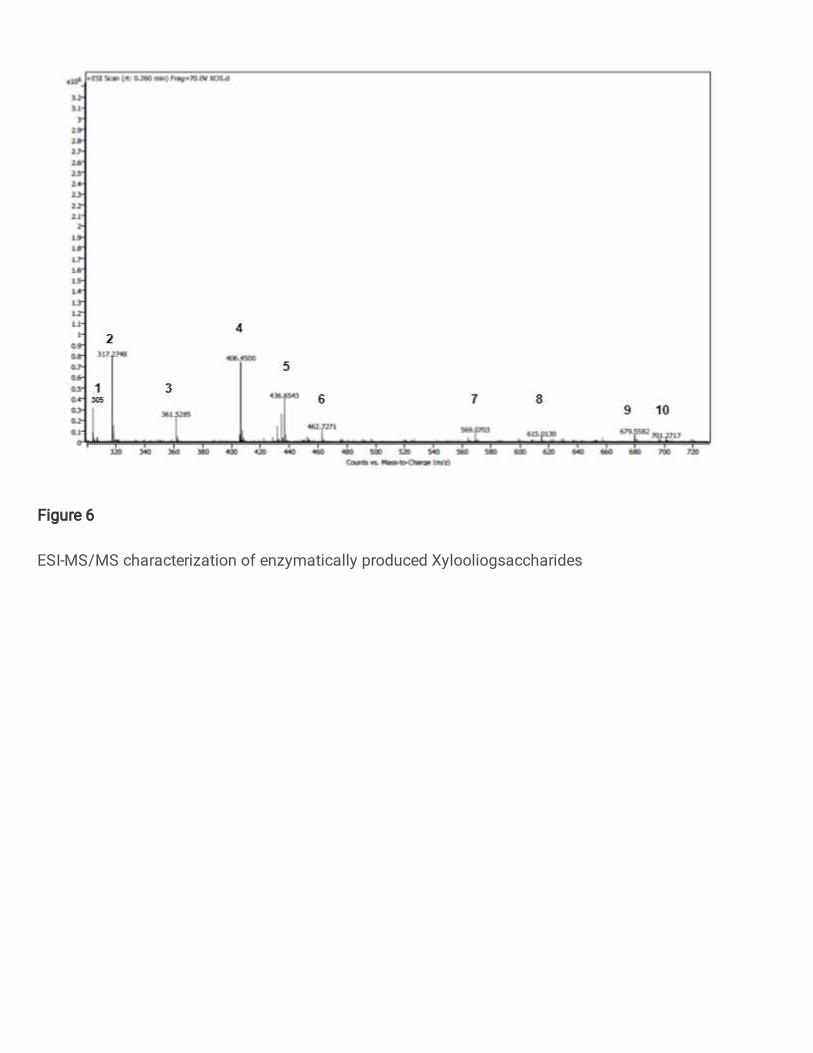
Figure 6
ESI-MS/MS characterization of enzymatically produced Xylooliogsaccharides

Figure 7
TGA characterization of enzymatically produced Xylooliogsaccharides

Figure 8
Acid Indigestability of XOS

Figure 9
Prebiotic e�cacy of XOS produced from sugarcane bagasse and Inulin (Commercial prebiotic)
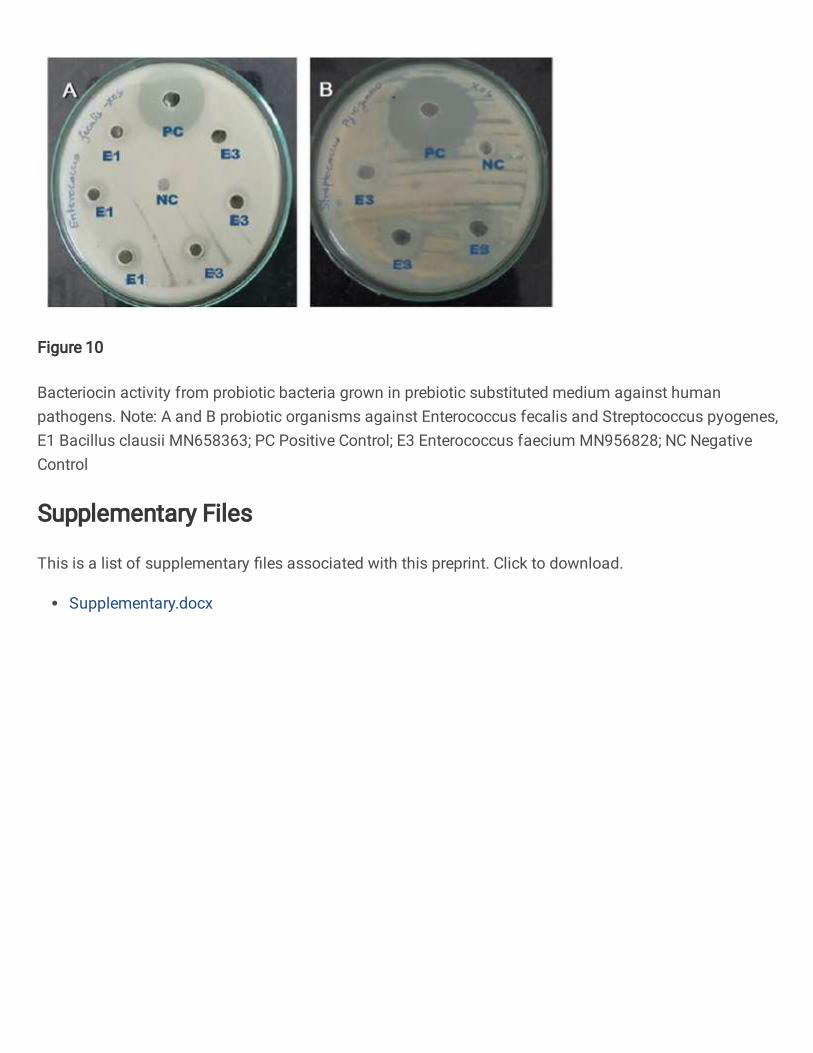
Figure 10
Bacteriocin activity from probiotic bacteria grown in prebiotic substituted medium against humanpathogens. Note: A and B probiotic organisms against Enterococcus fecalis and Streptococcus pyogenes,E1 Bacillus clausii MN658363; PC Positive Control; E3 Enterococcus faecium MN956828; NC NegativeControl
Supplementary Files
This is a list of supplementary �les associated with this preprint. Click to download.
Supplementary.docx
Related Documents