3 Appendix Utility Wildfire Mitigation Data Strategy Utility Wildfire Mitigation Strategy and Roadmap for the Wildfire Safety Division FINAL

Welcome message from author
This document is posted to help you gain knowledge. Please leave a comment to let me know what you think about it! Share it to your friends and learn new things together.
Transcript

3 Appendix
Utility Wildfire Mitigation Data Strategy
Utility Wildfire Mitigation Strategy and Roadmap for the Wildfire Safety Division
FINAL

Table of Contents | Appendix 3: Utility Wildfire Mitigation Data Strategy
Table of Contents 1 Introduction ..................................................................................................................................................................... 3
1.1 Summary................................................................................................................................................................ .. 3 1.2 Current data strategy.......................................................................................................................................... 4
2 Recommendations.......................................................................................................................................................11 2.1 Importance of a data strategy .......................................................................................................................11 2.2 Framework ........................................................................................................................................................... 11
2.2.1 Data vision ........................................................................................................................................................... 11 2.2.2 Use cases ...................................................................................................................................................... 12
2.3 Guiding principles for development...........................................................................................................12 3 Data strategy & roadmap.......................................................................................................................................... 14
3.1 Near-term action plan ...................................................................................................................................... 15 3.1.1 Recommended actions ...........................................................................................................................15 3.1.2 Key tactical elements of near-term implementation plan .......................................................16 3.1.3 Implementation timeline.......................................................................................................................18 3.1.4 Near-term use case ..................................................................................................................................18
3.2 Mid-term action plan ........................................................................................................................................24 3.2.1 Recommended actions ...........................................................................................................................24 3.2.2 Key tactical elements of mid-term implementation plan ........................................................24 3.2.3 Implementation timeline.......................................................................................................................27 3.2.4 Mid-term use case ....................................................................................................................................28
3.3 Long-term opportunities................................................................................................................................. 30 3.3.1 Potential actions................................................................................................................................................30 3.3.2 Example case study: data strategy implementation at the FAA ....................................................30 3.3.3 Long-term use case ..........................................................................................................................................32 3.3.4 Long-term coordination and integration with other state agencies ...........................................35
4 Conclusion....................................................................................................................................................................... 37
Utility Wildfire Mitigation Strategy 2

Table of Contents | Appendix 3: Utility Wildfire Mitigation Data Strategy
1 Introduction
1.1 Summary
Currently, the Wildfire Safety Division (WSD) within the California Public Utilities Commission (CPUC), and California’s broader wildfire community, encounter a set of pain points that limit their ability to pursue long-term, utility-related wildfire risk management objectives. The pain points include:
• Poor data quality and limited availability • Lack of process standardization across stakeholders • Need for manual intervention in decision-making processes • Lack of transparency • Limited participation of relevant stakeholders
These pain points hamper a data-driven approach to utility wildfire risk management. Although many stakeholders are pursuing the use of data to better gauge and manage their risks, the lack of an overall strategy has meant that individual activities have taken place in silos, hindering implementation of statewide solutions.
WSD and its partners (such as CAL FIRE and Cal OES) can benefit from a robust and holistic data strategy in seeking to address existing pain points and more effectively manage utility-related wildfire risks for the State of California. The data strategy here would underpin the creation, maintenance, distribution, and operationalization of data across wildfire stakeholders, enabling data-supported decisions that are faster, more consistent, and more transparent.
The data strategy empowers the WSD to transcend today’s manual reviews of utility wildfire mitigation plans, and to realize a digital future with decisions enabled by data and objective criteria. For example, the data strategy supports use cases, such as actively monitoring utilities’ Public Safety Power Shutoffs (PSPS) mitigation activities by connecting field audit data with planned mitigation activities. Similarly, longer-term a properly implemented data strategy supports analyses of wildfire risk factors, enabling coordinated action across stakeholders and efficient use of limited state resources. This data-driven decision-making will put the state at the cutting edge of the global fight against utility-related wildfires.
Pivotal to the data strategy is the build out of a data platform, a central repository and source of truth for key decision-driving data. The data platform can integrate data and qualitative inputs in a consistent manner from relevant stakeholders to support analyses and insights that drive utility wildfire mitigation and management decisions.
Implementation of the data strategy should occur in three phases. In the near-term, foundational elements of the data strategy will be operationalized, concurrent with any relevant immediate priorities like the 2020 WMP review process. In the medium-term a data platform supporting data collection, validation, archiving, and reporting is planned to be designed, built, and tested. The data platform can serve as a foundation for actions in the longer-term, where external data could be ingested by the WSD or its partners to enable advanced analytics and other enhanced use cases. At its maturity, the data strategy supports a broader implementation of more sophisticated analyses and engagement of a wider range of stakeholders. Operationalizing the data strategy requires investments in people, processes, and tools. Investment in people at the WSD, as well as partnerships with organizations such as CAL FIRE
Utility Wildfire Mitigation Strategy 3
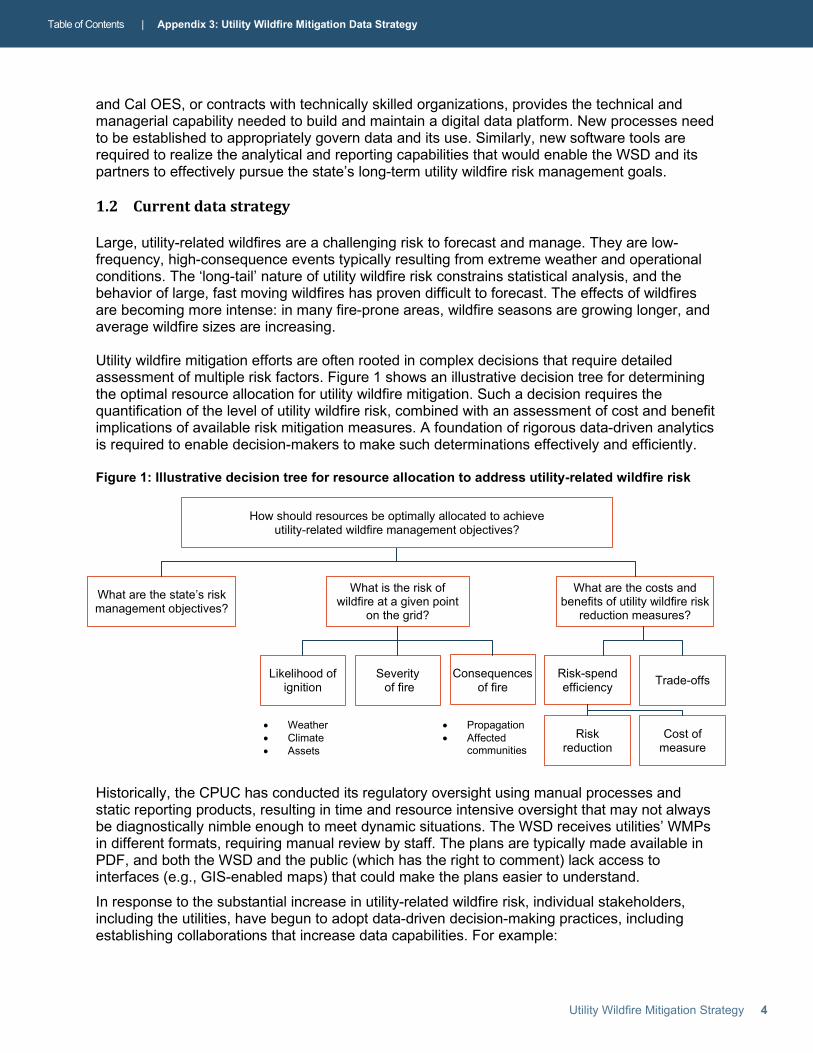
Table of Contents | Appendix 3: Utility Wildfire Mitigation Data Strategy
and Cal OES, or contracts with technically skilled organizations, provides the technical and managerial capability needed to build and maintain a digital data platform. New processes need to be established to appropriately govern data and its use. Similarly, new software tools are required to realize the analytical and reporting capabilities that would enable the WSD and its partners to effectively pursue the state’s long-term utility wildfire risk management goals.
1.2 Current data strategy
Large, utility-related wildfires are a challenging risk to forecast and manage. They are low-frequency, high-consequence events typically resulting from extreme weather and operational conditions. The ‘long-tail’ nature of utility wildfire risk constrains statistical analysis, and the behavior of large, fast moving wildfires has proven difficult to forecast. The effects of wildfires are becoming more intense: in many fire-prone areas, wildfire seasons are growing longer, and average wildfire sizes are increasing.
Utility wildfire mitigation efforts are often rooted in complex decisions that require detailed assessment of multiple risk factors. Figure 1 shows an illustrative decision tree for determining the optimal resource allocation for utility wildfire mitigation. Such a decision requires the quantification of the level of utility wildfire risk, combined with an assessment of cost and benefit implications of available risk mitigation measures. A foundation of rigorous data-driven analytics is required to enable decision-makers to make such determinations effectively and efficiently.
Figure 1: Illustrative decision tree for resource allocation to address utility-related wildfire risk
• Weather• Climate• Assets
• Propagation• Affected
communities
What is the risk of wildfire at a given point
on the grid?
What are the state’s risk management objectives?
What are the costs and benefits of utility wildfire risk
reduction measures?
Risk reduction
Risk-spend efficiency
Cost of measure
Trade-offs Likelihood of ignition
Consequences of fire
Severity of fire
Historically, the CPUC has conducted its regulatory oversight using manual processes and static reporting products, resulting in time and resource intensive oversight that may not always be diagnostically nimble enough to meet dynamic situations. The WSD receives utilities’ WMPs in different formats, requiring manual review by staff. The plans are typically made available in PDF, and both the WSD and the public (which has the right to comment) lack access to interfaces (e.g., GIS-enabled maps) that could make the plans easier to understand. In response to the substantial increase in utility-related wildfire risk, individual stakeholders, including the utilities, have begun to adopt data-driven decision-making practices, including establishing collaborations that increase data capabilities. For example:
Utility Wildfire Mitigation Strategy 4
How should resources be optimally allocated to achieve utility-related wildfire management objectives?
Data are not collected in the same manner,
Limited data quality
1 5
Table of Contents | Appendix 3: Utility Wildfire Mitigation Data Strategy
Lack of standardization
Decisions require manual intervention
Lack of transparency
Limited stakeholder participation
2 3 4
• In 2019, SCE pioneered the use of a Multi-Attribute Risk Score (MARS), whichcombined multiple drivers to quantify the relative severity of different risks (includingwildfire) and applied it to estimate the impact and risk-spend efficiency (RSE) of potentialrisk mitigation measures, in a safety report to the CPUC.1
• In 2019, SDG&E launched proprietary software to quantify the risk of vegetation contactfor each of its circuits, based on such data inputs as the counts of trees adjacent to thecircuit’s right-of-way by species and height, as well as a historical correlation withoutages.2
• In 2019, some utilities, as part of their preparation for the WMPs, utilized private, thirdparty wildfire propagation modeling to identify areas of high risk at more granular scalesthan the CPUC’s High Fire Threat District (HFTD) maps.
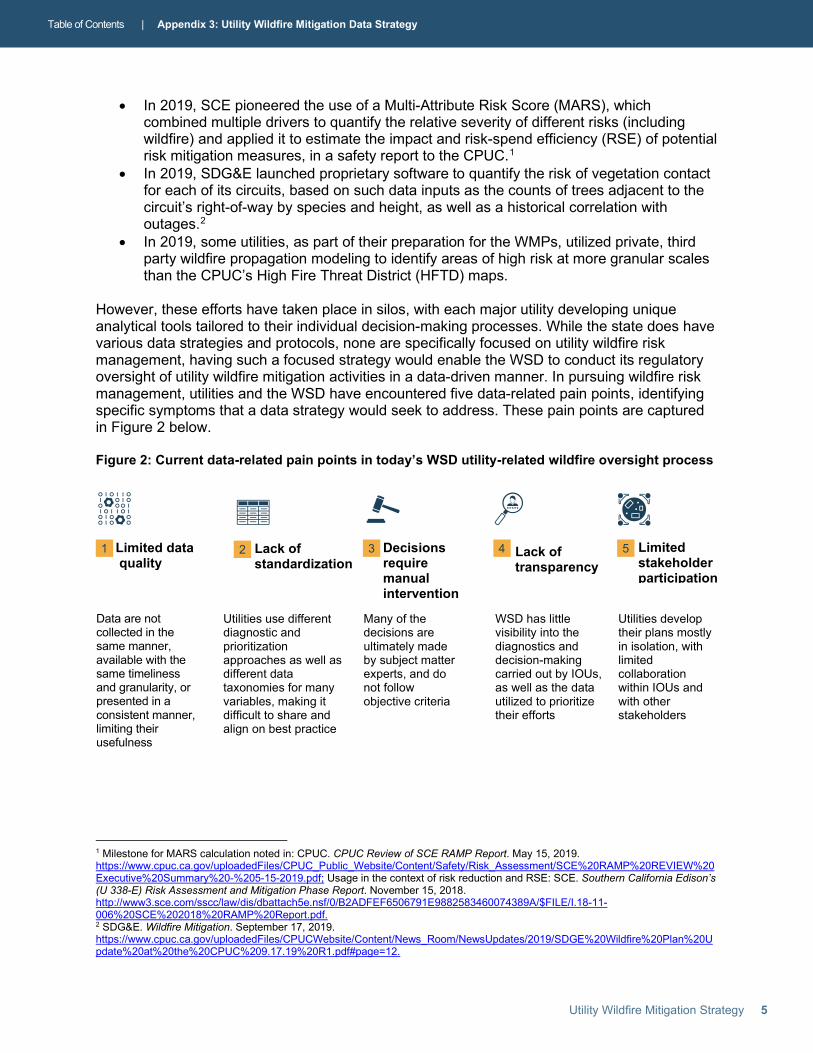
However, these efforts have taken place in silos, with each major utility developing unique analytical tools tailored to their individual decision-making processes. While the state does have various data strategies and protocols, none are specifically focused on utility wildfire risk management, having such a focused strategy would enable the WSD to conduct its regulatory oversight of utility wildfire mitigation activities in a data-driven manner. In pursuing wildfire risk management, utilities and the WSD have encountered five data-related pain points, identifying specific symptoms that a data strategy would seek to address. These pain points are captured in Figure 2 below.
Figure 2: Current data-related pain points in today’s WSD utility-related wildfire oversight process
Utilities use different diagnostic and
Many of the decisions are
WSD has little visibility into the
Utilities develop their plans mostly
prioritization ultimately made diagnostics and in isolation, with available with the approaches as well as by subject matter decision-making limited same timeliness different data experts, and do carried out by IOUs, collaboration and granularity, or taxonomies for many not follow as well as the data within IOUs and presented in a variables, making it objective criteria utilized to prioritize with other consistent manner, difficult to share and their efforts stakeholders limiting their align on best practice usefulness
1 Milestone for MARS calculation noted in: CPUC. CPUC Review of SCE RAMP Report. May 15, 2019. https://www.cpuc.ca.gov/uploadedFiles/CPUC_Public_Website/Content/Safety/Risk_Assessment/SCE%20RAMP%20REVIEW%20 Executive%20Summary%20-%205-15-2019.pdf; Usage in the context of risk reduction and RSE: SCE. Southern California Edison’s (U 338-E) Risk Assessment and Mitigation Phase Report. November 15, 2018. http://www3.sce.com/sscc/law/dis/dbattach5e.nsf/0/B2ADFEF6506791E9882583460074389A/$FILE/I.18-11-006%20SCE%202018%20RAMP%20Report.pdf.2 SDG&E. Wildfire Mitigation. September 17, 2019. https://www.cpuc.ca.gov/uploadedFiles/CPUCWebsite/Content/News_Room/NewsUpdates/2019/SDGE%20Wildfire%20Plan%20U pdate%20at%20the%20CPUC%209.17.19%20R1.pdf#page=12.
Utility Wildfire Mitigation Strategy 5

Table of Contents | Appendix 3: Utility Wildfire Mitigation Data Strategy
1. Limited data quality
Currently available wildfire and utility data are affected by four issues:
a. Data availability
In the past, the CPUC has also not historically collected data on (or even established standardized definitions for) metrics including near-miss/near-hit3 events, such as incipient faults, as part of its utility wildfire risk management oversight.4 The WSD is in the process of regularly collecting the data that it would need to monitor utility activities and outcomes.
b. Data accessibility
Historically, some data is provided in PDF or image form, requiring manual extraction to put them in a useable, accessible format. For example, the WMPs were filed as PDFs and data tables were provided in MS Excel. However, utilities took many liberties in reformatting the MS Excel tables and as a result readers seeking the same data across were required to manually scan through each filing and transcribe the data.
c. Data consistency
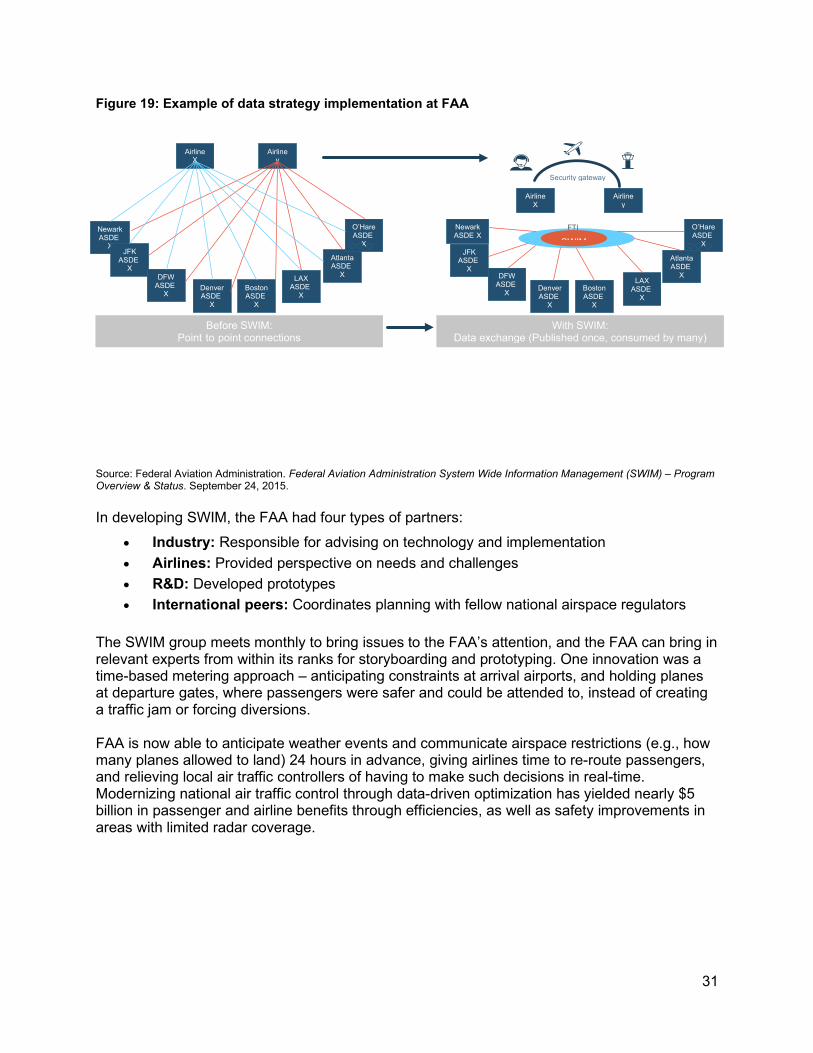
The WSD is working towards collecting utility data consistently and in a timely and standardized manner. However, certain data, such as, fuel moisture content, a key input to wildfire propagation models, is plagued by a lack of sampling guidelines and is not consistently collected, limiting the accuracy of risk forecasts, as well as an intermittence in the update cycle of the public database storing the data.
Data freshness
Lastly, some key data used for standard fire risk analysis is stale, relative to the time frame of the analyses for which they are used. For example, a commonly used map of fuel load5
was last updated in 2016,6 which means the map does not reflect the significant vegetation growth due to strong precipitation in water years 2017 and 2019.7
3 The CPUC lacks a definition of ‘near-miss or ‘near-hit’ in the utility wildfire context; c.f. for worker safety: “A near hit can be described as an incident that occurred and did not cause harm to a person…but could have resulted in injury.” Source: NorthStar Consulting Group. Assessment of Pacific Gas and Electric Corporations and Pacific Gas and Electric Company’s Safety Culture. May 8, 2017. https://www.cpuc.ca.gov/uploadedFiles/CPUC_Public_Website/Content/Safety/Risk_Assessment/PGE%20Final%20Safety%20Rep ort%205-8-17%20NorthStar%20Consulting.pdf#page=2544 In its review of the 2019 WMPs, the CPUC noted that these metrics would be developed in Phase 2 (i.e. in June 2019, after 2019 WMPs were approved). Source: CPUC. Guidance Decision on 2019 Wildfire Mitigation Plans Submitted Pursuant to Senate Bill 901. June 3, 2019. http://docs.cpuc.ca.gov/PublishedDocs/Published/G000/M296/K577/296577466.PDF#page=26. Damage to utility systems (which could constitute near-misses) after Public Safety Power Shut-offs are reported, but not in a standardized manner) c.f. PG&E, PG&E's Public Safety Power Shutoff Oct. 23-25, 2019 Report, November 8, 2019. https://www.cpuc.ca.gov/uploadedFiles/CPUCWebsite/Content/News_Room/NewsUpdates/2019/PGE%20Public%20Safety%20Po wer%20Shutoff%20Oct.%2023-25,%202019%20Report.pdf#page=5; SCE. Amended PSPS Post Event Report Regarding Pro-Active De-Energization Event October 21 to October 26, 2019. November 26, 2019. https://www.cpuc.ca.gov/uploadedFiles/CPUCWebsite/Content/News_Room/NewsUpdates/2019/Amended%20SCE%20Post%20E vent%20Reporting%20October%2021%20through%20October%2026,%202019.pdf#page=10.5 Fuel load is the density of biomass (which would become fuel for a fire) in a given location. Fuel load is reduced when a fire burns through the location or is reduced through intervention (e.g., thinning). 6 The 2019-2020 update to the United States Department of Interior (DOI)’s LANDFIRE, LF Remap, is based on 2016 observations. Source: U.S. Department of the Interior. LANDFIRE Remap (LF 2.0.0). https://www.landfire.gov/lf_remap.php. 7 California Department of Water Resources. Water Year 2017: What a Difference a Year Makes. September 17, 2017. https://water.ca.gov/LegacyFiles/waterconditions/docs/2017/Water%20Year%202017.pdf; California Department of Water
Utility Wildfire Mitigation Strategy 6

Table of Contents | Appendix 3: Utility Wildfire Mitigation Data Strategy
2. Lack of standardization
Currently, stakeholders’ data and diagnostics are not held to universal standards. In many instances, each stakeholder has its own methods and indices for utility wildfire risk assessment and planning, limiting the ability to make statewide comparisons and introducing opportunities for misalignment. For example, each of the major IOUs has their own individual Fire Potential Index (FPI), creating potential for confusion among the broader emergency operations community and general public. In addition, each utility has developed its own wildfire risk ‘bow-tie’ framework,8 shown in Figures 3a, 3b, and 3c. The lack of consistency between utilities, particularly on such a critical diagnostic, limits the WSD’s ability to oversee the utilities’ ability to conduct these types of calculations and to establish statewide standards.
3. Manual intervention required
Stakeholders’ reliance on the manual interpretation of data by experts, currently affects diagnostics in three ways:
a. Subjectivity: Today, some diagnostics can only be produced based on determinations from experience. Prior WMP reviews, for example, required manual assessment by CPUC staff and other stakeholders, which was a labor-intensive process requiring the application of expertise in a range of subjects, including fire science, utility asset operations and maintenance, and risk management.
b. Inefficiencies: Some processes are prone to bottlenecks, such as an expert’s bandwidth for reviewing data (especially across multiple simultaneous events or filings). Time-sensitive analyses are particularly prone to such constraints, for example assessing real-time wildfire risk often requires an analyst to simultaneously view many online data feeds from different weather and/or environmental monitoring agencies.
c. Access: Stakeholders’ ability to benefit from diagnostics is often determined by the resources they have available in-house. For example, Fire Safe Councils or other community wildfire preparedness organizations do not have access to data on the type and location of fire risks, in order to prioritize their mitigation activities.
4. Lack of transparency
Many key utility-related wildfire decisions, particularly those by utilities affecting grid operations during periods of high fire risk, are not documented in a manner that allows for after-action review and auditing, particularly by third parties. This challenges the WSD’s efforts to validate reasonableness and regulatory compliance of utility decisions.
Resources. Water Year 2020 Begins with Robust Reservoir Storage. October 1, 2019. https://water.ca.gov/News/News-Releases/2019/October-19/Water-Year-2020-Begins-with-Robust-Reservoir-Storage.8 PG&E. Amended 2019 Wildfire Safety Plan. February 6, 2019; SCE. SCE’s (U 902 E) Wildfire Mitigation Plan. February 6, 2019; SDG&E. SDG&E’s (U 902 E) Wildfire Mitigation Plan. February 6, 2019. https://www.sdge.com/sites/default/files/regulatory/R.18-10-007%20SDG%26E%20Wildfire%20Mitigation%20Plan.pdf.
Utility Wildfire Mitigation Strategy 7

Table of Contents | Appendix 3: Utility Wildfire Mitigation Data Strategy
5. Limited stakeholder participation
In practice, generally only stakeholders with substantial financial, human, or technical resources participate in-depth in CPUC proceedings about statewide utility wildfire risk management decision-making processes. Often excluded from the process are important stakeholders such as local governments, Fire Safe Councils, and private landowners, due to the limited nature of their resources such as technical infrastructure, specialists on staff, and funding for studies and activities. The high barrier to accessing statewide wildfire data and engaging in wildfire mitigation planning means that excluded stakeholders cannot contribute their unique resource – the local knowledge of critical infrastructure, as well as the trust and goodwill that can be important to implementing critical permitting, fuel management, and right-of-way maintenance projects.
Figure 3a: Southern California Edison wildfire risk bow-tie framework
Drivers Triggering Outcomes Consequences
D1- Contract from object
D1a - Animal
D1b - Balloons
D1c - Unspecified
D1d - Vegetation
D1e – Vehicle
D2 – Equipment/Facility failure
D2a – Capacitor Bank
D2b - Conductor
D2c - Crossarm
D2d - Fuse
D2e - Insulator
D2f – Splice/Clamp/connector
D2g - Transformer
D2h - Unspecified
D3 – W2W contact/contamination
D4 – Unknown/Unspecified
IgnitionAssociation with SCE in
High FireRisk area
O1: Wildfire Red Flag Warning in effect greater
than 5,000 acres
Serious injury
Fatality
Reliability
Financial
Serious injury
O2: Wildfire Red Flag Warning in
Fatality
effect less than 5,000 acres Reliability
Financial
Serious injury
O3: Wildfire Red Flag Warning not in effect greaterthan 5,000 acres
Fatality
Reliability
Financial
Serious injury
O4: Wildfire Red Flag Warning not in effect less than
Fatality
5,000 acres Reliability
Financial
Source: 2019 Wildfire Mitigation Plans filed by SCE
Utility Wildfire Mitigation Strategy 8

Table of Contents | Appendix 3: Utility Wildfire Mitigation Data Strategy
Figure 3b: Pacific Gas and Electric wildfire risk bow-tie framework
Risk top-level drivers
Exposure Frequency Risk event(s) Consequences
Wildfire events initiated by
PG&E assets specific to the
fire index areas
Overhead miles in fire
areas: Distribution
(PG&E data) 43K
Trans-mission (PG&E data)
9K
D1 – Vegetation (PG&E data)
D2 – Equipment failure – conductor (PG&E data)
D3 – Equipment failure – Connector/hardware (PG&E data)
D4 – Equipment failure – other (PG&E data)
D5 – Third party contact (PG&E data)
D6 – Animal (PG&E data)
D7 – Fuse Operation (PG&E data)
D8 – Unknown (PG&E data)
Safety injuries
Safety facilities
Environmental
Reliability
Compliance
Trust
Financial
Source: 2019 Wildfire Mitigation Plans filed by PG&E
Utility Wildfire Mitigation Strategy 9

Table of Contents | Appendix 3: Utility Wildfire Mitigation Data Strategy
Figure 3c: San Diego Gas and Electric wildfire risk bow-tie framework
Wildfire caused by
SDG&E equipment
Potential drivers Potential consequences
Downed conductor in Santa Ana conditions
Vegetation contact with SDG&E equipment
Downed conductor due to vehicle contact
Downed conductor due to third party attachment
General equipment failure on system
Contact by foreign object
Weather related failure of SDG&E equipment
Not observing operational procedures (e.g., welding during fire warnings)
Lack of internal or external coordinated response
Extreme force of nature events (high winds, earthquakes, etc.)
Personal injuries to the public, employees and contractors, including numerous fatalities
Damage to a third party real and personal property (such as vehicles)
Damage and loss to SDG&E assets or facilities
Operational and reliability impacts
Claims and litigation
Erosion of public confidence
Source: 2019 Wildfire Mitigation Plans filed by SDG&E
During the 2020 WMP evaluations, the WSD managed a greater volume and variety of data, conducted new diagnostics, and enabled different outputs and insights to a wider range of stakeholders. However, such requirements challenged the capabilities of the WSD without the platform and tools necessary to standardize access to utility documents and to streamline the review process. As a result, the WSD made a concerted effort to issue a standardized data schema and is working on deploying an enterprise GIS infrastructure at the CPUC.9
9 On August 22, 2020, the WSD issued the utilities data schema instructions, which are available on the WSD’s website: https://www.cpuc.ca.gov/wildfiremitigationplans/.
Utility Wildfire Mitigation Strategy 10
Table of Contents | Appendix 3: Utility Wildfire Mitigation Data Strategy
2 Recommendations
2.1 Importance of a data strategy
A robust data strategy is crucial for enabling the WSD to realize its longer-term vision for wildfire risk management. To this end, the purpose of the data strategy is not to simply digitize the WSD’s record-keeping processes or to support its existing decision-making approach. Rather, the data strategy can transform the future robustness and scope of WSD decision-making. For example, by enabling the use of simulations that precisely estimate impact of risks and risk reduction measures in the longer term through external partnerships. Such a data-driven regulatory oversight process enables the WSD to more objectively scrutinize a larger volume of important utility decisions.
Beyond its oversight role, the WSD will also be positioned to better facilitate coordination of California utilities’ wildfire mitigation activities. In the near- to mid-term, the data strategy enables a ‘single source of truth’ for California’s utility wildfire-related data and insights. This allows state agencies (such as CAL FIRE and Cal OES) and utilities to share information with relevant stakeholders, identify synergies, and plan collaborative activities. In the long-term, the data strategy helps position California’s wildfire mitigation community on the global stage, sharing innovative practices developed in-state, as well as importing ideas from other geographies that are also pursuing innovative data-driven wildfire mitigation solutions.
Ultimately, the data strategy provides the WSD, its partners, and utilities a foundation for integrating data across multiple sources and/or stakeholders, deploying the power of statistical forecasting techniques, and leveraging robust reporting tools to drive utility wildfire mitigation decisions. It helps drive a decision-making approach that is “impartial, fair, consistent, and transparent, maintains integrity at all levels, and adheres to the law,”10 consistent with the broader CPUC’s 2019 Strategic Directives.
2.2 Framework
The WSD’s data strategy is developed around three areas of focus:
• Data vision, with four elements that articulate the WSD’s ambition and values • Four use cases, which characterize the WSD’s evolving data requirements • Four guiding principles, which guide the development and implementation of the data
strategy
2.2.1 Data vision
The recommendations that follow are based on the proposed vision for the WSD’s data strategy: “to utilize the richness of data and possibilities of insights to make well-informed utility safety regulation decisions that are actionable, accessible, aligned, and auditable.” This includes the following four elements:
1. Actionable: Designed to generate insights for key functions such as the WMP analysis, the PSPS analysis/audit, and driving actions for change at the IOUs
10 CPUC. Strategic Directives, Governance Process Policies, and Commission-Staff Linkage Policies. February 20, 2019. https://www.cpuc.ca.gov/uploadedFiles/CPUC_Public_Website/Content/About_Us/Mission_and_Values/Strategic_Directives_and_ Governance_Policies_Revised_February%2020%202019.pdf#page=15.
Utility Wildfire Mitigation Strategy 11
- - -
Table of Contents | Appendix 3: Utility Wildfire Mitigation Data Strategy
2. Accessible: Delivers relevant information to the right stakeholders, while ensuring confidentiality and data integrity
3. Aligned: Enables data sharing, prioritization of utility wildfire management action, benchmarking, and cross-stakeholder decision coordination
4. Auditable: Documents data sources and methodologies for key functions (e.g. WMP, PSPS, and IOU recommendations) such that they are available for review across relevant stakeholders
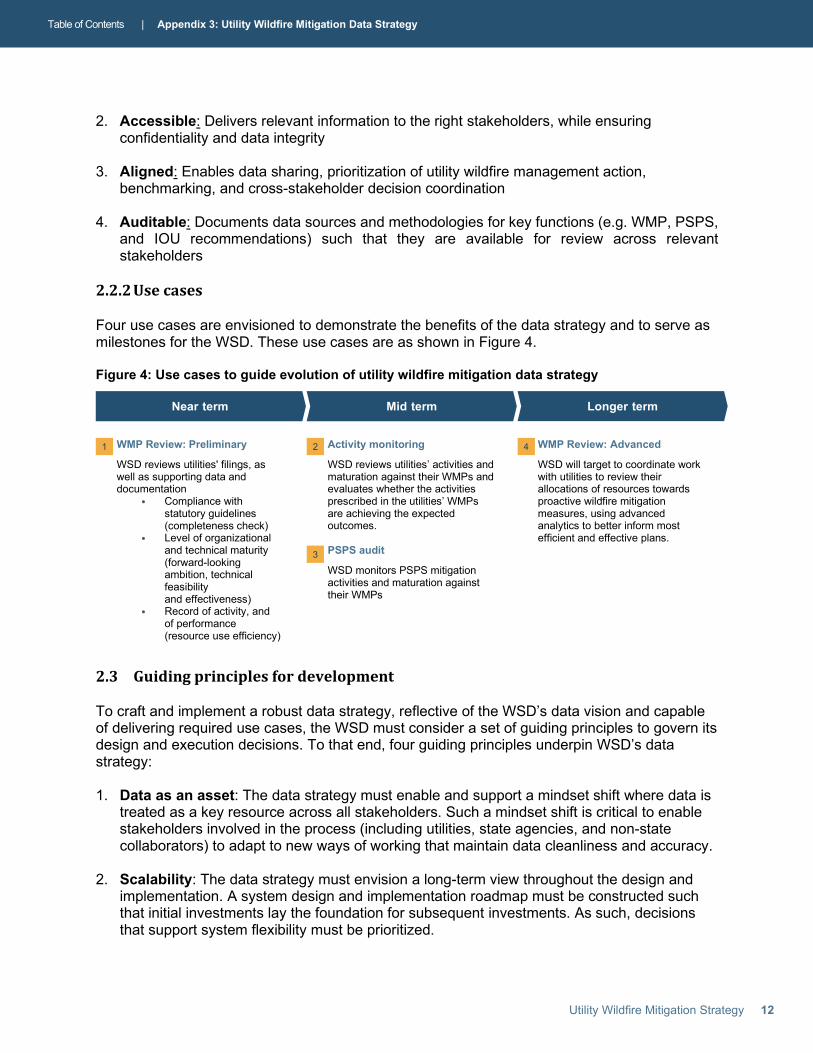
2.2.2 Use cases
Four use cases are envisioned to demonstrate the benefits of the data strategy and to serve as milestones for the WSD. These use cases are as shown in Figure 4.
Figure 4: Use cases to guide evolution of utility wildfire mitigation data strategy
Near term Mid term Longer term
1 WMP Review: Preliminary 2 Activity monitoring 4 WMP Review: Advanced
WSD reviews utilities' filings, as WSD reviews utilities’ activities and WSD will target to coordinate work well as supporting data and maturation against their WMPs and with utilities to review their documentation evaluates whether the activities allocations of resources towards
• Compliance with prescribed in the utilities’ WMPs proactive wildfire mitigation statutory guidelines are achieving the expected measures, using advanced (completeness check) outcomes. analytics to better inform most
• Level of organizational efficient and effective plans. and technical maturity 3 PSPS audit (forward-looking
WSD monitors PSPS mitigation ambition, technical activities and maturation against feasibility their WMPs and effectiveness)
• Record of activity, and of performance (resource use efficiency)
2.3 Guiding principles for development
To craft and implement a robust data strategy, reflective of the WSD’s data vision and capable of delivering required use cases, the WSD must consider a set of guiding principles to govern its design and execution decisions. To that end, four guiding principles underpin WSD’s data strategy:
1. Data as an asset: The data strategy must enable and support a mindset shift where data is treated as a key resource across all stakeholders. Such a mindset shift is critical to enable stakeholders involved in the process (including utilities, state agencies, and non-state collaborators) to adapt to new ways of working that maintain data cleanliness and accuracy.
2. Scalability: The data strategy must envision a long-term view throughout the design and implementation. A system design and implementation roadmap must be constructed such that initial investments lay the foundation for subsequent investments. As such, decisions that support system flexibility must be prioritized.
Utility Wildfire Mitigation Strategy 12
Table of Contents | Appendix 3: Utility Wildfire Mitigation Data Strategy
3. Holistic capability build: The implementation of the data strategy must contemplate comprehensive investments in people, processes, and tools necessary to support WSD’s data vision and enable required capability.
4. Continuous improvement: The data strategy must support continuous improvements using an iterative process that allows for rapid development of Minimum Viable Products (MVPs), retrospectives and lookbacks to capture learnings, and improvements in the next iteration.
These guiding principles function as strategic “north stars,” clarifying direction and enabling trade-offs in the event of conflicting priorities.
Utility Wildfire Mitigation Strategy 13

Table of Contents | Appendix 3: Utility Wildfire Mitigation Data Strategy
3 Data strategy & roadmap
Implementation of a robust, best-in-class data strategy is a gradual, multi-phased journey. Designing and executing a holistic data strategy often entails fundamental shift in existing ways of working, as well as significant resource commitments. Organizations embarking in such strategic digital transformations typically implement in a phased approach to allow adequate pace for sustained change.
An organization at the WSD’s level of data maturity would require a three-phased implementation roadmap, sequenced over a timeline of 12-plus months, to fully implement a robust data strategy. Figure 5 below shows the three distinct phases (i.e., near-, mid-, and long-term phases) as well as the high-level timeline for each phase.
Figure 5: High-level roadmap for data strategy development and execution
- - -Shorter term (by end of 2020) During WMP cycle (2020 2022) Longer term (2023+)
Establish and align on vision and goals for data strategy, while delivering short-term priorities and foundational elements for a digital data platform
Design and build digital data platform to deliver data use cases and support data management guidelines and processes
Enable collaborators with external stakeholders to establish data connection needed to realize full data capability e.g., predictive analysis Near-term phase
Mid-term phase
Long-term Phase
In the near-term phase, investments focused on addressing immediate needs and installing key foundational elements are prioritized. The mid-term phase plans to focus on designing and building out a digital data platform, the central backbone structure that will power data use cases and support newly established data management process. Finally, the long-term phase aims to establish connections and collaborations necessary to enable next-gen data capabilities.
These phases are sequenced to develop the WSD’s data capability in an agile fashion11 while delivering to operationally mandated timelines. A near-term phase builds the foundation for future data investments while simultaneously driving critical short-term deliverables required to support the 2020 WMP process. Subsequently, a mid-term phase is planned to culminate in a robust digital data platform in time to drive monitoring and review use cases. It should be noted that during this mid-term phase, the WSD will transition to OEIS within CNRA by July 2021, which may impact the implementation of the mid-term phase. Ultimately, the long-term phase
11 Agile is a method of product development focused on cross-functional collaboration, iteration on functional versions of the software, and a focus on customer satisfaction. See: Agile Alliance. “12 Principles Behind the Agile Manifesto.” https://www.agilealliance.org/agile101/12-principles-behind-the-agile-manifesto/.
Utility Wildfire Mitigation Strategy 14

Table of Contents | Appendix 3: Utility Wildfire Mitigation Data Strategy
aims to build on top of preceding phases to incrementally deliver full capability processes and systems that supports the WSD’s data vision and uses cases. Each phase requires investments in people, processes, and tools, described in detail in the following sections.
3.1 Near-term action plan
3.1.1 Recommended actions
During the near-term phase, the WSD’s primary focus was the collection, processing, and review of the 2020 WMPs and setting the groundwork for a digital data platform to be built out in a subsequent phase. The combination of these immediate-term priorities, as well as foundational elements, constitute the recommended actions for the near-term phase.
Executing the near-term phase of the data strategy requires investments in people, processes and tools. These investments are described below and laid out in Figure 6.
1. Investment in peopleIncludes addition of key resources and teams required to acquire necessary data skills
2. Investment in processesComprises of modifications in existing processes, and the stand-up of new ones to enable delivery of critical use cases
3. Investment in tools Requires procurement of technology components needed to power established use cases
Figure 6: Recommended actions for near-term phase of data strategy implementation
Investment in people Investment in process Investment in tools
1 Develop data governance playbooks to provide standards for data sharing across state agencies and associated partners
Applying relevant statewide data security protocols against relevant sections of repository hierarchy
74 Establishment and standardization of templates for collecting utility wildfire management plans, data, and initiatives
2
3
Hire additional staff with necessary technical capabilities to clean data submitted through the WMP process and perform simple spatial analyses
Align on data governance model and individuals responsible for collaboratively determining rules for data sharing across WSD’s data platform between WSD and affiliates.
Build out of data dictionary that drives clarity and uniformity in information requirements/ submissions
Securing of file repository to enforce standardized structure for information storage and sharing across stakeholders
85
Development of data taxonomy to codify collected information into structured, easy-to-navigate hierarchy.
6
Primary focus: To be complete by end of 2020
Secondary focus: Lay the groundwork for a fully digital platform
Utility Wildfire Mitigation Strategy 15
Table of Contents | Appendix 3: Utility Wildfire Mitigation Data Strategy
3.1.2 Key tactical elements of near-term implementation plan
Figure 7 lays out four tactical elements to be executed for a successful implementation of the near-term data strategy. These implementation considerations are described in detail below.
Figure 7: Tactical elements of the near-term data strategy implementation
4321 Data taxonomy& dictionary
Data collection templates
Security protocols
Playbook/User guide
Taxonomy organizes information, and dictionary provides definition & context
Templates provide consistency between utilities, and among data points
Established protocols ensure that the right information gets to right stakeholder
'Playbook' will guide all engagement with platform
1. Data taxonomy and dictionary
A data taxonomy is a logical structure for cataloging the data and information needed to drive utility wildfire mitigation use cases in a manner that allows for easy access and comprehension. An example of a data taxonomy used to codify utility ignition reporting template is shown in Figure 8. This structure supports the manual process in the near term, providing a structure for easy access and objective comparison of plans across utilities. Longer term data taxonomies will enable automated data management from ingesting utility submissions to generating figures for review.
Figure 8: Illustrative categories from draft proposed ignition reporting template
Event information Cause Situational
awareness Outcome Response Location Event Log (related table)
IgnitionID SuspectedInitiating Cause
RFWStatus RFWIssueDate RFWIssueTime
FireSize (Acres burned) SuppressedBy
City County District
PhotoID (associated photos
with event)
UtilityID ObjectContact FacilityContacted
FWWStatus FWWIssueDate FWWIssueTime
OutageStatus (outage associated
w/event?) FireInvestigation Longitude
Latitude IgnitionID
(maps to “Event information”)
FireStartTime FireStartDate FireStartYear
EquipmentFailure EquipmentType
HWWStatus HWWIssueDate HWWIssueTime
OutageID FireAHJ HFTDClass
FireDetectionMethod Determination
(who determined cause of event)
Circuit ID SubstationID
AssociatedVoltage
OriginLandUse (urban or rural) IgnitionNotes
MaterialAtOrigin (Fuel for ignition)
FuelBedDescription
Utility Wildfire Mitigation Strategy 16

Table of Contents | Appendix 3: Utility Wildfire Mitigation Data Strategy
The data taxonomy will serve as the initial blueprint for the WSD’s data model to be built out in the mid-term. The data taxonomy also enables development of the data dictionary by functioning as a backbone that structures and unifies data and information from multiple disparate sources.
The data dictionary documents and defines metadata associated with a data point, along with a codified structure in the data taxonomy, allowing users to understand the purpose, source, lineage, and any cleaning or calibration that has been applied to a data point. By establishing common nomenclature across stakeholders, the dictionary sets a foundation for standardization and uniformity in the WMPs’ preparation, review, and post-approval monitoring.
The WSD will play a central role in the development of the data taxonomy and data dictionary documents, in consultation with a broader set of stakeholders to ensure a cross-stakeholder lens.
2. Data collection templates
Templates, such as those illustrated in Figure 9 below, will be used to ensure that the utilities submit information consistently and comprehensively. They were developed in the initial phase of the 2020 WMP process and were subject to public comments. The data collection template will enforce rigor and structure in how utility submissions are organized and reviewed.
Figure 9: Recent performance on progress metrics, last 5 years (WMP Guidelines, Table 1, partial)
Annual performance
# Progress metric name 2015 2016 2017 2018 2019 Unit(s)
1 Grid condition findings from inspection
Number of Level 1, 2, and 3 findings per mile of circuit in HFTD, and per total miles of circuit for each of the following inspection types:
1. Patrol inspections 2. Detailed inspections 3. Other inspection types
2 Vegetation Percentage of right-of-way with clearance noncompliant clearance based on findings from applicable rules and regulations at the inspection time of inspection, as a percentage of
all right-of-way inspected
3. Security protocols
The design and implementation of the file repository must contemplate information access, user authentication, and other necessary security features. Although the 2020 WMP filings and support documentation are publicly available on the WSD’s website, appropriate security protocols are needed for confidential utility information. While many laws, regulations and best practices already exist including specific protocols in the data system will demonstrate the WSD’s commitment to appropriate and secure data handling to utility and non-utility stakeholders.
Utility Wildfire Mitigation Strategy 17
-
Table of Contents | Appendix 3: Utility Wildfire Mitigation Data Strategy
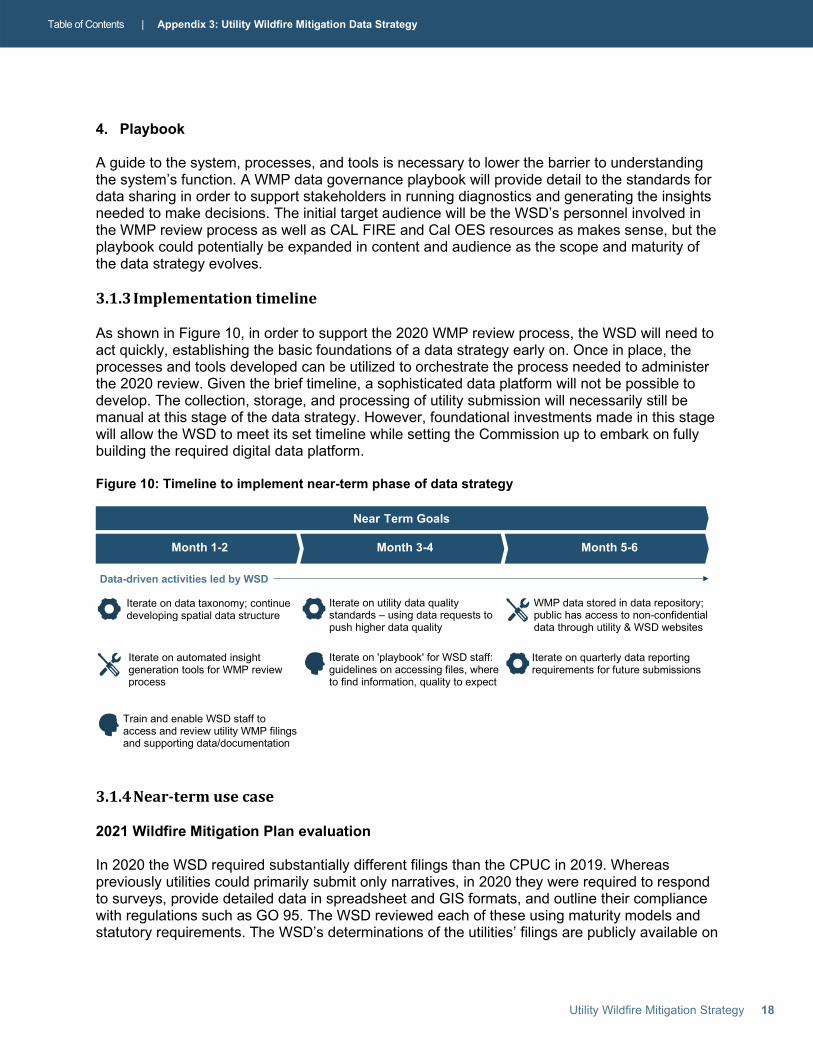
4. Playbook
A guide to the system, processes, and tools is necessary to lower the barrier to understanding the system’s function. A WMP data governance playbook will provide detail to the standards for data sharing in order to support stakeholders in running diagnostics and generating the insights needed to make decisions. The initial target audience will be the WSD’s personnel involved in the WMP review process as well as CAL FIRE and Cal OES resources as makes sense, but the playbook could potentially be expanded in content and audience as the scope and maturity of the data strategy evolves.
3.1.3 Implementation timeline
As shown in Figure 10, in order to support the 2020 WMP review process, the WSD will need to act quickly, establishing the basic foundations of a data strategy early on. Once in place, the processes and tools developed can be utilized to orchestrate the process needed to administer the 2020 review. Given the brief timeline, a sophisticated data platform will not be possible to develop. The collection, storage, and processing of utility submission will necessarily still be manual at this stage of the data strategy. However, foundational investments made in this stage will allow the WSD to meet its set timeline while setting the Commission up to embark on fully building the required digital data platform.
Figure 10: Timeline to implement near-term phase of data strategy
Near Term Goals
Month 1-2 Month 3-4 Month 5-6
Data-driven activities led by WSD
Iterate on utility data quality standards – using data requests to push higher data quality
Iterate on 'playbook' for WSD staff: guidelines on accessing files, where to find information, quality to expect
Train and enable WSD staff to access and review utility WMP filings and supporting data/documentation
Iterate on data taxonomy; continue developing spatial data structure
Iterate on automated insight generation tools for WMP review process
WMP data stored in data repository; public has access to non-confidential data through utility & WSD websites
Iterate on quarterly data reporting requirements for future submissions
3.1.4 Near-term use case
2021 Wildfire Mitigation Plan evaluation
In 2020 the WSD required substantially different filings than the CPUC in 2019. Whereas previously utilities could primarily submit only narratives, in 2020 they were required to respond to surveys, provide detailed data in spreadsheet and GIS formats, and outline their compliance with regulations such as GO 95. The WSD reviewed each of these using maturity models and statutory requirements. The WSD’s determinations of the utilities’ filings are publicly available on
Utility Wildfire Mitigation Strategy 18

Table of Contents | Appendix 3: Utility Wildfire Mitigation Data Strategy
the WSD’s website. In 2021, the WSD will continue to evolve the implementation of its data strategy.
The 2020 review comprised four stages:
1. WSD published templates and other related materials for the WMP
This was a manual process: the WSD displayed the draft WMP guidelines online on December 16, 2019 and received electronically filed comments from stakeholders by January 7, 2020.12 Materials included the WMP guidelines, the utility wildfire mitigation maturity model, a utility survey, proposed WMP metrics, and a Supplemental Data Request (SDR).13
2. Utilities completing and submitting their WMP and SDR responses
This was largely a manual process: beyond filing written plans, the utilities were required to complete a survey and supply supporting data. The utilities were required to complete an electronic utility survey and upload documents using a standardized file naming convention, expediting reviewers’ access to the same information across all utilities.
3. WSD’s statutory compliance check of the WMP
This was a manual process, in which the WSD’s staff checked the written responses against a set of completeness guidelines.
4. WSD’s evaluation of the WMP
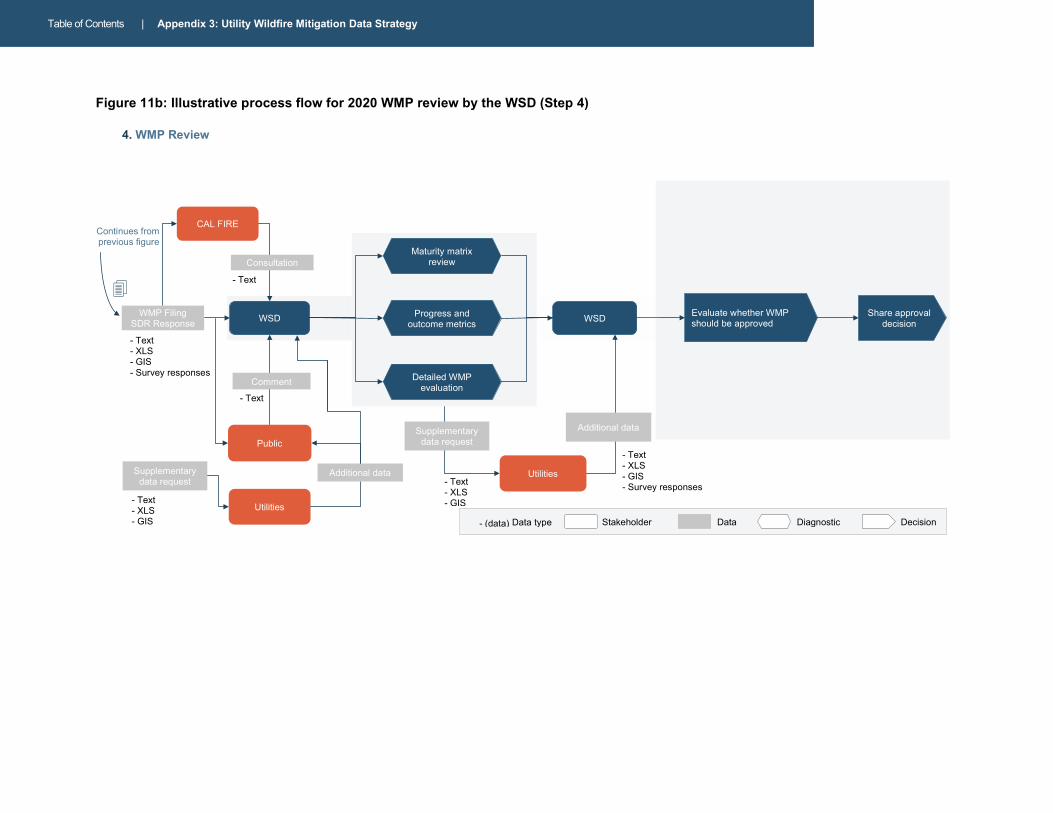
Figures 11a and 11b below organize the stages described above, showing how stakeholders interacted, when key diagnostics were made, and, ultimately, how the WSD arrived at a decision. Figure 12 describes how the WSD’s information gathering process drove diagnostics for the 2020 WMP review process.
The 2020 review provided three main benefits beyond the immediate decision for the WMP:
• First, the WMP approval itself was used by utilities as a prerequisite to receive a Safety Certificate.
• Second, outcomes of the WMP approval process supported medium-term and long-term oversight. In the medium-term, the WSD continues to evaluate whether utilities are undertaking the activities promised in their WMP. In the long-term, WSD will be able to use the outcomes (in terms of wildfire risk reduction) realized by utility wildfire mitigation activities to inform more advanced evaluation WMP effectiveness in the future.
• Lastly, the more data-driven evaluation of the WMPs enabled the WSD to make more comprehensive comparisons between utilities, and drove insights into utility wildfire mitigation and management practices that underpin superior reduction and/or management of wildfire risk among leaders.
12 Rulings and templates are available at www.cpuc.ca.gov/SB901. 13 The SDR outlines a broader set of data that the CPUC is requesting from utilities and intends to formalize in the 2021 process to evaluate utility plans, activities, and outcomes in greater detail.
Utility Wildfire Mitigation Strategy 19

Table of Contents | Appendix 3: Utility Wildfire Mitigation Data Strategy
In order to complete these stages, the WSD reviewed the 2020 WMP materials in an accessible format, assessed relevant metrics (e.g., maturity model scoring), and viewed the results. Moving forward, stakeholders’ reviews will benefit from consistency in data definitions (e.g., through using the same ignition reporting template), format (e.g., following a standardized template), and criteria for plans. While the review process will remain largely manual, and rely upon the judgment of the reviewer, templates and scorecards will highlight the benefits of a data-driven regulatory review.
Utility Wildfire Mitigation Strategy 20

Continues in next figure
Utilities
Statutory compliance
check
- Text - XLS - GIS - Survey responses
- Text
Amended WMP filing or add’l data
Return for remediation as needed
WSD
Table of Contents | Appendix 3: Utility Wildfire Mitigation Data Strategy
Figure 11a: Illustrative process flow for 2020 WMP review by the WSD (Steps 1-3)
3. Check: Is the WMP complete? 1. What should be in the SupplementalData Request (SDR) & Wildfire MitigationPlan (WMP)?
2. Completing the SDR & WMP
WSD
Utilities
Public
Utilities
CAL FIRE
Cal OES
Other state agencies
- Text
- Text
- Text - Text - XLS template
- Survey responses - Text – XLS - GIS
- XLS - GIS
Preliminary Survey, SDR & WMP guidelines
SDR response
WMP filing, incl. utility survey
Comment Data Data Request
Finalized Survey, SDR & WMP guidelines
WSD WSD
Comment
- (data) Data Diagnosti Decision Data type Stakeholder
(data)
Table of Contents | Appendix 3: Utility Wildfire Mitigation Data Strategy
Figure 11b: Illustrative process flow for 2020 WMP review by the WSD (Step 4)
4. WMP Review
- Text - XLS - GIS
WSD
Maturity matrix review
Progress and outcome metrics
Detailed WMP evaluation
Public
WSD
Utilities
Share approval decision
- Text
- Text
- Text - XLS - GIS - Survey responses
- Text - XLS - GIS - Survey responses
CAL FIRE
Supplementary data request
WMP Filing SDR Response
Consultation
Comment
Additional data
Utilities - Text - XLS - GIS
Additional data Supplementary data request
Continues from previous figure
Stakeholder Data - Data type
Evaluate whether WMP should be approved
Diagnostic Decision
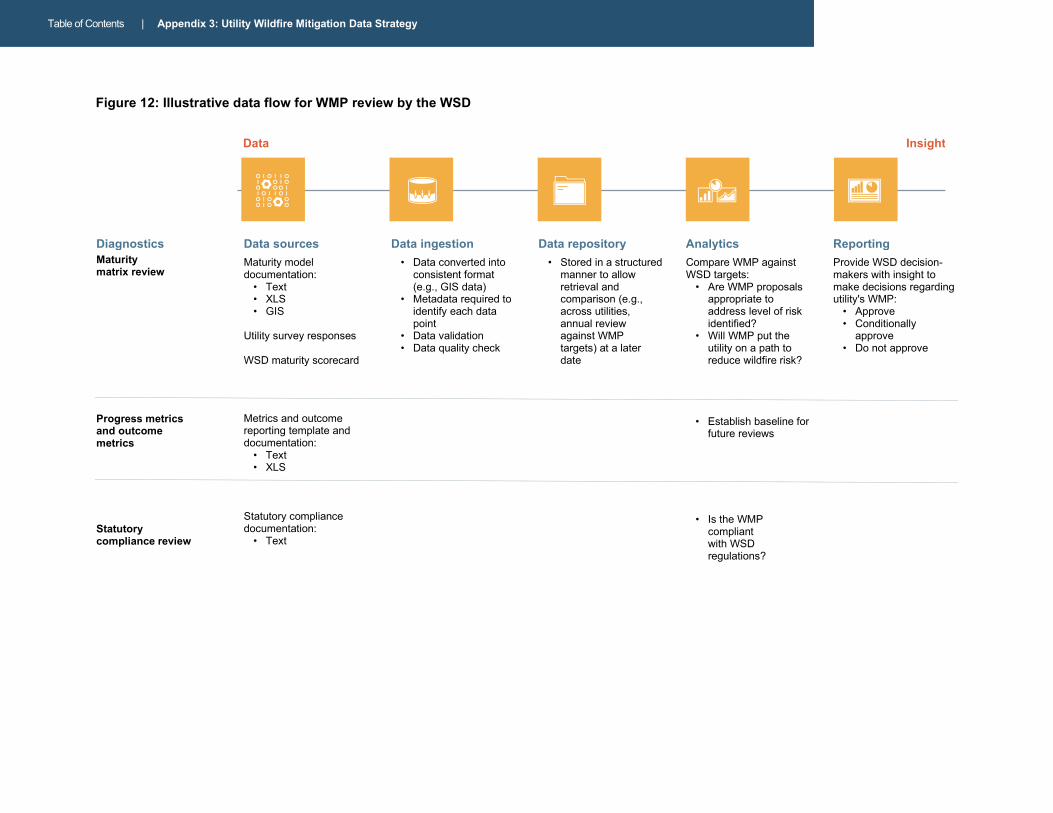
Table of Contents | Appendix 3: Utility Wildfire Mitigation Data Strategy
Figure 12: Illustrative data flow for WMP review by the WSD
Data Insight
Diagnostics Data repository Analytics Reporting
Metrics and outcome reporting template and documentation:
• Text • XLS
• Establish baseline for future reviews
Provide WSD decision-makers with insight to make decisions regarding utility's WMP:
• Approve • Conditionally
approve • Do not approve
Maturitymatrix review
Progress metricsand outcome metrics
Statutorycompliance review
Maturity model documentation:
• Text • XLS • GIS
Utility survey responses
WSD maturity scorecard
Statutory compliance documentation:
• Text
Data sources Data ingestion • Data converted into
consistent format (e.g., GIS data)
• Metadata required to identify each data point
• Data validation • Data quality check
• Stored in a structured manner to allow retrieval and comparison (e.g., across utilities, annual review against WMP targets) at a later date
Compare WMP against WSD targets:
• Are WMP proposals appropriate to address level of risk identified?
• Will WMP put the utility on a path to reduce wildfire risk?
• Is the WMP compliant with WSD regulations?

Table of Contents | Appendix 3: Utility Wildfire Mitigation Data Strategy
3.2 Mid-term action plan
3.2.1 Recommended actions
The central focus of the mid-term phase is the designing, building, testing, and deploying of a digital data platform to support the WSD’s utility wildfire management oversight functions. To implement a best-in-class data platform, investments in people, process, and tools is required, building on the investments made in the near-term phase, while also laying groundwork to leverage advanced data capabilities (e.g., advanced analytics) developed by utilities, researchers, technology companies, and others.
Figure 13 below describes the recommended mid-term actions across the different investment buckets.
Figure 13: Recommended actions for mid-term phase of data strategy implementation
Investment in people Investment in process Investment in tools
Engage program management team to oversee end-to-end platform build and test and associated change management effort.
Continue build of data taxonomy down to data element level as well as iterative build out of data dictionary
Procure software components required to build out the platform based on platform design architecture
531
Engage platform implementation team to stitch together the key software components.
42 Design data platform architecture that harvests information from disparate information sources into a centralized repository to power WSD use cases
Develop front-end data acquisition tools to digitally obtain data from across all relevant stakeholders
6
Standing up a program management team is a crucial first step to support requirement gathering and detailed definition of critical use cases. Additionally, such a team helps ensure optimal platform architecture is developed at the get-go, avoiding potential downstream misalignment and/or need for rework. In contrast, platform implementation resources can be contracted and brought onboard once use case definition, requirement gathering, and platform design are completed. This should all be done while leveraging existing WSD GIS capabilities to build on existing infrastructure.
3.2.2 Key tactical elements of mid-term implementation plan
This section lays out a set of three tactical considerations for building a robust data platform and actualize the WSD’s data strategy ambitions. These considerations include:
1. Key outcomes enabled by a data platform 2. Technology design configuration for a best in class platform 3. Required technical resources for build and maintain phases
24
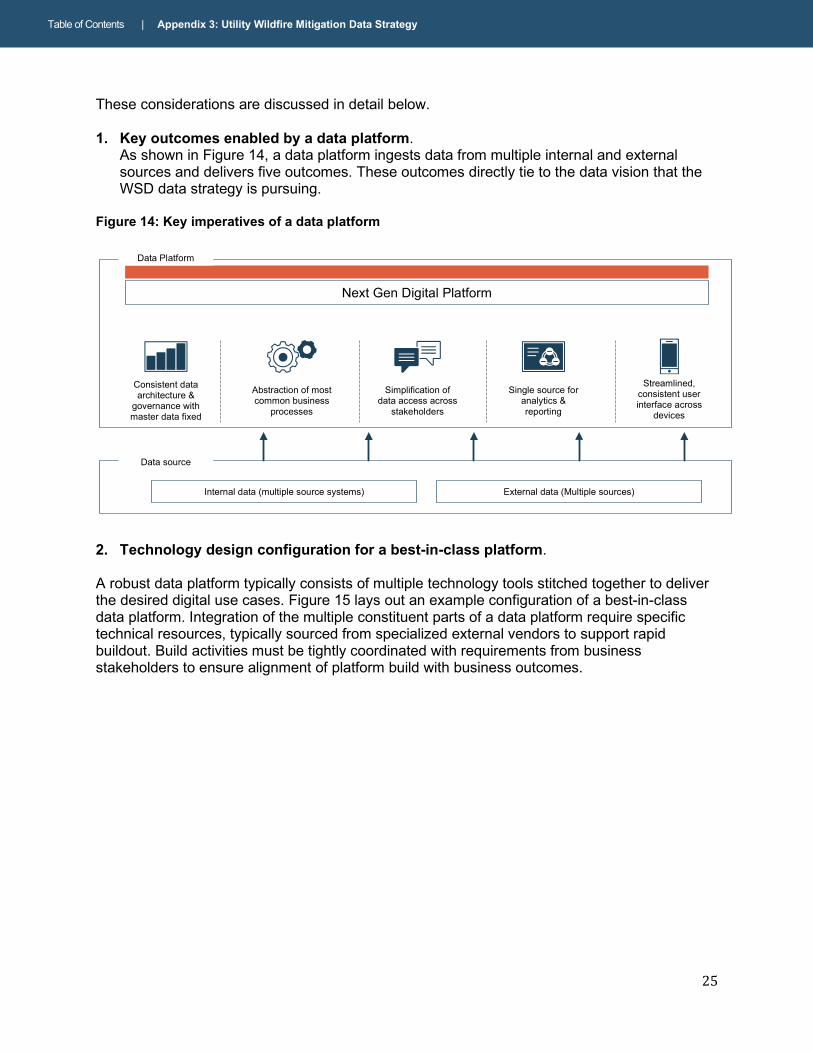
Table of Contents | Appendix 3: Utility Wildfire Mitigation Data Strategy
These considerations are discussed in detail below.
1. Key outcomes enabled by a data platform. As shown in Figure 14, a data platform ingests data from multiple internal and external sources and delivers five outcomes. These outcomes directly tie to the data vision that the WSD data strategy is pursuing.
Figure 14: Key imperatives of a data platform
Next Gen Digital Platform
Data Platform
Data source
Internal data (multiple source systems) External data (Multiple sources)
Consistent data architecture &
governance with master data fixed
Abstraction of most common business
processes
Simplification of data access across
stakeholders
Single source for analytics & reporting
Streamlined, consistent user interface across
devices
2. Technology design configuration for a best-in-class platform.
A robust data platform typically consists of multiple technology tools stitched together to deliver the desired digital use cases. Figure 15 lays out an example configuration of a best-in-class data platform. Integration of the multiple constituent parts of a data platform require specific technical resources, typically sourced from specialized external vendors to support rapid buildout. Build activities must be tightly coordinated with requirements from business stakeholders to ensure alignment of platform build with business outcomes.
25

---
-
Table of Contents | Appendix 3: Utility Wildfire Mitigation Data Strategy
Figure 15: Example configuration of a next-gen platform
Data consumption
Model development
Feature engineering
RPA5
Advanced analytics
BI dashboards
Self service reporting
Visualization
Reporting & BI4
Sources Data platform
Utility data and submissions
Data from other government
agencies
Third party data
Research labs, universities, etc.
Others relevant data sources
Data Sources
Data connectors Batch ingest
API management Real time ingest
Ingestion Layer
Transformation Quality checks
Validation
Logic and ComputerL
Storage Layer
Data warehouse
Batch data DB1
Real time data DB
EDW2/data marts
MDM3 DB
Workflow management Code versioning
Sys Ops Data Ops
Data security Meta data Data mastering Data modelling
Data Management
1. Database 2. Electronic data warehouse 3. Master data management 4. Business intelligence 5. Robotic process automation
3. Required technical resources for ongoing maintenance phase.
Beyond platform building by an external vendor implementation team, ongoing maintenance of a data platform requires a specific set of technical resources that must be procured externally or retained in-house. Required technical skills largely depend on the platform architecture but generally fall under the roles described in Figure 16. Identification, hiring, and onboarding of required resources (full-time employees) at the appropriate stage of platform implementation allows for appropriate overlap between build and maintenance teams, driving better knowledge transfer.
Figure 16: General technical skillsets required to build and maintain a data platform Example roles Responsibilities Data Architect Overall oversight of meeting business needs via platform, including leading data model, building and
connecting core systems to platform Data Engineer Develop and test data platform and pipelines, assemble complex data sets and build infrastructure and
processes for Extract, Transform, Load (ETL)14 and data model Cloud Engineer Build cloud infrastructure to ensure data security and availability ETL Developer Write code for ETL of individual sources under the guidance of the data architect and the engineer BI Developer Write initial Business Intelligence (BI)15 reports to deliver initial wins based on business requirements and
direction of data architect
14 Extract, transform, load (ETL) describes the process in which data are taken from the source’s system, translated into the format used by the destination (recipient) system, and loaded into the latter’s system. Source: SAS Institute Inc. “ETL: What it is and why it matters.” https://www.sas.com/en_us/insights/data-management/what-is-etl.html. 15 Business intelligence (BI) leverages software and services to transform data into actionable insights that inform an organization’s strategic and tactical business decisions. Source: Pratt, Mary K. & Fruhlinger, Josh. “What is business intelligence? Transforming data into business insights.” CIO, October 16, 2019. https://www.cio.com/article/2439504/business-intelligence-definition-and-solutions.html.
26

Table of Contents | Appendix 3: Utility Wildfire Mitigation Data Strategy
3.2.3 Implementation timeline
Building out a data platform entails execution of five interconnected workstreams involving multiple business and technical stakeholders. As shown in Figure 17, a concerted effort is required for full end-to-end implementation. Executing such a complex program and requiring tight process coordination between business and technical teams requires a dedicated central program management team. Therefore, establishing a program management team that is tasked with overall program oversight and coordination of the different activities within and across workstreams is a crucial ingredient for successful platform implementation.
Figure 17: High-level data platform implementation roadmap
Change management
Selection of final platform components and implementation partner
Data infrastructure and architecture design
Technical build, test, and deployment
Data governance and management
Training and enablement
Initialization of build effort
Finalization of build effort
1
3
4
5
6
2
27
Table of Contents | Appendix 3: Utility Wildfire Mitigation Data Strategy
3.2.4 Mid-term use case
Mid-term use case: Utility activity inspection
Upon approval of the 2020 WMPs, the utilities began executing them through targeted activities (e.g., enhanced vegetation removal) and investments (e.g., in asset hardening). The WSD continues to inspect the utilities’ implementation, based on the process laid out in Figure 18, reviewing both the extent and nature of their resource allocations relative to approved plans. In particular, the WSD conducts four diagnostics:
1. Are the utilities complying with statutory requirements? This diagnostic is mostly manual, including field inspection, audits and reviewing utility policies and plans to ensure that they follow broader industry standards (e.g., worker safety).
2. Are the utilities successfully executing on the activities promised in their WMPs, at the pace that they promised? This diagnostic is ideally largely data-driven: the WSD aims to create a dashboard listing planned activities, side-by-side with actual results retrieved from WSD field inspectors and utility systems.
3. Are the utilities maturing according to plans? As with the original maturity survey in the 2020 WMP review, this diagnostic can be automated and standardized.
4. Are the outcomes trending as expected? This diagnostic can be data-driven, as the WSD could utilize leading metrics of utility wildfire risk that the utilities can affect, which were requested in the 2020 guidelines (e.g., near-miss incidents), as a proxy that can be calculated even outside of wildfire season.
The WSD uses the first three diagnostics to determine whether the utility is undertaken activities in line with their WMP. The fourth diagnostic can be used to review the WMPs themselves – to determine, for example, whether they were sufficiently ambitious to achieve the WSD’s overall utility wildfire mitigation objectives.
28
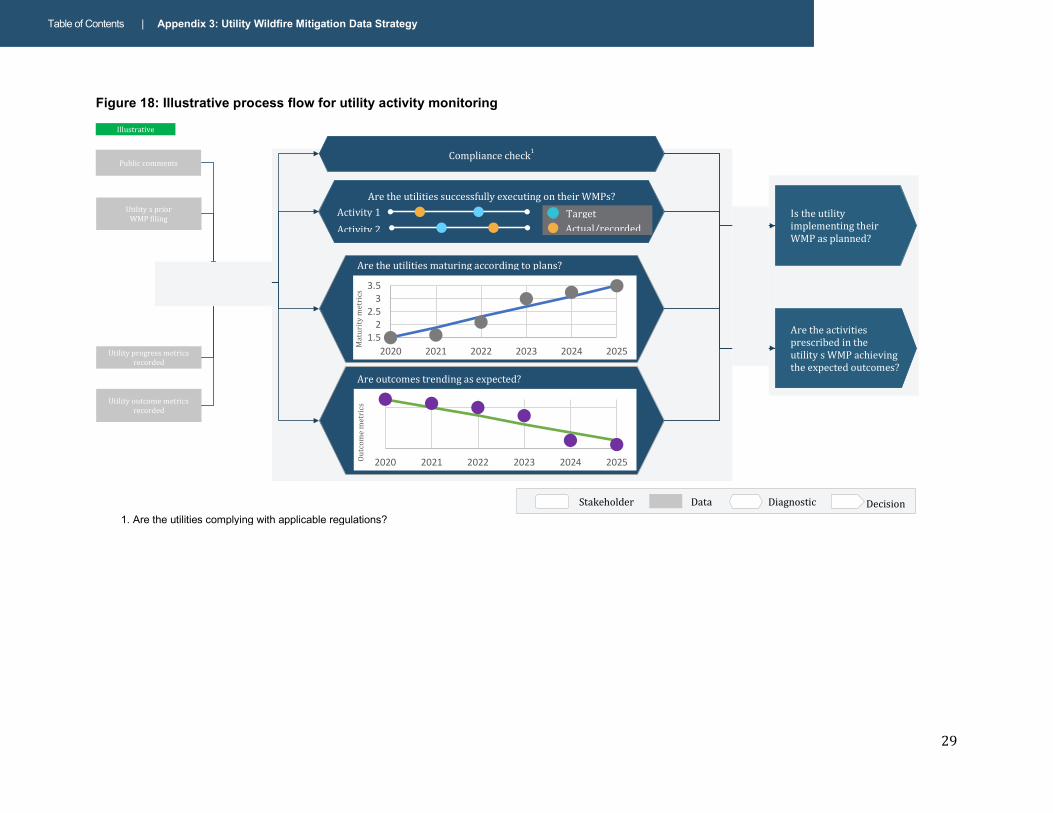
Table of Contents | Appendix 3: Utility Wildfire Mitigation Data Strategy
Figure 18: Illustrative process flow for utility activity monitoring
1.5 2
2.5 3
3.5
2020 2021 2022 2023 2024 2025
2020 2021 2022 2023 2024 2025
CPUC
Utility s prior WMP filing
Utility progress metrics recorded
Utility outcome metrics recorded
Public comments
Is the utility implementing their WMP as planned?
Are the activities prescribed in the utility s WMP achieving the expected outcomes?
Compliance check1
Are outcomes trending as expected?
Outc
ome
met
rics
Are the utilities successfully executing on their WMPs?
Are the utilities maturing according to plans?
Mat
urity
met
rics
Activity 1 Activity 2
Target Actual/recorded
Illustrative
WSD
'
'
Stakeholder Data Diagnostic Decision 1. Are the utilities complying with applicable regulations?
29
3.3 Long-term opportunities
3.3.1 Potential actions
In the longer-term, the WSD strives to utilize the full extent of the data strategy, efficiently and effectively collecting, ingesting, validating, and storing data in a platform that can support complex analyses while meeting specific needs of individual stakeholders. The WMP review and annual progress updates will be data-supported processes, with benchmarks and metrics enabling decision makers. Evaluations can be applied more consistently and objectively, saving review time for expert staff. New diagnostic methods, developed internally and by universities and the private sector, can be tested using historical data, logically organized and easily accessible.
State and federal agencies, communities, and private landowners can also partner with the WSD in developing their data strategy for utility wildfire mitigation. In the long-term, these stakeholders also need to assess the level of utility-related wildfire risk and allocate resources towards utility wildfire mitigation, and will be able to adopt similar data-driven evaluation and planning developed in partnership with the WSD. For example, other agencies could transform their planning and oversight activities by leveraging the WSD’s data strategy, either directly through their use of WSD tools, or indirectly, by fashioning their own data strategy in its image.
As the state’s utility wildfire mitigation assessment and response infrastructure evolves, the WSD’s data strategy will be integrated with the broader state emergency management infrastructure. For example, the planned Wildfire Forecast and Threat Intelligence Integration Center, to be built out under the leadership of Cal OES,16 may take on some of the assessment responsibilities currently anticipated for the WSD data strategy.
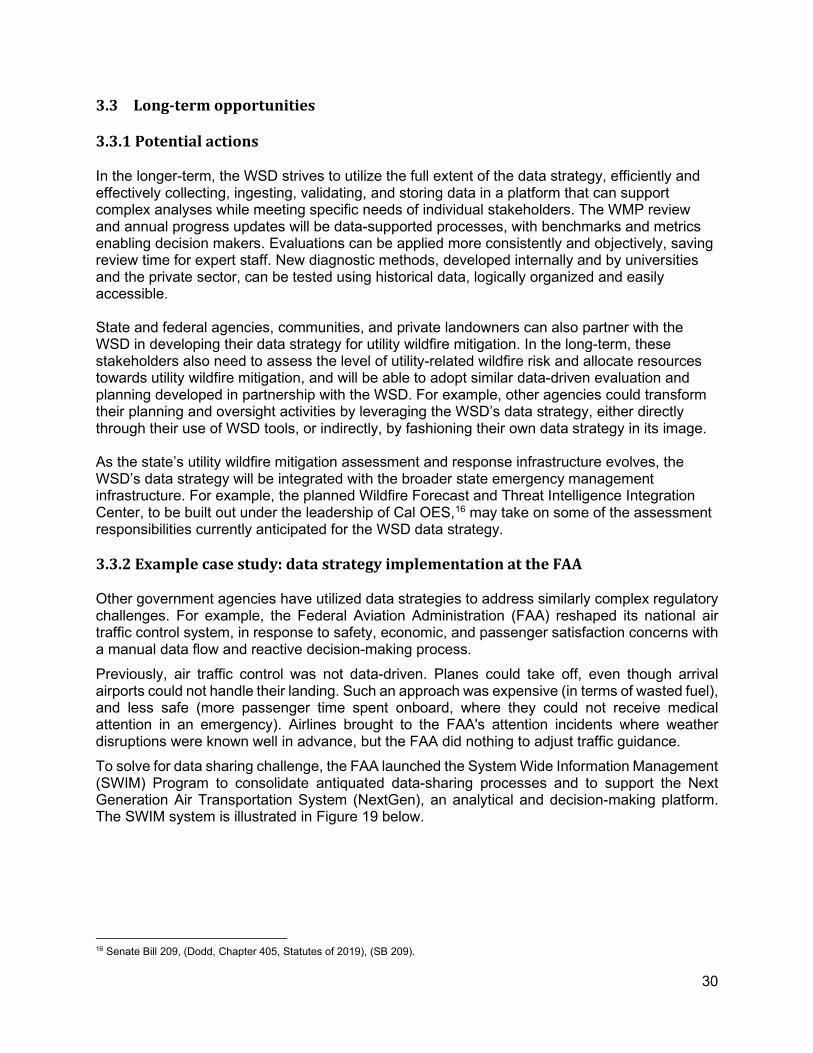
3.3.2 Example case study: data strategy implementation at the FAA
Other government agencies have utilized data strategies to address similarly complex regulatory challenges. For example, the Federal Aviation Administration (FAA) reshaped its national air traffic control system, in response to safety, economic, and passenger satisfaction concerns with a manual data flow and reactive decision-making process. Previously, air traffic control was not data-driven. Planes could take off, even though arrival airports could not handle their landing. Such an approach was expensive (in terms of wasted fuel), and less safe (more passenger time spent onboard, where they could not receive medical attention in an emergency). Airlines brought to the FAA's attention incidents where weather disruptions were known well in advance, but the FAA did nothing to adjust traffic guidance. To solve for data sharing challenge, the FAA launched the System Wide Information Management (SWIM) Program to consolidate antiquated data-sharing processes and to support the Next Generation Air Transportation System (NextGen), an analytical and decision-making platform. The SWIM system is illustrated in Figure 19 below.
16 Senate Bill 209, (Dodd, Chapter 405, Statutes of 2019), (SB 209).
30
-
-
-- -
-
-
- --
-
-- -
-
-
- -
Figure 19: Example of data strategy implementation at FAA
Airline X
Airline y
Newark ASDE
X JFK
ASDE X
DFW ASDE
X Denver ASDE
X
Boston ASDE
X
LAX ASDE
X
Atlanta ASDE
X
O’Hare ASDE
X
Airline X
Airline y
O’Hare ASDE
X
Newark ASDE X
JFK ASDE
X DFW
ASDE X Denver
ASDE X
Boston ASDE
X
LAX ASDE
X
Atlanta ASDE
X
SWIM FTI
Security gateway
Before SWIM: Point to point connections
With SWIM: Data exchange (Published once, consumed by many)
Source: Federal Aviation Administration. Federal Aviation Administration System Wide Information Management (SWIM) – Program Overview & Status. September 24, 2015.
In developing SWIM, the FAA had four types of partners: • Industry: Responsible for advising on technology and implementation • Airlines: Provided perspective on needs and challenges • R&D: Developed prototypes • International peers: Coordinates planning with fellow national airspace regulators
The SWIM group meets monthly to bring issues to the FAA’s attention, and the FAA can bring in relevant experts from within its ranks for storyboarding and prototyping. One innovation was a time-based metering approach – anticipating constraints at arrival airports, and holding planes at departure gates, where passengers were safer and could be attended to, instead of creating a traffic jam or forcing diversions.
FAA is now able to anticipate weather events and communicate airspace restrictions (e.g., how many planes allowed to land) 24 hours in advance, giving airlines time to re-route passengers, and relieving local air traffic controllers of having to make such decisions in real-time. Modernizing national air traffic control through data-driven optimization has yielded nearly $5 billion in passenger and airline benefits through efficiencies, as well as safety improvements in areas with limited radar coverage.
31

3.3.3 Long-term use case
WMP Review: Advanced
Longer-term, this data strategy – along with improved data availability – can enable the WSD to review WMP submissions and determine whether utilities have allocated resources optimally to decrease utility-related wildfire risk, in the highest need areas, by potentially estimating:
• Residual risk level by location: Baseline utility wildfire risk level in a particular location (assuming no mitigation measures)
• Risk reduction impact by measure in each location: Degree to which a given measure lowers utility wildfire risk, multiplied by the number of years the measure is effective
• Risk-spend efficiency (RSE) by measure in each location: Ratio of risk reduction efficacy to the cost of such measure
To do so, the WSD will need to be able to access and utilize a rich, well-organized data set that includes risk drivers (e.g., climate, asset conditions, and maintenance practices), historical correlations with wildfire ignition related to utility infrastructure and propagation, and the realized impact and cost-effectiveness of different mitigation measures. This will require significant improvements from utilities to the availability and access related to existing utility infrastructure.
Calculating the risk reduction impact and RSE, per location per measure, yields three benefits to the WSD, utilities, and broader wildfire community:
1. Prioritization
The combination of efficacy and RSE provides a transparent and quantified prioritization schematic, and allows utilities to consider resources that partners (e.g., Fire Safe Council volunteers) could contribute. In addition, such diagnostics could be utilized to identify constraints,17 as well as synergies and economies of scale (e.g., coordinated procurement of difficult-to-obtain equipment) that could affect measures’ RSE.
2. Optimization
Given budget, workforce, and other constraints, identify the measures and locations that maximizes utility-related wildfire risk reduction.18 With this optimization, the WSD could validate that utilities’ planned spending will yield a reduction in wildfire risk, that the utilities are focused on the highest-priority locations, and that they are investing their resources in the most cost-effective manner. Beyond its utility oversight, the WSD could utilize the optimization framework to lead a broader statewide conversation about resource allocation. An illustrative process flow for resource allocation review is shown in Figure 20.
17 For example, some easements do not have sufficient underground space for burying electrical lines. Source: Lawrence Berkeley National Laboratory. A Method to Estimate the Costs and Benefits of Undergrounding Electricity Transmission and Distribution Lines. October 2016. http://eta-publications.lbl.gov/sites/default/files/lbnl-1006394_pre-publication.pdf. 18 The lack of such a methodology by the major utilities was one of the major findings by the CPUC’s Safety and Enforcement Division (SED) in its review of S-MAP filings. California Public Utilities Commission. Safety and Enforcement Division Evaluation Report on the Risk Evaluation Models and Risk-based Decision Frameworks in A.15-05-002, et al. March 21, 2016. http://www.cpuc.ca.gov/WorkArea/DownloadAsset.aspx?id=10483.
32

-
Figure 20: Illustrative process flow for resource allocation review
Level of wildfire & PSPS risk
Cost of risk reduction measure
1
Prioritized list of initiatives and
locations
Risk assessments
(e.g., risk analysis 90 day sprint)
Cost estimates
Risk map
What measures the utilities can undertake to reduce their reliance on PSPS, while not increasing wildfire risk?
Risk reduction potential by measure¹
Risk reduction estimates Utilities or CAL FIRE
Utilities
WSD & utilities
1. Will need to be adjusted by location (i.e. some locations are more expensive for measure implementation, and yield less risk reduction, than others). For example, a small community will experience less risk reduction than a larger community (since there are fewer values at risk), and a mile of distribution line in a difficult-to-access area is more expensive to maintain than a mile in a suburban location.
Stakeholder Data Diagnostic Decision
33

3. Technology assessment
The calculations could be utilized to evaluate the market for new technologies, as well as the value they deliver. Specifically, the WSD could identify locations where the new technology could greater impact and/or RSE than existing solutions, structure proof-of-concept with industry and university partners, and work with the California Energy Commission (CEC)19 to fund early commercialization. For example, in utilizing the optimization framework to lead a broader statewide conversation the WSD could:
• Serve the community created by the March 2019 Wildfire Technology Innovation Summit20 by establishing a portal for software developers to test new applications (while maintaining the security and confidentiality of the underlying data).
• Identify opportunities to use biomass-fueled generation to improve the economics of fuel treatments. Specifically, the WSD could assist in determining the feasibility of installing wood-fueled boilers or cogeneration at hospitals21 or other energy-intensive facilities located near areas requiring thinning and clearing, in order to lower the cost to transport for disposal, and to generate additional revenue.
• Lead the design and costing of micro-grids serving remote communities, drawing upon work by Lawrence Berkeley National Laboratory22 on simplifying the design of systems serving areas without established electrical grids.
• Promote microgrids powered primarily by centralized renewable resources, using as an example SDG&E’s Borrego Springs microgrid, serving a 2,800-resident town at the end of a single 50-mile radial transmission line. In particular, the microgrid was effective at integrating / dispatching multiple generation resources, the largest of which (a 26 MW solar plant) was intermittent.23
In addition, a rich data set could be used by the WSD and utilities to inform resource planning and rate design. For example, if the WSD determined that no adequate or cost-effective measure existed to mitigate a circuit’s wildfire risk, rather than either allowing the utility to spend inefficiently or to bear the extraordinary risk, they could recognize the need to use PSPS on that circuit. At the same time, interconnected customers could be encouraged to adopt local power solutions (e.g., backup generation, solar paired with energy storage, owned either by the consumer, the utility, or a third party) to allow communities to withstand frequent de-energizations.
19 The CEC (under CPUC oversight) administers grants through its Electric Program Investment Charge (EPIC) program, which is funded by a mandated utility charge. Source: California Energy Commission. “Electric Program Investment Charge Program – EPIC.” https://www.energy.ca.gov/programs-and-topics/programs/electric-program-investment-charge-epic-program. 20 CPUC. Wildfire Technology Innovation Summit. March 20-21, 2019. https://firetechsummit.cpuc.ca.gov/. 21 For example: Vermont Department of Forests, Parks and Recreation. North Country Hospital Biomass Combined Heat and Power Demonstration Project. July 2007. https://archive.epa.gov/region1/healthcare/web/pdf/appendixa.pdf; Gundersen Health System. Biomass boiler a key part of Gundersen energy independence goal. https://www.gundersenenvision.org/app/files/public/5317/envision-case-studies-biomass-boiler-chp-project.pdf.22 Lawrence Berkeley National Laboratory. Rural electrification and capacity expansion with an integrated modeling approach. January 2018. http://eta-publications.lbl.gov/sites/default/files/pdf_11.pdf. 23 CEC. Borrego Springs: California’s First Renewable Energy-Based Community Microgrid. February 2019. https://ww2.energy.ca.gov/2019publications/CEC-500-2019-013/CEC-500-2019-013.pdf.
34

Four options are among those available to the WSD for directly incentivizing local investments by assisting in and educating stakeholders and decisionmakers about:
• The WSD could contribute to the design of a subsidy program, utilizing as a template the Self-Generation Incentive Program24 to offset the cost of specific locations and types of power generation and management resources (reflecting the balance between wildfire, reliability, sustainability, and affordability priorities).
• Through rate design the WSD and utilities could analyze the reliability (and wildfire risk reduction) benefit of local solutions, either by reimbursing for services (similar to payments for ancillary services, such as voltage control) or compensating customers for the avoided mitigation measures.25
• The WSD could study utility proposals to increase their distribution charges to customers located in such areas, making grid-connected power more expensive relative to the cost of procuring local generation.
• The WSD could analyze proposals to lower reliability requirements for such circuits, reflecting the need for PSPS, and creating a disincentive for customers to remain without a backup power source.
By partnering with county and state actors, the WSD could unlock additional types of incentives, including Property-Assessed Clean Energy (PACE) Financing26 and low-interest loans.27
3.3.4 Long-term coordination and integration with other state agencies
The WSD has begun to lay the groundwork today to gain access to more robust data and analytics capabilities in the longer-term, by acquiring talent directly and forming partnerships to leverage existing capabilities. A comprehensive data strategy builds on early foundations, such as common data dictionary and standardized processes for data sharing and risk analysis, creating a platform to support new technologies and diagnostic methods. Advances in data-gathering and analytics have the potential to change how decision-makers receive intelligence, coordinate activity with partners, and provide greater transparency to regulators. It then has the potential to better inform policy and regulatory decisions in the longer-term. Furthermore, more advanced data analytics capabilities can also enable more, detailed data to be available to public stakeholders. Specific to the WSD advanced data can support advanced risk assessments, investment decisions, and resource allocations which would benefit from data-driven scenario planning and optimization. The WSD needs sufficient data fluency in these areas in order to regulate the utilities appropriately.
In order to support and regulate the intelligence derived from advanced analytics, additional data must also be collected by utilities and others over time, at the cadence, accuracy, and quality that the analytics require. Where needed, new metrics, such as a Northern California equivalent of the Santa Ana Wildfire Threat Index (SAWTI), for instance, should be developed to standardize codification of type and degree of risk, using a well-publicized reference point. Additionally, linking data to a central geographic information system (GIS) would allow a range
24 The Self-Generation Incentive Program (https://www.cpuc.ca.gov/sgip/) provides incentives for customer-sited distributed renewable energy systems, with allocations for energy storage technology and siting in low-income communities (many of which are also in High Fire Threat Districts https://ww3.arb.ca.gov/cc/capandtrade/auctionproceeds/lowincomemapfull.htm)25 See discussion of rate design in: Lawrence Berkeley National Laboratory. Distribution System Pricing with Distributed Energy Resources. May 2016. https://emp.lbl.gov/sites/all/files/feur_4_20160518_fin-links2.pdf. 26 See United States Department of Energy. Property Assessed Clean Energy Programs. https://www.energy.gov/eere/slsc/property-assessed-clean-energy-programs.27 See, for example: CEC. Energy Conservation Assistance Act (ECAA). https://www.energy.ca.gov/programs-and-topics/programs/energy-conservation-assistance-act.
35
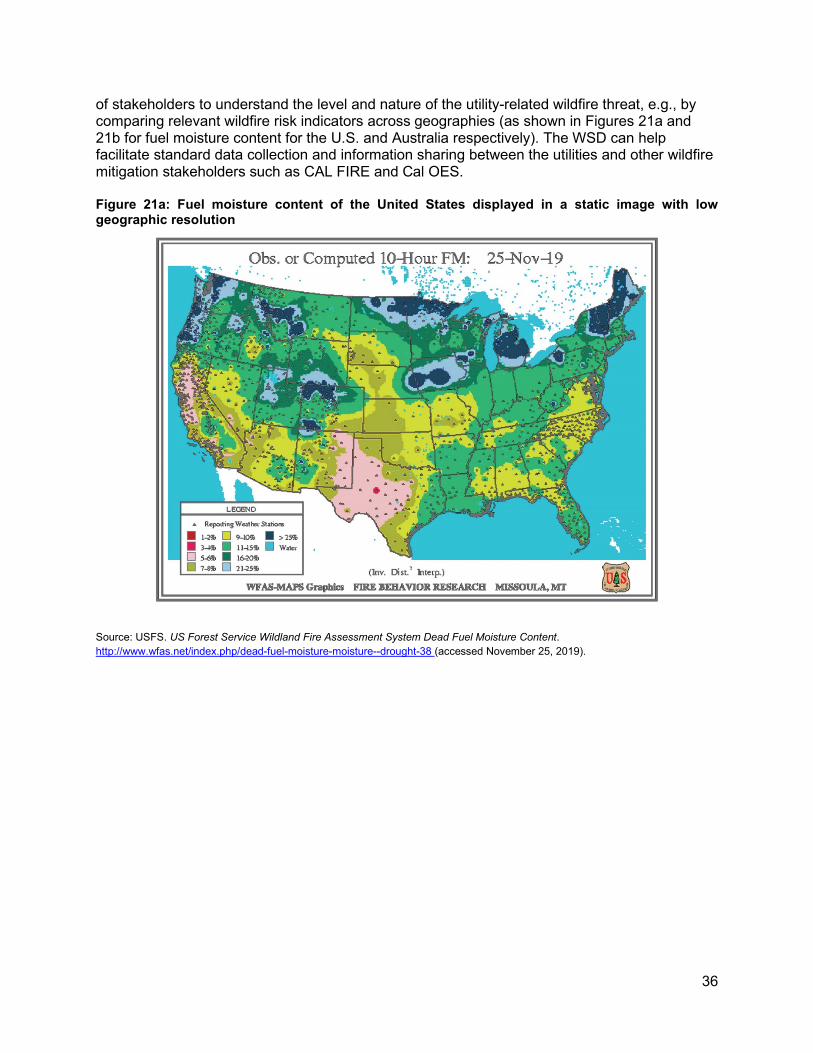
of stakeholders to understand the level and nature of the utility-related wildfire threat, e.g., by comparing relevant wildfire risk indicators across geographies (as shown in Figures 21a and 21b for fuel moisture content for the U.S. and Australia respectively). The WSD can help facilitate standard data collection and information sharing between the utilities and other wildfire mitigation stakeholders such as CAL FIRE and Cal OES.
Figure 21a: Fuel moisture content of the United States displayed in a static image with low geographic resolution
Source: USFS. US Forest Service Wildland Fire Assessment System Dead Fuel Moisture Content. http://www.wfas.net/index.php/dead-fuel-moisture-moisture--drought-38 (accessed November 25, 2019).
36

Figure 21b: Fuel moisture content of Australia displayed in a GIS-enabled online application, with km-scale granularity, overlays of historical content, and the locations of current fires
Source: Bushfire & Natural Hazards CRC. Australian Flammability Monitoring System. http://www.wenfo.org/afms (accessed November 25, 2019).
Finally, in the long-term, WSD and utilities’ risk reduction activities will benefit from data from external non-utility stakeholders and incorporation of fire science expertise (e.g., from universities and research institutions). Collaborating with California’s premier research institutions, including the national laboratories, could strengthen the technical foundations of the WSD’s diagnostics and intelligence generation, and, collectively, establish the state as a global leader in responding to a growing yet difficult-to-quantify risk.
4 Conclusion
The WSD’s utility wildfire mitigation data strategy will enable it to transform how the WSD uses data to oversee utility wildfire policies and procedures. Figure 22 shows how the data strategy empowers the WSD to overcome the data-related pain points it faces in carrying out its oversight and regulatory responsibilities. By executing this strategy, manual reviews and decision-making processes can be improved by rigorous, data-enabled insight.
37
Figure 22: Addressing existing pain points with WSD’s utility wildfire mitigation data strategy
Pain points Elements of the data strategy Example Today Future
Limited use of data Data dictionary defines requirements for data collection
Fuel moisture content data sampled using different methods
Lack of standardization and consistency
WSD can establish standard diagnostic procedures as benchmarks
Each utility uses its own Fire Potential Index
Subjectivity Playbook to document how data and diagnostics should be utilized
WSD decisions made by subject-matter experts
Lack of transparency Data access protocols allow WSD to retrieve (and properly handle) sensitive data
WSD often does not have visibility into the data and diagnostics informing PSPS decisions
Limited stakeholder participation
Utilities do not involve full range of stakeholders in long-term planning
Reporting applications can be designed for use by stakeholders with limited technical resources
A data strategy offers the opportunity to substantially transform this process by creating a platform of standardized, coordinated data, upon which the WSD, other agencies, or external stakeholders could run their analytics and generate insights useful for their decision-making. A data platform representing the ‘single source of truth’ for relevant utility-related wildfire data creates the foundation for mutual understanding and collaboration, promoting cross-pollination of best practices across stakeholders and encouraging continuous learning and improvement. By taking advantage of the lessons learned during the 2020 WMP review process and building the foundations of a robust data strategy, the WSD can position itself to become a leader in California and global utility wildfire mitigation communities.
38
Related Documents