Plant and Soil 246: 53–63, 2002. © 2002 Kluwer Academic Publishers. Printed in the Netherlands. 53 Utilisation of soil organic P by agroforestry and crop species in the field, western Kenya T.S. George 1,4,5 , P.J. Gregory 1 , J.S. Robinson 1 , R.J. Buresh 2,3 & B. Jama 2 1 Department of Soil Science, The University of Reading, P.O. Box 233, Whiteknights, Reading, RG6 6DW, UK. 2 International Centre for Research in Agroforestry (ICRAF), P.O. Box 30677, Nairobi, Kenya. 3 Current address: International Rice Research Institute (IRRI), MCPO Box 3127, 1271 Makati City, Philippines. 4 Current address CSIRO, Plant Industry, P.O. Box 1600, Canberra, ACT 2601, Australia. 5 Corresponding author ∗ Key words: Crotalaria grahmiana, organic P cycling, phosphatase, Sesbania sesban, Tephrosia vogelii, Tithonia diversifolia Abstract A field experiment in western Kenya assessed whether the agroforestry species Tithonia diversifolia (Hemsley) A. Gray, Tephrosia vogelii Hook f., Crotalaria grahamiana Wight & Arn. and Sesbania sesban (L) Merill. had access to forms of soil P unavailable to maize, and the consequences of this for sustainable management of biomass transfer. The species were grown in rows at high planting density to ensure the soil under rows was thoroughly permeated by roots. Soil samples taken from beneath rows were compared to controls, which included a bulk soil monolith enclosed by iron sheets within the tithonia plot, continuous maize, and bare fallow plots. Three separate plant biomass samples and soil samples were taken at 6-month intervals, over a period of 18 months. The agroforestry species produced mainly leaf biomass in the first 6 months but stem growth dominated thereafter. Consequently, litterfall was greatest early in the experiment (0–6 months) and declined with continued growth. Soil pH increased by up to 1 unit (from pH 4.85) and available P increased by up to 38% (1 µgPg −1 ) in agroforestry plots where biomass was conserved on the field. In contrast, in plots where biomass was removed, P availability decreased by up to 15%. Coincident with the declines in litterfall, pH decreased by up to 0.26 pH units, plant available P decreased by between 0.27 and 0.72 µgg −1 and P o concentration decreased by between 8 and 35 µg g −1 in the agroforestry plots. Declines in P o were related to phosphatase activity (R 2 = 0.65,P< 0.05), which was greater under agroforestry species (0.40–0.50 nmol MUB s −1 g −1 ) than maize (0.28 nmol MUB s −1 g −1 ) or the bare fallow (0.25 nmol MUB s −1 g −1 ). Management of tithonia for biomass transfer, decreased available soil P by 0.70 µgg −1 and P o by 22.82 µgg −1 . In this study, tithonia acquired P o that was unavailable to maize. However, it is apparent that continuous cutting and removal of biomass would lead to rapid depletion of P stored in organic forms. Introduction Green biomass of Tithonia diversifolia (Hemsley) A. Gray (subsequently referred to as tithonia) has been identified as a useful resource for biomass transfer (Gachengo et al., 1999) and is one of several technolo- gies under investigation as a means of replenishing soil fertility in East Africa (Buresh and Niang, 1997; Rao et al., 1998). Other species identified with potential for these technologies include Crotalaria grahami- ∗ E-mail: [email protected] ana Wight & Arn., Sesbania sesban (L) Merrill. and Tephrosia vogelii Hook f. Tithonia originated from Mexico and is now widely distributed throughout the humid and sub- humid tropics in Central and South America, Asia and Africa, where it is widespread on roadsides and farm boundaries (Jama et al., 2000). The P concen- tration of leaves is greater than the critical 2.5 mg g −1 threshold for net P mineralisation (Palm et al., 1999) when grown in naturalised hedges (George et al., 2001). This means that addition of biomass to soil is likely to result in net mineralisation rather than

Welcome message from author
This document is posted to help you gain knowledge. Please leave a comment to let me know what you think about it! Share it to your friends and learn new things together.
Transcript
Plant and Soil 246: 53–63, 2002.© 2002 Kluwer Academic Publishers. Printed in the Netherlands.
53
Utilisation of soil organic P by agroforestry and crop species in the field,western Kenya
T.S. George1,4,5, P.J. Gregory1, J.S. Robinson1, R.J. Buresh2,3 & B. Jama2
1Department of Soil Science, The University of Reading, P.O. Box 233, Whiteknights, Reading, RG6 6DW, UK.2International Centre for Research in Agroforestry (ICRAF), P.O. Box 30677, Nairobi, Kenya. 3Current address:International Rice Research Institute (IRRI), MCPO Box 3127, 1271 Makati City, Philippines. 4Current addressCSIRO, Plant Industry, P.O. Box 1600, Canberra, ACT 2601, Australia. 5Corresponding author∗
Key words: Crotalaria grahmiana, organic P cycling, phosphatase, Sesbania sesban, Tephrosia vogelii, Tithoniadiversifolia
Abstract
A field experiment in western Kenya assessed whether the agroforestry species Tithonia diversifolia (Hemsley) A.Gray, Tephrosia vogelii Hook f., Crotalaria grahamiana Wight & Arn. and Sesbania sesban (L) Merill. had accessto forms of soil P unavailable to maize, and the consequences of this for sustainable management of biomasstransfer. The species were grown in rows at high planting density to ensure the soil under rows was thoroughlypermeated by roots. Soil samples taken from beneath rows were compared to controls, which included a bulksoil monolith enclosed by iron sheets within the tithonia plot, continuous maize, and bare fallow plots. Threeseparate plant biomass samples and soil samples were taken at 6-month intervals, over a period of 18 months.The agroforestry species produced mainly leaf biomass in the first 6 months but stem growth dominated thereafter.Consequently, litterfall was greatest early in the experiment (0–6 months) and declined with continued growth. SoilpH increased by up to 1 unit (from pH 4.85) and available P increased by up to 38% (1 µg P g−1) in agroforestryplots where biomass was conserved on the field. In contrast, in plots where biomass was removed, P availabilitydecreased by up to 15%. Coincident with the declines in litterfall, pH decreased by up to 0.26 pH units, plantavailable P decreased by between 0.27 and 0.72 µg g−1 and Po concentration decreased by between 8 and 35 µgg−1 in the agroforestry plots. Declines in Po were related to phosphatase activity (R2 = 0.65, P < 0.05), whichwas greater under agroforestry species (0.40–0.50 nmol MUB s−1 g−1) than maize (0.28 nmol MUB s−1 g−1) orthe bare fallow (0.25 nmol MUB s−1 g−1). Management of tithonia for biomass transfer, decreased available soil Pby 0.70 µg g−1 and Po by 22.82 µg g−1. In this study, tithonia acquired Po that was unavailable to maize. However,it is apparent that continuous cutting and removal of biomass would lead to rapid depletion of P stored in organicforms.
Introduction
Green biomass of Tithonia diversifolia (Hemsley) A.Gray (subsequently referred to as tithonia) has beenidentified as a useful resource for biomass transfer(Gachengo et al., 1999) and is one of several technolo-gies under investigation as a means of replenishing soilfertility in East Africa (Buresh and Niang, 1997; Raoet al., 1998). Other species identified with potentialfor these technologies include Crotalaria grahami-
∗ E-mail: [email protected]
ana Wight & Arn., Sesbania sesban (L) Merrill. andTephrosia vogelii Hook f.
Tithonia originated from Mexico and is nowwidely distributed throughout the humid and sub-humid tropics in Central and South America, Asiaand Africa, where it is widespread on roadsides andfarm boundaries (Jama et al., 2000). The P concen-tration of leaves is greater than the critical 2.5 mgg−1 threshold for net P mineralisation (Palm et al.,1999) when grown in naturalised hedges (George etal., 2001). This means that addition of biomass tosoil is likely to result in net mineralisation rather than
54
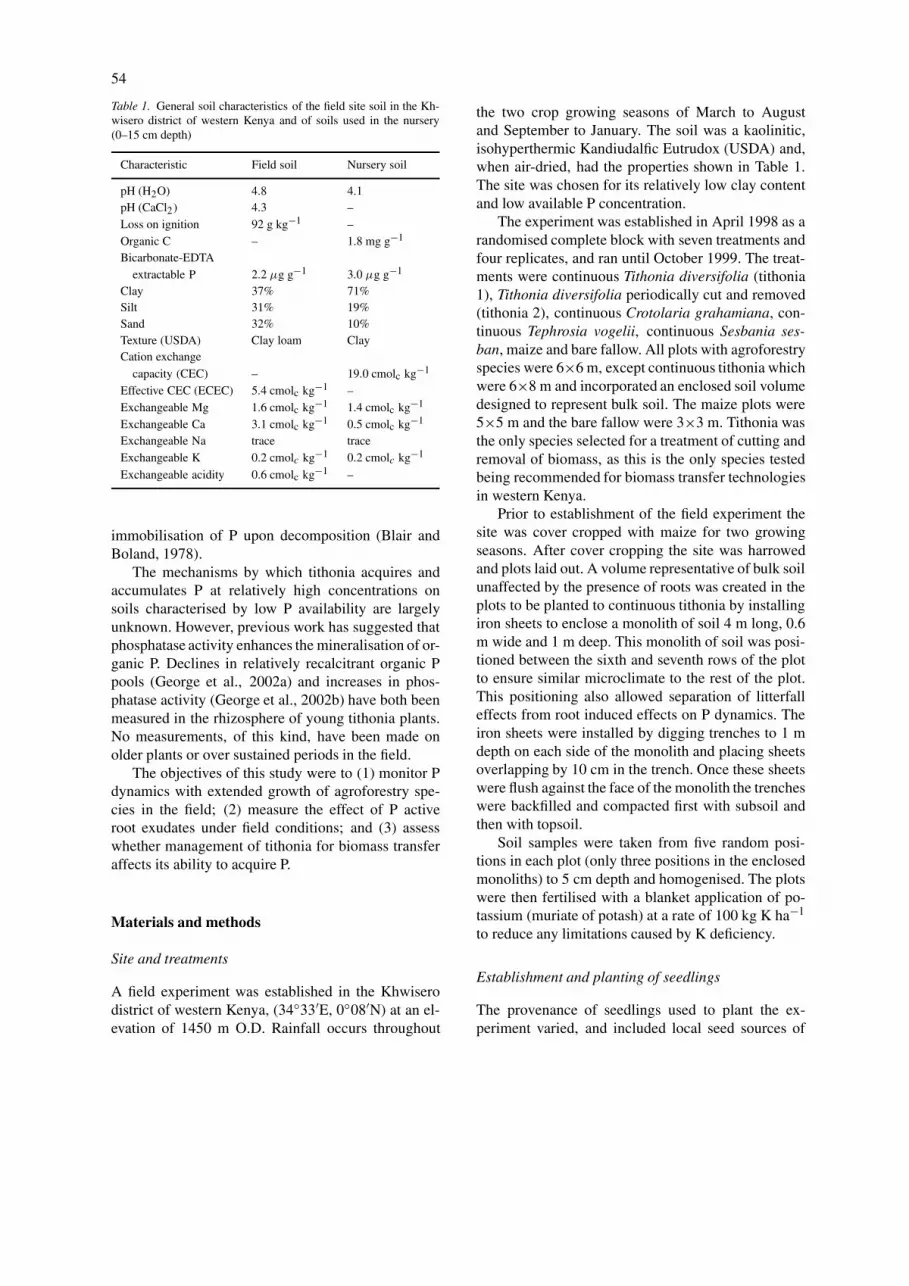
Table 1. General soil characteristics of the field site soil in the Kh-wisero district of western Kenya and of soils used in the nursery(0–15 cm depth)
Characteristic Field soil Nursery soil
pH (H2O) 4.8 4.1pH (CaCl2) 4.3 –Loss on ignition 92 g kg−1 –Organic C – 1.8 mg g−1
Bicarbonate-EDTAextractable P 2.2 µg g−1 3.0 µg g−1
Clay 37% 71%Silt 31% 19%Sand 32% 10%Texture (USDA) Clay loam ClayCation exchange
capacity (CEC) – 19.0 cmolc kg−1
Effective CEC (ECEC) 5.4 cmolc kg−1 –Exchangeable Mg 1.6 cmolc kg−1 1.4 cmolc kg−1
Exchangeable Ca 3.1 cmolc kg−1 0.5 cmolc kg−1
Exchangeable Na trace traceExchangeable K 0.2 cmolc kg−1 0.2 cmolc kg−1
Exchangeable acidity 0.6 cmolc kg−1 –
immobilisation of P upon decomposition (Blair andBoland, 1978).
The mechanisms by which tithonia acquires andaccumulates P at relatively high concentrations onsoils characterised by low P availability are largelyunknown. However, previous work has suggested thatphosphatase activity enhances the mineralisation of or-ganic P. Declines in relatively recalcitrant organic Ppools (George et al., 2002a) and increases in phos-phatase activity (George et al., 2002b) have both beenmeasured in the rhizosphere of young tithonia plants.No measurements, of this kind, have been made onolder plants or over sustained periods in the field.
The objectives of this study were to (1) monitor Pdynamics with extended growth of agroforestry spe-cies in the field; (2) measure the effect of P activeroot exudates under field conditions; and (3) assesswhether management of tithonia for biomass transferaffects its ability to acquire P.
Materials and methods
Site and treatments
A field experiment was established in the Khwiserodistrict of western Kenya, (34◦33′E, 0◦08′N) at an el-evation of 1450 m O.D. Rainfall occurs throughout
the two crop growing seasons of March to Augustand September to January. The soil was a kaolinitic,isohyperthermic Kandiudalfic Eutrudox (USDA) and,when air-dried, had the properties shown in Table 1.The site was chosen for its relatively low clay contentand low available P concentration.
The experiment was established in April 1998 as arandomised complete block with seven treatments andfour replicates, and ran until October 1999. The treat-ments were continuous Tithonia diversifolia (tithonia1), Tithonia diversifolia periodically cut and removed(tithonia 2), continuous Crotolaria grahamiana, con-tinuous Tephrosia vogelii, continuous Sesbania ses-ban, maize and bare fallow. All plots with agroforestryspecies were 6×6 m, except continuous tithonia whichwere 6×8 m and incorporated an enclosed soil volumedesigned to represent bulk soil. The maize plots were5×5 m and the bare fallow were 3×3 m. Tithonia wasthe only species selected for a treatment of cutting andremoval of biomass, as this is the only species testedbeing recommended for biomass transfer technologiesin western Kenya.
Prior to establishment of the field experiment thesite was cover cropped with maize for two growingseasons. After cover cropping the site was harrowedand plots laid out. A volume representative of bulk soilunaffected by the presence of roots was created in theplots to be planted to continuous tithonia by installingiron sheets to enclose a monolith of soil 4 m long, 0.6m wide and 1 m deep. This monolith of soil was posi-tioned between the sixth and seventh rows of the plotto ensure similar microclimate to the rest of the plot.This positioning also allowed separation of litterfalleffects from root induced effects on P dynamics. Theiron sheets were installed by digging trenches to 1 mdepth on each side of the monolith and placing sheetsoverlapping by 10 cm in the trench. Once these sheetswere flush against the face of the monolith the trencheswere backfilled and compacted first with subsoil andthen with topsoil.
Soil samples were taken from five random posi-tions in each plot (only three positions in the enclosedmonoliths) to 5 cm depth and homogenised. The plotswere then fertilised with a blanket application of po-tassium (muriate of potash) at a rate of 100 kg K ha−1
to reduce any limitations caused by K deficiency.
Establishment and planting of seedlings
The provenance of seedlings used to plant the ex-periment varied, and included local seed sources of
55
Tithonia diversifolia (Siaya, Kenya) and Sesbania ses-ban (Kakamega, Kenya) and inter-continental sourcesof Crotolaria grahamiana (Mararauo, Madagascar)and Tephrosia vogelii (Yaounde, Cameroon). Theseeds were sown into shaded germinating beds filledwith coarse sand between 6 and 14 March 1998. Theseedlings were allowed to establish for 3–5 days, andwere then pricked out and transferred into nursery me-dia contained in polythene collars. The nursery mediaconsisted of a 5:1:1 mix of forest soil from a 10–15-year old plantation (properties shown in Table 1),animal manure and sand. The seedlings were allowedto establish in the nursery media under shelter, thenhardened in the prevailing climate for 2 weeks prior toplanting.
On 28 April 1998, maize was direct seeded in fiverows 1 m apart, with 15 cm between individual seedswithin the row. The agroforestry species were plantedon 12 and 13 May 1998 also in rows 1 m apart and15 cm between plants. The plots were hand weededweekly, and the areas between plots were slashedevery month. Maize plots were harvested at the sametime as other crops in the region and re-sown to givetwo crops per year. After 6 months, biomass from thetithonia 2 plots was cut at the surface, above groundbiomass removed and cut stems left to regenerate.
Plant and soil sampling
Yields of maize grain, stover and cob were measuredand tissues ground for nutrient analysis. Agroforestryplots were sampled every 6 months by destructivelyharvesting all of the plants in a 2-m sub-sample of arow. Yields of stem, leaves and flowers/pods for eachspecies were recorded after oven-drying, at 60 ◦C untilweight stabilised, and samples kept for nutrient ana-lysis. At the end of the experiment (October 1999),all plots were destructively harvested and the biomassof each plant part measured. Litter was collected byremoving all dead biomass from the surface of theplots.
Soil samples from 0 to 50 mm were taken directlyunder planted rows in October 1998, April 1999 andOctober 1999. In bare fallow plots, three samples weretaken at least 0.5 m from the edge of the plot. In themaize plots, six samples were taken from the middlethree planted rows, at least 1 m from the edge of theplot. Nine samples were taken from the middle fourrows of the agroforestry plots, three of which weretaken beneath the plants to be destructively sampled.The continuous tithonia plots were sampled in the
same way as other agroforestry plots with additionalsoil sampling (two samples) within the enclosed soilmonolith. Soil samples were composites of three augerborings to 50 mm depth, taken with a 70-mm diameterEdleman auger. Individual samples under the sametreatment were bulked, homogenised and a sub-sample(about 1 kg) was air-dried, ground and passed througha 2-mm mesh sieve before subsequent analysis.
Analyses
Soil samples were analysed by procedures modifiedfrom Hedley et al. (1994), and described in full inGeorge et al. (2002a). Measurements of pH were fol-lowed in sequence by extractions of P using anionexchange resin, and 0.1 M NaOH, the latter of whichwas split into inorganic (Pi) and organic P (Po) bydifference. Supernatants from the various stages wereanalysed for P concentration by colorimetry using themethod of Murphy and Riley (1962).
Phosphatase activity in soil samples taken from be-neath rows was analysed after 18 months plant growth,using an fluorescent enzyme assay based on methyl-umberliferone (MUB)-phosphate described by Marxet al. (2001).
Sub-samples of the plant material were digestedand analysed for tissue N, P and K content by aciddigestion (Parkinson and Allen, 1975), followed bycolorimetry (N and P) and flame photometry (K).
All data are presented as means of three replicateswith standard errors in parenthesis or as bars. Differ-ences between treatments were tested with standardone-way analysis of variance (ANOVA) using GEN-STAT (Genstat, 1987). Values for percent changesin soil parameters were calculated by removing thechange in the bare fallow, assumed to be due to in-corporation of maize trash at the end of previous covercropping. Changes in P fractions were calculated relat-ive to the original concentration in the fraction, whilepH changes were calculated relative to the changenecessary to reach neutrality.
Results
Biomass production
After 6 months growth there were significant dif-ferences (P < 0.001) in the amounts of biomassproduced by different species (Table 2). Tithonia andcrotalaria had the largest production of leaves and lit-
56
Table 2. Average biomass yields (t ha−1) of total plants and plant parts for agroforestry plots after 6 and 12 months plant growth, in the fieldexperiment western Kenya
Treatment Biomass Yield (October 1998) (t ha−1) Biomass Yield (May 1999) (t ha−1)
Leaf Litter Stem Pods Total Leaf Litter Stem Pods Total
Tithonia1 1.8 (0.16)3 2.5 (0.06) 5.2 (0.62) A 9.5 (0.84)bc 2.4 (0.36) 3.9 (0.55) 13.9 (1.16) A 20.2 (2.07)b
Tithonia2 2.1 (0.06) 1.6 (0.02) 7.9 (1.04) A 11.6 (1.12)b 1.9 (0.20) 0.9 (0.12) 3.4 (0.70) A 6.3 (1.02)c
Crotolaria1 2.6 (0.27) 2.3 (0.29) 9.2 (1.45) 5.6 (0.27) 19.7 (2.28)a 2.9 (0.46) 4.0 (0.58) 21.6 (1.69) 0.8 (0.10) 29.3 (2.83)a
Tephrosia1 1.2 (0.13) 1.7 (0.12) 4.7 (0.90) 0.7 (0.04) 8.3 (1.19)c 0.2 (0.06) B 4.0 (0.74) 0.4 (0.15) 4.6 (0.95)d
Sesbania1 1.6 (0.34) 1.0 (0.45) 11.3 (1.37) nd 13.9 (2.16)ab 0.6 (0.47) B 22.2 (7.80) 0.3 (0.27) 23.1 (8.54)ab
1Continuous growth of stand.2Stand cut and removed at 6-monthly intervals.3Values in parentheses are standard errors of the mean.(a−d)Letters refer to significance, if letter is different within the same column then total biomass is significantly different (P < 0.05).nd – not determined; A – Tithonia does not produce seed pods; B – Grass weed made it impossible to harvest litter.
ter, while crotolaria and sesbania produced the largestdry weights of stem.
After 12 months, much the same pattern existed,except that the tithonia cut at 6 months had muchless (P < 0.001) total biomass than the continuoustithonia. However, when the biomass removed fromthe cut plot was included, there was no significant dif-ference between the tithonia treatments (Table 2). Inthe second 6-month period, leaf, litter and stem dryweight increased in both tithonia and crotolaria plots,although the majority of the biomass production forboth species was as stems. In contrast, leaf biomassof tephrosia and sesbania plots declined while stemdry weights remained the same or increased. At thisharvest it was impossible to collect litter in tephrosiaand sesbania plots due to infestation with a grass weed.
Maize grain and cob yields varied significantly(P < 0.05) with season (Table 3). Maize failed inthe first short rains (harvest January 1999), but grainyield was similar in all other seasons (average for threeseasons=1.8 t ha−1). In contrast, stover and total yieldsdid not vary with season. This point is reflected in theharvest index (proportion of total biomass as grain)which is relatively high for seasons 1, 3 and 4, butlow for season 2.
Total nutrient uptake
The amount of N, P and K taken up varied signific-antly (P < 0.001) with species (Table 4). Crotalariaand tithonia took up consistently more N, P and Kthan sesbania and tephrosia, management of tithoniamade no difference to the total uptake of any nu-trient. The leguminous species (crotalaria, tephrosia,sesbania) partitioned most of their nutrients to stems,
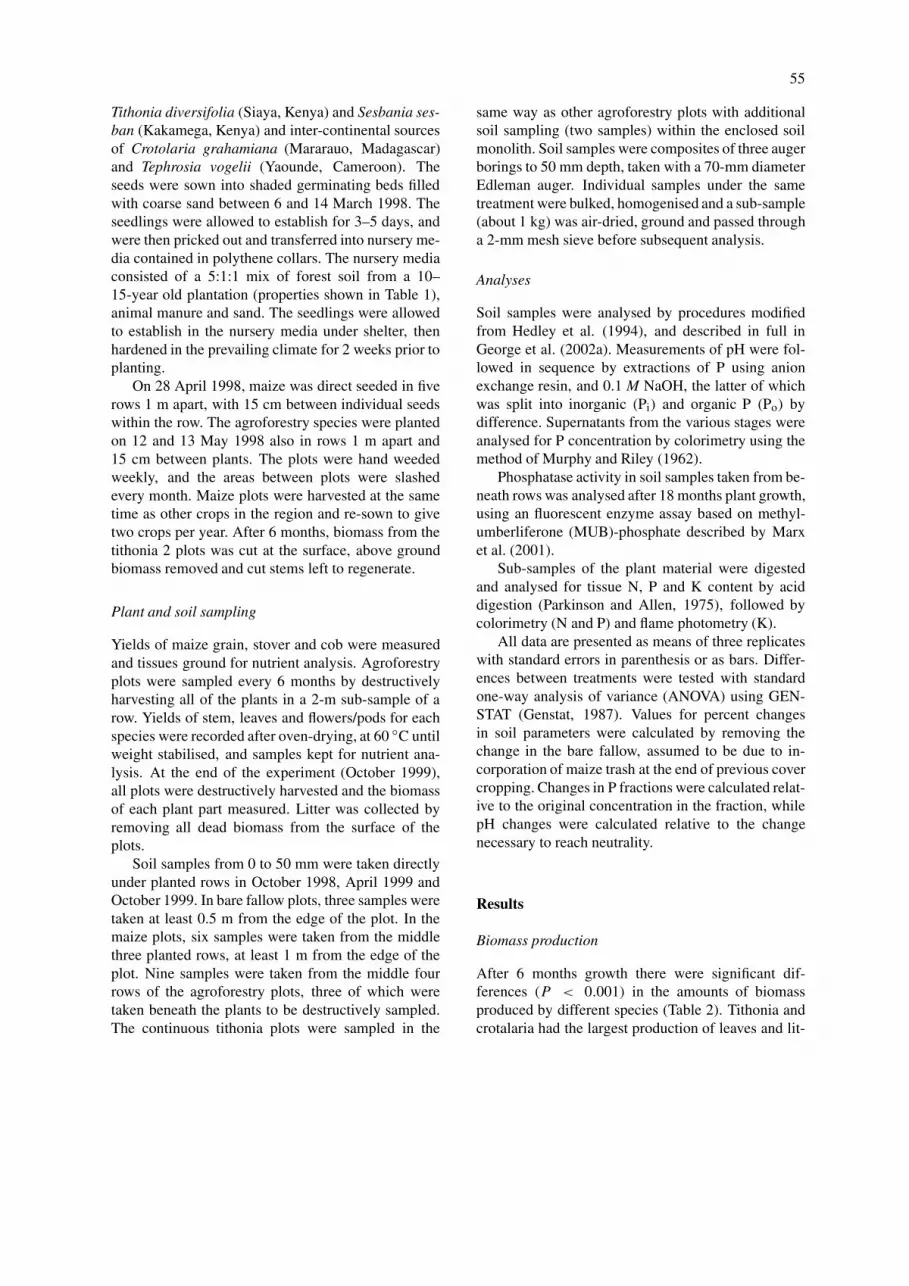
Figure 1. Soil pH in field plots after 0, 12 and 18 months.
whereas tithonia partitioned similar amounts to leavesand stems.
Soil pH and P changes
At the beginning of the experiment there were nodifferences between plots with regard to pH, Resin-P, NaOH-Pi or NaOH-Po. After 12 months of plantgrowth the pH under all agroforestry species includ-ing enclosed soil areas had risen significantly (P <
0.01, Figure 1). pH in maize plots also increased(P < 0.05), while in bare fallow plots it remainedunchanged. After 18 months pH was greater in allthe agroforestry plots than at the start of the exper-iment, although it had declined between 12 and 18months in some treatments. In contrast, during thesame period pH in the enclosed bulk soil continued toincrease, while the bare fallow pH remained the same.

57
Table 3. Average maize yield (four growing seasons) from maize plots of the fieldexperiment, western Kenya
Harvest date Maize yield
Cob Stover Total Grain Harvest
(t ha−1) (t ha−1) (t ha−1) (t ha−1) index
August 1998 3.0 (0.64)∗ 2.4 (0.37) 5.4 (1.01) 2.2 (0.47)a 0.41
January 1999 0.3 (0.13) 2.6 (0.52) 2.9 (0.65) 0.2 (0.09)b 0.07
July 1999 1.5 (0.32) 2.2 (0.39) 3.7 (0.71) 1.2 (0.26)a 0.32
January 2000 2.5 (0.68) 2.1 (0.36) 4.6 (1.04) 2.1 (0.57)a 0.46
Mean 1.8 (0.44) 2.3 (0.41) 4.2 (0.85) 1.4 (0.35) 0.32
∗Values in parentheses are standard errors of the mean.(a−−b)Letters refer to significance, if letter is different then grain yield is significantlydifferent (P < 0.05).
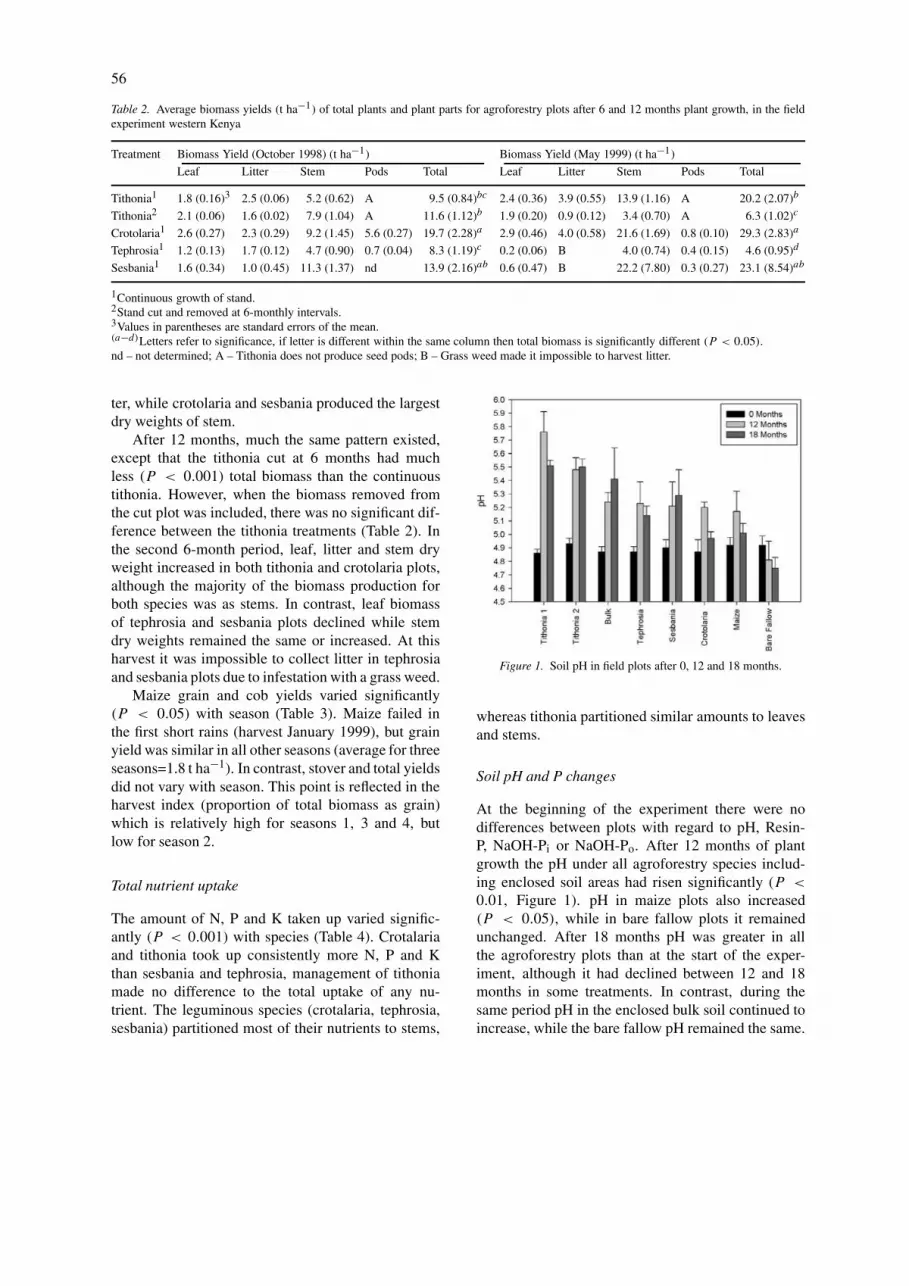
Figure 2. Resin-P concentration under field plots after 0, 12 and 18months.
There were significant differences (P < 0.001) in pHbetween treatments after both 12 and 18 months. Over-all, all tithonia plots, including enclosed soil areashad the highest pH, while the bare fallow pH did notchange (Figure 1).
Resin-P increased (P < 0.01) by 0.82 µg g−1 inthe bare fallow after 12 months. A similar increasein resin-P was observed in tephrosia and crotolariaplots. Continuous tithonia (+1.45 µg g−1) and ses-bania (+1.12 µg g−1) increased resin-P to a greaterextent. However, resin-P also increased in the bulksoil area within the continuous tithonia plots. In con-trast to all other plots, resin-P in maize plots did notchange significantly during plant growth (Figure 2). Inthe subsequent 6 months resin-P in all plots began todecline, except in the maize plot which again remainedunchanged.
Figure 3. NaOH-Pi concentration under field plots after 0, 12 and18 months.
Figure 4. NaOH-Po concentration under field plots after 0, 12 and18 months.
58
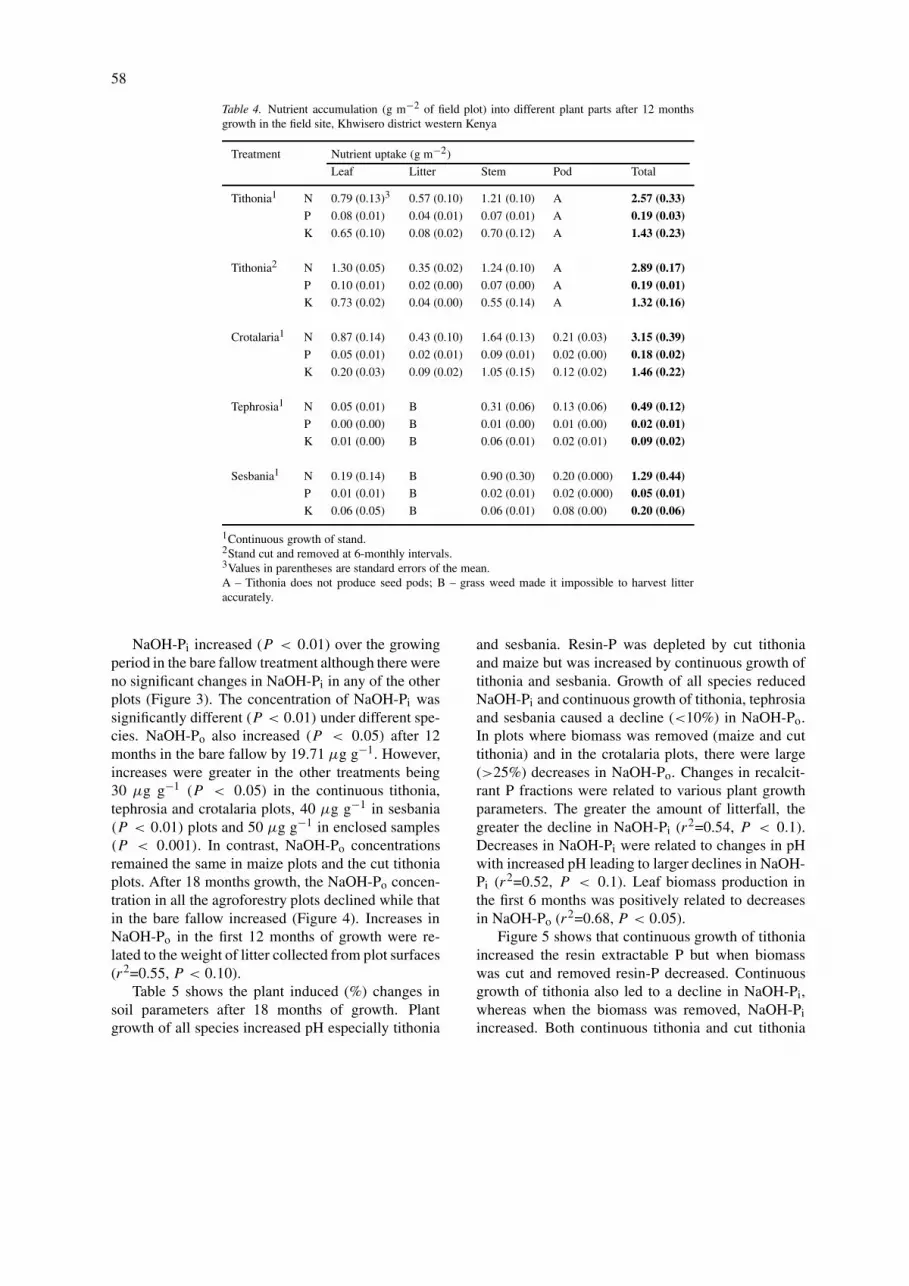
Table 4. Nutrient accumulation (g m−2 of field plot) into different plant parts after 12 monthsgrowth in the field site, Khwisero district western Kenya
Treatment Nutrient uptake (g m−2)
Leaf Litter Stem Pod Total
Tithonia1 N 0.79 (0.13)3 0.57 (0.10) 1.21 (0.10) A 2.57 (0.33)P 0.08 (0.01) 0.04 (0.01) 0.07 (0.01) A 0.19 (0.03)K 0.65 (0.10) 0.08 (0.02) 0.70 (0.12) A 1.43 (0.23)
Tithonia2 N 1.30 (0.05) 0.35 (0.02) 1.24 (0.10) A 2.89 (0.17)P 0.10 (0.01) 0.02 (0.00) 0.07 (0.00) A 0.19 (0.01)K 0.73 (0.02) 0.04 (0.00) 0.55 (0.14) A 1.32 (0.16)
Crotalaria1 N 0.87 (0.14) 0.43 (0.10) 1.64 (0.13) 0.21 (0.03) 3.15 (0.39)P 0.05 (0.01) 0.02 (0.01) 0.09 (0.01) 0.02 (0.00) 0.18 (0.02)K 0.20 (0.03) 0.09 (0.02) 1.05 (0.15) 0.12 (0.02) 1.46 (0.22)
Tephrosia1 N 0.05 (0.01) B 0.31 (0.06) 0.13 (0.06) 0.49 (0.12)P 0.00 (0.00) B 0.01 (0.00) 0.01 (0.00) 0.02 (0.01)K 0.01 (0.00) B 0.06 (0.01) 0.02 (0.01) 0.09 (0.02)
Sesbania1 N 0.19 (0.14) B 0.90 (0.30) 0.20 (0.000) 1.29 (0.44)P 0.01 (0.01) B 0.02 (0.01) 0.02 (0.000) 0.05 (0.01)K 0.06 (0.05) B 0.06 (0.01) 0.08 (0.00) 0.20 (0.06)
1Continuous growth of stand.2Stand cut and removed at 6-monthly intervals.3Values in parentheses are standard errors of the mean.A – Tithonia does not produce seed pods; B – grass weed made it impossible to harvest litteraccurately.
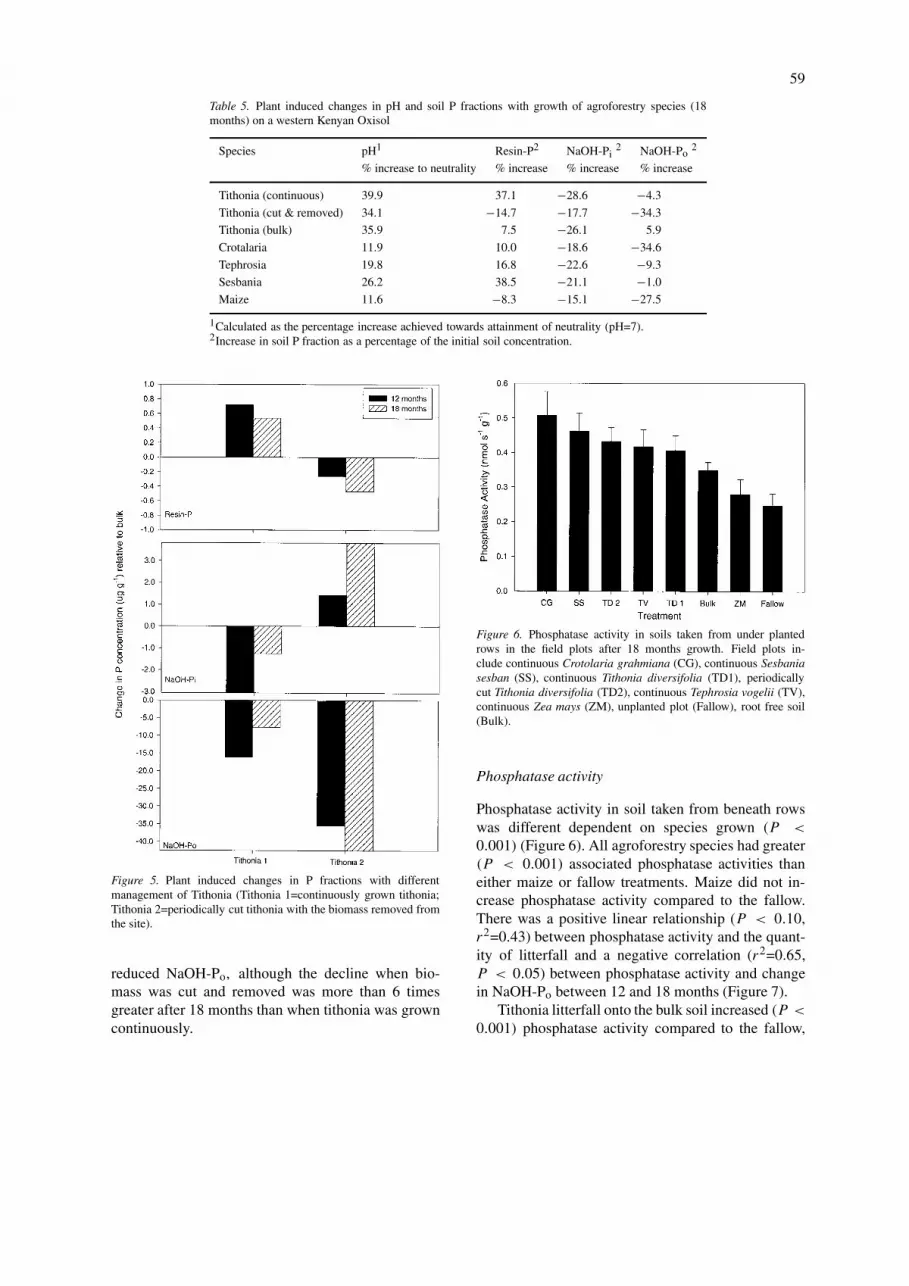
NaOH-Pi increased (P < 0.01) over the growingperiod in the bare fallow treatment although there wereno significant changes in NaOH-Pi in any of the otherplots (Figure 3). The concentration of NaOH-Pi wassignificantly different (P < 0.01) under different spe-cies. NaOH-Po also increased (P < 0.05) after 12months in the bare fallow by 19.71 µg g−1. However,increases were greater in the other treatments being30 µg g−1 (P < 0.05) in the continuous tithonia,tephrosia and crotalaria plots, 40 µg g−1 in sesbania(P < 0.01) plots and 50 µg g−1 in enclosed samples(P < 0.001). In contrast, NaOH-Po concentrationsremained the same in maize plots and the cut tithoniaplots. After 18 months growth, the NaOH-Po concen-tration in all the agroforestry plots declined while thatin the bare fallow increased (Figure 4). Increases inNaOH-Po in the first 12 months of growth were re-lated to the weight of litter collected from plot surfaces(r2=0.55, P < 0.10).
Table 5 shows the plant induced (%) changes insoil parameters after 18 months of growth. Plantgrowth of all species increased pH especially tithonia
and sesbania. Resin-P was depleted by cut tithoniaand maize but was increased by continuous growth oftithonia and sesbania. Growth of all species reducedNaOH-Pi and continuous growth of tithonia, tephrosiaand sesbania caused a decline (<10%) in NaOH-Po.In plots where biomass was removed (maize and cuttithonia) and in the crotalaria plots, there were large(>25%) decreases in NaOH-Po. Changes in recalcit-rant P fractions were related to various plant growthparameters. The greater the amount of litterfall, thegreater the decline in NaOH-Pi (r2=0.54, P < 0.1).Decreases in NaOH-Pi were related to changes in pHwith increased pH leading to larger declines in NaOH-Pi (r2=0.52, P < 0.1). Leaf biomass production inthe first 6 months was positively related to decreasesin NaOH-Po (r2=0.68, P < 0.05).
Figure 5 shows that continuous growth of tithoniaincreased the resin extractable P but when biomasswas cut and removed resin-P decreased. Continuousgrowth of tithonia also led to a decline in NaOH-Pi,whereas when the biomass was removed, NaOH-Piincreased. Both continuous tithonia and cut tithonia
59
Table 5. Plant induced changes in pH and soil P fractions with growth of agroforestry species (18months) on a western Kenyan Oxisol
Species pH1 Resin-P2 NaOH-Pi2 NaOH-Po
2
% increase to neutrality % increase % increase % increase
Tithonia (continuous) 39.9 37.1 −28.6 −4.3
Tithonia (cut & removed) 34.1 −14.7 −17.7 −34.3
Tithonia (bulk) 35.9 7.5 −26.1 5.9
Crotalaria 11.9 10.0 −18.6 −34.6
Tephrosia 19.8 16.8 −22.6 −9.3
Sesbania 26.2 38.5 −21.1 −1.0
Maize 11.6 −8.3 −15.1 −27.5
1Calculated as the percentage increase achieved towards attainment of neutrality (pH=7).2Increase in soil P fraction as a percentage of the initial soil concentration.
Figure 5. Plant induced changes in P fractions with differentmanagement of Tithonia (Tithonia 1=continuously grown tithonia;Tithonia 2=periodically cut tithonia with the biomass removed fromthe site).
reduced NaOH-Po, although the decline when bio-mass was cut and removed was more than 6 timesgreater after 18 months than when tithonia was growncontinuously.
Figure 6. Phosphatase activity in soils taken from under plantedrows in the field plots after 18 months growth. Field plots in-clude continuous Crotolaria grahmiana (CG), continuous Sesbaniasesban (SS), continuous Tithonia diversifolia (TD1), periodicallycut Tithonia diversifolia (TD2), continuous Tephrosia vogelii (TV),continuous Zea mays (ZM), unplanted plot (Fallow), root free soil(Bulk).
Phosphatase activity
Phosphatase activity in soil taken from beneath rowswas different dependent on species grown (P <
0.001) (Figure 6). All agroforestry species had greater(P < 0.001) associated phosphatase activities thaneither maize or fallow treatments. Maize did not in-crease phosphatase activity compared to the fallow.There was a positive linear relationship (P < 0.10,r2=0.43) between phosphatase activity and the quant-ity of litterfall and a negative correlation (r2=0.65,P < 0.05) between phosphatase activity and changein NaOH-Po between 12 and 18 months (Figure 7).
Tithonia litterfall onto the bulk soil increased (P <
0.001) phosphatase activity compared to the fallow,

60
Phosphatase Activity (nmol s−1g−1)
Figure 7. Relationship between phosphatase activity in soils at 18months plant growth and the decline in NaOH-Po in the last 6months of the experiment.
but roots had an additional effect as both tithonia plotshad a higher (P < 0.001) activity than the enclosedsoil. However, there was no significant difference intotal phosphatase activity between the two differentlymanaged tithonia plots.
Discussion
Biomass production
Biomass production of agroforestry species was sim-ilar to and showed the same temporal variation ingrowth patterns as other studies using similar species(Barrios et al., 1997; Ndufa et al., 1999). In the first6 months of growth, production of leaf biomass wasrelatively large for all agroforestry species but after12 months they produced fewer leaves and subsequentgrowth was concentrated in stems. This meant thatlater in the growth of the agroforestry stands there wasless litterfall and potentially less cycling of nutrients.The management of tithonia for biomass transfer didnot alter leaf biomass production, but total biomassproduction of the cut tithonia was significantly lessfollowing cutting than before cutting.
Maize yields were five times greater than thosereported for plots without fertilisation by Jama et al.(1997) on an Alfisol in the same region of westernKenya. However, studies on similar Oxisols in thesame region have demonstrated similar maize yields(1.5–2.5 t ha−1) (Jama et al., 1998; Mutuo et al.,1999).
Changes in soil pH
Growth of agroforestry species increased soil pH,most notably under tithonia, but also substantially un-der sesbania. Increases in soil pH under sesbania havealso been noted by Nyberg and Hogberg (1995) andOnim et al. (1990) with the addition of sesbania greenmanure to a soil. These authors attributed increased pHto the relatively high concentration of Ca in sesbaniatissue compared to other agroforestry species (Nyathiand Campbell, 1994). High tissue concentrations of Cahave also been noted for tithonia (Jama et al., 2000),and might explain the increases of pH in tithonia plots.
After 12 months it was apparent that pH began todecline in the agroforestry plots. It is probable thatlarge additions of litter in the early stages of growthcontributed to increased pH. However, subsequent de-clines in litterfall due to allocation of more resourcesto stem growth would potentially reduce the neutral-ising effect, allowing acidification by roots to lowerpH in plots. Evidence for the acidifying effect of theroots is demonstrated by the fact that, coincident withacidification in other plots beyond 12 months, pH con-tinued to increase in the bulk soil samples where therewas no root effect.
Changes in P pools
Under bare fallow concentrations of P extracted byNaOH increased throughout the experiment probablybecause of some residual fertilisation effect, eitherfrom previous fertilisation or due to the incorporationof maize trash at the end of the cover cropping periodprior to experimentation.
Treatments involving the removal of biomass fromplots (tithonia 2 and maize) produced a decline inresin extractable P, contrasting with increases in agro-forestry plots where litterfall was large (tithonia 1and crotalaria). This suggests that maintenance oraugmentation of plant available P in this Oxisol is de-pendent on cycling of nutrients through litterfall. Thishas been observed previously on Oxisols and Ultisolsin Brazil by McGrath et al. (2000), who demonstratedthat resin extractable P was enhanced with litterfall.
In comparison to the bare fallow, all plant speciesproduced a decline in the NaOH-Pi. This was greaterfor agroforestry species than maize. The relation-ship between increased litterfall and greater declinein NaOH-Pi suggests that the associated pH increaseswith addition of litter are responsible for reducedNaOH-Pi. This probably occurs because pH increases,
61
in this soil, would reduce the solubility of Fe and Alresulting in lower reactivity of these metals with P(Barrow, 1987). This link with pH is supported by therelationship between NaOH-Pi decline and pH change.
Growth of agroforestry species increased NaOH-Po concentration in the soil. This was most notable inbulk soil under tithonia. Whereas when roots had aninfluence on the soil sample, sesbania produced thegreatest increase in NaOH-Po. Maroko et al. (1999)also found a 20 µg g−1 increase in NaOH-Po con-centration with growth of sesbania compared to a barefallow. They attributed the increase to cycling of Po vialitterfall, which is also suggested by the relationshipbetween litterfall in the first 12 months and increasesin NaOH-Po, in this study.
After 12 months growth the NaOH-Po fractionbegan to decline in agroforestry plots, suggesting anet mineralisation of Po after the rate of litterfall inthe stands had declined. The decline in NaOH-Po to18 months was related to the leaf biomass productionof the various species in the first 6 months, suggestingreliance of Po mineralisation on availability of recentlydeposited substrate.
The growth of agroforestry species appears to im-prove chemical properties of the soil and probablymicrobial cycling of nutrients. This has been previ-ously demonstrated by many authors including Kanget al. (1999), who observed that agroforestry speciesenhanced organic carbon, phosphorus and potassiumlevels in soils. Wick et al. (1998) showed increased pHand NaOH-Po concentration in Nigerian soils, with thegrowth of Leucaena leucocephala and Senna siamea.They also attributed these changes to cycling throughlitterfall.
It could therefore be postulated that, early in thegrowth of agroforestry species they produce largeamounts of leaf biomass, which enhances litterfall.This litterfall then alters the soil favourably for contin-ued growth, by increasing pH which tends to increasethe availability of more recalcitrant P forms. This,along with recycling of P in organic material, stimu-lates microbial biomass leading to the build up of Poby microbial immobilisation. Once the soil character-istics are more favourable, the plants reduce resourceallocation to leaves and put more resources into stemgrowth. During this period, pH and P availability de-cline and continued acquisition of Po immobilised inthe previous phase causes net mineralisation of the Popreviously accumulated.
Effects of biomass cycling can be seen in Figure 5.When above ground biomass is periodically removed
from tithonia stands, resin-P declines, NaOH-Pi in-creases and NaOH-Po greatly declines. This appearsto be a less sustainable use of P resources compared tocontinuous growth of tithonia where there is continu-ous cycling of nutrients via litterfall. This suggests thatdespite the fact that cutting and removal of tithoniabiomass improves the plant’s ability to acquire P fromsources less available to maize, longer-term cuttingwill quickly exhaust the available reserves of Po whichare not replenished by litterfall.
Phosphatase activity
Soil from agroforestry plots had greater phosphataseactivities than that taken from below maize and inbare fallow treatments, and this activity was ap-parently related to declines in concentrations of Po.Previous studies have demonstrated increased phos-phatase activity under agroforestry species. Wick etal. (1998) grew Leucaena leucocephala and Sennasiamea and not only demonstrated greater acid phos-phatase activity but also increased alkaline phos-phatase, β-glucosidase and protease activities underagroforestry species. Similarly, Chander et al. (1998)demonstrated greater phosphatase activity in plotswhere trees (Dalbergia sissoo) had been incorpor-ated. In addition, Khanna (1997) also demonstratedenhanced phosphatase activity with the growth ofEucalyptus and Acacia.
Enhanced phosphatase activities with growth ofagroforestry species could be attributed to either en-hanced phosphatase production in the rhizosphere asdemonstrated in George et al. (2002b) or productionby a stimulated microbial biomass on the addition oforganic material as litterfall. The latter explanationwas suggested for enhanced phosphatase activities un-der agroforestry in Nigeria by Wick et al. (1998), whoalso demonstrated increased microbial populations.This could also explain the positive linear relationshipbetween litterfall (t ha−1) and phosphatase activity(nmol MUB s−1 g−1) shown in our study.
The results from this field trial support the con-clusions made on 8-week-old seedlings by Georgeet al. (2002a,b). Agroforestry species acquire Po un-available to maize while also enhancing the activityof phosphatase. However, what was not demonstratedby the short-term pot studies was the importance ofcycling of organic material by litterfall. Cycling of or-ganic material by continuous growth of agroforestryspecies is beneficial in that it improves pH, and Pavailability, potentially enhances microbial cycling of
62
nutrients and provides a readily available supply ofPo for phosphatase to hydrolyse. Overall, agroforestryspecies, particularly tithonia, appear to be useful spe-cies for agroforestry technologies especially where theplant can benefit from litterfall, such as in improvedfallow systems. However, where the litterfall compon-ent is lost, e.g., biomass transfer, then the growth oftithonia appears to be unsustainable due to potentialrapid mining of Po resources.
Conclusions
• After an initial establishment phase of 6 months,agroforestry species switched biomass productionfrom leaves to stem, with subsequent reducedlitterfall.
• Growth of agroforestry species increased pH, resinextractable P, and NaOH-Po, while decreasingNaOH-Pi. These dynamics were related to addi-tion of, potentially Ca-rich, organic material bylitterfall. In contrast maize and tithonia plants,where the biomass was removed, decreased resinextractable P and increased NaOH-Pi. However,they also reduced NaOH-Po.
• Phosphatase activity was greater under the agro-forestry species than under the maize.
• Management of tithonia for biomass transfer ap-pears to be deleterious to the sustainability ofthe technology. Despite utilisation of Po resourcesbeing stimulated by cutting, it is apparent thatwithout replenishment of these resources by lit-terfall growth of tithonia for biomass transfer willquickly exhausts the soil of available Po resources.
Acknowledgements
T.S.G. thanks the Natural Environment ResearchCouncil (NERC) for funding his postgraduate researchstudentship and Obedere Kyinguti and his team forhelp in establishment and management of the field plotat Khwiseiro.
References
Barrios E, Kwesiga F, Buresh R J and Sprent J I 1997 Light fractionsoil organic matter and available nitrogen following trees andmaize. Soil Sci. Soc. Am. J. 37, 121–131.
Barrow N J 1987 Reactions with Variable Charge Soils. MartinusNijhoff, Dordrecht.
Bhardwaj K K R and Datt N 1995 Effects of legume green-manuringon nitrogen mineralisation and some microbiological propertiesin an acid rice soil. Biol. Fertil. Soil. 19, 19–21.
Blair G J and Boland O W 1978 The release of P from plant materialadded to soil. Aust. J. Soil Res. 16, 101–111.
Buresh R J and Niang A I 1997 Tithonia diversifolia as a greenmanure: awareness, expectations and realities. Agrofor. Forum8, 29–31.
Chander K, Goyal S, Nandal D P and Kapoor K K 1998 Soil or-ganic matter, microbial biomass and enzyme activity in a tropicalagroforestry system. Biol. Fertil. Soil 27, 168–172.
Gachengo C N, Palm C A, Jama B and Othieno C 1999 Tithoniaand senna green manures and inorganic fertilizers as phosphorussources for maize in western Kenya. Agrofor. Systems 44, 21–36.
George T S, Gregory P J, Robinson J S, Buresh R J and Jama B2001 Tithonia diversifolia: Variations in leaf nutrient concen-tration and implications for biomass transfer. Agrofor. Syst. 52,199–205.
George T S, Gregory P J, Robinson J S and Buresh R J 2002aChanges in phosphorus concentrations and pH in the rhizosphereof some agroforestry and crop species. Plant Soil (in press).
George T S, Gregory P J, Robinson J S, Wood M, Read D and Bur-esh R J 2002b Phosphorus active root exudates in the rhizosphereof Tithonia diversifolia and other potential agroforestry species.Soil Biol. Biochem. (in press).
Haggar J P and Ewel J J 1994 Experiments on the ecological basisof sustainability: early findings on nitrogen, phosphorus and rootsystems. Interciencia 19, 347–351.
Hedley M J, Kirk G J D and Santos M B 1994 Phosphorus efficiencyand the forms of soil phosphorus utilised by upland rice cultivars.Plant Soil 158, 53–62.
Jama B, Swinkels R A and Buresh R J 1997 Agronomic and eco-nomic evaluation of organic and inorganic sources of phosphorusin western Kenya. Agron. J. 89, 597–604.
Jama B, Buresh R J and Place F M 1998 Sesbania tree fallowson phosphorus deficient sites: Maize yield and financial benefit.Agron. J. 90, 717–726.
Jama B, Palm C A, Buresh R J, Niang A, Gachengo C, NzinguhebaG and Amadalo B 2000 Tithonia diversifolia as a green ma-nure for soil fertility improvement in western Kenya: a review.Agrofor. Syst. 49, 201–221.
Kang B T, Caveness F E, Tian G and Kolawole G O 1999 Longtermalley cropping with four hedgerow species on an Alfisol in south-western Nigeria: effects on crop performance, soil chemicalproperties and nematode population. Nutr. Cycl. Agroecosyst.54, 145–155.
Khanna P K 1997 Nutrient cycling under mixed-species tree sys-tems in southeast Asia. Agrofor. Syst. 38, 99–120.
Maroko J B, Buresh R J and Smithson P C 1999 Soil phosphorusfractions in unfertilised fallow-maize systems in two tropicalsoils. Soil Sci. Soc. Am. J. 63, 320–326.
Marx M-C, Wood M and Jarvis S C 2001 A microplate fluorimet-ric assay for the study of enzyme diversity in soils. Soil Biol.Biochem. 33, 1633–1640.
McGrath D A, Comerford N B and Duryea M L 2000 Litter dynam-ics and monthly fluctuations in soil phosphorus availability in anAmazonian agroforest. For. Ecol. Manage. 131, 167–181.
Murphy J and Riley J P 1962 A modified single solution method forthe determination of phosphate in natural waters. Anal. Chim.Acta 27, 31–36.
Mutuo P K, Smithson P C, Buresh R J and Okalebo R J 1999Comparisons of phosphate rock and triple superphosphate on aphosphorus deficient Kenyan soil. Commun. Soil Sci. Plant Anal.30, 1091–1103.

63
Ndufa J K, Sheppard K D, Buresh R J and Jama B 1999 Nutrient up-take and growth of young trees in a P-deficient soil: tree speciesand phosphorus effects. For. Ecol. Manage. 122, 231–241.
Niang A, Amadalo B, Gathumbi S and Obonyo C O 1996 Maizeyield response to green manure application from selected shrubsand tree species in western Kenya: a preliminary assessment.East Afr. Agric. For. J. 62, 199–207.
Nyathi P and Campbell B 1994 Leaf quality of Sesbania sesban,Leucaena leucocephala and Brachystegia spiciformis: potentialof agroforestry species. For. Ecol. Manage. 64, 259–264.
Nyberg G and Hogberg P 1995 Effects of young agroforestry treeson soils in on-farm situations in western Kenya. Agrofor. Syst.32, 45–52.
Onim J F M, Mathuva M, Otieno K and Fitzhugh H A 1990 Soilfertility changes and response of maize and beans to green ma-nures of leucaena, sesbania and pigeonpea. Agrofor. Syst. 12,197–215.
Palm C A, Nziguheba G, Gachengo C, Gacheru E and Rao MR 1999 Organic materials as sources of phosphorus. Agrofor.Forum 9, 30–33.
Palm C A 1995 Contribution of agroforestry trees to nutrientrequirements of intercropped plants. Agrofor. Syst. 30, 105–124.
Parkinson J A and Allen S E 1975 A wet oxidation procedure suit-able for the determination of nitrogen and mineral nutrients inbiological materials. Commun. Soil Sci. Plant Anal. 6, 1–11.
Rao M R, Niang A, Kwesiga F, Duguma B, Franzel S, Jama Band Buresh R 1998 Soil fertility replenishment in sub-SaharanAfrica: new techniques and the spread of their use on farms.Agrofor. Today 10, 3–8.
Wick B, Kuhne R F and Vlek P L G 1998 Soil microbiologicalparameters as indicators of soil quality under improved fallowmanagement systems in south-western Nigeria. Plant Soil 202,97–107.
Section editor: H. Lambers
Related Documents