Ustilago maydis reprograms cell proliferation in maize anthers Li Gao 1,2, *, Timothy Kelliher 2 , Linda Nguyen 2 and Virginia Walbot 2 1 State Key Laboratory for Biology of Plant Disease and Insect Pests, Institute of Plant Protection, Chinese Academy of Agricultural Sciences, Beijing 100193, China, and 2 Department of Biology, Stanford University, 385 Serra Mall, Stanford, CA 94305-5020, USA Received 31 January 2013; revised 04 May 2013; accepted 23 May 2013; published online 25 June 2013. *For correspondence (e-mail [email protected]). SUMMARY The basidiomycete Ustilago maydis is a ubiquitous pathogen of maize (Zea mays), one of the world’s most important cereal crops. Infection by this smut fungus triggers tumor formation in aerial plant parts within which the fungus sporulates. Using confocal microscopy to track U. maydis infection on corn anthers for 7 days post-injection, we found that U. maydis is located on the epidermis during the first 2 days, and has reached all anther lobe cell types by 3 days post-injection. Fungal infection alters cell-fate specification events, cell division patterns, host cell expansion and host cell senescence, depending on the developmen- tal stage and cell type. Fungal effects on tassel and plant growth were also quantified. Transcriptome profil- ing using a dual organism microarray identified thousands of anther genes affected by fungal infection at 3 days post-injection during the cell-fate specification and rapid cell proliferation phases of anther develop- ment. In total, 4147 (17%) of anther-expressed genes were altered by infection, 2018 fungal genes were expressed in anthers, and 206 fungal secretome genes may be anther-specific. The results confirm that U. maydis deploys distinct genes to cause disease in specific maize organs, and suggest mechanisms by which the host plant is manipulated to generate a tumor. Keywords: Zea mays, anther, Ustilago maydis, interaction. INTRODUCTION Infection of maize (Zea mays) by the pathogenic basidio- mycete Ustilago maydis causes plant cancer, characterized by tumor formation in aerial organs. Tumors consist of mixed populations of proliferating plant cells and fungal hyphae, which eventually mature into teliospores, the primary agent of fungal dispersal (Banuett, 2002). Infection is initiated by a dikaryotic filament that arises after fusion of two compatible haploid sporidia or growth of the modi- fied solopathogenic (SG200) fungal strain (Doehlemann et al., 2008). The invading filaments exhibit tip growth but fail to divide mitotically; during extended tip growth, empty sections are sealed off by regularly spaced septae (Steinberg et al., 1998). After appressorium formation, fun- gal cells proliferate and penetrate between epidermal cells (Snetselaar and Mims, 1992), and subsequently the fungal cells interact extensively with host cells, forming a bio- trophic interface in which the pathogen and invaginations of the host plasma membranes are in close contact. Tumor formation is mediated, at least in part, by fungal proteins secreted into the biotrophic interface that trigger host developmental and physiological changes. The U. maydis genome was found to contain 12 gene clusters encoding three or more proposed secreted proteins whose expres- sion in most cases was significantly up-regulated at some stage of tumor formation on seedling leaves (K€ amper et al., 2006). Bioinformatics analysis estimated that there are 554 U. maydis secretome genes (M€ ueller et al., 2008). Nearly all research on this host–pathogen interaction has focused on early steps in pathogen establishment, resulting in detailed knowledge of the fungal genome, the gene expression patterns during infection, and the genetic requirements for pathogenicity (K€ amper et al., 2006; Doeh- lemann et al., 2009; Wahl et al., 2010). Cytological descrip- tions of tumors are restricted to electron micrographs of infected seedling leaves (Callow and Ling, 1973; Callow, 1975). More recently, infection of maize adult organs and developmental mutants established several host require- ments for tumor formation, such as active cell proliferation (Walbot and Skibbe, 2010), and transcriptome profiling of both host and pathogen established that both partners © 2013 The Authors The Plant Journal © 2013 John Wiley & Sons Ltd 903 The Plant Journal (2013) 75, 903–914 doi: 10.1111/tpj.12270

Welcome message from author
This document is posted to help you gain knowledge. Please leave a comment to let me know what you think about it! Share it to your friends and learn new things together.
Transcript
Ustilago maydis reprograms cell proliferation in maizeanthers
Li Gao1,2,*, Timothy Kelliher2, Linda Nguyen2 and Virginia Walbot2
1State Key Laboratory for Biology of Plant Disease and Insect Pests, Institute of Plant Protection, Chinese Academy of
Agricultural Sciences, Beijing 100193, China, and2Department of Biology, Stanford University, 385 Serra Mall, Stanford, CA 94305-5020, USA
Received 31 January 2013; revised 04 May 2013; accepted 23 May 2013; published online 25 June 2013.
*For correspondence (e-mail [email protected]).
SUMMARY
The basidiomycete Ustilago maydis is a ubiquitous pathogen of maize (Zea mays), one of the world’s most
important cereal crops. Infection by this smut fungus triggers tumor formation in aerial plant parts within
which the fungus sporulates. Using confocal microscopy to track U. maydis infection on corn anthers for
7 days post-injection, we found that U. maydis is located on the epidermis during the first 2 days, and has
reached all anther lobe cell types by 3 days post-injection. Fungal infection alters cell-fate specification
events, cell division patterns, host cell expansion and host cell senescence, depending on the developmen-
tal stage and cell type. Fungal effects on tassel and plant growth were also quantified. Transcriptome profil-
ing using a dual organism microarray identified thousands of anther genes affected by fungal infection at
3 days post-injection during the cell-fate specification and rapid cell proliferation phases of anther develop-
ment. In total, 4147 (17%) of anther-expressed genes were altered by infection, 2018 fungal genes were
expressed in anthers, and 206 fungal secretome genes may be anther-specific. The results confirm that
U. maydis deploys distinct genes to cause disease in specific maize organs, and suggest mechanisms by
which the host plant is manipulated to generate a tumor.
Keywords: Zea mays, anther, Ustilago maydis, interaction.
INTRODUCTION
Infection of maize (Zea mays) by the pathogenic basidio-
mycete Ustilago maydis causes plant cancer, characterized
by tumor formation in aerial organs. Tumors consist of
mixed populations of proliferating plant cells and fungal
hyphae, which eventually mature into teliospores, the
primary agent of fungal dispersal (Banuett, 2002). Infection
is initiated by a dikaryotic filament that arises after fusion
of two compatible haploid sporidia or growth of the modi-
fied solopathogenic (SG200) fungal strain (Doehlemann
et al., 2008). The invading filaments exhibit tip growth but
fail to divide mitotically; during extended tip growth,
empty sections are sealed off by regularly spaced septae
(Steinberg et al., 1998). After appressorium formation, fun-
gal cells proliferate and penetrate between epidermal cells
(Snetselaar and Mims, 1992), and subsequently the fungal
cells interact extensively with host cells, forming a bio-
trophic interface in which the pathogen and invaginations
of the host plasma membranes are in close contact. Tumor
formation is mediated, at least in part, by fungal proteins
secreted into the biotrophic interface that trigger host
developmental and physiological changes. The U. maydis
genome was found to contain 12 gene clusters encoding
three or more proposed secreted proteins whose expres-
sion in most cases was significantly up-regulated at some
stage of tumor formation on seedling leaves (K€amper
et al., 2006). Bioinformatics analysis estimated that there
are 554 U. maydis secretome genes (M€ueller et al., 2008).
Nearly all research on this host–pathogen interaction
has focused on early steps in pathogen establishment,
resulting in detailed knowledge of the fungal genome, the
gene expression patterns during infection, and the genetic
requirements for pathogenicity (K€amper et al., 2006; Doeh-
lemann et al., 2009; Wahl et al., 2010). Cytological descrip-
tions of tumors are restricted to electron micrographs of
infected seedling leaves (Callow and Ling, 1973; Callow,
1975). More recently, infection of maize adult organs and
developmental mutants established several host require-
ments for tumor formation, such as active cell proliferation
(Walbot and Skibbe, 2010), and transcriptome profiling of
both host and pathogen established that both partners
© 2013 The AuthorsThe Plant Journal © 2013 John Wiley & Sons Ltd
903
The Plant Journal (2013) 75, 903–914 doi: 10.1111/tpj.12270

exhibit organ-specific gene expression during infection
(Skibbe et al., 2010).
As a biotrophic pathogen, U. maydis causes tumors by
reprogramming vegetative and reproductive development,
causing disturbances in normal organ growth resulting in
organs that grow much larger than normal (Walbot and
Skibbe, 2010). Maize anthers are particularly favorable for
analyzing development, because they are readily dissected
and staged by length, and developmental progression is
highly regular within each anther and among anthers of
similar size. Additionally, lobe cells have well-defined pat-
terns of cell division and growth (Ma et al., 2008; Kelliher
and Walbot, 2011). Maize tassels have hundreds of paired
spikelets, each containing six stamens separated into two
florets (Kelliher and Walbot, 2011). Stamens consist of
pollen-producing anthers subtended by filaments, which
supply nutrients and water to the growing anther through
a single vascular column (Figure 1a–d). An immature
anther of 250 lm comprises four lobes flanking the con-
nective tissue and central vasculature; at this stage, lobes
contain epidermis (EPI), endothecium (EN), secondary pari-
etal layer (SPL) and pre-meiotic archesporial (AR) cell types
(Figure 1e). By 700 lm, SPL cells have divided periclinally
to establish middle layer (ML) and tapetum (TA) cells
(Kelliher and Walbot, 2012), and from this stage onwards,
normal anther lobes contain five cell types (Figure 1f–h).
Exploiting these features, we have analyzed the interaction
between the maize anther and the U. maydis pathogen
using confocal microscopy and transcriptome profiling to
compare developmental progression in normal and
infected anthers.
RESULTS
Timeline of U. maydis infection on maize anthers
To determine appropriate times at which to investigate the
effect of U. maydis on anther development, we tracked
infection by strain SG200-YFP in three dimensions by con-
focal imaging. Infected and mock-infected anthers were
stained with propidium iodide to determine host cell
(a) (b) (c) (d)
(e) (f) (g) (h)
(i)
Figure 1. Orientation to maize organs and cell types.
(a) Maize plant at 30 days.
(b) The tassel consists of a central spike with several lateral branches, which together support hundreds of paired spikelets. This immature tassel (approximately
3 cm) contains anthers of <100–400 lm.
(c) Spikelets contain two florets of three stamens each. Note that the anthers in the upper floret are approximately 1 day more developmentally advanced that
the anthers in the lower floret.
(d) Stamens consist of an anther supported by a filament. The y axis represents the apical–basal axis.(e) Propidium iodide-stained confocal reconstruction of a transverse section of a 250 lm anther, comprising four lobes surrounding the central connective and
vascular tissue, which are continuous with the filament. In each lobe, the epidermis and three sub-epidermal somatic cell types surround the central reproduc-
tive cells that undergo meiosis and ultimately form pollen. The x,z view represents the circumferential and radial axis, respectively.
(f–h) Confocal reconstructions of propidium iodide-stained anthers at (f) 700 lm, (g) 1000 lm and (h) 1500 lm. All locules in (f)–(h) comprise EPI, EN, ML, TA
and AR cells/PMCs.
V, vasculature; C, connective tissue; EPI, epidermal cell; EN, endothecial cell; SPL, secondary parietal layer cell; AR/PMC, archesporial cell/pollen mother cell;
ML, middle layer cell; TA, tapetal cell. Scale bars = 6 cm (a), 1 cm (b), 500 lm (c), 250 lm (d), and 50 lm (e–h).
© 2013 The AuthorsThe Plant Journal © 2013 John Wiley & Sons Ltd, The Plant Journal, (2013), 75, 903–914
904 Li Gao et al.

morphologies, and the YFP signal identified the tip of live
fungi. The major developmental stages classified by anther
length are <100 lm (before cell-fate specification), approxi-
mately 200–500 lm (during cell-fate specification but
before periclinal division of the SPL), and > 700 lm (when
all lobe cell types are present). At all three stages, U. may-
dis was observed on the epidermis at 1 and 2 days
post-injection (dpi) (Table 1), and, on subsequent days,
both epidermal and sub-epidermal cells were in contact
with U. maydis (Table 1 and Figure 2). To confirm these
observations, infected anthers were also stained with
WGA-AF488 (wheatgerm agglutinin conjugated to
Alexa Fluor 488) to identify both live fungal cell tips and
the empty septated cell walls tracing the filaments and
hyphae (Figure 3).
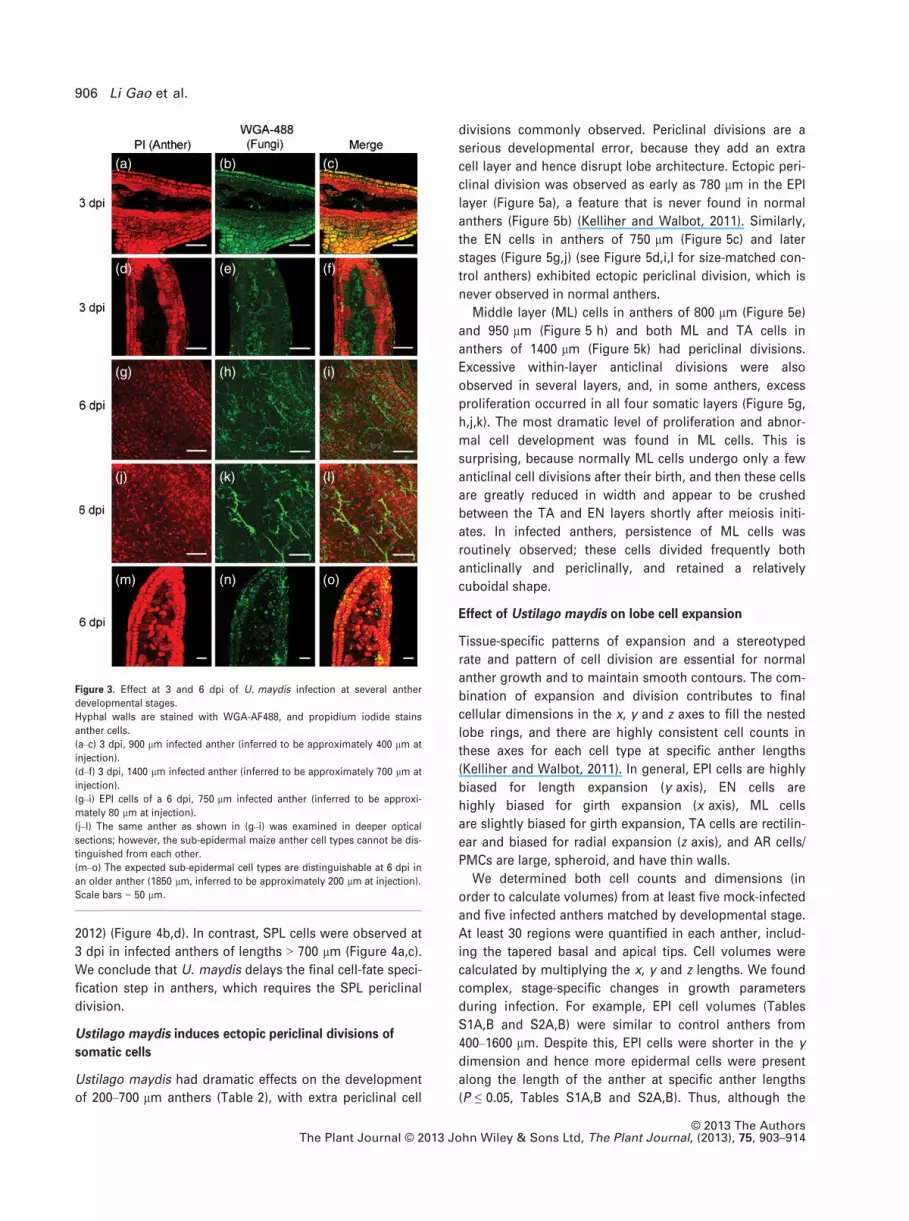
At 3 dpi, hyphae were observed weaving around and
into the central-most AR cells of 900 lm anthers (inferred
to be approximately 400 lm at injection) (Figure 3a–c);
similar results were observed with 1400 lm long anthers
(inferred to be approximately 700 lm at injection)
(Figure 3d–f). To reach AR cells/pollen mother cells (PMCs),
hyphae made contact with all somatic sub-epidermal cell
types. In sub-epidermal leaf cells, the biotrophic interface
is observed by 4 dpi (Doehlemann et al., 2008), and we
assume that this zone is forming in anthers at 3 dpi
although we have no specific marker for this structure.
Infection of young anthers prior to cell-fate specification
resulted in total disruption of internal lobe development:
although the anthers kept growing in length and girth,
sub-epidermal cell types were abnormal and lacked differ-
entiated features of EN, ML, TA or AR cells (Figure 3j–l). In
addition, for anthers infected at a length of approximately
80 lm, although the epidermis appeared intact (Figure 3g–
i), the cell length and volume were significantly smaller
(P ≤ 0.001) than mock-infected anthers, and there were sig-
nificantly more cells along the y axis (P ≤ 0.001) than in
normal anthers. Anther cells infected after initiation of cell-
fate specification retained aspects of normal cell identity at
6 dpi. For instance, an anther of 1850 lm (inferred to be
approximately 200 lm at injection) contains recognizable
cell types (Figure 3m–o). For deeper analysis of the effect of
infection on development of specific cell types, we chose to
focus on 3 dpi infected anthers with injection after 200 lm.
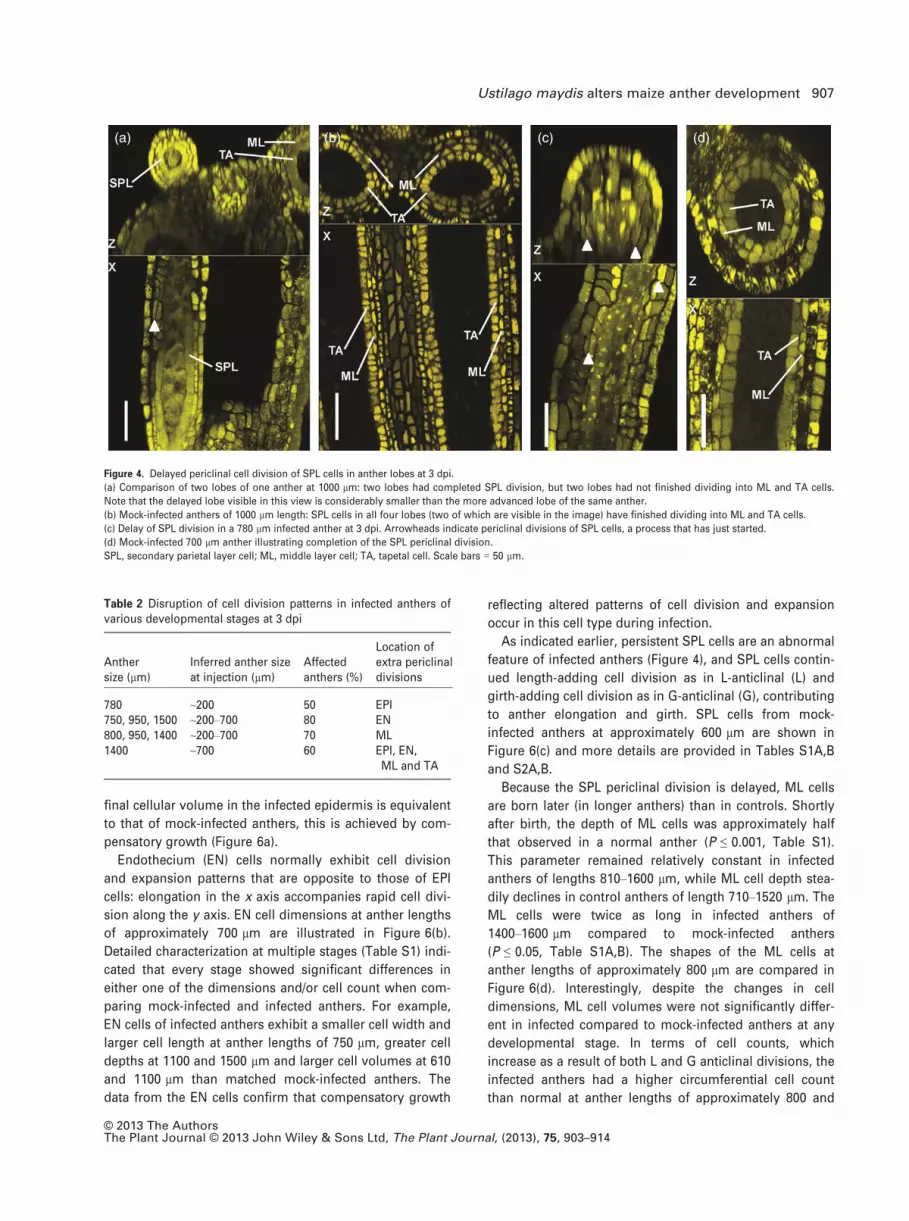
Ustilago maydis delays the SPL cell periclinal division
Normally, the four anther lobes reach developmental land-
marks coordinately; one key landmark is the periclinal divi-
sion of SPL cells to generate ML and TA cells. In infected
anthers, we found variation within the same anther, with
some lobes having SPL cells and other lobes containing
ML and TA cells. Figure 4(a) shows a 1000 lm anther with
two aberrant lobes. In mock-infected anthers, all SPL cells
have divided periclinally and terminally differentiated into
ML and TA cells by the 700 lm stage (Kelliher and Walbot,
Table 1 Timeline of U. maydis infection on maize anthers
DpiAnalysislength (lm)
Inferred length(lm) at injection
Fungal location(cell type)
1 750 ~550 EPI2 250 ~90 EPI2 560 ~220 EPI3 1450 ~700 EPI, EN, ML, TA and PMC3 1500 ~700 EPI, EN, ML, TA and PMC3 1700 ~800 EPI, EN, ML, TA and PMC3 2000 ~1000 EPI, EN, ML, TA and PMC4 2600 >1000 EPI, EN, ML, TA and PMC4 3000 >1000 EPI, EN, ML, TA and PMC5 3700 >1000 EPI, EN, ML, TA and PMC6 2600 >1000 EPI, EN, ML, TA and PMC7 2200 >1000 EPI, EN, ML, TA and PMC
The inferred length at the time of injection is based on thetimeline described by (Kelliher and Walbot, 2012).
(a) (b) (c)
(d) (e) (f)
(g) (h) (i)
(j) (k) (l)
(m) (n) (o)
Figure 2. U. maydis location on cell types of one maize anther (1500 lm) at
3 dpi.
YFP green signal indicates live fungi tips, while propidium iodide (red)
stains the nuclei of all anther cell types. (a–c) Fungi located on EPI cells;
(d–f) fungi located on EN cells; (g–i) fungi located on ML cells; (j–l) fungi
located on TA cells; (m–o) fungi located on PMCs. Scale bars = 50 lm.
© 2013 The AuthorsThe Plant Journal © 2013 John Wiley & Sons Ltd, The Plant Journal, (2013), 75, 903–914
Ustilago maydis alters maize anther development 905
2012) (Figure 4b,d). In contrast, SPL cells were observed at
3 dpi in infected anthers of lengths > 700 lm (Figure 4a,c).
We conclude that U. maydis delays the final cell-fate speci-
fication step in anthers, which requires the SPL periclinal
division.
Ustilago maydis induces ectopic periclinal divisions of
somatic cells
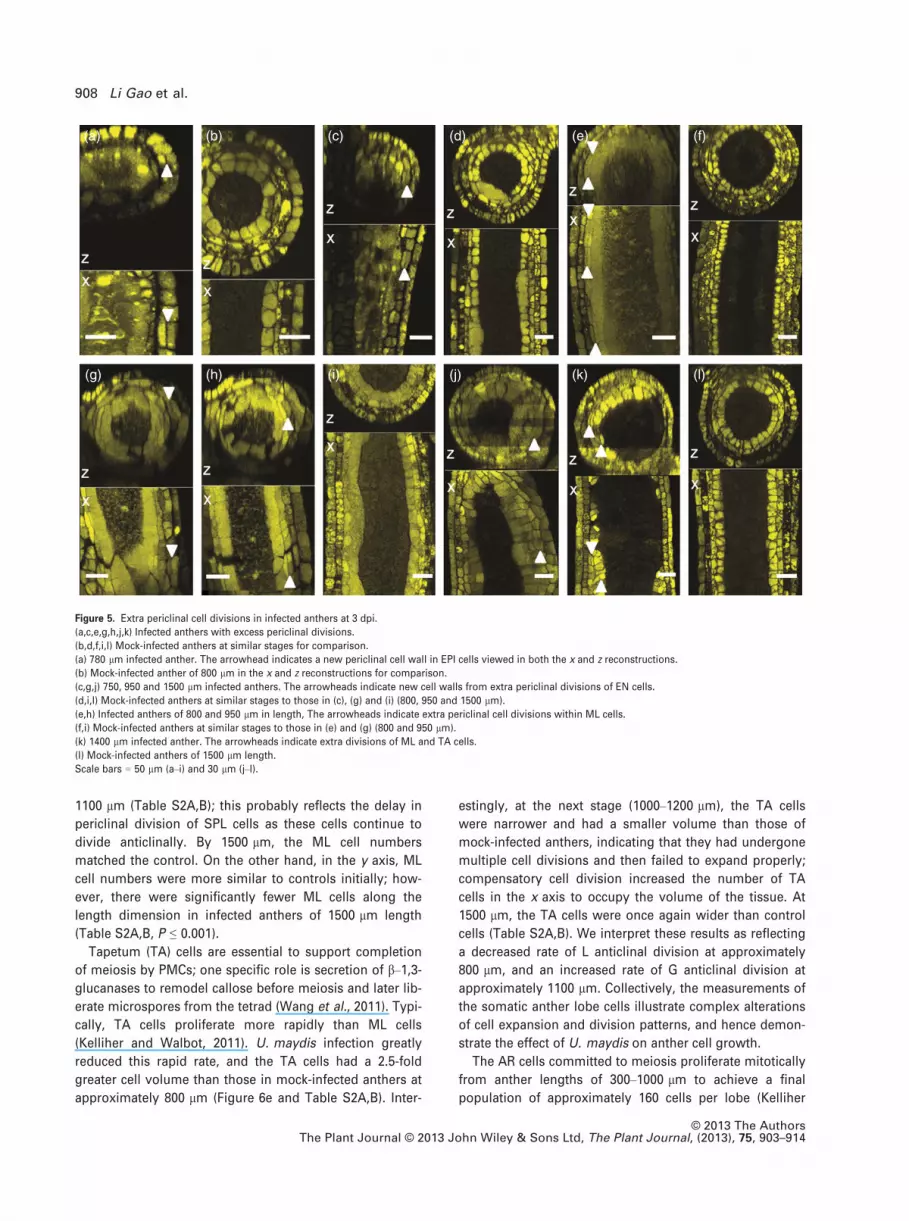
Ustilago maydis had dramatic effects on the development
of 200–700 lm anthers (Table 2), with extra periclinal cell
divisions commonly observed. Periclinal divisions are a
serious developmental error, because they add an extra
cell layer and hence disrupt lobe architecture. Ectopic peri-
clinal division was observed as early as 780 lm in the EPI
layer (Figure 5a), a feature that is never found in normal
anthers (Figure 5b) (Kelliher and Walbot, 2011). Similarly,
the EN cells in anthers of 750 lm (Figure 5c) and later
stages (Figure 5g,j) (see Figure 5d,i,l for size-matched con-
trol anthers) exhibited ectopic periclinal division, which is
never observed in normal anthers.
Middle layer (ML) cells in anthers of 800 lm (Figure 5e)
and 950 lm (Figure 5 h) and both ML and TA cells in
anthers of 1400 lm (Figure 5k) had periclinal divisions.
Excessive within-layer anticlinal divisions were also
observed in several layers, and, in some anthers, excess
proliferation occurred in all four somatic layers (Figure 5g,
h,j,k). The most dramatic level of proliferation and abnor-
mal cell development was found in ML cells. This is
surprising, because normally ML cells undergo only a few
anticlinal cell divisions after their birth, and then these cells
are greatly reduced in width and appear to be crushed
between the TA and EN layers shortly after meiosis initi-
ates. In infected anthers, persistence of ML cells was
routinely observed; these cells divided frequently both
anticlinally and periclinally, and retained a relatively
cuboidal shape.
Effect of Ustilago maydis on lobe cell expansion
Tissue-specific patterns of expansion and a stereotyped
rate and pattern of cell division are essential for normal
anther growth and to maintain smooth contours. The com-
bination of expansion and division contributes to final
cellular dimensions in the x, y and z axes to fill the nested
lobe rings, and there are highly consistent cell counts in
these axes for each cell type at specific anther lengths
(Kelliher and Walbot, 2011). In general, EPI cells are highly
biased for length expansion (y axis), EN cells are
highly biased for girth expansion (x axis), ML cells
are slightly biased for girth expansion, TA cells are rectilin-
ear and biased for radial expansion (z axis), and AR cells/
PMCs are large, spheroid, and have thin walls.
We determined both cell counts and dimensions (in
order to calculate volumes) from at least five mock-infected
and five infected anthers matched by developmental stage.
At least 30 regions were quantified in each anther, includ-
ing the tapered basal and apical tips. Cell volumes were
calculated by multiplying the x, y and z lengths. We found
complex, stage-specific changes in growth parameters
during infection. For example, EPI cell volumes (Tables
S1A,B and S2A,B) were similar to control anthers from
400–1600 lm. Despite this, EPI cells were shorter in the y
dimension and hence more epidermal cells were present
along the length of the anther at specific anther lengths
(P ≤ 0.05, Tables S1A,B and S2A,B). Thus, although the
(a) (b) (c)
(d) (e) (f)
(g) (h) (i)
(j) (k) (l)
(m) (n) (o)
Figure 3. Effect at 3 and 6 dpi of U. maydis infection at several anther
developmental stages.
Hyphal walls are stained with WGA-AF488, and propidium iodide stains
anther cells.
(a–c) 3 dpi, 900 lm infected anther (inferred to be approximately 400 lm at
injection).
(d–f) 3 dpi, 1400 lm infected anther (inferred to be approximately 700 lm at
injection).
(g–i) EPI cells of a 6 dpi, 750 lm infected anther (inferred to be approxi-
mately 80 lm at injection).
(j–l) The same anther as shown in (g–i) was examined in deeper optical
sections; however, the sub-epidermal maize anther cell types cannot be dis-
tinguished from each other.
(m–o) The expected sub-epidermal cell types are distinguishable at 6 dpi in
an older anther (1850 lm, inferred to be approximately 200 lm at injection).
Scale bars = 50 lm.
© 2013 The AuthorsThe Plant Journal © 2013 John Wiley & Sons Ltd, The Plant Journal, (2013), 75, 903–914
906 Li Gao et al.
final cellular volume in the infected epidermis is equivalent
to that of mock-infected anthers, this is achieved by com-
pensatory growth (Figure 6a).
Endothecium (EN) cells normally exhibit cell division
and expansion patterns that are opposite to those of EPI
cells: elongation in the x axis accompanies rapid cell divi-
sion along the y axis. EN cell dimensions at anther lengths
of approximately 700 lm are illustrated in Figure 6(b).
Detailed characterization at multiple stages (Table S1) indi-
cated that every stage showed significant differences in
either one of the dimensions and/or cell count when com-
paring mock-infected and infected anthers. For example,
EN cells of infected anthers exhibit a smaller cell width and
larger cell length at anther lengths of 750 lm, greater cell
depths at 1100 and 1500 lm and larger cell volumes at 610
and 1100 lm than matched mock-infected anthers. The
data from the EN cells confirm that compensatory growth
reflecting altered patterns of cell division and expansion
occur in this cell type during infection.
As indicated earlier, persistent SPL cells are an abnormal
feature of infected anthers (Figure 4), and SPL cells contin-
ued length-adding cell division as in L-anticlinal (L) and
girth-adding cell division as in G-anticlinal (G), contributing
to anther elongation and girth. SPL cells from mock-
infected anthers at approximately 600 lm are shown in
Figure 6(c) and more details are provided in Tables S1A,B
and S2A,B.
Because the SPL periclinal division is delayed, ML cells
are born later (in longer anthers) than in controls. Shortly
after birth, the depth of ML cells was approximately half
that observed in a normal anther (P ≤ 0.001, Table S1).
This parameter remained relatively constant in infected
anthers of lengths 810–1600 lm, while ML cell depth stea-
dily declines in control anthers of length 710–1520 lm. The
ML cells were twice as long in infected anthers of
1400–1600 lm compared to mock-infected anthers
(P ≤ 0.05, Table S1A,B). The shapes of the ML cells at
anther lengths of approximately 800 lm are compared in
Figure 6(d). Interestingly, despite the changes in cell
dimensions, ML cell volumes were not significantly differ-
ent in infected compared to mock-infected anthers at any
developmental stage. In terms of cell counts, which
increase as a result of both L and G anticlinal divisions, the
infected anthers had a higher circumferential cell count
than normal at anther lengths of approximately 800 and
(a) (b) (c) (d)
Figure 4. Delayed periclinal cell division of SPL cells in anther lobes at 3 dpi.
(a) Comparison of two lobes of one anther at 1000 lm: two lobes had completed SPL division, but two lobes had not finished dividing into ML and TA cells.
Note that the delayed lobe visible in this view is considerably smaller than the more advanced lobe of the same anther.
(b) Mock-infected anthers of 1000 lm length: SPL cells in all four lobes (two of which are visible in the image) have finished dividing into ML and TA cells.
(c) Delay of SPL division in a 780 lm infected anther at 3 dpi. Arrowheads indicate periclinal divisions of SPL cells, a process that has just started.
(d) Mock-infected 700 lm anther illustrating completion of the SPL periclinal division.
SPL, secondary parietal layer cell; ML, middle layer cell; TA, tapetal cell. Scale bars = 50 lm.
Table 2 Disruption of cell division patterns in infected anthers ofvarious developmental stages at 3 dpi
Anthersize (lm)
Inferred anther sizeat injection (lm)
Affectedanthers (%)
Location ofextra periclinaldivisions
780 ~200 50 EPI750, 950, 1500 ~200–700 80 EN800, 950, 1400 ~200–700 70 ML1400 ~700 60 EPI, EN,
ML and TA
© 2013 The AuthorsThe Plant Journal © 2013 John Wiley & Sons Ltd, The Plant Journal, (2013), 75, 903–914
Ustilago maydis alters maize anther development 907
1100 lm (Table S2A,B); this probably reflects the delay in
periclinal division of SPL cells as these cells continue to
divide anticlinally. By 1500 lm, the ML cell numbers
matched the control. On the other hand, in the y axis, ML
cell numbers were more similar to controls initially; how-
ever, there were significantly fewer ML cells along the
length dimension in infected anthers of 1500 lm length
(Table S2A,B, P ≤ 0.001).
Tapetum (TA) cells are essential to support completion
of meiosis by PMCs; one specific role is secretion of b–1,3-glucanases to remodel callose before meiosis and later lib-
erate microspores from the tetrad (Wang et al., 2011). Typi-
cally, TA cells proliferate more rapidly than ML cells
(Kelliher and Walbot, 2011). U. maydis infection greatly
reduced this rapid rate, and the TA cells had a 2.5-fold
greater cell volume than those in mock-infected anthers at
approximately 800 lm (Figure 6e and Table S2A,B). Inter-
estingly, at the next stage (1000–1200 lm), the TA cells
were narrower and had a smaller volume than those of
mock-infected anthers, indicating that they had undergone
multiple cell divisions and then failed to expand properly;
compensatory cell division increased the number of TA
cells in the x axis to occupy the volume of the tissue. At
1500 lm, the TA cells were once again wider than control
cells (Table S2A,B). We interpret these results as reflecting
a decreased rate of L anticlinal division at approximately
800 lm, and an increased rate of G anticlinal division at
approximately 1100 lm. Collectively, the measurements of
the somatic anther lobe cells illustrate complex alterations
of cell expansion and division patterns, and hence demon-
strate the effect of U. maydis on anther cell growth.
The AR cells committed to meiosis proliferate mitotically
from anther lengths of 300–1000 lm to achieve a final
population of approximately 160 cells per lobe (Kelliher
(a) (b) (c) (d) (e) (f)
(g) (h) (i) (j) (k) (l)
Figure 5. Extra periclinal cell divisions in infected anthers at 3 dpi.
(a,c,e,g,h,j,k) Infected anthers with excess periclinal divisions.
(b,d,f,i,l) Mock-infected anthers at similar stages for comparison.
(a) 780 lm infected anther. The arrowhead indicates a new periclinal cell wall in EPI cells viewed in both the x and z reconstructions.
(b) Mock-infected anther of 800 lm in the x and z reconstructions for comparison.
(c,g,j) 750, 950 and 1500 lm infected anthers. The arrowheads indicate new cell walls from extra periclinal divisions of EN cells.
(d,i,l) Mock-infected anthers at similar stages to those in (c), (g) and (i) (800, 950 and 1500 lm).
(e,h) Infected anthers of 800 and 950 lm in length, The arrowheads indicate extra periclinal cell divisions within ML cells.
(f,i) Mock-infected anthers at similar stages to those in (e) and (g) (800 and 950 lm).
(k) 1400 lm infected anther. The arrowheads indicate extra divisions of ML and TA cells.
(l) Mock-infected anthers of 1500 lm length.
Scale bars = 50 lm (a–i) and 30 lm (j–l).
© 2013 The AuthorsThe Plant Journal © 2013 John Wiley & Sons Ltd, The Plant Journal, (2013), 75, 903–914
908 Li Gao et al.

and Walbot, 2011). Early in the development of infected
anthers, the AR cell sizes are consistent with those of con-
trols. However, starting at approximately 800 lm, the AR
cells fail to enlarge sufficiently in the x dimension, and, by
the start of meiosis, the PMCs are smaller in all dimensions
(Table S1A,B). AR cells in anthers of length approximately
1500 lm are illustrated in Figure 6(f). The AR cells continue
their steady proliferation to fill the internal lobe space: as a
result, The mean final count in mock-infected anthers was
165 AR cells/PMCs per lobe, while that in infected anthers
was 196 (Table S2A). These results suggest that U. maydis
disrupts development of AR cells, either by increasing their
rate of division or preventing them from enlarging, which
indirectly permits continued cell division.
Later in infection, when tumorigenesis is evident,
anthers are grossly distorted (Figure S1). In addition,
U. maydis also reduces the growth of maize plants (plant
height, tassel length and internode elongation) (Figures S2
and S3).
Microarray analysis of infected and mock-infected anthers
at 3 dpi
To obtain a comprehensive view of the effect of U. maydis
on gene expression patterns, RNA was extracted from 300–
600 lm infected and mock-infected anther pools at 3 dpi,
and hybridized to an Agilent 44K microarray. Correlation
plots of the comparisons of infected and mock samples
showed the expected significant difference in hybridization
to U. maydis probes for three of the four arrays. The fourth
array showed evidence of only slight infection and was
therefore excluded from further analysis.
Maize anthers express approximately 25 000 genes at all
stages surveyed with the microarray. As shown in Fig-
ure 7(a), mock-infected anthers expressed 25 179 transcript
types (24 736 + 443). U. maydis infection caused expres-
sion of 4147 additional maize anther transcripts (17%),
accompanied by loss of expression of only 443 anther-
expressed genes (2%) (Figure 7a and Tables S3 and S4).
Therefore, activation is almost ten times more prevalent
than suppression of the anther gene expression program.
Among the 24 736 maize genes common to both control
and infected anthers, 2% (534/24 736) were up-regulated
during infection (Table S5), 1% (188/24 736) were down-
regulated (Table S6), and 97% (24 014/24 736) showed
statistically similar expression levels. Therefore, de novo
activation of maize gene expression is much more exten-
sive than differential expression of genes with persistent
expression (Table S7).
A previous study (Skibbe et al., 2010) documented fewer
changes in gene expression by U. maydis infection
(Figure 7b) when whole tassels were analyzed: only 0.85%
[299/(35 215 + 394)] of maize genes were de novo
expressed and 1.1% [394/(35 215 + 394)] were no longer
expressed in 3 dpi tassels. Among 35 215 maize genes
scored as expressed in both infected and mock-infected
tassel samples (Figure 7b), 2% (825/35 215) were up-regu-
lated, 3% (1052/35 215) were down-regulated, and 95%
(33 338/35 215) showed statistically similar expression lev-
els in these two samples.
(a) (b)
(c) (d)
(e) (f)
Figure 6. Comparison of cell dimensions in infected (green) and mock-
infected (yellow) anther lobe cell types with similar anther sizes.
The diagram at the top shows how the x, y and z axes correspond to the
dimensions of the anther lobe. Dimensions that are significantly different in
infected cells are indicated by a solid red line.
(a) EPI cells: infected (810–870 lm), mock-infected (810–850 lm).
(b) EN cells: infected (720–780 lm), mock-infected (710–750 lm).
(c) SPL cells: infected (610–670 lm), mock-infected (600–620 lm).
(d) ML cells: infected (810–870 lm), mock-infected (810–850 lm).
(e) TA cells: infected (810–870 lm), mock-infected (810–850 lm).
(f) AR cells/PMCs: infected (1400–1600 lm), mock-infected (1480–1520 lm).
© 2013 The AuthorsThe Plant Journal © 2013 John Wiley & Sons Ltd, The Plant Journal, (2013), 75, 903–914
Ustilago maydis alters maize anther development 909
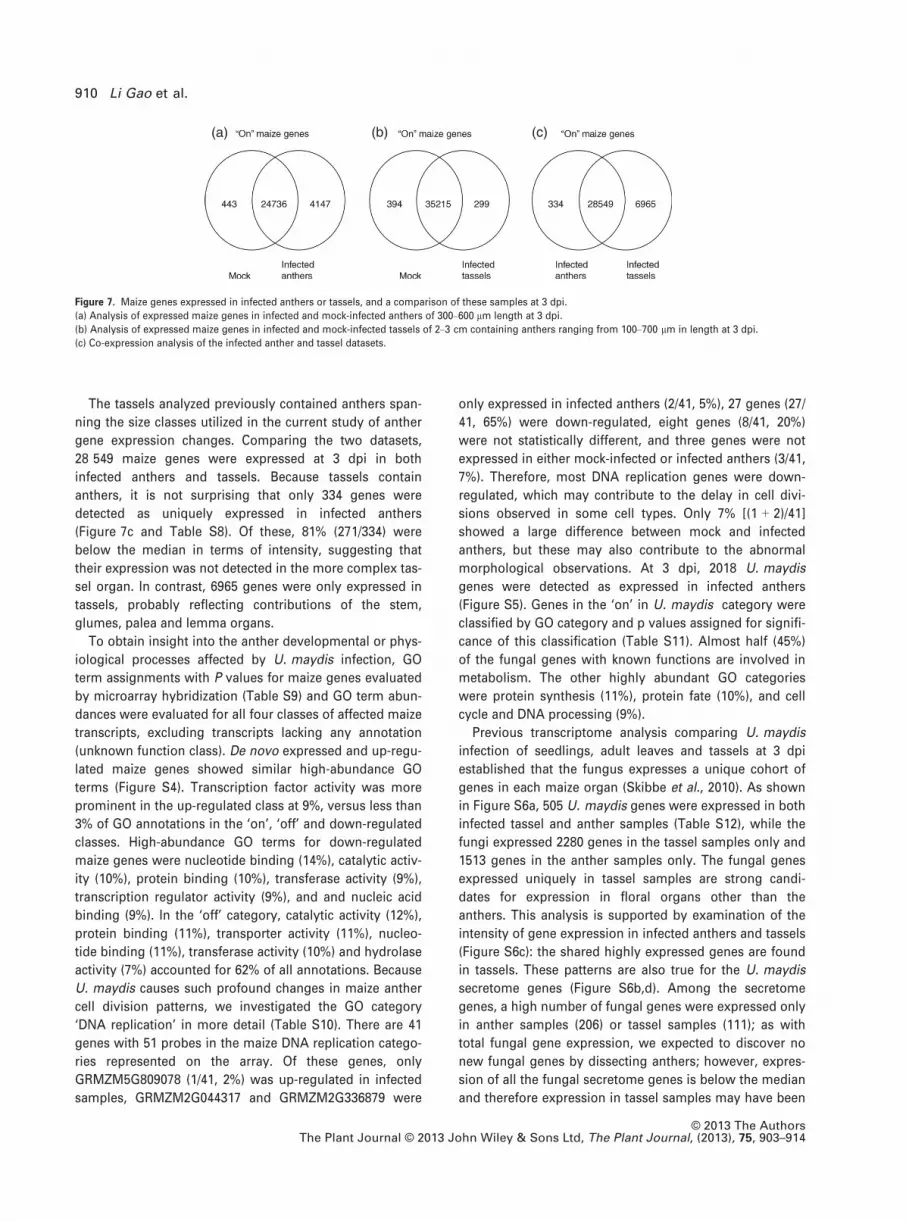
The tassels analyzed previously contained anthers span-
ning the size classes utilized in the current study of anther
gene expression changes. Comparing the two datasets,
28 549 maize genes were expressed at 3 dpi in both
infected anthers and tassels. Because tassels contain
anthers, it is not surprising that only 334 genes were
detected as uniquely expressed in infected anthers
(Figure 7c and Table S8). Of these, 81% (271/334) were
below the median in terms of intensity, suggesting that
their expression was not detected in the more complex tas-
sel organ. In contrast, 6965 genes were only expressed in
tassels, probably reflecting contributions of the stem,
glumes, palea and lemma organs.
To obtain insight into the anther developmental or phys-
iological processes affected by U. maydis infection, GO
term assignments with P values for maize genes evaluated
by microarray hybridization (Table S9) and GO term abun-
dances were evaluated for all four classes of affected maize
transcripts, excluding transcripts lacking any annotation
(unknown function class). De novo expressed and up-regu-
lated maize genes showed similar high-abundance GO
terms (Figure S4). Transcription factor activity was more
prominent in the up-regulated class at 9%, versus less than
3% of GO annotations in the ‘on’, ‘off’ and down-regulated
classes. High-abundance GO terms for down-regulated
maize genes were nucleotide binding (14%), catalytic activ-
ity (10%), protein binding (10%), transferase activity (9%),
transcription regulator activity (9%), and and nucleic acid
binding (9%). In the ‘off’ category, catalytic activity (12%),
protein binding (11%), transporter activity (11%), nucleo-
tide binding (11%), transferase activity (10%) and hydrolase
activity (7%) accounted for 62% of all annotations. Because
U. maydis causes such profound changes in maize anther
cell division patterns, we investigated the GO category
‘DNA replication’ in more detail (Table S10). There are 41
genes with 51 probes in the maize DNA replication catego-
ries represented on the array. Of these genes, only
GRMZM5G809078 (1/41, 2%) was up-regulated in infected
samples, GRMZM2G044317 and GRMZM2G336879 were
only expressed in infected anthers (2/41, 5%), 27 genes (27/
41, 65%) were down-regulated, eight genes (8/41, 20%)
were not statistically different, and three genes were not
expressed in either mock-infected or infected anthers (3/41,
7%). Therefore, most DNA replication genes were down-
regulated, which may contribute to the delay in cell divi-
sions observed in some cell types. Only 7% [(1 + 2)/41]
showed a large difference between mock and infected
anthers, but these may also contribute to the abnormal
morphological observations. At 3 dpi, 2018 U. maydis
genes were detected as expressed in infected anthers
(Figure S5). Genes in the ‘on’ in U. maydis category were
classified by GO category and p values assigned for signifi-
cance of this classification (Table S11). Almost half (45%)
of the fungal genes with known functions are involved in
metabolism. The other highly abundant GO categories
were protein synthesis (11%), protein fate (10%), and cell
cycle and DNA processing (9%).
Previous transcriptome analysis comparing U. maydis
infection of seedlings, adult leaves and tassels at 3 dpi
established that the fungus expresses a unique cohort of
genes in each maize organ (Skibbe et al., 2010). As shown
in Figure S6a, 505 U. maydis genes were expressed in both
infected tassel and anther samples (Table S12), while the
fungi expressed 2280 genes in the tassel samples only and
1513 genes in the anther samples only. The fungal genes
expressed uniquely in tassel samples are strong candi-
dates for expression in floral organs other than the
anthers. This analysis is supported by examination of the
intensity of gene expression in infected anthers and tassels
(Figure S6c): the shared highly expressed genes are found
in tassels. These patterns are also true for the U. maydis
secretome genes (Figure S6b,d). Among the secretome
genes, a high number of fungal genes were expressed only
in anther samples (206) or tassel samples (111); as with
total fungal gene expression, we expected to discover no
new fungal genes by dissecting anthers; however, expres-
sion of all the fungal secretome genes is below the median
and therefore expression in tassel samples may have been
(a) (b) (c)
Figure 7. Maize genes expressed in infected anthers or tassels, and a comparison of these samples at 3 dpi.
(a) Analysis of expressed maize genes in infected and mock-infected anthers of 300–600 lm length at 3 dpi.
(b) Analysis of expressed maize genes in infected and mock-infected tassels of 2–3 cm containing anthers ranging from 100–700 lm in length at 3 dpi.
(c) Co-expression analysis of the infected anther and tassel datasets.
© 2013 The AuthorsThe Plant Journal © 2013 John Wiley & Sons Ltd, The Plant Journal, (2013), 75, 903–914
910 Li Gao et al.

below the detection limit. The U. maydis secretome genes
that are expressed only in the tassels are candidates for
fungal manipulation of vegetative floral tissues such as
stem, glumes, lemma and palea.
To determine whether the needle injection required to
perform a mock infection altered the maize anther tran-
scriptome, we compared the results for mock-infected
whole anthers of 300–600 lm at 3 dpi with untreated 400
or 700 lm W23 inbred whole-anther datasets (GSE43982;
Figure S7), and found that 0.5% of genes (118/21 692)
were specifically expressed in mock-injected anthers. We
consider this figure insignificant. Compared to whole-
anther data for 400 lm anthers, mock-injected anthers
expressed 4% [(118 + 777)/24 199] unique genes, while
compared to whole-anther data for 700 lm anthers, they
expressed 0.5% [(118 + 39)/29 786]. As anthers exhibit
many stage-specific transcripts, Venn analysis uncovered
instances of unique expression in the pooled 300–600 lmmock-infected cohort compared to either 400 or 700 lmnormal anthers. The difference between the stages
exceeded the differences with the pooled mock-infected
samples; therefore, we conclude that introducing water
around the developing tassel does not greatly alter
anther gene expression monitored at 3 dpi. By quantita-
tive RT–PCR, we validated eight expression results in
terms of ‘on’/’off’ or up-/down-regulation; several genes
were selected that were not detectably expressed by
microarray analysis, and these exhibit extremely low
values in the quantitative RT–PCR analysis (Tables S13
and S14).
DISCUSSION
Ustilago maydis effects on maize anther cells
The primary goals of studies on host–pathogen interac-
tions have been to elucidate the sequential deployment of
pathogen effectors, to analyze effector targets in the host,
and to define the scope of host defense. In the case of the
U. maydis–maize interaction, the outcome of successful
infection is re-direction of maize development to form
tumors within which the fungal pathogen produces diploid
teliospores for dispersal (Banuett and Herskowitz, 1996).
Through a combination of genetics and biochemistry, the
necessity and roles of a number of fungal effectors that act
early in infection have been established, such as Pep1
(Doehlemann et al., 2009). Tumor formation requires dis-
tinct suites of fungal genes, depending on the host organ
infected, reflecting the discrete mechanisms governing
maize organogenesis that the pathogen must subvert or
co-opt to cause tumors (Skibbe et al., 2010). In the present
study, we analyzed the effect of U. maydis on anther devel-
opment to address the question of whether the pathogen
causes cell-type specific alterations in host cell division
and expansion. By monitoring host cell properties at
sequential stages of anther development, we also defined
the dependence of the host response on the temporal
program of anther differentiation.
Fungal penetration into maize leaves is a gradual pro-
cess; hyphal tips are just below the leaf surface at 2 dpi
(Schirawski et al., 2005). Similarly, we observed that invad-
ing U. maydis filaments occur primarily on the surface of
maize anthers at 1–2 dpi. Following penetration, the
hyphae spread rapidly throughout the anther: by 3 dpi, all
internal anther cell types may be in contact with the living
hyphae (Table 1).
Confocal imaging permitted measurement of host cell
volumes and counts of fungal infection (Tables S1A,B
and S2A,B) during the developmental period spanning
anther cell-fate specification (400–700 lm) and cell prolif-
eration and expansion prior to meiosis at 1500 lm. By
comparison with mock-infected anthers, we analyzed
development with reference to key landmarks of cell-fate
specification, including addition of new cell layers by
periclinal cell division, periods of rapid cell division, and
cell-type specific patterns of cell expansion. U. maydis
infection triggered complete disruption of sub-epidermal
cell development in anthers that were < 100 lm at the
time of infection, such that no recognizable cell types dif-
ferentiated; we conclude that the pathogen prevents nor-
mal specification of AR cells, which in turn interrupts the
production of signals that result in periclinal division of
the sub-epidermal layer to produce the EN and SPL cell
types (Kelliher and Walbot, 2012).
In subsequent stages, anthers consist of epidermis and
three sub-epidermal cell types, and each cell type showed
significant differences in length, width, depth and/or
volume at some stages when monitored at 3 dpi (Tables
S1A,B and S2A,B). Because anthers continue to elongate
and increase in girth during infection, changes in cell vol-
ume are necessarily accompanied by alterations in cell
numbers for specific cell types as a means of compensa-
tion (Tables S1A,B and S2A,B). It is particularly striking that
mitosis continues in the pre-meiotic cell population to pro-
duce almost 200 AR cells per lobe rather than the usual
160 cells; the smaller AR cells proliferate to fill the central
space, reinforcing the previous suggestion that spatial con-
straints normally limit AR cell numbers (Wang et al., 2012).
Therefore, we conclude that, while overall anther growth is
initially little perturbed by U. maydis infection, the cellular
composition and cell type-specific volumes are substan-
tially altered, i.e. the balance of anticlinal cell division
versus expansion, which sets cell volumes, is altered by
U. maydis without much effect on overall anther size over
the period of 3 days after infection. Despite this observa-
tion, mature tumors at 10–14 dpi are the result of very
extensive cell division and expansion in infected anthers
compared to normal floral organs (Walbot and Skibbe,
2010). In leaf tumors, greatly enlarged cells containing
© 2013 The AuthorsThe Plant Journal © 2013 John Wiley & Sons Ltd, The Plant Journal, (2013), 75, 903–914
Ustilago maydis alters maize anther development 911

endo-reduplicated chromosomes are observed (Callow,
1975).
A striking observation during U. maydis infection is that
SPL cell division is delayed, and this cell type may still be
present at 1000 lm (Figure 4). Moreover, within a single
anther, some lobes had undergone the SPL periclinal divi-
sion while other lobes were arrested. Altogether, these
results indicate that there is considerable variation in the
anther cell response to U. maydis. We consider it likely
that the timing and extent of formation of the biotrophic
interface, a narrow gap between host and fungal cells,
may determine host responses. For example, the propor-
tion of SPL cells involved in a biotrophic interaction may
affect completion of the periclinal division. Periclinal divi-
sions are precisely controlled in plant development
because they generate additional layers in organs and are
frequently required for differentiation of new cell types.
The somatic cell layers surrounding the germinal cells are
derived by two rounds of periclinal division: the first
yields EN and SPL cells, and in the second round, the SPL
cells generate ML and TA cells (Figure 1). Depending on
when infection starts, U. maydis disrupts both of these
landmark events.
Wenzler and Meins (1987) demonstrated that U. maydis
infection is confined to young aerial tissues of maize.
Within the tassels, Walbot and Skibbe (2010) observed that
all organs may form tumors, but there is a progression
regarding which floral parts are most prominently involved
that follows the chronological pattern of spikelet organ
maturation (cessation of mitosis). These observations dem-
onstrate that U. maydis is only able to redirect maize to
tumor development in zones with actively dividing cells;
thus, unlike other oncogenic agents that reactivate cell
division, U. maydis only directs the developmental out-
come in proliferating floral tissues. In developing anthers,
there is rapid cell proliferation from approximately
200–800 lm, with cessation of cell division of AR, TA and
ML cells by approximately 1000 lm (Kelliher and Walbot,
2011). This period of rapid cell division corresponds to the
period when most anther tumors are generated (Skibbe
et al., 2010; Walbot and Skibbe, 2010). In the present study,
we further demonstrate that there is cell type specificity in
response to fungal infection, evidenced by the alterations
in division and expansion in specific cell types at various
developmental stages.
Microarray analysis
In the comparison of infected and mock-infected anthers,
a greater number of maize genes were turned ‘on’ or
up-regulated than were turned ‘off’ or down-regulated;
therefore, the overall response in infected anthers is acti-
vation rather than repression of gene expression. By 3
dpi, when U. maydis is subverting normal development,
the anther appears to respond to fungal invasion by acti-
vating and altering the expression of developmental
genes, rather than switching on host defenses to combat
infection.
Comparing anther and whole tassel microarray data, we
find support for the hypothesis that U. maydis tailors its
gene expression to specific maize organs. Only 505 fungal
genes were expressed in both tassels and anthers, and 3793
genes were found in just one of these infected samples
(2280 in tassels and 1513 in anthers) (Figure S6a). As the
tassels contain anthers, we interpret this result as indicating
that anther infection requires a discrete program of fungal
gene expression, and that many of these genes are
expressed at low levels that were undetectable in the much
more complex tassel organ sample. Unlike leaf develop-
ment, in which there are zones of cell specification, cell pro-
liferation, cell differentiation and expansion in an acropetal
gradient from the base of the blade, the entire anther under-
goes developmental events in a chronological series. We
therefore speculate that U. maydis may deploy distinct
gene expression programs reflecting the temporal series of
developmental stages. This facet of host–pathogen interac-
tion may be explored in future microarray analysis of the
many developmental stages of anther development. Our
analysis also found that 2280 fungal genes were expressed
in infected anthers that were absent (or below the detection
limit) in uninfected anthers. Although U. maydis has pro-
found effects on the rate and pattern of host cell prolifera-
tion, only 7% of genes (3/41) in the GO category ‘DNA
replication’ were activated or showed up-regulated expres-
sion during infection, while a large proportion of genes in
this category (27/41) were down-regulated. Therefore, it
appears likely that U. maydis modulates cell division by
inducing modest changes in existing gene expression
programs.
Fungal infection, growth and spore differentiation
require approximately 2 weeks, and culminate in release of
billions of diploid teliospores (Banuett and Herskowitz,
1996). Based on the phenotype of fewer or smaller tumors
after fungal gene deletion and computational analysis of
the U. maydis genome, the current hypothesis to explain
tumor induction is that this pathogen secretes effector pro-
teins that cause abnormal host cell differentiation. Analysis
of the U. maydis genome yielded 554 predicted secreted
proteins (M€ueller et al., 2008); some clusters of predicted
secretome genes have been shown to be required for
tumor formation in seedlings (K€amper et al., 2006) and to
have differential effects on seedlings, adult leaves and
tassels (Skibbe et al., 2010). Only 25 secretome genes were
detectably expressed at 3 dpi in both anthers and tassels,
while 206 were specifically detected in anthers and 111
were specifically expressed in tassels. These results indi-
cate the importance of anther dissection, as the tassels
contained anthers spanning the size range of the anther
samples; it is likely that the ‘anther-specific’ secretome
© 2013 The AuthorsThe Plant Journal © 2013 John Wiley & Sons Ltd, The Plant Journal, (2013), 75, 903–914
912 Li Gao et al.

genes were below the limit of detection in the more com-
plex tassel sample and the tassel-specific secretome genes
are involved in fungal interaction with non-anther tissues.
EXPERIMENTAL PROCEDURES
Plant growth
Plants of the W23 bz2 inbred line of Z. mays (deficient in vacuolaranthocyanin accumulation) were greenhouse-grown with supple-mental lighting equivalent to 40% summer photon fluence (no UVradiation) for a 14 h day/10 h night period (Casati and Walbot,2004). The light period temperature was 32°C and the dark periodtemperature was 21°C.
Fungal growth and injections
SG200-YFP (supplied by Regine Kahmann, Max Planck Institute,Marburg, Germany) is a solopathogenic strain that is able to infectplants without a mating partner (K€amper et al., 2006). The strainwas grown and injected as described previously (Kr€uger et al.,2000; Walbot and Skibbe, 2010). Typically, six replicates wereperformed for each injection treatment (U. maydis- and mock-infected) for each dpi period. Three replicates of field-grown plantsduring summer 2012 at tassel lengths of approximately 1, 5 and8 cm were used for evaluation of growth parameters at 8–14 dpi.
Anther staining and microscopy
Spikelets were dissected to recover the anthers; one anther fromeach dissected floret was incubated in fixative (100% ethanol) toscore infection using light or confocal microscopy; the other twoanthers of the same floret were snap frozen in liquid nitrogen forRNA extraction.
Ustilago maydis was visualized using the YFP signal and/or bystaining with 10 lg/ml WGA-AF488 (Molecular Probes/Invitrogen,http://www.invitrogen.com) as described previously (Doehlemannet al., 2009). Confocal images were taken with a Leica TCS SP5 con-focal microscope (Leica, http://www.leica-microsystems.com) withexcitation/emission spectra of 561/590-640 nm for propidiumiodide, 514/520-550 nm for YFP, and 488/500-520 nm for WGA-AF488. Five or more replicates were evaluated for each reportedsize class and treatment. Evaluation of cellular parameters anddevelopmental landmarks was performed as described previously(Kelliher and Walbot, 2011), and cell images were processed usingVolocity 6.0. (www.perkinelmer.com.cn) Mathematica 7.0 (www.wolfram.com) was used for visualization of cell volume.
Microarray hybridization
For both the 3 dpi mock-infected and infected samples, we usedthree biological replicates and a technical replicate of one of thebiological samples for each sample type. All eight hybridizationswere performed on a single Agilent 4 9 44K (www.empiregenomics.com) dual organism array (Skibbe et al., 2010). RNAwas extracted using TRIzol� (Invitrogen) for pools of anthersamples. Labeled cRNA was prepared as described previously(Ma et al., 2006). A balanced dye-swap protocol was used tominimize systematic variances (Kerr and Churchill, 2001; Ma et al.,2006). After hybridization on a dual organism according tothe manufacturer’s instructions, feature extraction, statisticaland graphical criteria, and GO annotation were performed asdescribed previously (Skibbe et al., 2010). All microarray dataassociated with these experiments are available at GEO (http://www.ncbi.nlm.nih.gov/geo/) under accession numbers GSE43544
(anther/U. maydis experiment) and GSE43982 (400 and 700 lmW23 anthers).
Quantitative RT–PCR analysis
Quantitative RT–PCR analysis was used to validate the micro-array results for a handful of genes Tables S13 and S14). Frozenanthers were pooled by size into samples of 400, 700, 1000, 1500and 2000 lm for both infected and mock-infected anthers. RNAwas extracted from two pools of staged infected anthers as bio-logical replicates. Primer pairs (Table S15) designed for selectedgenes were purchased from Invitrogen. The quantitative RT–PCRreactions and amplification conditions were as described previ-ously for maize (Ma et al., 2008) or U. maydis (Doehlemannet al., 2009; Wahl et al., 2010). The expression levels of maize cy-anase and fungal U. maydis peptidylprolyl isomerise were usedas internal controls for each species.
ACKNOWLEDGMENTS
We thank the Carnegie Institution, Department of Plant BiologyImaging Facility, for use of the confocal microscope. John Fernan-des (Stanford University, Department of Biology) wrote the pro-gram to visualize cell dimensions. L.G. was supported by theScholarship Program of the Chinese Scholarship Council(2010325033). T.K. was supported by a US National Institutes ofHealth Biotechnology Training Grant (5-T32-GM008412-17). L.N.received a Stanford Vice Provost for Undergraduate Educationaward to support summer undergraduate research. Manuscriptpreparation was supported in part by the Ministry of Science andTechnology, China (grant numbers 2011CB100403 and2013CB127701), Beijing NOVA Programme, China (grant numberXX2013057) and by the Ministry of Agriculture, China (grant num-ber 200903035).
SUPPORTING INFORMATION
Additional Supporting Information may be found in the online ver-sion of this article.Figure S1. Infected anthers viewed by light microscopy.
Figure S2. U. maydis delays plant height, tassel length and elon-gation of the internode below the tassels at 14 dpi.
Figure S3. U. maydis delays tassel length growth at 8, 10 and 12dpi.
Figure S4. GO term count for the four classifications of maize geneexpression changes in 3 dpi anthers.
Figure S5. Abundance of GO terms for expressed U. maydis genesin anthers at 3 dpi.
Figure S6. Comparison of fungal gene expression patterns ininfected tassels and anthers at 3 dpi.
Figure S7. Comparison of normal fertile W23 anthers with mock-injected anthers.
Table S1. Cell size at 3 dpi, and statistical analysis of cell size andcell volume for infected and mock-injected anthers.Table S2. Cell counts at 3 dpi, and statistical analysis of cell countsfor infected and mock-injected anthers.Table S3. Expression of 4147 genes scored as ‘on’ in infectedanthers and ‘off’ in mock-infected anthers.Table S4. List of 443 genes expressed in mock-infected anthersand scored as ‘off’ in infected anthers.Table S5. List of up-regulated maize genes (534) in both infectedand mock-infected anthers.Table S6. List of down-regulated genes (188) in both infected andmock-infected anthers.
© 2013 The AuthorsThe Plant Journal © 2013 John Wiley & Sons Ltd, The Plant Journal, (2013), 75, 903–914
Ustilago maydis alters maize anther development 913

Table S7. Categories of expressed genes in anthers and tassels at3 dpi.Table S8. List of genes (334) expressed in infected anthers butscored as ‘off’ in infected tassels at 3 dpi.Table S9. GO term assignments with P values for maize genesevaluated by microarray hybridization.Table S10. Gene expression comparison of transcripts classifiedby GO as involved in DNA replication in infected and mock-infected anthers at 3 dpi.Table S11. GO terms (with P values) of the ‘on’ in U. maydis cate-gory of genes.Table S12. U. maydis genes expressed in both infected anthersand tassels at 3 dpi.Table S13. Microarray information on maize candidate genes forcallose synthase and for SPL and/or TA-enriched genes.Table S14. U. maydis Pep1 and Srt1 gene expression informationin microarray and quantitative RT–PCR assays.Table S15. Primers used for quantitative RT–PCR assays.
REFERENCES
Banuett, F. (2002) Pathogenic development in Ustilago maydis. In Molecular
Biology of Fungal Development (Osiewacz, H.D., ed.). New York: Marcel
Dekker, pp. 349–398.Banuett, F. and Herskowitz, I. (1996) Discrete developmental stages during
teliospore formation in the corn smut fungus, Ustilago maydis. Develop-
ment, 122, 2965–2976.Callow, J.A. (1975) Endopolyploidy in maize smut neoplasms induced by
maize smut fungus, Ustilago maydis. New Phytol. 75, 253–257.Callow, J.A. and Ling, I.T. (1973) Histology of neoplasms and lesions in
maize seedlings following the infection of sporidia of Ustilago maydis
(DC) Corda. Physiol. Plant Pathol. 3, 489–494.Casati, P. and Walbot, V. (2004) Rapid transcriptome responses of maize (Zea
mays) to UV–B in irradiated and shielded tissues. Genome Biol. 5, R16.
Doehlemann, G., Wahl, R., Vranes, M., de Vries, R.P., K€amper, J. and
Kahmann, R. (2008) Establishment of compatibility in the Ustilago may-
dis/maize pathosystem. J. Plant Physiol. 165, 29–40.Doehlemann, G., van der Linde, K., Aßmann, D., Schwammbach, D., Hof,
A., Mohanty, A., Jackson, D. and Kahmann, R. (2009) Pep1, a secreted
effector protein of Ustilago maydis, is required for successful invasion of
plant cells. PLoS Pathog. 5, e1000290.
K€amper, J., Kahmann, R., B€olker, M. et al. (2006) Insights from the genome
of the biotrophic fungal plant pathogen Ustilago maydis. Nature, 444,
97–101.
Kelliher, T. and Walbot, V. (2011) Emergence and patterning of the five cell
types of the Zea mays anther locule. Dev. Biol. 350, 32–49.Kelliher, T. and Walbot, V. (2012) Hypoxia triggers meiotic fate acquisition
in maize. Science, 337, 345–348.Kerr, M.K. and Churchill, G.A. (2001) Statistical design and the analysis of
gene expression microarray data. Genet. Res. 77, 123–128.Kr€uger, J., Loubradou, G., Wanner, G., Regenfelder, E., Feldbr€ugge, M. and
Kahmann, R. (2000) Activation of the cAMP pathway in Ustilago maydis
reduces fungal proliferation and teliospore formation in plant tumors.
Mol. Plant Microbe Interact. 13, 1034–1040.Ma, J., Morrow, D.J., Fernandes, J. and Walbot, V. (2006) Comparative
profiling of the sense and antisense transcriptome of maize lines.
Genome Biol. 7, R22.
Ma, J., Skibbe, D.S., Fernandes, J. and Walbot, V. (2008) Male reproductive
development: gene expression profiling of maize anther and pollen
ontogeny. Genome Biol. 9, R181.
M€ueller, O., Kahmann, R., Aguilar, G., Trejo-Aguilar, B., Wu, A. and de Vries,
R.P. (2008) The secretome of the maize pathogen Ustilago maydis.
Fungal Genet. Biol. 45, S63–S70.Schirawski, J., B€ohnert, H.U., Steinberg, G., Snetselaar, K., Adamikowa, L.
and Kahmann, R. (2005) Endoplasmic reticulum glucosidase II is required
for pathogenicity of Ustilago maydis. Plant Cell 17, 3532–3543.Skibbe, D.S., Doehlemann, G., Fernandes, J. and Walbot, V. (2010) Maize
tumors caused by Ustilago maydis require organ-specific genes in host
and pathogen. Science, 328, 89–92.Snetselaar, K.M. andMims, C.W. (1992) Sporidial fusion and infection of maize
seedlings by the smut fungusUstilagomaydis.Mycologia, 84, 193–203.Steinberg, G., Schliwa, M., Lehmler, C., B€olker, M., Kahmann, R. and McIn-
tosh, J.R. (1998) Kinesin from the plant pathogenic fungus Ustilago may-
dis is involved in vacuole formation and cytoplasmic migration. J. Cell
Sci. 111, 2235–2246.Wahl, R., Wippel, K., Goos, S., K€amper, J. and Sauer, N. (2010) A novel
high-affinity sucrose transporter is required for virulence of the plant
pathogen Ustilago maydis. PLoS Biol. 8, e1000303.
Walbot, V. and Skibbe, D.S. (2010) Maize host requirements for Ustilago
maydis tumor induction. Sex. Plant Reprod. 23, 1–13.Wang, D., Skibbe, D.S. and Walbot, V. (2011) Maize csmd1 exhibits pre-mei-
otic somatic and post-meiotic microspore and somatic defects but
sustains anther growth. Sex. Plant Reprod. 24, 297–306.Wang, C.J.R., Nan, G.L., Kelliher, T., Timofejeva, L., Vernoud, V., Golubovs-
kaya, I.N., Harper, L., Egger, R., Walbot, V. and Cande, W.Z. (2012) Maize
multiple archesporial cells 1 (mac1), an ortholog of rice TDL1A,
modulates cell proliferation and identity in early anther development.
Development, 139, 2594–2603.Wenzler, H. and Meins, F. (1987) Persistent changes in the proliferative
capacity of maize leaf tissues induced by Ustilago infection. Physiol.
Mol. Plant Pathol. 30, 309–319.
© 2013 The AuthorsThe Plant Journal © 2013 John Wiley & Sons Ltd, The Plant Journal, (2013), 75, 903–914
914 Li Gao et al.
Related Documents