IJICIS, Vol.14, No 3 JULY 2014 51 International Journal of Intelligent Computing and Information Science USING WAVELET TRANSFORM FOR CARDIAC MAPPING DE-NOISING OF HEART ANTERIOR SURFACE ISCHEMIA M. Aouf Higher Technological Institute, Cairo - Egypt, [email protected] M. A.-M. Salem Faculty of Computer and Information Sciences, Aim Shams University, Egypt [email protected] A. Sharawy Faculty of Engineering, Cairo University, Egypt [email protected] Abstract: Anterior surface heart ischemia is one of the most prominent heart diseases. Chest cardiac mapping using multi-electrode systems for chest leads increases the diagnostic power over the traditional chest lead ECG. Noise is one of the most apparent problems in cardiac mapping which decreases the fidelity of the signals. In this paper we propose a new technique for signal de-noising and presentation of chest cardiac maps. Using the 3D wavelet transform, we apply sensitivity analysis to the wavelets of the Daubechies (dbs) family to find out the most suitable wavelet for each chest lead at each position. We have computed the performance measure of the signal to noise ratio (SNR) for each chest lead at each position to measure the quality of the de-noising techniques focusing at the most important chest lead. By applying db4, db8 and db11 at selected positions of chest leads we are able to get optimal de-noising. The resulting cardiac maps have proven to be of diagnostic value for the bio-potential state of the anterior surface ischemia of heart. Keywords: Signal Processing, De-noising, Electrocardiograph, Cardiac Mapping, 3D Wavelet Transform 1 Introduction 1.1 Multi-electrode system chest leads Electric Imaging is one of the most advanced methods to upgrade the diagnosis of the Electrocardiograph (ECG). Using multi-electrode system chest leads is a real step for cardiac mapping which provides us with real electric data. The effort for acquiring potential signals from cardiac mapping is focused on studying the current dipole distributed on chest [1, 2]. The diagnostic power of cardiac mapping shows a real success in the area of coronary artery disease (CAD) and ischemia [3,4,5]. Chest leads have a great power for the diagnosis and classification of anterior surface ischemia of the heart, especially V 1 . Figure 1 shows the overall processing performed in this paper. 1.2 QRS detection and filter bank theory The pre-processing stage for body surface potential mapping involves peak (QRS complex) detection of the ECG signal using a filter banks algorithm [6]. Figure 2 depicts the theory of filter banks.

Welcome message from author
This document is posted to help you gain knowledge. Please leave a comment to let me know what you think about it! Share it to your friends and learn new things together.
Transcript
IJICIS, Vol.14, No 3 JULY 2014
51
International Journal of Intelligent Computing and Information Science
USING WAVELET TRANSFORM FOR CARDIAC MAPPING DE-NOISING OF
HEART ANTERIOR SURFACE ISCHEMIA
M. Aouf
Higher Technological Institute,
Cairo - Egypt,
M. A.-M. Salem
Faculty of Computer and Information Sciences,
Aim Shams University, Egypt
A. Sharawy
Faculty of Engineering,
Cairo University, Egypt
Abstract: Anterior surface heart ischemia is one of the most prominent heart diseases. Chest cardiac
mapping using multi-electrode systems for chest leads increases the diagnostic power over the
traditional chest lead ECG. Noise is one of the most apparent problems in cardiac mapping which
decreases the fidelity of the signals. In this paper we propose a new technique for signal de-noising and
presentation of chest cardiac maps. Using the 3D wavelet transform, we apply sensitivity analysis to the
wavelets of the Daubechies (dbs) family to find out the most suitable wavelet for each chest lead at
each position. We have computed the performance measure of the signal to noise ratio (SNR) for
each chest lead at each position to measure the quality of the de-noising techniques focusing at the
most important chest lead. By applying db4, db8 and db11 at selected positions of chest leads we
are able to get optimal de-noising. The resulting cardiac maps have proven to be of diagnostic
value for the bio-potential state of the anterior surface ischemia of heart.
Keywords: Signal Processing, De-noising, Electrocardiograph, Cardiac Mapping, 3D Wavelet
Transform
1 Introduction
1.1 Multi-electrode system chest leads
Electric Imaging is one of the most advanced methods to upgrade the diagnosis of the
Electrocardiograph (ECG). Using multi-electrode system chest leads is a real step for cardiac mapping
which provides us with real electric data. The effort for acquiring potential signals from cardiac
mapping is focused on studying the current dipole distributed on chest [1, 2]. The diagnostic power of
cardiac mapping shows a real success in the area of coronary artery disease (CAD) and ischemia [3,4,5].
Chest leads have a great power for the diagnosis and classification of anterior surface ischemia of the
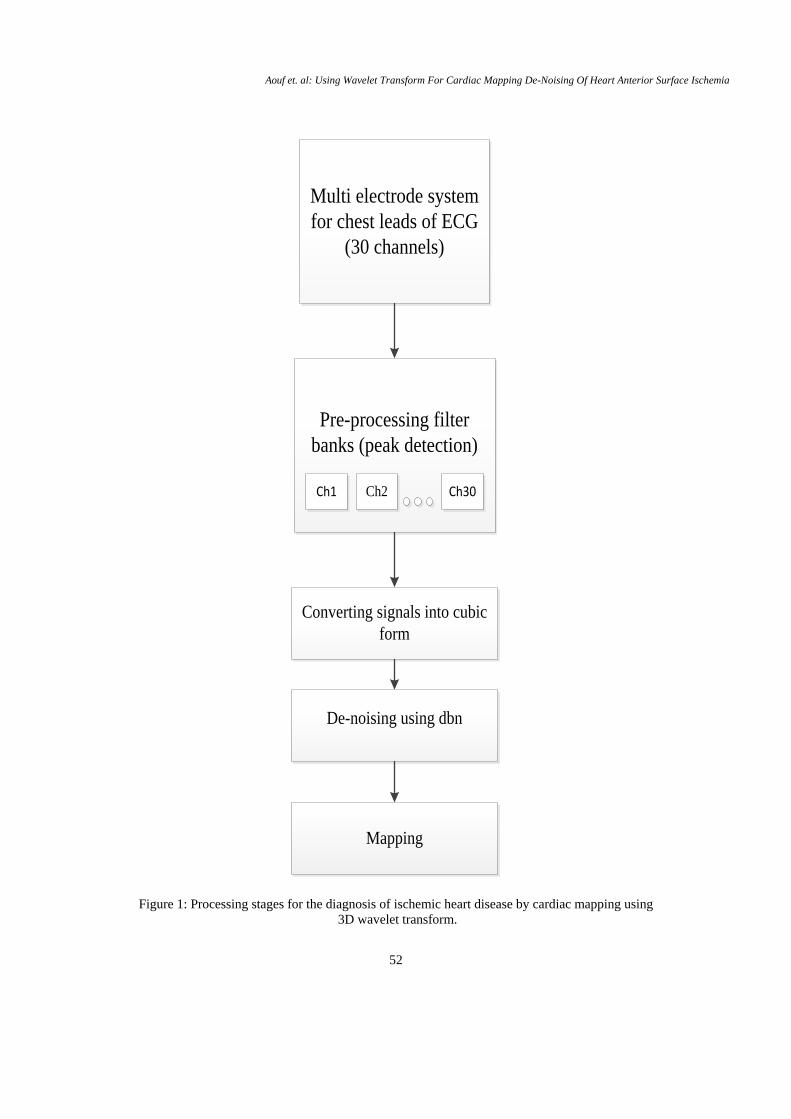
heart, especially V1. Figure 1 shows the overall processing performed in this paper.
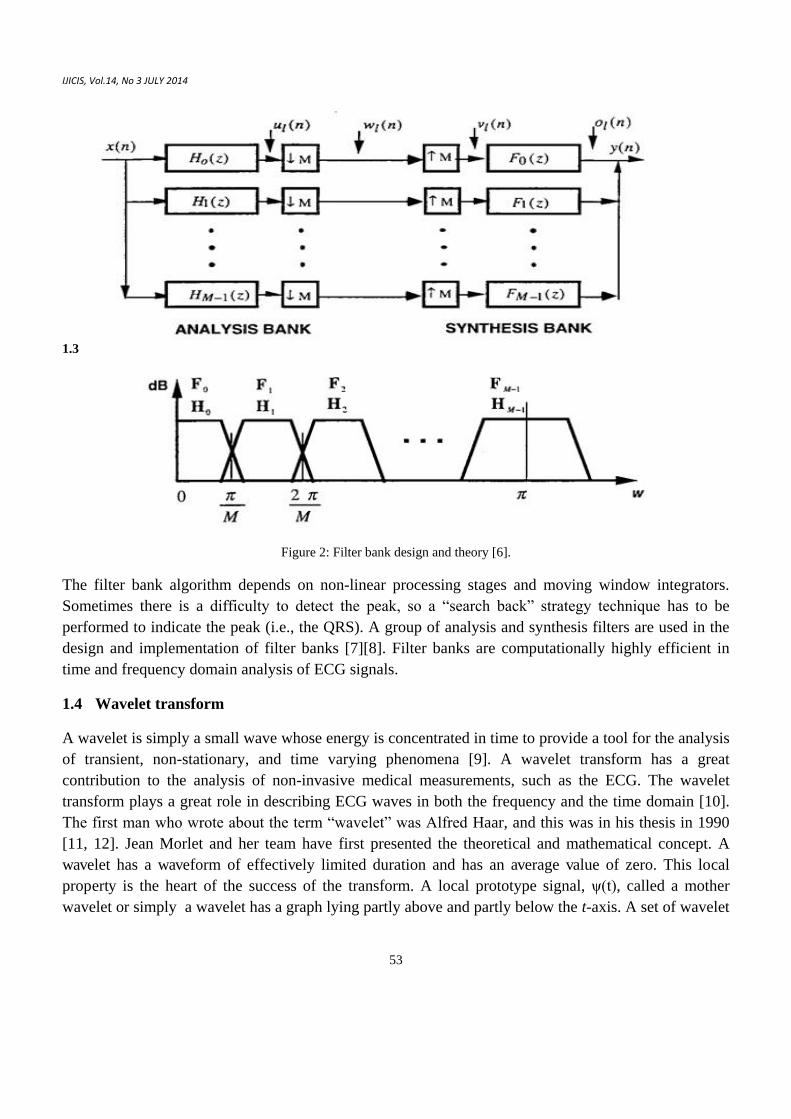
1.2 QRS detection and filter bank theory
The pre-processing stage for body surface potential mapping involves peak (QRS complex) detection of
the ECG signal using a filter banks algorithm [6]. Figure 2 depicts the theory of filter banks.
Aouf et. al: Using Wavelet Transform For Cardiac Mapping De-Noising Of Heart Anterior Surface Ischemia
52
Multi electrode system
for chest leads of ECG
(30 channels)
Pre-processing filter
banks (peak detection)
Ch1 Ch2 Ch30
Converting signals into cubic
form
De-noising using dbn
Mapping
Figure 1: Processing stages for the diagnosis of ischemic heart disease by cardiac mapping using
3D wavelet transform.
IJICIS, Vol.14, No 3 JULY 2014
53
1.3
Figure 2: Filter bank design and theory [6].
The filter bank algorithm depends on non-linear processing stages and moving window integrators.
Sometimes there is a difficulty to detect the peak, so a “search back” strategy technique has to be
performed to indicate the peak (i.e., the QRS). A group of analysis and synthesis filters are used in the
design and implementation of filter banks [7][8]. Filter banks are computationally highly efficient in
time and frequency domain analysis of ECG signals.
1.4 Wavelet transform
A wavelet is simply a small wave whose energy is concentrated in time to provide a tool for the analysis
of transient, non-stationary, and time varying phenomena [9]. A wavelet transform has a great
contribution to the analysis of non-invasive medical measurements, such as the ECG. The wavelet
transform plays a great role in describing ECG waves in both the frequency and the time domain [10].
The first man who wrote about the term “wavelet” was Alfred Haar, and this was in his thesis in 1990
[11, 12]. Jean Morlet and her team have first presented the theoretical and mathematical concept. A
wavelet has a waveform of effectively limited duration and has an average value of zero. This local
property is the heart of the success of the transform. A local prototype signal, ψ(t), called a mother
wavelet or simply a wavelet has a graph lying partly above and partly below the t-axis. A set of wavelet
Aouf et. al: Using Wavelet Transform For Cardiac Mapping De-Noising Of Heart Anterior Surface Ischemia
54
functions {ψa,b(t)} can be generated by scaling and translating the mother wavelet ψ(t) by quantities a,
b, respectively as:
ψ ( )
√ ψ (
) ( )
where a>0 and b are real numbers. The wavelet transform of f(t) using the wavelets {ψa,b(t)} can be
written as follows:
∫ ( )ψ ( )
(2)
The parameters a and b are called the scale or dilation parameter and the translation or shifting
parameter, respectively. Restricting the values of a and b by integers rather than real numbers gives the
Discrete Wavelet Transform (DWT). However, an interesting type of wavelet transform is to restrict
the scaling by factors of two (binary scaling), and the translation by an integer multiple of the binary
scale factor (dyadic translation). Thus, it relates at any scale to the width of the wavelets at that scale,
i.e., a = 2j, b=k2j
, j∈Z, k∈Z, where Z & Z* represent the set of integers and positive integers,
respectively.
ψj, k
(t)=2−j/2ψ(2
−j∙t − k) (3)
Mallat[14] proposed a mathematical operator which transforms a signal into an approximation at lower
resolution, say 2j . Then he showed that the difference in information between two approximations at
resolutions 2j and 2
j+1 is extracted by the wavelet function. A scaling function φ(t) is defined such that:
Φj,k(t)=2−j/2φ(2−j∙t − k), j, k ∈ Z (4)
The signal f(t) is decomposed into two new sub-band signals using the scaling and the wavelet
functions yielding the approximation coefficient A1 and detail coefficient D1 with a lower resolution at
level j = 1, each of which has as many sample points as half of the sample points of f(t). The process is
repeated for the new approximation coefficients at level j giving the approximation and detail at level
j+1 until a level j is reached. At that level both sub-bands have only one sample point and the analysis
must stop. In fact Aj represents the global approximation of the original signal f(t)=A.
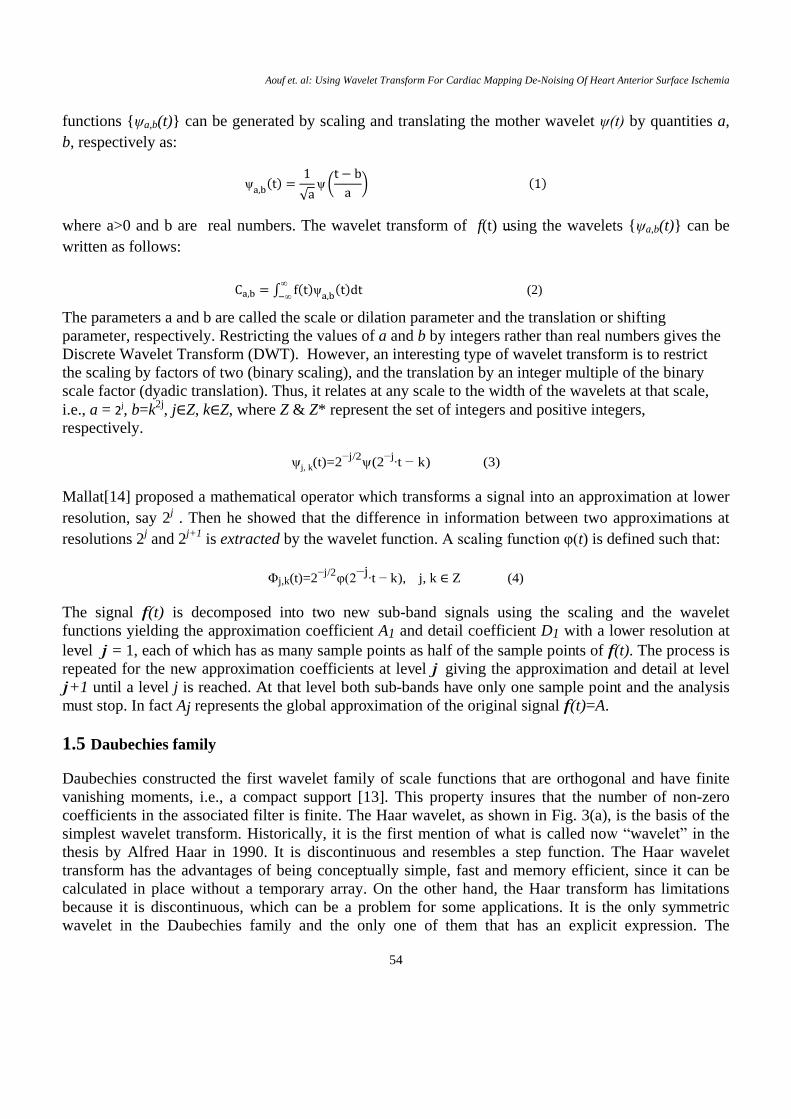
1.5 Daubechies family
Daubechies constructed the first wavelet family of scale functions that are orthogonal and have finite
vanishing moments, i.e., a compact support [13]. This property insures that the number of non-zero
coefficients in the associated filter is finite. The Haar wavelet, as shown in Fig. 3(a), is the basis of the
simplest wavelet transform. Historically, it is the first mention of what is called now “wavelet” in the
thesis by Alfred Haar in 1990. It is discontinuous and resembles a step function. The Haar wavelet
transform has the advantages of being conceptually simple, fast and memory efficient, since it can be
calculated in place without a temporary array. On the other hand, the Haar transform has limitations
because it is discontinuous, which can be a problem for some applications. It is the only symmetric
wavelet in the Daubechies family and the only one of them that has an explicit expression. The
IJICIS, Vol.14, No 3 JULY 2014
55
associated filter is of length two. This means that the resulting approximation and details are all half the
number of columns and rows of the input signal. The scale function φhaar is the simple average
function and the wavelet ψhaar is the difference. For higher order Daubechies wavelets ψdb, N denotes
the order of the wavelet and the number of vanishing moments. The regularity increases with the order
[14][13].
Figure 3: Scaling functions associated with the wavelets (a) Haar (b) Db2 (c) Db4 (d) Db8.
1.6 De-noising using the wavelet transform
Noise in the medical field, especially in ECG signal has a great powerful effect in the reduction of
signal to noise ratio (SNR). The ECG signal is always corrupted by different types of noise [15].
Wavelet transformation is one of the most popular and important techniques used in the field of de-
noising the ECG waveform [16, 17, 18, 19]. We propose a new technique using the wavelet transform
to detect and eliminate the noise of the potential signal. Equation (5) indicates that the received signal is
the sum of both the physical signal S(t) and the corrupting noise N(t).
R(t) =S(t)+N(t) (5)
Aouf et. al: Using Wavelet Transform For Cardiac Mapping De-Noising Of Heart Anterior Surface Ischemia
56
The de-noising process proposed in this paper depends upon the difference between the characteristics
of the noise and signal. The power of the wavelet technique here is detecting signal discontinuities [19].
So, we calculated the signal to noise ratio (SNR) to assess the quality of the reconstructed signal.
In this paper we present new technique using 3D wavelet transform for reconstructing and denoising of
maps representing chest leads signals at selected positions for the bio-potential state of the heart. The
rest of the paper is organized as following, The methods of map reconstruction and the 3D wavelets for
signal de-noising are represented in section 2 . The results of different db wavelets are shown and
represented statistically and graphically in section 3. Finally, the best wavelet for each lead position is
highlighted to obtain the highest diagnostic degree for heart anterior surface ischemia in the Conclusion.
2 Material and Methods
2.1 Database collection
In this research we applied our experiment to 30 patients suffering from ischemia. The range of age of
the patients was from 35 to 50, having a weight range from 80 to 100 kg and a height range from 1.6 to
1.8 meters. The equipment used in our experiment was a single channel ECG interfaced with a
computer. The experiment location was the cardiology department research at Ain-Shams Specialized
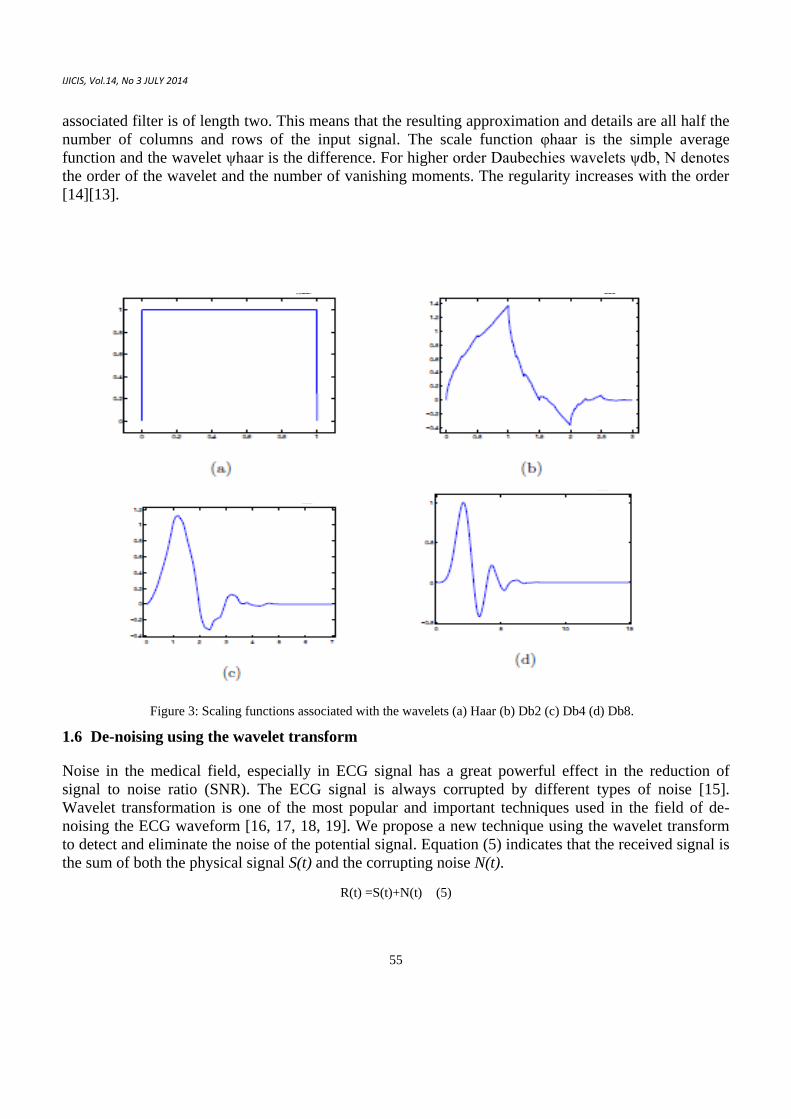
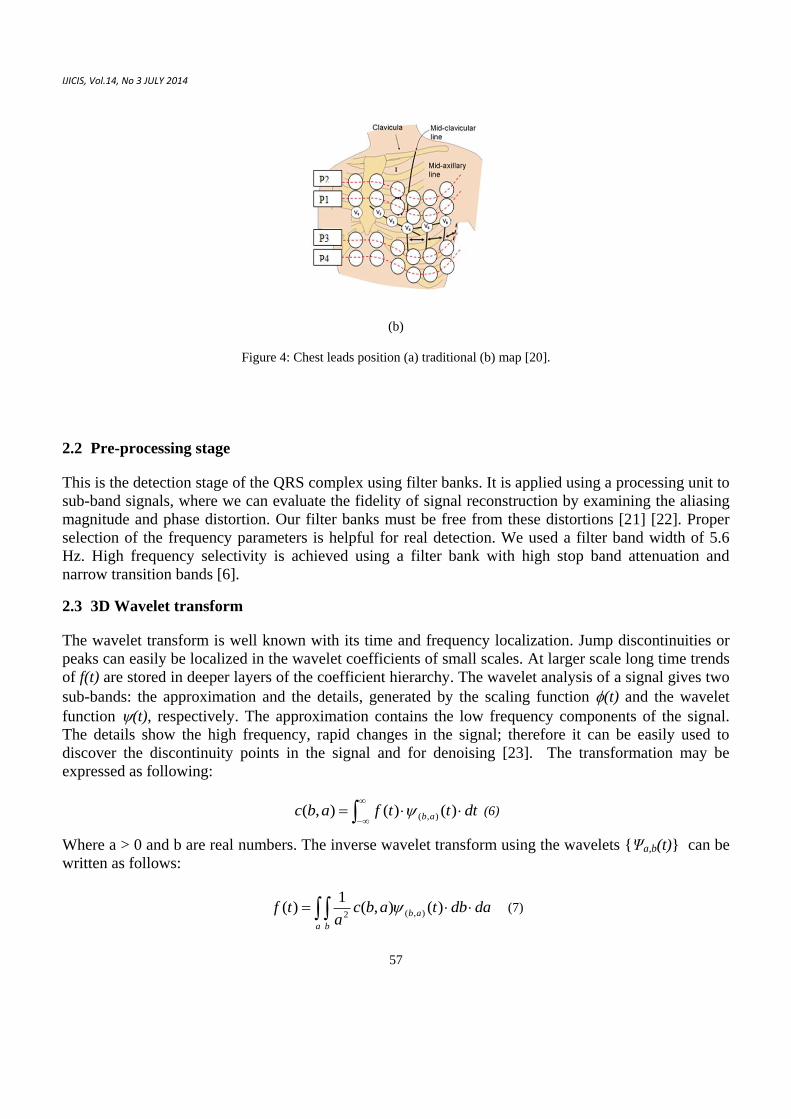
Hospital, Cairo, Egypt. In our experiment we used standard chest leads but with new electrode
placements. We chose four positions on the chest in addition to the traditional position, as shown in Fig.
4. The five positions were designated by p0, p1, p2, p3, and p4. p0 is the traditional position, while p1
and p2 are the upper positions, and p3 and p4 are the lower positions, taking into account the anatomical
structure of the chest and the chest rib locations [20].
(a)
IJICIS, Vol.14, No 3 JULY 2014
57
(b)
Figure 4: Chest leads position (a) traditional (b) map [20].
2.2 Pre-processing stage
This is the detection stage of the QRS complex using filter banks. It is applied using a processing unit to
sub-band signals, where we can evaluate the fidelity of signal reconstruction by examining the aliasing
magnitude and phase distortion. Our filter banks must be free from these distortions [21] [22]. Proper
selection of the frequency parameters is helpful for real detection. We used a filter band width of 5.6
Hz. High frequency selectivity is achieved using a filter bank with high stop band attenuation and
narrow transition bands [6].
2.3 3D Wavelet transform
The wavelet transform is well known with its time and frequency localization. Jump discontinuities or
peaks can easily be localized in the wavelet coefficients of small scales. At larger scale long time trends
of f(t) are stored in deeper layers of the coefficient hierarchy. The wavelet analysis of a signal gives two
sub-bands: the approximation and the details, generated by the scaling function (t) and the wavelet
function (t), respectively. The approximation contains the low frequency components of the signal.
The details show the high frequency, rapid changes in the signal; therefore it can be easily used to
discover the discontinuity points in the signal and for denoising [23]. The transformation may be
expressed as following:
dtttfabc ab
)()(),( ),( (6)
Where a > 0 and b are real numbers. The inverse wavelet transform using the wavelets {Ψa,b(t)} can be
written as follows:
dadbtabca
tfa b
ab )(),(1
)( ),(2 (7)
Aouf et. al: Using Wavelet Transform For Cardiac Mapping De-Noising Of Heart Anterior Surface Ischemia
58
As shown in the last equations, the signal f(t) is represented in terms of a linear combination of wavelet
coefficients c(a,b). The 3D wavelet transform is extended from the 1D wavelet transform [2][12]. It is
the product of three one-dimensional functions. The analysis is carried out along the horizontal (x), the
vertical (y), and the depth (z) dimensions of the volumetric data. The equations 8 – 15 represent the
eight wavelet and scaling functions of the 3D wavelet transform [10][24].
Φj,{k, l m}(x, y, z) = 23 j/2 Φ(x - 2- j∙k) Φ(y - 2- j∙l) Φ(z - 2- j∙m) (8)
ψ 1j,{k, l, m}(x, y, z) = 23 j/2 Ψ(x - 2- j∙k) Φ(y - 2- j∙l) Φ(z - 2- j∙m) (9)
ψ 2j,{k, l, m}(x, y, z) = 23 j/2 Φ(x - 2- j∙k) Ψ(y - 2- j∙l) Φ(z - 2- j∙m) (10)
ψ 3j,{k, l, m}(x, y, z) = 23 j/2 Ψ(x - 2- j∙k) Ψ(y - 2- j∙l) Φ(z - 2- j∙m) (11)
ψ 4j,{k, l, m}(x ,y, z) = 23 j/2 Φ(x - 2- j∙k) Φ(y - 2- j∙l) Ψ(z - 2- j∙m) (12)
ψ 5j,{k, l, m}(x ,y, z) = 23 j/2 Ψ(x - 2- j∙k) Φ(y - 2- j∙l) Ψ(z - 2- j∙m) (13)
ψ 6j,{k, l, m}(x, y, z) = 23 j/2 Φ(x - 2- j∙k) Ψ(y - 2- j∙l) Ψ(z - 2- j∙m) (14)
ψ 7j,{k, l, m}(x ,y ,z) = 23 j/2 Ψ(x - 2- j∙k) Ψ(y - 2- j∙l) Ψ(z - 2- j∙m) (15)
The different types of mother wavelets are always a subject of comparison aiming to find out which
wavelet is more suitable for which application [25][26][27]. Daubechies constructed the first wavelet
family of scale functions that are orthogonal and have finite vanishing moments, i.e., a compact support
[13]. Wavelets with fewer vanishing moments give less smoothing and remove fewer details, but
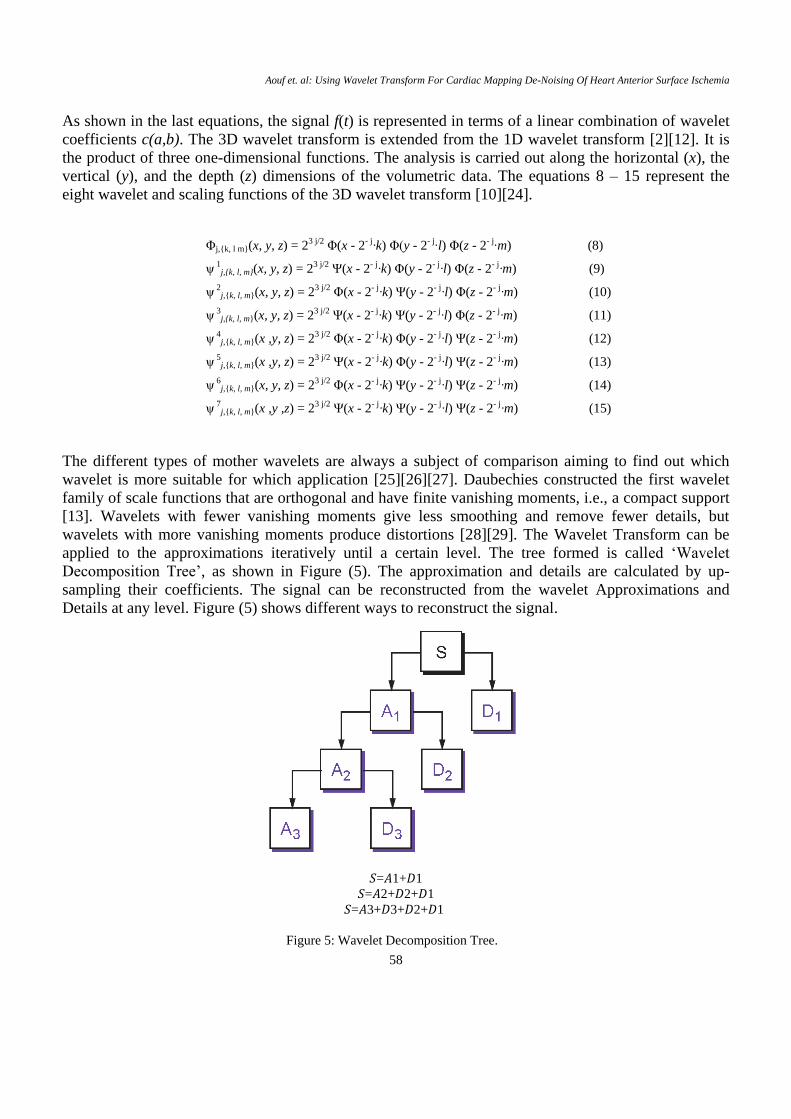
wavelets with more vanishing moments produce distortions [28][29]. The Wavelet Transform can be
applied to the approximations iteratively until a certain level. The tree formed is called „Wavelet
Decomposition Tree‟, as shown in Figure (5). The approximation and details are calculated by up-
sampling their coefficients. The signal can be reconstructed from the wavelet Approximations and
Details at any level. Figure (5) shows different ways to reconstruct the signal.
𝑆=𝐴1+𝐷1
𝑆=𝐴2+𝐷2+𝐷1
𝑆=𝐴3+𝐷3+𝐷2+𝐷1
Figure 5: Wavelet Decomposition Tree.
IJICIS, Vol.14, No 3 JULY 2014
59
2.4 De-noising using the wavelet transform
There is noise in the Details of the signal, and a simple filtering process can be made by reconstructing
the signal with a zero vector instead of the Details coefficients, but this will omit the other details of the
signal as well. A better approach is to threshold the Details then reconstruct the signal [30][31].There
are two types of threshold, hard and soft thresholds as in equations (16) and (17).
( ) { ( ) | ( )|
| ( )| (16)
( ) { ( ( )) (| ( ) |) | ( )|
| ( )| (17)
A hard threshold produces discontinuities while a soft threshold has a smoothing effect with
discontinuities. A universal thresholding rule that provides an easy, fast, and automatic thresholding is
given by:
√ (18)
Where N is the length of the coefficient vector, is the standard deviation of the noise with = 0.6745 𝑀𝐴𝐷, MAD represents the Median Absolute Deviation of the coefficients, and denotes the threshold
value. This threshold can be updated for each interval of the signal as the noise variance can vary with
time resulting in several different variance values, so there is a different noise variance for different
time intervals.
3 Results and Discussion
In this study, we have proposed an improved method for the diagnosis of anterior ischemia of the heart
using traditional ECG by plotting maps for the bio-potential state of cardiac muscle without noise.
Traditional ECG shows a spreading of the electrical signal at the ventricles of the heart from the point
of view of one position placement for the chest electrodes to obtain the six chest leads, thus V1 and V2
look at the right ventricles, V3 and V4 look at the septum between the ventricles and the anterior wall of
the left ventricle, whereas V5 and V6 look at the anterior and lateral walls of the left ventricles [32][33].
Plotting the maps with four additional positions, gives the cardiologist the facility to look more deeply
into the spreading of the electrical signals of the ventricles. The maps produce 30 channels due to the
five positions with the six chest leads. But noise is an apparent problem which decreases the fidelity of
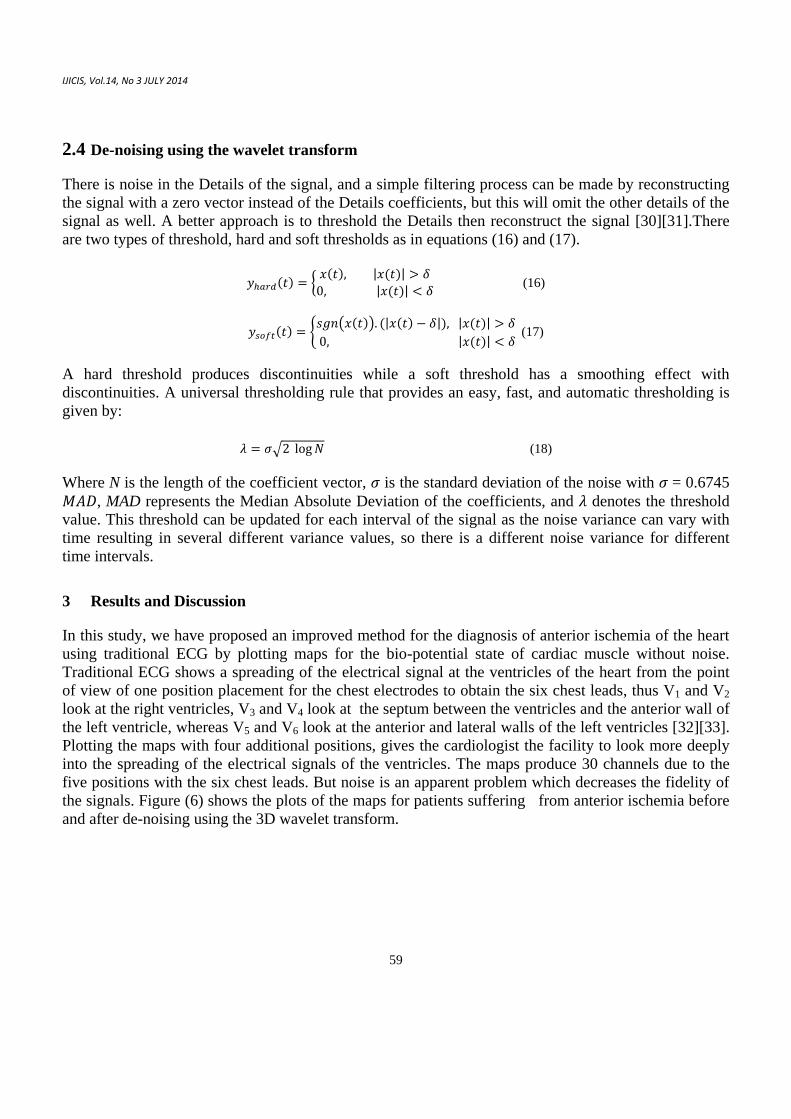
the signals. Figure (6) shows the plots of the maps for patients suffering from anterior ischemia before
and after de-noising using the 3D wavelet transform.
Aouf et. al: Using Wavelet Transform For Cardiac Mapping De-Noising Of Heart Anterior Surface Ischemia
60
Figure 6: Denoising of maps using different Daubechies (dbs) family
Using the 3D wavelet transform, we have performed sensitivity analysis on Daubechies (db) wavelets
for de-noising. Maps were drawn at 10 msec, at 20 msec, at 30 msec, and at 40 msec from the R-
peak reference to cover the cardiac cycle. We found that maps appear differently at each instant,
which demonstrates the bio- potential propagation state at different durations for the ventricles.
Plotting maps for 30 different channels ECG makes them subjected to noise. We used the 3D
wavelet transform especially with Daubechies (db) to perform de-noising. In Figure (6) we found
that there are differences in the maps before and after de-noising. At 10 msec, maps still show
negative signal values in most of the chest leads at different positions. There is a remarkable
increase in the negative amplitude at p4 with V3, and also at p2 with V4, V5 and V6. At 20 msec,
the negative signal appearance still prevails, but with a disappearance of positive values, and
zeroes values occur at P4 with V5. At 30 msec, no significant changes occur. At 40 msec, maps still
show negative values, but signal negativity increases at p4 with V2, V3, and V4, and at P3 with V3.
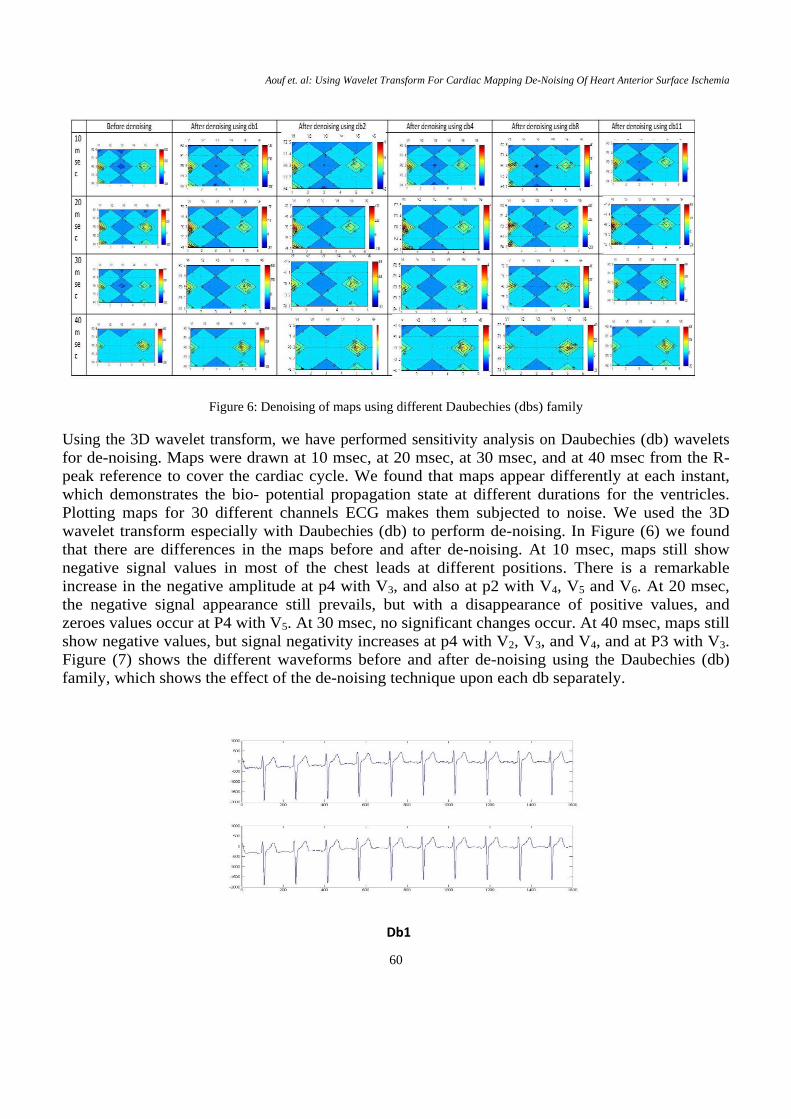
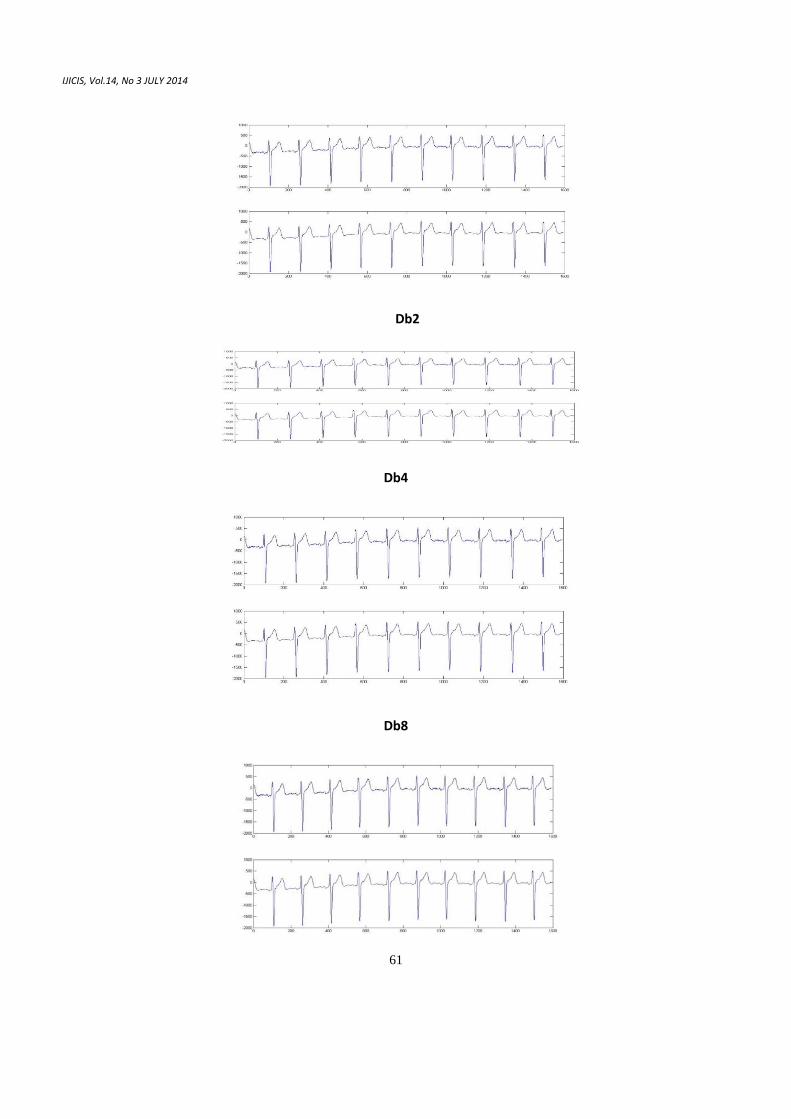
Figure (7) shows the different waveforms before and after de-noising using the Daubechies (db)
family, which shows the effect of the de-noising technique upon each db separately.
Db1
IJICIS, Vol.14, No 3 JULY 2014
61
Db2
Db4
Db8
Aouf et. al: Using Wavelet Transform For Cardiac Mapping De-Noising Of Heart Anterior Surface Ischemia
62
Db11
Figure (7): the different waveforms before and after de-noising using different Daubechies
(dbs) families
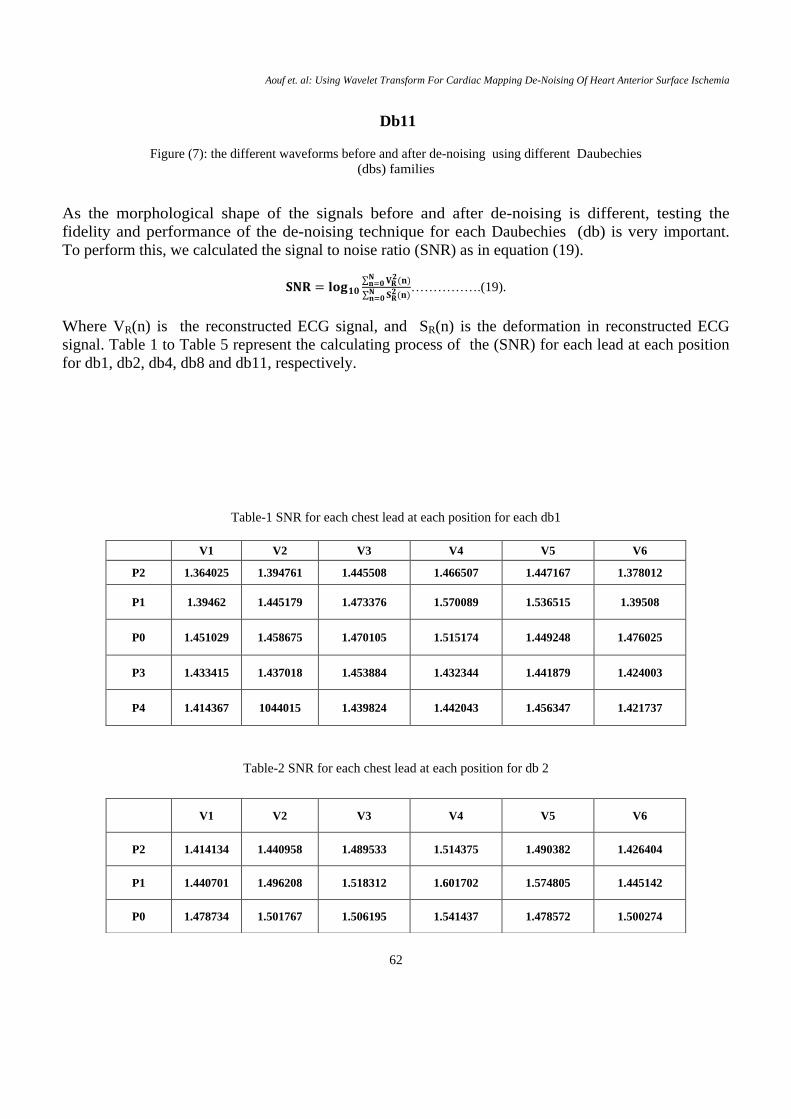
As the morphological shape of the signals before and after de-noising is different, testing the
fidelity and performance of the de-noising technique for each Daubechies (db) is very important.
To perform this, we calculated the signal to noise ratio (SNR) as in equation (19).
∑
( )
∑ ( )
…………….(19).
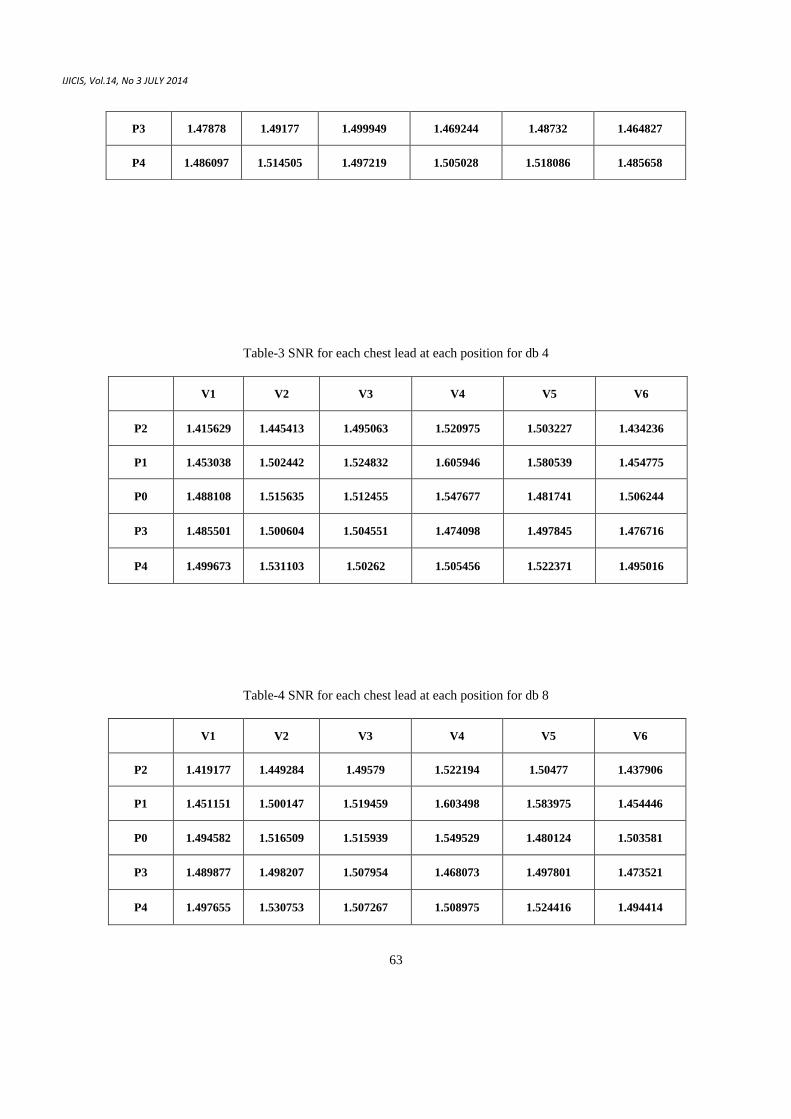
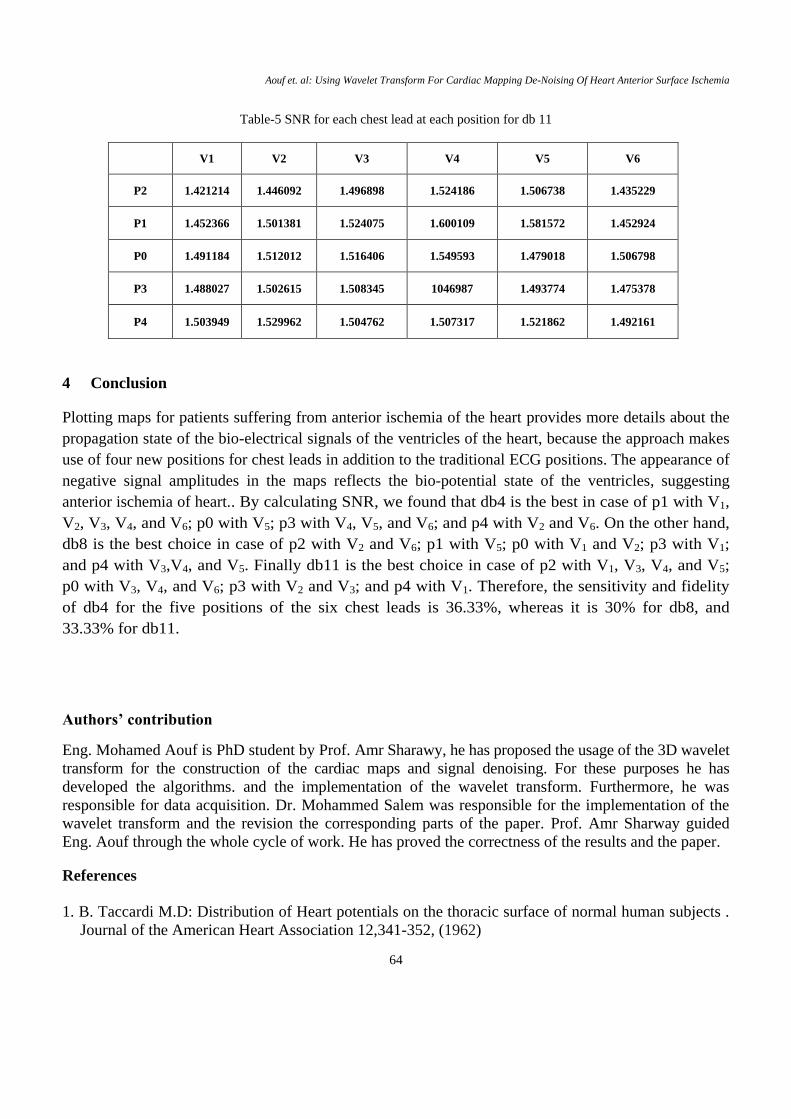
Where VR(n) is the reconstructed ECG signal, and SR(n) is the deformation in reconstructed ECG
signal. Table 1 to Table 5 represent the calculating process of the (SNR) for each lead at each position
for db1, db2, db4, db8 and db11, respectively.
Table-1 SNR for each chest lead at each position for each db1
V1 V2 V3 V4 V5 V6
P2 1.364025 1.394761 1.445508 1.466507 1.447167 1.378012
P1 1.39462 1.445179 1.473376 1.570089 1.536515 1.39508
P0 1.451029 1.458675 1.470105 1.515174 1.449248 1.476025
P3 1.433415 1.437018 1.453884 1.432344 1.441879 1.424003
P4 1.414367 1044015 1.439824 1.442043 1.456347 1.421737
Table-2 SNR for each chest lead at each position for db 2
V1 V2 V3 V4 V5 V6
P2 1.414134 1.440958 1.489533 1.514375 1.490382 1.426404
P1 1.440701 1.496208 1.518312 1.601702 1.574805 1.445142
P0 1.478734 1.501767 1.506195 1.541437 1.478572 1.500274
IJICIS, Vol.14, No 3 JULY 2014
63
Table-3 SNR for each chest lead at each position for db 4
V1 V2 V3 V4 V5 V6
P2 1.415629 1.445413 1.495063 1.520975 1.503227 1.434236
P1 1.453038 1.502442 1.524832 1.605946 1.580539 1.454775
P0 1.488108 1.515635 1.512455 1.547677 1.481741 1.506244
P3 1.485501 1.500604 1.504551 1.474098 1.497845 1.476716
P4 1.499673 1.531103 1.50262 1.505456 1.522371 1.495016
Table-4 SNR for each chest lead at each position for db 8
V1 V2 V3 V4 V5 V6
P2 1.419177 1.449284 1.49579 1.522194 1.50477 1.437906
P1 1.451151 1.500147 1.519459 1.603498 1.583975 1.454446
P0 1.494582 1.516509 1.515939 1.549529 1.480124 1.503581
P3 1.489877 1.498207 1.507954 1.468073 1.497801 1.473521
P4 1.497655 1.530753 1.507267 1.508975 1.524416 1.494414
P3 1.47878 1.49177 1.499949 1.469244 1.48732 1.464827
P4 1.486097 1.514505 1.497219 1.505028 1.518086 1.485658
Aouf et. al: Using Wavelet Transform For Cardiac Mapping De-Noising Of Heart Anterior Surface Ischemia
64
Table-5 SNR for each chest lead at each position for db 11
V1 V2 V3 V4 V5 V6
P2 1.421214 1.446092 1.496898 1.524186 1.506738 1.435229
P1 1.452366 1.501381 1.524075 1.600109 1.581572 1.452924
P0 1.491184 1.512012 1.516406 1.549593 1.479018 1.506798
P3 1.488027 1.502615 1.508345 1046987 1.493774 1.475378
P4 1.503949 1.529962 1.504762 1.507317 1.521862 1.492161
4 Conclusion
Plotting maps for patients suffering from anterior ischemia of the heart provides more details about the
propagation state of the bio-electrical signals of the ventricles of the heart, because the approach makes
use of four new positions for chest leads in addition to the traditional ECG positions. The appearance of
negative signal amplitudes in the maps reflects the bio-potential state of the ventricles, suggesting
anterior ischemia of heart.. By calculating SNR, we found that db4 is the best in case of p1 with V1,
V2, V3, V4, and V6; p0 with V5; p3 with V4, V5, and V6; and p4 with V2 and V6. On the other hand,
db8 is the best choice in case of p2 with V2 and V6; p1 with V5; p0 with V1 and V2; p3 with V1;
and p4 with V3,V4, and V5. Finally db11 is the best choice in case of p2 with V1, V3, V4, and V5;
p0 with V3, V4, and V6; p3 with V2 and V3; and p4 with V1. Therefore, the sensitivity and fidelity
of db4 for the five positions of the six chest leads is 36.33%, whereas it is 30% for db8, and
33.33% for db11.
Authors’ contribution
Eng. Mohamed Aouf is PhD student by Prof. Amr Sharawy, he has proposed the usage of the 3D wavelet
transform for the construction of the cardiac maps and signal denoising. For these purposes he has
developed the algorithms. and the implementation of the wavelet transform. Furthermore, he was
responsible for data acquisition. Dr. Mohammed Salem was responsible for the implementation of the
wavelet transform and the revision the corresponding parts of the paper. Prof. Amr Sharway guided
Eng. Aouf through the whole cycle of work. He has proved the correctness of the results and the paper.
References
1. B. Taccardi M.D: Distribution of Heart potentials on the thoracic surface of normal human subjects .
Journal of the American Heart Association 12,341-352, (1962)
IJICIS, Vol.14, No 3 JULY 2014
65
2. G.Xanthis , P.M. Bonovas, and G. A. Kyriacou : Inverse problem of ECG for different equivalent
cardiac sources . Piers on line, vol. 3 No. 8. (2007)
3. B.R.Farr.B. VON denbusch.j.silny.G.Rau, and S.Effert: localization of significant coronry arterial
narrow wings using body surface potential mapping during exercise stress testing. Am. J.cardiol
5,528-530 (1987)
4. L.S.Green, R.L LUX, and C.W Haws: Detection and localization of coronary artery disease with
body surface mapping in patients with normal electrocardiograms. American Heart Association
76,1290-1297 (1987)
5. Linwei,Wang,Wong, K.C.L, Heye Zhang, Huafeng Liv: Non invasive Computational Imaging of
cardiac electrophysiology for 3-D Infaract . IEEE 58,1033-1043 (2011)
6. Tompkins,Willis J. Truong Q. Nguyen , and Shen lou,: ECG Beat detection using filter banks. IEEE
transactions on Biomedical Engineering 46, 192-202.. (1999)
7. Vaidyanathan P.P: Multirate systems and filter banks . IEEE1,56-93, (1992)
8. Soman A K,Vaidyanathan P. P and T. Q Nguyen :Linear phase paraunitary filter banks :
Thery,Factorizations and Designs.IEEE signal processing 41,3480-3495 (1993)
9. Alfaouri, M. and K. Daqrouq: ECG Signal Denoising By Wavelet Transform Thresholding.
American Journal of Applied Sciences. 5,276-281 (2008)
10. Mohamed Abdel-Megeed Salem: Multi-resolution Image segmentation . Humboldt-universitat Zu
berlin (2012)
11. Y.Y. Tang : Wavelet theory and its application to pattern recognition .World Scientific Publishing
co, (2000)
12. Gerald Kaiser: The fast Harr Transform, Gate way to wavelets. IEEE potentials(1998)
13. Ingrid Daubechies: Ten lectures on wavelets Society for Industrial and applied mathematics, 26 –
100 (1992)
14. Stephane G. Mallat: A theory for multiresolution signal decomposition: The wavelet
representation. IEEE Trans. Pattern Anal. Machine Intell 11, 674-693. (1989).
15. Zhidong Z, Min P: ECG de-noising by sparse wavelet shrinkage .IEEE Conf.Bioinformatics and
Biomedical Engineering vol. 1 No. 12 ,786-789(2007)
16. Al faouri. M, Dagrougk: ECG de-noising by sparse wavelet shrinkage .American journal of applied
sciences 3,6597-6600 (2008)
17. Sayadi o., Sham Sollahi M.B: ECG de-noising with adaptive bionic wavelet transform. In 28th
Annual International conference of IEEE on Eng. In Med. And Biology Society, EMBS 06, 6597-
660 (2006)
18. Beheshtis, Nikvand N., Fernando X.N: Soft Thresholding by Noise Invalidation. 24th Biennial
Symposium on Communications, 235 – 238(24-26 June 2008)
19. Christopher Brouse , Guy A. Dumont. Felix j. Herrmann. And J Mark Ansermina: A wavelet
Approach to detecting Electro cautery noise in the ECG. IEEE Engineering in Medicine and Biology
Magazine 14,76-82 (2006)
20. Amr Sharawy, Sherief Sami, Mohamed Aouf: Pseudo-Body Surface Potential Mapping on Heart
Using 3D WaveletTransform : international journal of computer application volume 80,No.8,27-32
(2013)
21. J.pan , and w. j. Tompkins, : A real- time QRS Detection Algorithm. IEEE Trans. Biomed. Eng.
Vol. 32,230-236 (1985)
22. P.s. Hamilton and w. j Tompkins: Quantitative investigation of qrs detection rules using mit / bih
arrhythmia database . IEEE trans. Biomed. Eng. Vol. 33,1157-1165 (1986)
Aouf et. al: Using Wavelet Transform For Cardiac Mapping De-Noising Of Heart Anterior Surface Ischemia
66
23. M.Misiti, Y. Misiti , G. Oppenheim, J.Poggi : Wavelets tool box user‟s guide 5th
edition Math works
(2007)
24. Mohamed Abdel-Megeed Salem: Application of the 3D Wavelet Transform on Lane Extraction on
Traffic Monitoring Images Extended Abstract in Wave , wavelets Applications conf,10-14(2007)
25. M. I. Mahmoud, M. I. M. Dessouky, S. Deyab, and F. H. Elfouly : Comparison between haar and
Daubechies wavelet transformions on fpga technology. World Academy of Science, Engineering and
Technology vol. 6: 23–29, (2007)
26. S. D. M. Raja and A. Shanmugam: Ann and svm based war scene classification using wavelet
features. A comparative study, Journal of Computational Information Systems (JCIS) 7:1402–1411
(2011)
27. Mohammed A-Megeed Salem : On the Selection of the Proper Wavelet for Moving Object
Detection. The 7th IEEE International Conference on Computer Engineering and Systems
(ICCES‟11) 207-212 (2011)
28. A.Khare and U.S.Tiwary: Soft-thresholding for de-noising of medical images-a multi resolution
approach .International Journal of Wavelets, Multi resolution and Information Processing 3:477–
496 (2005)
29. M.A.M. Salem, K. Klaus, F. Winkler, and B. Meffert: Resolution mosaic based smart camera for
video surveillance in Third ACM/IEEE International Conference on Distributed Smart cameras
(2009)
30. Mehmet Ustundag, Abdulkadir Sengur, Muammer Gokbulut, Fikret Ata. : Performance comparison
of wavelet thresholding techniques on weak ECG signal de-noising. Przeglad Elektrotechniczny,
ISSN 0033-2097, R.89 ,63-66 (2013)
31. Ustunday M.Gokbulat M, Sengur A, Ataf: De-noising of weak ECG signals by using wavelet
analysis and fuzzy thresholding . Network modeling analysis in health informatics and Bio
informatics 6,135-140 (2012)
32. Berne R m, Levy MN: Cardiovascular physiology .St. Louis, Mosby , 2001
33. Mirvis DM : Electrocardiography ,A Physiologic Approach . St . Louis , Mosby (1993)
Related Documents