BioOne sees sustainable scholarly publishing as an inherently collaborative enterprise connecting authors, nonprofit publishers, academic institutions, research libraries, and research funders in the common goal of maximizing access to critical research. Using Water Isotope Tracers to Develop the Hydrological Component of a Long-Term Aquatic Ecosystem Monitoring Program for a Northern Lake-Rich Landscape Author(s): J. M. E. Tondu , K. W. Turner , B. B. Wolfe , R. I. Hall , T. W. D. Edwards and I. McDonald Source: Arctic, Antarctic, and Alpine Research, 45(4):594-614. 2013. Published By: Institute of Arctic and Alpine Research (INSTAAR), University of Colorado DOI: http://dx.doi.org/10.1657/1938-4246-45.4.594 URL: http://www.bioone.org/doi/full/10.1657/1938-4246-45.4.594 BioOne (www.bioone.org ) is a nonprofit, online aggregation of core research in the biological, ecological, and environmental sciences. BioOne provides a sustainable online platform for over 170 journals and books published by nonprofit societies, associations, museums, institutions, and presses. Your use of this PDF, the BioOne Web site, and all posted and associated content indicates your acceptance of BioOne’s Terms of Use, available at www.bioone.org/page/terms_of_use . Usage of BioOne content is strictly limited to personal, educational, and non-commercial use. Commercial inquiries or rights and permissions requests should be directed to the individual publisher as copyright holder.

Welcome message from author
This document is posted to help you gain knowledge. Please leave a comment to let me know what you think about it! Share it to your friends and learn new things together.
Transcript

BioOne sees sustainable scholarly publishing as an inherently collaborative enterprise connecting authors, nonprofit publishers, academic institutions, researchlibraries, and research funders in the common goal of maximizing access to critical research.
Using Water Isotope Tracers to Develop the Hydrological Component of aLong-Term Aquatic Ecosystem Monitoring Program for a Northern Lake-RichLandscapeAuthor(s): J. M. E. Tondu , K. W. Turner , B. B. Wolfe , R. I. Hall , T. W. D. Edwards and I. McDonaldSource: Arctic, Antarctic, and Alpine Research, 45(4):594-614. 2013.Published By: Institute of Arctic and Alpine Research (INSTAAR), University of ColoradoDOI: http://dx.doi.org/10.1657/1938-4246-45.4.594URL: http://www.bioone.org/doi/full/10.1657/1938-4246-45.4.594
BioOne (www.bioone.org) is a nonprofit, online aggregation of core research in the biological, ecological, andenvironmental sciences. BioOne provides a sustainable online platform for over 170 journals and books publishedby nonprofit societies, associations, museums, institutions, and presses.
Your use of this PDF, the BioOne Web site, and all posted and associated content indicates your acceptance ofBioOne’s Terms of Use, available at www.bioone.org/page/terms_of_use.
Usage of BioOne content is strictly limited to personal, educational, and non-commercial use. Commercialinquiries or rights and permissions requests should be directed to the individual publisher as copyright holder.

Arctic, Antarctic, and Alpine Research, Vol. 45, No. 4, 2013, pp. 594–614
Using Water Isotope Tracers to Develop theHydrological Component of a Long-Term AquaticEcosystem Monitoring Program for a Northern Lake-Rich Landscape
AbstractJ. M. E. Tondu*#Arctic lake-rich landscapes are vulnerable to climate change, but their remote locationsK. W. Turner†present a challenge to develop effective approaches for monitoring hydroecological status
B. B. Wolfe† and trends. Here, we structure the hydrological component of an aquatic ecosystem moni-R. I. Hall* toring program that addresses concerns of Parks Canada (Vuntut National Park) and the
Vuntut Gwitchin First Nation about changing water levels of Old Crow Flats (OCF),T. W. D. Edwards‡ andYukon, Canada, a 5600-km2 thermokarst landscape recognized nationally and internation-
I. McDonald§ ally for its ecological, historical, and cultural significance. The foundation of the monitor-*Department of Biology, University of ing program is 5 years (2007–2011) of water isotope data from 14 lakes situated inWaterloo, 200 University Avenue West, catchments that are representative of the land-cover and hydrological diversity of OCF.Waterloo, Ontario, N2L 3G1, Canada Isotopic compositions of input water (�I) and evaporation-to-inflow (E/I) ratios, calculated†Department of Geography and
using the coupled-isotope tracer method, provide key hydrological metrics for each lakeEnvironmental Studies, Wilfrid Laurierover the 5-year sampling interval. From these time series, we identify monitoring lakesUniversity, 75 University Avenue West,
Waterloo, Ontario, N2L 3C5, Canada that are sensitive to changes in snowmelt, rainfall, and evaporation, and demonstrate the‡Department of Earth and Environmental use of the Mann-Kendall test for determining statistically significant trends in the rolesSciences, University of Waterloo, 200 of these hydrological processes on lake-water balances. These approaches will serve toUniversity Avenue West, Waterloo,
identify lake hydrological responses to climate change and variability from ongoing waterOntario, N2L 3G1, Canadaisotope monitoring by Parks Canada, in partnership with the Vuntut Gwitchin Government,§Yukon Field Unit, Parks Canada,
205–300 Main Street, Whitehorse, Yukon Wilfrid Laurier University, and the University of Waterloo.Territory, Y1A 2B5, Canada#Corresponding author: Jana Tondu [email protected]
DOI: http://dx.doi.org/10.1657/1938-4246-45.4.594
Introduction
Shallow thermokarst lakes contribute significantly to Arcticbiodiversity with abundant microbial, planktonic, and benthic com-munities, aquatic plants, and fish (Schindler and Smol, 2006;ABEK, 2008; Vincent et al., 2008; Rautio et al., 2011). Thesefreshwater ecosystems also provide important habitat that supportspopulations of migratory birds and other wildlife, and are integral tothe traditional lifestyle and cultural heritage of indigenous circum-Arctic communities (Wrona et al., 2006; White et al., 2007). Arcticlandscapes are particularly sensitive to accelerating climatic warm-ing and change, and are undergoing pronounced ecosystem modifi-cations (Smol et al., 2005; Schindler and Smol, 2006; Prowse et al.,2009). For example, remote sensing techniques have documentedwidespread hydrological changes during recent decades, includingdecreases in the abundance and size of lakes in Alaska (Yoshikawaand Hinzman, 2003; Riordan et al., 2006), Siberia (Smith et al.,2005; Karlsson et al., 2012), and Canada (Labrecque et al., 2009;Carroll et al., 2011), likely driven by increases in susceptibility ofthermokarst lakes to sudden drainage events (Frohn et al., 2005;Hinkel et al., 2007; Wolfe and Turner, 2008; Marsh et al., 2009;Pohl et al., 2009; Jones et al., 2011) and evaporation (Labrecqueet al., 2009; Turner et al., 2010). Increases in water surface areahave also been observed in some other regions of Alaska (Jorgensonand Shur, 2007), Siberia (Smith et al., 2005), and northern Quebec
594 / ARCTIC, ANTARCTIC, AND ALPINE RESEARCH � 2013 Regents of the University of Colorado1523-0430/6 $7.00
(Payette, 2004) owing to thawing permafrost. Yet, not all lakeshave shown changes in surface area during recent decades (Roveret al., 2012). Although models predict declines in the areal extentof pan-Arctic wetlands (Avis et al., 2011), accelerated rates ofpermafrost thaw within the continuous permafrost zone and in-creases in precipitation may also lead to increases in total surfacearea of lakes in some regions (Plug et al., 2008; Arp et al., 2011).Thus, shallow lakes in circumpolar regions exhibit, and will likelycontinue to display, variability in their hydrological responses toclimatic changes and local controls on lake water balances (Roachet al., 2011; Wolfe et al., 2011a; Jepsen et al., 2012).
Climate warming has not only resulted in profound hydrologi-cal transitions but also regime shifts in the biological communitiesof many high-latitude lakes (Schindler and Smol, 2006; Carroll etal., 2011; Karlsson et al., 2011). Changes in lake water balancesdue to thawing permafrost (Hobbie et al., 1999; Kokelj et al., 2005,2009; Frey and McClelland, 2009) and enhanced evaporation (Smoland Douglas, 2007) influence water quality (changes in water clar-ity and water chemistry, including nutrient supply and nutrientcycling) that has cascading effects on aquatic biological communi-ties (MacDonald et al., 2012a; Kokelj and Jorgenson, 2013). Thus,there is a growing need for improved comprehensive science-basedmonitoring programs to adequately assess spatial patterns and ratesof change of the hydroecological conditions of these northern land-scapes.

To address the complexities of climate change in northernlandscapes and the concerns about rapidly changing lake levels, andthe associated effects on ecological integrity, a multidisciplinaryproject entitled ‘‘Environmental change and traditional use of theOld Crow Flats in northern Canada (Yeendoo Nanh NakhweenjitK’atr’ahanahtyaa)’’ was initiated in 2007 to study the physical andbiological components of the ecosystem as part of the InternationalPolar Year (IPY) program (Wolfe et al., 2011b). Old Crow Flats(OCF) is the largest, most significant wetland in Yukon and iscooperatively managed by the Vuntut Gwitchin First Nation(VGFN), Parks Canada (Vuntut National Park, established in1995), and the North Yukon Renewable Resource Council. TheIPY project aimed to leave a legacy for the northern communityof Old Crow, and research is currently focused on establishinglong-term monitoring programs to detect and quantify ecosystemchange, increase understanding of the mechanisms driving changes,and inform decisions and policies underpinning effective ecosys-tem stewardship.
In recognition of the need for long-term monitoring, the Can-ada National Parks Act (2000) states that a set of ecological integ-rity objectives and indicators need to be developed for each nationalpark. Science-based monitoring and reporting programs are re-quired to effectively measure the state of ecosystems and determinehow they are changing over time. Monitoring plans are based onthe systematic gathering of data and information from a set ofindicator variables with the purpose of establishing baseline condi-tions and detecting changes over time (Vaughan et al., 2001; Mez-quida et al., 2005; Lovett et al., 2007). Ecological monitoring innational parks is a response to the fundamental question: ‘‘Whatis the state of the park ecological integrity, and how is it changing?’’(Parks Canada, 2011:8). Information capturing an assessment ofpark ecological integrity is conveyed to the Canadian public every10 years in State of the Park reports (SoPR). In 2009, the first SoPRfor Vuntut National Park was released, which rated the overallecological integrity of Vuntut National Park as ‘‘good.’’ The reportused a wide range of ecosystem indicators, yet there is currently nomethod to adequately assess the conditions of the aquatic ecosystemwithin OCF, despite the fact that surface water (mainly shallowthermokarst lakes) in OCF covers �25% of the landscape (ParksCanada, 2009). Since shallow thermokarst lakes are an importantlandscape feature, a science-based monitoring program is essentialto improve understanding and quantification of the hydroecologicalconditions within OCF and identify how they are changing overtime.
Here, we advocate the use of water isotope tracers as a practi-cal monitoring tool to track hydrological conditions because theyare sensitive, diagnostic, broadly applicable, and samples are easilyobtained during fieldwork. Previous studies have shown that thewater balance of shallow northern lakes strongly influences limnol-ogy and aquatic ecology, which can be identified using water iso-tope tracers (Sokal et al., 2008; Balasubramaniam, 2012; Wiklundet al., 2012). Although the hydrogen and oxygen isotope composi-tion of water is well understood as it passes through the hydrologi-cal cycle (Clark and Fritz, 1997; Edwards et al., 2004), it has beenunderutilized as an indicator variable for hydrological monitoringprograms. While wetland hydroecological monitoring programs arelacking in general, long-term investigation on lentic systems tends
J. M. E. TONDU ET AL. / 595
to rely on instrumentation techniques (e.g., lysimeters, gauged in-flows and outflows) that are labor-intensive and expensive (Gilvearand Bradley, 2000) and are generally not feasible to implement ata large spatial scale in remote northern landscapes. Alternatively,leading-edge isotopic analysis techniques can be used to generatekey process-based insight of lake hydrological conditions and driv-ers at the landscape scale (Brock et al., 2007; Wolfe et al., 2007;Turner et al., 2010).
To effectively detect, describe, and report on ecological integ-rity in national parks in a broad ecosystem context, multiple indica-tor variables are essential. A genuinely interdisciplinary and collab-orative monitoring program for the OCF aquatic ecosystem iscurrently being developed, and this paper focuses on establishinga method for assessing hydrological changes using water isotopedata collected from 2007 to 2011. We provide a 5-year time seriesof calculated lake-specific input water isotope compositions (�I)and evaporation-to-inflow (E/I) ratios, key metrics that will serveas the foundation of the hydroecological monitoring program. �I
values determine the dominant source water type (snowmelt versusrainfall) that influences lake water balances and distinguishes iso-topic-based hydrologic regimes. E/I ratios indicate lake sensitivityto evaporation. We also demonstrate how researchers, a northerncommunity, and a government agency can effectively collaborateto develop a long-term monitoring program that will continue toevaluate the status and trends of the aquatic ecosystem in responseto climate change.
Study AreaOld Crow Flats (68�N, 140�W) is a large (5600 km2) landscape
dominated by shallow thermokarst lakes that is recognized as aWetland of International Importance by the Ramsar Conventionon Wetlands (1982) for its valuable wildlife habitat and culturalsignificance (Fig. 1). OCF represents a prominent region of Be-ringia that remained unglaciated during the Last Glacial Maximum.During this time OCF was inundated by Glacial Lake Old Crow,which left a thick deposit of fluvial and glaciolacustrine sediments,with the exception of an exposure of Carboniferous shale at TimberHill (Hughes, 1972; Lauriol et al., 2002; Zazula et al., 2004). Theshallow-water wetland is dissected by the deeply incised, broadlymeandering Old Crow River, leaving the river valley 40–50 mbelow a plateau of ‘‘perched’’ lakes that are primarily thermokarstin origin and underlain by continuous permafrost (Yukon Ecore-gions Working Group, 2004; Labrecque et al., 2009; Roy-Leveilleeand Burn, 2011).
Vegetation in OCF has spatially complex patterns owing tovariations in topography, drainage patterns, and ongoing ther-mokarst cycles (lake formation, expansion, and drainage) (YukonEcoregions Working Group, 2004). Land cover in OCF has beenbroadly categorized by Turner (2013) using Landsat imagery. Atotal of 37% of OCF is covered by dwarf shrub tundra vegetation.This terrain is characterized by ericaceous shrubs (e.g., Labradortea, blueberry), herbaceous plants (e.g., arctic marsh grass, reedgrass, water sedges, horsetails), and non-vascular plants (e.g.,sphagnum mosses and lichens) that are commonly found in drainedlake beds and low-center polygons (Ovenden, 1982; Ovenden andBrassard, 1989). Coniferous and deciduous forests (e.g., blackspruce, white spruce), located in well-drained areas, account for
FIGURE 1. Map showing the location of 14 lakes selected for the hydroecological monitoring program in Old Crow Flats (OCF), YukonTerritory. The shaded area north of Old Crow River represents Vuntut National Park, while the southern portion of OCF represents theVuntut Gwitchin First Nation Special Management Area. Catchment areas are outlined for each lake (dashed lines). See Turner (2013).
13% of the landscape. Tall shrub tundra (e.g., shrub birch, willows)covers 25% of the landscape. Shallow lakes located across OCFprovide habitat for communities of pond weed, yellow pond lily,common duck weed, hornwart, watermilfoil, muskgrass, and bur-reed (Ovenden and Brassard, 1989; Yukon Ecoregions WorkingGroup, 2004).
596 / ARCTIC, ANTARCTIC, AND ALPINE RESEARCH
Water isotope tracers (2H, 18O) have been used to classifylakes in OCF into hydrologic categories based on the dominantsource of input waters and include snowmelt dominated, rainfalldominated, and evaporation dominated (Turner et al., 2010). Thesehydrological differences are driven by physiographic location andcatchment characteristics including vegetation type (Turner, 2013).
Water balances of lakes in the southwestern area of OCF are primar-ily snowmelt dominated owing to the dominance of coniferous anddeciduous trees that entrap and accumulate snow redistributed fromdwarf shrub tundra areas by northeasterly winds. Furthermore,many of these lakes have catchments extending to upland areasthat provide snowmelt runoff. Lakes classified as having rainfall-dominated hydrology are typically found in central and northeast-ern areas of OCF, and their catchments have a greater proportionof herbaceous plants, non-vascular plants, and dwarf shrubs. Thephysiography of snowmelt- and rainfall-dominated lakes locatedin more peripheral areas of OCF tends to provide adequate runofffrom surrounding upland areas to offset evaporation. In contrast,rainfall-dominated lakes located in more central low-lying areashave smaller catchments, higher proportions of surface water, andshort and sparse vegetation cover, and are more susceptible to evap-orative drawdown. During prolonged dry periods, these rainfall-dominated lakes typically become evaporation dominated (Turner,2013).
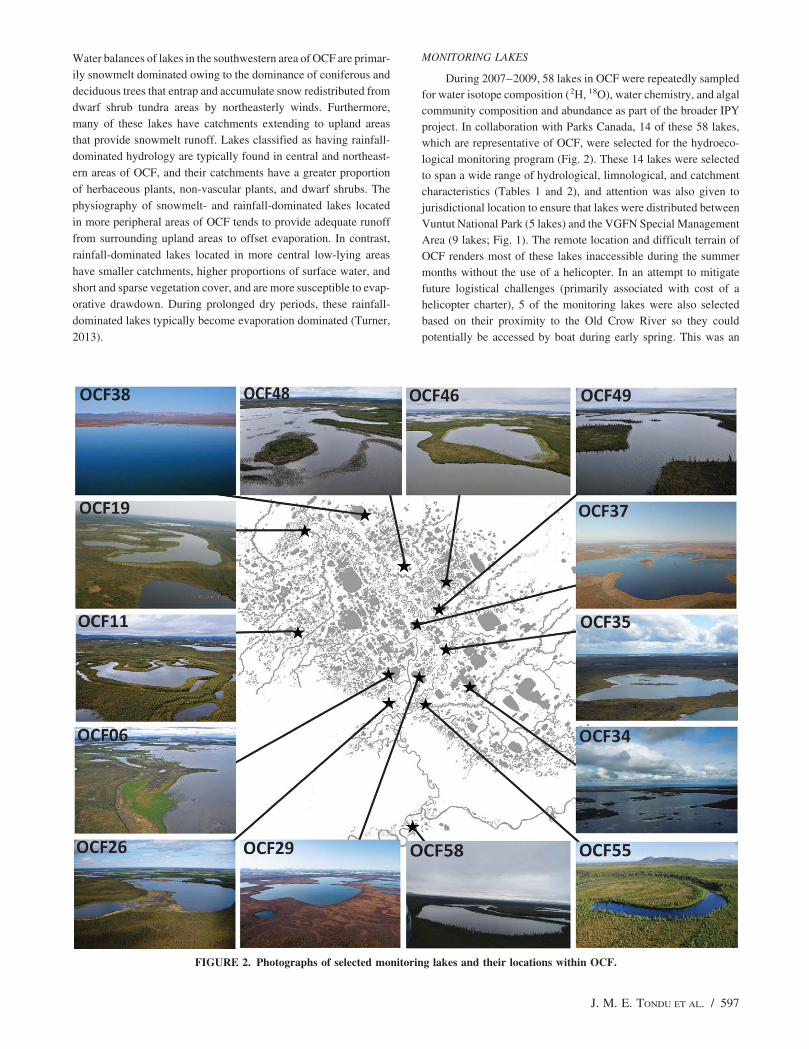
FIGURE 2. Photographs of selected monitoring lakes and their locations within OCF.
J. M. E. TONDU ET AL. / 597
MONITORING LAKES
During 2007–2009, 58 lakes in OCF were repeatedly sampledfor water isotope composition (2H, 18O), water chemistry, and algalcommunity composition and abundance as part of the broader IPYproject. In collaboration with Parks Canada, 14 of these 58 lakes,which are representative of OCF, were selected for the hydroeco-logical monitoring program (Fig. 2). These 14 lakes were selectedto span a wide range of hydrological, limnological, and catchmentcharacteristics (Tables 1 and 2), and attention was also given tojurisdictional location to ensure that lakes were distributed betweenVuntut National Park (5 lakes) and the VGFN Special ManagementArea (9 lakes; Fig. 1). The remote location and difficult terrain ofOCF renders most of these lakes inaccessible during the summermonths without the use of a helicopter. In an attempt to mitigatefuture logistical challenges (primarily associated with cost of ahelicopter charter), 5 of the monitoring lakes were also selectedbased on their proximity to the Old Crow River so they couldpotentially be accessed by boat during early spring. This was an
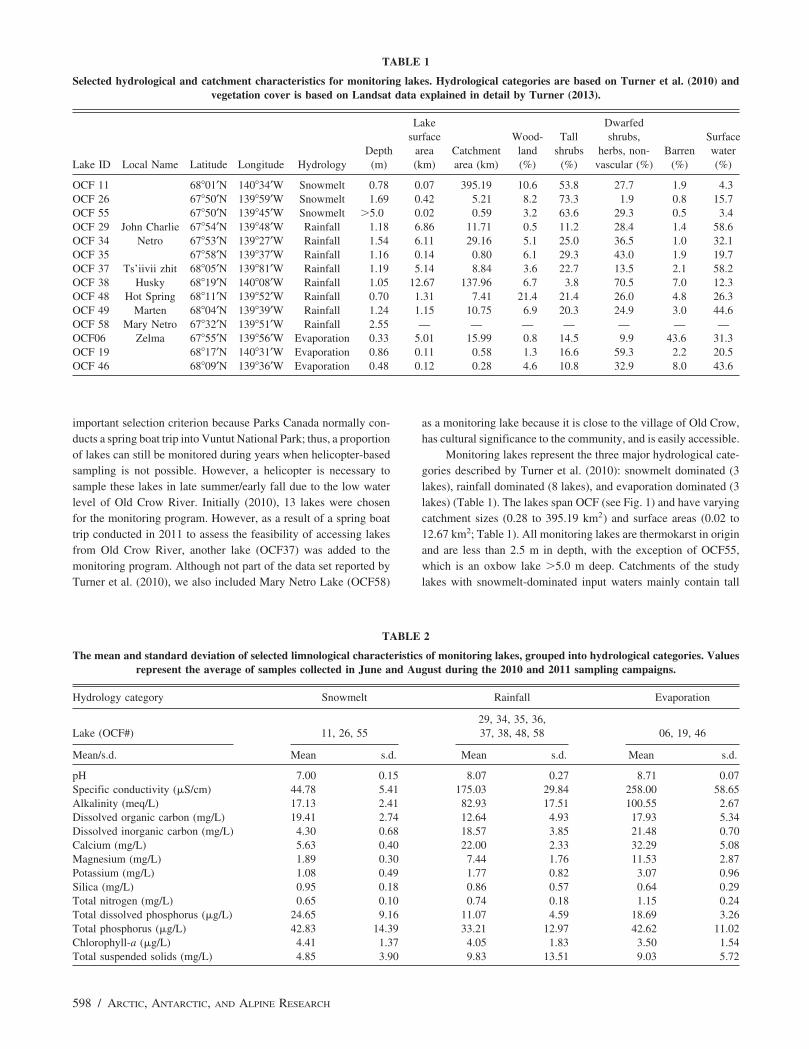
TABLE 1
Selected hydrological and catchment characteristics for monitoring lakes. Hydrological categories are based on Turner et al. (2010) andvegetation cover is based on Landsat data explained in detail by Turner (2013).
Lake Dwarfedsurface Wood- Tall shrubs, Surface
Depth area Catchment land shrubs herbs, non- Barren waterLake ID Local Name Latitude Longitude Hydrology (m) (km) area (km) (%) (%) vascular (%) (%) (%)
OCF 11 68�01′N 140�34′W Snowmelt 0.78 0.07 395.19 10.6 53.8 27.7 1.9 4.3OCF 26 67�50′N 139�59′W Snowmelt 1.69 0.42 5.21 8.2 73.3 1.9 0.8 15.7OCF 55 67�50′N 139�45′W Snowmelt �5.0 0.02 0.59 3.2 63.6 29.3 0.5 3.4OCF 29 John Charlie 67�54′N 139�48′W Rainfall 1.18 6.86 11.71 0.5 11.2 28.4 1.4 58.6OCF 34 Netro 67�53′N 139�27′W Rainfall 1.54 6.11 29.16 5.1 25.0 36.5 1.0 32.1OCF 35 67�58′N 139�37′W Rainfall 1.16 0.14 0.80 6.1 29.3 43.0 1.9 19.7OCF 37 Ts’iivii zhit 68�05′N 139�81′W Rainfall 1.19 5.14 8.84 3.6 22.7 13.5 2.1 58.2OCF 38 Husky 68�19′N 140�08′W Rainfall 1.05 12.67 137.96 6.7 3.8 70.5 7.0 12.3OCF 48 Hot Spring 68�11′N 139�52′W Rainfall 0.70 1.31 7.41 21.4 21.4 26.0 4.8 26.3OCF 49 Marten 68�04′N 139�39′W Rainfall 1.24 1.15 10.75 6.9 20.3 24.9 3.0 44.6OCF 58 Mary Netro 67�32′N 139�51′W Rainfall 2.55 — — — — — — —OCF06 Zelma 67�55′N 139�56′W Evaporation 0.33 5.01 15.99 0.8 14.5 9.9 43.6 31.3OCF 19 68�17′N 140�31′W Evaporation 0.86 0.11 0.58 1.3 16.6 59.3 2.2 20.5OCF 46 68�09′N 139�36′W Evaporation 0.48 0.12 0.28 4.6 10.8 32.9 8.0 43.6
important selection criterion because Parks Canada normally con-ducts a spring boat trip into Vuntut National Park; thus, a proportionof lakes can still be monitored during years when helicopter-basedsampling is not possible. However, a helicopter is necessary tosample these lakes in late summer/early fall due to the low waterlevel of Old Crow River. Initially (2010), 13 lakes were chosenfor the monitoring program. However, as a result of a spring boattrip conducted in 2011 to assess the feasibility of accessing lakesfrom Old Crow River, another lake (OCF37) was added to themonitoring program. Although not part of the data set reported byTurner et al. (2010), we also included Mary Netro Lake (OCF58)
TABLE 2
The mean and standard deviation of selected limnological characteristics of monitoring lakes, grouped into hydrological categories. Valuesrepresent the average of samples collected in June and August during the 2010 and 2011 sampling campaigns.
Hydrology category Snowmelt Rainfall Evaporation
29, 34, 35, 36,Lake (OCF#) 11, 26, 55 37, 38, 48, 58 06, 19, 46
Mean/s.d. Mean s.d. Mean s.d. Mean s.d.
pH 7.00 0.15 8.07 0.27 8.71 0.07Specific conductivity (�S/cm) 44.78 5.41 175.03 29.84 258.00 58.65Alkalinity (meq/L) 17.13 2.41 82.93 17.51 100.55 2.67Dissolved organic carbon (mg/L) 19.41 2.74 12.64 4.93 17.93 5.34Dissolved inorganic carbon (mg/L) 4.30 0.68 18.57 3.85 21.48 0.70Calcium (mg/L) 5.63 0.40 22.00 2.33 32.29 5.08Magnesium (mg/L) 1.89 0.30 7.44 1.76 11.53 2.87Potassium (mg/L) 1.08 0.49 1.77 0.82 3.07 0.96Silica (mg/L) 0.95 0.18 0.86 0.57 0.64 0.29Total nitrogen (mg/L) 0.65 0.10 0.74 0.18 1.15 0.24Total dissolved phosphorus (�g/L) 24.65 9.16 11.07 4.59 18.69 3.26Total phosphorus (�g/L) 42.83 14.39 33.21 12.97 42.62 11.02Chlorophyll-a (�g/L) 4.41 1.37 4.05 1.83 3.50 1.54Total suspended solids (mg/L) 4.85 3.90 9.83 13.51 9.03 5.72
598 / ARCTIC, ANTARCTIC, AND ALPINE RESEARCH
as a monitoring lake because it is close to the village of Old Crow,has cultural significance to the community, and is easily accessible.
Monitoring lakes represent the three major hydrological cate-gories described by Turner et al. (2010): snowmelt dominated (3lakes), rainfall dominated (8 lakes), and evaporation dominated (3lakes) (Table 1). The lakes span OCF (see Fig. 1) and have varyingcatchment sizes (0.28 to 395.19 km2) and surface areas (0.02 to12.67 km2; Table 1). All monitoring lakes are thermokarst in originand are less than 2.5 m in depth, with the exception of OCF55,which is an oxbow lake �5.0 m deep. Catchments of the studylakes with snowmelt-dominated input waters mainly contain tall

shrubs (mean 63.6% of catchment area) and have small proportionsof dwarfed shrubs, herbs, and non-vascular plants (mean � 19.7%;Table 1). In contrast, the catchments of study lakes with rainfall-dominated and evaporation-dominated hydrology have lower pro-portions of tall shrubs (mean � 19.1% and 14.0%, respectively)and higher proportions of dwarf shrubs, herbs, and non-vascularplants (mean � 34.7% and 34.0%, respectively; Table 1). Barrenareas of exposed rock, sand, and fire scar make up a small propor-tion of land cover within lake catchment areas, with the exceptionof OCF06 where barren lands accounted for 43.6% of the catchmentarea (based on a Landsat image from 2007). This high proportionof barren land around OCF06 is due to the drainage event thatoccurred in June 2007, as well as the drainage of two neighboringlakes (Wolfe and Turner, 2008; Turner et al., 2010). Since then, alarge proportion of the exposed sediments has become re-vegetatedby grasses and sedges.
Monitoring lakes span a wide range of limnological conditionsthat are associated with hydrological categories (Table 2). Snow-melt-dominated lakes tend to have neutral pH, whereas rainfall-dominated and evaporation-dominated lakes are more basic. Snow-melt-dominated lakes have relatively low conductivity and lowconcentrations of major ions (Ca, K, Mg, Na, SiO2), rainfall-domi-nated lakes have intermediate ion content, and evaporation-domi-nated lakes have high values. Dissolved inorganic carbon (DIC)concentration displays a similar pattern among the hydrologicalcategories and is relatively low in snowmelt-dominated lakes andhigh in evaporation-dominated lakes. Although lakes in OCF arecovered by ice for up to 9 months of the year, they are highlyproductive and are meso-eutrophic to eutrophic based on total phos-phorus (TP) concentration (Table 2).
METEOROLOGICAL CONDITIONS
According to 1971–2000 climate normals at Old Crow airport(Station ID 2100800 and 2100805), average annual temperature is–9.0 �C and fluctuates substantially between summer and wintermonths. Average annual total precipitation is 265.5 mm, 60% ofwhich falls as rain (165.5 mm) from May to September. Meanmonthly air temperatures during the study period (2007–2011)were comparable to the 1971–2000 climate normals (Fig. 3, parta). Total annual precipitation between 2007 and 2011 was variableand was high in the last 2 years (417 mm and 625 mm in 2010and 2011, respectively; Fig. 3). With the exception of very wetspring conditions, total precipitation during the ice-free months(May–September) of 2007 was below average (134 mm;1971–2000 mean � 166 mm; Fig. 3, part b; Environment Canada,2012). The 2007–2008 ice-covered months experienced extremelylow snowfall and below-average winter cumulative precipitation(snow water equivalent (SWE) � 28 mm; 1951–2000 mean SWE� 100 mm; Environment Canada, 2012) and near-average cumula-tive rainfall during the 2008 ice-free season (178 mm). Wintersnowfall in 2008–2009 was above average (SWE � 134 mm),followed by high ice-free season cumulative rainfall (212 mm).The ice-covered months during 2009–2010 experienced below-average snowfall (SWE � 75 mm) and the 2010 ice-free seasonhad above-average cumulative rainfall (276 mm). Heavy snowfallduring the fall of 2010 coupled with uncharacteristically high snow-fall events in February 2011 contributed to very high winter precipi-
J. M. E. TONDU ET AL. / 599
tation in 2010–2011 (SWE � 359 mm). Cumulative ice-free sea-son rainfall reached 347 mm by September 2011, which is �200%greater than the long-term mean. Overall, precipitation during 2007and 2009 was similar to the long-term mean, 2008 was relativelydry, and precipitation during 2010 and 2011 exceeded the long-term mean (Fig. 3, part b).
MethodsWATER ISOTOPE SAMPLING AND ANALYSIS
Monitoring lakes were sampled for the analysis of water iso-tope tracers in June, July, and September from 2007 to 2009, asreported in Turner et al. (2010) and Turner (2013), and on 10 Juneand 25 August 2010 and 5–17 June and 12 September 2011. Theinitial 3 years of fieldwork included mid-season sampling in Julyto more fully characterize the hydrological behavior of lakes withinOCF, which was used as a basis for establishing the monitoringprogram. All monitoring lakes were sampled with the aid of ahelicopter equipped with pontoons, except for Mary Netro Lake(OCF58), which was always sampled from a canoe following rivertravel by motorboat and a short hike to the lake, and 5 lakes(OCF29, 35, 37, 49, and 55) that were sampled from a canoe duringa spring boat trip in 2011. Water samples were collected from 10to 15 cm below the surface at the approximate center of each lake.A hand-held GPS system was used to ensure that samples werecollected at the same location in each lake (within a maximumdistance of 150 m) during subsequent sampling trips. Samples forwater isotope analysis were collected in 30-mL high-density poly-ethylene bottles and transported to the University of Waterloo Envi-ronmental Isotope Laboratory for evaluation of oxygen and hydro-gen isotope composition.
Isotopic compositions are expressed as variations in the rela-tive abundance of the rare (heavy) isotope species of water withrespect to the common (light) isotope species. These ratios areconventionally expressed as a delta (�) value, reported as per mil(‰). Reported isotopic compositions reflect the difference betweenthe ratio of the sample and the ratio of a known standard, such that�2H or �18O � 1000 ([Rsample/Rstandard] � 1), where R is the ratioof 2H/1H or 18O/16O in the sample and standard. The internationalstandard for water is the Vienna Standard Mean Ocean Water(VSMOW), and results are normalized to �55.5‰ and �428‰,respectively, for Standard Light Antarctic Precipitation (Coplen,1996). Maximum analytical uncertainties for �18O and �2H are�0.2‰ and �2.0‰, respectively.
A constant volume Class-A evaporation pan was deployed atthe Old Crow airport from 2007 to 2009, as reported by Turner etal. (2010) and Turner (2013), and it was monitored by staff of theVuntut Gwitchin Government (VGG). We continued to monitorthe evaporation pan at the Old Crow airport again from June toAugust 2010, with the assistance of VGG staff. The evaporationpan was operated over 4 years to simulate a terminal basin (i.e.,closed-drainage) at isotopic and hydrologic steady-state, where in-flow is equal to evaporation (�SSL). The source of evaporation paninput water was from the Old Crow airport, which is supplied bygroundwater from below the permafrost zone. Water within thepan was maintained at a constant volume, and water samples werecollected weekly for isotopic analysis.
Lake hydrological conditions were evaluated using a reference
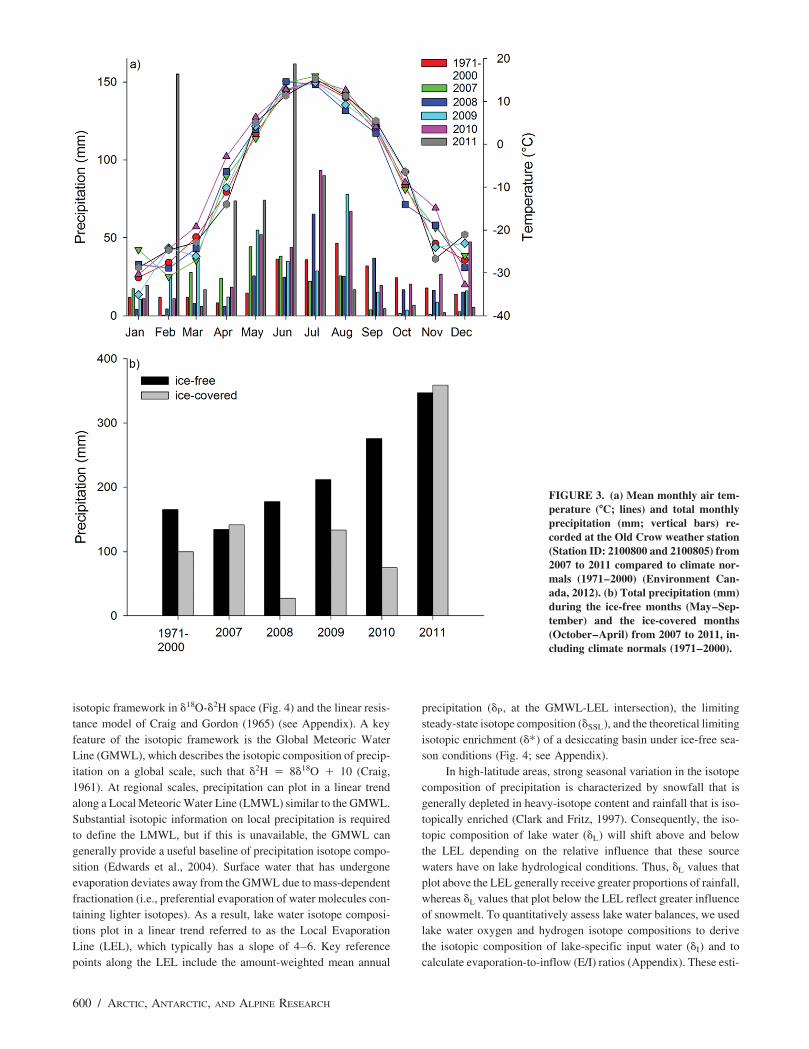
FIGURE 3. (a) Mean monthly air tem-perature (�C; lines) and total monthlyprecipitation (mm; vertical bars) re-corded at the Old Crow weather station(Station ID: 2100800 and 2100805) from2007 to 2011 compared to climate nor-mals (1971–2000) (Environment Can-ada, 2012). (b) Total precipitation (mm)during the ice-free months (May–Sep-tember) and the ice-covered months(October–April) from 2007 to 2011, in-cluding climate normals (1971–2000).
isotopic framework in �18O-�2H space (Fig. 4) and the linear resis-tance model of Craig and Gordon (1965) (see Appendix). A keyfeature of the isotopic framework is the Global Meteoric WaterLine (GMWL), which describes the isotopic composition of precip-itation on a global scale, such that �2H � 8�18O � 10 (Craig,1961). At regional scales, precipitation can plot in a linear trendalong a Local Meteoric Water Line (LMWL) similar to the GMWL.Substantial isotopic information on local precipitation is requiredto define the LMWL, but if this is unavailable, the GMWL cangenerally provide a useful baseline of precipitation isotope compo-sition (Edwards et al., 2004). Surface water that has undergoneevaporation deviates away from the GMWL due to mass-dependentfractionation (i.e., preferential evaporation of water molecules con-taining lighter isotopes). As a result, lake water isotope composi-tions plot in a linear trend referred to as the Local EvaporationLine (LEL), which typically has a slope of 4–6. Key referencepoints along the LEL include the amount-weighted mean annual
600 / ARCTIC, ANTARCTIC, AND ALPINE RESEARCH
precipitation (�P, at the GMWL-LEL intersection), the limitingsteady-state isotope composition (�SSL), and the theoretical limitingisotopic enrichment (�*) of a desiccating basin under ice-free sea-son conditions (Fig. 4; see Appendix).
In high-latitude areas, strong seasonal variation in the isotopecomposition of precipitation is characterized by snowfall that isgenerally depleted in heavy-isotope content and rainfall that is iso-topically enriched (Clark and Fritz, 1997). Consequently, the iso-topic composition of lake water (�L) will shift above and belowthe LEL depending on the relative influence that these sourcewaters have on lake hydrological conditions. Thus, �L values thatplot above the LEL generally receive greater proportions of rainfall,whereas �L values that plot below the LEL reflect greater influenceof snowmelt. To quantitatively assess lake water balances, we usedlake water oxygen and hydrogen isotope compositions to derivethe isotopic composition of lake-specific input water (�I) and tocalculate evaporation-to-inflow (E/I) ratios (Appendix). These esti-
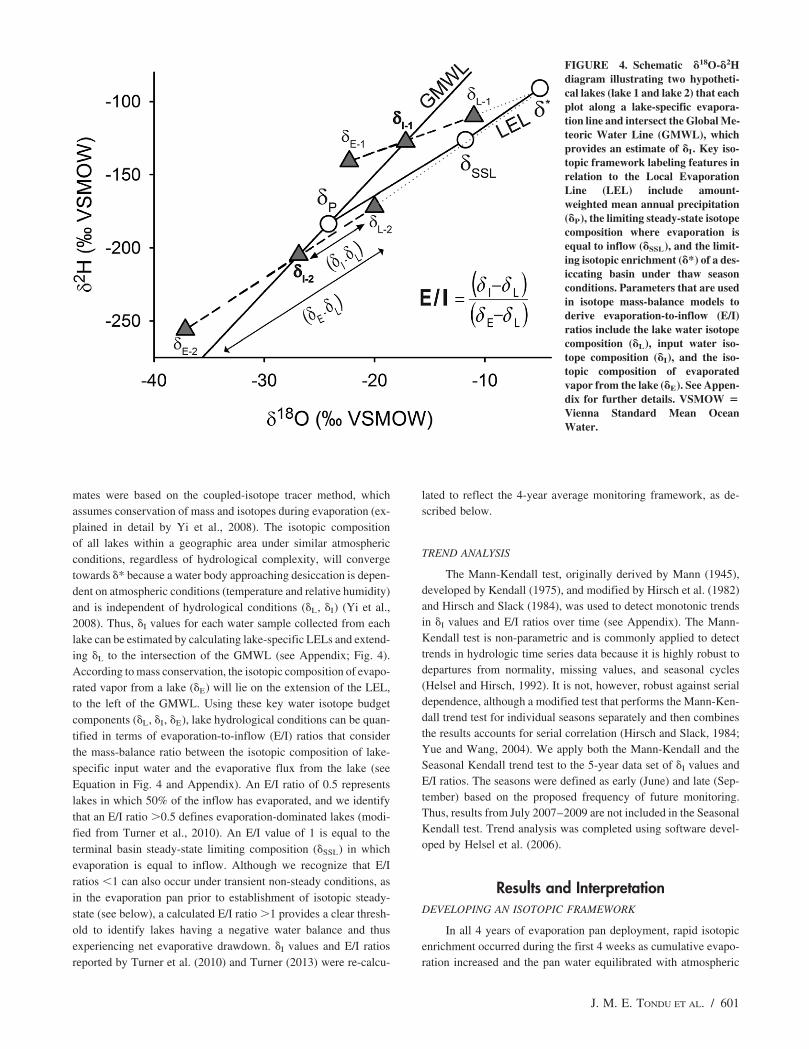
FIGURE 4. Schematic �18O-�2Hdiagram illustrating two hypotheti-cal lakes (lake 1 and lake 2) that eachplot along a lake-specific evapora-tion line and intersect the Global Me-teoric Water Line (GMWL), whichprovides an estimate of �I. Key iso-topic framework labeling features inrelation to the Local EvaporationLine (LEL) include amount-weighted mean annual precipitation(�P), the limiting steady-state isotopecomposition where evaporation isequal to inflow (�SSL), and the limit-ing isotopic enrichment (�*) of a des-iccating basin under thaw seasonconditions. Parameters that are usedin isotope mass-balance models toderive evaporation-to-inflow (E/I)ratios include the lake water isotopecomposition (�L), input water iso-tope composition (�I), and the iso-topic composition of evaporatedvapor from the lake (�E). See Appen-dix for further details. VSMOW �Vienna Standard Mean OceanWater.
mates were based on the coupled-isotope tracer method, whichassumes conservation of mass and isotopes during evaporation (ex-plained in detail by Yi et al., 2008). The isotopic compositionof all lakes within a geographic area under similar atmosphericconditions, regardless of hydrological complexity, will convergetowards �* because a water body approaching desiccation is depen-dent on atmospheric conditions (temperature and relative humidity)and is independent of hydrological conditions (�L, �I) (Yi et al.,2008). Thus, �I values for each water sample collected from eachlake can be estimated by calculating lake-specific LELs and extend-ing �L to the intersection of the GMWL (see Appendix; Fig. 4).According to mass conservation, the isotopic composition of evapo-rated vapor from a lake (�E) will lie on the extension of the LEL,to the left of the GMWL. Using these key water isotope budgetcomponents (�L, �I, �E), lake hydrological conditions can be quan-tified in terms of evaporation-to-inflow (E/I) ratios that considerthe mass-balance ratio between the isotopic composition of lake-specific input water and the evaporative flux from the lake (seeEquation in Fig. 4 and Appendix). An E/I ratio of 0.5 representslakes in which 50% of the inflow has evaporated, and we identifythat an E/I ratio �0.5 defines evaporation-dominated lakes (modi-fied from Turner et al., 2010). An E/I value of 1 is equal to theterminal basin steady-state limiting composition (�SSL) in whichevaporation is equal to inflow. Although we recognize that E/Iratios �1 can also occur under transient non-steady conditions, asin the evaporation pan prior to establishment of isotopic steady-state (see below), a calculated E/I ratio �1 provides a clear thresh-old to identify lakes having a negative water balance and thusexperiencing net evaporative drawdown. �I values and E/I ratiosreported by Turner et al. (2010) and Turner (2013) were re-calcu-
J. M. E. TONDU ET AL. / 601
lated to reflect the 4-year average monitoring framework, as de-scribed below.
TREND ANALYSIS
The Mann-Kendall test, originally derived by Mann (1945),developed by Kendall (1975), and modified by Hirsch et al. (1982)and Hirsch and Slack (1984), was used to detect monotonic trendsin �I values and E/I ratios over time (see Appendix). The Mann-Kendall test is non-parametric and is commonly applied to detecttrends in hydrologic time series data because it is highly robust todepartures from normality, missing values, and seasonal cycles(Helsel and Hirsch, 1992). It is not, however, robust against serialdependence, although a modified test that performs the Mann-Ken-dall trend test for individual seasons separately and then combinesthe results accounts for serial correlation (Hirsch and Slack, 1984;Yue and Wang, 2004). We apply both the Mann-Kendall and theSeasonal Kendall trend test to the 5-year data set of �I values andE/I ratios. The seasons were defined as early (June) and late (Sep-tember) based on the proposed frequency of future monitoring.Thus, results from July 2007–2009 are not included in the SeasonalKendall test. Trend analysis was completed using software devel-oped by Helsel et al. (2006).
Results and InterpretationDEVELOPING AN ISOTOPIC FRAMEWORK
In all 4 years of evaporation pan deployment, rapid isotopicenrichment occurred during the first 4 weeks as cumulative evapo-ration increased and the pan water equilibrated with atmospheric

FIGURE 5. (a) Isotopic evolution of �18O of water sampled from an evaporation pan maintained at the Old Crow airport from June toSeptember, 2007–2010. (b) Evaporation pan evolution is consistent among years and cluster around an average �SSL (�11.8‰ for �18Oand �126‰ for �2H). (c) A four-year mean LEL (�2H � 4.7�18O � 71.2) was extended through the isotopic composition of pan inputwater (�I-Pan) to the Global Meteoric Water Line (GMWL).
conditions (Fig. 5, part a). After the fifth week of operation eachyear, similar and relatively constant �18O and �2H values wereobtained, yielding robust estimates of �SSL (mean �18OSSL �
�11.8‰ and �2HSSL � �126‰; standard deviation (s.d.) � 0.5and 3.2, respectively; Table 3). The isotopic composition of evapo-ration pan input water was very consistent each year (mean �I-pan
� �22.1‰ for �18O and �173‰ for �2H; s.d. � 0.3 and 0.3,respectively) and plotted close to the GMWL (Fig. 5, part b). Basedon the 4-year mean �SSL and �I-Panvalues, the LEL (�2H � 4.7�18O � 71.2) was extended to the GMWL to provide an estimateof �P (�18OP � �24.3‰ and �2H � �185‰; s.d. � 0.4 and3.2, respectively). The equation provided by Gonfiantini (1986; seeAppendix) was used to calculate �* for each year (mean �* �
�4.9‰ for �18O and �90‰ for �2H; s.d. � 0.6 and 3.8, respec-tively; Fig. 5, part c). Although an evaporation pan was not main-tained in 2011, framework results likely did not deviate substan-
602 / ARCTIC, ANTARCTIC, AND ALPINE RESEARCH
tially since the flux-weighted temperature and relative humidityfor 2011 (T � 287.0 K, h � 67.1%) were similar to mean valuesfor 2007 to 2010 (T � 286.8 K and h � 65.9%; s.d. � 0.8 and3.0, respectively; Table 3).
MONITORING LAKE HYDROLOGICAL CONDITIONS WITHWATER ISOTOPES
Lake water isotope compositions (�L) obtained from the moni-toring lakes during the 2007–2011 field campaigns are superim-posed on the 4-year average isotopic framework developed fromthe evaporation pan data (Fig. 6). In general, the lake water isotopecomposition spans a broad range (�18OL � �25.8‰ to �8.7‰,and �2HL � �200‰ to �100‰) among the monitoring lakesand between the sampling periods, but distinct trends are evident.Lakes with values that are positioned below the LEL reflect a

TABLE 3
Flux-weighted ice-free season temperature and relative humidity based on WLU meteorological station set up at Old Crow airport andparameters used to construct an average isotopic framework for long-term monitoring based on 2007–2010 evaporation pan data.
Parameter 2007 2008 2009 2010 2011 Mean Stand. Dev.
T (K) 287.7 286.3 285.8 287.1 287.0 286.8 0.8h (%) 62.6 64.0 66.5 69.4 67.1 65.9 3.0�* (18O, 2H) 1.0103, 1.0910 1.0104, 1.0927 1.0105, 1.0934 1.0103, 1.0917 — 1.0104, 1.0922 0.0001, 0.0010�* (18O, 2H) ‰ 10.3, 91.0 10.4, 92.7 10.5, 93.4 10.3, 91.7 — 10.4, 92.2 0.1, 1.1�K (18O, 2H) ‰ 5.3, 4.7 5.1, 4.5 4.8, 4.2 4.3, 3.8 — 4.9, 4.3 0.4, 0.4�AS (18O, 2H) ‰ �28.8, �216 �29.5, �220 �27.8, �216 �25.8, �203 — �27.8, �214 1.5, 7.7�SSL (18O, 2H) ‰ �11.8, �127 �12.4, �129 �11.7, �127 �11.2, �122 — �11.8, �126 0.5, 3.2�* (18O, 2H) ‰ �4.1, �87 �5.6, �93 �5.2, �94 �4.9, �87 — �4.9, �90 0.6, 3.8�P (18O, 2H) ‰ �24.1, �183 �24.2, �184 �24.1, �183 �24.9, �190 — �24.3, �185 0.4, 3.2�I-pan (18O, 2H) ‰ �22.3, �173 �22.4, �173 �22.1, �174 �21.7, �173 — �22.1, �173 0.3, 0.3Slope of LEL 4.57 4.65 4.54 4.93 — 4.67 0.20
stronger influence of inputs from snowmelt relative to rainfall, andgenerally plot closer to the GMWL. In contrast, lakes that are moreinfluenced by summer rainfall have higher values and are posi-tioned above the LEL. �L values are lower in June and becomehigher by the end of the ice-free season, reflecting the seasonalisotopic evolution that is typical of high-latitude lakes as they re-ceive isotopically depleted snowmelt in spring and subsequentlyundergo evaporative isotopic enrichment during the summer. Thisgeneral seasonal cycle is evident in all 5 years, although the evolu-tion is unique to each year because of inter-annual differences inthe flux and isotopic composition of inputs (snowmelt and rainfall)and outputs (evaporation). For example, lakes in 2008 are muchmore isotopically enriched in July and September compared toother sampling years (Fig. 6), with some lakes plotting beyond�SSL because there was very low precipitation during the preceding10 months (Fig. 3).
The influence of summer rainfall is most clearly revealed in2010 and 2011 (Fig. 6, parts d and e) when lake water isotopecompositions for August and September, respectively, deviatedabove the LEL in several lakes in response to substantial rainfallevents in July and August of both years (Fig. 3). The influenceof snowmelt, rainfall, and evaporation on lake water balances issummarized in Figure 6, part f, which shows the 5-year mean �L
for each monitoring lake according to hydrological lake categoriesdefined by Turner et al. (2010). Lakes that are classified as snow-melt dominated are located below the LEL close to the GMWL,whereas rainfall-dominated lakes plot above the LEL and are closerto �SSL. An exception to this is one rainfall-dominated lake(OCF48) that plots within the isotopic range of snowmelt-domi-nated lakes. Turner et al. (2010) and MacDonald et al. (2012a)noted that this lake, in particular, oscillates between snowmelt-and rainfall-dominated categories owing to a high proportion ofwoodland and tall shrubs within the catchment area that entrapsnow. OCF48 is also located close to Timber Hill, which mayenhance shallow groundwater seepage through the active layer thatis likely derived from snowmelt. Evaporation-dominated lakes aresituated further along the LEL, and the 5-year average of one lake(OCF06) plots beyond �SSL.
The relative role of snowmelt versus rainfall on lake waterbalances was quantitatively assessed by calculating lake-specific
J. M. E. TONDU ET AL. / 603
input water isotope compositions (�I). As displayed in Figure 7,calculated �I values over the 5-year period show variation withinand among lakes. Turner et al. (2010) distinguished snowmelt-versus rainfall-dominated lakes based on the position of �I relativeto �P, such that snowmelt-dominated lakes are defined by �18OI
� �P and rainfall-dominated lakes are delineated by �18OI � �P.Using this operational metric and considering the 5-year data set,rainfall is the main contributor to most monitoring lakes (OCF06,19, 29, 34, 35, 37, 38, 46, 49, and 58), and snowmelt is a maincontributor to only OCF11 and 55. A few lakes oscillate betweenrainfall and snowmelt categories (OCF26 and 48), and their average�I values are similar to �P. Therefore, we recategorize these lakesas sourced by mean annual precipitation (‘‘�P lakes’’).
�I values for 18O were plotted versus time to explore temporaltrends in lake-specific input water for each monitoring lake(Fig. 8). The 5-year mean of �I values for each lake was calculatedand compared to the 4-year mean of �P (�24.3‰) that delineatesthe threshold between snowfall- and rainfall-dominated isotope-based hydrologic regimes (Fig. 8). Seasonally, �I values in June aretypically lower than in July and September owing to the decreasingsupply of snowmelt and increasing influence of rainfall during theice-free season. Standard deviations (reported in Table 4, part a)reveal lakes that have relatively low, moderate, and high variabilityin �I values during the 5-year data set. OCF29, 38, 48, 55, and 58show very little variability in �I values, with standard deviationsthat range from 0.6 to 0.7. Most of the monitoring lakes (OCF11,26, 34, 35, 37, and 49) display moderate variation in �I values(s.d. � 0.9 to 1.1). Lakes OCF06, 19, and 46 exhibit pronouncedseasonal and inter-annual variation in �I values, with standard de-viations �1.5.
A Mann-Kendall test showed statistically significant increas-ing monotonic trends at OCF11, 26, and 49 (OCF11: S � 48, p� 0.004; OCF26: S � 44, p � 0.003; OCF49: S �38, p � 0.011)and an emerging trend in OCF29 (S � �8, p � 0.088). A SeasonalKendall test also showed emergent trends at OCF11 (S � 12, p� 0.057) and OCF29 (S � 11, p � 0.079), but no significanttrends for any of the monitoring lakes (Table 4, part a). From 2007to 2009, both OCF11 and 26 have depleted �I signatures that arebelow �P and shift to �I values that are above �P in 2010 and 2011.An independent samples t-test of �I values from 2007–2009 and

FIG
UR
E6.
Isot
opic
com
posi
tion
ofm
onit
orin
gla
kes
(�L
)su
peri
mpo
sed
onth
efo
ur-y
ear
mea
nm
onit
orin
gis
otop
icfr
amew
ork
for
each
sam
plin
gye
ar:
(a)
2007
,(b
)20
08,
(c)
2009
,(d
)20
10,
(e)
2011
,an
d(f
)th
efi
ve-y
ear
mea
nfo
rea
chla
kedi
stin
guis
hed
byth
ehy
drol
ogic
alca
tego
ries
desi
gnat
edby
Tur
ner
etal
.(2
010)
.
604 / ARCTIC, ANTARCTIC, AND ALPINE RESEARCH
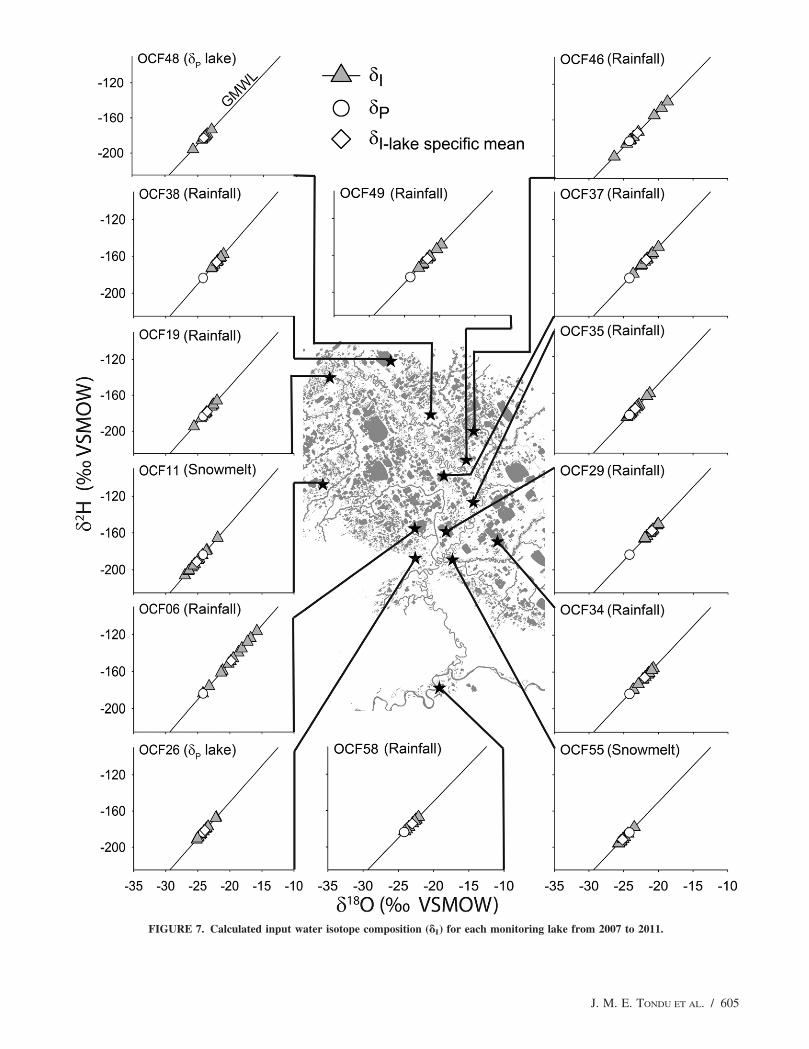
FIGURE 7. Calculated input water isotope composition (�I) for each monitoring lake from 2007 to 2011.
J. M. E. TONDU ET AL. / 605
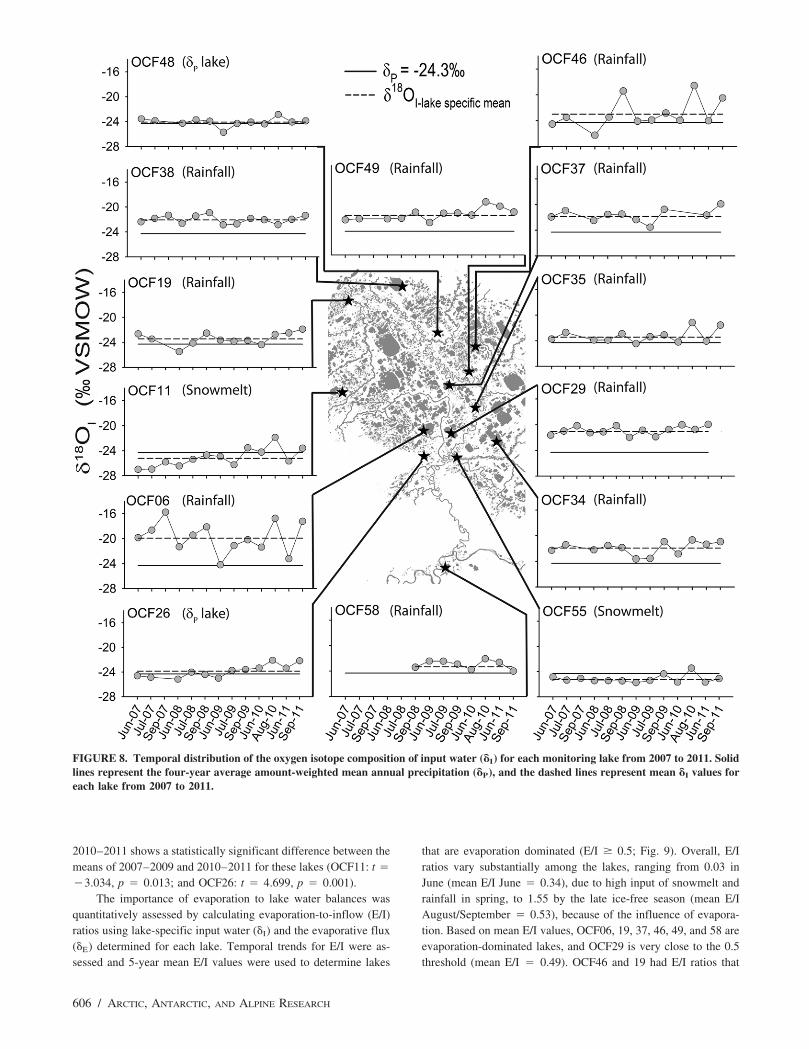
FIGURE 8. Temporal distribution of the oxygen isotope composition of input water (�I) for each monitoring lake from 2007 to 2011. Solidlines represent the four-year average amount-weighted mean annual precipitation (�P), and the dashed lines represent mean �I values foreach lake from 2007 to 2011.
2010–2011 shows a statistically significant difference between themeans of 2007–2009 and 2010–2011 for these lakes (OCF11: t �
�3.034, p � 0.013; and OCF26: t � 4.699, p � 0.001).The importance of evaporation to lake water balances was
quantitatively assessed by calculating evaporation-to-inflow (E/I)ratios using lake-specific input water (�I) and the evaporative flux(�E) determined for each lake. Temporal trends for E/I were as-sessed and 5-year mean E/I values were used to determine lakes
606 / ARCTIC, ANTARCTIC, AND ALPINE RESEARCH
that are evaporation dominated (E/I � 0.5; Fig. 9). Overall, E/Iratios vary substantially among the lakes, ranging from 0.03 inJune (mean E/I June � 0.34), due to high input of snowmelt andrainfall in spring, to 1.55 by the late ice-free season (mean E/IAugust/September � 0.53), because of the influence of evapora-tion. Based on mean E/I values, OCF06, 19, 37, 46, 49, and 58 areevaporation-dominated lakes, and OCF29 is very close to the 0.5threshold (mean E/I � 0.49). OCF46 and 19 had E/I ratios that
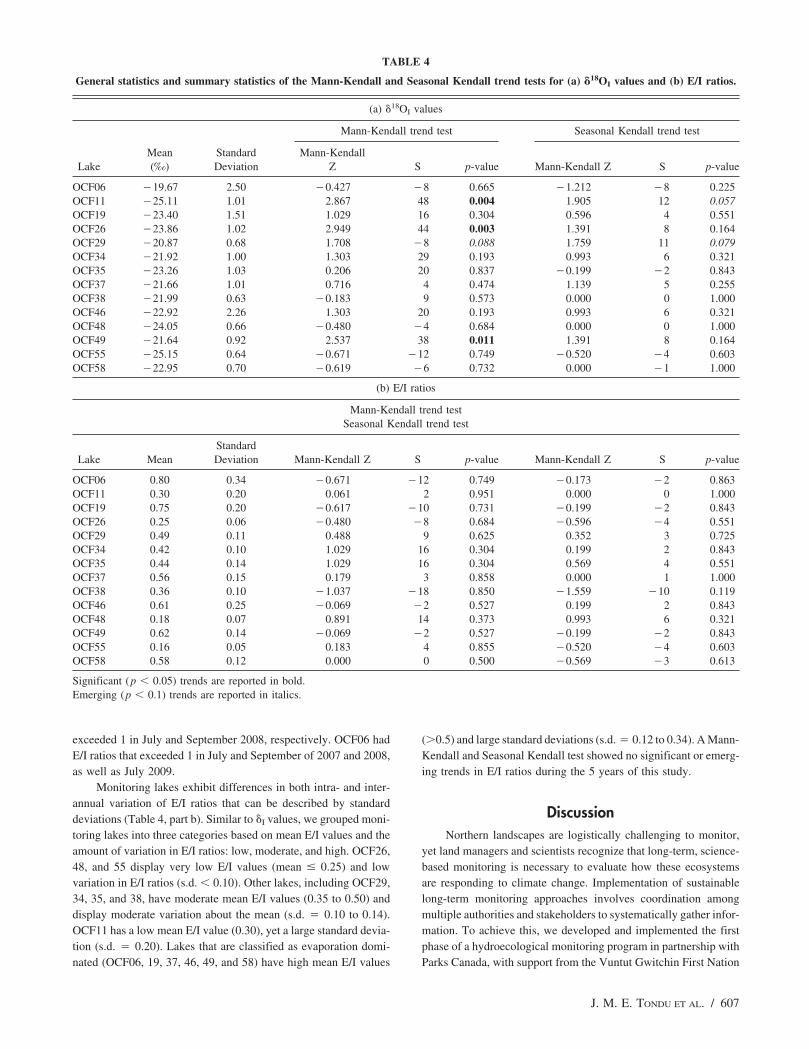
TABLE 4
General statistics and summary statistics of the Mann-Kendall and Seasonal Kendall trend tests for (a) �18OI values and (b) E/I ratios.
(a) �18OI values
Mann-Kendall trend test Seasonal Kendall trend test
Mean Standard Mann-KendallLake (‰) Deviation Z S p-value Mann-Kendall Z S p-value
OCF06 �19.67 2.50 �0.427 �8 0.665 �1.212 �8 0.225OCF11 �25.11 1.01 2.867 48 0.004 1.905 12 0.057OCF19 �23.40 1.51 1.029 16 0.304 0.596 4 0.551OCF26 �23.86 1.02 2.949 44 0.003 1.391 8 0.164OCF29 �20.87 0.68 1.708 �8 0.088 1.759 11 0.079OCF34 �21.92 1.00 1.303 29 0.193 0.993 6 0.321OCF35 �23.26 1.03 0.206 20 0.837 �0.199 �2 0.843OCF37 �21.66 1.01 0.716 4 0.474 1.139 5 0.255OCF38 �21.99 0.63 �0.183 9 0.573 0.000 0 1.000OCF46 �22.92 2.26 1.303 20 0.193 0.993 6 0.321OCF48 �24.05 0.66 �0.480 �4 0.684 0.000 0 1.000OCF49 �21.64 0.92 2.537 38 0.011 1.391 8 0.164OCF55 �25.15 0.64 �0.671 �12 0.749 �0.520 �4 0.603OCF58 �22.95 0.70 �0.619 �6 0.732 0.000 �1 1.000
(b) E/I ratios
Mann-Kendall trend testSeasonal Kendall trend test
StandardLake Mean Deviation Mann-Kendall Z S p-value Mann-Kendall Z S p-value
OCF06 0.80 0.34 �0.671 �12 0.749 �0.173 �2 0.863OCF11 0.30 0.20 0.061 2 0.951 0.000 0 1.000OCF19 0.75 0.20 �0.617 �10 0.731 �0.199 �2 0.843OCF26 0.25 0.06 �0.480 �8 0.684 �0.596 �4 0.551OCF29 0.49 0.11 0.488 9 0.625 0.352 3 0.725OCF34 0.42 0.10 1.029 16 0.304 0.199 2 0.843OCF35 0.44 0.14 1.029 16 0.304 0.569 4 0.551OCF37 0.56 0.15 0.179 3 0.858 0.000 1 1.000OCF38 0.36 0.10 �1.037 �18 0.850 �1.559 �10 0.119OCF46 0.61 0.25 �0.069 �2 0.527 0.199 2 0.843OCF48 0.18 0.07 0.891 14 0.373 0.993 6 0.321OCF49 0.62 0.14 �0.069 �2 0.527 �0.199 �2 0.843OCF55 0.16 0.05 0.183 4 0.855 �0.520 �4 0.603OCF58 0.58 0.12 0.000 0 0.500 �0.569 �3 0.613
Significant (p � 0.05) trends are reported in bold.Emerging (p � 0.1) trends are reported in italics.
exceeded 1 in July and September 2008, respectively. OCF06 hadE/I ratios that exceeded 1 in July and September of 2007 and 2008,as well as July 2009.
Monitoring lakes exhibit differences in both intra- and inter-annual variation of E/I ratios that can be described by standarddeviations (Table 4, part b). Similar to �I values, we grouped moni-toring lakes into three categories based on mean E/I values and theamount of variation in E/I ratios: low, moderate, and high. OCF26,48, and 55 display very low E/I values (mean � 0.25) and lowvariation in E/I ratios (s.d. � 0.10). Other lakes, including OCF29,34, 35, and 38, have moderate mean E/I values (0.35 to 0.50) anddisplay moderate variation about the mean (s.d. � 0.10 to 0.14).OCF11 has a low mean E/I value (0.30), yet a large standard devia-tion (s.d. � 0.20). Lakes that are classified as evaporation domi-nated (OCF06, 19, 37, 46, 49, and 58) have high mean E/I values
J. M. E. TONDU ET AL. / 607
(�0.5) and large standard deviations (s.d. � 0.12 to 0.34). A Mann-Kendall and Seasonal Kendall test showed no significant or emerg-ing trends in E/I ratios during the 5 years of this study.
DiscussionNorthern landscapes are logistically challenging to monitor,
yet land managers and scientists recognize that long-term, science-based monitoring is necessary to evaluate how these ecosystemsare responding to climate change. Implementation of sustainablelong-term monitoring approaches involves coordination amongmultiple authorities and stakeholders to systematically gather infor-mation. To achieve this, we developed and implemented the firstphase of a hydroecological monitoring program in partnership withParks Canada, with support from the Vuntut Gwitchin First Nation

FIGURE 9. Temporal distribution of evaporation-to-inflow (E/I) ratios during 2007–2011. An E/I ratio �0.5 represents the threshold forevaporation-dominated lakes and is designated by a dotted line. The dashed line at E/I � 1 represents �SSL.
and the North Yukon Renewable Resource Council. A key compo-nent of these efforts includes a commitment that future water iso-tope monitoring (to be conducted by Parks Canada in partnershipwith the Vuntut Gwitchin Government, Wilfrid Laurier University,and the University of Waterloo) will occur to provide hydrologicinformation for Vuntut National Park State of the Park reports.
608 / ARCTIC, ANTARCTIC, AND ALPINE RESEARCH
Climate warming is already pronounced in the Arctic (Vincentet al., 2011) and has the potential to cause major regime shifts inhigh-latitude inland ecosystems (Karlsson et al., 2011), the mostcritical threshold being the integrity of lake basins and the presenceor absence of water (Vincent et al., 2008). Northern lake-rich land-scapes are showing different responses to ongoing climate change

over space and time (Avis et al., 2011; Carroll et al., 2011; Karlssonet al., 2011; Roach et al., 2011; Rover et al., 2012). Thus, ongoingmonitoring that is capable of capturing the diversity of hydrologicaltrajectories is needed to adequately assess the ecological integrityof high-latitude aquatic ecosystems. The approach presented hereutilizes leading-edge water isotope tracer techniques as an effectivemonitoring tool to evaluate landscape-scale hydrological changein a northern thermokarst landscape. Water isotopes are sufficientlyaffordable and logistically feasible to incorporate into a sustainablelong-term hydroecological monitoring program. Key informationfrom this work includes 5-year characterization of lake hydrologi-cal conditions, which will be compared to results of future samplingcampaigns to evaluate multiple potential hydrological pathways inresponse to changes in climate.
Each lake selected for this study represents an individual‘‘monitoring station’’ that records the relative importance of hydro-logical drivers of lake-water balance conditions. Since hydrologicalfluxes from groundwater are generally negligible in continuouspermafrost landscapes (Woo et al., 2000), and glaciolacustrine sedi-ments underlying the OCF landscape have a low hydraulic conduc-tivity, the main components of thermokarst lake water balancescan be characterized using the isotopic metrics �I and E/I, whichevaluate the relative importance of input source water types (snow-melt and rainfall) and losses (evaporation), respectively. The �L
data collected from 2007 to 2011 show that the monitoring lakesencompass a broad range of isotopic signatures and, thus, capturethe diverse hydrological conditions in OCF (Fig. 6). This highlightsthe range of hydrological variation in OCF and reinforces the notionthat lakes will likely undergo multifaceted hydrological changesover time (Turner, 2013).
Ideally, samples for water isotope analysis should be collectedduring the early, mid, and late ice-free season, yet given the logisti-cal constraints of northern monitoring, this is not necessarily feasi-ble. �I values and E/I ratios calculated for July and September arestatistically different from each other based on a Wilcoxon signed-rank test (�I: 2007 n � 28, p � �0.001; 2008 n � 56, p �
�0.001, 2009 n � 58, p � 0.002; and E/I: 2007 n � 28, p �
�0.001; 2008 n � 56, p � 0.12; 2009 n � 58 p � �0.001,respectively). However, collecting samples during the early andlate ice-free season captures the full scope of seasonal isotopicevolution, and, therefore, we consider this sample frequency ade-quate to assess changes in hydrological conditions. Furthermore,lakes that experience high E/I ratios in July generally maintainelevated E/I ratios when sampled again in September, thus theimportance of vapor loss can still be determined by collecting sam-ples at the beginning and end of the ice-free season.
AN ISOTOPIC FRAMEWORK FOR LONG-TERM MONITORING
A framework to evaluate the isotopic evolution and waterbalance of monitoring lakes was based on 4 years of evaporationpan data and flux-weighted temperature and relative humidity. Thesimilarity of flux-weighted temperature and relative humidity dur-ing the 5-year sampling period and the agreement between isotopicframeworks developed from evaporation pan data for each year(Fig. 5, part c; Table 3) clearly demonstrates that our approach isrobust and repeatable. A meteorological station deployed withinOCF at John Charlie Lake (OCF29), located approximately 50 km
J. M. E. TONDU ET AL. / 609
north of Old Crow airport, revealed that temperature and relativehumidity recorded at the Old Crow airport by Environment Canadaand within OCF were very similar over a 3-year period (Turner,2013). Thus, temperature and relative humidity recorded by Envi-ronment Canada at the Old Crow airport are suitable for interpretingwater isotope results for future monitoring in OCF. Although wehave shown that the 4-year average isotope framework is appropri-ate for characterizing lake water balances during 2007–2011, werecommend that isotope monitoring of an evaporation pan be con-ducted every 5 years to ensure that the framework remains reflec-tive of hydroclimatic conditions.
FUTURE CONSIDERATIONS OF ONGOING WATERISOTOPE MONITORING
We present data collected over 5 years of varying meteorologi-cal conditions (Fig. 3) and show that lakes within OCF vary sub-stantially in temporal patterns of dominant source-water types (�I).�I values can be used to identify lakes that are sensitive to changesin relative inputs from snowmelt versus rainfall. Despite experienc-ing both ‘‘dry’’ and ‘‘wet’’ conditions, some lakes in OCF (29,38, 48, 55, and 58) displayed very narrow ranges in �I values overthe 5-year time period. In contrast, OCF06, 19, and 46 displayedconsiderable temporal variations in �I values throughout the dataset. This suggests that some lakes will be more sensitive to changesin snowmelt and rainfall than others, which may result in alteredlake hydrological conditions on a local scale. Increases in summerrainfall, winter rain events, and decreases in winter snowpack influ-ence the source water composition of lakes, and can potentially shiftthe water balance of snowmelt-dominated lakes toward rainfall-dominated lakes. Derksen and Brown (2012) recently showed evi-dence of pan-Arctic losses in snow cover extent, and continuedreductions in snow cover extent and snow depth may also contributeto a shift towards rainfall-dominated lakes. Reductions in ice coverextent and increasing temperatures have also been associated withchanges in Arctic vegetation (Jia et al., 2009), and Turner (2013)revealed a strong association between individual lake �I valuesand catchment characteristics such as terrestrial land cover and theability that trees have to entrap snow and minimize snow redistribu-tion. Hence, monitoring trends in �I values over time may alsoreveal hydrological changes associated with an increase in shrubcoverage that may shift lake water balance from rainfall dominatedto snowmelt dominated. Complete and partial lake drainage events,due to increased rates of thermokarst erosion and lateral expansionas temperature (Pohl et al., 2009) and precipitation rise (Wolfe andTurner, 2008), will also influence vegetation dynamics. Mackayand Burn (2002) showed that vegetation grows rapidly on the ex-posed organic-rich sediments of recently drained lake basins in asuccessional pattern from grasses and sedges, to willow and othershrubs, to alder trees and tall willows �2.0 m. For example, themargins of OCF06, a lake that drained in 2007, have become reveg-etated by grasses, sedges, and other water-tolerant plants. Thus,the edges of partially drained and completely drained lake bedswill eventually be colonized by tall shrubs that will help trap snowand enhance winter snowpack thickness. Though not all areas inthe Arctic are experiencing increases in tree growth (Osterkamp etal., 2000), local land users have observed increases in shrub sizeand coverage in OCF (ABEK, 2007).

Lakes in OCF have high surface-area-to-depth ratios, makingthem susceptible to climate-induced losses in lake area due to in-creased evaporation rates. In this study, we used calculated E/Iratios to evaluate the importance of evaporation and temporal trendson lake water balances. Lakes that possess low E/I values and lowvariability are the least sensitive to vapor loss, whereas lakes withhigh E/I values and greater variability are more responsive to evap-oration. OCF26, 48, and 55 represent lakes that are, currently, notsensitive to vapor loss. In contrast, OCF06, 19, 37, 46, 49, and 58have mean E/I ratios that surpass 0.5, indicating that evaporativewater loss exceeds 50% of the lake input. This is not to suggestthat these lakes are drying up, as they still maintain positive waterbalances. Rather they will be more sensitive to evaporative draw-down under shifting meteorological conditions that enhance ratesof evaporation. Rainfall-dominated lakes are most susceptible tobecoming evaporation dominated, and they are typically shallow,have small lake surface areas, small catchment areas, or have re-cently experienced a drainage event. Furthermore, vegetationwithin the catchments of evaporation-dominated lakes typicallyincludes high proportions of low-lying tundra vegetation that donot act as a barrier to wind-driven snow redistribution and thusgenerate less spring snowmelt (Turner, 2013). Snowmelt-domi-nated lakes are less vulnerable to water vapor loss as demonstratedduring the dry 2008 ice-free season. On the other hand, 3 lakesexceeded an E/I ratio of 1 during the 2008 ice-free season (OCF06,19, and 46), signifying that these lakes had a negative water balanceand are the most susceptible to dry conditions. If prolonged dryconditions such as these become more frequent, lakes may crossthe evaporation-dominated threshold. Several shallow lakes in theHigh Arctic have completely desiccated, while others have experi-enced reduced water levels attributed to increased evaporation/pre-cipitation ratios associated with climatic warming (Smol and Doug-las, 2007). This underscores the importance of continued isotopemonitoring to calculate E/I ratios, which identify lakes and areasin OCF that are sensitive to water-level changes due to evaporation.
To determine if hydrological conditions (i.e., �I values andE/I ratios) are changing over time, the Mann-Kendall trend test wasapplied to detect statistically significant increasing or decreasingtrends. Three lakes (OCF11, 26, and 49) display a statistically sig-nificant increasing trend in �I values, indicating that rainfall inputsbecame a greater influence on water balances for these lakes duringthe monitoring period, although this trend is not significant whenthe Seasonal Kendall trend test is applied. This may be a result ofa small sample size (�5 years of data) or the strong influence ofJuly data. Despite the lack of significant trends according to theSeasonal Kendall test, Figure 8 clearly shows that both OCF11(snowmelt dominated) and OCF26 (a �P lake) have �I values belowthe snowmelt/rainfall threshold from 2007–2009 and above thethreshold in 2010–2011 with means that are different. This is likelydue to above-average precipitation during the ice-free season of2010 and 2011. While we are cognizant that this represents a smalldata set, the test suggests that the water balances of these lakesmay transition from snowmelt-dominated to rainfall-dominated iso-topic-based hydrologic regimes due to increases in precipitationduring the ice-free season. There were no discernible trends inE/I ratios, although prolonged ice-free conditions and warmer tem-peratures may lead, in the future, to enhanced evaporative isotopic
610 / ARCTIC, ANTARCTIC, AND ALPINE RESEARCH
enrichment, which can only be determined by long-term monitoringand future trend tests.
The time series of �I values and E/I ratios presented hereprovide baseline hydrologic data that, in conjunction with the deter-mined threshold values for snowmelt- and rainfall-dominated lakes(�P � �24.3‰) and evaporation-dominated lakes (E/I � 0.5), canbe used to identify and evaluate fluctuations in the hydrologicalstatus of lakes in OCF in response to ongoing climate change. Theoutcome of this work will contribute directly to ecological integrityassessments. Parks Canada uses thresholds as a mechanism toevaluate ecological integrity and determine the ‘‘condition’’ of theecosystem (Parks Canada, 2011). The condition of the ecosystemis rated as good, fair, or poor based on a healthy composition andabundance of native species or biological communities, rates ofchange, and supporting processes (Parks Canada, 2011). While thehydrological monitoring methods presented here do not providedirect assessments of ecosystem health, they do provide a usefultool that can define isotopic-based thresholds and effectively evalu-ate the status and trends of lake hydrological conditions in OCF.Furthermore, �I values and E/I ratios are ecologically relevant hy-drological variables that influence nutrient chemistry (Table 2) andlikely aquatic communities (e.g., macrophytes and algae). Thesemetrics will provide Parks Canada, the Vuntut Gwitchin First Na-tion, and the North Yukon Renewable Resource Council with quan-titative data that will provide insight to the hydroecological re-sponses to changes in climate conditions.
ConclusionsThis paper advocates that long-term hydroecological monitor-
ing of high-latitude wetlands is essential to adequately determinechanges in ecological integrity, and that routine surveillance ofthese landscapes should be incorporated into stewardship and man-agement activities. There is substantial evidence showing that theArctic is in a state of hydrological transition, the direction of whichis varied (Hinzman et al., 2005; Rowland et al., 2010; Vincent etal., 2011). Thus, long-term data sets and monitoring are essentialto identify and understand the hydrological status and trends ofnorthern freshwater landscapes. We demonstrate that water isotopetracers are a useful monitoring tool that can be used to assess futurevulnerabilities of a suite of representative lakes in OCF to changesin input waters (snowmelt versus rainfall) and evaporation. �I val-ues distinguish snowmelt- and rainfall-dominated lakes, with �P
representing a threshold between the two isotopic-based hydrologicregimes. Lakes that display considerable variation in �I values(OCF06, 11, and 46) are more sensitive to changes in snowmelt andrainfall, which may result in altered lake hydrological conditions.Transitions in �I values from snowmelt-dominated to rainfall-domi-nated hydrology, or vice versa, may be a result of changes in cumu-lative summer rainfall, winter rain, and changes in winter snowpackassociated with precipitation levels as well as landscape vegetationthat entraps snow. A Mann-Kendall test, used to identify monotonictrends over time, revealed that 3 lakes (OCF11, 26, and 49) displaystatistically significant increasing trends in �I values and thatOCF11 and 26 may be transitioning from snowmelt dominated torainfall dominated, although a longer data set is required to beconclusive. Lake sensitivity to vapor loss was monitored usinghydrological thresholds established from E/I ratios such that E/I

ratios � 0.5 signify lakes that are evaporation dominated withpositive water balances, and E/I ratios � 1 indicate lakes that areevaporation dominated with negative water balances. Six lakes(OCF06, 19, 37, 46, 49, and 58) surpassed the 0.5 threshold andare evaporation dominated. Three of these lakes (OCF06, 19, and46) cross the significant evaporation threshold (E/I � 1), represent-ing lakes that are vulnerable to desiccation. Despite the substantialvariability in precipitation and meteorological conditions duringthe 5-year study period, the water balances of OCF29, 48, and55 showed marked hydrological resiliency. While these trends aresubject to the limitations inherent in a 5-year data set, they highlightthe diversity of hydrological conditions in OCF and reinforce thenotion that lakes will undergo multiple pathways and trajectoriesover time that can be captured using water isotope tracers. Waterisotope tracers are diagnostic indicator variables of changes insource water and evaporation, which can be coupled with remotesensing studies and climate records to support explanations of rootcauses of future hydrologic transitions here, and potentially else-where.
Changes in hydrological conditions will likely have implica-tions for water chemistry and aquatic ecology, potentially alteringthe structure and function of lake ecosystems. In recognition ofthe value and need for coordinated hydrological and ecologicalmonitoring to systematically observe the status and trends ofaquatic ecosystems, we are working towards integrating the hydro-logical monitoring program with an ecological monitoring pro-gram, protocols of which were described by MacDonald et al.(2012b). Northern ecosystem monitoring remains challenging. Yet,here we reveal how collaboration between researchers, a northerncommunity, and a government agency can develop a long-termmonitoring strategy that will serve to inform future policy and land-use management decisions. Furthermore, these approaches can bereadily adopted by other national parks and agencies that have avested interest in monitoring the hydrological status and trends ofnorthern lake-rich landscapes.
AcknowledgmentsWe would like to thank the community of Old Crow, the
Vuntut Gwitchin Government (VGG), and the North Yukon Re-newable Resource Council for accommodating and supporting thisresearch project, and the community and VGG members who haveprovided logistical support in the field, including Shel Graupe,Lance Nagwon, James Itsi, Megan Williams, Edna Kyikavichik,Dick Mahoney, Joel Peter, Danny Kassi, Mary-Jane Moses, andWilliam Josie. We are grateful to Parks Canada staff (Leila Sumi,David Frost, Esau Schafer, and Jeffrey Peter) for supporting andparticipating in sample collection as well as organizing the springboat sampling campaign. Ann Balasubramaniam, Nicholas Sidhu,and Katie Thomas provided field assistance. We appreciate thediligence of University of Waterloo EIL staff members for isotopeanalysis. Financial support for this research was provided by theNatural Sciences and Engineering Council of Canada Northern Re-search Chair Program, the Government of Canada InternationalPolar Year Program, the Polar Continental Shelf Program of Natu-ral Resources Canada, the Northern Scientific Training Programof Aboriginal Affairs and Northern Development Canada, ParksCanada, and a Natural Sciences and Engineering Research Council
J. M. E. TONDU ET AL. / 611
of Canada Canadian Graduate Scholarship and Northern ResearchInternship to Tondu.
References CitedABEK, 2007: Community Reports 2005–2006. Whitehorse, Yukon:
Arctic Borderlands Society.Arp, C. D., Jones, B. M., Urban, F. E., and Grosse, G., 2011: Hydrogeo-
morphic processes of thermokarst lakes with grounded-ice and float-ing-ice regimes on the Arctic coastal plain, Alaska. HydrologicalProcesses, 25(15): 2422–2438.
Avis, C. A., Weaver, A. J., and Meissner, K. J., 2011: Reduction inareal extent of high-latitude wetlands in response to permafrost thaw.Nature Geoscience, 4: 444–448.
Balasubramaniam, A. M., 2012: Characterizing hydro-limnological re-lationships in the shallow thermokarst lakes of the Old Crow Flats,Yukon Territory. Arctic, 65: 500–503.
Brock, B. E., Wolfe, B. B., and Edwards, T. W. D., 2007: Characteriz-ing the hydrology of shallow floodplain lakes in the Slave RiverDelta, NWT, Canada, using water isotope tracers. Arctic, Antarctic,and Alpine Research, 39: 388–401.
Carroll, M. L., Townshend, J. R. G., DiMiceli, C. M., Loboda, T.,and Sohlberg, R. A., 2011: Shrinking lakes of the Arctic: spatialrelationships and trajectory of change. Geophysical Research Letters,38: L20406, http://dx.doi.org/10.1029/2011GL049427.
Clark, I. D., and Fritz, P., 1997: Environmental Isotopes in Hydrogeol-ogy. Boca Raton, Florida: CRC Press, 328 pp.
Coplen, T. B., 1996: New guidelines for reporting stable hydrogen,carbon, and oxygen isotope-ratio data. Geochimica et CosmochimicaActa, 60: 3359–3360.
Craig, H., 1961: Isotopic variations in meteoric waters. Science, 133:1702–1703.
Craig, H., and Gordon, L. J., 1965: Deuterium and oxygen 18 variationsin the ocean and the marine atmosphere. In Tongiorgi, E. (ed.), StableIsotopes in Oceanographic Studies and Paleotemperatures. Pisa,Italy: Laboratorio di Geologia Nucleare, 9–130.
Derksen, C., and Brown, R., 2012: Spring snow cover extent reductionsin the 2008–2012 period exceeding climate model projections. Geo-physical Research Letters, 39: L19504, http://dx.doi.org/10.1029/2012gl053387.
Edwards, T. W. D., Wolfe, B. B., Gibson, J. J., and Hammarlund, D.,2004: Use of water isotope tracers in high latitude hydrology andpaleolimnology. In Pienitz, R., Douglas, M. S. V., and Smol, J. P.(eds.), Long-Term Environmental Change in Arctic and AntarcticLakes. Dordrecht, Netherlands: Springer, 187–207.
Environment Canada, 2012: National Climate Data and InformationArchive. �http://www.climate.weatheroffice.gc.ca/climateData/hourlydata e.html�.
Frey, K. E., and McClelland, J. W., 2009: Impacts of permafrost degra-dation on Arctic river biogeochemistry. Hydrological Processes,23(1): 169–182.
Frohn, R. C., Hinkel, K. M., and Eisner, W. R., 2005: Satellite remotesensing classification of thaw lakes and drained thaw lake basins onthe North Slope of Alaska. Remote Sensing of Environment, 97:116–126.
Gibson, J. J., and Edwards, T. W. D., 2002: Regional water balancetrends and evaporation-transpiration partitioning from a stable iso-tope survey of lakes in northern Canada. Global BiogeochemicalCycles, 16: 1–9.
Gibson, J. J., Edwards, T. W. D., and Prowse, T. D., 1999: Pan-derivedisotopic composition of atmospheric water vapour and its variabilityin northern Canada. Journal of Hydrology, 217: 55–74.
Gilvear, D. J., and Bradley, C., 2000: Hydrological monitoring andsurveillance for wetland conservation and management; a UK per-spective. Physics and Chemistry of the Earth (B), 25: 571–588.
Gonfiantini, R., 1986: Environmental isotopes in lake studies. In Fritz,P., and Fontes, J. C. (eds.), Handbook of Environmental IsotopeGeochemistry. Volume 2. New York: Elesvier, 113–168.

Helsel, D. R., and Hirsch, R. M., 1992: Statistical Methods in WaterResources. Amsterdam: Elsevier, 522 pp.
Helsel, D. R., Mueller, D. K., and Slack, J. R., 2006: Computer programfor the Kendall family of trend tests. Reston, Virginia: U.S. Geologi-cal Survey, �http://pubs.usgs.gov/sir/2005/5275/�.
Hinkel, K. M., Jones, B. M., Eisner, W. R., Cuomo, C. J., Beck, R.A., and Frohn, R., 2007: Methods to assess natural and anthropogenicthaw lake drainage on the western Arctic coastal plain of northernAlaska. Journal of Geophysical Research, 112: F02S16, http://dx.doi.org/10.1029/2006jf000584.
Hinzman, L. D., Bettez, N. D., Bolton, W. R., Chapin, F. S., Dyurgerov,M. B., Fastie, C. L., Griffith, B., Hollister, R. D., Hope, A., Hunting-ton, H. P., Jensen, A. M., Jia, G. J., Jorgenson, T., Kane, D. L.,Klein, D. R., Kofinas, G., Lynch, A. H., Lloyd, A. H., McGuire, A.D., Nelson, F. E., Oechel, W. C., Osterkamp, T. E., Racine, C. H.,Romanovsky, V. E., Stone, R. S., Stow, D. A., Sturm, M., Tweedie,C. E., Vourlitis, G. L., Walker, M. D., Walker, D. A., Webber, P.J., Welker, J. M., Winker, K. S., and Yoshikawa, K., 2005: Evidenceand implications of recent climate change in northern Alaska andother Arctic regions. Climatic Change, 72: 251–298.
Hirsch, R. M., and Slack, J. R., 1984: A nonparametric trend test forseasonal data with serial dependence. Water Resources Research,20: 727–732.
Hirsch, R. M., Slack, J. R., and Smith, R. A., 1982: Techniques oftrend analysis for monthly water quality data. Water Resources Re-search, 18: 107–121.
Hobbie, J. E., Peterson, B. J., Bettez, N. D., Deegan, L., O’Brien, J.,Kling, G. W., Kipphut, G. W., Bowden, W. B., and Hershey, A. E.,1999: Impacts of global change on the biogeochemistry and ecologyof an Arctic freshwater system. Polar Research, 18(2): 207–214.
Horita, J., and Wesolowski, D. J., 1994: Liquid-vapor fractionation ofoxygen and hydrogen isotopes of water from the freezing to thecritical temperature. Geochimica et Cosmochimica Acta, 58:3425–3437.
Hughes, O. L., 1972: Surficial geology of northern Yukon Territoryand northwestern District of Mackenzie Northwest Territories. Geo-logical Survey of Canada, Paper 69-36: 1–11.
Jepsen, S. M., Voss, C. I., Walvoord, M. A., Rose, J. R., Minsley, B.J., and Smith, B. D., 2012: Sensitivity analysis of lake mass balancein discontinuous permafrost: the example of disappearingTwelvemile Lake, Yukon Flats, Alaska (USA). Hydrogeology Jour-nal, 21: 185–200, http://dx.doi.org/10.1007/s10040-012-0896-5.
Jia, G. J., Epstein, H. E., and Walker, D. A., 2009: Vegetation greeningin the Canadian Arctic related to decadal warming. Journal of Envi-ronmental Monitoring, 11: 2231–2238.
Jones, B. M., Grosse, G., Arp, C. D., Jones, M. C., Walter Anthony,K. M., and Romanovsky, V. E., 2011: Modern thermokarst lakedynamics in the continuous permafrost zone, northern Seward Penin-sula, Alaska. Journal of Geophysical Research, 116: G00M03, http://dx.doi.org/10.1029/2011JG001666.
Jorgenson, M. T., and Shur, Y. L., 2007: Evolution of lakes and basinsin northern Alaska and discussion of the thaw lake cycle. Journalof Geophysical Research, 112: F02S17, http://dx.doi.org/10.1029/2006JF000531.
Karlsson, J. M., Bring, A., Peterson, G. D., Gordon, L. J., and Destouni,G., 2011: Opportunities and limitations to detect climate-related re-gime shifts in inland Arctic ecosystems through eco-hydrologicalmonitoring. Environmental Research Letters, 6: http://dx.doi.org/10.1088/1748-9326/6/1/0140159.
Karlsson, J. M., Lyon, S. W., and Destouni, G., 2012: Thermokarstlake, hydrological flow and water balance indicators of permafrostchange in Western Siberia. Journal of Hydrology, 464/465: 459–466,http://dx.doi.org/10.1016/j.jhydrol.2012.07.037.
Kendall, M. G., 1975: Rank Correlation Methods. London: CharlesGriffin.
Kokelj, S. V., and Jorgenson, M. T., 2013: Advances in thermokarstresearch. Permafrost and Periglacial Processes, 24: 108–119.
Kokelj, S. V., Jenkins, R. E., Milburn, D., Burn, C. R., and Snow, N.,2005: The influence of thermokarst disturbance on the water quality
612 / ARCTIC, ANTARCTIC, AND ALPINE RESEARCH
of small upland lakes, Mackenzie Delta region, Northwest Territo-ries, Canada. Permafrost and Periglacial Processes, 16(4): 343–353.
Kokelj, S. V., Zajdlik, B., and Thompson, M. S., 2009: The impactsof thawing permafrost on the chemistry of lakes across the subarcticboreal-tundra transition, Mackenzie Delta region, Canada. Perma-frost and Periglacial Processes, 20(2): 185–199.
Labrecque, S., Lacelle, D., Duguay, C. R., Lauriol, B., and Hawkings,J., 2009: Contemporary (1951–2001) evolution of lakes in the OldCrow Basin, northern Yukon, Canada: remote sensing, numericalmodeling, and stable isotope analysis. Arctic, 62: 225–238.
Lauriol, B., Duguay, C. R., and Riel, A., 2002: Response of the Porcu-pine and Old Crow Rivers in northern Yukon, Canada, to Holoceneclimatic change. The Holocene, 12: 27–34.
Lovett, G. M., Burns, D. A., Driscoll, C. T., Jenkins, J. C., Mitchell,M. J., Rustad, L., Shanley, J. B., Likens, G. E., and Haeuber, R.,2007: Who needs environmental monitoring? Frontiers in Ecologyand the Environment, 5: 253–260.
MacDonald, L. A., Turner, K. W., Balasubramaniam, A. M., Wolfe,B. B., Hall, R. I., and Sweetman, J. N., 2012a: Tracking hydrologicalresponses of a thermokarst lake in the Old Crow Flats (Yukon Terri-tory, Canada) to recent climate variability using aerial photographsand paleolimnological methods. Hydrological Processes, 26:117–129.
MacDonald, L. A., Balasubramaniam, A. M., Hall, R. I., and Wolfe,B. B., 2012b: Developing biomonitoring protocols for shallow Arcticlakes using diatoms and artificial substrate samplers. Hydrobiologia,683: 231–248.
Mackay, J. R. and Burn, C. R., 2002: The first 20 years (1978–1979to 1998–1999) of ice-wedge growth at the Illisarvik experimentaldrained lake site, western Arctic coast, Canada. Canadian Journalof Earth Sciences, 39: 95–111.
Mann, H. B., 1945: Nonparametric tests against trend. Enconometrica,13: 245–259.
Marsh, P., Russell, M., Pohl, S., Haywood, H., and Onclin, C., 2009:Changes in thaw lake drainage in the Western Canadian Arctic from1950 to 2000. Hydrological Processes, 23(1): 145–158.
Mezquida, J. A., Fernandez, A., Lucio, J. V., and Yanguas, M. A. M.,2005: A framework for designing ecological monitoring programsfor protected areas: a case study of the Galachos del Ebro NatureReserve (Spain). Environmental Management, 35: 20–33.
Osterkamp, T. E., Viereck, L., Shur, Y. L., Jorgenson, M. T., Racine,C. H., Doyle, A., and Boone, R. D., 2000: Observations of ther-mokarst and its impact on boreal forests in Alaska, USA. Arctic,Antarctic, and Alpine Research, 32: 303–315.
Ovenden, L., 1982: Vegetation history of a polygonal peatland, north-ern Yukon. Boreas, 11: 209–223.
Ovenden, L., and Brassard, G. R., 1989: Wetland vegetation near OldCrow, northern Yukon. Canadian Journal of Botany, 67: 954–960.
Parks Canada Agency, 2009: State of the park report, Vuntut NationalPark. Ottawa: Parks Canada Agency, 58 pp.
Parks Canada Agency, 2011: Consolidated guidelines for ecologicalintegrity monitoring in Canada’s national parks. Ottawa: Parks Can-ada Agency, 115 pp.
Payette, S., 2004: Accelerated thawing of subarctic peatland permafrostover the last 50 years. Geophysical Research Letters, 31: L18208,http://dx.doi.org/10.1029/2004gl020358.
Plug, L. J., Walls, C., and Scott, B. M., 2008: Tundra lake changesfrom 1978 to 2001 on the Tuktoyaktuk Peninsula, western CanadianArctic. Geophysical Research Letters, 35(3): L03502, http://dx.doi.org/10.1029/2007gl032303.
Pohl, S., Marsh, P., Onclin, C., and Russell, M., 2009: The summerhydrology of a small upland tundra thaw lake: implications to lakedrainage. Hydrological Processes, 23: 2536–2546.
Prowse, T. D., Furgal, C., Wrona, F. J., and Reist, J. D., 2009: Implica-tions of climate change for northern Canada: freshwater, marine, andterrestrial ecosystems. Ambio, 35: 282–289.
Rautio, M., Dufresne, F., Laurion, I., Bonilla, S., Vincent, W. F., andChristoffersen, K. S., 2011: Shallow freshwater ecosystems of thecircumpolar Arctic. Ecoscience, 18: 204–222.

Riordan, B., Verbyla, D., and McGuire, A. D., 2006: Shrinking pondsin subarctic Alaska based on 1950–2002 remotely sensed images.Journal of Geophysical Research, 111(G4): http://dx.doi.org/10.1029/2005jg000150.
Roach, J., Griffith, B., Verbyla, D., and Jones, J., 2011: Mechanismsinfluencing changes in lake area in Alaskan boreal forest. GlobalChange Biology, 17(8): 2567–2583.
Rover, J., Ji, L., Wylie, B. K., and Tieszen, L. L., 2012: Establishingwater body areal extent trends in interior Alaska from multi-temporalLandsat data. Remote Sensing Letters, 3(7): 595–604.
Rowland, J. C., Jones, C. E., Altman, G., Bryan, R., Crosby, B. T.,Geernaert, G. L., Hinzman, L. D., Kane, D. L., Lawrence, D. M.,Mancino, A., Marsh, P., McNamara, J. P., Romanovsky, V. E., Toni-olo, H., Travis, B. J., Tochim, E., and Wilson, C. J., 2010: Arcticlandscapes in transition: responses to thawing permafrost. EOS,Transactions, American Geophysical Union, 91(26): 229–230.
Roy-Leveillee, P., and Burn, C. R., 2011: Permafrost conditions nearshorelines of oriented lakes in Old Crow Flats, Yukon Territory.Calgary: Canadian Geotechnical Society, 63rd Canadian Geotechni-cal Conference and 6th Canadian Permafrost Conference,1509–1516.
Schindler, D. W., and Smol, J. P., 2006: Cumulative effects of climatewarming and other human activities on freshwaters of Arctic andsubarctic North America. Ambio, 35: 160–168.
Smith, L. C., Sheng, Y., MacDonald, G. M., and Hinzman, L. D., 2005:Disappearing arctic lakes. Science, 308: 1429–1429.
Smol, J. P., and Douglas, M. S. V., 2007: Crossing the final ecologicalthreshold in high Arctic ponds. Proceedings of the National Academyof Sciences of the United States of America, 104: 12395–12397.
Smol, J. P., Wolfe, A. P., Birks, H. J. B., Douglas, M. S. V., Jones,V. J., Korhola, A., Pienitz, R., Ruhland, K., Sorvari, S., Antoniades,D., Brooks, S. J., Fallu, M.-A., Hughes, M., Keatley, B. E., Laing,T. E., Michelutti, N., Nazarova, L., Nyman, M., Paterson, A. M.,Perren, B., Quinlan, R., Rautio, M., Saulnier-Talbot, E., Siitonen,S., Solovieva, N., and Weckstrom, J., 2005: Climate-driven regimeshifts in the biological communities of Arctic lakes. Proceedings ofthe National Academy of Sciences of the United States of America,102: 4397–4402.
Sokal, M. A., Hall, R. I., and Wolfe, B. B., 2008: Relationships betweenhydrological and limnological conditions in lakes of the Slave RiverDelta (NWT, Canada) and quantification of their roles on sedimen-tary diatom assemblages. Journal of Paleolimnology, 39(4):533–550.
Turner, K. W., 2013: Investigation the hydrology of a thermokarstlandscape (Old Crow Flats, Yukon, Canada) using water isotopetracers. PhD thesis, Geography and Environmental Studies, WilfridLaurier University, Waterloo, Ontario, Canada, 193 pp.
Turner, K. W., Wolfe, B. B., and Edwards, T. W. D., 2010: Characteriz-ing the role of hydrological processes on lake water balances in theOld Crow Flats, Yukon Territory, Canada, using water isotopetracers. Journal of Hydrology, 386: 103–117.
Vaughan, H., Brydges, T., Fenech, A., and Lumb, A., 2001: Monitoringlong-term ecological changes through the ecological monitoring andassessment network: science-based and policy relevant. Environmen-tal Monitoring and Assessment, 67: 3–28.
Vincent, W. F., Hobbie, J. E., and Laybourn-Parry, J., 2008: Introduc-tion to the limnology of high-latitude lake and river ecosystems. InVincent, W. F., and Laybourn-Parry, J. (eds.), Polar Lakes and Riv-ers. Oxford: Oxford University Press, 1–23.
Vincent, W. F., Callaghan, T. V., Dahl-Jensen, D., Johansson, M.,
J. M. E. TONDU ET AL. / 613
Kovacs, K. M., Michel, C., Prowse, T., Reist, J., and Sharp, M.,2011: Ecological implications of changes in the Arctic cryosphere.Ambio, 40: 87–99.
White, D. M., Gerlach, C. S., Loring, P., Tidwell, A. C., and Chambers,M. C., 2007: Food and water security in a changing Arctic climate.Environmental Research Letters, 2: http://dx.doi.org/10.1088/1748-9326/2/4/045018.
Wiklund, J. A., Hall, R. I., and Wolfe, B. B., 2012: Timescales ofhydrolimnological change in floodplain lakes of the Peace-AthabascaDelta, northern Alberta, Canada. Ecohydrology, 5(3): 351–367.
Wolfe, B. B., and Turner, K. W., 2008: Near record precipitation causesrapid drainage of Zelma Lake, Old Crow Flats, northern Yukon Terri-tory. Meridian, Sping: 7–12.
Wolfe, B. B., Karst-Riddoch, T. L., Hall, R. I., Edwards, T. W. D.,English, M. C., Palmini, R., McGowan, S., Leavitt, P. R., and Vardy,S. R., 2007: Classification of hydrological regimes of northern flood-plain basins (Peace-Athabasca Delta, Canada) from analysis of stableisotopes (�18O, �2H) and water chemistry. Hydrological Processes,21: 151–168.
Wolfe, B. B., Light, E. M., Macrae, M. L., Hall, R. I., Eichel, K.,Jasechko, S., White, J., Fishback, L., and Edwards, T. W. D., 2011a:Divergent hydrological responses to 20th century climate changein shallow tundra ponds, western Hudson Bay Lowlands. Geophysi-cal Research Letters, 38: L23402, http://dx.doi.org/10.1029/2011gl049766.
Wolfe, B. B., Humphries, M. M., Pisaric, M. F. J., Balasubramaniam,A. M., Burns, C. R., Chan, L., Cooley, D., Froese, D. G., Graupe,S., Hall, R. I., Lantz, T., Porter, T. J., Roy-Leveillee, P., Turner, K.W., Wesche, S. D., and Williams, M., 2011b: Environmental changeand traditional use of the Old Crow Flats in northern Canada: anIPY opportunity to meet the challenges of the new northern researchparadigm. Arctic, 64: 127–135.
Woo, M. K., Marsh, P., and Pomeroy, J. W., 2000: Snow, frozen soils,and permafrost hydrology in Canada, 1995–1998. Hydrological Pro-cesses, 14: 1591–1611.
Wrona, F. J., Prowse, T. D., Reist, J. D., Hobbie, J. E., Levesque, L.M. J., and Vincent, W. F., 2006: Climate change effects on aquaticbiota, ecosystem structure and function. Ambio, 35: 359–369.
Yi, Y., Brock, B. E., Falcone, M. D., Wolfe, B. B., and Edwards, T.W. D., 2008: A coupled isotope tracer method to characterize inputwater to lakes. Journal of Hydrology, 350: 1–13.
Yoshikawa, K., and Hinzman, L. D., 2003: Shrinking thermokarstponds and groundwater dynamics in discontinuous permafrost nearCouncil, Alaska. Permafrost and Periglacial Processes, 14:151–160.
Yue, S., and Wang, C., 2004: The Mann-Kendall test modified byeffective sample size to detect trend in serially correlated hydrologi-cal series. Water Resources Research, 18: 201–218.
Yukon Ecoregions Working Group, 2004: Old Crow Flats. In Smith,C. A. S., Meikle, J. C., and Roots, C. F. (eds.), Ecoregions of theYukon Territory: Biophysical Properties of Yukon Landscapes. Sum-merland, British Columbia: Agriculture and Agri-Foods Canada,115–123.
Zazula, G. D., Duk-Rodkin, A., Schweger, C. E., and Morlan, R. E.,2004: Late Pleistocene chronology of Glacial Lake Old Crow andthe north-west margin of the Laurentide Ice Sheet. In Ehlers, J., andGibbard, P. L. (eds.), Quaternary Glaciations—Extent and Chronol-ogy. Part II: Amsterdam: Elsevier, 347–342.
MS accepted August 2013
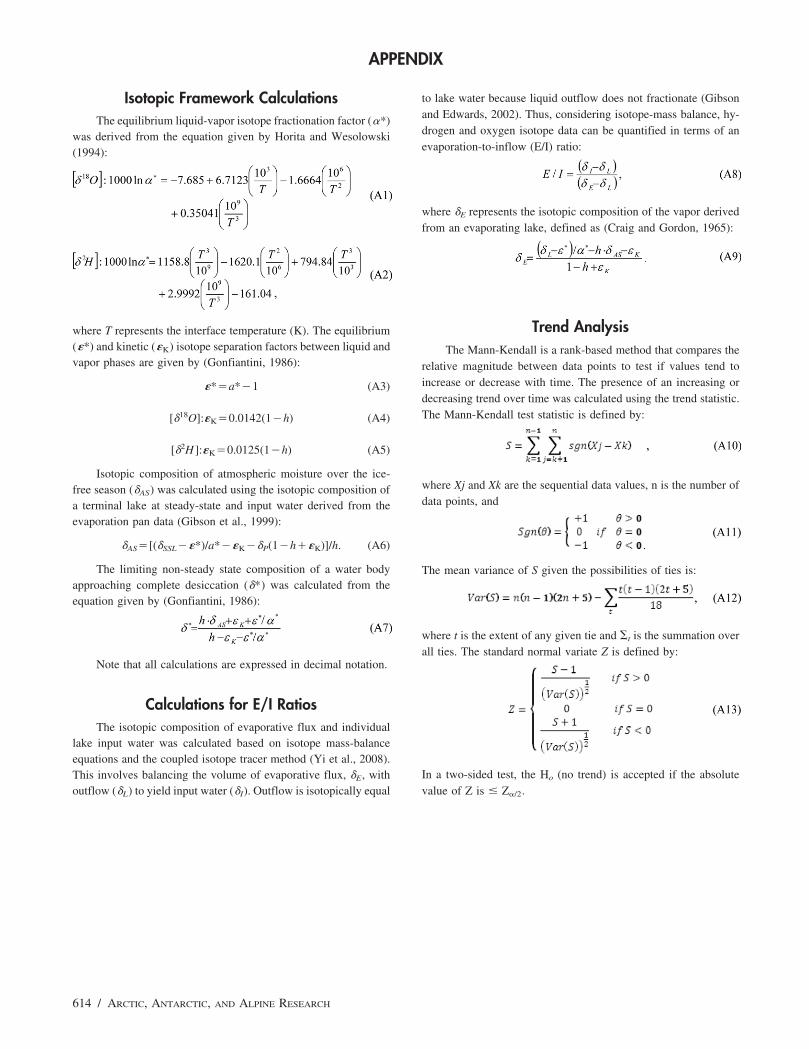
APPENDIX
Isotopic Framework CalculationsThe equilibrium liquid-vapor isotope fractionation factor (�*)
was derived from the equation given by Horita and Wesolowski(1994):
where T represents the interface temperature (K). The equilibrium(�*) and kinetic (�K) isotope separation factors between liquid andvapor phases are given by (Gonfiantini, 1986):
�*�a*�1 (A3)
[�18O]:�K�0.0142(1�h) (A4)
[�2H ]:�K�0.0125(1�h) (A5)
Isotopic composition of atmospheric moisture over the ice-free season (�AS) was calculated using the isotopic composition ofa terminal lake at steady-state and input water derived from theevaporation pan data (Gibson et al., 1999):
�AS�[(�SSL��*)/a*��K��P(1�h��K)]/h. (A6)
The limiting non-steady state composition of a water bodyapproaching complete desiccation (�*) was calculated from theequation given by (Gonfiantini, 1986):
Note that all calculations are expressed in decimal notation.
Calculations for E/I RatiosThe isotopic composition of evaporative flux and individual
lake input water was calculated based on isotope mass-balanceequations and the coupled isotope tracer method (Yi et al., 2008).This involves balancing the volume of evaporative flux, �E, withoutflow (�L) to yield input water (�I). Outflow is isotopically equal
614 / ARCTIC, ANTARCTIC, AND ALPINE RESEARCH
to lake water because liquid outflow does not fractionate (Gibsonand Edwards, 2002). Thus, considering isotope-mass balance, hy-drogen and oxygen isotope data can be quantified in terms of anevaporation-to-inflow (E/I) ratio:
where �E represents the isotopic composition of the vapor derivedfrom an evaporating lake, defined as (Craig and Gordon, 1965):
Trend AnalysisThe Mann-Kendall is a rank-based method that compares the
relative magnitude between data points to test if values tend toincrease or decrease with time. The presence of an increasing ordecreasing trend over time was calculated using the trend statistic.The Mann-Kendall test statistic is defined by:
where Xj and Xk are the sequential data values, n is the number ofdata points, and
The mean variance of S given the possibilities of ties is:
where t is the extent of any given tie and �t is the summation overall ties. The standard normal variate Z is defined by:
In a two-sided test, the Ho (no trend) is accepted if the absolutevalue of Z is � Z�/2.
Related Documents