sensors Article Aerial Mapping of Forests Affected by Pathogens Using UAVs, Hyperspectral Sensors, and Artificial Intelligence Juan Sandino 1, * ID , Geoff Pegg 2 ID , Felipe Gonzalez 1 ID and Grant Smith 3 ID 1 Insitute for Future Environments; Robotics and Autonomous Systems, Queensland University of Technology (QUT), 2 George St, Brisbane City, QLD 4000, Australia; [email protected] 2 Horticulture & Forestry Science, Department of Agriculture & Fisheries, Ecosciences Precinct, 41 Boggo Rd Dutton Park, QLD 4102, Australia; [email protected] 3 BioProtection Technologies, The New Zealand Institute for Plant & Food Research Limited, Gerald St, Lincoln 7608, New Zealand; [email protected] * Correspondence: [email protected]; Tel.: +61-7-3138-1363 Received: 22 February 2018; Accepted: 21 March 2018; Published: 22 March 2018 Abstract: The environmental and economic impacts of exotic fungal species on natural and plantation forests have been historically catastrophic. Recorded surveillance and control actions are challenging because they are costly, time-consuming, and hazardous in remote areas. Prolonged periods of testing and observation of site-based tests have limitations in verifying the rapid proliferation of exotic pathogens and deterioration rates in hosts. Recent remote sensing approaches have offered fast, broad-scale, and affordable surveys as well as additional indicators that can complement on-ground tests. This paper proposes a framework that consolidates site-based insights and remote sensing capabilities to detect and segment deteriorations by fungal pathogens in natural and plantation forests. This approach is illustrated with an experimentation case of myrtle rust (Austropuccinia psidii) on paperbark tea trees (Melaleuca quinquenervia) in New South Wales (NSW), Australia. The method integrates unmanned aerial vehicles (UAVs), hyperspectral image sensors, and data processing algorithms using machine learning. Imagery is acquired using a Headwall Nano-Hyperspec R camera, orthorectified in Headwall SpectralView R , and processed in Python programming language using eXtreme Gradient Boosting (XGBoost), Geospatial Data Abstraction Library (GDAL), and Scikit-learn third-party libraries. In total, 11,385 samples were extracted and labelled into five classes: two classes for deterioration status and three classes for background objects. Insights reveal individual detection rates of 95% for healthy trees, 97% for deteriorated trees, and a global multiclass detection rate of 97%. The methodology is versatile to be applied to additional datasets taken with different image sensors, and the processing of large datasets with freeware tools. Keywords: Austropuccinia psidii; drones; hyperspectral camera; machine learning; Melaleuca quinquenervia; myrtle rust; non-invasive assessment; paperbark; unmanned aerial vehicles (UAV); xgboost 1. Introduction Exotic pathogens have caused irreversible damage to flora and fauna within a range of ecosystems worldwide. Popular outbreaks include the enormous devastations of chestnut blight (Endothia parasitica) on American chestnut trees (Castanea dentata) in the U.S. [1–3], sudden oak death (Phytophthora ramorum) on oak populations (Quercus agrifolia) in Europe, California, and Oregon [4–6], dieback (Phytophthora cinnamomi) on hundreds of hosts globally [7–9], and myrtle rust (Austropuccinia psidii) on Myrtaceae family plants in Australia [10–13]. The effects of the latter case have Sensors 2018, 18, 944; doi:10.3390/s18040944 www.mdpi.com/journal/sensors

Welcome message from author
This document is posted to help you gain knowledge. Please leave a comment to let me know what you think about it! Share it to your friends and learn new things together.
Transcript

sensors
Article
Aerial Mapping of Forests Affected by PathogensUsing UAVs, Hyperspectral Sensors, andArtificial Intelligence
Juan Sandino 1,* ID , Geoff Pegg 2 ID , Felipe Gonzalez 1 ID and Grant Smith 3 ID
1 Insitute for Future Environments; Robotics and Autonomous Systems, Queensland University of Technology(QUT), 2 George St, Brisbane City, QLD 4000, Australia; [email protected]
2 Horticulture & Forestry Science, Department of Agriculture & Fisheries, Ecosciences Precinct,41 Boggo Rd Dutton Park, QLD 4102, Australia; [email protected]
3 BioProtection Technologies, The New Zealand Institute for Plant & Food Research Limited, Gerald St,Lincoln 7608, New Zealand; [email protected]
* Correspondence: [email protected]; Tel.: +61-7-3138-1363
Received: 22 February 2018; Accepted: 21 March 2018; Published: 22 March 2018�����������������
Abstract: The environmental and economic impacts of exotic fungal species on natural and plantationforests have been historically catastrophic. Recorded surveillance and control actions are challengingbecause they are costly, time-consuming, and hazardous in remote areas. Prolonged periods oftesting and observation of site-based tests have limitations in verifying the rapid proliferation ofexotic pathogens and deterioration rates in hosts. Recent remote sensing approaches have offeredfast, broad-scale, and affordable surveys as well as additional indicators that can complementon-ground tests. This paper proposes a framework that consolidates site-based insights andremote sensing capabilities to detect and segment deteriorations by fungal pathogens in naturaland plantation forests. This approach is illustrated with an experimentation case of myrtle rust(Austropuccinia psidii) on paperbark tea trees (Melaleuca quinquenervia) in New South Wales (NSW),Australia. The method integrates unmanned aerial vehicles (UAVs), hyperspectral image sensors,and data processing algorithms using machine learning. Imagery is acquired using a HeadwallNano-Hyperspec R© camera, orthorectified in Headwall SpectralView R©, and processed in Pythonprogramming language using eXtreme Gradient Boosting (XGBoost), Geospatial Data AbstractionLibrary (GDAL), and Scikit-learn third-party libraries. In total, 11,385 samples were extracted andlabelled into five classes: two classes for deterioration status and three classes for background objects.Insights reveal individual detection rates of 95% for healthy trees, 97% for deteriorated trees, anda global multiclass detection rate of 97%. The methodology is versatile to be applied to additionaldatasets taken with different image sensors, and the processing of large datasets with freeware tools.
Keywords: Austropuccinia psidii; drones; hyperspectral camera; machine learning;Melaleuca quinquenervia; myrtle rust; non-invasive assessment; paperbark; unmanned aerialvehicles (UAV); xgboost
1. Introduction
Exotic pathogens have caused irreversible damage to flora and fauna within a range ofecosystems worldwide. Popular outbreaks include the enormous devastations of chestnut blight(Endothia parasitica) on American chestnut trees (Castanea dentata) in the U.S. [1–3], sudden oakdeath (Phytophthora ramorum) on oak populations (Quercus agrifolia) in Europe, California, andOregon [4–6], dieback (Phytophthora cinnamomi) on hundreds of hosts globally [7–9], and myrtle rust(Austropuccinia psidii) on Myrtaceae family plants in Australia [10–13]. The effects of the latter case have
Sensors 2018, 18, 944; doi:10.3390/s18040944 www.mdpi.com/journal/sensors

Sensors 2018, 18, 944 2 of 17
raised national alerts and response programmes given the extensive host range and the ecological andeconomic importance of Myrtaceae plants in the Australian environment [14–17]. As a result, varioussurveillance and eradication programmes have been applied in an attempt to minimise the impactsinvasive pathogens cause on local hosts such as dieback in the Western Australia Jarrah forests [18],sudden oak death in the tan oak forests of the U.S. [19], and rapid ohia death (Ceratocystis fimbriata) onohia trees (Metrosideros polymorpha) in Hawaii [20].
Modern surveillance methods to map hosts vulnerable to and affected by exotic pathogens canbe classified in site-based and remote sensing methods, according to Lawley et al. [21]. Site-basedapproaches are commonly small regions used to collect exhaustive compositional and structuralindicators of vegetation condition with a strong focus on biophysical attributes of single vegetationcommunities [22,23]. These methods, nonetheless, require deep expertise and time to conductexperimentation, data collection, and validation that, along with their limited area they can cover,represent a challenge while assessing effects on a broad scale [24]. Research has also suggestedthe design of decision frameworks to monitor and control the most threatened species [17,25,26].Although these models can determine flora species that require immediate management control,limitations on the amount of tangible, feasible, and broad quantified data of vulnerable host areas [21]have resulted in lack of support from state and federal governments [11].
The role of remote sensing methods to assess and quantify the impacts of invasive pathogens inbroad scale has increased exponentially [27,28]. Standard approaches comprise the use of spectral andimage sensors through satellite, manned, and unmanned aircraft technology [29]. Concerning sensingtechnology by itself, applied methods by research communities include the use of non-imagingspectroradiometers, fluorescence, multispectral, hyperspectral, and thermal cameras, and lightdetection and ranging (LiDAR) technology [30–33]. These equipment are usually employed for thecalculation of spectral indexes [34–37] and regression models in the host range [38,39]. Nevertheless,these methods are mainly focused on quantification and distribution, among other physical propertiesof flora species.
Satellite and manned aircraft surveys have reported limitations concerning resolution,operational costs, and unfavourable climate conditions (e.g., cloudiness and hazard winds) [40].In contrast, the continuous development of unmanned aerial vehicles (UAVs) designs, navigationsystems, portable image sensors and cutting-edge machine learning methods allow unobtrusive,accurate, and versatile surveillance tools in precision agriculture and biosecurity [41–44]. Many studieshave positioned UAVs for the collection of aerial imagery in applications such as weed, disease,and pest mapping and wildlife monitoring [21,45–47]. More recently, unmanned aerial systems (UASs)have been deployed in cluttered and global positioning system (GPS)-denied environments [48].
Approaches to the use of UAVs, hyperspectral imagery and artificial intelligence are gainingpopularity. For example, Aasen et al. [49] deployed UAS to boost vegetation monitoring efforts usinghyperspectral three-dimensional (3D) imagery. The authors of Nasi et al. [50] developed techniques toassess pest damages at canopy levels using spectral indexes and k-nearest neighbour (k-NN) classifiers,achieving global detection rates of 90%. Similar research focused on disease monitoring, however,has been limited. The authors of Calderon et al. [51], for instance, evaluated the early detectionand quantification of verticillium wilt in olive plants using support vector machines (SVMs) andlinear discriminant analysis (LDA), obtaining mixed accuracy results among the evaluated classes ofinfection severity (59–75%) [52]. The authors of Albetis et al. [53] presented a system to discriminateasymptomatic and symptomatic red and white vineyard cultivars by Flavescence doree, using UAVs,multispectral imagery, and up to 20 data features, collecting contrasting results between the cultivarsand maximum accuracy rates of 88%. In sum, the integration of site-based and remote sensingframeworks have boosted the capabilities of these surveillance solutions by combining data fromabiotic and biotic factors and spectral responses, respectively [54]. However, this synthesis is stillchallenging due to the high number of singularities, data correlation, and validation procedurespresented in each case study.

Sensors 2018, 18, 944 3 of 17
Considering the importance of site-based and remote sensing methods to obtain reliableand broader assessments of forest health, specifically, for pest and fungal assessments [55],this paper presents an integrated system that classifies and maps natural and plantation forestsexposed and deteriorated by fungal pathogens using UAVs, hyperspectral sensors, and artificialintelligence. The framework is exemplified by a case study of myrtle rust on paperbark tea trees(Melaleuca quinquenervia) in a swamp ecosystem of Northeast New South Wales (NSW), Australia.
2. System Framework
A novel framework was designed for the assessment of natural and plantation forests exposedand potentially exposed to pathogens as presented in Figure 1. It comprises four sections linked to eachother, denoted as Data Acquisition, Data Preparation, Training, and Prediction. The system interactsdirectly and indirectly with the surveyed area to acquire information, preprocess and arrange obtaineddata into features, fit a supervised machine learning classifier, tune the accuracy and performanceindicators to process vast amounts of data, and provide prediction reports through segmented images.
Figure 1. Pipeline process for the detection and mapping of alterations in natural and plantation forestsby fungal diseases.
2.1. Data Acquisition
The data acquisition process involves an indirect data collection campaign using an airbornesystem, and direct ground assessments of the studied pathogen through exclusion trials, which arecontrolled by biosecurity experts. Airborne data is compiled using a UAV, image sensors, and a groundworkstation in the site to acquire data above the tree canopy. Similarly, ground data is collected throughfield assessment insights by biosecurity experts. Field assessments bring several factors such as growth,reproduction, and regeneration on coppiced trees exposed to any specific pathogen. A database iscreated by labelling, georeferencing, and correlating relevant insights into every tested plant. Details onthe studied area, flight campaigns, and field assessments can be found in Sections 3.1–3.3.
2.1.1. UAV and Ground Station
This methodology incorporates a hexa-rotor DJI S800 EVO (DJI, Guangdong, China) UAV.The drone features high-performance brushless rotors, a total load capacity of 3.9 kg, and dimensions

Sensors 2018, 18, 944 4 of 17
of 118 cm × 100 cm × 50 cm. It follows an automatic mission route using the DJI Ground Station 4.0software, controlling the route, speed, height above the ground, and overlapping values remotely.It is worth mentioning, however, that other UAVs with similar characteristics can also be used andincluded into the airborne data collection process of Figure 1.
2.1.2. Sensors
Spectral data is collected using a Headwall Nano-Hyperspec R© hyperspectral camera (HeadwallPhotonics Inc., Bolton, MA, USA). This visible near infrared (VNIR) sensor provides spectralwavelength responses up to 274 bands, a wavelength range from 385 to 1000 nm, a spectral resolutionof 2.2 nm, a frame rate of 300 Hz, spatial bands of 640 pixels, and a total storage limit of 480 GB.The camera is mounted in a customised gimbal system that augments data quality by minimisingexternal disturbances such as roll, pitch, and yaw oscillations, as depicted in Figure 2.
Figure 2. Assembly of the gimbal system and the Headwall Nano-Hyperspec R© camera into the DJIS800 EVO unmanned aerial vehicle (UAV).
2.2. Data Preparation
Imagery is downloaded and fed into a range of software solutions to transform raw data intofiltered and orthorectified spectral bands in reflectance. Using Headwall SpectralView R© software,raw hypercubes from the surveyed area were automatically processed. The preprocessing operationsincluded radiance, orthorectification (through ground control points), and the white referenceillumination spectrum (WRIS). The WRIS spectrum comes from the extraction of the radiancesignature of a Spectralon target from an acquired image in the surveyed area. Using the orthorectifiedimagery and the WRIS, reflectance data and scene shading are calculated through CSIRO|Data61Scyven 1.3.0. software [56,57]. Considering the massive amount of data contained for any orthorectifiedhyperspectral cube (4–12 GB), each cube is cropped to process regions of interest only (0.5–1 GB) andhandle system resources efficiently, as shown in Figure 3.
An additional image that contains the localisation of tested trees in the exclusion trial is created.From a recovered red–green–blue colour model (RGB) image of the cropped hypercube, each treeis graphically labelled using their tracked GPS coordinates in Argis ArcMap 10.4. To handle all thedata processing from the proposed system framework, Algorithm 1 was developed. These taskswere conducted with Python 2.7.14 programming language and several third-party libraries for datamanipulation and machine learning, including Geospatial Data Abstraction Library (GDAL) 2.2.2 [58],eXtreme Gradient Boosting (XGBoost) 0.6 [59], Scikit-learn 0.19.1 [60], OpenCV 3.3.0 [61], andMatplotlib 2.1.0 [62].

Sensors 2018, 18, 944 5 of 17
Figure 3. Creation of regions of interest in hyperspectral cubes.
Algorithm 1 Detection and mapping of vegetation alterations using spectral imagery and sets offeatures.
Required: orthorectified layers (bands) in reflectance I. Labelled regions from field assessments L.Data Preparation
1: Load I data.2: S← Spectral indexes array from I.3: X ← Features array [I, S].
Training4: Y ← Labels array from dataset L.5: D ← filtered dataset of features X with corresponding labelled pixel from Y.6: Split D into training data DT and testing data DE.7: Fit an XGBoost classifier C using DT .8: R← List of unique relevance values of processed features X from C.9: for all values in R do
10: DTF ← Filtered underscored features from DT .11: Fit C using DTF.12: Append accuracy values from C into T.13: end for14: Fit C using the best features threshold from T.15: Validate C with k-fold cross-validation from DTF. . number of folds = 10
Prediction16: P← Predicted values for each sample in X.17: Convert P array into a 2D orthorectified image.18: O← Displayed/overlayed image.19: return O
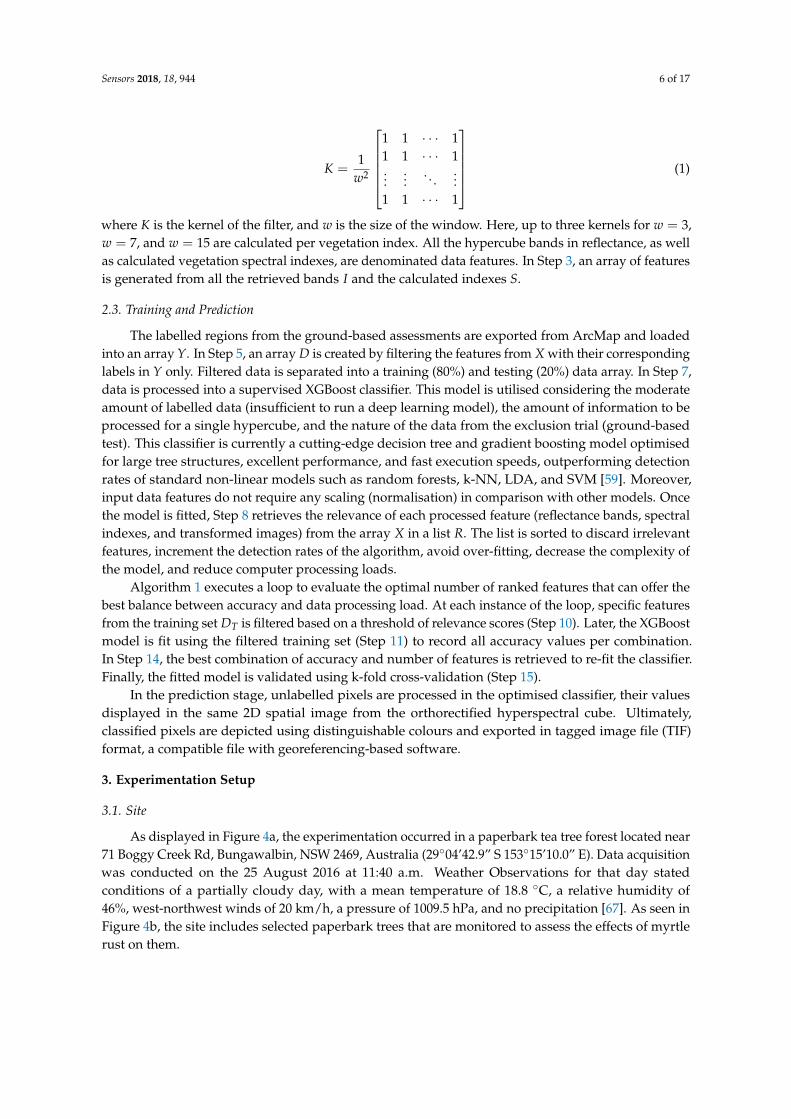
Reflectance cube bands are loaded into the program to calculate suitable spectral indexes andimprove the detection rates as mentioned in Step 2. For this approach, the most traditional indexes, suchas the normalised difference vegetation index (NDVI) [63], the green normalised difference vegetationindex (GNDVI) [64], the soil-adjusted vegetation index (SAVI) [65], and the second modified adjustedvegetation index (MSAVI2) [66], are calculated. Additionally, two-dimensional (2D) smoothing kernelsare applied into such indexes, following Equation (1).
Sensors 2018, 18, 944 6 of 17
K =1
w2
1 1 · · · 11 1 · · · 1...
.... . .
...1 1 · · · 1
(1)
where K is the kernel of the filter, and w is the size of the window. Here, up to three kernels for w = 3,w = 7, and w = 15 are calculated per vegetation index. All the hypercube bands in reflectance, as wellas calculated vegetation spectral indexes, are denominated data features. In Step 3, an array of featuresis generated from all the retrieved bands I and the calculated indexes S.
2.3. Training and Prediction
The labelled regions from the ground-based assessments are exported from ArcMap and loadedinto an array Y. In Step 5, an array D is created by filtering the features from X with their correspondinglabels in Y only. Filtered data is separated into a training (80%) and testing (20%) data array. In Step 7,data is processed into a supervised XGBoost classifier. This model is utilised considering the moderateamount of labelled data (insufficient to run a deep learning model), the amount of information to beprocessed for a single hypercube, and the nature of the data from the exclusion trial (ground-basedtest). This classifier is currently a cutting-edge decision tree and gradient boosting model optimisedfor large tree structures, excellent performance, and fast execution speeds, outperforming detectionrates of standard non-linear models such as random forests, k-NN, LDA, and SVM [59]. Moreover,input data features do not require any scaling (normalisation) in comparison with other models. Oncethe model is fitted, Step 8 retrieves the relevance of each processed feature (reflectance bands, spectralindexes, and transformed images) from the array X in a list R. The list is sorted to discard irrelevantfeatures, increment the detection rates of the algorithm, avoid over-fitting, decrease the complexity ofthe model, and reduce computer processing loads.
Algorithm 1 executes a loop to evaluate the optimal number of ranked features that can offer thebest balance between accuracy and data processing load. At each instance of the loop, specific featuresfrom the training set DT is filtered based on a threshold of relevance scores (Step 10). Later, the XGBoostmodel is fit using the filtered training set (Step 11) to record all accuracy values per combination.In Step 14, the best combination of accuracy and number of features is retrieved to re-fit the classifier.Finally, the fitted model is validated using k-fold cross-validation (Step 15).
In the prediction stage, unlabelled pixels are processed in the optimised classifier, their valuesdisplayed in the same 2D spatial image from the orthorectified hyperspectral cube. Ultimately,classified pixels are depicted using distinguishable colours and exported in tagged image file (TIF)format, a compatible file with georeferencing-based software.
3. Experimentation Setup
3.1. Site
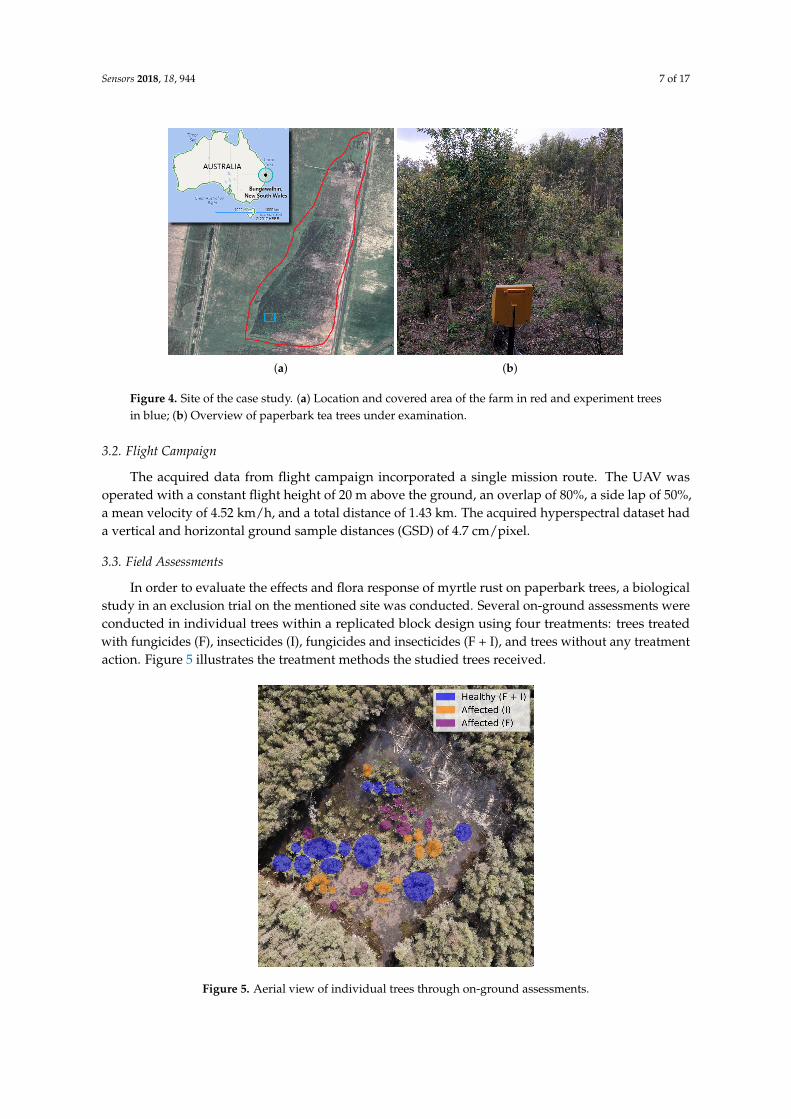
As displayed in Figure 4a, the experimentation occurred in a paperbark tea tree forest located near71 Boggy Creek Rd, Bungawalbin, NSW 2469, Australia (29◦04’42.9” S 153◦15’10.0” E). Data acquisitionwas conducted on the 25 August 2016 at 11:40 a.m. Weather Observations for that day statedconditions of a partially cloudy day, with a mean temperature of 18.8 ◦C, a relative humidity of46%, west-northwest winds of 20 km/h, a pressure of 1009.5 hPa, and no precipitation [67]. As seen inFigure 4b, the site includes selected paperbark trees that are monitored to assess the effects of myrtlerust on them.
Sensors 2018, 18, 944 7 of 17
(a) (b)
Figure 4. Site of the case study. (a) Location and covered area of the farm in red and experiment treesin blue; (b) Overview of paperbark tea trees under examination.
3.2. Flight Campaign
The acquired data from flight campaign incorporated a single mission route. The UAV wasoperated with a constant flight height of 20 m above the ground, an overlap of 80%, a side lap of 50%,a mean velocity of 4.52 km/h, and a total distance of 1.43 km. The acquired hyperspectral dataset hada vertical and horizontal ground sample distances (GSD) of 4.7 cm/pixel.
3.3. Field Assessments
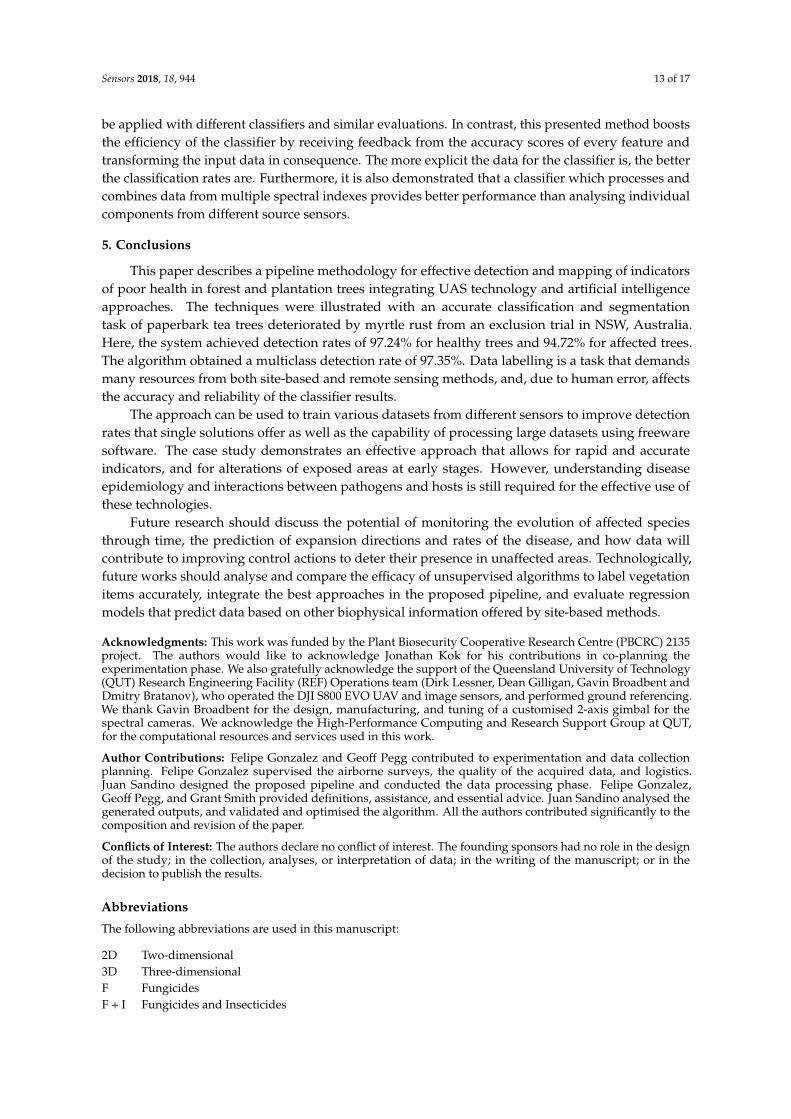
In order to evaluate the effects and flora response of myrtle rust on paperbark trees, a biologicalstudy in an exclusion trial on the mentioned site was conducted. Several on-ground assessments wereconducted in individual trees within a replicated block design using four treatments: trees treatedwith fungicides (F), insecticides (I), fungicides and insecticides (F + I), and trees without any treatmentaction. Figure 5 illustrates the treatment methods the studied trees received.
Figure 5. Aerial view of individual trees through on-ground assessments.

Sensors 2018, 18, 944 8 of 17
From the indicators generated, insect and disease assessments were extracted to label everytree. Overall, the assessment report showed that only the trees that received insecticide and fungicidetreatments remained healthy under direct exposure to the rust. In contrast, trees treated with insecticidewere affected by rust and those treated with fungicide were affected by insects. Thus, trees treatedwith fungicides and insecticides were consequently labelled as healthy and the others as affected inthe database.
3.4. Preprocessing
As mentioned in Section 2.2, the entire surveyed area included an exclusion trial. As a result,an orthorectified hyperspectral cube in reflectance with spatial dimensions of 2652 × 1882 pixel of a5.4 GB size was generated. This area was cropped from the original hypercube, reducing computationalcosts and discarding irrelevant data. Eventually, a 1.7 GB cube of 1200 × 1400 pixel as depicted inFigure 6 was extracted.
Figure 6. Red–green–blue (RGB) colour model representation of the orthorectified cube with itsextracted region of interest.
3.5. Training and Prediction
The XGBoost classifier contains several hyper-parameters to be set. Following a grid searchtechnique, in which the classifier performance and detection rates were tracked with a set of possiblehyper-parameters, the optimal values found for this case study were
estimators = 100, learning rate = 0.1, maximum depth = 3
where “estimators” is the number of trees, “learning rate” is the step size of each boosting step, and“maximum depth” is the maximum depth per tree that defines the complexity of the model.
4. Results and Discussion
To visualise the benefits of inserting an optimisation scheme in Step 8 of Algorithm 1,detection rates were tracked by training and running the classifier multiple times with only a set offiltered features per instance. The features were ranked with their relevance by the XGBoost classifierand sorted consequently, as illustrated in Figure 7.
The classifier can achieve high accuracy rates exceeding 97% of global accuracy when it processesdata using from 10 to 40 features only, with an optimal number of features of 24. On the otherhand, the classifier merely improves their registers when the number of processed features is moresubstantial. With this capability, the proposed approach can process fewer data and reduce the numberof calculations to achieve high detection values. Additionally, this boosts the capability of the algorithmof processing large datasets in less time, an ideal scenario for mapping vast rural areas. The mostrelevant features of this study case are depicted in Table 1 and Figure 8.

Sensors 2018, 18, 944 9 of 17
89%
90%
91%
92%
93%
94%
95%
96%
97%
98%
0 20 40 60 80 100 120 140 160 180 200 220 240 260 280 300
Acc
ura
cy
Features
Figure 7. Performance of the classifier using different filtered features. Optimal number of features: 24.
Table 1. Ranking of the most 30 relevant features.
# Feature Score # Feature Score # Feature Score
1 NDVI_Mean15 0.0933 11 NDVI_Mean3 0.0247 21 975.3710 0.01192 Shading_Mean15 0.0780 12 759.9730 0.0212 22 671.1490 0.01093 GNDVI_Mean7 0.0563 13 999_Mean3 0.0212 23 893.2090 0.01094 NDVI_Mean7 0.0558 14 999_Mean7 0.0202 24 990.9150 0.00995 999_Mean15 0.0504 15 997.5770 0.0188 25 877.6650 0.00946 444.6470 0.0494 16 764.4140 0.0148 26 966.4890 0.00947 Specularity_Mean15 0.0380 17 444_Mean15 0.0143 27 766.6350 0.00848 999.7980 0.0341 18 462.4120 0.0133 28 853.2380 0.00799 GNDVI_Mean15 0.0286 19 NDVI 0.0133 29 935.4000 0.007910 444_Mean7 0.0267 20 Shading_Mean7 0.0133 30 GNDVI_Mean3 0.0079
It is shown how the first four features for this classification task come from specific vegetationindexes and processed images by 2D kernels—specifically, NDVI, shading, and GNDVI features(Figure 8a–d). Although their illustrations show insights of distinguishable intensities between healthyand affected tree regions from Figure 5, these sets of features are insufficient for segmenting areasof other objects. Thus, specific reflectance wavelengths bands such as 999 and 444 nm (Figure 8e,f)are also determinant. Additionally, features processed with 2D kernels obtained better relevancescores than their unprocessed counterparts. That difference was even greater for processed featuresusing big window kernels considering that high amounts of noise, common in raw hyperspectralimagery, altered the performance of the approach. Nonetheless, these rankings do not suggest thatthese features can be used as global indicators to detect and map similar case studies (myrtle rust); thefeature ranking table showed here is relevant to the fitted XGBoost model only, and results may differif the same features are processed through other machine learning techniques. It is recommended,therefore, to perform individual analyses for every case study.

Sensors 2018, 18, 944 10 of 17
(a) (b) (c)
(d) (e) (f)
Figure 8. False colour representation of the first six features by relevance. (a) Smoothed NDVI withk = 15. (b) Smoothed Shading with k = 15. (c) Smoothed GNDVI with k = 7. (d) Smoothed NDVI withk = 7. (e) Smoothed 999 nm reflectance band with k = 15. (f) Raw 444 nm reflectance band.
A total of 11, 385 pixel contained in 23 features filtered by their relevance were read again inStep 14 of Algorithm 1. Data was divided into a training array DE with 9108 pixel and a testing arrayDT with 2277 pixel. The generated confusion matrix of the classifier and its performance report isshown in Tables 2 and 3.
Table 2. Confusion matrix of the eXtreme Gradient Boosting (XGBoost) classifier.
Predicted Healthy Affected Background Soil Stems
Labelled
Healthy 1049 15 0 0 0Affected 45 531 0 0 0Background 0 0 158 0 0Soil 0 0 0 321 0Stems 0 0 0 1 157
Table 3. Classification report of the confusion matrix of Table 2.
Class Precision (%) Recall (%) F-Score (%) Support
Healthy 95.89 98.59 97.24 1064Affected 97.25 92.19 94.72 576
Background 100.00 100.00 100.00 158Soil 99.69 100.00 99.68 321
Stems 100.00 99.37 99.68 158
Mean 97.32 97.32 97.35 ∑ = 2277
In sum, most of the classes were predicted favourably. The majority of misclassifications betweenthe “Healthy” and “Affected” classes are possibly caused by human errors while labelling the regionsmanually in the raw imagery. Considering a weighed importance of precision and recall of 1:1,

Sensors 2018, 18, 944 11 of 17
the F-support scores highlight a detection rate of 97.24% for healthy trees, 94.25% for affected trees,and an overall detection rate of 97.35%. Validation through k-fold cross-validation shows that thepresented approach has an accuracy of 96.79%, with a standard deviation of 0.567%.
The performance of Algorithm 1 was tested in a computer with the following characteristics:Processor Intel R© CoreTM i7-4770, 256 GB SSD, 16 GB RAM, Windows 7 64bit, and AMDRadeonTM HD 8490. It contains a report of the elapsed seconds for the application to accomplish theprimary data processing, training, and prediction tasks, as illustrated in Table 4.
Table 4. Performance in seconds of the main tasks from Algorithm 1.
Sub-Section Instance 1 Instance 2 Instance 3 Instance 4 Instance 5 Mean Std. Dev.Data preparation
Loading Hypercube 11.927 10.944 11.954 11.766 11.521 11.622 0.417Calculating indexes 46.864 51.860 51.901 52.622 47.322 50.114 2.779
Training
Preprocessing 0.152 0.141 0.149 0.148 0.140 0.146 0.005Fitting XGBoost 8.948 8.654 8.758 8.679 8.692 8.746 0.119Features Filtering 53.236 55.433 60.364 57.253 53.446 55.946 2.962Re-Fitting XGBoost 0.964 1.023 1.010 0.998 0.965 0.992 0.026
Prediction
Predicting results 29.738 40.749 42.131 34.473 66.477 42.714 14.188Display 0.776 0.705 1.043 0.917 0.612 0.811 0.171
Total 152.607 169.508 177.309 166.857 189.175 171.091 13.489
Taking into account the dimensions of the processed hypercube (1400 × 1200) and the initialnumber of bands (274), it was observed how a great demand of resources was required to open the fileitself and calculate spectral indexes, accumulating 61.7 s on average. Similarly, the features filteringprocess in the training section also demanded considerable time, exceeding 50 s. On the other hand,the elapsed time executing the remaining tasks of the training phase was remarkably short. Specifically,the report highlights the benefits of filtering irrelevant features by comparing the duration of fittingthe classifier for the first time with the duration of re-fitting it again with less yet relevant data from8.74 to 0.99 s. Overall, the application spent 2 min and 51 s to evaluate and map an area of 338 m2
approximately.The GSD value of 4.7 cm/pixel from the acquired hyperspectral imagery represented a minor
challenge in labelling individual trees, but is still problematic when specific stems or leaflets need tobe highlighted. Higher resolution can assist in higher classification rates. As an illustration, the finalsegmented image of the optimised classifier is shown in Figure 9, where Figure 9a shows the digitallabelling of every class region and Figure 9b depicts the generated segmentation output by Algorithm 1.A hypercube covering the entire area flown was also processed using the trained model, with resultsshown in Figure 10.
Results show a segmentation output using XGBoost as the supervised machine learning classifierthat works well for this task. This classifier as well as Algorithm 1 are not only important for theircapabilities to offer a pixel-wise classification task, but they also allow a rapid convergence, do notinvolve many complex mathematical calculations, and filter irrelevant data, compared to other methods.Nevertheless, it is suggested that their prediction performance be revised with new data. Like anymodel based on decision trees, over-fitting may occur, and misleading results might be generated.In those situations, labelling misclassified data, aggregating them into the features database andrerunning the algorithm is suggested.

Sensors 2018, 18, 944 12 of 17
0 200 400 600 800 1000 1200 1400
0
200
400
600
800
1000
1200
Healthy (F + I)Affected (I)SoilDead StemsBackground
(a)0 200 400 600 800 1000 1200 1400
0
200
400
600
800
1000
1200
Selected Region of Interest (ROI)
0 200 400 600 800 1000 1200 1400
0
200
400
600
800
1000
1200
Classification ResultsHealthyAffectedSoilDead StemsBackground
(b)
Figure 9. Segmentation results of the proposed approach. (a) Recovered hyperspectral image inred–green–blue (RGB) colour model; (b) Segmentation results.
100 mN
➤➤
NImage © 2018 DigitalGlobe
Image © 2018 DigitalGlobe
Image © 2018 DigitalGlobe
Figure 10. Layer of mapping results of the study area in Google Earth.
The availability to process and classify data with small GSD values demonstrates the potentialof UASs for remote sensing equipment compared with satellite and manned aircraft for forest healthassessments on forest and tree plantations and with traditional estimation methods, such as statisticalregression models. In comparison with similar approaches of non-invasive assessment techniquesusing UAVs and spectral sensors, this framework does not provide general spectral indexes that can
Sensors 2018, 18, 944 13 of 17
be applied with different classifiers and similar evaluations. In contrast, this presented method booststhe efficiency of the classifier by receiving feedback from the accuracy scores of every feature andtransforming the input data in consequence. The more explicit the data for the classifier is, the betterthe classification rates are. Furthermore, it is also demonstrated that a classifier which processes andcombines data from multiple spectral indexes provides better performance than analysing individualcomponents from different source sensors.
5. Conclusions
This paper describes a pipeline methodology for effective detection and mapping of indicatorsof poor health in forest and plantation trees integrating UAS technology and artificial intelligenceapproaches. The techniques were illustrated with an accurate classification and segmentationtask of paperbark tea trees deteriorated by myrtle rust from an exclusion trial in NSW, Australia.Here, the system achieved detection rates of 97.24% for healthy trees and 94.72% for affected trees.The algorithm obtained a multiclass detection rate of 97.35%. Data labelling is a task that demandsmany resources from both site-based and remote sensing methods, and, due to human error, affectsthe accuracy and reliability of the classifier results.
The approach can be used to train various datasets from different sensors to improve detectionrates that single solutions offer as well as the capability of processing large datasets using freewaresoftware. The case study demonstrates an effective approach that allows for rapid and accurateindicators, and for alterations of exposed areas at early stages. However, understanding diseaseepidemiology and interactions between pathogens and hosts is still required for the effective use ofthese technologies.
Future research should discuss the potential of monitoring the evolution of affected speciesthrough time, the prediction of expansion directions and rates of the disease, and how data willcontribute to improving control actions to deter their presence in unaffected areas. Technologically,future works should analyse and compare the efficacy of unsupervised algorithms to label vegetationitems accurately, integrate the best approaches in the proposed pipeline, and evaluate regressionmodels that predict data based on other biophysical information offered by site-based methods.
Acknowledgments: This work was funded by the Plant Biosecurity Cooperative Research Centre (PBCRC) 2135project. The authors would like to acknowledge Jonathan Kok for his contributions in co-planning theexperimentation phase. We also gratefully acknowledge the support of the Queensland University of Technology(QUT) Research Engineering Facility (REF) Operations team (Dirk Lessner, Dean Gilligan, Gavin Broadbent andDmitry Bratanov), who operated the DJI S800 EVO UAV and image sensors, and performed ground referencing.We thank Gavin Broadbent for the design, manufacturing, and tuning of a customised 2-axis gimbal for thespectral cameras. We acknowledge the High-Performance Computing and Research Support Group at QUT,for the computational resources and services used in this work.
Author Contributions: Felipe Gonzalez and Geoff Pegg contributed to experimentation and data collectionplanning. Felipe Gonzalez supervised the airborne surveys, the quality of the acquired data, and logistics.Juan Sandino designed the proposed pipeline and conducted the data processing phase. Felipe Gonzalez,Geoff Pegg, and Grant Smith provided definitions, assistance, and essential advice. Juan Sandino analysed thegenerated outputs, and validated and optimised the algorithm. All the authors contributed significantly to thecomposition and revision of the paper.
Conflicts of Interest: The authors declare no conflict of interest. The founding sponsors had no role in the designof the study; in the collection, analyses, or interpretation of data; in the writing of the manuscript; or in thedecision to publish the results.
Abbreviations
The following abbreviations are used in this manuscript:
2D Two-dimensional3D Three-dimensionalF FungicidesF + I Fungicides and Insecticides

Sensors 2018, 18, 944 14 of 17
GDAL Geospatial data abstraction libraryGPS Global positioning systemGNDVI Green normalised difference vegetation indexGSD Ground sampling distanceI Insecticidesk-NN k-nearest neighboursLDA Linear discriminant analysisLiDAR Light detection and rangingMDPI Multidisciplinary digital publishing instituteMSAVI2 Second modified soil-adjusted vegetation indexNDVI Normalised difference vegetation indexNSW New South WalesRGB Red–green–blue colour modelSAVI Soil-adjusted Vegetation IndexSVM Support Vector MachinesTIF Tagged Image FileUAS Unmanned Aerial SystemUAV Unmanned Aerial VehicleVNIR Visible Near InfraredWRIS White Reference Illumination SpectrumXGBoost eXtreme Gradient Boosting
References
1. Smock, L.A.; MacGregor, C.M. Impact of the American Chestnut Blight on Aquatic ShreddingMacroinvertebrates. J. N. Am. Benthol. Soc. 1988, 7, 212–221.
2. Anagnostakis, S.L. Chestnut Blight: The classical problem of an introduced pathogen. Mycologia 1987,79, 23–37.
3. Burke, K.L. The effects of logging and disease on American chestnut. For. Ecol. Manag. 2011, 261, 1027–1033.4. Rizzo, D.M.; Garbelotto, M.; Hansen, E.M. Phytophthora ramorum: Integrative research and management
of an emerging pathogen in California and oregon forests. Annu. Rev. Phytopathol. 2005, 43, 309–335.5. Frankel, S.J. Sudden oak death and Phytophthora ramorum in the USA: A management challenge.
Australas. Plant Pathol. 2008, 37, 19–25.6. Grünwald, N.J.; Garbelotto, M.; Goss, E.M.; Heungens, K.; Prospero, S. Emergence of the sudden oak
death pathogen Phytophthora ramorum. Trends Microbiol. 2012, 20, 131–138.7. Hardham, A.R. Phytophthora cinnamomi. Mol. Plant Pathol. 2005, 6, 589–604.8. Shearer, B.L.; Crane, C.E.; Barrett, S.; Cochrane, A. Phytophthora cinnamomi invasion, a major threatening
process to conservation of flora diversity in the South-West Botanical Province of Western Australia.Aust. J. Bot. 2007, 55, 225–238.
9. Burgess, T.I.; Scott, J.K.; Mcdougall, K.L.; Stukely, M.J.; Crane, C.; Dunstan, W.A.; Brigg, F.; Andjic, V.;White, D.; Rudman, T.; et al. Current and projected global distribution of Phytophthora cinnamomi, one ofthe world’s worst plant pathogens. Glob. Chang. Biol. 2017, 23, 1661–1674.
10. Pegg, G.S.; Giblin, F.R.; McTaggart, A.R.; Guymer, G.P.; Taylor, H.; Ireland, K.B.; Shivas, R.G.; Perry, S.Puccinia psidii in Queensland, Australia: Disease symptoms, distribution and impact. Plant Pathol. 2014,63, 1005–1021.
11. Carnegie, A.J.; Kathuria, A.; Pegg, G.S.; Entwistle, P.; Nagel, M.; Giblin, F.R. Impact of the invasive rustPuccinia psidii (myrtle rust) on native Myrtaceae in natural ecosystems in Australia. Biol. Invasions 2016,18, 127–144.
12. Howard, C.; Findlay, V.; Grant, C. Australia’s transition to management of myrtle rust. J. For. Sci. 2016,61, 138–139.
13. Fernandez Winzer, L.; Carnegie, A.J.; Pegg, G.S.; Leishman, M.R. Impacts of the invasive fungusAustropuccinia psidii (myrtle rust) on three Australian Myrtaceae species of coastal swamp woodland.Austral Ecol. 2017, 43, doi:10.1111/aec.12534.

Sensors 2018, 18, 944 15 of 17
14. Dayton, L.; Higgins, E. Myrtle rust ‘biggest threat to ecosystem’. Available online: http://www.webcitation.org/6y61T6sI6 (accessed on 19 February 2018).
15. Carnegie, A.J.; Cooper, K. Emergency response to the incursion of an exotic myrtaceous rust in Australia.Australas. Plant Pathol. 2011, 40, 346–359.
16. Carnegie, A.J. First Report of Puccinia psidii (Myrtle Rust) in Eucalyptus Plantations in Australia. Plant Dis.2015, 99, 161, doi:10.1094/PDIS-09-14-0901-PDN.
17. Pegg, G.; Taylor, T.; Entwistle, P.; Guymer, G.; Giblin, F.; Carnegie, A. Impact of Austropucciniapsidii (myrtle rust) on Myrtaceae-rich wet sclerophyll forests in south east Queensland. PLoS ONE 2017,12, e0188058, doi:10.1371/journal.pone.0188058.
18. Government of Western Australia. Phytophthora Dieback—Parks and Wildlife Service. Available online:http://www.webcitation.org/6xLA86qjW (accessed on 19 February 2018).
19. U.S. Forest Service. Sudden Oak Death (SOD)|Partnerships|PSW Research Station|Forest Service.Available online: http://www.webcitation.org/6xLDwPURd (accessed on 19 February 2018).
20. State of Hawaii. Department of Agriculture|How to Report Suspected Ohia Wilt/Rapid Ohia Death.Available online: http://www.webcitation.org/6xLCVG70h (accessed on 19 February 2018).
21. Lawley, V.; Lewis, M.; Clarke, K.; Ostendorf, B. Site-based and remote sensing methods for monitoringindicators of vegetation condition: An Australian review. Ecol. Indic. 2016, 60, 1273–1283.
22. Oliver, I.; Smith, P.L.; Lunt, I.; Parkes, D. Pre-1750 vegetation, naturalness and vegetation condition: Whatare the implications for biodiversity conservation? Ecol. Manag. Restor. 2002, 3, 176–178.
23. Lawley, V.; Parrott, L.; Lewis, M.; Sinclair, R.; Ostendorf, B. Self-organization and complex dynamics ofregenerating vegetation in an arid ecosystem: 82 years of recovery after grazing. J. Arid Environ. 2013,88, 156–164.
24. Ostendorf, B. Overview: Spatial information and indicators for sustainable management of naturalresources. Ecol. Indic. 2011, 11, 97–102.
25. Roux, J.; Germishuizen, I.; Nadel, R.; Lee, D.J.; Wingfield, M.J.; Pegg, G.S. Risk assessment for Pucciniapsidii becoming established in South Africa. Plant Pathol. 2015, 64, 1326–1335.
26. Berthon, K.; Esperon-Rodriguez, M.; Beaumont, L.; Carnegie, A.; Leishman, M. Assessment andprioritisation of plant species at risk from myrtle rust (Austropuccinia psidii) under current and futureclimates in Australia. Biol. Conserv. 2018, 218, 154 – 162.
27. Lausch, A.; Erasmi, S.; King, D.J.; Magdon, P.; Heurich, M. Understanding Forest Health with RemoteSensing -Part I –A Review of Spectral Traits, Processes and Remote-Sensing Characteristics. Remote Sens.2016, 8, 1029, doi:10.3390/rs8121029
28. Tuominen, J.; Lipping, T.; Kuosmanen, V.; Haapanen, R. Remote sensing of forest health. In Geoscience andRemote Sensing; Ho, P.G.P., Ed.; InTech: Rijeka, Croatia, 2009; Chapter 02.
29. Lausch, A.; Erasmi, S.; King, D.J.; Magdon, P.; Heurich, M. Understanding forest health with remotesensing-Part II–A review of approaches and data models. Remote Sens. 2017, 9, 129, doi:10.3390/rs9020129.
30. Cui, D.; Zhang, Q.; Li, M.; Zhao, Y.; Hartman, G.L. Detection of soybean rust using a multispectral imagesensor. Sens. Instrum. Food Qual. Saf. 2009, 3, 49–56.
31. Candiago, S.; Remondino, F.; De Giglio, M.; Dubbini, M.; Gattelli, M. Evaluating multispectral images andvegetation indices for precision farming applications from UAV images. Remote Sens. 2015, 7, 4026–4047.
32. Lowe, A.; Harrison, N.; French, A.P. Hyperspectral image analysis techniques for the detectionand classification of the early onset of plant disease and stress. Plant Methods 2017, 13, 80,doi:10.1186/s13007-017-0233-z.
33. Khanal, S.; Fulton, J.; Shearer, S. An overview of current and potential applications of thermal remotesensing in precision agriculture. Comput. Electron. Agric. 2017, 139, 22–32.
34. Devadas, R.; Lamb, D.W.; Simpfendorfer, S.; Backhouse, D. Evaluating ten spectral vegetation indices foridentifying rust infection in individual wheat leaves. Precis. Agric. 2009, 10, 459–470.
35. Ashourloo, D.; Mobasheri, M.; Huete, A. Developing two spectral disease indices for detection of wheatleaf rust (Pucciniatriticina). Remote Sens. 2014, 6, 4723–4740.
36. Wang, H.; Qin, F.; Liu, Q.; Ruan, L.; Wang, R.; Ma, Z.; Li, X.; Cheng, P.; Wang, H. Identification and diseaseindex inversion of wheat stripe rust and wheat leaf rust based on hyperspectral data at canopy level.J. Spectrosc. 2015, 2015, 1–10.

Sensors 2018, 18, 944 16 of 17
37. Heim, R.H.J.; Wright, I.J.; Chang, H.C.; Carnegie, A.J.; Pegg, G.S.; Lancaster, E.K.; Falster, D.S.; Oldeland, J.Detecting myrtle rust (Austropuccinia psidii) on lemon myrtle trees using spectral signatures and machinelearning. Plant Pathol. 2018, doi:10.1111/ppa.12830.
38. Booth, T.H.; Jovanovic, T. Assessing vulnerable areas for Puccinia psidii (eucalyptus rust) in Australia.Australas. Plant Pathol. 2012, 41, 425–429.
39. Elith, J.; Simpson, J.; Hirsch, M.; Burgman, M.A. Taxonomic uncertainty and decision making forbiosecurity: spatial models for myrtle/guava rust. Australas. Plant Pathol. 2013, 42, 43–51.
40. Salami, E.; Barrado, C.; Pastor, E. UAV flight experiments applied to the remote sensing of vegetated areas.Remote Sens. 2014, 6, 11051–11081.
41. Glassock, R.; Hung, J.Y.; Gonzalez, L.F.; Walker, R.A. Design, modelling and measurement of a hybridpowerplant for unmanned aerial systems. Aust. J. Mech. Eng. 2008, 6, 69–78.
42. Whitney, E.; Gonzalez, L.; Periaux, J.; Sefrioui, M.; Srinivas, K. A robust evolutionary technique for inverseaerodynamic design. In Proceedings of the European Congress on Computational Methods in AppliedSciences and Engineering, Jyvaskyla, Finland, 24–28 July 2004; Volume 2, pp. 1–2.
43. Gonzalez, L.; Whitney, E.; Srinivas, K.; Periaux, J. Multidisciplinary aircraft design and optimisation usinga robust evolutionary technique with variable fidelity models. In Proceedings of the 10th AIAA/ISSMOMultidisciplinary Analysis and Optimization Conference, Albany, NY, USA, 30 August–1 September 2004;Volume 6, pp. 3610–3624.
44. Ken, W.; Chris, H.C. Remote sensing of the environment with small unmanned aircraft systems (UASs),part 1: A review of progress and challenges. J. Unmanned Veh. Syst. 2014, 2, 69–85.
45. Gonzalez, L.; Montes, G.; Puig, E.; Johnson, S.; Mengersen, K.; Gaston, K. Unmanned Aerial Vehicles(UAVs) and artificial intelligence revolutionizing wildlife monitoring and conservation. Sensors 2016,16, 97, doi:10.3390/s16010097.
46. Sandino, J.; Wooler, A.; Gonzalez, F. Towards the automatic detection of pre-existing termite moundsthrough UAS and hyperspectral imagery. Sensors 2017, 17, 2196, doi:10.3390/s17102196.
47. Vanegas, F.; Bratanov, D.; Powell, K.; Weiss, J.; Gonzalez, F. A novel methodology for improving plantpest surveillance in vineyards and crops using UAV-based hyperspectral and spatial data. Sensors 2018, 18,e260, doi:10.3390/s18010260.
48. Vanegas, F.; Gonzalez, F. Enabling UAV navigation with sensor and environmental uncertainty in clutteredand GPS-denied environments. Sensors 2016, 16, 666, doi:10.3390/s16050666.
49. Aasen, H.; Burkart, A.; Bolten, A.; Bareth, G. Generating 3D hyperspectral information with lightweightUAV snapshot cameras for vegetation monitoring: From camera calibration to quality assurance. ISPRS J.Photogramm. Remote Sens. 2015, 108, 245–259.
50. Nasi, R.; Honkavaara, E.; Lyytikainen-Saarenmaa, P.; Blomqvist, M.; Litkey, P.; Hakala, T.; Viljanen, N.;Kantola, T.; Tanhuanpaa, T.; Holopainen, M. Using UAV-Based photogrammetry and hyperspectralimaging for mapping bark beetle damage at tree-level. Remote Sens. 2015, 7, 15467–15493.
51. Calderon, R.; Navas-Cortes, J.; Lucena, C.; Zarco-Tejada, P. High-resolution airborne hyperspectral andthermal imagery for early detection of Verticillium wilt of olive using fluorescence, temperature andnarrow-band spectral indices. Remote Sens. Environ. 2013, 139, 231–245.
52. Calderon, R.; Navas-Cortes, J.A.; Zarco-Tejada, P.J. Early detection and quantification of verticillium wiltin olive using hyperspectral and thermal imagery over large areas. Remote Sens. 2015, 7, 5584–5610.
53. Albetis, J.; Duthoit, S.; Guttler, F.; Jacquin, A.; Goulard, M.; Poilvé, H.; Féret, J.B.; Dedieu, G. Detectionof Flavescence dorée Grapevine Disease using Unmanned Aerial Vehicle (UAV) multispectral imagery.Remote Sens. 2017, 9, 308, doi:10.3390/rs9040308.
54. Pause, M.; Schweitzer, C.; Rosenthal, M.; Keuck, V.; Bumberger, J.; Dietrich, P.; Heurich, M.; Jung, A.;Lausch, A. In situ/remote sensing integration to assess forest health–A review. Remote Sens. 2016, 8, 471,doi:10.3390/rs8060471.
55. Stone, C.; Mohammed, C. Application of remote sensing technologies for assessing planted forestsdamaged by insect pests and fungal pathogens: A review. Curr. For. Rep. 2017, 3, 75–92.
56. Habili, N.; Oorloff, J. ScyllarusTM: From Research to Commercial Software. In Proceedings of the ASWEC24th Australasian Software Engineering Conference, Adelaide, SA, Australia, 28 September–1 October2015; ACM Press: New York, NY, USA, 2015; Volume II, pp. 119–122.

Sensors 2018, 18, 944 17 of 17
57. Gu, L.; Robles-Kelly, A.A.; Zhou, J. Efficient estimation of reflectance parameters from imaging spectroscopy.IEEE Trans. Image Process. 2013, 22, 3648–3663.
58. GDAL Development Team. GDAL—Geospatial Data Abstraction Library, Version 2.1.0; Open SourceGeospatial Foundation: Beaverton, OR, USA, 2017.
59. Chen, T.; Guestrin, C. XGBoost: A Scalable Tree Boosting System. In Proceedings of the 22nd ACMSIGKDD International Conference on Knowledge Discovery and Data Mining (KDD’16), San Francisco,CA, USA, 13–17 August 2016; ACM Press: New York, NY, USA, 2016; pp. 785–794.
60. Pedregosa, F.; Varoquaux, G.; Gramfort, A.; Michel, V.; Thirion, B.; Grisel, O.; Blondel, M.; Prettenhofer, P.;Weiss, R.; Dubourg, V.; et al. Scikit-learn: Machine Learning in Python. J. Mach. Learn. Res. 2011,12, 2825–2830.
61. Bradski, G. The OpenCV library. Dr. Dobb’s J. Softw. Tools 2000, 25, 120, 122–125.62. Hunter, J.D. Matplotlib: A 2D graphics environment. Comput. Sci. Eng. 2007, 9, 90–95.63. Rouse, J.W., Jr.; Haas, R.H.; Schell, J.A.; Deering, D.W. Monitoring vegetation systems in the great plains
with Erts. NASA Spec. Publ. 1974, 351, 309–317.64. Gitelson, A.A.; Kaufman, Y.J.; Merzlyak, M.N. Use of a green channel in remote sensing of global vegetation
from EOS-MODIS. Remote Sens. Environ. 1996, 58, 289–298.65. Huete, A. A soil-adjusted vegetation index (SAVI). Remote Sens. Environ. 1988, 25, 295–309.66. Laosuwan, T.; Uttaruk, P. Estimating tree biomass via remote sensing, MSAVI 2, and fractional cover
model. IETE Tech. Rev. 2014, 31, 362–368.67. Australian Government. Evans Head, NSW–August 2016–Daily Weather Observations; Bureau of Meteorology:
Evans Head, NSW, Australia, 2016.
c© 2018 by the authors. Licensee MDPI, Basel, Switzerland. This article is an open accessarticle distributed under the terms and conditions of the Creative Commons Attribution(CC BY) license (http://creativecommons.org/licenses/by/4.0/).
Related Documents