Using Total Worker Health® to Advance Worker Health and Safety Printed Edition of the Special Issue Published in International Journal of Environmental Research and Public Health www.mdpi.com/journal/ijerph Diane S. Rohlman and Kevin M. Kelly Edited by

Welcome message from author
This document is posted to help you gain knowledge. Please leave a comment to let me know what you think about it! Share it to your friends and learn new things together.
Transcript
Using Total Worker Health® to Advance Worker Health and Safety
Printed Edition of the Special Issue Published in International Journal of Environmental Research and Public Health
www.mdpi.com/journal/ijerph
Diane S. Rohlman and Kevin M. KellyEdited by
Using Total W
orker Health® to Advance W
orker Health and Safety • Diane S. Rohlm
an and Kevin M. Kelly

Using Total Worker Health R© toAdvance Worker Health and Safety

Using Total Worker Health R© toAdvance Worker Health and Safety
Special Issue Editors
Diane S. Rohlman
Kevin M. Kelly
MDPI • Basel • Beijing • Wuhan • Barcelona • Belgrade
Special Issue Editors
Diane S. Rohlman
Healthier Workforce Center of the Midwest
University of Iowa
USA
Kevin M. Kelly
Healthier Workforce Center of the Midwest
University of Iowa
USA
Editorial Office
MDPI
St. Alban-Anlage 66
4052 Basel, Switzerland
This is a reprint of articles from the Special Issue published online in the open access journal
International Journal of Environmental Research and Public Health (ISSN 1660-4601) from 2018 to 2019
(available at: https://www.mdpi.com/journal/ijerph/special issues/advance worker).
For citation purposes, cite each article independently as indicated on the article page online and as
indicated below:
LastName, A.A.; LastName, B.B.; LastName, C.C. Article Title. Journal Name Year, Article Number,
Page Range.
ISBN 978-3-03921-992-6 (Hbk) ISBN 978-3-03921-993-3 (PDF)
Cover image courtesy of Roman Slabach and Michael Guhin.
c© 2020 by the authors. Articles in this book are Open Access and distributed under the Creative
Commons Attribution (CC BY) license, which allows users to download, copy and build upon
published articles, as long as the author and publisher are properly credited, which ensures maximum
dissemination and a wider impact of our publications.
The book as a whole is distributed by MDPI under the terms and conditions of the Creative Commons
license CC BY-NC-ND.
Contents
About the Special Issue Editors . . . . . . . . . . . . . . . . . . . . . . . . . . . . . . . . . . . . . ix
Preface to ”Using Total Worker Health R© to Advance Worker Health and Safety” . . . . . . . . xi
Sara L. Tamers, L. Casey Chosewood, Adele Childress, Heidi Hudson, Jeannie Nigam and
Chia-Chia Chang
Total Worker Health R© 2014–2018: The Novel Approach to Worker Safety, Health, and Well-BeingEvolvesReprinted from: IJERPH 2019, 16, 321, doi:10.3390/ijerph16030321 . . . . . . . . . . . . . . . . . . 1
Tessa Bonney, Christina Welter, Elizabeth Jarpe-Ratner and Lorraine M. Conroy
Understanding the Role of Academic Partners as Technical Assistance Providers: Results froman Exploratory Study to Address Precarious WorkReprinted from: IJERPH 2019, 16, 3903, doi:10.3390/ijerph16203903 . . . . . . . . . . . . . . . . . 20
Aileen Hoge, Anna T. Ehmann, Monika A. Rieger and Achim Siegel
Caring for Workers’ Health: Do German Employers Follow a Comprehensive Approach Similarto the Total Worker Health Concept? Results of a Survey in an Economically Powerful Regionin GermanyReprinted from: IJERPH 2019, 16, 726, doi:0.3390/ijerph16050726 . . . . . . . . . . . . . . . . . . 38
Janalee Thompson, Natalie V. Schwatka, Liliana Tenney and Lee S. Newman
Total Worker Health: A Small Business Leader PerspectiveReprinted from: IJERPH 2018, 15, 2416, doi:10.3390/ijerph15112416 . . . . . . . . . . . . . . . . . 53
Ami Sedani, Derry Stover, Brian Coyle and Rajvi J. Wani
Assessing Workplace Health and Safety Strategies, Trends, and Barriers through a StatewideWorksite SurveyReprinted from: IJERPH 2019, 16, 2475, doi:10.3390/ijerph16142475 . . . . . . . . . . . . . . . . . 68
Jose Joaquın Del Pozo-Antunez, Antonio Ariza-Montes, Francisco Fernandez-Navarro and
Horacio Molina-Sanchez
Effect of a Job Demand-Control-Social Support Model on Accounting Professionals’ HealthPerceptionReprinted from: IJERPH 2018, 15, 2437, doi:10.3390/ijerph15112437 . . . . . . . . . . . . . . . . . 82
Sophie-Charlotte Meyer and Lena Hunefeld
Challenging Cognitive Demands at Work, Related Working Conditions, and EmployeeWell-BeingReprinted from: IJERPH 2018, 15, 2911, doi:10.3390/ijerph15122911 . . . . . . . . . . . . . . . . . 98
Aviroop Biswas, Colette N. Severin, Peter M. Smith, Ivan A. Steenstra, Lynda S. Robson and
Benjamin C. Amick III
Larger Workplaces, People-Oriented Culture, and Specific Industry Sectors Are Associated withCo-Occurring Health Protection and Wellness ActivitiesReprinted from: IJERPH 2018, 15, 2739, doi:/10.3390/ijerph15122739 . . . . . . . . . . . . . . . . 112
Marıa del Carmen Perez-Fuentes, Marıa del Mar Molero Jurado, Africa Martos Martınez and
Jose Jesus Gazquez Linares
New Burnout Evaluation Model Based on the Brief Burnout Questionnaire: PsychometricProperties for NursingReprinted from: IJERPH 2018, 15, 2718, doi:10.3390/ijerph15122718 . . . . . . . . . . . . . . . . . 125
v
Tamara D. Street, Sarah J. Lacey and Klaire Somoray
Employee Stress, Reduced Productivity, and Interest in a Workplace Health Program: A CaseStudy from the Australian Mining IndustryReprinted from: IJERPH 2019, 16, 94, doi:10.3390/ijerph16010094 . . . . . . . . . . . . . . . . . . 137
Nathan C. Huizinga, Jonathan A. Davis, Fred Gerr and Nathan B. Fethke
Association between Occupational Injury and Subsequent Employment Termination amongNewly Hired Manufacturing WorkersReprinted from: IJERPH 2019, 16, 433, doi:10.3390/ijerph16030433 . . . . . . . . . . . . . . . . . . 150
Gyesook Yoo and Soomi Lee
It Doesn’t End There: Workplace Bullying, Work-to-Family Conflict, and Employee Well-Beingin KoreaReprinted from: IJERPH 2018, 15, 1548, doi:10.3390/ijerph15071548 . . . . . . . . . . . . . . . . . 162
Eric A. Lauer, Karla Armenti, Margaret Henning and Lissa Sirois
Identifying Barriers and Supports to Breastfeeding in the Workplace Experienced by Mothers inthe New Hampshire Special Supplemental Nutrition Program for Women, Infants, and ChildrenUtilizing the Total Worker Health FrameworkReprinted from: IJERPH 2019, 16, 529, doi:10.3390/ijerph16040529 . . . . . . . . . . . . . . . . . . 175
Susan E. Peters, Michael P. Grant, Justin Rodgers, Justin Manjourides,
Cassandra A. Okechukwu and Jack T. Dennerlein
A Cluster Randomized Controlled Trial of a Total Worker Health R© Intervention on CommercialConstruction SitesReprinted from: IJERPH 2018, 15, 2354, doi:10.3390/ijerph15112354 . . . . . . . . . . . . . . . . . 192
Ryan Olson, Jennifer A. Hess, Kelsey N. Parker, Sharon V. Thompson, Anjali Rameshbabu,
Kristy Luther Rhoten and Miguel Marino
From Research-to-Practice: An Adaptation and Dissemination of the COMPASS Program forHome Care WorkersReprinted from: IJERPH 2018, 15, 2777, doi:10.3390/ijerph15122777 . . . . . . . . . . . . . . . . . 212
Jaime R. Strickland, Anna M. Kinghorn, Bradley A. Evanoff and Ann Marie Dale
Implementation of the Healthy Workplace Participatory Program in a Retail Setting:A Feasibility Study and Framework for EvaluationReprinted from: IJERPH 2019, 16, 590, doi:10.3390/ijerph16040590 . . . . . . . . . . . . . . . . . . 231
Rajashree Kotejoshyer, Yuan Zhang, Marian Flum, Jane Fleishman and Laura Punnett
Prospective Evaluation of Fidelity, Impact and Sustainability of Participatory Workplace HealthTeams in Skilled Nursing FacilitiesReprinted from: IJERPH 2019, 16, 1494, doi:10.3390/ijerph16091494 . . . . . . . . . . . . . . . . . 248
Ashamsa Aryal, Megan Parish and Diane Rohlman
Generalizability of Total Worker Health R© Online Training for Young WorkersReprinted from: IJERPH 2019, 16, 577, doi:10.3390/ijerph16040577 . . . . . . . . . . . . . . . . . . 265
Onno Bouwmeester and Tessa Elisabeth Kok
Moral or Dirty Leadership: A Qualitative Study on How Juniors Are Managed in DutchConsultanciesReprinted from: IJERPH 2018, 15, 2506, doi:10.3390/ijerph15112506 . . . . . . . . . . . . . . . . . 275
Tariku Ayana Abdi, Jose M. Peiro, Yarid Ayala and Salvatore Zappala
Four Wellbeing Patterns and their Antecedents in Millennials at WorkReprinted from: IJERPH 2019, 16, 25, doi:10.3390/ijerph16010025 . . . . . . . . . . . . . . . . . . 297
vi

Eva M. Shipp, Sharon P. Cooper, Luohua Jiang, Amber B. Trueblood and Jennifer Ross
Influence of Work on Elevated Blood Pressure in Hispanic Adolescents in South TexasReprinted from: IJERPH 2019, 16, 1096, doi:10.3390/ijerph16071096 . . . . . . . . . . . . . . . . . 314
Jose M. Peiro, Malgorzata W. Kozusznik, Isabel Rodrıguez-Molina and Nuria Tordera
The Happy-Productive Worker Model and Beyond: Patterns of Wellbeing and Performanceat WorkReprinted from: IJERPH 2019, 16, 479, doi:10.3390/ijerph16030479 . . . . . . . . . . . . . . . . . . 326
Toni Alterman, Rebecca Tsai, Jun Ju and Kevin M. Kelly
Trust in the Work Environment and Cardiovascular Disease Risk: Findings from theGallup-Sharecare Well-Being IndexReprinted from: IJERPH 2019, 16, 230, doi:10.3390/ijerph16020230 . . . . . . . . . . . . . . . . . . 346
vii

About the Special Issue Editors
Diane Rohlman (Professor): Diane Rohlman is Center Director of the Healthier Workforce Center
of the Midwest, and Professor in the Department of Occupational and Environmental Health at
the University of Iowa, Iowa City, Iowa, as well as Director of the Agricultural Safety and Health
Training Program in the University of Iowa’s Heartland Center for Occupational Health and Safety.
She received her Master’s degree and PhD in Experimental Psychology from Bowling Green State
University in Ohio. Her research focuses on both basic and applied research designed to identify,
characterize, and prevent occupational and environmental illness and injury in high-risk populations.
Kevin Kelly (Associate Research Scientist/Adjunct Associate Professor): Kevin Kelly is the Deputy
Director, and Director of Evaluation, at the Healthier Workforce Center of the Midwest, and Adjunct
Associate Professor in the Department of Anthropology at the University of Iowa, Iowa City,
Iowa. He received his Master’s degree and PhD in Anthropology from the University of Illinois
at Urbana-Champaign. His research interests are in the biological and cultural aspects of human
health and variations. He has conducted research in diverse settings, and has applied a broad set of
quantitative, qualitative and mixed methods to that research.
ix

Preface to ”Using Total Worker Health R© to
Advance Worker Health and Safety”
It is now recognized that workplace aspects (scheduling, shift work, physically demanding
work, chemical exposure) not only increase the risk of injury and illness, but also impact health
behaviors (smoking, physical activity) and health outcomes (sleep disorders and fatigue, obesity,
musculoskeletal disorders). In turn, ill health and chronic conditions can affect performance at work,
increasing risk for injury, absenteeism, and reduced productivity. In the past few decades, programs
that expand the traditional focus of occupational safety and health to consider nontraditional
work-related sources of health and well-being have been shown to be more effective than programs
that separately address these issues. This Total Worker Health R© approach has been recognized by the
National Institute for Occupational Safety and Health (NIOSH) as a method for protecting the safety
and health of workers, while also advancing the overall well-being of these workers by addressing
work conditions.
This Special Issue is devoted to “Advancing Worker Health and Safety”. It includes basic and
applied research relevant to programs, policies, and practices that promote holistic approaches to
worker well-being. The volume begins with an overview of the NIOSH Total Worker Health program,
describing the history of the program and identifying new challenges with the rapidly changing
nature of work. The international importance of this topic is demonstrated by research addressing
working populations in the United States, Australia, Korea, Canada, and countries in the European
Union who are employed in worksites as varied as manufacturing, retail, healthcare, accounting,
construction, and mining.
Several articles address new workers to the workplace. These focus on providing training and
encouraging young workers to communicate about health and safety, the importance of preventing
injuries to reduce retention, and how supervisor support and clear work organization and policies can
help reduce stress among junior employees. Other articles describe the evaluation of interventions
among construction workers, young workers, and homecare workers. Required components for the
successful development, implementation, and adoption of interventions promoting worker safety
and well-being are identified (e.g., the elimination of hazards, leadership support, participatory
approaches in the design and delivery of programs, and evaluation metrics). Not surprisingly,
implementation differs across industries and by organization size.
This compendium presents work from an international collection of scholars exploring the
relationship between workplace factors and worker safety, health, and well-being. It provides
guidance for improving the organization and design of work environments, innovative strategies
for promoting worker well-being, and novel methods for exposing underlying occupational causes
of chronic disease.
We would like to thank all of the authors that took the time to contribute to this Special Issue,
and the editors and reviewers for their assistance.
Diane S. Rohlman, Kevin M. Kelly
Special Issue Editors
xi

International Journal of
Environmental Research
and Public Health
Review
Total Worker Health® 2014–2018: The Novel Approachto Worker Safety, Health, and Well-Being Evolves
Sara L. Tamers 1,*, L. Casey Chosewood 2, Adele Childress 1, Heidi Hudson 3, Jeannie Nigam 3
and Chia-Chia Chang 1
1 Centers for Disease Control and Prevention, National Institute for Occupational Safety and Health,395 E St. SW, Washington, DC 20201, USA; [email protected] (A.C.); [email protected] (C.-C.C.)
2 Centers for Disease Control and Prevention, National Institute for Occupational Safety and Health,1600 Clifton Rd., Atlanta, GA 30329, USA; [email protected]
3 Centers for Disease Control and Prevention, National Institute for Occupational Safety and Health,1150 Tusculum Ave, Cincinnati, OH 45226, USA; [email protected] (H.H.); [email protected] (J.N.)
* Correspondence: [email protected]
Received: 11 December 2018; Accepted: 22 January 2019; Published: 24 January 2019
Abstract: Background: The objective of this article is to provide an overview of and update on theOffice for Total Worker Health® (TWH) program of the Centers for Disease Control and Prevention’sNational Institute for Occupational Safety and Health (CDC/NIOSH). Methods: This article describesthe evolution of the TWH program from 2014 to 2018 and future steps and directions. Results:The TWH framework is defined as policies, programs, and practices that integrate protection fromwork-related safety and health hazards with promotion of injury and illness prevention efforts toadvance worker well-being. Conclusions: The CDC/NIOSH TWH program continues to evolve inorder to respond to demands for research, practice, policy, and capacity building information andsolutions to the safety, health, and well-being challenges that workers and their employers face.
Keywords: Total Worker Health®; occupational safety and health; worker well-being
1. Introduction
The mission of the United States (U.S.) Centers for Disease Control and Prevention’s NationalInstitute for Occupational Safety and Health (CDC/NIOSH) is rooted in its dedication to preservingand enhancing the total health of workers. This mission—to generate knowledge in the field ofoccupational safety and health and to transfer that knowledge into practice for the betterment ofworkers—generated the Total Worker Health® (TWH) program. As of 2015, the TWH framework isdefined as policies, programs, and practices that integrate protection from work-related safety andhealth hazards with promotion of injury and illness prevention efforts to advance worker well-being [1].TWH efforts protect the safety and health of workers and advance their well-being by fostering saferand healthier workplaces and by addressing work organization, employment and supervisory practices,and workplace culture. Integration can ensue through collaboration and coordinated programmingaround organizational leadership and commitment; supportive organizational policies and practices;management and employee engagement strategies; supportive benefits and incentives; accountabilityand training; and integrated real-time evaluation and surveillance that bring about corrective actionwhere required [2]. Frameworks and models have been published to help describe what integration islike in practice [3–5].
The original emergence of the TWH approach at NIOSH began years prior with the Steps to aHealthier U.S. Workforce Initiative in 2003, which explored the benefits of integrating worker safety andhealth protection efforts with health promoting ones [6]. As research developed and implementationincreased, the focus on the integration of health protection and health promotion expanded to a
IJERPH 2019, 16, 321; doi:10.3390/ijerph16030321 www.mdpi.com/journal/ijerph1
IJERPH 2019, 16, 321
framework with a greater appreciation of (and demand for) a growing set of worker well-beingdeterminants that impact safety and health. In 2014, as initiatives evolved and more research andinformation became available, NIOSH launched the Office for TWH Coordination and ResearchSupport (Office for TWH) to coordinate and advance research, programs, policy, and training incollaboration with intramural and extramural partners [7]. A comprehensive history on the evolutionof the TWH program prior to 2014 is available elsewhere [6,8].
Some traditional occupational safety and health (OSH) and worksite wellness programs (thatis, non-integrated, stand-alone, siloed approaches) have had a favorable impact. However, scientificevidence has increasingly found that for tackling the wide-ranging, complex concerns of workers,integrating OSH protection activities with health-enhancing ones may be more efficacious thanconcentrating on either of these activities alone [2,8–10]. More specifically, studies have shownthat emphasizing a TWH or integrated approach to jointly and comprehensively address work-relatedhazards and other exposures addresses the synergistic risks that exist, engendering more promisingefforts and results [8].
There has been much headway in the field of TWH over the past several years, and the TWHprogram has continued to develop. Integration efforts have expanded to consider the synergisticopportunities between and among the health of workers at and away from work and a broader look atthe interplay of work and non-work factors and influences on the well-being of workers. This articleprovides an update on the TWH program since the 2013 publication by Schill and Chosewood [6] anddescribes its evolution from 2014 to 2018—including major program accomplishments and stakeholderand partnership activities—as well as highlights of future directions.
2. Discussion
2.1. The 1st International Symposium to Advance Total Worker Health®
A vital and key event in the maturation of the TWH field was the convening of a TWH scientificconference. Building on prior initiatives and symposia, the Office for TWH held the 1st InternationalSymposium to Advance Total Worker Health® in 2014, at the U.S. National Institutes of Health (NIH) [11].Given that this was the very first symposium of its kind, the theme was “Total Worker Health,” andthese were its goals:
• Showcase current research that advances the concept of TWH;• Connect stakeholders who share an interest in TWH;• Provide resources and strategies for practitioners working to improve the health, safety and
well-being of workers; and• Inform a future research agenda to expand the evidence-base for TWH.
The symposium brought together over 17 partner organizations and more than 350 national andinternational scientists and practitioners. These participants represented academia, labor, industry, andgovernment, including workplace health, human resources, employee benefits, employee assistance,health promotion, organized labor, workers’ compensation, disability management, emergencyresponse, public health, health policy, health economics, organizational and occupational healthpsychology, industrial hygiene, and related disciplines.
Over the course of two days, attendees explored topics and issues relevant to a TWH perspective,such as TWH frameworks, research methods, integrated approaches, implementation, evaluation, andpractical toolkits. Sessions highlighted high-risk industries such as construction, transportation,and health care, particularly in the areas of work stress and psychosocial factors, obesity, andmusculoskeletal conditions. They also emphasized examples of integrated interventions for a changingworkforce, new employment patterns, physical/built environment, community/workplace supports,advances in return-to-work policies, and disability and rehabilitation management.
2
IJERPH 2019, 16, 321
2.2. The National Total Worker Health® Agenda
A prime feature of the 1st International Symposium to Advance Total Worker Health® was thelaunch of the National Total Worker Health® Agenda draft, another important and major step forwardin the growth of the TWH approach [12].
Over 20 years ago, NIOSH partnered with wide-ranging stakeholders to pinpoint and establishnational priorities for the most significant issues affecting workers across varied occupationsand industries, by means of an OSH research framework known as the National OccupationalResearch Agenda (NORA), now in its third decade. The goal of the first NORA in TWH (NationalTotal Worker Health® Agenda) was to encourage and motivate diverse stakeholders dedicated toconcurrently protecting workers from hazards in the workplace and advancing their well-being.These stakeholders include OSH practitioners, labor organizations, health promotion and wellnessprofessionals, researchers, workers, employers, educators, policymakers, health care providers, andmany others. In line with NORA tradition, NIOSH sought extensive stakeholder input during thedevelopment of the National Total Worker Health® Agenda. This ensured that it emphasized stakeholderpriority areas not only explicitly in TWH research but also in practice, policy, and capacity building.
To that end, in 2014, NIOSH announced in the Federal Register that a draft version of the TWHNORA, entitled “Proposed National Total Worker Health® Agenda,” was available for stakeholder review.The Office for TWH subsequently reviewed, synthesized, and responded to all comments and critiquesreceived [13]. On the basis of those comments, the Office for TWH added and further developed goals, andit refocused the TWH definition and approach. Refining the description ensured a better understanding ofthe program priorities and further differentiated the approach from traditional worksite health promotionprogramming that does not integrate worker safety and protection elements. Prioritizing a foundation ofsafety first, and then integrating workplace policies, programs, and practices that grow health, createsgreater worker well-being and is the cornerstone of the TWH framework.
The National Total Worker Health® Agenda goals reflect not only stakeholder comments but alsosources in the peer-reviewed literature [6,8,14–16] and two workshops. The latter were Total WorkerHealth™: Promising and Best Practices in the Integration of Occupational Safety and Health Protectionwith Health Promotion in the Workplace—A Workshop [17] and the Pathways to Prevention Workshop,Total Worker Health®: What’s Work Got to Do With It? [18].
Four strategic goals, each supported by several intermediate and activity/output goals, comprisethe following domains: research, practice, policy, and capacity building.
1. Research: Advance and conduct etiologic, surveillance, and intervention research that buildsthe evidence base for effectively integrating protection from work-related safety and health hazardswith promotion of injury and illness prevention efforts to advance worker well-being.
2. Practice: Increase the implementation of evidence-based programs and practices that integrateprotection from work-related safety and health hazards with promotion of injury and illness preventionefforts to advance worker well-being.
3. Policy: Increase adoption of policies that integrate protection from work-related safety andhealth hazards with promotion of injury and illness prevention efforts to advance worker well-being.
4. Capacity Building: Build capacity to strengthen the TWH workforce and TWH field tosupport the development, growth, and maintenance of policies, programs, and practices that integrateprotection from work-related safety and health hazards with promotion of injury and illness preventionefforts to advance worker well-being.
The continued fulfillment of these goals by stakeholders over the next years (2016–2026) willbetter safeguard the safety, health, and well-being of workers, support overall workforce vitality, andfoster economic prosperity.
2.3. Advances in TWH Research
The research goals in the National Total Worker Health® Agenda focus on advancing andconducting etiologic, surveillance, and intervention research activities that build the evidence base [12].
3
IJERPH 2019, 16, 321
Though the research base has grown, the field will benefit from further exploration of current and newresearch areas to solidify the evidence base and advance the field [19]. This led the Office for TWH todevelop the intramural research program and coordinate research-related activities, both intramurallyand extramurally, targeting priority topics and working populations [6]. At NIOSH, researchersare engaged in varied TWH activities such as conducting research, participating on the TWHsteering committee, providing support activities, presenting at seminars and in webinars, publishingpeer-reviewed papers, and engaging in collaborative stakeholder and partnership research efforts.
2.3.1. Issues Relevant to Advancing Worker Well-Being through Total Worker Health®
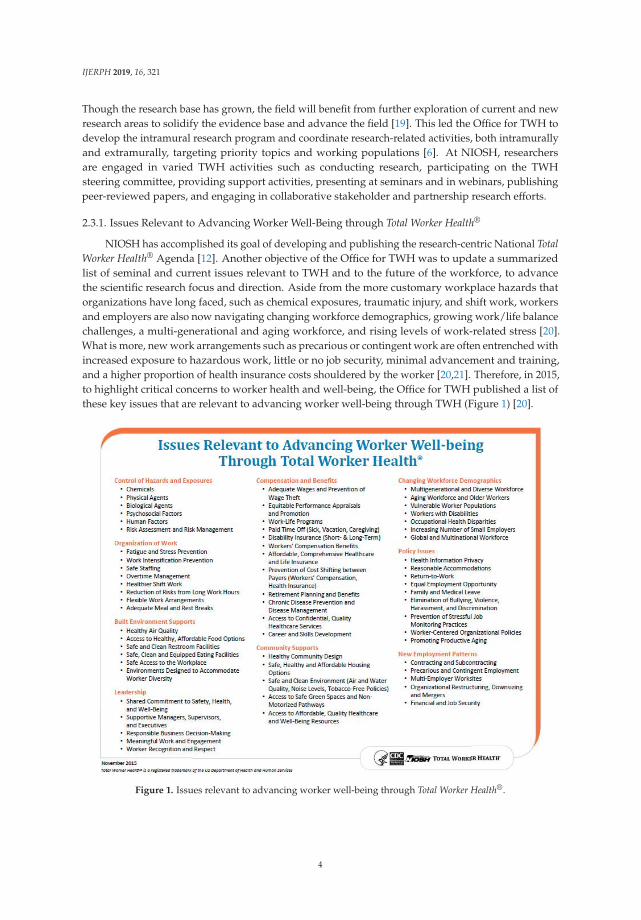
NIOSH has accomplished its goal of developing and publishing the research-centric National TotalWorker Health® Agenda [12]. Another objective of the Office for TWH was to update a summarizedlist of seminal and current issues relevant to TWH and to the future of the workforce, to advancethe scientific research focus and direction. Aside from the more customary workplace hazards thatorganizations have long faced, such as chemical exposures, traumatic injury, and shift work, workersand employers are also now navigating changing workforce demographics, growing work/life balancechallenges, a multi-generational and aging workforce, and rising levels of work-related stress [20].What is more, new work arrangements such as precarious or contingent work are often entrenched withincreased exposure to hazardous work, little or no job security, minimal advancement and training,and a higher proportion of health insurance costs shouldered by the worker [20,21]. Therefore, in 2015,to highlight critical concerns to worker health and well-being, the Office for TWH published a list ofthese key issues that are relevant to advancing worker well-being through TWH (Figure 1) [20].
Figure 1. Issues relevant to advancing worker well-being through Total Worker Health®.
4
IJERPH 2019, 16, 321
2.3.2. NIOSH Centers of Excellence for TWH
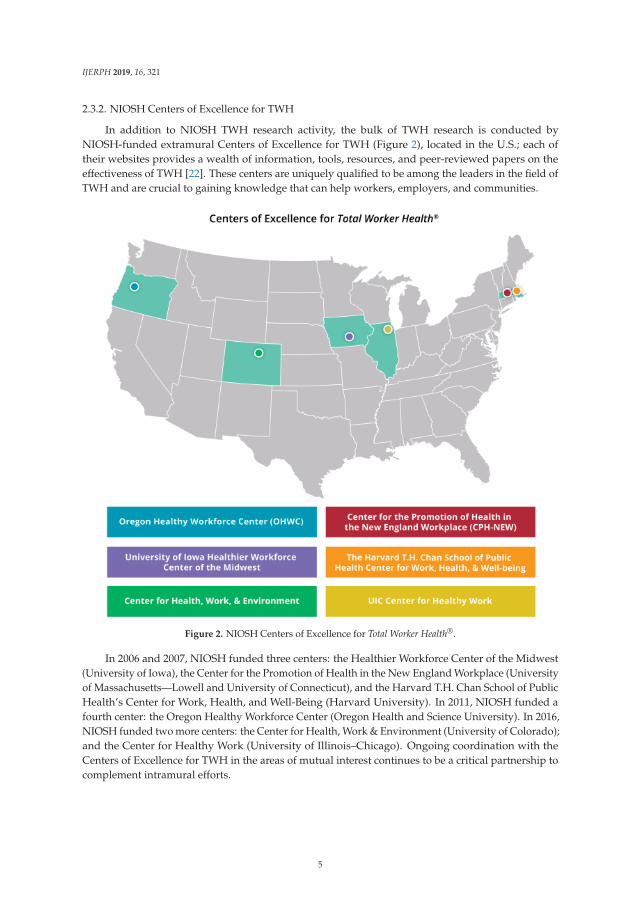
In addition to NIOSH TWH research activity, the bulk of TWH research is conducted byNIOSH-funded extramural Centers of Excellence for TWH (Figure 2), located in the U.S.; each oftheir websites provides a wealth of information, tools, resources, and peer-reviewed papers on theeffectiveness of TWH [22]. These centers are uniquely qualified to be among the leaders in the field ofTWH and are crucial to gaining knowledge that can help workers, employers, and communities.
Figure 2. NIOSH Centers of Excellence for Total Worker Health®.
In 2006 and 2007, NIOSH funded three centers: the Healthier Workforce Center of the Midwest(University of Iowa), the Center for the Promotion of Health in the New England Workplace (Universityof Massachusetts—Lowell and University of Connecticut), and the Harvard T.H. Chan School of PublicHealth’s Center for Work, Health, and Well-Being (Harvard University). In 2011, NIOSH funded afourth center: the Oregon Healthy Workforce Center (Oregon Health and Science University). In 2016,NIOSH funded two more centers: the Center for Health, Work & Environment (University of Colorado);and the Center for Healthy Work (University of Illinois–Chicago). Ongoing coordination with theCenters of Excellence for TWH in the areas of mutual interest continues to be a critical partnership tocomplement intramural efforts.
5
IJERPH 2019, 16, 321
2.3.3. Total Worker Health® Research Methodology Workshop
One such recent and vital effort that NIOSH, the NIOSH-funded Centers of Excellence for TWH,and several other external partners undertook was to assess methodological and measurement issuesfor TWH intervention research and establish concrete examples of how challenges can be overcometo drive research practices in the field of TWH. There were multiple goals for the workshop. Thefirst was to respond to two of the eight recommendations put forth by the Independent Panel ofthe Pathways to Prevention 2015 Meeting, co-sponsored by NIH and NIOSH: Total Worker Health®:What’s Work Got to Do With It? [18]: (1) expand research and evaluation design options to includea range of rigorous methodologies; and (2) develop a core set of measures and outcomes that areincorporated into all integrated intervention studies. The second was to respond to the intermediateand activity/output goals (Sections 1.3; 1.3.2–1.3.6) to apply and develop rigorous, standardizedmethods for TWH interventions, as outlined in the National Total Worker Health® Agenda [12]. Moredetail on the impetuses and need for such a workshop have been previously published in publiclyavailable papers [12,19,23].
Accordingly, in 2017, the University of Iowa’s College of Public Health and Healthier WorkforceCenter of the Midwest hosted the Total Worker Health® Research Methodology Workshop. Anopen-access peer-reviewed article summarizing this workshop, by Tamers et al. (2018), highlights theTWH research methodological and measurement approaches currently in use and suggests others thatthe workshop experts believe have the potential to advance the field through rigorous and repeatableTWH intervention research [24].
2.3.4. Worker Well-Being Framework
Another key TWH accomplishment in recent years is NIOSH’s partnership with the Research ANdDevelopment (RAND) Corporation to develop a framework for worker well-being and its subsequentstill-in-development survey instrument. The framework was published in 2018 [25] and will serveas a conceptual model for future research on worker well-being. The continued work of NIOSHand RAND to develop the survey will be useful in advancing the understanding of issues related toworker well-being.
2.4. Advances in TWH Practice
The practice goals in the National Total Worker Health® Agenda center on the need to increase theimplementation of evidence-based programs and practices [12]. Although the scientific evidence baseis relatively new, the uptake of the integrated concept of TWH has gained substantial traction amongleaders and practitioners in safety and health [26]. A testament that advancements in worker safety,health, and well-being are not entirely an academic enterprise is also demonstrated by industry andother private sector interest in TWH strategies [27,28].
2.4.1. Tools and Resources
A number of tool-kits, actionable guidance, web-based training, continuing education courses,and other practice-based resources that have been developed in recent years are available on the NIOSHTWH website and on the Centers of Excellence for TWH websites [22]. An increasing community ofstakeholders receive information about these tools and resources regularly through a multitude ofdissemination channels (i.e., social media, e-newsletters, and other media outlets) and through otheroutreach efforts and engagement programs. One of the most widely consumed outputs of NIOSH’scommunication efforts has been an electronic newsletter, TWH in Action! [29]. Published quarterlysince 2012, this e-newsletter now has more than 80,000 subscribers. Another highly popular resource isthe NIOSH Total Worker Health® Webinar series [30]. This free, online training platform features thelatest research and practice in the field of TWH and has provided continuing education credits to morethan 1000 physicians, nurses, health educators, and others.
6
IJERPH 2019, 16, 321
2.4.2. Hierarchy of Controls Applied to NIOSH Total Worker Health®
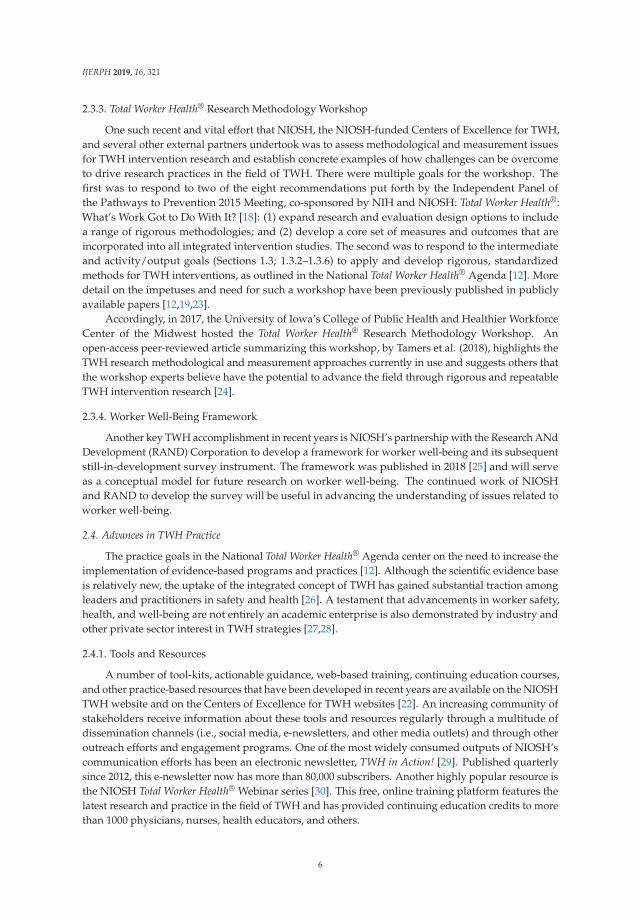
In 2015, the Office for TWH published the Hierarchy of Controls Applied to NIOSH Total WorkerHealth® (Figure 3)—adapted from the Hierarchy of Controls framework used in OSH—to strengthenthe link between traditional OSH approaches and TWH and to further illustrate the value of this kindof approach to practitioners who are quite familiar with this means toward risk mitigation [31]. As inthe traditional hierarchy, the controls and strategies are in descending order of likely effectiveness andprotectiveness. The emphasis on addressing system-level or environmental determinants of healthbefore individual-level approaches is a key tenet of the TWH approach.
Figure 3. Hierarchy of Controls Applied to NIOSH Total Worker Health®.
2.4.3. Fundamentals of Total Worker Health® Approaches
A central practice-based tool developed by the Office for TWH and published in 2016 is theFundamentals of Total Worker Health® Approaches: Essential Elements for Advancing Worker Safety,Health, and Well-Being [32]. To help organizations launch and sustain their own programs, theOffice for TWH developed this workbook centered on five fundamental steps essential to the TWHapproach. These five defining elements of TWH are guiding principles that provide practical directionfor organizations seeking to develop workplace policies, programs, and practices that contribute toworker safety, health, and well-being:
1. Demonstrate leadership commitment;2. Eliminate hazards and promote well-being;3. Engage workers in program design and delivery;4. Ensure confidentiality and privacy; and5. Integrate systems effectively.
2.4.4. Edited Volume on TWH
Forthcoming is an edited volume on TWH [33]. This book will bring together state-of-the-artresearch and practice in comprehensive, integrated prevention strategies from the most accomplishedscholars and practitioners in the field. The book will serve as premier guidance for interested
7
IJERPH 2019, 16, 321
professionals on the foundations of TWH, to further prevent adverse worker safety and healthoutcomes from contemporary work and work environments.
2.5. Advances in TWH Policy
The policy goals in the National Total Worker Health® Agenda aim to increase the adoption of TWHand related policies, mostly by external entities [12]. There has been growing interest in organizationalpolicies that integrate OSH with business strategy and practices. In particular, topics covered byguidance include responsible organizational and worker sustainability; small- and medium-sizedbusinesses; and risk management and workers’ compensation.
2.5.1. Partner and Stakeholder Efforts
Over the past few years, several initiatives have contributed to the National Total Worker Health®
Agenda’s intermediate goal of “implementing policy guidance developed from evidence-basedresearch and consensus statements to promote worker safety, health, and well-being” andactivity/output goals focused on promoting responsible organizational policies and sustainability ofworkers. These have been led by a number of stakeholders and partners, some with direct and somewith indirect or no firm affiliation to the Office for TWH.
For instance, the theme of the 11th International Conference on Occupational Stress and Healthin 2015, which NIOSH co-hosted along with the American Psychological Association and theSociety for Occupational Health Psychology, was Sustainable Work, Sustainable Health, SustainableOrganizations [34]. During the conference, researchers and practitioners discussed how sustainablework and worker well-being can affect economic growth and organizational health. The relevanceof OSH to sustainability was recognized by the U.S. Occupational Safety and Health Administration(OSHA) in its report based on interviews with stakeholders, Sustainability in the Workplace: ANew Approach for Advancing Worker Safety and Health [35]. To facilitate implementation of policyguidance, OSHA identified opportunities in shareholder engagement, recognition of OSH as a businessinnovation, rankings of businesses, and materiality of factors that affect business performance.
Similarly, the Center for Safety and Health Sustainability (CSHS), which represents morethan 70,000 OSH professionals in over 70 countries, has developed guidance supporting workersustainability [36]. CSHS recommended integrated reporting of both financial and non-financialinformation, such as environmental, social, and governance (ESG) issues, including human, intellectual,social, and relationship capital. To facilitate sustainability policies that take into considerationworker well-being, CSHS highlighted the need to understand how organizations create value fortheir stakeholders through various types of capital. In 2016, CSHS outlined guidance for OSH insustainability reports and key performance metrics to provide information on corporate performance.The Vitality Institute created a different approach, which recognized employee health as a crucial inputto organizational success and proposed a comprehensive scorecard for sustainability reporting, touse for making decisions and tracking progress. By reporting on job satisfaction and turnover, healthstatus, assessment of health risk, physical environment, corporate capacity, strategic communications,health policies/programs/practices, population health, corporate climate, leadership, and communityrelations, organizations can ensure that policies are supportive of worker well-being [37].
2.5.2. Small- and Medium-Sized Businesses
A further area of progress in policy implementation is the targeting of small- and medium-sizedcompanies and incorporation of TWH approaches within workers’ compensation systems, which areadditional activity/output goals in the National Total Worker Health® Agenda. To gather evidenceto guide organizational policies, NIOSH and the U.S. National Academy of Medicine convened apublic workshop noted earlier (Total Worker Health™: Promising and Best Practices in the Integrationof Occupational Safety and Health Protection with Health Promotion in the Workplace) to identifyprevalent and best practices in small, medium, and large workplaces. The summary report from this
8
IJERPH 2019, 16, 321
workshop, which included recommendations from experts on the workshop’s concluding reactorspanel, was published in 2014 [17]. Common elements identified include the importance of leaderrecognition and prioritization of TWH in a business culture, a “comprehensive perspective” on safety,and attention to activities that can help workers be healthier and more satisfied, which in turn canpositively impact businesses. Later in 2017, NIOSH and the Colorado School of Public Health’sCenter for Health, Work & Environment sponsored the International Understanding Small Enterprisesconference [38]. The conference enabled small business owners, researchers specializing in smallbusinesses, representatives from chambers of commerce, workers, and other stakeholders to sharepolicy strategies for engaging workers and increasing happiness and productivity by creating saferand healthier workplaces.
A newly developed key small-business resource is a series of videos created by the HealthierWorkforce Center of the Midwest. This center interviewed small businesses to identify gaps whereit would be useful to provide guidance, and the resulting videos have shed light on useful policiesfor small businesses that seek to implement TWH approaches. Additionally, implementation of TWHapproaches in workers’ compensation programs has occurred by way of two NIOSH TWH Affiliates:the Ohio Bureau of Workers’ Compensation (OBWC) and the State Accident Insurance Fund (SAIF),a workers’ compensation company in Oregon. The OBWC created a program to support the healthand well-being of workers for their client policyholders. SAIF shares the TWH approach with itspolicyholders and offers free consulting services to facilitate adoption of TWH policies. Furthermore,SAIF partnered with the Oregon OSHA and the Oregon Healthy Workforce Center to create a statewidealliance to encourage the updating of TWH policies in workplaces.
2.5.3. Voluntary Standards
For general policies, voluntary standards are useful for widespread adoption of a TWH approach.In 2018, the International Organization for Standardization (ISO) finalized the voluntary standardISO 45001—Occupational Health and Safety. Although the guidance does not specify requirementsfor responsible business practices, it enables integration of OSH management systems with othersystems, including those related to worker well-being [39]. Another related policy effort well-alignedwith the TWH approach is the National Standard of Canada for Psychological Health and Safety inthe Workplace; this could serve as a useful template for other nations seeking to improve workingconditions. Adoption of the Canadian voluntary standard, developed in 2013, has increased and thestandard has served as useful guidance internationally [40].
2.6. Advances in TWH Capacity Building
The capacity building goals in the National Total Worker Health® Agenda emphasize the needto build and strengthen the TWH workforce and field [12]. Multidisciplinary and comprehensivelytrained OSH professionals are essential to apply a TWH approach that addresses complex current andfuture workplace challenges, such as existing and emerging hazards and exposures, a multigenerationalworkforce, and rapid changes in technology. An important focus since the establishment of the Officefor TWH has been to develop and equip OSH professionals as well as allied workplace professionalswith the knowledge, skills, and training to prevent worker injury and illness and to advance healthand well-being.
2.6.1. NIOSH Workforce Development Framework Guidance
The NIOSH Workforce Development Framework Guidance, which is an unpublished NIOSH-leddocument, explores approaches to build capacity and identifies competencies and trainingprofessionals need to apply an integrated approach that addresses the diverse needs of the U.S.workforce. In 2014, the Office for TWH shared this guidance with stakeholders and partners. This wasan opportunity to identify current training needs and approaches, foster partnerships with researchand training centers, and identify additional organizations and collaborators (Schools of Business,
9
IJERPH 2019, 16, 321
Engineering, Nursing, Occupational Medicine Residency Programs, Public Health, and others). Theguidance includes five broad foci necessary for professionals to apply a more comprehensive TWHapproach, as well as recommendations for accomplishing this goal:
1. Identify training and professional development needs;2. Develop a list of current TWH training programs;3. Establish a TWH workforce development committee of interested stakeholders to discuss and
provide guidance on building capacity for a TWH workforce;4. Develop a list of TWH competencies; and5. Identify effective methods of training and standardize a TWH curriculum.
Key internal/external stakeholders and partners who are in a position to lead this charge includeprofessionals from academia, labor, OSH and health promotion, the private sector, human resources,and international partners and governments. Work in this area by the Office for TWH and myriadpartners, some of which is highlighted in this article, is ongoing.
2.6.2. TWH Training and Certificate Programs
During the 1st International Symposium to Advance Total Worker Health® [11], a plenary sessionconsisting of research and training experts from the NIOSH-funded Centers of Excellence for TWH,NIOSH-funded Education Research Centers (ERCs), and NIOSH TWH Affiliates covered currenttraining initiatives, plans to formally solicit external input and engage key stakeholders, curricularreform, and integration of TWH into NIOSH-funded ERCs. During this session, speakers andparticipants confirmed a growing need to increase the knowledge and skills of researchers andpractitioners to implement an integrated TWH approach through interdisciplinary education of theexisting and future workforce. Currently, a number of differing types of continuing education andcertificate programs are available or in development; such programs could include TWH approachesin already existent OSH or health promotion programs, or create new ones altogether. Theseinclude the University of Colorado [41]; the University of North Carolina—Chapel Hill; Oregon andPortland State Universities in collaboration with SAIF; Northern Kentucky University; and WesternKentucky University.
2.6.3. TWH Workforce Development Roundtable
Another key accomplishment in 2017 was the Office for TWH’s collaboration with theUniversity of North Carolina–Chapel Hill and Harvard University to convene a roundtablediscussion with partners from the NIOSH-funded Centers of Excellence for TWH, ERCs, organizedlabor, NIOSH-funded OSH training institutions, state health departments, professional societies,workplace-wellness training vendors, and other experts in the field. The roundtable discussionexplored training that could be incorporated into existing core OSH degree programs such asoccupational health nursing, occupational medicine, and industrial hygiene. The focus of theroundtable was to identify the highest priority audiences; perform needs assessments; identifycompetencies for TWH; and suggest effective training approaches and programs (certificate, continuingeducation, and others). Key findings and recommendations from a 2017 report by the University ofColorado (Uncovering Training Needs for Total Worker Health® Professionals: Results of a NationalContinuing Education Survey [unpublished data]) were also reviewed at the meeting and influencedfuture directions. Of individuals working within the OSH and peripheral fields (human resources,benefits, wellness), survey results found that 2.8% indicated TWH as their primary profession, 14%indicated TWH as a secondary work task, and 75% identified a need for basic and advanced TWHtraining (n = 1501).
10
IJERPH 2019, 16, 321
2.7. The 2nd International Symposium to Advance Total Worker Health®
The 2nd International Symposium to Advance Total Worker Health® was held four years after thefirst, in 2018, at NIH [11]. The theme of the symposium was “Work & Well-Being: How Safer, HealthierWork Can Enhance Well-Being,” and these were its goals:
• Reaffirm TWH dedication and commitment to the safety and health of workers by prioritizingsafety in all jobs;
• Redesign the organization of work to promote a workplace environment that optimizes healthyopportunities through leadership, management, and supervision;
• Reveal new strategies to redesign work to improve worker well-being through new links andsolutions for work and chronic disease risks; and
• Introduce novel research methods and interventions for advancing TWH.
More than 100 partners and affiliate organizations and nearly 400 participants from 37 statesand 15 countries attended the symposium, highlighting both a national and international demand forcritical TWH research, training, and implementation in the workplace.
Presenters from nonprofit, government, private, and academic institutions shared theirperspectives and research findings on TWH, as well as demonstrations of successful practicalapplications. Sessions included themes and topics on integrated TWH methods, approaches,interventions, evaluations, results, and recommendations from the NIOSH-funded Centers ofExcellence for TWH, NIOSH researchers, and other experts in the field. High-risk industries andoccupations, such as transportation, agriculture, firefighting and first response, manufacturing, healthcare, and law enforcement and corrections were the focus of many presentations. Speakers highlightedrisks, exposures, and health conditions facing many workers in these fields, such as acute and chronicdiseases, stress and mental health, fatigue, and violence.
Additional topics focused on the needs of small businesses, special populations, and governmentworkers; strategies for optimizing community collaborations, integration, organizational policies andpractices, supervision, and employee relations practices; and ways to enhance the work-life continuumand work design. Featured speakers covered worker health and well-being through the lens ofnew technologies, the current opioid crisis, globalization, and the rapidly evolving domestic andinternational economy. Finally, an important highlight was the launch of the Vision Zero Campaignfor North America, organized by the International Social Security Association, to engage partners,institutions, and organizations worldwide in reducing occupational accidents and diseases by focusingon responsible leadership and investing in healthy workplaces and a motivated workforce [42].
2.8. TWH Partnership and Stakeholder Involvement
As discussed throughout this article, partnership and stakeholder involvement across multiplefactions and disciplines has been and continues to be critical in advancing TWH research, practice,policy, and capacity building. To move the field of TWH forward, all stakeholders must work together,take ownership, and contribute.
Fundamental but sometimes challenging is demonstrating the value that a TWH approach bringsto long-term sustainability of employers, industry, and society. Perhaps one of the most criticaldevelopments is inspiring the gatekeepers of worker health—professionals in labor, healthcare, andpublic health—to engage in new ways that bring greater visibility to the value of an integratedapproach to worker safety and health [26,43,44]. Scholars believe this high-level engagement couldstimulate more alignment of the field with long-standing and current social movements (such aslabor rights, worker advocacy, sustainability-related responsible business practices, and paid familyleave) and encourage broader collaboration among and within labor, academia, government, andindustry [45]. For example, novel solutions to access worker populations could develop with new orbetter engagement with economic development [46], community-based, and labor organizations. The
11
IJERPH 2019, 16, 321
relationship between health and economic prosperity and national security is a priority of the U.S.Surgeon General [47].
In addition, new models of interventions at the workplace, community, industry, and society levelscould establish the results sought for simultaneously addressing work- and non-work-related risks.Many of these actions involve expanding the role of professionals who protect worker safety, health,and well-being. Examples of NIOSH successes in increasing recognition of the relationship betweenwork and health, as well as the role of community partnerships, include TWH participation in the U.S.National Academies Action Collaborative on Business Engagement in Building Healthy Communitiesand the U.S. National Academies of Medicine Action Collaborative on Clinician Well-Being andResilience [48,49].
Finally, a significant accomplishment in the development of new partners in recent years wasthe Office for TWH’s co-sponsorship with the NIH Office of Disease Prevention and the NationalHeart, Lung, and Blood Institute (NHLBI) to convene the 2015 NIH Pathways to Prevention WorkshopTotal Worker Health®: What’s Work Got to Do With It? [18]. Approval for the conference’s TWH themerequired buy-in from several other NIH offices/institutes and U.S. federal agencies, making this anoteworthy TWH partnership achievement in raising awareness of the importance of TWH issuesacross U.S. federal agencies. The workshop had over 700 registered attendees, making it the largestTWH event to date. Outcomes include a review of the literature on research gaps and an independentpanel report on future research priorities [23,50] as well as a new partnership with the American HeartAssociation and NHLBI to plan a meeting on workplace health.
NIOSH TWH Affiliates
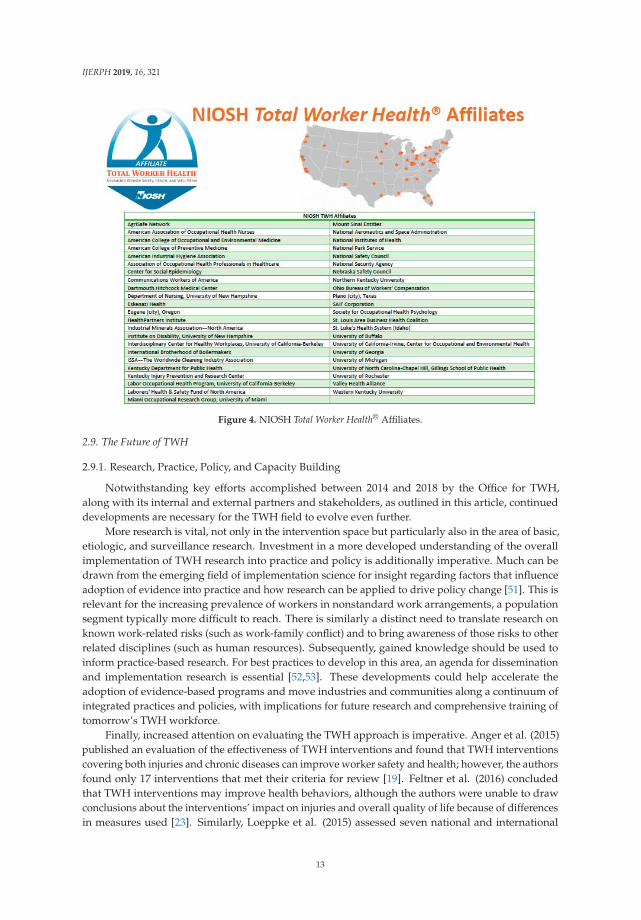
In addition to work done within NIOSH, the NIOSH-funded Centers of Excellence for TWH, andthe NIOSH-funded ERCs, TWH activities are shaped by the NIOSH TWH Affiliate program. The Officefor TWH established this partnership program in 2014 to recognize not-for-profit, labor, academic, andgovernment organizations that are advancing the TWH approach [28].
The program presently includes 45 NIOSH TWH Affiliates (Figure 4). Though the NIOSH TWHAffiliates do not receive funding from NIOSH, they are critical to all of the activities discussed inthis article, each in their own way. The academic NIOSH TWH Affiliates conduct valuable researchon systems approaches to worker well-being, organization of work, and workplace exposures andare leaders in the concept of an integrated framework for worker safety and health [28]. SomeNIOSH TWH Affiliates provide training to professionals and students in TWH and have beeninstrumental in research and intervention evaluations in work settings. Several also collaboratewith businesses to assess the effectiveness of workplace policies and practices. Labor union NIOSHTWH Affiliates are vital to ensure that worker involvement and outreach are embedded in TWHtranslation, education, and communication activities. Not-for-profit NIOSH TWH Affiliates are key insharing TWH messages with local employer organizations and in facilitating regional outreach. Theprofessional association/society NIOSH TWH Affiliates help translate research findings into trainingmaterials, share the latest promising practices, and provide continuing education to practitioners.Finally, employer-organization NIOSH TWH Affiliates help implement the TWH approach and, indoing so, provide successful TWH case studies from which other interested employers have learned.Relaying of ongoing NIOSH TWH Affiliate activities and development of collaborative efforts withNIOSH have also taken place during NIOSH TWH Affiliate-specific and other expert colloquia hostedannually by the Office for TWH since 2014.
12
IJERPH 2019, 16, 321
Figure 4. NIOSH Total Worker Health® Affiliates.
2.9. The Future of TWH
2.9.1. Research, Practice, Policy, and Capacity Building
Notwithstanding key efforts accomplished between 2014 and 2018 by the Office for TWH,along with its internal and external partners and stakeholders, as outlined in this article, continueddevelopments are necessary for the TWH field to evolve even further.
More research is vital, not only in the intervention space but particularly also in the area of basic,etiologic, and surveillance research. Investment in a more developed understanding of the overallimplementation of TWH research into practice and policy is additionally imperative. Much can bedrawn from the emerging field of implementation science for insight regarding factors that influenceadoption of evidence into practice and how research can be applied to drive policy change [51]. This isrelevant for the increasing prevalence of workers in nonstandard work arrangements, a populationsegment typically more difficult to reach. There is similarly a distinct need to translate research onknown work-related risks (such as work-family conflict) and to bring awareness of those risks to otherrelated disciplines (such as human resources). Subsequently, gained knowledge should be used toinform practice-based research. For best practices to develop in this area, an agenda for disseminationand implementation research is essential [52,53]. These developments could help accelerate theadoption of evidence-based programs and move industries and communities along a continuum ofintegrated practices and policies, with implications for future research and comprehensive training oftomorrow’s TWH workforce.
Finally, increased attention on evaluating the TWH approach is imperative. Anger et al. (2015)published an evaluation of the effectiveness of TWH interventions and found that TWH interventionscovering both injuries and chronic diseases can improve worker safety and health; however, the authorsfound only 17 interventions that met their criteria for review [19]. Feltner et al. (2016) concludedthat TWH interventions may improve health behaviors, although the authors were unable to drawconclusions about the interventions’ impact on injuries and overall quality of life because of differencesin measures used [23]. Similarly, Loeppke et al. (2015) assessed seven national and international
13
IJERPH 2019, 16, 321
guidelines aimed at worker safety, health, and well-being and concluded that there was promise butconsiderable variation in the guidelines on strategies, evidence, and strategic elements [26].
2.9.2. Healthy Work Design and Well-Being
In addition to forthcoming critical work by external TWH stakeholders and partners, NIOSHcontinues to make considerable headway. The TWH program has had a widespread impact on otherNIOSH programs through the recognition of well-being as an imperative component of the NIOSHintramural research program structure. Indeed, the Office for TWH influenced the overall researchtrajectory of NIOSH, bringing to life the construct of worker well-being [25] into the decades-oldNORA portfolio. This included enhancing future collaborations and deepening connections in the areaof improved work design and well-being across NIOSH.
The programmatic synthesis of elements of three separate and independent programs: TWH,economics, and work organization and stress-related disorders is evident in a newly developedprogram entitled, Healthy Work Design and Well-Being (HWD). HWD is one of only seven NORAcross-sector programs in the third decade of NORA. The HWD program seeks to improve the designof work, work environments, and management practices in order to advance worker safety, health,and well-being. This program works with partners in labor, industry, trade associations, professionalorganizations, and academia to accomplish its goals.
Work design has implications for the safety, health, well-being, and functioning of individuals,families, groups, organizations, and communities. Like the TWH approach, the HWD program viewsworkplaces as settings not only to impact work-related risks, such as unsafe working conditions,high job demands, and low control, but also to promote workplace programs and conditions thatprovide support for workers’ health and well-being, such as smoking cessation or promotion of healthyphysical activity [54]. The close alignment and potential for synergy with TWH efforts is apparent,rich, and compelling.
Healthy work design efforts include primary-level interventions that change the design of boththe physical workspace and work processes to reduce sedentary behavior and increase physical activityduring the work day. Furthermore, these efforts collectively serve another critical function, which is tosupport the overall well-being of workers. Worker well-being characterizes quality of life with respectto an individual’s health and work-related environmental, organizational, and psychosocial factors [25].Organizational practices that focus on prevention of safety and health hazards and promotion ofwell-being typically involve multi-level approaches that include commitment and involvement frommanagement as well as worker input on identification of effective strategies.
Going forward, the HWD program, along with TWH professionals and other partners, will furtherour understanding of healthy work design and advance worker well-being through researching,implementing interventions, and translating findings into practice.
2.9.3. New Workforce Challenges
As time goes on, the Office for TWH will strive to bring credible solutions to not only on-goingbut also new challenges facing workers and employers. One such pressing example the CDC isprioritizing—as is the Office for TWH—is the need for comprehensive remedies to the U.S. opioidepidemic, from which the workplace and workers are not immune.
The U.S. Bureau of Labor Statistics reported that overdose deaths at work from non-medical useof drugs or alcohol increased by at least 38% annually between 2013 and 2016. The 217 workplaceoverdose deaths reported in 2016 accounted for 4.2% of occupational injury deaths that year, comparedwith 1.8% in 2013 [55]. Opioids are often initially prescribed to manage pain arising from a work injurythough workers can develop a subsequent non-work injury related dependence, making this a criticalissue for all those involved in worker safety, health, and well-being. Though opioid use/misuse ratesare higher in certain occupations/industries, there are some commonplace factors associated withuse/misuse; these include heavy workloads; hazards causing slips, trips, and falls; job insecurity;
14
IJERPH 2019, 16, 321
job loss; and high-demand/low-control jobs [56]. Further, rates are higher in occupations with loweravailability of paid sick leave, suggesting that the need to return to work soon after an injury maycontribute to high rates of opioid-related overdose deaths [57,58].
Whether they involve examining antecedents of drug use or developing strategies for thosereturning to the workplace while recovering from addiction, TWH strategies can offer guidance foremployers to follow. Briefly, using NIOSH- and the Office for TWH-developed resources [31,32,59],early efforts would focus on eliminating or minimizing working conditions that may predispose toworker injury or illness or that lead to increased levels of worker stress or excessive work demands.Next, educating occupational health providers, onsite and community-wide, of the organization’spolicies related to return-to-work after an injury and after the prescribing of opioids would beimperative. Additional steps would be taken to educate and train leaders, managers, and supervisorsabout likely red flags to observe, and how to effectively, efficiently, and compassionately address these.Careful examination of the impacts, risks, and considerations of safety-sensitive jobs and particularworker duties would occur, as well as of pre-employment/ongoing requirements. Finally, workers andtheir families would be provided with the necessary education on the proper and safe use of opioids,both at work and away from work. The Office for TWH and others across NIOSH are diligentlyworking on actionable guidance and recommendations, materials, and resources to help address theopioid crisis affecting workers and employers [60].
No matter the complex, multi-faceted, or new challenge facing the future workforce, the Officefor TWH will continue to work with its partners and stakeholders to effectively tackle issues amenableto integrated and comprehensive solutions that account for work and non-work factors.
3. Conclusions
The TWH framework, while rooted in the bedrock of worker health protection and prevention,must be a living, breathing entity, responding to the changing needs of workers, organizations, andthe U.S. economy. Perennial challenges of the work environment, such as safety hazards, workstress, mental health, substance misuse, and chronic disease, are prime targets for integrated, holisticapproaches rather than the more limited, siloed ones of the past. Where worker health issues cross theboundaries of work and home, affecting the lives of workers in and out of the workplace, there will bea place for TWH strategies that bridge this distance.
Author Contributions: Conceptualization, S.L.T., L.C.C., A.C., H.H., J.N. and C.-C.C.; Supervision, S.L.T.;Writing—original draft, S.L.T., L.C.C., A.C., H.H., J.N. and C.-C.C.; Writing—review & editing, S.L.T., L.C.C., A.C.,H.H., J.N. and C.-C.C. All authors read and approved the final manuscript.
Funding: This research received no external funding.
Acknowledgments: The authors express their thanks to Harpriya Kaur, Sara Luckhaupt, Anita Schill, ReidRichards, and Seleen Collins for reviewing and editing the manuscript. The findings and conclusions in thispaper are those of the authors and do not necessarily represent the official position of the National Institute forOccupational Safety and Health, Centers for Disease Control and Prevention.
Conflicts of Interest: The authors declare no conflict of interest.
References
1. National Institute for Occupational Safety and Health. What Is Total Worker Health? Available online:https://www.cdc.gov/niosh/twh/totalhealth.html (accessed on 8 March 2018).
2. Sorensen, G.; McLellan, D.; Dennerlein, J.T.; Pronk, N.P.; Allen, J.D.; Boden, L.I.; Okechukwu, C.A.;Hashimoto, D.; Stoddard, A.; Wagner, G.R. Integration of health protection and health promotion: Rationale,indicators, and metrics. J. Occup. Environ. Med. 2013, 55 (Suppl. 12), S12–S18. [CrossRef] [PubMed]
3. Institute of Medicine. Integrating Employee Health: A Model Program for NASA. 2005. Availableonline: https://www.nap.edu/catalog/11290/integrating-employee-health-a-model-program-for-nasa(accessed on 22 September 2018).
15
IJERPH 2019, 16, 321
4. Pronk, N. Integrated worker health protection and promotion programs: Overview and perspectives onhealth and economic outcomes. J. Occup. Environ. Med. 2013, 55 (Suppl. 12), S30–S37. [CrossRef] [PubMed]
5. Punnett, L.; Cherniack, M.; Henning, R.; Morse, T.; Faghri, P.; Team, C.-N.R. A conceptual framework forintegrating workplace health promotion and occupational ergonomics programs. Public Health Rep. 2009,124 (Suppl. 1), 16–25. [CrossRef] [PubMed]
6. Schill, A.L.; Chosewood, L.C. The NIOSH Total Worker Health program: An overview. J. Occup. Environ. Med.2013, 55 (Suppl. 12), S8–S11. [CrossRef] [PubMed]
7. National Institute for Occupational Safety and Health. Total Worker Health. Available online:https://www.cdc.gov/niosh/twh/ (accessed on 3 August 2018).
8. National Institute for Occupational Safety and Health. Research Compendium; The NIOSH Total Worker Health™Program: Seminal Research Papers 2012; DHHS (NIOSH) Publication No. 2012-146; U.S. Department of Healthand Human Services, Centers for Disease Control and Prevention, National Institute for Occupational Safetyand Health: Cincinnati, OH, USA, 2012.
9. DeJoy, D.; Southern, D. An integrative perspective on work-site health promotion. J. Occup. Med. 1993, 35,1221–1230. [PubMed]
10. Sauter, S.L. Integrative approaches to safeguarding the health and safety of workers. Ind. Health 2013, 51,559–561. [CrossRef] [PubMed]
11. National Institute for Occupational Safety and Health. 1st and 2nd International Symposia to AdvanceTotal Worker Health®. Available online: https://www.cdc.gov/niosh/TWH/symposium.html (accessed on30 October 2018).
12. National Institute for Occupational Safety and Health. National Occupational Research Agenda (NORA)/NationalTotal Worker Health® Agenda (2016–2026): A National Agenda to Advance Total Worker Health® Research,Practice, Policy, and Capacity; DHHS (NIOSH) Publication 2016-114; U.S. Department of Health and HumanServices, Centers for Disease Control and Prevention, National Institute for Occupational Safety and Health:Cincinnati, OH, USA, 2016.
13. National Institute for Occupational Safety and Health. NIOSH Response to Summarized Stakeholders’Comments. Available online: https://www.cdc.gov/niosh/twh/pdfs/NIOSH-Response-to-Summarized-Stakeholders-Comments_4_12_16.pdf (accessed on 27 December 2018).
14. Cherniack, M.; Henning, R.; Merchant, J.; Punnett, L.; Sorensen, G.; Wagner, G. Statement on NationalWorkLife Priorities. Am. J. Ind. Med. 2010, 54, 10–20. [CrossRef]
15. Hymel, P.A.; Loeppke, R.R.; Baase, C.M.; Burton, W.N.; Hartenbaum, N.P.; Hudson, T.W.; McLellan, R.K.;Mueller, K.L.; Roberts, M.A.; Yarborough, C.M.; et al. Workplace health protection and promotion: A newpathway for a healthier—And safer—Workforce. J. Occup. Environ. Med. 2011, 53, 695–702. [CrossRef]
16. Sorensen, G.; Landsbergis, P.; Hammer, L.; Amick, B.C., 3rd; Linnan, L.; Yancey, A.; Welch, L.S.; Goetzel, R.Z.;Flannery, K.M.; Pratt, C.; et al. Preventing chronic disease in the workplace: A workshop report andrecommendations. Am. J. Public Health 2011, 101 (Suppl. 1), S196–S207. [CrossRef]
17. Institute of Medicine. Promising and Best Practices in Total Worker Health: Workshop Summary; TheNational Academies Press: Washington, DC, USA, 2014; Available online: http://www.iom.edu/Activities/Environment/TotalWorkerHealth/2014-MAY-22.aspx (accessed on 22 September 2018).
18. National Institutes of Health and National Institute for Occupational Safety and Health Pathways to PreventionWorkshop. Total Worker Health: What’s Work Got to Do with It? Available online: https://prevention.nih.gov/programs-events/pathways-to-prevention/workshops/total-worker-health (accessed on 22 February 2018).
19. Anger, W.K.; Elliot, D.L.; Bodner, T.; Olson, R.; Rohlman, D.S.; Truxillo, D.M.; Kuehl, K.S.; Hammer, L.B.;Montgomery, D. Effectiveness of total worker health interventions. J. Occup. Health Psychol. 2015, 20, 226–247.[CrossRef]
20. National Institute for Occupational Safety and Health. Issues Relevant to Advancing Worker Well-Beingthrough Total Worker Health. Available online: https://www.cdc.gov/niosh/twh/pdfs/TWH-Issues-4x3_10282015_final.pdf (accessed on 27 January 2018).
21. McLellan, R.K. Work, Health, And Worker Well-Being: Roles and Opportunities For Employers. Health Aff.(Millwood) 2017, 36, 206–213. [CrossRef] [PubMed]
22. National Institute for Occupational Safety and Health. Centers of Excellence. Available online: https://www.cdc.gov/niosh/twh/centers.html (accessed on 11 October 2018).
16
IJERPH 2019, 16, 321
23. Feltner, C.; Peterson, K.; Palmieri Weber, R.; Cluff, L.; Coker-Schwimmer, E.; Viswanathan, M.; Lohr, K.N.The Effectiveness of Total Worker Health Interventions: A Systematic Review for a National Institutes ofHealth Pathways to Prevention Workshop. Ann. Intern. Med. 2016, 165, 262–269. [CrossRef] [PubMed]
24. Tamers, S.L.; Goetzel, R.; Kelly, K.M.; Luckhaupt, S.; Nigam, J.; Pronk, N.P.; Rohlman, D.S.; Baron, S.;Brosseau, L.M.; Bushnell, T.; et al. Research Methodologies for Total Worker Health®: Proceedings from aWorkshop. J. Occup. Environ. Med. 2018, 60, 968–978. [CrossRef] [PubMed]
25. Chari, R.; Chang, C.C.; Sauter, S.L.; Sayers, E.L.P.; Cerully, J.L.; Schulte, P.; Schill, A.L.; Uscher-Pines, L.Expanding the Paradigm of Occupational Safety and Health: A New Framework for Worker Well-Being.J. Occup. Environ. Med. 2018, 60, 589–593. [CrossRef] [PubMed]
26. Loeppke, R.R.; Hohn, T.; Baase, C.; Bunn, W.B.; Burton, W.N.; Eisenberg, B.S.; Ennis, T.; Fabius, R.;Hawkins, R.J.; Hudson, T.W.; et al. Integrating health and safety in the workplace: How closely aligninghealth and safety strategies can yield measurable benefits. J. Occup. Environ. Med. 2015, 57, 585–597.[CrossRef] [PubMed]
27. National Institute for Occupational Safety and Health. Promising Practices for Total Worker Health. Availableonline: https://www.cdc.gov/niosh/twh/practices.html (accessed on 12 September 2018).
28. National Institute for Occupational Safety and Health. Total Worker Health Affiliates. Available online:https://www.cdc.gov/niosh/twh/affiliate.html (accessed on 2 September 2018).
29. National Institute for Occupational Safety and Health. TWH in Action! eNewsletter. Available online:https://www.cdc.gov/niosh/twh/newsletter/default.html (accessed on 6 December 2018).
30. National Institute for Occupational Safety and Health. Total Worker Health Webinar Series. Available online:https://www.cdc.gov/niosh/twh/webinar.html (accessed on 6 December 2018).
31. National Institute for Occupational Safety and Health. The Hierarchy of Controls Applied to Total Worker Health.Available online: https://www.cdc.gov/niosh/twh/letsgetstarted.html (accessed on 22 September 2017).
32. Lee, M.P.; Hudson, H.; Richards, R.; Chang, C.C.; Chosewood, L.C.; Schill, A.L. Fundamentals of Total WorkerHealth Approaches: Essential Elements for Advancing Worker Safety, Health, and Well-Being; DHHS (NIOSH)Publication No. 2017-112; U.S. Department of Health and Human Services, Centers for Disease Control andPrevention, National Institute for Occupational Safety and Health: Cincinnati, OH, USA, 2016.
33. Hudson, H.L.; Nigam, J.S.; Sauter, S.L.; Chosewood, L.C.; Schill, A.S.; Howard, J. Total Worker Health:Integrative Approaches to Safety, Health, and Well-Being; American Psychological Association: Washington, DC,USA, 2018; in press.
34. American Psychological Association Work, Stress and Health. 2015: Sustainable Work, SustainableHealth, Sustainable Organizations. Available online: https://www.apa.org/wsh/past/2015/index.aspx(accessed on 2 October 2018).
35. Occupational Safety & Health Administration. Sustainability in the Workplace: A New Approach forAdvancing Worker Safety and Health. Available online: www.osha.gov/sustainability (accessed on 2October 2018).
36. Center for Safety and Health Sustainability. Center for Safety and Health Sustainability. Available online:http://www.centershs.org/aboutus.php (accessed on 20 September 2018).
37. Vitality Institute. Reporting on Health: A Roadmap for Investors, Companies, and Reporting Platforms.Available online: www.thevitalityinstitute.org/healthreporting (accessed on 3 September 2018).
38. National Institute for Occupational Safety and Health. Understanding small enterprises: proceedings from the2017 conferenc; Cunningham, T., Schulte, P., Jacklitsch, B., Burnett, G., Newman, L., Brown, C., Haan, M.,Eds.; DHHS (NIOSH) Publication No. 2019-108; U.S. Department of Health and Human Services, Centersfor Disease Control and Prevention, National Institute for Occupational Safety and Health: Cincinnati, OH,USA, 2018.
39. International Organization for Standardization. Occupational Health and Safety ManagementSystems—Requirements with Guidance for Use. Available online: https://www.iso.org/obp/ui/#iso:std:iso:45001:ed-1:v1:en (accessed on 11 October 2018).
40. Mental Health Commission of Canada National Standard of Canada for Psychological Health and Safetyin the Workplace. Available online: https://www.mentalhealthcommission.ca/English/what-we-do/workplace/national-standard (accessed on 4 September 2018).
17
IJERPH 2019, 16, 321
41. University of Colorado. Certificate in Total Worker Health. Available online: http://www.ucdenver.edu/academics/colleges/PublicHealth/Academics/degreesandprograms/certificate/Pages/TotalWorkerHealth.aspx (accessed on 2 October 2018).
42. International Society Security Association. Vision Zero. Available online: http://visionzero.global/(accessed on 2 October 2018).
43. Black, C. Working for a Healthier Tomorrow. 2008. Available online: https://www.rnib.org.uk/sites/default/files/Working_for_a_healthier_tomorrow.pdf (accessed on 10 October 2018).
44. Sepulveda, M.J. From worker health to citizen health: Moving upstream. J. Occup. Environ. Med. 2013, 55(Suppl. 12), S52–S57. [CrossRef] [PubMed]
45. Peckham, T.K.; Baker, M.G.; Camp, J.E.; Kaufman, J.D.; Seixas, N.S. Creating a future for occupational health.Ann. Work Expo. Health 2017, 61, 3–15.
46. Adams, J.M. The Value of Wellness. Public Health Rep. 2018, 133, 127–129.47. U.S. Department of Health and Human Services. The Surgeon General’s Priorities. Available online:
https://www.surgeongeneral.gov/priorities/index.html#econ (accessed on 6 December 2018).48. National Academies of Sciences, Engineering and Medicine, Action Collaborative on Business Engagement Building
Healthy Communities. Available online: http://www.nationalacademies.org/hmd/Activities/PublicHealth/~{}/link.aspx?_id=3DEB3B97AEDA43FCBDBF4AB2091E1A87&_z=z (accessed on 6 December 2018).
49. National Academy of Medicine. Action Collaborative on Clinician Well-Being and Resilience. Availableonline: https://nam.edu/initiatives/clinician-resilience-and-well-being/ (accessed on 6 December 2018).
50. Curry, S.; Bradley, C.; Grossman, D.; Hubbard, R.; Ortega, A. NIH Pathways to Prevention Workshop TotalWorker Health®: What’s Work Got to Do with It? 2015. Available online: https://prevention.nih.gov/sites/default/files/documents/twh/twh-final-report-2016.pdf (accessed on 7 October 2018).
51. Bradley, C.J.; Grossman, D.C.; Hubbard, R.A.; Ortega, A.N.; Curry, S.J. Integrated Interventions for ImprovingTotal Worker Health: A Panel Report From the National Institutes of Health Pathways to PreventionWorkshop: Total Worker Health-What’s Work Got to Do With It? Ann. Intern. Med. 2016, 165, 279–283.[CrossRef]
52. Dugan, A.G.; Farr, D.A.; Namazi, S.; Henning, R.A.; Wallace, K.N.; El Ghaziri, M.; Punnett, L.;Dussetschleger, J.L.; Cherniack, M.G. Process evaluation of two participatory approaches: Implementing totalworker health(R) interventions in a correctional workforce. Am. J. Ind. Med. 2016, 59, 897–918. [CrossRef]
53. Schulte, P.A.; Cunningham, T.R.; Nickels, L.; Felknor, S.; Guerin, R.; Blosser, F.; Chang, C.C.; Check, P.;Eggerth, D.; Flynn, M.; et al. Translation research in occupational safety and health: A proposed framework.Am. J. Ind. Med. 2017, 60, 1011–1022. [CrossRef] [PubMed]
54. Sorensen, G.; Stoddard, A.; Quintiliani, L.; Ebbeling, C.; Nagler, E.; Yang, M.; Pereira, L.; Wallace, L. Tobaccouse cessation and weight management among motor freight workers: Results of the gear up for health study.Cancer Causes Control 2010, 21, 2113–2122. [CrossRef] [PubMed]
55. Bureau of Labor Statistics. Economic News Release: Census of Fatal Occupational Injuries Summary, 2017; Bureauof Labor Statistics: Washington, DC, USA, 2017. Available online: https://www.bls.gov/news.release/cfoi.nr0.htm (accessed on 12 September 2018).
56. Kowalski-McGraw, M.; Green-McKenzie, J.; Pandalai, S.P.; Schulte, P.A. Characterizing the Interrelationshipsof Prescription Opioid and Benzodiazepine Drugs with Worker Health and Workplace Hazards. J. Occup.Environ. Med. 2017, 59, 1114–1126. [CrossRef] [PubMed]
57. Massachusetts Department of Public Health. Opioid-Related Overdose Deaths in Massachusetts by Industryand Occupation, 2011–2015; MDPH Occupational Health Surveillance Program: Boston, MA, USA, 2018.Available online: https://www.mass.gov/files/documents/2018/08/15/opioid-industry-occupation.pdf(accessed on 1 November 2018).
58. Centers for Disease Control and Prevention. Occupational Patterns in Unintentional and UndeterminedDrug-Involved and Opioid-Involved Overdose Deaths—United States, 2007–2012; U.S. Department of Healthand Human Services, Centers for Disease Control and Prevention: Atlanta, GA, USA, 2018. Availableonline: https://www.cdc.gov/mmwr/volumes/67/wr/mm6733a3.htm?s_cid=mm6733a3_e (accessed on1 November 2018).
18

IJERPH 2019, 16, 321
59. National Institute for Occupational Safety and Health. Total Worker Health Tools: Let’s Get Started. Availableonline: https://www.cdc.gov/niosh/twh/letsgetstarted.html (accessed on 22 September 2017).
60. National Institute for Occupational Safety and Health. Opioids. Available online: https://www.cdc.gov/niosh/topics/opioids/default.html (accessed on 3 January 2019).
© 2019 by the authors. Licensee MDPI, Basel, Switzerland. This article is an open accessarticle distributed under the terms and conditions of the Creative Commons Attribution(CC BY) license (http://creativecommons.org/licenses/by/4.0/).
19
International Journal of
Environmental Research
and Public Health
Article
Understanding the Role of Academic Partners asTechnical Assistance Providers: Results from anExploratory Study to Address Precarious Work
Tessa Bonney *, Christina Welter, Elizabeth Jarpe-Ratner and Lorraine M. Conroy
Environmental and Occupational Health Sciences, School of Public Health, University of Illinois at Chicago,Chicago, IL 60607, USA* Correspondence: [email protected]
Received: 23 September 2019; Accepted: 12 October 2019; Published: 15 October 2019
Abstract: Universities may be well poised to support knowledge, skill, and capacity-building effortsto foster the development of multi-level interventions to address complex problems. Researchers atthe University of Illinois at Chicago (UIC) engaged organizations interested in developing policy- andsystems-level initiatives to address the drivers of precarious work in a six-meeting Action Learning(AL) process, in which the researchers served as technical assistance (TA) providers focused onfacilitating learning and promoting critical thinking among participants. This exploratory qualitativestudy examined the role, facilitators, challenges, and impacts of university facilitation in this context.A total of 22 individuals participated in this study, including UIC TA providers, content expert TAproviders from labor-focused organizations, and TA recipients from health-focused organizations.Results from interviews and a focus group highlight the utility of a university connecting organizationsfrom different disciplines that do not traditionally work together, and suggest that the TA provided byUIC helped participants think concretely about precarious work and ways in which their organizationsmight work collaboratively to bring about sustainable change. Findings from this study suggest thatuniversity facilitation using an AL approach may be effective in increasing knowledge to action.
Keywords: precarious work; action learning; technical assistance; community-university partnership;policy, systems, and environmental (PSE) change
1. Introduction
In recent years, the National Institute for Occupational Safety and Health (NIOSH) has fundedseveral Total Worker Health® Centers for Excellence at universities across the United States with thegoal of building scientific evidence around innovative approaches to address complex problems facedby workers in the United States [1]. Occupational safety and health researchers and practitionersare increasingly called to navigate the complexities of a changing work landscape, in which workarrangements have increasingly shifted away from standard, full-time employment with benefitstoward non-standard, “atypical”, and precarious work arrangements such as employment in temporaryor contract jobs [2]. The University of Illinois at Chicago (UIC) Center for Healthy Work, one of theNIOSH Total Worker Health (TWH) Centers for Excellence, has focused its efforts on understandingthe barriers faced by workers in these precarious jobs in Illinois, and building evidence around thedevelopment of interventions to remove those barriers [3].
Over the past several years, a subset of researchers at the UIC Center for Healthy Work haveengaged with individuals and organizations in Chicago and across the state of Illinois to betterunderstand the causes and consequences of precarious work and initiatives that are already underwayto address them. One of the Center for Healthy Work’s aims is to work with a variety of organizationalpartners, across sectors and levels, to build organizations’ capacities to develop and implement
IJERPH 2019, 16, 3903; doi:10.3390/ijerph16203903 www.mdpi.com/journal/ijerph20
IJERPH 2019, 16, 3903
interventions to address the barriers to healthy work. While some studies have examined thevalue and impacts of community–university engagement in research and practice partnerships [4–6],existing studies have not focused on universities as a convener for processes focused heavily onplanning and preparing for action, and focused less on traditional research methodology. The UICCenter for Healthy Work is examining the role that a university can play in supporting knowledge,skills, and overall capacity-building efforts to foster the development of multi-level initiatives toaddress precarious work.
1.1. Precarious Work and the Healthy Work Collaborative Initiative
The term “precarious work” has been used to describe work that is “uncertain, unpredictable,and risky from the point of view of the worker” [7]. The rise in precarious work in the US can be linkedto macroeconomic changes that resulted in increased global competition, which led to outsourcingof labor, weakened labor unions, and deregulation of the labor market [7]. Employers have soughtto minimize costs by shifting jobs away from standard, full-time work arrangements toward a moreflexible labor market. These more flexible, precarious work arrangements are characterized by lowwages, a lack of protection from termination, variable work schedules, disproportionate exposure tohealth and safety hazards in the workplace, and working conditions that cause high psychosocialstress [2,8–10]. Without intervention, a growing share of workers in the US will experience precariousemployment conditions, regardless of occupation [11].
Although studies increasingly show that these highly precarious work arrangements adverselyaffect the health of workers [12–15], interventions that improve the health of workers in these jobsare difficult to design and implement, given the nature of their work arrangements [16]. There is asubstantial body of literature that posits that public health interventions that create the social andenvironmental conditions to promote and facilitate health are likely to be most effective and impactfulon a population level [17–19]. Since many of the features of precarious work are not unique to a singleoccupation or to a single workplace, interventions aimed at addressing the causes of precarious workmust be implemented at these broadly impactful social ecological levels. These types of interventions,typically in the form of policy, systems, and environmental (PSE) changes, are most effective when adiverse group of stakeholders are involved in intervention development and implementation, and whenthese stakeholders understand the problem and relevant power dynamics [17,20,21].
While there are several examples of successful, cross-sectoral PSE interventions to address publichealth issues, including tobacco control and measures to reduce automotive crashes [19], there is littleevidence in the literature of similar strategies to address precarious work. Given the absence of existingbest practices or evidence-based initiatives in this area, researchers at the UIC Center for HealthyWork engaged a group of multi-disciplinary stakeholders in a process designed to understand andbegin to develop upstream action to address drivers of precarious work. This process, known as theHealthy Work Collaborative Initiative, involved a six-session series of instructional and planning-basedactivities for organizations that were interested in addressing precarious work.
The six session Healthy Work Collaborative (HWC) was part of a larger project in the UIC Centerfor Healthy Work. The overarching aim of this larger project was to use an action research framework tounderstand and address precarious work through cycles of inquiry and action planning [22]. The HWCwas a component of this larger project, which was designed with an intent to increase stakeholders’individual and organizational capacities to apply PSE strategies to address drivers of precarious work.The primary goal of the HWC was to bring together health and labor organizations to explore initiativesthat may address health in the context of precarious employment. The goal of this manuscript isto report on a study that examined the role of university-based facilitation in this HWC process,conceptualized as technical assistance (TA) provided by UIC researchers. The HWC and TA in theHWC are further described below.
UIC researchers recruited Chicago- and Illinois-based public health and healthcare organizationsand their partners to participate in the six in-person HWC sessions; many participants were recruited
21
IJERPH 2019, 16, 3903
through existing relationships between the School of Public Health researchers and representativesof these organizations. The researchers also recruited representatives of labor organizations,including Chicago-based worker centers and labor advocacy groups, to share content expertisewith participants during the HWC sessions. All labor organizations represented in the HWC also hadlongstanding relationships with researchers in the UIC School of Public Health. All six in-person HWCsessions took place within a 10-week period in the spring and summer of 2018.
Collaborations between university groups and outside partner organizations have been describedin various contexts in the literature. Much of the existing literature on community–universitypartnerships focuses on opportunities for knowledge translation, or the application of research findingsin the community, and service-learning and community-based research [4,6]. While the HWC modelshares some of the features of community–university partnerships highlighted in the literature, such asan opportunity to co-create knowledge and develop shared research and action agendas [4], the purposeof the HWC was primarily to drive action rather than to generate knowledge.
The researchers designed the HWC using an Action Learning (AL) approach, which is an approachto problem solving that emphasizes learning through action and reflection on the results of thataction [23]. AL was originally conceptualized by Reg Revans in the early 1980s, but has been adaptedby others to better suit emerging learning and action needs in different contexts. One of theseadaptations is that of Marquardt et al., in which AL is used with the intent to build and sustainsystems-level change [24]. Similar to Revan’s original AL approach, that described by Marquardt et al.uses an iterative, participatory process, which combines scientific knowledge with evidence derivedfrom learners’ experiences to solve complex problems [24,25]. However, unlike Revan’s approach,Marquardt et al.’s AL approach relies on AL “coaches”, or facilitators who promote critical thinkingthrough the probing and prompting of learners throughout a process. In the HWC, UIC researchersserved in this facilitator role, which is further described below.
Activities within each HWC session were designed to build upon one another so that participantswould leave with foundational knowledge and skills to begin to plan for and take action to address thedrivers of precarious work. The HWC sessions were grouped into three phases (Table 1), all of whichincorporated AL tools: (1) Understanding; (2) System, strategies, and approaches; and (3) Planning foraction. A fourth phase, the Action phase, was not included in the HWC sessions. Each phase includedtwo sessions. Table 1 details the purpose of each phase and the activities that were included in thatphase’s sessions.
Small stipends were provided to HWC participants to compensate for their time spent preparingfor and participating in the sessions. This aligns with the community–university partnership literaturethat suggests that funding community engagement in university-sponsored activities both supportscommunity involvement and demonstrates the value that the university places on communityengagement [6]. Funding was also provided to representatives from local worker centers and otherlabor advocacy and educational organizations who served as TA providers in the HWC sessions.The various participant roles in the HWC are further described below.
22
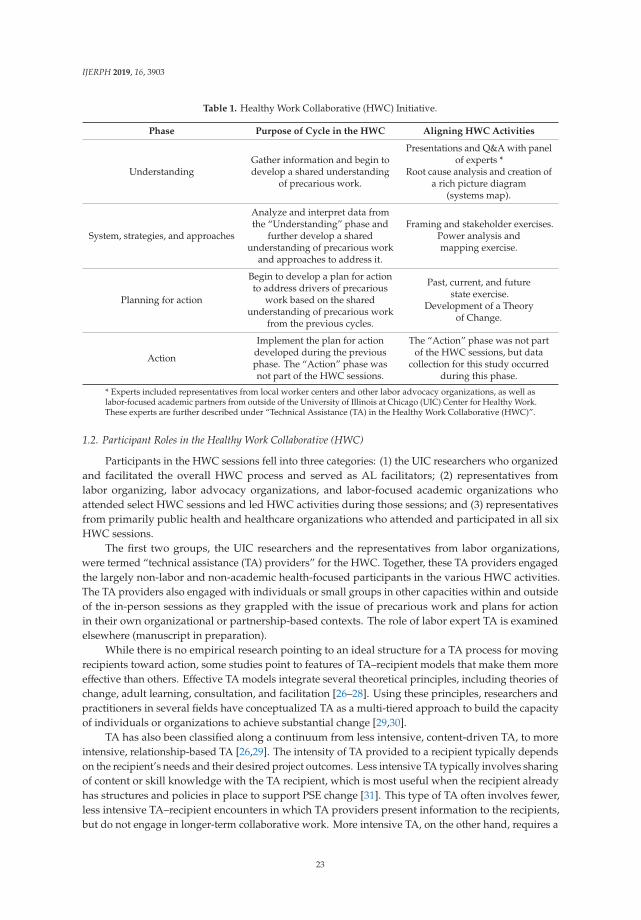
IJERPH 2019, 16, 3903
Table 1. Healthy Work Collaborative (HWC) Initiative.
Phase Purpose of Cycle in the HWC Aligning HWC Activities
UnderstandingGather information and begin todevelop a shared understanding
of precarious work.
Presentations and Q&A with panelof experts *
Root cause analysis and creation ofa rich picture diagram
(systems map).
System, strategies, and approaches
Analyze and interpret data fromthe “Understanding” phase and
further develop a sharedunderstanding of precarious work
and approaches to address it.
Framing and stakeholder exercises.Power analysis andmapping exercise.
Planning for action
Begin to develop a plan for actionto address drivers of precarious
work based on the sharedunderstanding of precarious work
from the previous cycles.
Past, current, and futurestate exercise.
Development of a Theoryof Change.
Action
Implement the plan for actiondeveloped during the previousphase. The “Action” phase wasnot part of the HWC sessions.
The “Action” phase was not partof the HWC sessions, but data
collection for this study occurredduring this phase.
* Experts included representatives from local worker centers and other labor advocacy organizations, as well aslabor-focused academic partners from outside of the University of Illinois at Chicago (UIC) Center for Healthy Work.These experts are further described under “Technical Assistance (TA) in the Healthy Work Collaborative (HWC)”.
1.2. Participant Roles in the Healthy Work Collaborative (HWC)
Participants in the HWC sessions fell into three categories: (1) the UIC researchers who organizedand facilitated the overall HWC process and served as AL facilitators; (2) representatives fromlabor organizing, labor advocacy organizations, and labor-focused academic organizations whoattended select HWC sessions and led HWC activities during those sessions; and (3) representativesfrom primarily public health and healthcare organizations who attended and participated in all sixHWC sessions.
The first two groups, the UIC researchers and the representatives from labor organizations,were termed “technical assistance (TA) providers” for the HWC. Together, these TA providers engagedthe largely non-labor and non-academic health-focused participants in the various HWC activities.The TA providers also engaged with individuals or small groups in other capacities within and outsideof the in-person sessions as they grappled with the issue of precarious work and plans for actionin their own organizational or partnership-based contexts. The role of labor expert TA is examinedelsewhere (manuscript in preparation).
While there is no empirical research pointing to an ideal structure for a TA process for movingrecipients toward action, some studies point to features of TA–recipient models that make them moreeffective than others. Effective TA models integrate several theoretical principles, including theories ofchange, adult learning, consultation, and facilitation [26–28]. Using these principles, researchers andpractitioners in several fields have conceptualized TA as a multi-tiered approach to build the capacityof individuals or organizations to achieve substantial change [29,30].
TA has also been classified along a continuum from less intensive, content-driven TA, to moreintensive, relationship-based TA [26,29]. The intensity of TA provided to a recipient typically dependson the recipient’s needs and their desired project outcomes. Less intensive TA typically involves sharingof content or skill knowledge with the TA recipient, which is most useful when the recipient alreadyhas structures and policies in place to support PSE change [31]. This type of TA often involves fewer,less intensive TA–recipient encounters in which TA providers present information to the recipients,but do not engage in longer-term collaborative work. More intensive TA, on the other hand, requires a
23
IJERPH 2019, 16, 3903
more sophisticated relationship between the TA provider and the recipient. In this instance, the TAprovider engages in sustained, in-depth work in partnership with the TA recipient, and takes on moreresponsibility for the outcomes of the program that they are supporting [29].
In the HWC, TA provided by UIC researchers was conceptualized as more intensive,relationship-based TA, focused on facilitating behavior and systems change, while TA providedby labor experts was conceptualized as more content-driven, focused on the transfer of knowledgeto participants. For the duration of the HWC, UIC TA providers divided themselves up between TArecipient groups, helping to guide TA recipients through each of the HWC activities and exercises.UIC TA providers also followed up with their TA recipient groups between HWC sessions, pointing themin the direction of resources, clarifying content from the sessions, and pushing them toward actionablenext steps. This type of higher intensity TA, focused on the facilitation of learning and action planning,aligned with the role of an AL “coach” described in the AL literature [32,33]. There is some evidence thathigher intensity TA, facilitation, or coaching, involving frequent check-ins and tailored supports andfeedback, increases the sustained engagement of learners, or TA recipients, in later implementation oraction phases [26,34]. With the HWC, UIC researchers positioned themselves in a way to both connectpractitioners in different disciplines who do not already work together, and support engagementbetween those practitioners as they move to bring about sustainable change. Little is known aboutuniversities operating in this role, and this study aims to contribute knowledge to this gap.
This study explores the role of TA provided by UIC researchers in the HWC process. Specifically,this study seeks to understand UIC TA providers’ perceptions of their own roles in the HWC process,facilitators, and challenges associated with these roles, and any outcomes of the HWC process that theyattribute to these roles. This study also seeks to understand the perceptions of other HWC participants,including labor expert TA providers and health-focused TA recipients, regarding these same concepts.Given that TA and university–community partnerships have been identified as important mechanismsto close the “knowledge to action” gap, this study seeks to explore the importance of these factors infacilitating the learning and development of PSE change interventions in the context of the HWC.
2. Materials and Methods
UIC researchers used a mixed-methods approach to evaluate the overall HWC process. For thisstudy, researchers used an exploratory qualitative study design with focus group and interviewmethodology to examine HWC participants’ perceptions of the role of TA provided by UIC in theHWC, including during the period leading up to the six sessions, the periods between sessions, and theperiod after the sessions. The UIC Institutional Review Board approved this study in 2018.
All 31 individuals who participated in the HWC in some capacity were invited to participate inthis study. Information about the HWC participants is included in Table 2. Seven UIC TA providersparticipated in the HWC sessions, including two UIC faculty members, three staffmembers, and twostudent research assistants. Seven labor expert TA providers participated in at least one HWCsession, and five participated in two or more sessions. Four of these labor expert TA providersrepresented Chicago-area worker centers, two represented national labor advocacy organizations,and one represented a labor-focused academic research center at UIC that is not part of the UIC Centerfor Healthy Work. A total of 17 representatives of other organizations participated in the HWC sessionsas TA recipients, including representatives from local health departments (LHDs), public health andother health advocacy organizations, a hospital system, an academic institution other than UIC, a localboard of health, two worker centers, and a labor union.
Of these TA recipients, 14 came to the HWC with other partners (see the TA Recipient Groups inTable 2). These TA recipient groups focused on action planning with their partners. The remainingthree TA recipients attended the HWC sessions as individual representatives of their organization,and focused their efforts on action planning within their own organization’s purview. Each TA recipientgroup or individual organization joined the HWC with a pre-determined focus for action planning.These foci are briefly described in Table 2.
24
IJERPH 2019, 16, 3903
Several instruments were developed to obtain information about UIC TA providers’ roles inthe HWC from the various HWC participants. A semi-structured focus group guide was developedto collect perspectives from the UIC facilitators immediately following the conclusion of the HWC.One semi-structured interview guide was designed to collect perspectives from the labor experts,who served as TA providers in the HWC sessions, immediately following their involvement in the HWC,and another semi-structured interview guide was designed to collect perspectives from non-labor,primarily health-focused TA recipients three months after the conclusion of the HWC sessions. Notably,both of the interview guides included questions aimed at understanding other features of the HWC andimpacts of participating in the sessions. The results reported in this study focus on the aforementionedconcepts around TA provided by UIC. Table 3 compares the content relevant to this study included inthe interview guides and the focus group guide, all of which are further described below.
UIC TA providers were invited to participate in an in-person focus group in the days immediatelyfollowing the final HWC session. The focus group guide was designed to capture UIC TA provider’sperceptions of what TA recipients gained from the HWC process, perceptions of UIC TA providers’ ownroles inside and outside of the HWC sessions, and perceptions of impacts that the HWC process had onUIC TA providers’ own thinking. Labor expert TA providers were invited to participate in a follow-upphone interview in this same time frame. All TA recipients were invited to participate in a phoneinterview approximately three months after the final HWC session, as were TA providers who hadcontinued to engage with TA recipients beyond the formal HWC six-meeting period. The immediatepost-HWC guide and the three-month post-HWC interview guide were designed to capture laborexperts’ and TA recipients’ perceptions of the same concepts as the UIC TA provider focus group guide,as well as their impressions of the HWC process more generally. TA recipients were interviewed atthe three-month time point instead of immediately post-HWC to better capture ways in which theTA recipients had applied what they had learned from the HWC since the conclusion of the sessions,and any implementation of activities planned during the HWC sessions.
Analysis
A preliminary codebook for this study was developed prior to data collection with templatecodes based on the study’s research questions and relevant technical assistance literature similarto the code manual development described by Fereday and Muir Cochrane [35]. Four broad codecategories were included in this a priori codebook: perception of TA role, intensity of TA, impact of TA,and importance of TA. These broad categories and sub-codes within each category were included inthe a priori codebook with a definition and description of each code. Emergent codes were addedduring the preliminary analysis steps, and are described below. The codebook used for this study wasseparate to that used for the overall evaluation of the HWC process.
The in-person focus group with UIC TA providers and all phone interviews with labor expertTA providers and TA recipients were audio recorded and professionally transcribed. The transcriptswere analyzed using a hybrid approach that involved both inductive and deductive coding and themedevelopment, similar to the approach described by Fereday and Muir-Cochrane [35]. Dedoose software(Dedoose Version 7.0.23, web application for managing, analyzing, and presenting qualitative andmixed method research data, SocioCultural Research Consultants LLC, Los Angeles, CA, USA) wasused for all qualitative analyses in this study.
25
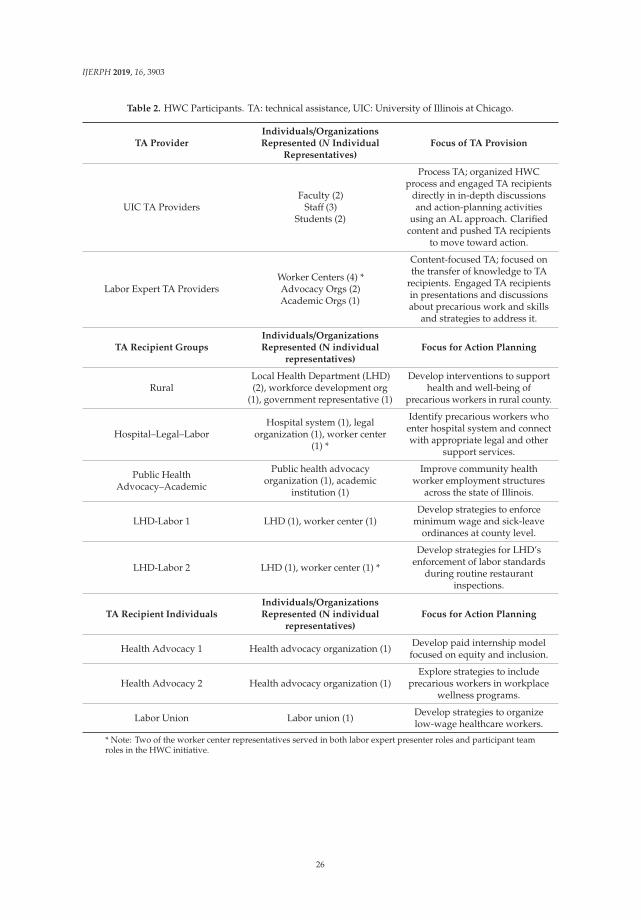
IJERPH 2019, 16, 3903
Table 2. HWC Participants. TA: technical assistance, UIC: University of Illinois at Chicago.
TA ProviderIndividuals/OrganizationsRepresented (N Individual
Representatives)Focus of TA Provision
UIC TA ProvidersFaculty (2)
Staff (3)Students (2)
Process TA; organized HWCprocess and engaged TA recipients
directly in in-depth discussionsand action-planning activities
using an AL approach. Clarifiedcontent and pushed TA recipients
to move toward action.
Labor Expert TA ProvidersWorker Centers (4) *Advocacy Orgs (2)Academic Orgs (1)
Content-focused TA; focused onthe transfer of knowledge to TA
recipients. Engaged TA recipientsin presentations and discussionsabout precarious work and skills
and strategies to address it.
TA Recipient GroupsIndividuals/OrganizationsRepresented (N individual
representatives)Focus for Action Planning
RuralLocal Health Department (LHD)(2), workforce development org
(1), government representative (1)
Develop interventions to supporthealth and well-being of
precarious workers in rural county.
Hospital–Legal–LaborHospital system (1), legal
organization (1), worker center(1) *
Identify precarious workers whoenter hospital system and connectwith appropriate legal and other
support services.
Public HealthAdvocacy–Academic
Public health advocacyorganization (1), academic
institution (1)
Improve community healthworker employment structures
across the state of Illinois.
LHD-Labor 1 LHD (1), worker center (1)Develop strategies to enforce
minimum wage and sick-leaveordinances at county level.
LHD-Labor 2 LHD (1), worker center (1) *
Develop strategies for LHD’senforcement of labor standards
during routine restaurantinspections.
TA Recipient IndividualsIndividuals/OrganizationsRepresented (N individual
representatives)Focus for Action Planning
Health Advocacy 1 Health advocacy organization (1) Develop paid internship modelfocused on equity and inclusion.
Health Advocacy 2 Health advocacy organization (1)Explore strategies to include
precarious workers in workplacewellness programs.
Labor Union Labor union (1) Develop strategies to organizelow-wage healthcare workers.
* Note: Two of the worker center representatives served in both labor expert presenter roles and participant teamroles in the HWC initiative.
26
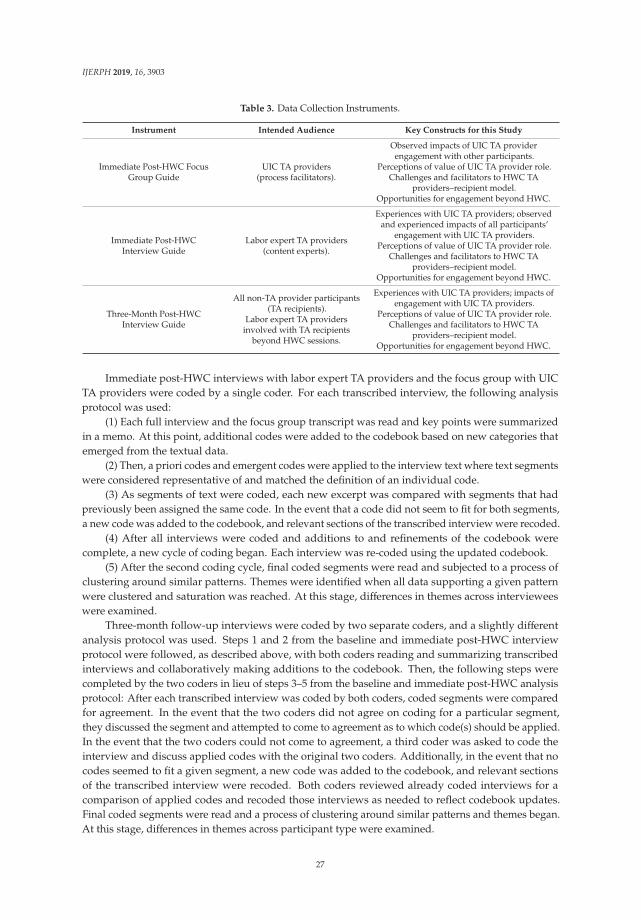
IJERPH 2019, 16, 3903
Table 3. Data Collection Instruments.
Instrument Intended Audience Key Constructs for this Study
Immediate Post-HWC FocusGroup Guide
UIC TA providers(process facilitators).
Observed impacts of UIC TA providerengagement with other participants.
Perceptions of value of UIC TA provider role.Challenges and facilitators to HWC TA
providers–recipient model.Opportunities for engagement beyond HWC.
Immediate Post-HWCInterview Guide
Labor expert TA providers(content experts).
Experiences with UIC TA providers; observedand experienced impacts of all participants’
engagement with UIC TA providers.Perceptions of value of UIC TA provider role.
Challenges and facilitators to HWC TAproviders–recipient model.
Opportunities for engagement beyond HWC.
Three-Month Post-HWCInterview Guide
All non-TA provider participants(TA recipients).
Labor expert TA providersinvolved with TA recipients
beyond HWC sessions.
Experiences with UIC TA providers; impacts ofengagement with UIC TA providers.
Perceptions of value of UIC TA provider role.Challenges and facilitators to HWC TA
providers–recipient model.Opportunities for engagement beyond HWC.
Immediate post-HWC interviews with labor expert TA providers and the focus group with UICTA providers were coded by a single coder. For each transcribed interview, the following analysisprotocol was used:
(1) Each full interview and the focus group transcript was read and key points were summarizedin a memo. At this point, additional codes were added to the codebook based on new categories thatemerged from the textual data.
(2) Then, a priori codes and emergent codes were applied to the interview text where text segmentswere considered representative of and matched the definition of an individual code.
(3) As segments of text were coded, each new excerpt was compared with segments that hadpreviously been assigned the same code. In the event that a code did not seem to fit for both segments,a new code was added to the codebook, and relevant sections of the transcribed interview were recoded.
(4) After all interviews were coded and additions to and refinements of the codebook werecomplete, a new cycle of coding began. Each interview was re-coded using the updated codebook.
(5) After the second coding cycle, final coded segments were read and subjected to a process ofclustering around similar patterns. Themes were identified when all data supporting a given patternwere clustered and saturation was reached. At this stage, differences in themes across intervieweeswere examined.
Three-month follow-up interviews were coded by two separate coders, and a slightly differentanalysis protocol was used. Steps 1 and 2 from the baseline and immediate post-HWC interviewprotocol were followed, as described above, with both coders reading and summarizing transcribedinterviews and collaboratively making additions to the codebook. Then, the following steps werecompleted by the two coders in lieu of steps 3–5 from the baseline and immediate post-HWC analysisprotocol: After each transcribed interview was coded by both coders, coded segments were comparedfor agreement. In the event that the two coders did not agree on coding for a particular segment,they discussed the segment and attempted to come to agreement as to which code(s) should be applied.In the event that the two coders could not come to agreement, a third coder was asked to code theinterview and discuss applied codes with the original two coders. Additionally, in the event that nocodes seemed to fit a given segment, a new code was added to the codebook, and relevant sectionsof the transcribed interview were recoded. Both coders reviewed already coded interviews for acomparison of applied codes and recoded those interviews as needed to reflect codebook updates.Final coded segments were read and a process of clustering around similar patterns and themes began.At this stage, differences in themes across participant type were examined.
27
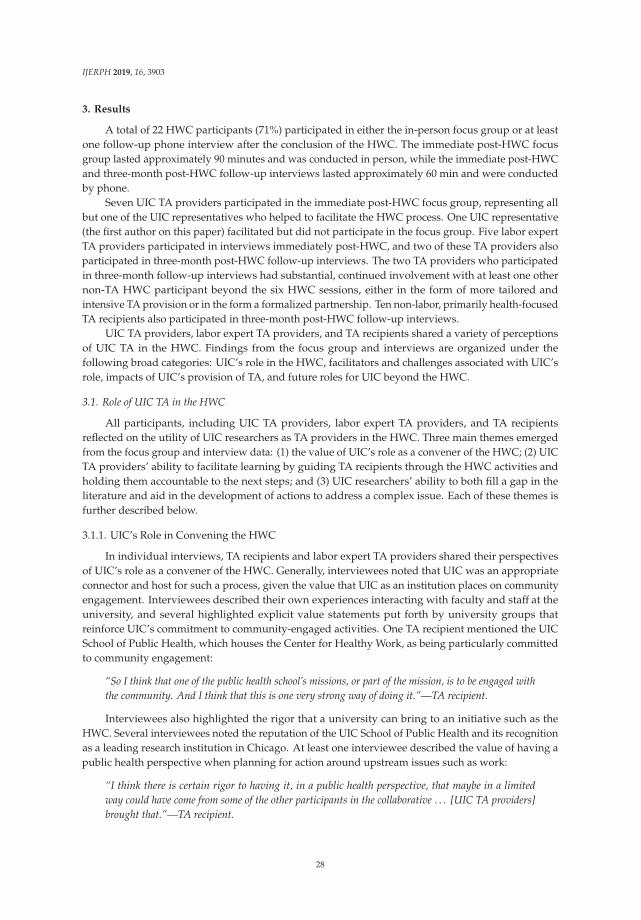
IJERPH 2019, 16, 3903
3. Results
A total of 22 HWC participants (71%) participated in either the in-person focus group or at leastone follow-up phone interview after the conclusion of the HWC. The immediate post-HWC focusgroup lasted approximately 90 minutes and was conducted in person, while the immediate post-HWCand three-month post-HWC follow-up interviews lasted approximately 60 min and were conductedby phone.
Seven UIC TA providers participated in the immediate post-HWC focus group, representing allbut one of the UIC representatives who helped to facilitate the HWC process. One UIC representative(the first author on this paper) facilitated but did not participate in the focus group. Five labor expertTA providers participated in interviews immediately post-HWC, and two of these TA providers alsoparticipated in three-month post-HWC follow-up interviews. The two TA providers who participatedin three-month follow-up interviews had substantial, continued involvement with at least one othernon-TA HWC participant beyond the six HWC sessions, either in the form of more tailored andintensive TA provision or in the form a formalized partnership. Ten non-labor, primarily health-focusedTA recipients also participated in three-month post-HWC follow-up interviews.
UIC TA providers, labor expert TA providers, and TA recipients shared a variety of perceptionsof UIC TA in the HWC. Findings from the focus group and interviews are organized under thefollowing broad categories: UIC’s role in the HWC, facilitators and challenges associated with UIC’srole, impacts of UIC’s provision of TA, and future roles for UIC beyond the HWC.
3.1. Role of UIC TA in the HWC
All participants, including UIC TA providers, labor expert TA providers, and TA recipientsreflected on the utility of UIC researchers as TA providers in the HWC. Three main themes emergedfrom the focus group and interview data: (1) the value of UIC’s role as a convener of the HWC; (2) UICTA providers’ ability to facilitate learning by guiding TA recipients through the HWC activities andholding them accountable to the next steps; and (3) UIC researchers’ ability to both fill a gap in theliterature and aid in the development of actions to address a complex issue. Each of these themes isfurther described below.
3.1.1. UIC’s Role in Convening the HWC
In individual interviews, TA recipients and labor expert TA providers shared their perspectivesof UIC’s role as a convener of the HWC. Generally, interviewees noted that UIC was an appropriateconnector and host for such a process, given the value that UIC as an institution places on communityengagement. Interviewees described their own experiences interacting with faculty and staff at theuniversity, and several highlighted explicit value statements put forth by university groups thatreinforce UIC’s commitment to community-engaged activities. One TA recipient mentioned the UICSchool of Public Health, which houses the Center for Healthy Work, as being particularly committedto community engagement:
“So I think that one of the public health school’s missions, or part of the mission, is to be engaged withthe community. And I think that this is one very strong way of doing it.”—TA recipient.
Interviewees also highlighted the rigor that a university can bring to an initiative such as theHWC. Several interviewees noted the reputation of the UIC School of Public Health and its recognitionas a leading research institution in Chicago. At least one interviewee described the value of having apublic health perspective when planning for action around upstream issues such as work:
“I think there is certain rigor to having it, in a public health perspective, that maybe in a limitedway could have come from some of the other participants in the collaborative . . . [UIC TA providers]brought that.”—TA recipient.
28
IJERPH 2019, 16, 3903
3.1.2. UIC’s Role in Facilitating Learning
An important observation of UIC TA providers’ own role in the HWC was that of facilitating ashared language and fostering opportunities for open dialogue about the issues related to precariouswork for all participants. UIC TA providers generally agreed that establishing a definition of precariouswork early on in the HWC sessions helped to facilitate engagement in subsequent HWC activities anddeeper dialogue between the various participants. One UIC TA provider described both UIC and laborexpert TA providers’ role in establishing this shared language:
“So I think it was a skill that people were able to find a shared language, and I think we helped facilitatethat along with the TA providers, to be able to talk to one another.”—UIC TA provider.
UIC TA providers further described their role as “pushing” or “coaching” TA recipients towardaction as they progressed through the HWC sessions. Several UIC TA providers shared examples ofways in which they had helped TA recipients develop action steps based on what they had learned orcreated in HWC session activities; for example, one UIC TA provider had helped their group builda small action plan based on the Theory of Change that the group had developed during one of theHWC sessions. Several UIC TA providers noted that TA recipients were seemingly appreciative of thistype of TA-led facilitation and encouragement, as summarized by one UIC TA provider below:
“I did hear quite a bit that having somebody to push them to help them focus, give them that extrasupport . . . They wouldn’t be doing it, without that push. They need the push. They need the. . . And, I don’t mean pushing them out the door. But, th . . . to help encourage, to build theirself-advocacy/capacity.”—UIC TA provider.
In interviews, many TA recipients shared similar reflections of the utility of UIC TA providers’facilitation or “pushing” of TA recipients throughout the HWC process. Several TA recipients describedspecific interactions with UIC TA providers during or between HWC sessions in which the TA providerhad helped them to further refine or develop tools or plans to move the recipients toward action.One TA recipient described their experience as follows:
“I liked the idea that you had a staff person that was sort of assigned to each group, because it reallykept us together, and then you organized us. You made sure we had meetings, and we decided tohave a little pre-meeting before the actual training sessions, and you really facilitated sort of all of thelogistics, as well as providing leadership in the groups. And I think we loved working with the folksthat we were working with.”—TA recipient.
TA recipients also recognized UIC TA providers’ roles in guiding them toward a more profoundunderstanding of precarious work and TA recipients’ own roles in addressing its drivers. Several TArecipients noted the ways in which UIC TA providers helped TA recipients to think about the issueswithout being overly prescriptive or forceful in what their takeaways should be. One TA recipientdescribed their experiences with UIC TA providers as follows:
“One of the things I liked is that with [the] UIC facilitator and UIC facilitator and everybody, you allguided. You don’t imprint on it . . . And it’s a great way to learn. And you helped guide people towhere, I think where we should have gotten to without saying, you know, you let us have a learningexperience, that’s what I guess I’m trying to say, without handing us a syllabus and saying, ‘You’regoing to be at this point, this point,’ you know what I’m saying? And so I really liked that approach.And it’s really very beneficial.”—TA recipient.
3.1.3. UIC’s Role in Contributing Evidence and Facilitating Action
In the focus group, UIC TA providers reflected on the factors that made their role in organizingand coordinating the HWC feasible and appropriate. Several UIC TA providers described the gapin the literature around PSE strategies to address the drivers of precarious work, and how this gap
29
IJERPH 2019, 16, 3903
presented an opportunity for the researchers in the UIC Center for Healthy Work to gather contributingevidence in this arena via the HWC. One UIC TA provider summarized these sentiments below:
“ . . . it’s about building the evidence that doesn’t exist, there is not good evidence around how to doPSE change around in particular precarious work for sustainable change, and that’s what we’ve beentrying to do and we are documenting it, we’re building evidence, we’re adapting theory based onfeedback for practice and integrating it to do something we hope is impactful.”—UIC TA provider.
UIC TA providers also engaged in a discussion around academic expectations and needs forevidence building that allow for the dedicated time and funding to support an initiative such as theHWC. At least one UIC TA provider mentioned the need to respond to the expectations of the fundingagency for the Center for Healthy Work by collecting data and producing products for dissemination,which is made possible through the engagement of other stakeholders in the HWC.
“ . . . we have to keep the funders in mind and research and building evidence in mind . . . So having aproduct, something that can be disseminated widely or policy change, environmental change, havingsomething happen that can be counted, that’s [the funder’s] perspective.”—UIC TA provider.
3.2. Facilitators and Challenges Associated with UIC TA Role
Several themes emerged from the data regarding facilitators and challenges associated with theTA role that UIC researchers played in the HWC. Existing relationships between UIC researchersand representatives from the organization that participated in the HWC, and UIC’s knowledge ofthe participants’ needs and related opportunities emerged as facilitators associated with the UICresearchers’ role; in contrast, constraints related to time, content, planning, and limitations to TA controlemerged as challenges associated with this role. These facilitators and challenges are described below.
3.2.1. Existing Relationships
Labor expert TA providers and TA recipients described their existing relationships with UICresearchers as a catalyst to their involvement in the HWC. All labor expert TA providers describedlongstanding relationships with UIC faculty and staff in the Environmental and Occupational HealthDivision of the School of Public Health, while most of the non-labor TA recipients described existingrelationships with faculty and staff at the MidAmerica Center for Public Health Practice, also in theSchool of Public Health, which provided training to public health professionals. Representatives fromboth School of Public Health groups were involved in the planning and coordinating of the HWC.One TA recipient described their relationship with UIC and their decision to participate in the HWC:
“We’re fortunate enough to have a long-standing working relationship with UIC . . . So I heard aboutthe collaborative from [UIC facilitators], and we talked about some of the work that was going to bedone and what the overall, I guess what the health outcomes might be. There was [sic] some issuesthat I’ve kind of wanted to work on, and so I just said, yeah, I kind of was interested in pursuingthis.”—TA recipient.
Several interviewees indicated that they felt UIC researchers had their organization’s best interestsand needs in mind when soliciting their involvement in something such as the HWC. A labor expertTA provider summarized this sentiment:
“ . . . we have relationships with individuals and the departments that span all my time here . . . wealready have an idea of what kind of things that it would involve, or yeah, there’s less uncertaintyabout, “Well, would this be a good use of my time?” That sort of thing ‘cause we already have therelationship and are accustomed to working together. I think part of it is just experience is a factor inour decision making here to engage, being that we already have experience together.”—Labor expertTA provider.
30
IJERPH 2019, 16, 3903
3.2.2. UIC’s Capacity to Recognize Needs and Opportunities
Additionally, several interviewees described the university’s unique capacity to recognize theneed for and engage a diverse group of stakeholders to collaboratively learn about and plan forupstream action to address drivers of precarious work. Several interviewees described the uniquefeatures of the university as a convener, including its commitment to community engagement and itsexisting relationships with community organizations (further described below) that made the HWCespecially impactful in a way that it would not have been without UIC’s involvement. One intervieweesummarized these sentiments below:
“I doubt we would have had the same kind of people, diversity of entities in the room and in conversation.Without you all . . . I doubt the conversation would have happened without the (HWC), the grantfunding which all happened behind it.”—TA recipient.
At least one TA recipient also noted that the representatives in the HWC would not have had theopportunity to connect if it were not for the convening of the HWC.
“It is really helpful to bring groups together who haven’t worked together before and who we may notalways think of—and see how it ties back to our work—unless we get connected and seek it out on ourown, which we don’t really have time for, we don’t have access to these new relationships.”—Laborexpert TA provider.
3.2.3. Time and Content Balance
Despite the many touted benefits of UIC’s TA provision in the HWC, participants described someof the limitations, challenges, and opportunities for change given their experience in this HWC process.Many of the TA recipients, in particular, described the challenges of digesting so much new content insuch a short period of time. Some TA recipients also felt that there was not enough time built in toreflect upon and apply what they had learned in the HWC sessions. One TA recipient summarizedthese sentiments below:
“It was super structured and a lot of stuff over a short timeline. There was a balance that it needed tobe structured so it didn’t lose the thread . . . But it still was quite a bit.”—TA recipient.
Several UIC TA providers also attributed challenges in timing with what TA recipients were ableto accomplish through the HWC process. UIC TA providers felt that the readiness of TA recipientsto both engage with a complex new issue such as precarious work and actively plan implementableinterventions outside of the HWC sessions varied between groups and individual TA recipients.One UIC TA provider noted that the timing of the HWC was based solely on UIC researchers’ ownneeds and not on the needs of participants, including both the readiness piece and the amount of timeparticipants, including TA recipients and labor expert TA providers, needed in between sessions todigest information and prepare for subsequent sessions. One UIC TA provider summarized theseobservations below:
“I think the timing issue was really a very important factor in influencing what went on and whatwent well for some and what didn’t go well for others.”—UIC TA provider.
3.2.4. Time and Planning Constraints
UIC TA providers noted some of the challenges related to the tight HWC timeline, both in termsof what content could be covered in the sessions and in terms of limitations in time to plan the sessions.Several UIC TA providers shared the challenges that stemmed from working within a time-boundgrant structure, in which funds allocated to activities such as the HWC needed to be spent down withina short time frame. This presented problems with HWC planning, limiting UIC TA providers’ abilitiesto engage labor expert TA providers in much of the planning in advance of the meetings themselves:
31
IJERPH 2019, 16, 3903
“ . . . ultimately we only had so much time to devote to developing this curriculum and structuringthese meetings that there are certain things with the curriculum that I think we may have donedifferently that would facilitate learning in a different way. I wonder if we had brought in all of the. . . if they had the capacity to do this, if we had brought in all of the TA providers from the get go todevelop a curriculum in a more collaborative way.”—UIC TA provider.
3.2.5. Limitations of UIC TA Role
Beyond the challenges related to content load and timing, UIC TA providers shared severallimitations of what they as TA providers were able to bring about through the HWC process.Although they were able to provide tools to TA recipients, follow up with them between sessions,and push them to focus on particularly relevant content or action steps, UIC TA providers could notforce TA recipients to actually move toward action. Many UIC TA providers described an obviousshift in TA recipients’ thinking over the course of the HWC sessions, but in many cases felt that it wasnot apparent how those TA recipients will actually move toward action post-process. One UIC TAprovider described this challenge below:
“The “doing” part in their case, I struggled with . . . so I don’t know what else I could have done oryou could have done. We literally handed them a lot of stuff and I couldn’t get them to really put aplan together ultimately, in terms of what was next.”—UIC TA provider.
Another limitation encountered by UIC TA providers was their ability to promote diversepartnerships between TA recipients in the HWC. While some TA recipients entered the HWCwith pre-determined partners (e.g., representatives of other organizations interested in developinginterventions to address issues of shared interest), others began and ended the HWC process asindividual representatives of their own organizations. One UIC TA provider, who worked primarilywith one such individual, described this as an observed limitation during the HWC process:
“I think [what] the other groups show was that coming in with a team with a diversity of voices reallydoes make a difference, that that can foster learning . . . I think he had some shift in his ideas but Idon’t it was as much as with the groups where people came in as a diverse team.”—UIC TA provider.
3.3. Impacts of UIC TA Provision
Despite some limitations to UIC TA providers’ roles in the HWC process, UIC TA providers,labor expert TA providers, and TA recipients were able to articulate a number of impacts attributedto TA provision by UIC researchers in the HWC. Two themes that emerged from the data includedpushing TA recipients toward a more concrete understanding of precarious work and holding TArecipients accountable to next steps throughout the HWC process. Both themes are described below.
3.3.1. Shifts from Abstract to Concrete Understanding of Precarious Work
In the focus group, UIC TA providers described the various ways in which they helped guideTA recipients toward a deeper understanding of the drivers and manifestations of precarious work,both within the HWC sessions and in follow-up calls with TA recipients between sessions. One UICTA provider observed the most significant changes in TA recipients’ understanding of the issues whendebriefing the previous week’s session by phone:
“I think for some of the groups that I was working with, it was a big transition between abstractionand like recognizing, “Yeah, this is an issue,” and then putting pen to paper and actually devising aplan and having concrete ways to talk about it and to address it. I think that those changes have beenthe most in our individual phone calls with them.”—UIC TA provider.
32
IJERPH 2019, 16, 3903
3.3.2. Accountability and Resultant Shifts toward Action
In addition to encouraging or “pushing” TA recipients toward actionable next steps, UIC TAproviders and TA recipients agreed that UIC TA also helped hold individuals and groups accountable tothose next steps. Several UIC TA providers described the utility in scheduling follow-up conversations,typically by phone, in between HWC sessions as means to check in with TA recipients about agreedupon next steps. One UIC TA provider highlighted this accountability role as particularly impactfulfor a TA recipient they were working with:
“I think having someone to hold him accountable and I feel like the same as the case with the otherteam too, being held accountable for something made a big difference.”—UIC TA provider.
3.4. Role of UIC beyond HWC
Focus group and interview data revealed a range of anticipated needs for UIC TA provisionpost-HWC. In the focus group, which took place several days after the conclusion of the HWC,several UIC TA providers speculated that going forward, many of the TA recipients would needadditional supports as they continued to both digest information from the HWC and move forwardin their plans for action. At least one UIC TA provider expressed a feeling that TA recipients wouldrequire little content-related TA beyond the HWC sessions, but would instead require substantialguidance and continued structure and encouragement from UIC TA providers:
“I think going forward, it seems to me as though there may have to be less of a desire for the other TAproviders and more of a desire for things that we can do. Which is sort of helping them navigate thingsand connect them to other resources that may not be one of our TA providers . . . ”—UIC TA provider.
TA recipients echoed these sentiments in their interviews, indicating that they would value andbenefit from additional facilitation and related supports from UIC TA providers moving forward.Some TA recipients went so far as to describe a specific role for UIC in the implementation of theirplanned actions, with some describing UIC TA providers serving in coordination and evaluativecapacity. One TA recipient commented on the utility of having UIC TA support beyond the HWC:
“I think just having [UIC] as technical assistance providers as we move our project forward . . . itwould be really helpful if our team doesn’t have to develop the next phases on our own or come upwith the ideas . . . I think our group is open enough to your feedback on the direction to take theproject.”—TA recipient.
4. Discussion
This study examined the perceptions of HWC participants, including UIC TA providers,labor expert TA providers, and TA recipients of UIC researchers’ TA role throughout the HWCprocess. The findings centered on HWC participants’ perceptions of the appropriateness and utility ofUIC’s role as TA in the HWC, challenges encountered in this TA provider–recipient model, and potentialnext steps for UIC’s involvement with TA recipients beyond the HWC sessions. The findings provideinsight into the role of a university, such as UIC, in convening a learning and action planning initiativesuch as the HWC, and highlight the impacts of UIC TA providers’ engagement with other participantsthroughout the HWC process. UIC’s experience in convening and facilitating the HWC sheds lighton factors that contributed to participants’ perceptions of the success of the university-facilitatedTA provider–recipient model for learning and action development, which may be useful to otheruniversities or similarly positioned organizations interested in engaging diverse stakeholders with theaim of facilitating PSE change. Data from this study suggest that this unique model helped to preparerepresentatives of various organizations to develop PSE change initiatives to address the complexitiesof precarious work.
This study provides important insight into how universities, such as UIC, can position themselvesto support non-academic organizations across sectors and levels to facilitate evidence-informed
33
IJERPH 2019, 16, 3903
development and the implementation of actions to address complex problems such as precariouswork. The data from this study highlight the utility of having a community-engaged university bringtogether organizations that have existing relationships with the university, but do not necessarilyhave existing relationships with one another. The data also highlight the benefits and challenges ofhaving university researchers play a TA role in a process such as the HWC, and suggest ways in whichuniversity researchers might be involved beyond initial capacity building activities to support theimplementation of PSE change.
Findings that highlight the value that HWC participants placed on UIC’s role as a research-focusedand community-engaged institution offer support to UIC’s decision to organize the HWC andconvene its various participants in six in-person sessions. These findings align with much of thecommunity–university partnership literature, which details community engagement with universityresearchers as a means for knowledge translation and the development of shared action agendas [4].This supports UIC’s role in putting together an initiative that has the potential to help closea knowledge-to-action gap, although this initiative differs from many of the examples in theliterature. Unlike other community–university partnerships, the HWC relied on the expertise ofoutside TA providers, in this case labor experts, to share knowledge with the groups who are wellpositioned to implement interventions to address a complex problem, in this case the multi-faceteddrivers of precarious work. UIC researchers’ roles as facilitators differs from the more traditionalknowledge-sharing role described in much of this literature.
Due to longstanding relationships with individuals involved in occupational health research andpublic health practice groups at UIC, labor expert TA providers and TA recipients described a levelof trust and reciprocity that were vital to their decisions to participate in the HWC. These findingsindicate that UIC was uniquely positioned to convene and facilitate the HWC, suggesting that theHWC participants may not have otherwise willingly participated in such an initiative. It is unlikelythat without the HWC, participants would have interacted with one another at all, further highlightingthe importance of UIC’s role in supporting important steps toward PSE change. Without strong,pre-existing relationships between UIC researchers and members of the various organizations thatwere represented in the HWC, these representatives may not have decided to commit the time andresources to participate the inaugural HWC initiative. The time and effort that UIC researchers putinto developing and maintaining their relationships with the labor- and health-focused organizationsthat ultimately agreed to participate in the HWC, either as TA providers or TA recipients, cannot beoverlooked as an important step in facilitating diverse engagement and commitment to participate in apilot initiative such as the HWC.
In addition to UIC’s role as a convener of the HWC, data from the focus group and interviews revealseveral perceptions of the function of UIC TA in the HWC sessions. These functions, from providingguidance, facilitation, encouragement, and accountability to TA recipients, display the range of intensityof TA provided by UIC researchers in the HWC model. This intensity differed from that describedin the TA literature, with UIC TA providers serving in a capacity that might be likened to that of acoach or accountability manager instead of a role in which the TA provider takes on responsibility forsome of the work. The HWC model seemed nevertheless effective for TA recipients, many of whomattributed their progress in digesting HWC content and planning for next steps of the involvement ofUIC TA providers. This suggests that TA as it is described in the literature does not fit the HWC’smodel, and perhaps an expanded definition of TA is needed. Further, this suggests that universityfacilitation using AL, in a model such as the HWC, may be effective in increasing knowledge to action.This aligns with calls for capacity-building initiatives to foster more effective public health practice toaddress complex issues such as precarious work [36].
These findings did highlight some of the limitations of this UIC TA model. Many of the limitationsdescribed by participants revolved around the the timing and tight timeline of the HWC, both ofwhich resulted from constraints of operating within a time-bound grant period. UIC TA providersdescribed the challenges of planning and developing the HWC curriculum in such a short time period,
34
IJERPH 2019, 16, 3903
which limited opportunities for cooperative planning between UIC and labor expert TA providers.Likewise, labor expert TA providers noted the challenges of not being involved in the planning of eachsession. This particular issue highlights the limitations of having a university group, which relies ongrant funding, designing, and hosting such an initiative, given many of the factors, such as timing andfunding, are determined by the funder and are out of their immediate control.
Finally, findings from the focus group and interviews suggested that TA recipients would valueand benefit from UIC TA beyond the HWC sessions. This finding highlights some of the ways inwhich TA recipient organizations were underprepared for action following the HWC, likely requiringadditional guidance and supports to move their plans forward. This finding also highlights theimportance of sustained engagement between university groups, such as the UIC TA providersin the HWC, and community groups, which is mirrored in the community–university partnershipliterature [4].
While this manuscript describes the role of university-provided TA in developing strategiesfor addressing precarious work, evaluation of the HWC in promoting sustainable relationships andpartnerships is ongoing. The impact of the HWC on organizational priorities and on process andsystems change to better address precarious employment is also an area of ongoing and future research.
Limitations
There are a number of limitations in this study, including low participation in study componentsand the involvement of the author in the HWC process. Since the HWC process was a pilot, there wasonly a small number of representatives in both TA provider and TA recipient roles who participated inthis study, and approximately 30% did not participate in interviews. Since the TA provider samplewas especially small (seven UIC TA providers and seven labor expert TA providers), attempts weremade to accommodate varying schedules and allow for participation in interviews or the focus groupat times that best suited the TA providers. For TA recipients, similar efforts were made to ensurethat at least one representative from each team (see Table 1) was interviewed to capture the team’sexperiences. An additional limitation was there were no opportunities to compare findings from thisstudy to another similar collaborative process with multiple TA providers and TA recipients, as similarexamples of TA provider–recipient models were not found in the literature.
Another potential limitation of this study is the author’s involvement in the HWC as one of theUIC TA providers who helped with the design and facilitation of the HWC process. This presents apotential bias, both due to the author’s own involvement and perceptions of the HWC and the potentialbias in interviewees’ responses to interview questions, given their knowledge of my role in the HWCprocess. To partially address this limitation, assurances were made to participants that their datawould be both de-identified and reported in the aggregate, and would not be shared outside of the UICresearch team. Further, another UIC TA provider conducted interviews with the TA recipients who theauthor interacted with most directly in the HWC sessions. Although the author did facilitate the focusgroup with other UIC TA providers, she did not participate in the focus group herself (i.e., she didnot share her own perceptions of the HWC process and the role of TA). The author worked with anexternal colleague to code and debrief transcribed data to both reflect upon and document potentialbiases and subjectivities.
5. Conclusions
The complex problems that workers face, especially those in precarious work arrangements,demand innovative and comprehensive solutions. The Total Worker Health® model recognizes the needfor research and practice to improve the health of workers, and TWH Centers for Excellence, such as theCenter for Healthy Work at UIC, are tasked with understanding the conditions that workers face anddeveloping strategies to improve those conditions through multi-disciplinary projects. The findingsfrom this study, which focuses on an initiative at the UIC Center for Healthy Work, highlight the
35
IJERPH 2019, 16, 3903
utility of university facilitation in engaging diverse stakeholders in learning and action planning, in thecontext of a process rooted in Action Learning, to promote action to address drivers of precarious work.
Author Contributions: Conceptualization: T.B., C.W., and E.J.-R.; methodology, T.B., C.W., and E.J.-R.;formal analysis, T.B.; investigation: T.B. and E.J.-R.; writing—original draft preparation, T.B.; writing—review andediting, C.W., E.J.-R., and L.M.C.; supervision, C.W. and L.M.C.; funding acquisition, C.W. and L.M.C.
Funding: The UIC Center for Healthy Work is supported by grant number U190H011232 from the NationalInstitute for Occupational Safety and Health (CDC). The views expressed in written materials or do not necessarilyreflect the official policies of the Department of Health and Human Services, nor does the mention of trade names,commercial practices, or organizations imply endorsement by the U.S. Government. Total Worker Health® isa registered trademark of the U.S. Department of Health and Human Services (HHS). Participation by the UICCenter for Healthy Work does not imply endorsement by HHS, the Centers for Disease Control and Prevention,or the National Institute for Occupational Safety and Health. Tessa Bonney was also supported by the IllinoisEducation and Research Center, grant number T42/OH008672 from the National Institute for Occupational Safetyand Health (CDC). The work is solely the responsibility of the authors and does not necessarily represent theofficial views of the National Institute for Occupational Safety and Health.
Acknowledgments: Nandini Deb, research assistant; Elizabeth Fisher, Devangna Kapadia, Marsha Love,Eve Pinsker, Anna Yankelev, and Joseph Zanoni from the UIC Center for Healthy Work; and all HealthyWork Collaborative participants.
Conflicts of Interest: The authors declare no conflict of interest. The funders had no role in the design of thestudy; in the collection, analyses, or interpretation of data; in the writing of the manuscript, or in the decision topublish the results.
References
1. National Institute for Occupational Safety and Health (NIOSH). Total Worker Health. Available online:https://www.cdc.gov/niosh/twh/totalhealth.html (accessed on 20 July 2019).
2. Benach, J.; Muntaner, C. Precarious employment and health: Developing a research agenda. J. Epidemiol.Community Health 2007, 61, 276–277. [CrossRef] [PubMed]
3. University of Illinois at Chicago School of Public Health. Center for Healthy Work. Available online:http://publichealth.uic.edu/healthywork (accessed on 20 July 2019).
4. Shannon, J.; Wang, T. A Model for University-Community Engagement: Continuing Education’s Role asConvener. J. Contin. High. Educ. 2010, 58, 108–112. [CrossRef]
5. Drabble, L.; Lemon, K.; D’Andrade, A.; Donoviel, B.; Le, J. Child welfare partnership for research andtraining: A Title IV-E university/community collaborative research model. J. Public Child Welf. 2013, 7,411–429. [CrossRef]
6. Leisey, M.; Holton, V.; Davey, T.L. Community engagement grants: Assessing the impact of universityfunding and engagements. J. Community Engagem. 2012, 5, 6.
7. Kalleberg, A. Precarious Work, Insecure Workers: Employment Relations in Transition. Am. Sociol. Rev.2009, 74, 1–22. [CrossRef]
8. National Employment Law Project (NELP). Unregulated Work: Research and Public Policy for anEmerging Trend in the U.S. Labor Market. 2009. Available online: http://nelp.org/content/uploads/2015/03/UnregulatedWorkResearchPublicPolicy509.pdf (accessed on 20 July 2019).
9. Hadden, W.; Muntaner, C.; Benach, J.; Gimeno, D.; Benavides, F. A glossary for the social epidemiology ofwork organisation: Part 3, Terms from the sociology of labour markets. J. Epidemiol. Community Health 2007,61, 6–8. [CrossRef]
10. Weil, D. Rethinking the regulation of vulnerable work in the USA: A sector-based approach. J. Ind. Relat.2009, 51, 411–430. [CrossRef]
11. Weil, D. The Fissured Workplace; Harvard University Press: Cambridge, MA, USA, 2014.12. Benach, J.; Muntaner, C.; Santana, V. Employment Conditions and Health Inequalities Final Report to the
WHO Commission on Social Determinants of Health (CSDH) Employment Conditions Knowledge Network(EMCONET). 2007. Available online: http://www.who.int/social_determinants/resources/articles/emconet_who_report.pdf?ua=1 (accessed on 20 July 2019).
13. Azaroff, L.; Levenstein, C.; Wegman, D. Occupational injury and illness surveillance: Conceptual filtersexplain underreporting. Am. J. Public Health 2002, 92, 1421–1429. [CrossRef]
36
IJERPH 2019, 16, 3903
14. Park, Y.; Butler, R. The safety costs of contingent work: Evidence from Minnesota. J. Labor Res. 2001, 22,831–849. [CrossRef]
15. Benavides, F.; Delclos, G. Flexible employment and health inequalities. J. Epidemiol. Community Health 2005.[CrossRef]
16. Baron, S.; Beard, S.; Davis, L.; Delp, L.; Forst, L.; Kidd-Taylor, A.; Liebman, A.K.; Linnan, L.; Punnett, L.;Welch, L.S. Promoting integrated approaches to reducing health inequities among low-income workers:Applying a social ecological framework. Am. J. Ind. Med. 2014, 57, 539–556. [CrossRef] [PubMed]
17. Golden, S.; McLeroy, K.; Green, L.; Earp, J.; Lieberman, L. Upending the Social Ecological Model to GuideHealth Promotion Efforts Toward Policy and Environmental Change. Health Educ. Behav. 2015, 42, 8S–14S.[CrossRef] [PubMed]
18. Phelan, J.C.; Link, B.G.; Tehranifar, P. Social conditions as fundamental causes of health inequalities: Theory,evidence, and policy implications. J. Health Soc. Behav. 2010, 51, S28–S40. [CrossRef] [PubMed]
19. Allegrante, J. Policy and Environmental Approaches in Health Promotion. Health Educ. Behav. 2015, 42,5S–7S. [CrossRef]
20. Freudenberg, N.; Franzosa, E.; Chisholm, J.; Libman, K. New Approaches for Moving Upstream. Health Educ.Behav. 2015, 42, 46S–56S. [CrossRef]
21. Freudenberg, N.; Silver, M.; Hirsch, L.; Cohen, N. The Good Food Jobs Nexus: A Strategy for PromotingHealth, Employment, and Economic Development. J. Agric. Food Syst. Community Dev. 2016, 6, 1–19.[CrossRef]
22. Stringer, E. Action Research; Sage Publications: Thousand Oaks, CA, USA, 2013.23. Revans, R. Action Learning: Its origins and nature. High. Educ. Rev. 1982, 15, 20–29.24. Marquardt, M.; Leonard, H.; Freedman, A.; Hill, C. Action Learning for Developing Leaders and Organizations:
Principles, Strategies, and Cases; American Psychological Association: Washington, DC, USA, 2009.25. Hawe, P.; Noort, M.; King, L.; Jordens, C. Multiplying health gains: The critical role of capacity-building
within health promotion programs. Health Policy 1997, 39, 29–42. [CrossRef]26. Le, L.; Anthony, B.; Bronheim, S.; Holland, C.; Perry, D. A Technical Assistance Model for Guiding Service
and Systems Change. J. Behav. Health Serv. Res. 2016, 43, 380–395. [CrossRef]27. De Silva, M.; Breuer, E.; Lee, L.; Asher, L.; Chowdhary, N.; Lund, C.; Patel, V. Theory of Change: A
theory-driven approach to enhance the Medical Research Council’s framework for complex interventions.Trials 2014, 15, 267. [CrossRef]
28. Trohanis TA Project. Guiding Principles for Effective Technical Assistance. 2014. Available online:http://ectacenter.org/~{}pdfs/trohanis/trohanis_guiding_principles.pdf (accessed on 20 July 2019).
29. Fixsen, D.; Blasé, K.; Horner, R.; Sugai, G. Intensive Technical Assistance. Scaling-Up Brief. Number 2. FPGChild Dev. Inst. ERIC 2009, 2, 1–4.
30. Chilenski, S.; Welsh, J.; Olson, J.; Hoffman, L.; Perkins, D.; Feinberg, M. Examining the Highs and Lows ofthe Collaborative Relationship between Technical Assistance Providers and Prevention Implementers. Prev.Sci. 2018, 19, 250–259. [CrossRef] [PubMed]
31. Rushovich, B.; Bartley, L.; Steward, R.; Bright, C. Technical Assistance: A Comparison between Providersand Recipients. Hum. Serv. Organ. Manag. Leadersh. Gov. 2015, 39, 362–379. [CrossRef]
32. Marquardt, M. Action learning and leadership. Learn. Organ. 2000, 7, 233–241. [CrossRef]33. Marsick, V.; O’Neil, J. The many faces of action learning. Manag. Learn. 1999, 30, 159–176. [CrossRef]34. Noell, G.; Witt, J.; Slider, N.; Connell, J.; Gatti, S.; Williams, K.; Koenig, J.L.; Resetar, J.L.; Duhon, G.J. Treatment
implementation following behavioral consultation in schools: A comparison of three follow-up strategies.School Psychol. Rev. 2005, 34, 87–106.
35. Fereday, J.; Muir-Cochrane, E. Demonstrating rigor using thematic analysis: A hybrid approach of inductiveand deductive coding and theme development. Int. J. Qual. Methods 2006, 5, 80–92. [CrossRef]
36. Brownson, R.; Fielding, J.; Green, L. Building capacity for evidence-based public health: Reconciling thepulls of practice and the push of research. Annu. Rev. Public Health Annu. Rev. 2018, 39, 27–53. [CrossRef]
© 2019 by the authors. Licensee MDPI, Basel, Switzerland. This article is an open accessarticle distributed under the terms and conditions of the Creative Commons Attribution(CC BY) license (http://creativecommons.org/licenses/by/4.0/).
37
International Journal of
Environmental Research
and Public Health
Article
Caring for Workers’ Health: Do German EmployersFollow a Comprehensive Approach Similar to theTotal Worker Health Concept? Results of a Surveyin an Economically Powerful Region in Germany
Aileen Hoge †, Anna T. Ehmann † , Monika A. Rieger ‡ and Achim Siegel *,‡
Institute of Occupational Medicine, Social Medicine and Health Services Research, University HospitalTübingen, Wilhelmstraße 27, 72074 Tübingen, Germany; [email protected] (A.H.);[email protected] (A.T.E.); [email protected] (M.A.R.)* Correspondence: [email protected]; Tel.: +49-7071-29-86812† Equal contribution (shared first).‡ Equal contribution (shared last).
Received: 30 January 2019; Accepted: 26 February 2019; Published: 28 February 2019
Abstract: Similar to ‘Total Worker Health’ in the United States (USA), ‘Workplace Health Management’in Germany is a holistic strategy to protect, promote, and manage employees’ health at the workplace.It consists of four subcategories. While the subcategories ‘occupational health and safety’ and‘reintegration management’ contain measures prescribed by law, ‘workplace health promotion’ and‘personnel development’ can be designed more individually by the companies. The present studyfocused on the current implementation of voluntary and legally required measures of the foursubcategories, as well as companies’ satisfaction with the implementation. A total of N = 222/906companies (small, medium, and big enterprises of one German county) answered a standardizedquestionnaire addressing the implementation of health-related measures, satisfaction with theimplementation, and several company characteristics. In the subcategory ‘occupational health andsafety’, 23.9% of the companies fulfilled all of the legally required measures, whereas in the category‘reintegration management’, that rate amounted to 50.9%. There was a positive correlation betweencompany size and the implementation grade, and as well between company size and the fulfillingof measures required by law. Companies tended to be more satisfied with higher implementationgrades. Nevertheless, a surprisingly high proportion of the companies with poor implementationindicated satisfaction with the measures’ implementation.
Keywords: workplace health management; total worker health; workplace health promotion;occupational health and safety; company reintegration management; return to work; cross-sectionalsurvey; Germany
1. Introduction
Similar to many other high-income countries, Germany currently faces two trends that have aserious impact on its economy and workforce. First of all, the composition of the working population isshifting toward older age groups, which is a process that will probably be accompanied by an increasein the burden of non-communicable diseases among the workforce [1,2]. Secondly, many branchesof the German economy are confronted with an acute shortage of skilled workers and qualifiedstaff, which is a situation that has persisted for years, and recently deteriorated [3,4]. Against thisbackground, stakeholders are increasingly recognizing activities that strengthen the workability andemployability of the workforce and promote the good health of workers [2,5]. Thus, it comes as nosurprise that during the last few decades, a strategy called ‘workplace health management’ (in German
IJERPH 2019, 16, 726; doi:10.3390/ijerph16050726 www.mdpi.com/journal/ijerph38
IJERPH 2019, 16, 726
‘Betriebliches Gesundheitsmanagement’) has gained popularity in Germany [6–8]. ‘Workplace healthmanagement’ is very similar to the ‘Total Worker Health’ approach in the USA [9–19]. The NationalInstitute for Occupational Safety and Health (NIOSH) defined ‘total worker health’ as activitiesintegrating protection from work-related safety and health hazards with the promotion of injury andillness prevention efforts in order to advance worker well-being [12,13]. The German ‘workplacehealth management’ approach pursues a similarly holistic strategy. It is commonly defined as theintegration and management of all operational processes (in an enterprise) so as to create healthyworking conditions and promote the health of its employees [5,20]. Workplace health managementcan be differentiated into four components or subcategories: (1) occupational health and safetymeasures, (2) management of the return to work process of employees who have been on long-termsickness absence (in short: ‘reintegration management’), (3) workplace health promotion, and (4) acorresponding personnel development. In Germany, these components differ as to their legal status:whereas many occupational health and safety measures as well as some reintegration managementactivities are required by law, measures in the areas of workplace health promotion and personneldevelopment are voluntary (cf., in greater detail below).
While the importance of comprehensive workplace health management in Germany seems tobe commonly recognized in public discourse, a quite different question is whether and to whatextent enterprises actually follow the concept in practice. From several surveys we know thatin small and medium enterprises (with up to 250 employees, or—according to another commoncategorization—with up to 500 employees), workplace health management is often neglected.The ability or willingness to implement workplace health management measures seems to dependlinearly on company size. The smaller the company, the less likely it is that a comprehensive workplacehealth management will be implemented [21–24]. Small enterprises with up to 50 employees seem tohave implementation deficits even with regard to occupational health and safety measures that arerequired by law [25]. Thus, as to small and medium enterprises (SMEs), the situation in Germanyseems to be comparable to the United States (USA) and other European countries [26,27].
In light of these former surveys we wanted to find out the current situation in a German regionin which the social and economic environment for health-related measures is comparably good, i.e.,clearly above average. If the results of such a survey show that the implementation of workplace healthmanagement measures is still as poor as previous surveys suggest, we may conclude and confirmthat serious implementation problems persist also within an above-average social and economicenvironment. Thus, we designed a short survey of health-related measures in small, medium, and bigenterprises in the county of Reutlingen (Landkreis Reutlingen). As far as socio-economic strengthand population health is concerned, the County of Reutlingen is well above the German average.In 2015, e.g., the unemployment rate in the county was 3.7% (Germany: 6.4%), the average monthlyhousehold income per inhabitant amounted to 1946 €, i.e., about 2208 USD (Germany: 1787 €, i.e.,about 2028 USD), and the gross domestic product per inhabitant was 38,400 €, i.e., about 43,574 USD(Germany: 36,900 €, i.e., about 41,872 USD) [28]. At the same time, the average life expectancy in thecounty was 82.69 years (Germany: 80.89 years). At the end of 2015, the county had 282,000 inhabitants.Furthermore, five out of 26 municipalities in the county have been certificated as ‘healthy communities’because of their commitment to promote physical activity and population health.
In our survey, we addressed only companies that had a minimum size of 10 employees incraft enterprises or 20 employees respectively in non-craft enterprises (cf., further details in the nextsection). Craft enterprises are enterprises that do not produce industrial mass goods, but generallywork to order or provide services on demand (such as carpenters, painters, etc.). As we know fromprevious studies that the implementation of health-related measures in micro enterprises is very pooror virtually non-existent [21–24], we concentrated—for economic reasons—on enterprises that had acertain minimum size. Thus, our focus on small, medium, and big enterprises (leaving aside micro, i.e.,very small enterprises) and on the county of Reutlingen sets the framework for the following argument.If the degree of implementation of workplace health management measures in the companies we
39
IJERPH 2019, 16, 726
surveyed is good or acceptable, we should not conclude that this is the same (or similar) on averagein Germany. On the other hand, if the degree of implementation is poor even in the companies wesurveyed, we can conclude that this probably also applies to the German average.
In this context, we will answer the following research questions (RQs):
RQ 1: What is the current state as to the implementation of various workplace health management measures inthe companies we addressed in our survey?
RQ 2: Do enterprises generally comply with legal requirements in the areas of occupational health and safetyand reintegration management?
RQ 3: What influence does the size of the company have on implementation status?RQ 4: How satisfied are company representatives with the implementation status as to the above-mentioned
four components of workplace health management? How aware are the company representatives ofinadequate implementation?
2. Materials and Methods
2.1. Data Collection
In July 2017, N = 906 enterprises in the county of Reutlingen in southwestern Germany weredetermined as potential respondents of the survey. This number contained all of the enterprises in thecounty, except for the very small ones: we excluded craft businesses with less than 10 employees andnon-craft enterprises with less than 20 employees.
At the end of July and the beginning of August 2017, we sent a standardized questionnaireto these 906 enterprises. Craft businesses received our letter via the local chamber of crafts, whichsupported the survey; non-craft enterprises received the questionnaire directly from our institute, aswe were able to use the complete address data record of the county’s enterprises that was availablefrom a marketing agency (Creditreform [29]). An enclosed leaflet included the request to hand out thequestionnaire either to the managing director or to a member of the personnel department. Fourteendays after the first invitation to participate in the survey, a reminder was sent to all of the potentialparticipants, regardless of whether some of them had already returned the questionnaire.
A formal ethical approval from the ethical committee at the University Hospital Tübingen wasnot required. Study participants were informed that the study was voluntary, and that all of the datawere analyzed anonymously.
2.2. Questionnaire
The questionnaire was based on previous studies and current literature [24,30–33]. It wasdeveloped, discussed, and formulated in a multidisciplinary team consisting of a specialist inoccupational medicine (MAR), a sociologist and public health researcher (AS), and a medical student(AH). After a pretest with N = 24 participants (senior employees of the personnel departments ofdifferent enterprises of the metal and electrical industry in southwestern Germany), the questionnairewas partially modified and supplemented to ensure good comprehensibility.
Based on a self-developed questionnaire for a similar survey of companies in Constance Countythat was conducted in 2015 [34], questions covered the implementation status of four categories ofhealth-related measures within the enterprise, referring to the above-mentioned four componentsof workplace health management. Each category was assessed by several items depicting typicalmeasures (cf., Table 1). Answers regarding the implementation of individual measures in the companywithin the last two years could be given on a three-point Likert scale (zero = ‘no’, one = ‘no, but inconcrete planning’, two = ‘yes’). Hereby, the order of the four categories was as following: workplacehealth promotion (six items and one possibility for free-text indication), occupational health andsafety (seven items and one free-text indication), personnel development (five items and one free-textindication), and reintegration management for employees on long-term sickness absence (eight itemsand one free-text indication) (cf., Table 1 for all items).
40
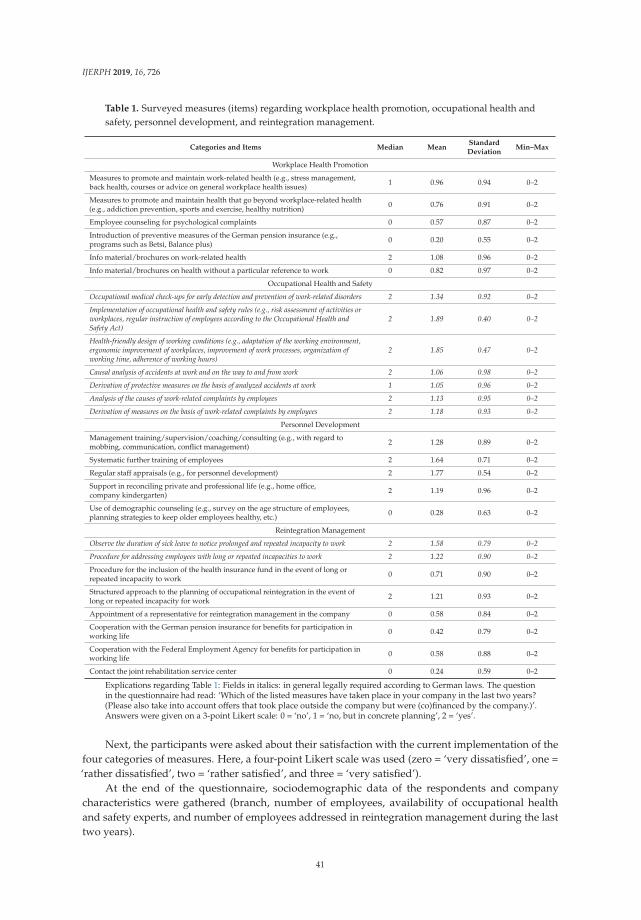
IJERPH 2019, 16, 726
Table 1. Surveyed measures (items) regarding workplace health promotion, occupational health andsafety, personnel development, and reintegration management.
Categories and Items Median MeanStandardDeviation
Min–Max
Workplace Health Promotion
Measures to promote and maintain work-related health (e.g., stress management,back health, courses or advice on general workplace health issues) 1 0.96 0.94 0–2
Measures to promote and maintain health that go beyond workplace-related health(e.g., addiction prevention, sports and exercise, healthy nutrition) 0 0.76 0.91 0–2
Employee counseling for psychological complaints 0 0.57 0.87 0–2
Introduction of preventive measures of the German pension insurance (e.g.,programs such as Betsi, Balance plus) 0 0.20 0.55 0–2
Info material/brochures on work-related health 2 1.08 0.96 0–2
Info material/brochures on health without a particular reference to work 0 0.82 0.97 0–2
Occupational Health and Safety
Occupational medical check-ups for early detection and prevention of work-related disorders 2 1.34 0.92 0–2
Implementation of occupational health and safety rules (e.g., risk assessment of activities orworkplaces, regular instruction of employees according to the Occupational Health andSafety Act)
2 1.89 0.40 0–2
Health-friendly design of working conditions (e.g., adaptation of the working environment,ergonomic improvement of workplaces, improvement of work processes, organization ofworking time, adherence of working hours)
2 1.85 0.47 0–2
Causal analysis of accidents at work and on the way to and from work 2 1.06 0.98 0–2
Derivation of protective measures on the basis of analyzed accidents at work 1 1.05 0.96 0–2
Analysis of the causes of work-related complaints by employees 2 1.13 0.95 0–2
Derivation of measures on the basis of work-related complaints by employees 2 1.18 0.93 0–2
Personnel Development
Management training/supervision/coaching/consulting (e.g., with regard tomobbing, communication, conflict management) 2 1.28 0.89 0–2
Systematic further training of employees 2 1.64 0.71 0–2
Regular staff appraisals (e.g., for personnel development) 2 1.77 0.54 0–2
Support in reconciling private and professional life (e.g., home office,company kindergarten) 2 1.19 0.96 0–2
Use of demographic counseling (e.g., survey on the age structure of employees,planning strategies to keep older employees healthy, etc.) 0 0.28 0.63 0–2
Reintegration Management
Observe the duration of sick leave to notice prolonged and repeated incapacity to work 2 1.58 0.79 0–2
Procedure for addressing employees with long or repeated incapacities to work 2 1.22 0.90 0–2
Procedure for the inclusion of the health insurance fund in the event of long orrepeated incapacity to work 0 0.71 0.90 0–2
Structured approach to the planning of occupational reintegration in the event oflong or repeated incapacity for work 2 1.21 0.93 0–2
Appointment of a representative for reintegration management in the company 0 0.58 0.84 0–2
Cooperation with the German pension insurance for benefits for participation inworking life 0 0.42 0.79 0–2
Cooperation with the Federal Employment Agency for benefits for participation inworking life 0 0.58 0.88 0–2
Contact the joint rehabilitation service center 0 0.24 0.59 0–2
Explications regarding Table 1: Fields in italics: in general legally required according to German laws. The questionin the questionnaire had read: ‘Which of the listed measures have taken place in your company in the last two years?(Please also take into account offers that took place outside the company but were (co)financed by the company.)’.Answers were given on a 3-point Likert scale: 0 = ‘no’, 1 = ‘no, but in concrete planning’, 2 = ‘yes’.
Next, the participants were asked about their satisfaction with the current implementation of thefour categories of measures. Here, a four-point Likert scale was used (zero = ‘very dissatisfied’, one =‘rather dissatisfied’, two = ‘rather satisfied’, and three = ‘very satisfied’).
At the end of the questionnaire, sociodemographic data of the respondents and companycharacteristics were gathered (branch, number of employees, availability of occupational healthand safety experts, and number of employees addressed in reintegration management during the lasttwo years).
41
IJERPH 2019, 16, 726
2.3. Statistical Analysis
For each category of measures a score, ranging from ‘zero’ to ‘10’, was calculated to represent astandardized implementation grade. This score was only calculated if at most one entry per categorywas missing. A score of ‘zero’ points corresponded to no offered measures and no measures in concreteplanning, while a score of ‘10’ stood for the complete implementation of all the listed measures ina given category. The legal requirements in a given category were considered ‘fulfilled’ if all ofthe legally required measures of that category had been implemented. All seven measures listedin the category ‘occupational safety and health’ were legally required due to regulations in the“Arbeitsschutzgesetz” ([Act on the Implementation of Measures of Occupational Safety and Healthto Encourage Improvements in the Safety and Health Protection of Workers at Work]—ArbSchG(1996) [35]), in the “Verordnung über die arbeitsmedizinische Vorsorge” ([Ordinance on OccupationalHealth Care]—ArbMedVV (2008) [36]), in the “Arbeitssicherheitsgesetz” ([Act on OccupationalPhysicians, Safety Engineers, and Other Occupational Safety Specialists]—ASiG (1973) [37]), in the“DGUV Vorschrift 1” ([DGUV Regulation 1 “Principles of prevention”] (2013) [38]) and the “DGUVVorschrift 2” ([DGUV Regulation 2 “Occupational physicians and OSH professionals”] (2011) [39]),and the first two measures listed in the category ‘reintegration management’ were legally requireddue to the respective regulations in “Book Nine of the Social Code” (Sozialgesetzbuch) (§ 167 SGB“Prevention” [40]) (cf., Table 1).
Rank correlation (Spearman’s r) coefficients were calculated to analyze relationships betweenordinal variables (such as, e.g., satisfaction with a given implementation status) and metricallyscaled variables or when metrical variables were not normally distributed. Thus, e.g., Spearman’sr was calculated to compare companies of different sizes, which were measured by their numberof employees, in terms of adherence of legal requirements (categorized as either ‘yes’/‘fulfilled’ or‘no’/‘not fulfilled’). To analyze relationships between metrically scaled and normally distributedvariables, we calculated Pearson’s correlation coefficients. Coefficients up to 0.3 were classified as low,those between 0.3–0.5 were classified as moderate, and those from 0.5 on were classified as high [41].The level of significance was set to p < 0.05.
As part of a non-responder analysis, responding and non-responding companies were comparedconcerning their company size. For this purpose, we used an ordinal five-point scale of companysize that had been delivered by the Reutlingen Chamber of Crafts for craft enterprises, and thuswas available for both responders and non-responders. We proceeded similarly with regard to thenon-craft enterprises.
All of the analyses were performed with SPSS, version 24 (IBM Analytics, IBM Corporation,Armonk, NY, USA).
3. Results
3.1. Participants
The response rate to the questionnaire was all in all 24.5% (N = 222/906). On average, there wereless than 5% missing values in each category of the questionnaire. The response was above average inmedium-sized companies (cf., Table 2) with 101 to 500 employees (31.5% and 32.3%), whereas it wasclearly below average in small enterprises with up to 50 employees (22.1%) and in big companies withmore than 500 employees (23.1%). Then, the correlation between response and company size seems tobe of the inverted u-shaped type. About half of the companies (48.2%) indicated the availability of anoccupational health physician, with a range from 29.4% (small companies with up to 50 employees) to85.0% (companies with 201 to 500 employees). The presence of an occupational safety engineer wasreported by 76.8% of all the participating companies (cf., in greater detail in Table 2).
42
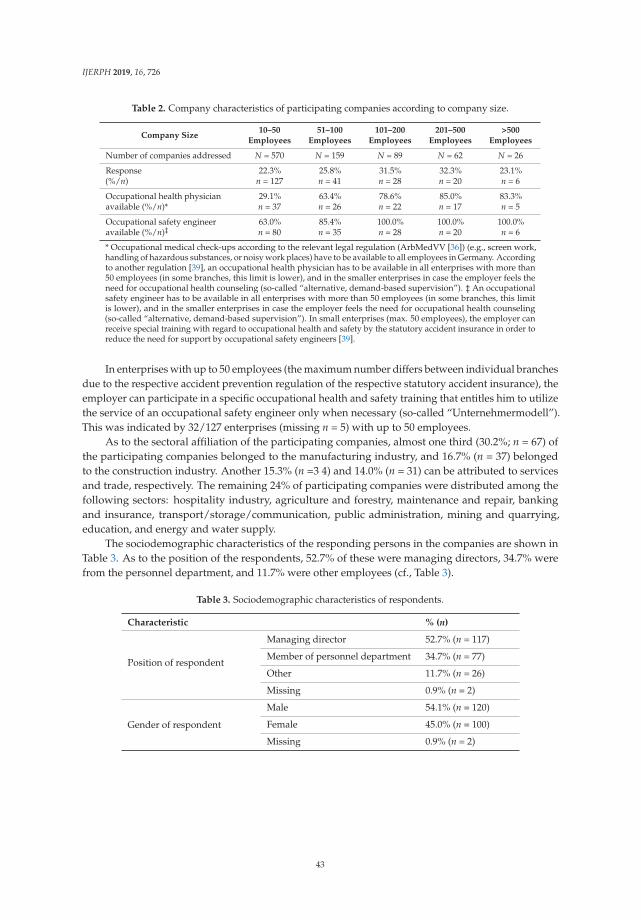
IJERPH 2019, 16, 726
Table 2. Company characteristics of participating companies according to company size.
Company Size10–50
Employees51–100
Employees101–200
Employees201–500
Employees>500
Employees
Number of companies addressed N = 570 N = 159 N = 89 N = 62 N = 26
Response(%/n)
22.3%n = 127
25.8%n = 41
31.5%n = 28
32.3%n = 20
23.1%n = 6
Occupational health physicianavailable (%/n)*
29.1%n = 37
63.4%n = 26
78.6%n = 22
85.0%n = 17
83.3%n = 5
Occupational safety engineeravailable (%/n)‡
63.0%n = 80
85.4%n = 35
100.0%n = 28
100.0%n = 20
100.0%n = 6
* Occupational medical check-ups according to the relevant legal regulation (ArbMedVV [36]) (e.g., screen work,handling of hazardous substances, or noisy work places) have to be available to all employees in Germany. Accordingto another regulation [39], an occupational health physician has to be available in all enterprises with more than50 employees (in some branches, this limit is lower), and in the smaller enterprises in case the employer feels theneed for occupational health counseling (so-called “alternative, demand-based supervision”). ‡ An occupationalsafety engineer has to be available in all enterprises with more than 50 employees (in some branches, this limitis lower), and in the smaller enterprises in case the employer feels the need for occupational health counseling(so-called “alternative, demand-based supervision”). In small enterprises (max. 50 employees), the employer canreceive special training with regard to occupational health and safety by the statutory accident insurance in order toreduce the need for support by occupational safety engineers [39].
In enterprises with up to 50 employees (the maximum number differs between individual branchesdue to the respective accident prevention regulation of the respective statutory accident insurance), theemployer can participate in a specific occupational health and safety training that entitles him to utilizethe service of an occupational safety engineer only when necessary (so-called “Unternehmermodell”).This was indicated by 32/127 enterprises (missing n = 5) with up to 50 employees.
As to the sectoral affiliation of the participating companies, almost one third (30.2%; n = 67) ofthe participating companies belonged to the manufacturing industry, and 16.7% (n = 37) belongedto the construction industry. Another 15.3% (n =3 4) and 14.0% (n = 31) can be attributed to servicesand trade, respectively. The remaining 24% of participating companies were distributed among thefollowing sectors: hospitality industry, agriculture and forestry, maintenance and repair, bankingand insurance, transport/storage/communication, public administration, mining and quarrying,education, and energy and water supply.
The sociodemographic characteristics of the responding persons in the companies are shown inTable 3. As to the position of the respondents, 52.7% of these were managing directors, 34.7% werefrom the personnel department, and 11.7% were other employees (cf., Table 3).
Table 3. Sociodemographic characteristics of respondents.
Characteristic % (n)
Position of respondent
Managing director 52.7% (n = 117)
Member of personnel department 34.7% (n = 77)
Other 11.7% (n = 26)
Missing 0.9% (n = 2)
Gender of respondent
Male 54.1% (n = 120)
Female 45.0% (n = 100)
Missing 0.9% (n = 2)
43
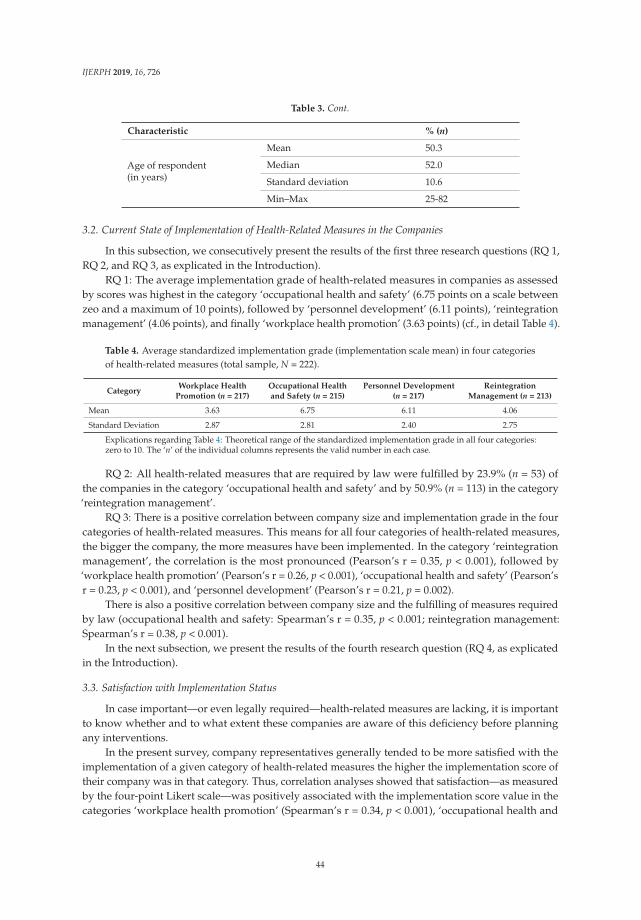
IJERPH 2019, 16, 726
Table 3. Cont.
Characteristic % (n)
Age of respondent(in years)
Mean 50.3
Median 52.0
Standard deviation 10.6
Min–Max 25-82
3.2. Current State of Implementation of Health-Related Measures in the Companies
In this subsection, we consecutively present the results of the first three research questions (RQ 1,RQ 2, and RQ 3, as explicated in the Introduction).
RQ 1: The average implementation grade of health-related measures in companies as assessedby scores was highest in the category ‘occupational health and safety’ (6.75 points on a scale betweenzeo and a maximum of 10 points), followed by ‘personnel development’ (6.11 points), ‘reintegrationmanagement’ (4.06 points), and finally ‘workplace health promotion’ (3.63 points) (cf., in detail Table 4).
Table 4. Average standardized implementation grade (implementation scale mean) in four categoriesof health-related measures (total sample, N = 222).
CategoryWorkplace Health
Promotion (n = 217)Occupational Healthand Safety (n = 215)
Personnel Development(n = 217)
ReintegrationManagement (n = 213)
Mean 3.63 6.75 6.11 4.06
Standard Deviation 2.87 2.81 2.40 2.75
Explications regarding Table 4: Theoretical range of the standardized implementation grade in all four categories:zero to 10. The ‘n’ of the individual columns represents the valid number in each case.
RQ 2: All health-related measures that are required by law were fulfilled by 23.9% (n = 53) ofthe companies in the category ‘occupational health and safety’ and by 50.9% (n = 113) in the category‘reintegration management’.
RQ 3: There is a positive correlation between company size and implementation grade in the fourcategories of health-related measures. This means for all four categories of health-related measures,the bigger the company, the more measures have been implemented. In the category ‘reintegrationmanagement’, the correlation is the most pronounced (Pearson’s r = 0.35, p < 0.001), followed by‘workplace health promotion’ (Pearson’s r = 0.26, p < 0.001), ‘occupational health and safety’ (Pearson’sr = 0.23, p < 0.001), and ‘personnel development’ (Pearson’s r = 0.21, p = 0.002).
There is also a positive correlation between company size and the fulfilling of measures requiredby law (occupational health and safety: Spearman’s r = 0.35, p < 0.001; reintegration management:Spearman’s r = 0.38, p < 0.001).
In the next subsection, we present the results of the fourth research question (RQ 4, as explicatedin the Introduction).
3.3. Satisfaction with Implementation Status
In case important—or even legally required—health-related measures are lacking, it is importantto know whether and to what extent these companies are aware of this deficiency before planningany interventions.
In the present survey, company representatives generally tended to be more satisfied with theimplementation of a given category of health-related measures the higher the implementation score oftheir company was in that category. Thus, correlation analyses showed that satisfaction—as measuredby the four-point Likert scale—was positively associated with the implementation score value in thecategories ‘workplace health promotion’ (Spearman’s r = 0.34, p < 0.001), ‘occupational health and
44
IJERPH 2019, 16, 726
safety’ (Spearman’s r = 0.16, p = 0.022), ‘personnel development’ (Spearman’s r = 0.21, p = 0.002), and‘reintegration management’ (Spearman’s r = 0.25, p < 0.001).
To get further hints on the above-mentioned awareness of company representatives, wefurthermore checked how satisfied those company representatives were whose enterprises had acomparably low implementation score in a given category. We defined having a ‘low implementationscore’ as belonging to the lowest quartile of the respective scores. In the category ‘workplace healthpromotion’, n = 81 companies (37.3%) belonged to the lowest implementation quartile, and inthe category ‘occupational health and safety’, n = 62 (28.8%) companies belonged to the lowestimplementation. In the category ‘personnel development’, n = 58 (26.7%) enterprises belonged tothe lowest implementation quartile, while in ‘reintegration management’ this was true for n = 57(26.8%) companies. Within each of these groups of enterprises with a comparably poor implementationof corresponding measures, a substantial proportion of company representatives were neverthelesssatisfied (either ‘rather satisfied’ or ‘very satisfied’) with the implementation status (cf., in detailTable 5). With regard to the current situation in the domain ‘workplace health promotion’, n = 33(40.7% of those companies that belonged to the lowest implementation score quartile) companyrepresentatives were satisfied. As to the domain ‘occupational health and safety’, n = 55 (88.7%)company representatives were satisfied in spite of their comparably poor implementation grade. As to‘personnel development’, n = 39 (67.2%) company representatives were satisfied, despite the relativelypoor implementation status of their companies, and regarding the category ‘reintegration management’,n = 25 (43.9%) of company representatives were satisfied, although they had a poor implementationrecord in this category. Thus, a substantial proportion—if not the majority—of ‘under-performing’enterprises (those belonging to the lowest score quartile) seemed to be satisfied despite a comparablypoor implementation.
Table 5. Satisfaction with implementation status in all enterprises vs. enterprises with poorimplementation status (enterprises in the lowest implementation score quartile).
Degree ofSatisfaction
Workplace HealthPromotion (N = 217)
Occupational Healthand Safety (N = 215)
PersonnelDevelopment (N = 217)
ReintegrationManagement (N = 213)
Enterprises in the lowest implementation score quartile
n = 81 n = 62 n = 58 n = 57
Dissatisfied: n (%) 38 (46.9) 6 (9.7) 18 (31.0) 20 (35.1)
Satisfied: n (%) 33 (40.7) 55 (88.7) 39 (67.2) 25 (43.9)
Missing: n (%) 10 (12.3) 1 (2.8) 1 (1.7) 12 (21.1)
Enterprises in the upper three implementation score quartiles
n = 136 n = 153 n = 159 n = 156
Dissatisfied: n (%) 25 (18.4) 7 (4.6) 24 (15.1) 30 (19.2)
Satisfied: n (%) 110 (80.9) 145 (94.8) 134 (84.3) 119 (76.3)
Missing: n (%) 1 (0.7) 1 (0.7) 1 (0.6) 7 (4.5)
Explication of Table 5: For the sake of clarity, the response categories ‘very dissatisfied’ and ’rather dissatisfied’ werecombined to form the ‘dissatisfied’ category, while the response categories ‘very satisfied’ and ‘rather satisfied’ werecombined to form the ‘satisfied’ category.
Turning to the association between satisfaction and the fulfillment of legally required measuresin a given domain, the results were as follows (cf., Table 6). Among those companies that did notcomply with all of the legal occupational health and safety requirements as assessed in this study(n = 155), 92.3% (n = 143) were satisfied with the current status of their company’s occupationalhealth and safety implementation. This proportion was nearly as high as within the group of companyrepresentatives whose companies fulfilled the listed legal requirements (96.2%). Correspondingly, therewas no significant correlation between satisfaction (dichotomously grouped into ‘satisfied’ versus‘dissatisfied’) and the fulfillment of legally required measures in that domain (Chi2 test p = 0.383;Fisher’s exact test p = 0.522). As to the category of ‘reintegration management’ (cf., Table 6), amongthose companies that did not comply with all of the listed legal requirements (n = 101), 53.5% (n = 54)
45
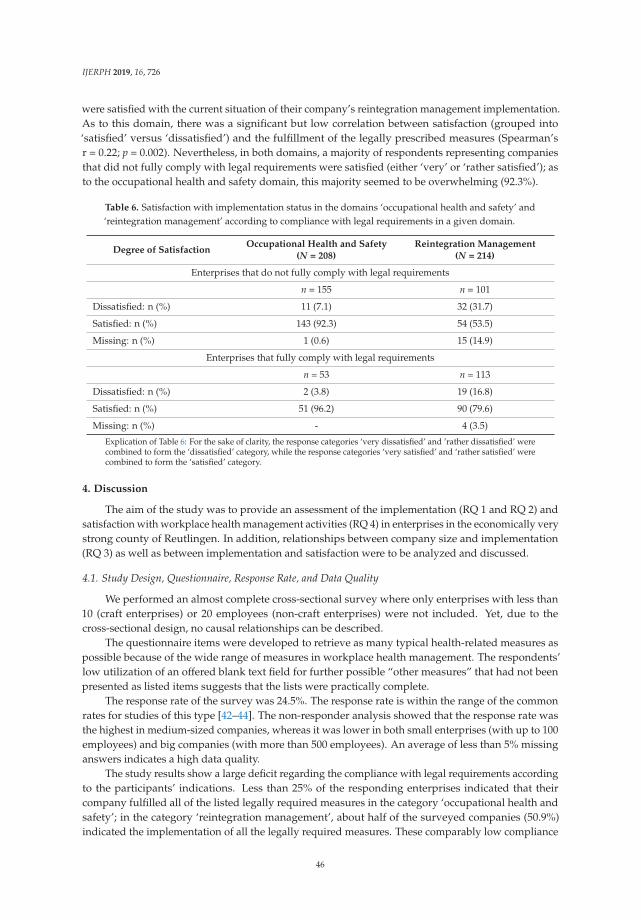
IJERPH 2019, 16, 726
were satisfied with the current situation of their company’s reintegration management implementation.As to this domain, there was a significant but low correlation between satisfaction (grouped into‘satisfied’ versus ‘dissatisfied’) and the fulfillment of the legally prescribed measures (Spearman’sr = 0.22; p = 0.002). Nevertheless, in both domains, a majority of respondents representing companiesthat did not fully comply with legal requirements were satisfied (either ‘very’ or ‘rather satisfied’); asto the occupational health and safety domain, this majority seemed to be overwhelming (92.3%).
Table 6. Satisfaction with implementation status in the domains ‘occupational health and safety’ and‘reintegration management’ according to compliance with legal requirements in a given domain.
Degree of SatisfactionOccupational Health and Safety
(N = 208)Reintegration Management
(N = 214)
Enterprises that do not fully comply with legal requirements
n = 155 n = 101
Dissatisfied: n (%) 11 (7.1) 32 (31.7)
Satisfied: n (%) 143 (92.3) 54 (53.5)
Missing: n (%) 1 (0.6) 15 (14.9)
Enterprises that fully comply with legal requirements
n = 53 n = 113
Dissatisfied: n (%) 2 (3.8) 19 (16.8)
Satisfied: n (%) 51 (96.2) 90 (79.6)
Missing: n (%) - 4 (3.5)
Explication of Table 6: For the sake of clarity, the response categories ‘very dissatisfied’ and ’rather dissatisfied’ werecombined to form the ‘dissatisfied’ category, while the response categories ‘very satisfied’ and ‘rather satisfied’ werecombined to form the ‘satisfied’ category.
4. Discussion
The aim of the study was to provide an assessment of the implementation (RQ 1 and RQ 2) andsatisfaction with workplace health management activities (RQ 4) in enterprises in the economically verystrong county of Reutlingen. In addition, relationships between company size and implementation(RQ 3) as well as between implementation and satisfaction were to be analyzed and discussed.
4.1. Study Design, Questionnaire, Response Rate, and Data Quality
We performed an almost complete cross-sectional survey where only enterprises with less than10 (craft enterprises) or 20 employees (non-craft enterprises) were not included. Yet, due to thecross-sectional design, no causal relationships can be described.
The questionnaire items were developed to retrieve as many typical health-related measures aspossible because of the wide range of measures in workplace health management. The respondents’low utilization of an offered blank text field for further possible “other measures” that had not beenpresented as listed items suggests that the lists were practically complete.
The response rate of the survey was 24.5%. The response rate is within the range of the commonrates for studies of this type [42–44]. The non-responder analysis showed that the response rate wasthe highest in medium-sized companies, whereas it was lower in both small enterprises (with up to 100employees) and big companies (with more than 500 employees). An average of less than 5% missinganswers indicates a high data quality.
The study results show a large deficit regarding the compliance with legal requirements accordingto the participants’ indications. Less than 25% of the responding enterprises indicated that theircompany fulfilled all of the listed legally required measures in the category ‘occupational health andsafety’; in the category ‘reintegration management’, about half of the surveyed companies (50.9%)indicated the implementation of all the legally required measures. These comparably low compliance
46
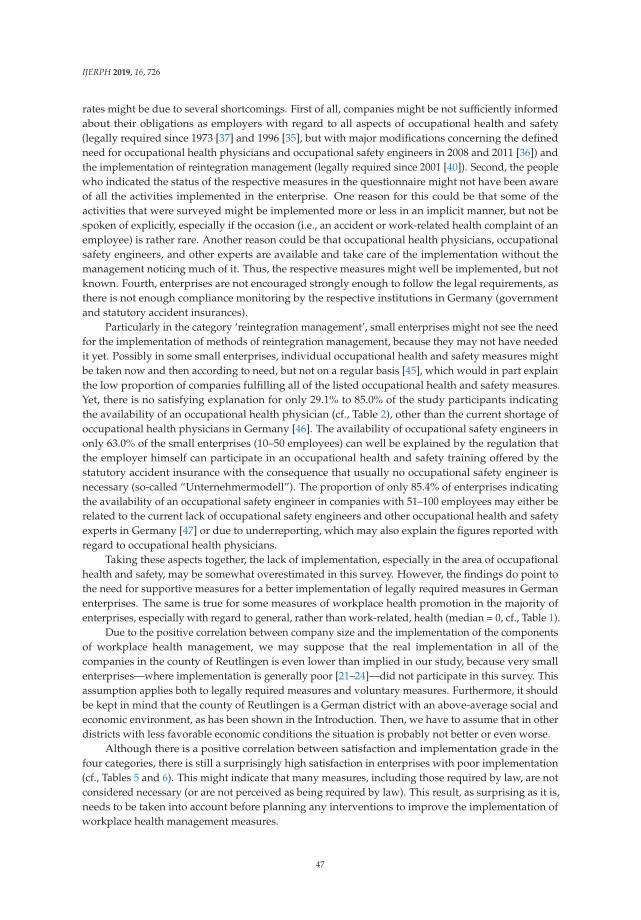
IJERPH 2019, 16, 726
rates might be due to several shortcomings. First of all, companies might be not sufficiently informedabout their obligations as employers with regard to all aspects of occupational health and safety(legally required since 1973 [37] and 1996 [35], but with major modifications concerning the definedneed for occupational health physicians and occupational safety engineers in 2008 and 2011 [36]) andthe implementation of reintegration management (legally required since 2001 [40]). Second, the peoplewho indicated the status of the respective measures in the questionnaire might not have been awareof all the activities implemented in the enterprise. One reason for this could be that some of theactivities that were surveyed might be implemented more or less in an implicit manner, but not bespoken of explicitly, especially if the occasion (i.e., an accident or work-related health complaint of anemployee) is rather rare. Another reason could be that occupational health physicians, occupationalsafety engineers, and other experts are available and take care of the implementation without themanagement noticing much of it. Thus, the respective measures might well be implemented, but notknown. Fourth, enterprises are not encouraged strongly enough to follow the legal requirements, asthere is not enough compliance monitoring by the respective institutions in Germany (governmentand statutory accident insurances).
Particularly in the category ‘reintegration management’, small enterprises might not see the needfor the implementation of methods of reintegration management, because they may not have neededit yet. Possibly in some small enterprises, individual occupational health and safety measures mightbe taken now and then according to need, but not on a regular basis [45], which would in part explainthe low proportion of companies fulfilling all of the listed occupational health and safety measures.Yet, there is no satisfying explanation for only 29.1% to 85.0% of the study participants indicatingthe availability of an occupational health physician (cf., Table 2), other than the current shortage ofoccupational health physicians in Germany [46]. The availability of occupational safety engineers inonly 63.0% of the small enterprises (10–50 employees) can well be explained by the regulation thatthe employer himself can participate in an occupational health and safety training offered by thestatutory accident insurance with the consequence that usually no occupational safety engineer isnecessary (so-called “Unternehmermodell”). The proportion of only 85.4% of enterprises indicatingthe availability of an occupational safety engineer in companies with 51–100 employees may either berelated to the current lack of occupational safety engineers and other occupational health and safetyexperts in Germany [47] or due to underreporting, which may also explain the figures reported withregard to occupational health physicians.
Taking these aspects together, the lack of implementation, especially in the area of occupationalhealth and safety, may be somewhat overestimated in this survey. However, the findings do point tothe need for supportive measures for a better implementation of legally required measures in Germanenterprises. The same is true for some measures of workplace health promotion in the majority ofenterprises, especially with regard to general, rather than work-related, health (median = 0, cf., Table 1).
Due to the positive correlation between company size and the implementation of the componentsof workplace health management, we may suppose that the real implementation in all of thecompanies in the county of Reutlingen is even lower than implied in our study, because very smallenterprises—where implementation is generally poor [21–24]—did not participate in this survey. Thisassumption applies both to legally required measures and voluntary measures. Furthermore, it shouldbe kept in mind that the county of Reutlingen is a German district with an above-average social andeconomic environment, as has been shown in the Introduction. Then, we have to assume that in otherdistricts with less favorable economic conditions the situation is probably not better or even worse.
Although there is a positive correlation between satisfaction and implementation grade in thefour categories, there is still a surprisingly high satisfaction in enterprises with poor implementation(cf., Tables 5 and 6). This might indicate that many measures, including those required by law, are notconsidered necessary (or are not perceived as being required by law). This result, as surprising as it is,needs to be taken into account before planning any interventions to improve the implementation ofworkplace health management measures.
47
IJERPH 2019, 16, 726
The results of our study seem to show—once again—that the effectiveness of a top–down approachto the implementation of comprehensive health-related measures in enterprises is rather limited, atleast in the context of Western, liberal–capitalist social systems. Even (or just?) in Germany, wherethere is a long tradition of occupational health and safety legislation, this seems evident. Perhapsa different, less top–down approach is more promising in contemporary Western social systems.The demonstration and publication of success stories of companies that have benefited economicallyfrom the implementation of comprehensive health management approaches and the dissemination ofcorresponding best practice models could possibly stimulate more willingness and motivation on thepart of companies to adopt such approaches in the mid and long term.
4.2. The Significance of the Study in Comparison with Previous Implementation Research in Germany
Compared with previous studies, this study has several special features. Most previous surveys,particularly those in Germany, were focused on workplace health promotion, while this studydifferentiates between four categories of workplace health management in order to gain detaileddata on each category. The correlation between implementation grade and company size is alreadywell evidenced by literature on Germany as well as other high-income countries [21,22,24–27,48–50].In addition, our study enables the analysis of new relationships such as the correlation betweenimplementation status and satisfaction of company representatives with their implementationstatus [30].
To get a holistic overview of the current situation of workplace health management, one mustmove on from the scope of our survey. It is not only important what companies do, but also how theydo it and, first of all, to what extent health-related measures actually reach the employees. Subjectiveperceptions of working conditions and appreciation of employees by managers play an important rolein employee health and well-being in companies, as has been shown for the prevention of psychologicaland psychosomatic disorders in employees in our recent research [44]. Therefore, further researchshould also integrate this dimension.
5. Conclusions
The implementation of health-related measures among companies of one county in southwesternGermany is heterogeneous. There are major shortcomings regarding compliance with legalrequirements, as well as specifically in the domain of occupational health and safety measures.Although there is a positive correlation between implementation and satisfaction, surprisingly manycompanies are satisfied despite a comparably poor implementation of single measures of workplacehealth management. These conditions—even in a country where occupational health and safety aswell as reintegration management for employees are legally required—must be taken into accountbefore planning interventions to improve workers’ health through a comprehensive approach.
Author Contributions: A.H., A.E., M.A.R., and A.S. drafted the manuscript. A.H., A.S., and M.A.R. developedthe study design; A.H., A.S., and M.A.R. developed the questionnaire; and A.S. performed the pre-test. A.H.,A.S., and M.A.R. planned the data collection, wrote the study protocol, and performed the survey. A.H. and A.E.performed the statistical analysis and received valuable advice from A.S. and M.A.R. All of the authors read andapproved the final manuscript.
Funding: The survey was financed by the institute’s own resources. The work of the Institute of Occupational andSocial Medicine and Health Services Research Tübingen is supported by an unrestricted grant of the Employers’Association of the Metal and Electric Industry Baden-Württemberg (Südwestmetall). We acknowledge additionalfinancial support by the German Research Foundation and the Open Access Publishing Fund of the University ofTübingen. This study is also part of the lead author’s (A.H.) work toward a doctoral degree.
Acknowledgments: The authors thank all the participating enterprises and the local chamber of crafts for supportof the survey. Parts of the questionnaire were based on a survey among enterprises in the Constance County in2015 [30] that was funded by the Sozialministerium (Ministry of Social Affairs) Baden-Württemberg (lead author:Martina Michaelis (Institute of Occupational and Social Medicine and Health Services Research Tübingen andResearch Centre for Occupational and Social Medicine (FFAS), Freiburg).
Conflicts of Interest: The authors declare no conflict of interest.
48
IJERPH 2019, 16, 726
References
1. World Economic Forum. The Global Risks Report 2016, 11th ed.; World Economic Forum: Cologny/Geneva,Switzerland, 2016.
2. Bundesministerium für Arbeit und Soziales. [Preservation of Employability. Occupational HealthRecommendation] Erhalt der Beschäftigungsfähigkeit, Arbeitsmedizinische Empfehlung. 2018. Availableonline: http://www.bmas.de/SharedDocs/Downloads/DE/PDF-Publikationen-DinA4/a452-erhalt-beschaeftigungsfaehigkeit.pdf?__blob=publicationFile (accessed on 20 December 2018).
3. Deutscher Industrie- und Handelskammertag. [Key Findings of the DIHK Business Survey at the Beginningof 2018.] Die wesentlichen Ergebnisse der DIHK-Konjunkturumfrage Jahresbeginn 2018. Availableonline: https://www.dihk.de/themenfelder/wirtschaftspolitik/konjunktur-und-wachstum/umfragen-und-prognosen/konjunkturumfrage-jahresbeginn-2018/ergebnisse-02-18 (accessed on 20 December 2018).
4. Bundesministerium für Wirtschaft und Energie. [Skilled Personnel for Germany] Fachkräfte fürDeutschland. 2018. Available online: https://www.bmwi.de/Redaktion/DE/Dossier/fachkraeftesicherung.html (accessed on 20 December 2018).
5. Südwestmetall. [Guidelines for Workplace Health Management] Leitfaden Betriebliches Gesundheitsmanagement.2014. Available online: https://www.suedwestmetall.de/SWM/medien.nsf/gfx/55FF5BE6D485B790C1257D5B00342E95/$file/BGM%20Leitfaden.pdf (accessed on 20 December 2018).
6. Badura, B.; Ducki, A.; Schröder, H.; Klose, J.; Meyer, M. [Absenteeism Report 2018. Experience Sense—Work andHealth] Fehlzeiten-Report 2018: Sinn erleben—Arbeit und Gesundheit; Springer: Berlin/Heidelberg, Germany, 2018.
7. Badura, B. [Work and Health in the 21st Century. Employee Retention through Cultural Development] Arbeitund Gesundheit im 21. Jahrhundert: Mitarbeiterbindung durch Kulturentwicklung; Springer: Berlin/Heidelberg,Germany, 2017.
8. Badura, B.; Ducki, A.; Schröder, H.; Klose, J.; Meyer, M. [Absenteeism Report 2016. CorporateCulture and Health—Challenges and Opportunities] Fehlzeiten-Report 2016: Unternehmenskultur undGesundheit—Herausforderungen und Chancen; Springer: Berlin/Heidelberg, Germany, 2016.
9. Anger, W.K.; Elliot, D.L.; Bodner, T.; Olson, R.; Rohlman, D.S.; Truxillo, D.M.; Kuehl, K.S.; Hammer, L.B.;Montgomery, D. Effectiveness of total worker health interventions. J. Occup. Health Psychol. 2015, 20, 226–247.[CrossRef] [PubMed]
10. Bradley, C.J.; Grossman, D.C.; Hubbard, R.A.; Ortega, A.N.; Curry, S.J. Integrated Interventions for ImprovingTotal Worker Health: A Panel Report from the National Institutes of Health Pathways to PreventionWorkshop: Total Worker Health-What’s Work Got to Do with It? Ann. Intern. Med. 2016, 165, 279–283.[CrossRef] [PubMed]
11. Feltner, C.; Peterson, K.; Palmieri Weber, R.; Cluff, L.; Coker-Schwimmer, E.; Viswanathan, M.; Lohr, K.N.Total Worker Health®175: Comparative Effectiveness Review Number; Agency for Healthcare Research andQuality: Rockville, MD, USA, 2016.
12. Feltner, C.; Peterson, K.; Palmieri Weber, R.; Cluff, L.; Coker-Schwimmer, E.; Viswanathan, M.; Lohr, K.N.The Effectiveness of Total Worker Health Interventions: A Systematic Review for a National Institutes ofHealth Pathways to Prevention Workshop. Ann. Intern. Med. 2016, 165, 262–269. [CrossRef] [PubMed]
13. Faghri, P.D.; Punnett, L. Inclusion of ‘Total Worker Health®’ a program by NIOSH. Health Promot. Int. 2018.[CrossRef] [PubMed]
14. Rohlman, D.S.; Campo, S.; Hall, J.; Robinson, E.L.; Kelly, K.M. What Could Total Worker Health® Look Likein Small Enterprises? Ann. Work Expo. Health 2018, 62, 34–41. [CrossRef] [PubMed]
15. Thompson, J.; Schwatka, N.V.; Tenney, L.; Newman, L.S. Total Worker Health: A Small Business LeaderPerspective. Int. J. Environ. Res. Public Health 2018, 15, 2416. [CrossRef] [PubMed]
16. Tamers, S.L.; Goetzel, R.; Kelly, K.M.; Luckhaupt, S.; Nigam, J.; Pronk, N.P.; Rohlman, D.S.; Baron, S.;Brosseau, L.M.; Bushnell, T.; et al. Research Methodologies for Total Worker Health®: Proceedings from aWorkshop. J. Occup. Environ. Med. 2018, 60, 968–978. [CrossRef] [PubMed]
17. Schill, A.L.; Chosewood, L.C. The NIOSH Total Worker Health™ program: An overview. J. Occup.Environ. Med. 2013, 55, 8–11. [CrossRef] [PubMed]
18. Schill, A.L.; Chosewood, L.C. Total Worker Health®: More Implications for the Occupational Health Nurse.Workplace Health Saf. 2016, 64, 4–5. [CrossRef] [PubMed]
49
IJERPH 2019, 16, 726
19. Schill, A.L. Advancing Well-Being Through Total Worker Health®. Workplace Health Saf. 2017, 65, 158–163.[CrossRef] [PubMed]
20. Drexler, H.; Letzel, S.; Nesseler, T. [Occupational medicine 4.0: Theses of Occupational Medicine on the Statusand Development Needs of Occupational Prevention and Health Promotion in Germany.] Arbeitsmedizin4.0, Thesen der Arbeitsmedizin zum Stand und zum Entwicklungsbedarf der betrieblichen Prävention undGesundheitsförderung in Deutschland; Stellungnahme der Deutschen Gesellschaft für Arbeitsmedizin undUmweltmedizin, DGAUM. Available online: https://www.arbeitenviernull.de/fileadmin/user_upload/Arbeitsmedizin_4.0_Broschuere_final.pdf (accessed on 27 February 2019).
21. European Agency for Safety and Health at Work. Motivation for Employers to Carry out Workplace HealthPromotion, Literature Review. Available online: https://osha.europa.eu/en/tools-and-publications/publications/literature_reviews/motivation-for-employers-to-carry-out-workplace-health-promotion (accessedon 20 December 2018).
22. Ahlers, E. [Demand and Reality of Workplace Health Managment in a Changing Working Environment.]Anspruch und Wirklichkeit des Betrieblichen Gesundheitsmanagements in Einer sich VeränderndenArbeitswelt. In Absenteeism Report 2015; Badura, B., Ducki, A., Schröder , H., Klose, J., Meyer, M., Eds.;Springer: Berlin/Heidelberg, Germany, 2015; pp. 39–47.
23. Kiesche, E. [Workplace Health Management.] Betriebliches Gesundheitsmanagement; Bund-Verlag:Frankfurt am Main, Germany, 2013.
24. Bechmann, S.; Jäckle, R.; Lück, P.; Herdegen, R. [Motives and Barriers for Worksite Health Management.Survey and Recommendation.] Motive und Hemmnisse für Betriebliches Gesundheitsmanagement (BGM),Umfrage und Empfehlungen. 2011. Available online: https://www.iga-info.de/fileadmin/redakteur/Veroeffentlichungen/iga_Reporte/Dokumente/iga-Report_20_Umfrage_BGM_KMU_final_2011.pdf (accessedon 27 February 2019).
25. Beck, D. [Modern Health Policy in Micro and Small Enterprises. Inhibiting and Promoting Conditions] ZeitgemäßeGesundheitspolitik in Kleinst- und Kleinbetrieben: Hemmende und fördernde Bedingungen, 1st ed.; Sigma: Berlin,Germany, 2011.
26. Linnan, L.; Bowling, M.; Childress, J.; Lindsay, G.; Blakey, C.; Pronk, S.; Wieker, S.; Royall, P. Results ofthe 2004 National Worksite Health Promotion Survey. Am. J. Public Health 2008, 98, 1503–1509. [CrossRef][PubMed]
27. Tremblay, P.A.; Nobrega, S.; Davis, L.; Erck, E.; Punnett, L. Healthy workplaces? A survey of Massachusettsemployers. Am. J. Health Promot. 2013, 27, 390–400. [CrossRef] [PubMed]
28. Bundesinstitut für Bau-, Stadt- und Raumforschung. [Indicators and Maps for Territorial and UrbanDevelopment] Indikatoren und Karten zur Raum- und Stadtentwicklung. 2018. Available online: https://www.inkar.de (accessed on 20 August 2018).
29. Federation of Creditreform Associations. Services, Marketing Data from the Information Expert.2019. Available online: https://www.creditreform.com/en/services/marketing-data.html (accessed on29 January 2019).
30. Michaelis, M.; Rieger, M.A. [Scientific Support and Conducting of the Survey to Determine the Needs withRegard to “Workplace Health Management (BGM) in the Lake of Konstanz county”] WissenschaftlicheBegleitung und Durchführung der Befragung zur Bedarfsermittlung “Betriebliches Gesundheitsmanagement(BGM) im Landkreis Konstanz”. In [Unpublished final report on the research project “Scientific Monitoring of theModel Phase I Dialogue on Work and Health“ for submission to the “Work and Health“ department, Ministery ofEconomics, Labour and Housing Baden-Württemberg] Unveröffentlichter Abschlussbericht zum Forschungsvorhaben“Wissenschaftliche Begleitung der Modellphase I Dialog Arbeit und Gesundheit“ zur Vorlage beim Referat “Arbeitund Gesundheit“, Ministerium für Wirtschaft, Arbeit und Wohnungsbau Baden-Württemberg; Rieger, M.A., Ed.;Tübingen, Germany, 2017; pp. 11–29.
31. Rieger, M.A.; Hildenbrand, S.; Nesseler, T.; Letzel, S.; Nowak, D. [Prevention and Health Promotion atthe Interface between Curative Medicine and Occupational Medicine: A Compendium for Occupational HealthManagement.] Prävention und Gesundheitsförderung an der Schnittstelle zwischen kurativer Medizin undArbeitsmedizin: Ein Kompendium für das Betriebliche Gesundheitsmanagement; Ecomed Medizin: Landsberg amLech, Germany, 2016.
50
IJERPH 2019, 16, 726
32. Bräunig, D.; Haupt, J.; Kohstall, T.; Kramer, I.; Pieper, C.; Schröer, S. [Effectiveness and Benefits ofOccupational Prevention.] Wirksamkeit und Nutzen betrieblicher Prävention, iga-Report.28. Availableonline: https://www.iga-info.de/fileadmin/redakteur/Veroeffentlichungen/iga_Reporte/Dokumente/iga-Report_28_Wirksamkeit_Nutzen_betrieblicher_Praevention.pdf (accessed on 27 February 2019).
33. Knoche, K.; Sochert, R. [Company Reintegration Management.] Betriebliches Eingliederungsmanagement,Iga.Report 24. 2013. Available online: https://www.iga-info.de/fileadmin/redakteur/Veroeffentlichungen/iga_Reporte/Dokumente/iga-Report_24_Betriebliches_Eingliederungsmanagement.pdf (accessedon 27 February 2019).
34. Rieger, M.A. [Scientific support and implementation of the survey to determine the needs of ‘WorkplaceHealth Management in the Constance County’.] Wissenschaftliche Begleitung und Durchführung derBefragung zur Bedarfsermittlung ‘Betriebliches Gesundheitsmanagement (BGM) im Landkreis Konstanz’.In [Unpublished final report on the research project “Scientific Monitoring of the Model Phase I Dialogue on Workand Health“ for submission to the “Work and Health“ department, Ministery of Economics, Labour and HousingBaden-Württemberg] Unveröffentlichter Abschlussbericht zum Forschungsvorhaben “Wissenschaftliche Begleitungder Modellphase I Dialog Arbeit und Gesundheit“ zur Vorlage beim Referat “Arbeit und Gesundheit“, Ministerium fürWirtschaft, Arbeit und Wohnungsbau Baden-Württemberg; Rieger, M.A., Ed.; Tübingen, Germany, 2017; pp. 4–6.
35. Arbeitsschutzgesetz [Act on the Implementation of Measures of Occupational Safety and Health to EncourageImprovements in the Safety and Health Protection of Workers at Work]: ArbSchG. 1996. Available online:http://www.gesetze-im-internet.de/englisch_arbschg/ (accessed on 28 February 2019).
36. Verordnung über die arbeitsmedizinische Vorsorge [Ordinance on Occupational Health Care]: ArbMedVV.2008. Available online: https://www.gesetze-im-internet.de/englisch_arbmedvv/englisch_arbmedvv.html(accessed on 28 February 2019).
37. Arbeitssicherheitsgesetz [Act on Occupational Physicians, Safety Engineers and Other Occupational SafetySpecialists]: ASiG. 1973. Available online: https://www.gesetze-im-internet.de/englisch_asig/englisch_asig.html (accessed on 28 February 2019).
38. Deutsche Gesetzliche Unfallversicherung. DGUV Regulation 1, Accident Prevention Regulation. Principlesof Prevention. 2013. Available online: https://www.dguv.de/medien/inhalt/praevention/vorschriften_regeln/vorschrift_1_en.pdf (accessed on 28 January 2019).
39. Deutsche Gesetzliche Unfallversicherung. DGUV Regulation 2, Accident Prevention Regulation.Occupational Physicians and OSH Professionals. Available online: https://www.dguv.de/medien/inhalt/praevention/vorschriften_regeln/regulation_2_en.pdf (accessed on 28 January 2019).
40. Sozialgesetzbuch (SGB IX) Neuntes Buch Rehabilitation und Teilhabe von Menschen mit Behinderungen[Book Nine of the Social Code (§ 167 SGB “Prevention”)]: § 167 SGB IX “Prevention”. 2018. Available online:https://www.gesetze-im-internet.de/sgb_9_2018/__167.html (accessed on 28 February 2019).
41. Cohen, J. Statistical Power Analysis for the Behavioral Sciences, 2nd ed.; Erlbaum: Hillsdale, MI, USA, 1988.42. Völter-Mahlknecht, S.; Michaelis, M.; Preiser, C.; Blomberg, N.; Rieger, M.A. Research Report
448. Utilization of Medical Check-ups in the Field of Occupational Medicine. Available online:http://www.bmas.de/SharedDocs/Downloads/DE/PDF-Publikationen/forschungsbericht-f448.pdf;jsessionid=DA7F8539671B556D67B3FC0A659C634D?__blob=publicationFile (accessed on 28 January 2019).
43. Michaelis, M.; Lange, R.; Junne, F.; Rothermund, E.; Zipfel, S.; Gündel, H.; Rieger, M.A. Prevention of commonmental disorders in employees—Conception, study design and sample characteristics of a multi-target survey.Ment. Health Prev. 2016, 4, 88–95. [CrossRef]
44. Junne, F.; Michaelis, M.; Rothermund, E.; Stuber, F.; Gündel, H.; Zipfel, S.; Rieger, M.A. The Role ofWork-Related Factors in the Development of Psychological Distress and Associated Mental Disorders:Differential Views of Human Resource Managers, Occupational Physicians, Primary Care Physicians andPsychotherapists in Germany. Int. J. Environ. Res. Public Health 2018, 15, 559. [CrossRef] [PubMed]
45. Schuller, K. [“Good we talked about this . . . ?!“—Methodological challenges for the risk assessmentof psychological stress in SMEs] “Gut, dass wir mal darüber geredet haben . . . ?!“—MethodischeHerausforderungen für die Gefährdungsbeurteilung psychischer Belastung in KMU. ArbeitsmedizinSozialmedizin Umweltmedizin 2018, 53, 790–797.
46. Barth, C.; Hamacher, W.; Blanco-Trillo, S. [Occupational health care needs in Germany] ArbeitsmedizinischerBetreuungsbedarf in Deutschland. 2014. Available online: https://www.baua.de/DE/Angebote/Publikationen/Berichte/F2326.pdf?__blob=publicationFile&v=5 (accessed on 29 January 2019).
51
IJERPH 2019, 16, 726
47. Barth, C.; Eickholt, C.; Hamacher, W.; Schmauder, M. [Need for occupational safety specialists in Germany]Bedarf an Fachkräften für Arbeitssicherheit in Deutschland. Available online: https://www.baua.de/DE/Angebote/Publikationen/Berichte/F2388.pdf?__blob=publicationFile&v=4 (accessed on 29 January 2019).
48. Harris, J.R.; Hannon, P.A.; Beresford, S.A.A.; Linnan, L.A.; McLellan, D.L. Health promotion in smallerworkplaces in the United States. Annu. Rev. Public Health 2014, 35, 327–342. [CrossRef] [PubMed]
49. Beck, D.; Lenhardt, U. [Workplace Health Promotion in Germany: Prevalence and Utilisation. Analyseson Labour Force Surveys of the Federal Institute for Occupational Safety and Health in 2006 and 2012.]Betriebliche Gesundheitsförderung in Deutschland: Verbreitung und Inanspruchnahme. Ergebnisse derBIBB/BAuA-Erwerbstätigenbefragungen 2006 und 2012. Gesundheitswesen 2016, 78, 56–62. [PubMed]
50. Faller, G. [Implementation of Workplace Health Promotion/Workplace Health Managementin Germany: State-of-the Art and Need for Further Research.] Umsetzung BetrieblicherGesundheitsförderung/Betrieblichen Gesundheitsmanagements in Deutschland: Stand undEntwicklungsbedarfe der einschlägigen Forschung. Gesundheitswesen 2018, 80, 278–285. [PubMed]
© 2019 by the authors. Licensee MDPI, Basel, Switzerland. This article is an open accessarticle distributed under the terms and conditions of the Creative Commons Attribution(CC BY) license (http://creativecommons.org/licenses/by/4.0/).
52
International Journal of
Environmental Research
and Public Health
Article
Total Worker Health: A Small BusinessLeader Perspective
Janalee Thompson 1, Natalie V. Schwatka 1,2,*, Liliana Tenney 1,2 and Lee S. Newman 1,2,3,4
1 Center for Health, Work & Environment, Colorado School of Public Health, University of Colorado,Anschutz Medical Campus, 13001 E. 17th Pl., 3rd Floor, Mail Stop B119 HSC, Aurora, CO 80045, USA;[email protected] (J.T.); [email protected] (L.T.); [email protected] (L.S.N.)
2 Department of Environmental and Occupational Health, Colorado School of Public Health,University of Colorado, Anschutz Medical Campus, 13001 E. 17th Pl., 3rd Floor, Mail Stop B119 HSC,Aurora, CO 80045, USA
3 Department of Epidemiology, Colorado School of Public Health, University of Colorado,Anschutz Medical Campus, 13001 E. 17th Pl., 3rd Floor, Mail Stop B119 HSC, Aurora, CO 80045, USA
4 Division of Pulmonary Science and Critical Care Medicine, Department of Medicine, School of Medicine,University of Colorado, Anschutz Medical Campus, 13001 E 17th Pl., Aurora, CO 80045, USA
* Correspondence: [email protected]; Tel.: +1-303-724-4607
Received: 28 September 2018; Accepted: 28 October 2018; Published: 31 October 2018
Abstract: Total Worker Health® (TWH) frameworks call for attention to organizational leadershipin the implementation and effectiveness of TWH approaches. It is especially important to studythis within in the small business environment where employees face significant health, safety,and well-being concerns and employers face barriers to addressing these concerns. The purposeof this study was to gain a better understanding of how small business leaders perceive employeehealth, safety, and well-being in the context of their own actions. We conducted semi-structuredinterviews with 18 small business senior leaders and used a qualitative coding approach to analyzethe transcripts to determine the frequency with which leaders discussed each code. When we askedleaders about their leadership practices for health, safety, and well-being, leaders reflected upon theirbusiness (65%), themselves (28%), and their employees (7%). Leaders rarely discussed the ways inwhich they integrate health, safety, and well-being. The interviews demonstrate that small businessleaders care about the health of their employees, but because of the perceived value to their business,not to employees or themselves. Thus, they may lack the knowledge and skills to be successful TWHleaders. The present study supports a need for continued small business TWH leadership research.
Keywords: workplace safety; safety leadership; health promoting leadership; safety programs;health promotion; health protection; leadership; qualitative study
1. Introduction
Total Worker Health® (TWH) is defined as policies, programs, and practice that integrateprotection from work-related safety and health hazards with promotion of injury and illness preventionefforts to advance worker well-being [1]. As the field of TWH gains research and practice support, it isimportant to study the role of organizational leadership. Several TWH frameworks call for attentionto organizational leadership in the implementation and effectiveness of TWH approaches [2–4].However, to date, leadership research has rarely integrated both health promoting leadership and safetyleadership. Doing so can improve our understanding of how to assess and improve TWH-specificleadership practices to ensure TWH system effectiveness [5]. This is especially important in the smallbusiness environment where employees face significant health, safety, and well-being concerns [6,7]and employers face barriers to addressing these concerns (e.g., resources) [6,8]. Therefore, as a first
IJERPH 2018, 15, 2416; doi:10.3390/ijerph15112416 www.mdpi.com/journal/ijerph53
IJERPH 2018, 15, 2416
step, the purpose of this study was to improve our understanding of how small business leadersperceive employee health, safety, and well-being in the context of their own actions.
The field of leadership research has grown substantially over the past few decades. Dinh et al. [9]found 66 leadership theory domains in their review of the leadership literature. While the evidencebase for each of these theories varies, it is generally agreed that leadership is a significant contributor toorganizational culture and ultimately, organizational success [10]. Successful organizations primarilyhave leaders who adopt several leadership characteristics to best meet organizational needs [11].A healthy business culture is derived from integrating leadership theories that align employee andorganizational goals [12], though some leaders who use some styles of leadership have been moreeffective in promoting health than others.
Building positive relationships, empowerment and the ability to view the organization from anemployee viewpoint are characteristics of successful leaders. Servant leaders are known for theirsupportive nature and how they achieve organizational goals by prioritizing needs of employeesfirst [13]. Similarly, leaders who employ high quality relationships (leader-member exchange (LMX))leverage employee relationships to meet organizational ambitions [14]. Successful leaders also placevalue in employee perceptions of meaningful work and contribution to the larger picture. Sirota’s ThreeFactor Theory argues for building and maintaining employee enthusiasm through equal treatment,employee belief that work is meaningful, and camaraderie. Sirota’s theory describes that when leaderschampion these factors, workers will be enthusiastic and motivated to produce more, while enjoyingwhat they do [15].
Leadership has an impact on employee physical and psychological health. Transformationalleadership, specifically, has been positively associated with psychological well-being [16], stress [17],depression [18], and sleep quality [19]. In terms of safety-specific outcomes, several meta-analysesdemonstrate that leadership (generally defined) and transformational leadership are related to bettersafety climate, better safety practices, and fewer occupational injuries [20–22]. However, employeehealth can also be compromised as a result of poor leadership. Researchers have found associationsbetween poor management support and ischemic heart disease [23], elevated blood pressure [24],problem drinking [25], smoking [26], as well as mental health issues related to affective well-being [27]and job well-being [16,28,29]. For example, Skakon et al. found that when leaders have high stress andpoor affective well-being, their subordinates also have high stress levels and poor well-being [27].
Recently, researchers have begun to investigate health promoting leadership. Health promotingleadership theory involves leadership characteristics that encourage wellness at work [30]. Researchhas shown that leaders who promote workplace health are hands-on, supportive [31], demonstratehealth awareness, and value community and fairness [32,33]. It has also been suggested thatwork-related stress may be reduced when specific, health promoting transformational leadershipskills are demonstrated at work [34]. Though research may be limited, all health promoting leadershipstudies suggest that health promoting leadership characteristics are likely to produce positive healthoutcomes. However, in the context of TWH, health promoting leadership fails to consider the role ofsafety leadership.
In contrast, the theory and evidence base for safety leadership gained traction over fifteenyears ago [35]. The majority of the safety-specific literature focuses on Bass’s multifactor leadershiptheory [36]. Some researchers developed safety-specific assessments of transformational and passiveleadership and found them to be more associated with safety outcomes than general forms ofleadership [37]. Studies have shown that the passive form of transactional safety leadership negativelyimpacts safety outcomes (e.g., injury rates) whereas transformational safety leadership positivelyimpacts safety outcomes [38]. However, other more active forms of transactional leadership, contingentreward and active management-by-exception, have been linked to positive safety outcomes [39].Safety leadership intervention studies have suggested that training leaders on transformational safetyleadership skills can lead to positive safety outcomes [40,41]. Other researchers applied the LMXtheory [42] and empowering leadership theory [43] to workplace safety and found both to be related
54
IJERPH 2018, 15, 2416
to positive safety outcomes. Although, similar to the singular focus of HP leadership, safety leadershipresearch has focused solely on safety and has rarely included research on other outcomes.
The literature illustrates the segmented nature of leadership research in the employee healthpromotion and safety contexts. Health promoting and safety leadership are both “best practices” tosupport worker health and safety but we are unaware of a concerted effort to evaluate their use insynchrony. Furthermore, we are aware of only one study that assessed health promotion and safetyleadership support amongst small businesses. They found that small business leaders who advocatefor TWH have higher integration scores than leaders who do not [44]. However, this study did notdefine TWH leadership support or describe the ways in which TWH leaders advocate. Thus, whilethere is some indication that TWH leadership is important amongst small businesses, it is unclearhow small businesses leaders can demonstrate support for TWH. For this reason, as a first step inunderstanding TWH leadership development needs, we sought to interview small business leaders tounderstand how they discuss their use of practices that demonstrate a commitment to health, safety,and well-being.
2. Materials and Methods
We conducted a qualitative study with small business leaders to understand their currentapproach to leadership for employee health, safety, and well-being (Appendix A). We recruitedsmall business leaders (<500 employees) in Colorado and Wyoming from a variety of industries byphone and email from May 2017 to August 2017. Businesses were identified through existing networksincluding a workers’ compensation insurer, chambers of commerce, and a community-based program,Health Links™. Leaders were eligible to participate if they had significant decision-making power inthe organization (e.g., owner, senior executive, or CEO).
The first author conducted 30-min, semi-structured interviews in-person or by phone askingeach leader how they perceive health, safety, and well-being in their organization and their rolein shaping it. The authors generated eleven interview questions based on the following themesrelated to key theories used in previous health promotion or safety leadership research: organizationalmission, organizational culture, leading by example as well as employee advancement, feedback,and recognition [11,15,37,45–47]. We chose these theories because they reflect important leadercharacteristics and actions for employee health, safety, and well-being. Beyond the transformationalstyle commonly studied in safety leadership [11,37], other styles layer in important leadership aspects,including openness, ethics [45], equity [15], focus on follower needs [47], and relationships [46].In keeping with the TWH framework, all questions inquired about leader actions associated withhealth, safety and well-being together. In keeping with leadership frameworks, all questions askedthem about their own practices, not their general business practices. If the interview lasted less than30 min, the first author asked additional follow-up questions. Follow-up questions were developeda priori, however they were chosen by the interviewer based on participant answers to main surveyitems. The interview questions can be read in the supplementary material. All interviews wererecorded. We obtained verbal permission from all participants prior to recording. The first authortranscribed the interview by hand in Microsoft Word and then imported it into Dedoose, qualitativedata analysis software [48]. Our protocol and all study procedures were approved by the ColoradoMultiple Institutional Review Board.
Analysis
The first and second authors analyzed the interview data using a qualitative coding approachdescribed by Saldana [49]. We used descriptive codes to summarize content line by line into concisethemes. The authors initially coded two transcripts individually with codes that best represented theinterview content, allowing the codes to emerge from the content. The authors then met to comparecodes and determine which codes best represented the content. Manuscripts were coded two at a timeuntil all coding was complete. During this initial coding phase, three overarching themes became
55
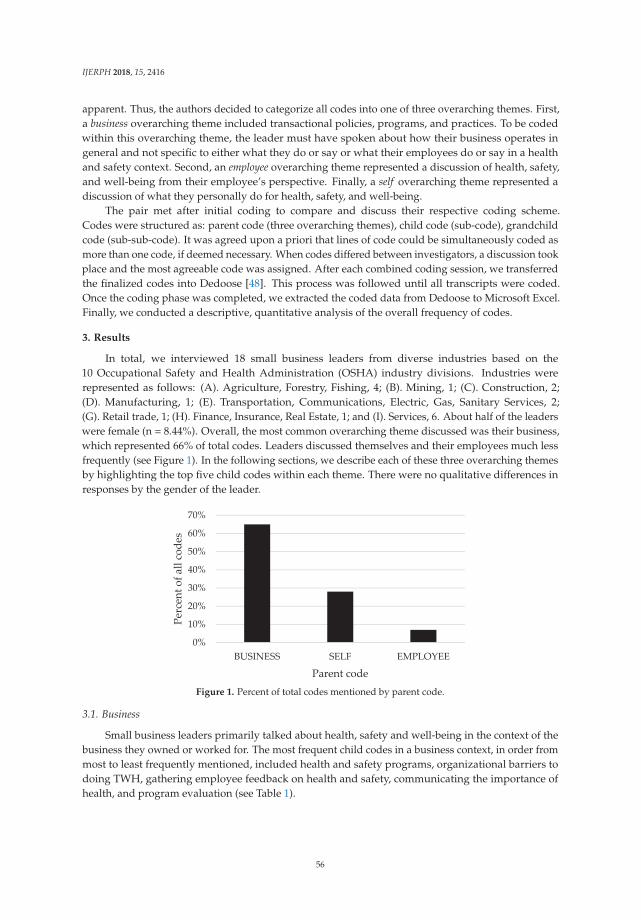
IJERPH 2018, 15, 2416
apparent. Thus, the authors decided to categorize all codes into one of three overarching themes. First,a business overarching theme included transactional policies, programs, and practices. To be codedwithin this overarching theme, the leader must have spoken about how their business operates ingeneral and not specific to either what they do or say or what their employees do or say in a healthand safety context. Second, an employee overarching theme represented a discussion of health, safety,and well-being from their employee’s perspective. Finally, a self overarching theme represented adiscussion of what they personally do for health, safety, and well-being.
The pair met after initial coding to compare and discuss their respective coding scheme.Codes were structured as: parent code (three overarching themes), child code (sub-code), grandchildcode (sub-sub-code). It was agreed upon a priori that lines of code could be simultaneously coded asmore than one code, if deemed necessary. When codes differed between investigators, a discussion tookplace and the most agreeable code was assigned. After each combined coding session, we transferredthe finalized codes into Dedoose [48]. This process was followed until all transcripts were coded.Once the coding phase was completed, we extracted the coded data from Dedoose to Microsoft Excel.Finally, we conducted a descriptive, quantitative analysis of the overall frequency of codes.
3. Results
In total, we interviewed 18 small business leaders from diverse industries based on the10 Occupational Safety and Health Administration (OSHA) industry divisions. Industries wererepresented as follows: (A). Agriculture, Forestry, Fishing, 4; (B). Mining, 1; (C). Construction, 2;(D). Manufacturing, 1; (E). Transportation, Communications, Electric, Gas, Sanitary Services, 2;(G). Retail trade, 1; (H). Finance, Insurance, Real Estate, 1; and (I). Services, 6. About half of the leaderswere female (n = 8.44%). Overall, the most common overarching theme discussed was their business,which represented 66% of total codes. Leaders discussed themselves and their employees much lessfrequently (see Figure 1). In the following sections, we describe each of these three overarching themesby highlighting the top five child codes within each theme. There were no qualitative differences inresponses by the gender of the leader.
0%
10%
20%
30%
40%
50%
60%
70%
BUSINESS SELF EMPLOYEE
Perc
ent o
f all
code
s
Parent codeFigure 1. Percent of total codes mentioned by parent code.
3.1. Business
Small business leaders primarily talked about health, safety and well-being in the context of thebusiness they owned or worked for. The most frequent child codes in a business context, in order frommost to least frequently mentioned, included health and safety programs, organizational barriers todoing TWH, gathering employee feedback on health and safety, communicating the importance ofhealth, and program evaluation (see Table 1).
56
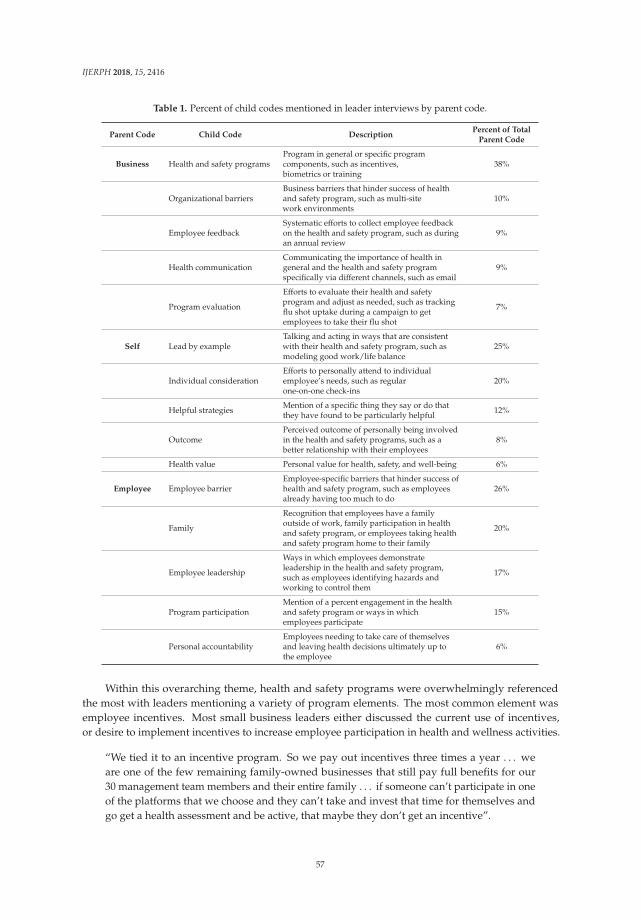
IJERPH 2018, 15, 2416
Table 1. Percent of child codes mentioned in leader interviews by parent code.
Parent Code Child Code DescriptionPercent of Total
Parent Code
Business Health and safety programsProgram in general or specific programcomponents, such as incentives,biometrics or training
38%
Organizational barriersBusiness barriers that hinder success of healthand safety program, such as multi-sitework environments
10%
Employee feedbackSystematic efforts to collect employee feedbackon the health and safety program, such as duringan annual review
9%
Health communicationCommunicating the importance of health ingeneral and the health and safety programspecifically via different channels, such as email
9%
Program evaluation
Efforts to evaluate their health and safetyprogram and adjust as needed, such as trackingflu shot uptake during a campaign to getemployees to take their flu shot
7%
Self Lead by exampleTalking and acting in ways that are consistentwith their health and safety program, such asmodeling good work/life balance
25%
Individual considerationEfforts to personally attend to individualemployee’s needs, such as regularone-on-one check-ins
20%
Helpful strategies Mention of a specific thing they say or do thatthey have found to be particularly helpful 12%
OutcomePerceived outcome of personally being involvedin the health and safety programs, such as abetter relationship with their employees
8%
Health value Personal value for health, safety, and well-being 6%
Employee Employee barrierEmployee-specific barriers that hinder success ofhealth and safety program, such as employeesalready having too much to do
26%
Family
Recognition that employees have a familyoutside of work, family participation in healthand safety program, or employees taking healthand safety program home to their family
20%
Employee leadership
Ways in which employees demonstrateleadership in the health and safety program,such as employees identifying hazards andworking to control them
17%
Program participationMention of a percent engagement in the healthand safety program or ways in whichemployees participate
15%
Personal accountabilityEmployees needing to take care of themselvesand leaving health decisions ultimately up tothe employee
6%
Within this overarching theme, health and safety programs were overwhelmingly referencedthe most with leaders mentioning a variety of program elements. The most common element wasemployee incentives. Most small business leaders either discussed the current use of incentives,or desire to implement incentives to increase employee participation in health and wellness activities.
“We tied it to an incentive program. So we pay out incentives three times a year . . . weare one of the few remaining family-owned businesses that still pay full benefits for our30 management team members and their entire family . . . if someone can’t participate in oneof the platforms that we choose and they can’t take and invest that time for themselves andgo get a health assessment and be active, that maybe they don’t get an incentive”.
57
IJERPH 2018, 15, 2416
“For participating in a lot of these activities, just by signing up to do yoga or signing up togive blood, we do random drawings for gift cards . . . After the event, we publicize howmany people participated and who got the gift card”.
Other common, but less frequently mentioned, grand-child codes under health and safetyprograms included safety and wellness meetings and/or committees as well as health insuranceofferings, such as benefits and biometric screenings. Compared to larger businesses, it is not ascommon for small businesses to offer health insurance benefits to employees, however, a few of theleaders in our study did mention offering these benefits to their white-collar workforce (see quoteabove under incentives).
“We also conduct monthly safety meetings in the field and all of the employees in the fieldattend. We do keep attendance at it and we’ve begun to integrate a variety of things. [Thereis an] enhanced level awareness and knowledge base at those meetings”.
“Through our benefits program . . . once a year or twice a year we have the third party comein and do the health assessments where they do the blood pressure, cholesterol levels andreadings and it’s interesting because you can see the history through the years . . . it’s justinteresting just to see how that changes throughout a period of time”.
“We started to, about a year and a half ago, provide some of our more management levelpositions and some of our full-time employees with health insurance”.
It is worth noting that leaders rarely discussed health, safety, and well-being practices from anintegrated perspective. Leaders mentioned a variety of program elements from paid time off to jobhazard analyses processes, but only one leader mentioned that they took steps to integrate these efforts.Another leader recognized the need for their business to integrate their efforts to protect and promoteemployee health. However, it was somewhat common for leaders to compare their safety and healthpromotion programs. About one-third of the leaders mentioned that one program was in better shapethan the other.
“We definitely separate health and safety. When we think about safety, we think aboutworkplace accidents only. We don’t connect the two, so I think one of the future things Iwould like to do is find an overlap of them”.
Within this overarching theme, leaders also discussed organizational barriers associated withdoing TWH. Leaders mentioned barriers such as an offsite workforce (e.g., easier to give officeemployees resources than field workers), difficulty obtaining employee engagement (e.g., challengeof designing programs that reach employees), and generational differences (e.g., millennials beingperceived as unreliable and not working as hard as older generations). However, if they are able tosuccessfully implement programs, some leaders (7% of all business child codes) mentioned someperceived beneficial business outcomes of adopting TWH, including better employee health andimproved employee engagement.
Leaders also discussed the ways in which their business communicates health information totheir employees and gathers employee feedback on health and safety programs. When discussinghealth communication, leaders frequently mentioned different modes of communication such as email,newsletters, and postings on wall boards. When discussing the ways in which their business goes aboutgathering feedback, leaders mentioned surveys, annual performance reviews, direct communicationbetween the safety/wellness committee and employees, near miss injury reporting programs, etc.Some leaders also discussed efforts to evaluate their programs and take action to improve theirprograms, for example, not only asking for employee feedback, but also taking steps to act uponthat feedback.
58
IJERPH 2018, 15, 2416
“Then we have a newsletter that goes out to all of our employees and again, there issomething in there about safety, something in there about your health and other things”.
“Information that we get through the near-miss program can also show us what employeesare looking for and what they’re needing and just kind of assessing that and prioritizing thatand seeing if there’s something that we can do about it”.
3.2. Self
About one-third of the time, leaders spoke about workplace health, safety, and well-being fromtheir own perspective. In order from most to least frequently mentioned, included leading by example,demonstrating individual consideration, helpful strategies for engaging employees, outcomes theyperceive by personally engaging in TWH-focused leadership practices, and value for health. Leadingby example was most commonly expressed as the leader participating in health and wellness initiativesor activities. Notably, “participate” was a grandchild code of “lead by example” and represented 15%of the “lead by example” codes. Individual consideration was denoted when a leader gave an exampleof how they paid special attention to individual employee to check-in or to help them. Some leadersspecifically mentioned having an open-door policy to provide a safe place for employees to talk aboutboth work and non-related work issues. Others also stressed the importance of connecting withemployees on an individual level.
“You can’t expect people to pull away from their desks and come participate in something ifit’s not important enough for you to do it yourself”.
“I hope that my actions positively affect the behaviors of my employees . . . if I come into theoffice in a bad mood, others are also in a bad mood. If I come into the office psyched andengaged, others are psyched and engaged. As a leader, I get that people mirror and modelmy behavior”.
“One thing that I tried to do over the years able to listen to my coworkers and just, you knowbe willing to hear them and how they’re doing and be able to help in any way that I can”.
“ . . . we have an open-door policy . . . if you’re struggling whether or not it’s work-related oroutside of work . . . you know we are here for you. We get life . . . we [upper management]tried to take our own personal experiences and reach out with regards to how we can involveour employees”.
“But there are tremendous opportunities when you do connect with someone . . . they knowyou understand what they’re doing and that you have their best interest in mind. You canmake a really meaningful change by simply helping someone do something the right way sothey don’t get hurt, or helping them achieve a professional development goal that they’vealways wanted to do, whether it’s a training, or a certification . . . ”
Of the few times leaders mentioned their health values, they spoke from a couple of perspectives.For example, some mentioned it terms of a personal value while others mentioned it in relation to theirwork team.
“And another thing I’d add is that I truly care about the well-being of the people that I workwith and that are my co-workers. From a human perspective, it just matters to me that theyfeel as good as they can”.
“I think it’s important from a personal perspective not only for ourselves, but also for ouremployees and that they conduct themselves in a safe manner so that they return to theirfamilies safely and be healthy and be able to provide for their families”.
59
IJERPH 2018, 15, 2416
On several occasions, leaders mentioned strategies they found to be helpful as they personallyworked to promote employee health, safety, and well-being.
“First and foremost, it’s building a trust level”.
“We have an advantage because we are small, and I think it’s critical in a small businessenvironment that you need to develop a structure that tunes it for each individual employee”.
When leaders spoke about perceived outcomes of their personal efforts to engage in TWH,they most commonly referred to better employee/leader relationship and employee engagement.
“I think that I have so many people that want to work with us and with me, and with mypartners just because they see us doing what we’re doing”.
3.3. Employee
In order from most to least frequently mentioned, leaders mentioned employees as a barrier toprogram effectiveness, employees who are treated like family, employees demonstrating leadershipin the program, employees participating in workplace health and safety programs, and individualaccountability. Leaders mentioned difficulty in getting employees engaged in the programs for severalreasons, such as adding more work to their busy schedules and cultural differences.
“The reality is that everyone is juggling things like having a family, getting their work done. . . having a hard time finding time to fit it exercise or gardening or all of the great stuff thatwe’d do if we only worked 30-h weeks”.
“It matters from an employee perspective obviously because we have got a small workforce. . . We wear a lot of different hats”.
“Our employee base is mostly Latino based and in most cases there is a difference of culturesbetween their originating country and here in the United States”.
Business leaders also expressed an understanding that employees have other non-workresponsibilities, like family. Some even promoted family inclusion to increase participation in healthand wellness initiatives.
“ . . . people can bring their families and their pets”.
Some leaders mentioned that their employees demonstrate leadership. For example, leadersmentioned instances in which employees identify hazards and help to control them, help build safetyand/or wellness programs, and senior employees who voluntarily coach newer employees until theybecome familiar with safe work processes.
“I think it’s important to involve employees in that decision-making process anddevelopment of programs”.
“So we take somebody who is extremely knowledgeable and skilled and they have to overseesomeone actually executing on a procedure before they sign off that they are competent todo that”.
Finally, as it pertains to health in general, some leaders mentioned that ultimately employeeshave to make the decision to be healthy.
“We just try to leave it up to the individual to make their own decisions about what they arecomfortable with”.
60
IJERPH 2018, 15, 2416
4. Discussion
We sought to understand TWH from the small business leader perspective. When we askedleaders about their leadership practices for health, safety, and well-being, leaders reflected upontheir business 65% of the time, on themselves 28% of the time, and their employees 7% of the time.These findings demonstrate that small business leaders primarily communicate about TWH throughthe lens of their business policies and programs. Within each of these three overarching themes, leadersmost commonly discussed elements of their TWH programs followed by the ways in which they leadby example within these programs and the employee barriers to TWH program effectiveness. Leadersrarely discussed the ways in which they integrate health, safety, and well-being.
Historically, leadership research focused on individual leader qualities and practices. The leadersin our study mentioned several times that they lead by example and considered the individualneeds of their workforce, both of which were previously linked to health and safety outcomes [39].However, other positive leadership characteristics such as empowering employees, coaching andteaching, motivating and inspiring, being authentic and ethical, and sharing or distributing leadershipwere rarely mentioned in the interviews [36,45,47,50,51]. Leaders mentioned business practices toencourage employee growth (i.e., training), solicit employee feedback, and communicate healthmessages. However, they did not specifically mention the ways in which they personally engaged inthese practices.
Present day leadership research expands the concept of leadership from the individual leaderto followers, the work environment, culture, etc. [52]. Our finding that small business leadersoverwhelmingly discuss health, safety and well-being in the context of their business when askedabout TWH leadership practices highlights the importance of considering leadership in a morecomprehensive context. Similar to other qualitative studies on management perceptions of safetyor health promotion programs [53,54], leaders mentioned a variety of policies and programs theyhave for their employees, as well as barriers to program effectiveness and outcomes of the programif successful. This perspective focuses on what Burke et al. [55] would call a transactional ratherthan transformational perspective. A transactional perspective focuses on management issues(e.g., TWH structures and systems), whereas a transformational perspective focuses on leadership,culture, and overall organizational mission and vision. Both are important aspects of a business’sTWH strategy [7]. Our findings point to an opportunity to study leadership practices in the contextof existing TWH systems, especially as it pertains to integration. It also demonstrates a need to helpsmall business leaders connect their own practices to their business’s TWH structures and systems inpractice [52].
In our study, leaders rarely talked about their employees’ perspective of health, safety,and well-being. When leaders did, they talked about employees in the context of barriers to programeffectiveness. Small businesses leaders who wish to increase employee engagement must be ableto understand and describe their employee’s perceptions of the TWH program. Safety climateresearch demonstrates the importance of employee perception, showing that employees often reportworse perceptions of organizational or management commitment to safety than managers [56,57].Huang et al. [56] argues that this difference can result in management failing to act to improve safetyconditions, and as a result that more weight should be placed on the employee than managementperspective when making program decisions. Furthermore, TWH researchers argue for a participatoryapproach to program development and management [58]. Thus, if small business leaders are primarilyfocused on TWH in a business context, as found in the present study, there are likely substantial gapsbetween TWH programs and employee needs and interests.
In practice, these finding suggests that small business leaders may be more receptive toTWH leadership practices if it is communicated through the lens of their business. To obtainleadership support for TWH, academics and practitioners should build an argument for why and howconsideration of their employees perspective as well as their own perspective on TWH contributes tobusiness operations and overall business success.
61
IJERPH 2018, 15, 2416
It is worth noting that there may be some alternative explanations for the code frequencies weobserved. As mentioned above, leaders rarely talked about specific leadership practices. However,this does not mean they do not display them in their daily work activities. It may mean that they donot naturally discuss them. We may have observed different results had we structured our questionsdifferently. For example, we did not preface the interview with an explanation of what leadership isnor did we explain what TWH is. The latter may have helped leaders better understand of the aimof the interview and resulted in more description of their leadership practices. The former may havecontributed to our finding that small business leaders primarily discussed health, safety, and well-beingseparately. Leaders may have interpreted the questions as asking for non-integrative responses.
4.1. Future Research
The present study adds to the literature on leadership support for TWH business practices [59] bybeing the first to begin to understand what leadership support means from small business leaders’own words. This follows previous calls by leadership researchers for more mixed methods leadershipresearch to better understand leadership in context [52]. Building upon the present study, futurequalitative research should consider focusing interview questions on TWH as an integrative conceptto better understand the ways leadership practices are used to simultaneously influence health, safety,and well-being. Additionally, concrete questions should be used to hone in on specific leadershippractices such as coaching or ethics. An important next step in this research will also be to studysmall business TWH leadership from the employee perspective to learn whether they observe theirleaders engaging in leadership practices. As described above, employee and management perceptionsoften differ.
Next, a quantitative needs assessment that employs a larger sample of small business leaders isneeded to quantify opportunities for TWH leadership development. This should investigate whichleadership styles, or combination of styles, elicit the best health, safety, and well-being outcomesincluding organizational-level indicators of TWH [60] as well as employee-level health, safety,and well-being outcomes. It will be important to assess TWH leadership from multiple perspectives,such as management, health and safety manager, human resources manager, and employee. Finally,future research on this topic should consider how contextual factors including business size, industry,business structure, geographic location, ownership, and other factors are associated with leadership.Other factors, including leaders’ age, gender, race, ethnicity, and identifying workforce information(e.g., diversity, industry sector, part-time, full-time) should be considered as well.
Another next step is to investigate TWH leadership development strategies. Leadershipdevelopment research for health promotion and safety has historically been siloed. Thus, an importantnext step will be to investigate the ways in which leadership development can be a means ofimproving TWH. We are currently investigating a TWH leadership development program describedin Schwatka et al. [7] by structuring the learning content based on the three themes learned in thisqualitative study: their business’s TWH policies and practices, their employee’s perspective of thesepolicies and practices, and their own perspective via key leadership practices curated from multipleleadership theories. Our aim is to help small business leaders place their business practices in thecontext of their employees TWH needs as well as their own leadership practices.
4.2. Limitations
The present study had a few limitations. First, small business leaders who agreed to be interviewedmay represent leaders who are more interested in TWH than all small business leaders. Results of thepresent study also reflect the small business leader perspectives of only 18 leaders from two states.Leaders from other states may approach health, safety and well-being differently. However, our samplewas diverse in terms of industry and gender, which may strengthen the generalizability of our findings.The study findings would be strengthened if we had also interviewed small business employees.Finally, due to the way the questions were worded, we cannot say for sure whether leaders’ responses
62
IJERPH 2018, 15, 2416
reflect the TWH integrated framework or whether they were reflecting upon what they do for health,safety, and well-being separately.
5. Conclusions
Leadership is a critical to TWH system effectiveness in small business. In this qualitative study weaimed to integrate both health promoting leadership and safety leadership to begin to understand smallbusiness leadership practices that protect and promote employee health. The interviews demonstratethat small business leaders care about the health of their employees, but because of the perceivedvalue to their business, not to employees or themselves. Thus, they may lack the knowledge and skillsto be successful TWH leaders. The present study supports a need for continued TWH leadershipresearch in a small business context, including mixed methods research to understand and quantifyTWH leadership practices from the small business leader and employee perspectives, as well as thedevelopment and evaluation of TWH leadership development strategies.
Author Contributions: Each author contributed to this paper. Conceptualization: J.T., N.V.S., L.T., and L.S.N.;Methodology: J.T. and N.V.S.; Software: J.T. and N.V.S.; Validation: J.T. and N.V.S.; Formal analysis: J.T. and N.V.S.;Investigation: J.T., N.V.S., L.T., and L.S.N.; Resources: N.V.S., L.T., and L.S.N.; data Curation: J.T.; Writing—originaldraft preparation: J.T. and N.V.S.; Writing—review and editing: J.T., N.V.S., L.T., L.S.N.; Visualization: J.T. andN.V.S.; Supervision: N.V.S.; Project administration: J.T.; Funding acquisition: L.S.N., L.T., and N.V.S.
Funding: This study was funded by a Total Worker Health Center of Excellence Cooperative Agreement 1 U19 OH011227-01, funded by the Centers for Disease Control and Prevention and the National Institute for OccupationalSafety and Health. Its contents are solely the responsibility of the authors and do not necessarily represent theofficial views of the National Institute for Occupational Safety and Health, Centers for Disease Control andPrevention, or the Department of Health and Human Services.
Conflicts of Interest: The authors declare no conflict of interest.
Appendix A. Small Business Leader Interview Questions
Appendix A.1. Organizational Mission and Vision
1. Why does health, safety, and well-being matter to you? For both your own health, safety,and well-being but also for your employees. How did you come to this understanding?
2. What does employee health, safety, and well-being look like today in your organization?3. Now that we’ve talked about what employee health, safety, and well-being looks like today,
how do you determine what the future of employee health, safety, and well-being looks like inyour organization?
Follow-up Questions
How do you communicate your vision for employee health, safety, and well-being?Do you spend time talking to your employees about health and safety in your organization?—Can
you give me an example of when you did this?
Appendix A.2. Organizational Culture
4. Every organization has its own unique culture of health and safety that develops over time basedon what’s said and what’s done. What does your organization do to set the culture for healthywork? How do you involve employees?
5. Do you find it challenging, or difficult to engage your employees around health, safety,and wellness?—How do you approach this?
Follow-up Question
How do you encourage your employees to provide feedback for health and wellness inyour organization?
63
IJERPH 2018, 15, 2416
When one of your employees provides feedback on health and wellness policies or programs,how do you react?
Have you ever incorporated employee suggestions into policies or standards? How did youdo this?
Can you give me an example of how you have inspired your employees or how your employeeshave inspired each other to be healthier and safer in the workplace?
Appendix A.3. Lead Yourself
6. How do you lead by example in your organization when it comes to health, safety, and well-being?7. How do you think your actions affect the behaviors of employees? Can you provide an example?
Follow-up Question
Do you ask for feedback on how you’re leading by example from your employees? If so, how doyou do it?
Employee Advancement
8. How do you go about identifying opportunities for supporting the values and goals ofyour employees?
9. Can you describe the opportunities and challenges you have experienced when initiating changesto improve employee health, safety and well-being?
Appendix A.4. Feedback and Recognition
10. What methods do you use to hold yourself and your employees accountable for sustaining goodhealth, safety and wellness practices?
11. What are some ways that you recognize your employees for prioritizing health, safety,and wellness? For example, do you use rewards, praise, celebrate?
Follow-up Questions
How do you provide feedback, whether it’s good or needs improvement, to your employeeswhen it comes to health, safety, and wellness in your organization?
How do you solicit and receive feedback from other leaders and employees about prioritizinghealth, safety, and well-being in your organization?
Have you ever encountered opposition to change around employee health, safety, and well-being?How did you deal with it?
References
1. NIOSH. What Is Total Worker Health? 2018. Available online: https://www.cdc.gov/niosh/twh/default.html (accessed on 15 October 2018).
2. McLellan, D.; Moore, W.; Nagler, E.; Sorensen, G. Implementing an Integrated Approach: Weaving EmployeeHealth, Safety, and Well-Being into the Fabric of Your Organization; Harvard, T.H., Ed.; Chan School of PublicHealth Center for Work, Health, and Well-Being: Boston, MA, USA, 2017.
3. Sorensen, G.; McLellan, D.; Dennerlein, J.T.; Pronk, N.P.; Allen, J.D.; Boden, L.I.; Okechukwu, C.A.;Hashimoto, D.; Stoddard, A.; Wagner, G.R. Integration of health protection and health promotion rationale,indicators, and metrics. J. Occup. Environ. Med. 2013, 55, S12–S18. [CrossRef] [PubMed]
4. Sorensen, G.; McLellan, D.; Sabbath, E.; Dennerlein, J.; Nagler, E.; Hurtado, D.; Pronk, N.; Wagner, G.Integrating worksite health protection and health promotion: A conceptual model for intervention andresearch. Prev. Med. 2016, 91, 188–196. [CrossRef] [PubMed]
5. Kelloway, E.K.; Barling, J. Leadership development as an intervention in occupational health psychology.Work Stress 2010, 24, 260–279. [CrossRef]
64
IJERPH 2018, 15, 2416
6. McCoy, K.; Stinson, K.; Scott, K.; Tenney, L.; Newman, L.S. Health promotion in small business: A systematicreview of factors influencing adoption and effectiveness of worksite wellness programs. J. Occup.Environ. Med. 2014, 56, 579–587. [CrossRef] [PubMed]
7. Schwatka, N.; Tenney, L.; Dally, M.; Scott, J.; Brown, C.; Weitzenkamp, D.; Shore, E.; Newman, L. Smallbusiness total worker health: A conceptual and methodological approach to facilitating organizationalchange. Occup. Health Sci. 2018, 2, 25–41. [CrossRef]
8. Cunningham, T.R.; Sinclair, R.; Schulte, P. Better understanding the small business construct to advanceresearch on delivering workplace health and safety. Small Enterp. Res. 2014, 21, 148–160. [CrossRef]
9. Dinh, J.E.; Lord, R.G.; Gardner, W.L.; Meuser, J.D.; Liden, R.C.; Hu, J. Leadership theory and research inthe new millennium: Current theoretical trends and changing perspectives. Leadersh. Q. 2014, 25, 36–62.[CrossRef]
10. Alvesson, M. The culture perspective on organizations: Instrumental values and basic features of culture.Scand. J. Manag. 1989, 5, 123–136. [CrossRef]
11. Kouzes, J.M.; Posner, B.Z. The Leadership Challenge: How to MAke Extraordinary Things Happen in Organizations,5th ed.; Wiley: San Francisco, CA, USA, 2012.
12. Hogan, R.; Kaiser, R.B. What we know about leadership. Rev. Gen. Psychol. 2005, 9, 169–180. [CrossRef]13. Allen, G.P.; Moore, W.M.; Moser, L.R.; Neill, K.K.; Sambamoorthi, U.; Bell, H.S. The role of servant leadership
and transformational leadership in academic pharmacy. Am. J. Pharm. Educ. 2016, 80, 113. [PubMed]14. Graen, G.B.; Uhl-Bien, M. Relationship-based approach to leadership: Development of leader-member
exchange (lmx) theory of leadership over 25 years: Applying a multi-level multi-domain perspective.Leadersh. Q. 1995, 6, 219–247. [CrossRef]
15. Sirota, D.; Mischkind, L.; Meltzer, M. The Enthusiastic Employee: How Companies Profit by Giving Workers WhatThey Want; Wharton School Publishing: Upper Saddle River, NJ, USA, 2005.
16. Arnold, K.A.; Turner, N.; Barling, J.; Kelloway, E.K.; McKee, M.C. Transformational leadership andpsychological well-being: The mediating role of meaningful work. J. Occup. Health Psychol. 2007, 12,193–203. [CrossRef] [PubMed]
17. Sosik, J.; Godshalk, V. Leadership styles, mentoring functions received, and job-related stress: A conceptualmodel and preliminary study. J. Organ. Behav. 2000, 21, 365–390. [CrossRef]
18. Munir, F.; Nielsen, K.; Carneiro, I.G. Transformational leadership and depressive symptoms: A prospectivestudy. J. Affect. Disord. 2010, 120, 235–239. [CrossRef] [PubMed]
19. Munir, F.; Nielsen, K. Does self-efficacy mediate the relationship between transformational leadershipbehaviours and healthcare workers’ sleep quality? A longitudinal study. J. Adv. Nurs. 2009, 65, 1833–1843.[CrossRef] [PubMed]
20. Clarke, S. Safety leadership: A meta-analytic review of transformational and transactional leadership stylesas antecedents of safety behaviours. J. Occup. Organ. Psychol. 2013, 86, 22–49. [CrossRef]
21. Nahrgang, J.D.; Morgeson, F.P.; Hofmann, D.A. Safety at work: A meta-analytic investigation of the linkbetween job demands, job resources, burnout, engagement, and safety outcomes. J. Appl. Psychol. 2011, 96,71–94. [CrossRef] [PubMed]
22. Christian, M.S.; Bradley, J.C.; Wallace, J.C.; Burke, M.J. Workplace safety: A meta-analysis of the roles ofperson and situation factors. J. Appl. Psychol. 2009, 94, 1103–1127. [CrossRef] [PubMed]
23. Nyberg, A.; Alfredsson, L.; Theorell, T.; Westerlund, H.; Vahtera, J.; Kivimaki, M. Managerial leadership andischaemic heart disease among employees: The swedish wolf study. Occup. Environ. Med. 2009, 66, 51–55.[CrossRef] [PubMed]
24. Karlin, W.; Brondolo, E.; Schwartz, J. Workplace social support and ambulatory cardiovascular activity innew york city traffic agents. Psychosom. Med. 2003, 65, 67–176. [CrossRef]
25. Bamberger, P.A.; Bacharach, S.B. Abusive supervision and subordinate problem drinking: Taking resistance,stress, and subordinate personality into account. Hum. Relat. 2006, 59, 723–752. [CrossRef]
26. Erikson, W. Work factors as predictors of smoking relapse in nurses’ aides. Int. Arch. Occup. Environ. Health2005, 79, 244–250. [CrossRef] [PubMed]
27. Skakon, J.; Nielsen, K.; Borg, V.; Guzman, J. Are leaders' well-being, behaviours and style associated with theaffective well-being of their employees? A systematic review of three decades of research. Work Stress 2010,24, 107–139. [CrossRef]
65
IJERPH 2018, 15, 2416
28. Colquitt, J.A.; Conlon, D.E.; Wesson, M.J.; Porter, C.O.L.H.; Ng, K.Y. Justice at the milleninium: Ameta-analytic review of 25 years of organizational justice research. J. Appl. Psychol. 2001, 86, 425–445.[CrossRef] [PubMed]
29. Nielsen, K.; Randall, R.; Yarker, J.; Brenner, S.-O. The effects of transformational leadership on followers’perceived work characteristics and psychological well-being: A longitudinal study. Work Stress 2008, 22,16–32. [CrossRef]
30. Eriksson, A.; Axelsson, R.; Bihari Axelsson, S. Health promoting leadership—Different views of the concept.Work J. Prev. Assess. Rehabil. 2011, 40, 75–86.
31. Skarholt, K.; Bli, E.; Sandsund, M.; Andersen, T. Health promoting leadership practices in four norweiganindustries. Health Promot. Int. 2016, 31, 936–945. [PubMed]
32. Jiménez, P.; Winkler, B.; Dunkl, A. Creating a healthy working environment with leadership: The concept ofhealth-promoting leadership. Int. J. Hum. Resour. Manag. 2016, 28, 2430–2448. [CrossRef]
33. Winkler, E.; Busch, C.; Clasen, J.; Vowinkel, J. Leaderhsip behavior as a health-promoting resorucesfor workers in low-skillsed jobs and the moderating role of power distance orientation. Ger. J. Hum.Resour. Manag. 2014, 28, 96–116. [CrossRef]
34. Dunkl, A.; Jimenez, P.; Sarotar Zizek, S.; Milfeiner, B.; Kallus, W.K. Similarities and differences ofhealth-promoting leadership and transformational leadership. Our Econ. 2015, 61, 3–13. [CrossRef]
35. Hofmann, D.A.; Morgeson, F.P. The Role of Leadership in Safety; Barling, J., Frone, M., Eds.; AmericanPsychological Association: Washington, DC, USA, 2004; pp. 159–180.
36. Bass, B. Leadership and Performance Beyond Expectations; Free Press: New York, NY, USA, 1985.37. Barling, J.; Loughlin, C.; Kelloway, E.K. Development and test of a model linking safety-specific
transformational leadership and occupational safety. J. Appl. Psychol. 2002, 87, 488–496. [CrossRef] [PubMed]38. Kelloway, E.; Mullen, J.; Francis, L. Divergent effects of transformational and passive leadership on employee
safety. J. Occup. Health Psychol. 2006, 11, 76–86. [CrossRef] [PubMed]39. Hoffmeister, K.; Gibbons, A.M.; Johnson, S.K.; Cigularov, K.P.; Chen, P.Y.; Rosecrance, J.C. The differential
effects of transformational leadership facets on employee safety. Saf. Sci. 2014, 62, 68–78. [CrossRef]40. Mullen, J.; Kelloway, E. Safety leadership: A longitudinal study of the effects of transformational leadership
on safety outcomes. J. Occup. Organ. Psychol. 2009, 82, 253–272. [CrossRef]41. von Thiele Schwarz, U.; Augustsson, H.; Hasson, H.; Stenfors-Hayes, T. Promoting employee health by
integrating health protection, health promotion, and continuous improvement. J. Occup. Environ. Med. 2015,57, 217–225. [CrossRef] [PubMed]
42. Hofmann, D.; Morgeson, F.; Gerras, S. Climate as a moderator of the relationship between leader-memberexchange and content specific citizenship: Safety climate as an exemplar. J. Appl. Psychol. 2003, 88, 170–178.[CrossRef] [PubMed]
43. Martínez-Córcoles, M.; Schöbel, M.; Gracia, F.J.; Tomás, I.; Peiró, J.M. Linking empowering leadership tosafety participation in nuclear power plants: A structural equation model. J. Saf. Res. 2012, 43, 215–221.[CrossRef] [PubMed]
44. McLellan, D.L.; Williams, J.A.; Katz, J.N.; Pronk, N.P.; Wagner, G.R.; Caban-Martinez, A.J.; Nelson, C.C.;Sorensen, G. Key organizational characteristics for integrated approaches to protect and promote workerhealth in smaller enterprises. J. Occup. Environ. Med 2017, 59, 289–294. [CrossRef] [PubMed]
45. Avolio, B.J.; Gardner, W.L. Authentic leadership development: Getting to the root of positive forms ofleadership. Leadersh. Q. 2005, 16, 315–338. [CrossRef]
46. Uhl-Bien, M. Relational leadership theory: Exploring the social processes of leadership and organizing.Leadersh. Q. 2006, 17, 654–676. [CrossRef]
47. van Dierendonck, D. Servant leadership: A review and synthesis. J. Manag. 2011, 37, 1228–1261. [CrossRef]48. Dedoose; Version 7.0.23; Web Application for Managing, Analyzing, and Presenting Qualitative and Mixed
Method Research Data; SocioCultural Research Consultants, LLC: Los Angeles, CA, USA, 2016.49. Saldana, J. The coding Manual for Qualitative Researchers, 2nd ed.; Sage Publications Ltd.: Thousand Oaks, CA,
USA, 2012.50. Bolden, R. Distributed leadership in organizations: A review of theory and research. Int. J. Manag. Rev. 2011,
13, 251–269. [CrossRef]51. Brown, M.E.; Treviño, L.K. Ethical leadership: A review and future directions. Leadersh. Q. 2006, 17, 595–616.
[CrossRef]
66
IJERPH 2018, 15, 2416
52. Avolio, B.J.; Walumbwa, F.O.; Weber, T.J. Leadership: Current theories, research, and future directions.Annu. Rev. Psychol. 2009, 60, 421–449. [CrossRef] [PubMed]
53. Huang, Y.H.; Leamon, T.B.; Courtney, T.K.; Chen, P.Y.; DeArmond, S. Corporate financial decision-makers:Perceptions of workplace safety. Accid. Anal. Prev. 2007, 39, 767–775. [CrossRef] [PubMed]
54. Pescud, M.; Teal, R.; Shilton, T.; Slevin, T.; Ledger, M.; Waterworth, P.; Rosenberg, M. Employers’ views onthe promotion of workplace health and wellbeing: A qualitative study. BMC Public Health 2015, 15, 642.[CrossRef] [PubMed]
55. Burke, W.; Litwin, G. A causal model of organizational performance. J. Manag. 1992, 18, 532–545.56. Huang, Y.-H.; Robertson, M.M.; Lee, J.; Rineer, J.; Murphy, L.A.; Garabet, A.; Dainoff, M.J. Supervisory
interpretation of safety climate versus employee safety climate perception: Association with safety behaviorand outcomes for lone workers. Transp. Res. Part F Traffic Psychol. Behav. 2014, 26, 348–360. [CrossRef]
57. Gittleman, J.L.; Gardner, P.C.; Haile, E.; Sampson, J.M.; Cigularov, K.P.; Ermann, E.D.; Stafford, P.; Chen, P.Y.Citycenter and cosmopolitan construction projects, las vegas, nevada: Lessons learned from the use ofmultiple sources and mixed methods in a safety needs assessment. J. Saf. Res. 2010, 41, 263–281. [CrossRef][PubMed]
58. Punnett, L.; Warren, N.; Henning, R.; Nobrega, S.; Cherniack, M.; CPH-NEW Research Team. Participatoryergonomics as a model for integrated programs to prevent chronic disease. J. Occup. Environ. Med. 2013, 55,S19–S24. [CrossRef] [PubMed]
59. McLellan, D.L.; Caban-Martinez, A.J.; Nelson, C.C.; Pronk, N.P.; Katz, J.N.; Allen, J.D.; Davis, K.L.;Wagner, G.R.; Sorensen, G. Organizational characteristics influence implementation of worksite healthprotection and promotion programs. J. Occup. Environ. Med. 2015, 57, 1009–1016. [CrossRef] [PubMed]
60. Williams, J.A.R.; Nelson, C.C.; Caban-Martinez, A.J.; Katz, J.N.; Wagner, G.R.; Pronk, N.P.; Sorensen, G.;McLellan, D.L. Validation of a new metric for assessing the integration of health protection and healthpromotion in a sample of small- and medium-sized employer groups. J. Occup. Environ. Med. 2015, 57,1017–1021. [CrossRef] [PubMed]
© 2018 by the authors. Licensee MDPI, Basel, Switzerland. This article is an open accessarticle distributed under the terms and conditions of the Creative Commons Attribution(CC BY) license (http://creativecommons.org/licenses/by/4.0/).
67
International Journal of
Environmental Research
and Public Health
Article
Assessing Workplace Health and Safety Strategies,Trends, and Barriers through a StatewideWorksite Survey
Ami Sedani 1, Derry Stover 2,* , Brian Coyle 2 and Rajvi J. Wani 2
1 Department of Biostatistics and Epidemiology, Hudson College of Public Health, University of OklahomaHealth Sciences Center, Oklahoma City, OK 73104, USA
2 Division of Public Health, Nebraska Department of Health and Human Services, Lincoln, NE 68509, USA* Correspondence: [email protected]
Received: 8 April 2019; Accepted: 9 July 2019; Published: 11 July 2019
Abstract: Chronic diseases have added to the economic burden of the U.S. healthcare system.Most Americans spend most of their waking time at work, thereby, presenting employers with anopportunity to protect and promote health. The purpose of this study was to assess the implementationof workplace health governance and safety strategies among worksites in the State of Nebraska,over time and by industry sector using a randomized survey. Weighted percentages were comparedby year, industry sector, and worksite size. Over the three study periods, 4784 responses werecollected from worksite representatives. Adoption of workplace health governance and planningstrategies increased over time and significantly varied across industry sector groups. Organizationalsafety policies varied by industry sector and were more commonly reported than workplace healthgovernance and planning strategies. Time constraints were the most common barrier among worksitesof all sizes, and stress was reported as the leading employee health issue that negatively impactsbusiness. Results suggest that opportunities exist to integrate workplace health and safety initiatives,especially in blue-collar industry sectors and small businesses.
Keywords: workplace health; wellness; governance; planning; barriers; survey; industry; ACA
1. Introduction
Chronic diseases remain the leading cause of death and disability in the United States, as wellas the leading contributor to the nation’s healthcare cost [1–3]. More than 150 million Americansare workers with most spending more than half of their waking time at work [4]. Maintaining ahealthier workforce can lower direct costs to the business (e.g., insurance premiums and workers’compensation claims) as well as indirect costs (e.g., absenteeism, return on investment, and workerproductivity) [5–9]. With changes in the workforce population, chronic health conditions have becomea growing concern for employees and businesses [10]. Worksite health and wellness programs offer animportant population health strategy to address the increase in chronic diseases [11–13].
While adoption of workplace health programs have increased in the U.S. in recent years, thereis still variation in uptake by business size and industries [14–16]. Many workplaces also lacka comprehensive, integrated approach that addresses multiple risk factors and health conditions.Successful worksite health programs are tailored to their employee population, thus making it difficultto evaluate initiatives across multiple businesses. However, all successful programs should be built ona solid foundation. According to the Centers for Disease Control and Prevention (CDC) WorkplaceHealth Model, this foundation requires a basic organizational governance infrastructure to administerand manage health promotion activities [17].
IJERPH 2019, 16, 2475; doi:10.3390/ijerph16142475 www.mdpi.com/journal/ijerph68
IJERPH 2019, 16, 2475
Organizational factors are important for other aspects of worker health, including worker safetyand occupational injury and illness prevention [18]. Employers have many opportunities for promotingsafety and occupational injury and illness prevention at the organizational level [19]. One example isthe Total Worker Health® (TWH) framework, which involves organizational-level strategies aimedat integration of worksite injury prevention and health promotion activities [20]. TWH is defined aspolicies, programs, and practice that integrate protection from work-related safety and health hazardswith promotion of injury and illness prevention efforts to advance worker well-being [21].
While many organizational approaches exist to improve worker health and safety throughworkplace initiatives, there is a need to better understand the adoption of these initiatives amongemployers. Findings have the potential to yield useful information when developing public healthpolicies and prevention activities for improving worker health, safety, and well-being. The primaryaim of this study is to assess the implementation of workplace health governance and safety strategiesamong worksites in the largely rural State of Nebraska, over time and by industry sector. Secondaryaims include describing employer perception of barriers related to implementing workplace healthstrategies and employee health issues that negatively impact business. Responses on the NebraskaWorksite Wellness Surveys from 2010, 2013, and 2016 were utilized for the study.
2. Materials and Methods
Three point-in-time surveys were conducted among worksites in Nebraska to test our centralhypothesis that the prevalence of reported health promotion and safety strategies did not vary acrossyears or industry sectors. The sample frames for all survey years (2010, 2013, and 2016) were generatedfrom an employer database of establishments provided by the Nebraska Department of Labor. Thesample frame data included worksite name, number of employees per worksite, worksite address, andindustry code. Establishments were coded and grouped using the 2-digit industry sector according tothe North American Industry Classification System (NAICS) ((Health Care and Social Assistance (62);Wholesale and Retail Trade (42, 44–45); Information, Finance, and Management services (51–55); OtherServices (56, 71, 72, 81); Education Services (61); Construction (23); Manufacturing (31–33); PublicAdministration (92); Transportation and Warehousing (48–49); All Other Sectors (11, 21, 22)).
Worksites in the sample frame were defined as establishments with a Nebraska worksite addressand 10 or more employees. In order to ensure worksites of all sizes were represented in the survey data,each sample was stratified by business size: Small (10 to 49 employees), medium (50 to 199 employees),and large (200 or more employees). Disproportionate stratification was used to allow for oversampling.All large businesses in the State were included in samples (N = 503 in 2010; N = 523 in 2013; and N =525 in 2016). For small and medium-sized businesses, random samples were included (N = 1500 in2010 and 2013, and N = 2010 in 2016 for both sizes). In 2016, two priority industry sectors with lowresponses in the 2013 survey, ‘Construction’ and ‘Transportation and Warehousing’, were oversampled.The sampling design allowed some businesses being surveyed across all three study periods, but noneof the businesses were repeated within the same time period.
The survey questions were developed by the Division of Public Health, Nebraska Department ofHealth and Human Services (NDHHS) in consultation with the Bureau of Sociological Research (BOSR),University of Nebraska—Lincoln. Questions were adapted from a variety of sources, and a small pilotof the survey instrument was conducted with businesses randomly selected from the sample. Becausethese were point-in-time surveys, worksites were asked to report current workplace practices (i.e., ifthey have a specific health promotion policy or program in place) and perceived barriers in each surveyyear. The majority of questions remained unchanged across survey years to ensure comparability overtime. Survey questions pertaining to this study are in Supplementary Materials (Table S1).
The 2010, 2013, and 2016 surveys were mailed to worksites, which included a cover letter, thesurvey, and a postage-paid envelope. The small and medium size surveys were addressed to thebusiness owner or manager, while the surveys for large businesses were addressed to the human
69
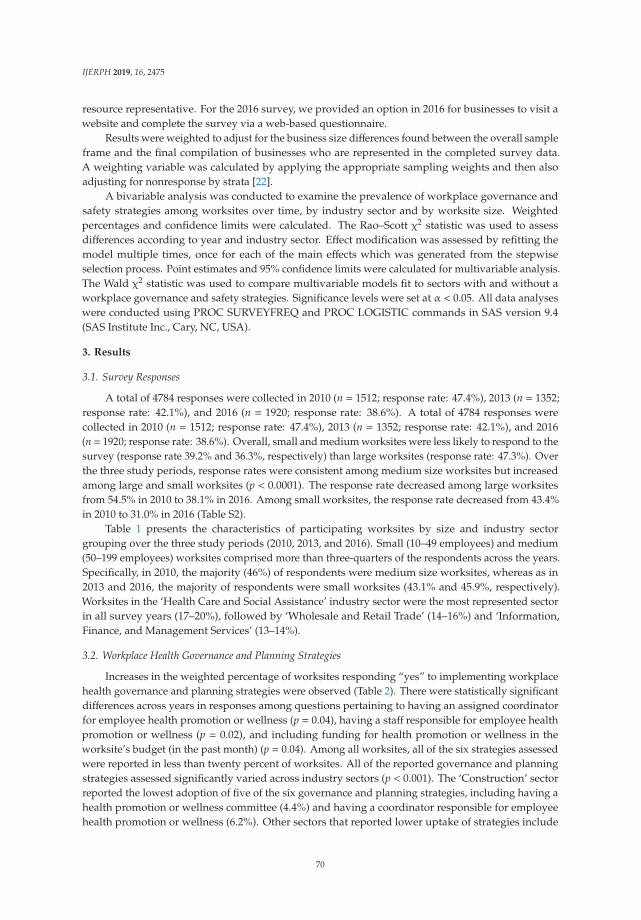
IJERPH 2019, 16, 2475
resource representative. For the 2016 survey, we provided an option in 2016 for businesses to visit awebsite and complete the survey via a web-based questionnaire.
Results were weighted to adjust for the business size differences found between the overall sampleframe and the final compilation of businesses who are represented in the completed survey data.A weighting variable was calculated by applying the appropriate sampling weights and then alsoadjusting for nonresponse by strata [22].
A bivariable analysis was conducted to examine the prevalence of workplace governance andsafety strategies among worksites over time, by industry sector and by worksite size. Weightedpercentages and confidence limits were calculated. The Rao–Scott χ2 statistic was used to assessdifferences according to year and industry sector. Effect modification was assessed by refitting themodel multiple times, once for each of the main effects which was generated from the stepwiseselection process. Point estimates and 95% confidence limits were calculated for multivariable analysis.The Wald χ2 statistic was used to compare multivariable models fit to sectors with and without aworkplace governance and safety strategies. Significance levels were set at α < 0.05. All data analyseswere conducted using PROC SURVEYFREQ and PROC LOGISTIC commands in SAS version 9.4(SAS Institute Inc., Cary, NC, USA).
3. Results
3.1. Survey Responses
A total of 4784 responses were collected in 2010 (n = 1512; response rate: 47.4%), 2013 (n = 1352;response rate: 42.1%), and 2016 (n = 1920; response rate: 38.6%). A total of 4784 responses werecollected in 2010 (n = 1512; response rate: 47.4%), 2013 (n = 1352; response rate: 42.1%), and 2016(n = 1920; response rate: 38.6%). Overall, small and medium worksites were less likely to respond to thesurvey (response rate 39.2% and 36.3%, respectively) than large worksites (response rate: 47.3%). Overthe three study periods, response rates were consistent among medium size worksites but increasedamong large and small worksites (p < 0.0001). The response rate decreased among large worksitesfrom 54.5% in 2010 to 38.1% in 2016. Among small worksites, the response rate decreased from 43.4%in 2010 to 31.0% in 2016 (Table S2).
Table 1 presents the characteristics of participating worksites by size and industry sectorgrouping over the three study periods (2010, 2013, and 2016). Small (10–49 employees) and medium(50–199 employees) worksites comprised more than three-quarters of the respondents across the years.Specifically, in 2010, the majority (46%) of respondents were medium size worksites, whereas as in2013 and 2016, the majority of respondents were small worksites (43.1% and 45.9%, respectively).Worksites in the ‘Health Care and Social Assistance’ industry sector were the most represented sectorin all survey years (17–20%), followed by ‘Wholesale and Retail Trade’ (14–16%) and ‘Information,Finance, and Management Services’ (13–14%).
3.2. Workplace Health Governance and Planning Strategies
Increases in the weighted percentage of worksites responding “yes” to implementing workplacehealth governance and planning strategies were observed (Table 2). There were statistically significantdifferences across years in responses among questions pertaining to having an assigned coordinatorfor employee health promotion or wellness (p = 0.04), having a staff responsible for employee healthpromotion or wellness (p = 0.02), and including funding for health promotion or wellness in theworksite’s budget (in the past month) (p = 0.04). Among all worksites, all of the six strategies assessedwere reported in less than twenty percent of worksites. All of the reported governance and planningstrategies assessed significantly varied across industry sectors (p < 0.001). The ‘Construction’ sectorreported the lowest adoption of five of the six governance and planning strategies, including having ahealth promotion or wellness committee (4.4%) and having a coordinator responsible for employeehealth promotion or wellness (6.2%). Other sectors that reported lower uptake of strategies include
70
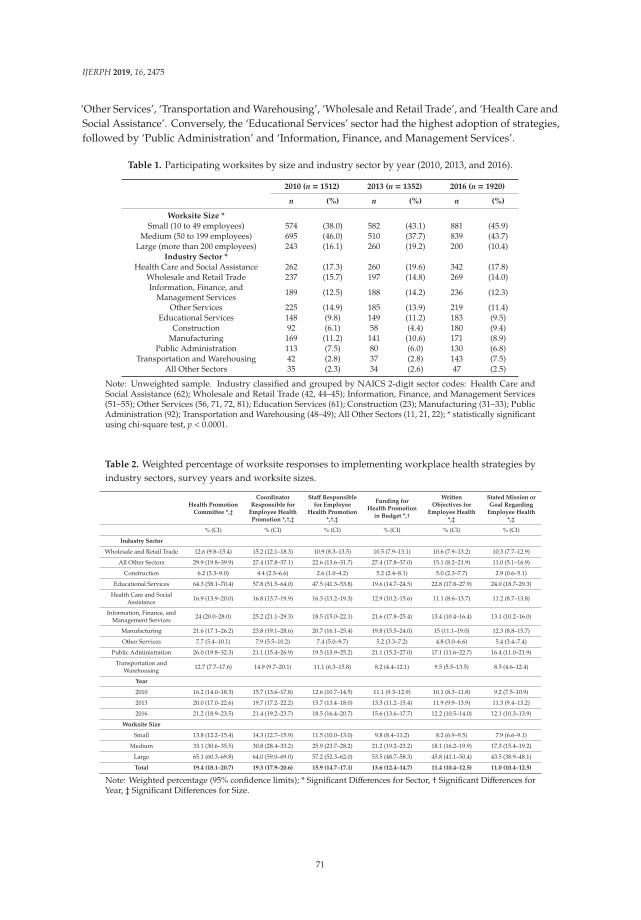
IJERPH 2019, 16, 2475
‘Other Services’, ‘Transportation and Warehousing’, ‘Wholesale and Retail Trade’, and ‘Health Care andSocial Assistance’. Conversely, the ‘Educational Services’ sector had the highest adoption of strategies,followed by ‘Public Administration’ and ‘Information, Finance, and Management Services’.
Table 1. Participating worksites by size and industry sector by year (2010, 2013, and 2016).
2010 (n = 1512) 2013 (n = 1352) 2016 (n = 1920)
n (%) n (%) n (%)
Worksite Size *
Small (10 to 49 employees) 574 (38.0) 582 (43.1) 881 (45.9)Medium (50 to 199 employees) 695 (46.0) 510 (37.7) 839 (43.7)
Large (more than 200 employees) 243 (16.1) 260 (19.2) 200 (10.4)Industry Sector *
Health Care and Social Assistance 262 (17.3) 260 (19.6) 342 (17.8)Wholesale and Retail Trade 237 (15.7) 197 (14.8) 269 (14.0)Information, Finance, and
Management Services 189 (12.5) 188 (14.2) 236 (12.3)
Other Services 225 (14.9) 185 (13.9) 219 (11.4)Educational Services 148 (9.8) 149 (11.2) 183 (9.5)
Construction 92 (6.1) 58 (4.4) 180 (9.4)Manufacturing 169 (11.2) 141 (10.6) 171 (8.9)
Public Administration 113 (7.5) 80 (6.0) 130 (6.8)Transportation and Warehousing 42 (2.8) 37 (2.8) 143 (7.5)
All Other Sectors 35 (2.3) 34 (2.6) 47 (2.5)
Note: Unweighted sample. Industry classified and grouped by NAICS 2-digit sector codes: Health Care andSocial Assistance (62); Wholesale and Retail Trade (42, 44–45); Information, Finance, and Management Services(51–55); Other Services (56, 71, 72, 81); Education Services (61); Construction (23); Manufacturing (31–33); PublicAdministration (92); Transportation and Warehousing (48–49); All Other Sectors (11, 21, 22); * statistically significantusing chi-square test, p < 0.0001.
Table 2. Weighted percentage of worksite responses to implementing workplace health strategies byindustry sectors, survey years and worksite sizes.
Health PromotionCommittee *,‡
CoordinatorResponsible for
Employee HealthPromotion *,†,‡
Staff Responsiblefor Employee
Health Promotion*,†,‡
Funding forHealth Promotion
in Budget *,†
WrittenObjectives for
Employee Health*,‡
Stated Mission orGoal Regarding
Employee Health*,‡
% (CI) % (CI) % (CI) % (CI) % (CI) % (CI)
Industry Sector
Wholesale and Retail Trade 12.6 (9.8–15.4) 15.2 (12.1–18.3) 10.9 (8.3–13.5) 10.5 (7.9–13.1) 10.6 (7.9–13.2) 10.3 (7.7–12.9)
All Other Sectors 29.9 (19.8–39.9) 27.4 (17.8–37.1) 22.6 (13.6–31.7) 27.4 (17.8–37.0) 15.1 (8.2–21.9) 11.0 (5.1–16.9)
Construction 6.2 (3.3–9.0) 4.4 (2.3–6.6) 2.6 (1.0–4.2) 5.2 (2.4–8.1) 5.0 (2.3–7.7) 2.9 (0.6–5.1)
Educational Services 64.3 (58.1–70.4) 57.8 (51.5–64.0) 47.5 (41.3–53.8) 19.6 (14.7–24.5) 22.8 (17.8–27.9) 24.0 (18.7–29.3)
Health Care and SocialAssistance 16.9 (13.9–20.0) 16.8 (13.7–19.9) 16.3 (13.2–19.3) 12.9 (10.2–15.6) 11.1 (8.6–13.7) 11.2 (8.7–13.8)
Information, Finance, andManagement Services 24 (20.0–28.0) 25.2 (21.1–29.3) 18.5 (15.0–22.1) 21.6 (17.8–25.4) 13.4 (10.4–16.4) 13.1 (10.2–16.0)
Manufacturing 21.6 (17.1–26.2) 23.8 (19.1–28.6) 20.7 (16.1–25.4) 19.8 (15.5–24.0) 15 (11.1–19.0) 12.3 (8.8–15.7)
Other Services 7.7 (5.4–10.1) 7.9 (5.5–10.2) 7.4 (5.0–9.7) 5.2 (3.3–7.2) 4.8 (3.0–6.6) 5.4 (3.4–7.4)
Public Administration 26.0 (19.8–32.3) 21.1 (15.4–26.9) 19.5 (13.9–25.2) 21.1 (15.2–27.0) 17.1 (11.6–22.7) 16.4 (11.0–21.9)
Transportation andWarehousing 12.7 (7.7–17.6) 14.9 (9.7–20.1) 11.1 (6.3–15.8) 8.2 (4.4–12.1) 9.5 (5.5–13.5) 8.5 (4.6–12.4)
Year
2010 16.2 (14.0–18.3) 15.7 (13.6–17.8) 12.6 (10.7–14.5) 11.1 (9.3–12.9) 10.1 (8.3–11.8) 9.2 (7.5–10.9)
2013 20.0 (17.0–22.6) 19.7 (17.2–22.2) 15.7 (13.4–18.0) 13.3 (11.2–15.4) 11.9 (9.9–13.9) 11.3 (9.4–13.2)
2016 21.2 (18.9–23.5) 21.4 (19.2–23.7) 18.5 (16.4–20.7) 15.6 (13.6–17.7) 12.2 (10.5–14.0) 12.1 (10.3–13.9)
Worksite Size
Small 13.8 (12.2–15.4) 14.3 (12.7–15.9) 11.5 (10.0–13.0) 9.8 (8.4–11.2) 8.2 (6.9–9.5) 7.9 (6.6–9.1)
Medium 33.1 (30.6–35.5) 30.8 (28.4–33.2) 25.9 (23.7–28.2) 21.2 (19.2–23.2) 18.1 (16.2–19.9) 17.3 (15.4–19.2)
Large 65.1 (60.3–69.8) 64.0 (59.0–69.0) 57.2 (52.3–62.0) 53.5 (48.7–58.3) 45.8 (41.1–50.4) 43.5 (38.9–48.1)
Total 19.4 (18.1–20.7) 19.3 (17.9–20.6) 15.9 (14.7–17.1) 13.6 (12.4–14.7) 11.4 (10.4–12.5) 11.0 (10.4–12.5)
Note: Weighted percentage (95% confidence limits); * Significant Differences for Sector, † Significant Differences forYear, ‡ Significant Differences for Size.
71
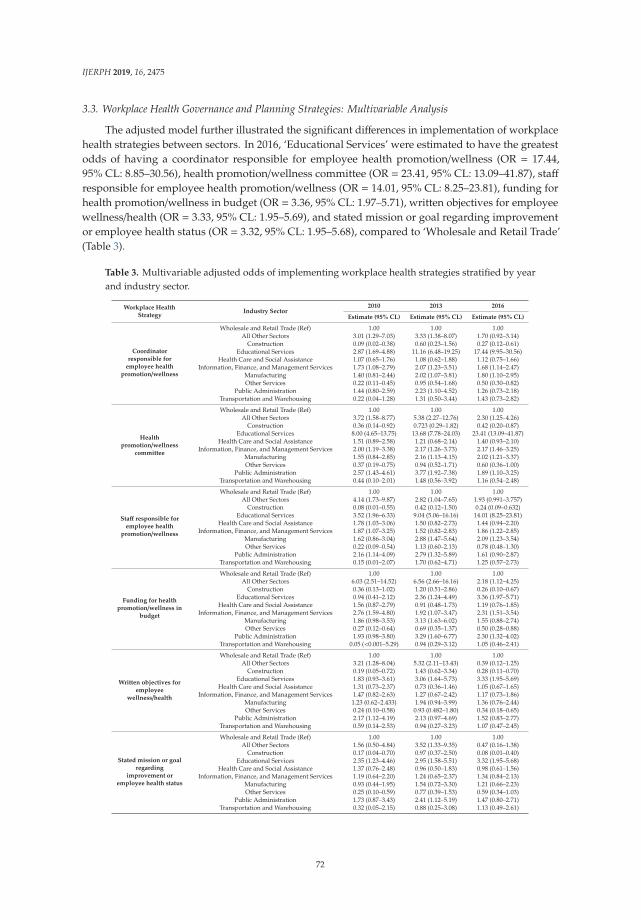
IJERPH 2019, 16, 2475
3.3. Workplace Health Governance and Planning Strategies: Multivariable Analysis
The adjusted model further illustrated the significant differences in implementation of workplacehealth strategies between sectors. In 2016, ‘Educational Services’ were estimated to have the greatestodds of having a coordinator responsible for employee health promotion/wellness (OR = 17.44,95% CL: 8.85–30.56), health promotion/wellness committee (OR = 23.41, 95% CL: 13.09–41.87), staffresponsible for employee health promotion/wellness (OR = 14.01, 95% CL: 8.25–23.81), funding forhealth promotion/wellness in budget (OR = 3.36, 95% CL: 1.97–5.71), written objectives for employeewellness/health (OR = 3.33, 95% CL: 1.95–5.69), and stated mission or goal regarding improvementor employee health status (OR = 3.32, 95% CL: 1.95–5.68), compared to ‘Wholesale and Retail Trade’(Table 3).
Table 3. Multivariable adjusted odds of implementing workplace health strategies stratified by yearand industry sector.
Workplace HealthStrategy
Industry Sector2010 2013 2016
Estimate (95% CL) Estimate (95% CL) Estimate (95% CL)
Coordinatorresponsible for
employee healthpromotion/wellness
Wholesale and Retail Trade (Ref) 1.00 1.00 1.00All Other Sectors 3.01 (1.29–7.03) 3.33 (1.38–8.07) 1.70 (0.92–3.14)
Construction 0.09 (0.02–0.38) 0.60 (0.23–1.56) 0.27 (0.12–0.61)Educational Services 2.87 (1.69–4.88) 11.16 (6.48–19.25) 17.44 (9.95–30.56)
Health Care and Social Assistance 1.07 (0.65–1.76) 1.08 (0.62–1.88) 1.12 (0.75–1.66)Information, Finance, and Management Services 1.73 (1.08–2.79) 2.07 (1.23–3.51) 1.68 (1.14–2.47)
Manufacturing 1.40 (0.81–2.44) 2.02 (1.07–3.81) 1.80 (1.10–2.95)Other Services 0.22 (0.11–0.45) 0.95 (0.54–1.68) 0.50 (0.30–0.82)
Public Administration 1.44 (0.80–2.59) 2.23 (1.10–4.52) 1.26 (0.73–2.18)Transportation and Warehousing 0.22 (0.04–1.28) 1.31 (0.50–3.44) 1.43 (0.73–2.82)
Healthpromotion/wellness
committee
Wholesale and Retail Trade (Ref) 1.00 1.00 1.00All Other Sectors 3.72 (1.58–8.77) 5.38 (2.27–12.76) 2.30 (1.25–4.26)
Construction 0.36 (0.14–0.92) 0.723 (0.29–1.82) 0.42 (0.20–0.87)Educational Services 8.00 (4.65–13.75) 13.68 (7.78–24.03) 23.41 (13.09–41.87)
Health Care and Social Assistance 1.51 (0.89–2.58) 1.21 (0.68–2.14) 1.40 (0.93–2.10)Information, Finance, and Management Services 2.00 (1.19–3.38) 2.17 (1.26–3.73) 2.17 (1.46–3.25)
Manufacturing 1.55 (0.84–2.85) 2.16 (1.13–4.15) 2.02 (1.21–3.37)Other Services 0.37 (0.19–0.75) 0.94 (0.52–1.71) 0.60 (0.36–1.00)
Public Administration 2.57 (1.43–4.61) 3.77 (1.92–7.38) 1.89 (1.10–3.25)Transportation and Warehousing 0.44 (0.10–2.01) 1.48 (0.56–3.92) 1.16 (0.54–2.48)
Staff responsible foremployee health
promotion/wellness
Wholesale and Retail Trade (Ref) 1.00 1.00 1.00All Other Sectors 4.14 (1.73–9.87) 2.82 (1.04–7.65) 1.93 (0.991–3.757)
Construction 0.08 (0.01–0.55) 0.42 (0.12–1.50) 0.24 (0.09–0.632)Educational Services 3.52 (1.96–6.33) 9.04 (5.06–16.16) 14.01 (8.25–23.81)
Health Care and Social Assistance 1.78 (1.03–3.06) 1.50 (0.82–2.73) 1.44 (0.94–2.20)Information, Finance, and Management Services 1.87 (1.07–3.25) 1.52 (0.82–2.83) 1.86 (1.22–2.85)
Manufacturing 1.62 (0.86–3.04) 2.88 (1.47–5.64) 2.09 (1.23–3.54)Other Services 0.22 (0.09–0.54) 1.13 (0.60–2.13) 0.78 (0.48–1.30)
Public Administration 2.16 (1.14–4.09) 2.79 (1.32–5.89) 1.61 (0.90–2.87)Transportation and Warehousing 0.15 (0.01–2.07) 1.70 (0.62–4.71) 1.25 (0.57–2.73)
Funding for healthpromotion/wellness in
budget
Wholesale and Retail Trade (Ref) 1.00 1.00 1.00All Other Sectors 6.03 (2.51–14.52) 6.56 (2.66–16.16) 2.18 (1.12–4.25)
Construction 0.36 (0.13–1.02) 1.20 (0.51–2.86) 0.26 (0.10–0.67)Educational Services 0.94 (0.41–2.12) 2.36 (1.24–4.49) 3.36 (1.97–5.71)
Health Care and Social Assistance 1.56 (0.87–2.79) 0.91 (0.48–1.73) 1.19 (0.76–1.85)Information, Finance, and Management Services 2.76 (1.59–4.80) 1.92 (1.07–3.47) 2.31 (1.51–3.54)
Manufacturing 1.86 (0.98–3.53) 3.13 (1.63–6.02) 1.55 (0.88–2.74)Other Services 0.27 (0.12–0.64) 0.69 (0.35–1.37) 0.50 (0.28–0.88)
Public Administration 1.93 (0.98–3.80) 3.29 (1.60–6.77) 2.30 (1.32–4.02)Transportation and Warehousing 0.05 (<0.001–5.29) 0.94 (0.29–3.12) 1.05 (0.46–2.41)
Written objectives foremployee
wellness/health
Wholesale and Retail Trade (Ref) 1.00 1.00 1.00All Other Sectors 3.21 (1.28–8.04) 5.32 (2.11–13.43) 0.39 (0.12–1.25)
Construction 0.19 (0.05–0.72) 1.43 (0.62–3.34) 0.28 (0.11–0.70)Educational Services 1.83 (0.93–3.61) 3.06 (1.64–5.73) 3.33 (1.95–5.69)
Health Care and Social Assistance 1.31 (0.73–2.37) 0.73 (0.36–1.46) 1.05 (0.67–1.65)Information, Finance, and Management Services 1.47 (0.82–2.63) 1.27 (0.67–2.42) 1.17 (0.73–1.86)
Manufacturing 1.23 (0.62–2.433) 1.94 (0.94–3.99) 1.36 (0.76–2.44)Other Services 0.24 (0.10–0.58) 0.93 (0.482–1.80) 0.34 (0.18–0.65)
Public Administration 2.17 (1.12–4.19) 2.13 (0.97–4.69) 1.52 (0.83–2.77)Transportation and Warehousing 0.59 (0.14–2.53) 0.94 (0.27–3.23) 1.07 (0.47–2.45)
Stated mission or goalregarding
improvement oremployee health status
Wholesale and Retail Trade (Ref) 1.00 1.00 1.00All Other Sectors 1.56 (0.50–4.84) 3.52 (1.33–9.35) 0.47 (0.16–1.38)
Construction 0.17 (0.04–0.70) 0.97 (0.37–2.50) 0.08 (0.01–0.40)Educational Services 2.35 (1.23–4.46) 2.95 (1.58–5.51) 3.32 (1.95–5.68)
Health Care and Social Assistance 1.37 (0.76–2.48) 0.96 (0.50–1.83) 0.98 (0.61–1.56)Information, Finance, and Management Services 1.19 (0.64–2.20) 1.24 (0.65–2.37) 1.34 (0.84–2.13)
Manufacturing 0.93 (0.44–1.95) 1.54 (0.72–3.30) 1.21 (0.66–2.23)Other Services 0.25 (0.10–0.59) 0.77 (0.39–1.53) 0.59 (0.34–1.03)
Public Administration 1.73 (0.87–3.43) 2.41 (1.12–5.19) 1.47 (0.80–2.71)Transportation and Warehousing 0.32 (0.05–2.15) 0.88 (0.25–3.08) 1.13 (0.49–2.61)
72
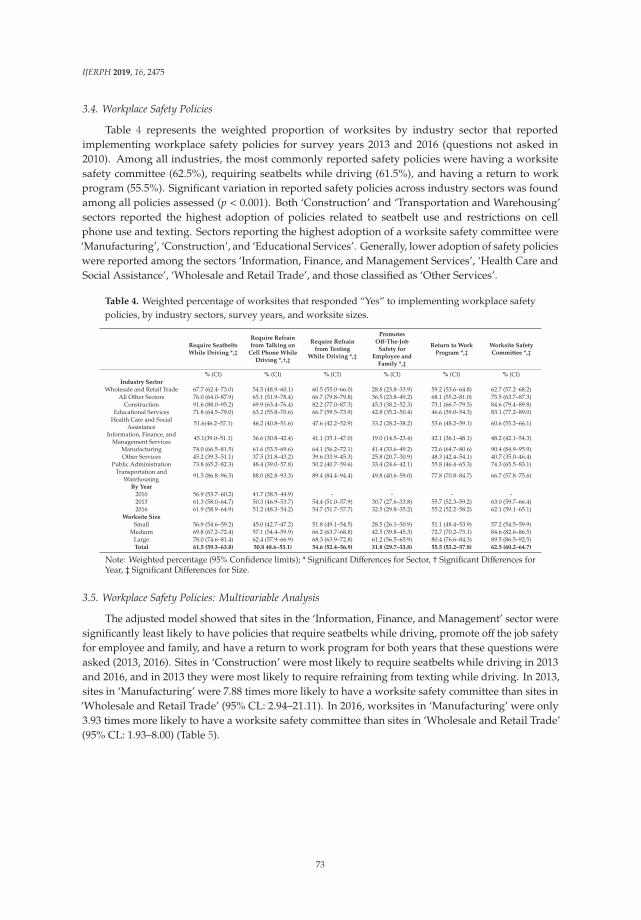
IJERPH 2019, 16, 2475
3.4. Workplace Safety Policies
Table 4 represents the weighted proportion of worksites by industry sector that reportedimplementing workplace safety policies for survey years 2013 and 2016 (questions not asked in2010). Among all industries, the most commonly reported safety policies were having a worksitesafety committee (62.5%), requiring seatbelts while driving (61.5%), and having a return to workprogram (55.5%). Significant variation in reported safety policies across industry sectors was foundamong all policies assessed (p < 0.001). Both ‘Construction’ and ‘Transportation and Warehousing’sectors reported the highest adoption of policies related to seatbelt use and restrictions on cellphone use and texting. Sectors reporting the highest adoption of a worksite safety committee were‘Manufacturing’, ‘Construction’, and ‘Educational Services’. Generally, lower adoption of safety policieswere reported among the sectors ‘Information, Finance, and Management Services’, ‘Health Care andSocial Assistance’, ‘Wholesale and Retail Trade’, and those classified as ‘Other Services’.
Table 4. Weighted percentage of worksites that responded “Yes” to implementing workplace safetypolicies, by industry sectors, survey years, and worksite sizes.
Require SeatbeltsWhile Driving *,‡
Require Refrainfrom Talking on
Cell Phone WhileDriving *,†,‡
Require Refrainfrom Texting
While Driving *,‡
PromotesOff-The-Job
Safety forEmployee and
Family *,‡
Return to WorkProgram *,‡
Worksite SafetyCommittee *,‡
% (CI) % (CI) % (CI) % (CI) % (CI) % (CI)Industry Sector
Wholesale and Retail Trade 67.7 (62.4–73.0) 54.5 (48.9–60.1) 60.5 (55.0–66.0) 28.8 (23.8–33.9) 59.2 (53.6–64.8) 62.7 (57.2–68.2)All Other Sectors 76.0 (64.0–87.9) 65.1 (51.9–78.4) 66.7 (79.8–79.8) 36.5 (23.8–49.2) 68.1 (55.2–81.0) 75.5 (63.7–87.3)
Construction 91.6 (88.0–95.2) 69.9 (63.4–76.4) 82.2 (77.0–87.3) 45.3 (38.2–52.3) 73.1 (66.7–79.5) 84.6 (79.4–89.8)Educational Services 71.8 (64.5–79.0) 63.2 (55.8–70.6) 66.7 (59.5–73.9) 42.8 (35.2–50.4) 46.6 (39.0–54.3) 83.1 (77.2–89.0)
Health Care and SocialAssistance 51.6(46.2–57.1) 46.2 (40.8–51.6) 47.6 (42.2–52.9) 33.2 (28.2–38.2) 53.6 (48.2–59.1) 60.6 (55.2–66.1)
Information, Finance, andManagement Services 45.1(39.0–51.1) 36.6 (30.8–42.4) 41.1 (35.1–47.0) 19.0 (14.5–23.4) 42.1 (36.1–48.1) 48.2 (42.1–54.3)
Manufacturing 74.0 (66.5–81.5) 61.6 (53.5–69.6) 64.1 (56.2–72.1) 41.4 (33.6–49.2) 72.6 (64.7–80.6) 90.4 (84.9–95.9)Other Services 45.2 (39.3–51.1) 37.5 (31.8–43.2) 39.6 (33.9–45.3) 25.8 (20.7–30.9) 48.3 (42.4–54.1) 40.7 (35.0–46.4)
Public Administration 73.8 (65.2–82.3) 48.4 (39.0–57.8) 50.2 (40.7–59.6) 33.4 (24.6–42.1) 55.8 (46.4–65.3) 74.3 (65.5–83.1)Transportation and
Warehousing 91.5 (86.8–96.3) 88.0 (82.8–93.3) 89.4 (84.4–94.4) 49.8 (40.6–59.0) 77.8 (70.8–84.7) 66.7 (57.8–75.6)
By Year
2010 56.9 (53.7–60.2) 41.7 (38.5–44.9) - - - -2013 61.3 (58.0–64.7) 50.3 (46.9–53.7) 54.4 (51.0–57.9) 30.7 (27.6–33.8) 55.7 (52.3–59.2) 63.0 (59.7–66.4)2016 61.9 (58.9–64.9) 51.2 (48.3–54.2) 54.7 (51.7–57.7) 32.5 (29.8–35.2) 55.2 (52.2–58.2) 62.1 (59.1–65.1)
Worksite Size
Small 56.9 (54.6–59.2) 45.0 (42.7–47.2) 51.8 (49.1–54.5) 28.5 (26.1–30.9) 51.1 (48.4–53.9) 57.2 (54.5–59.9)Medium 69.8 (67.2–72.4) 57.1 (54.4–59.9) 66.2 (63.7–68.8) 42.5 (39.8–45.3) 72.7 (70.2–75.1) 84.6 (82.6–86.5)
Large 78.0 (74.6–81.4) 62.4 (57.9–66.9) 68.3 (63.9–72.8) 61.2 (56.5–65.9) 80.4 (76.6–84.3) 89.5 (86.5–92.5)Total 61.5 (59.3–63.8) 50.8 48.6–53.1) 54.6 (52.4–56.9) 31.8 (29.7–33.8) 55.5 (53.2–57.8) 62.5 (60.2–64.7)
Note: Weighted percentage (95% Confidence limits); * Significant Differences for Sector, † Significant Differences forYear, ‡ Significant Differences for Size.
3.5. Workplace Safety Policies: Multivariable Analysis
The adjusted model showed that sites in the ‘Information, Finance, and Management’ sector weresignificantly least likely to have policies that require seatbelts while driving, promote off the job safetyfor employee and family, and have a return to work program for both years that these questions wereasked (2013, 2016). Sites in ‘Construction’ were most likely to require seatbelts while driving in 2013and 2016, and in 2013 they were most likely to require refraining from texting while driving. In 2013,sites in ‘Manufacturing’ were 7.88 times more likely to have a worksite safety committee than sites in‘Wholesale and Retail Trade’ (95% CL: 2.94–21.11). In 2016, worksites in ‘Manufacturing’ were only3.93 times more likely to have a worksite safety committee than sites in ‘Wholesale and Retail Trade’(95% CL: 1.93–8.00) (Table 5).
73
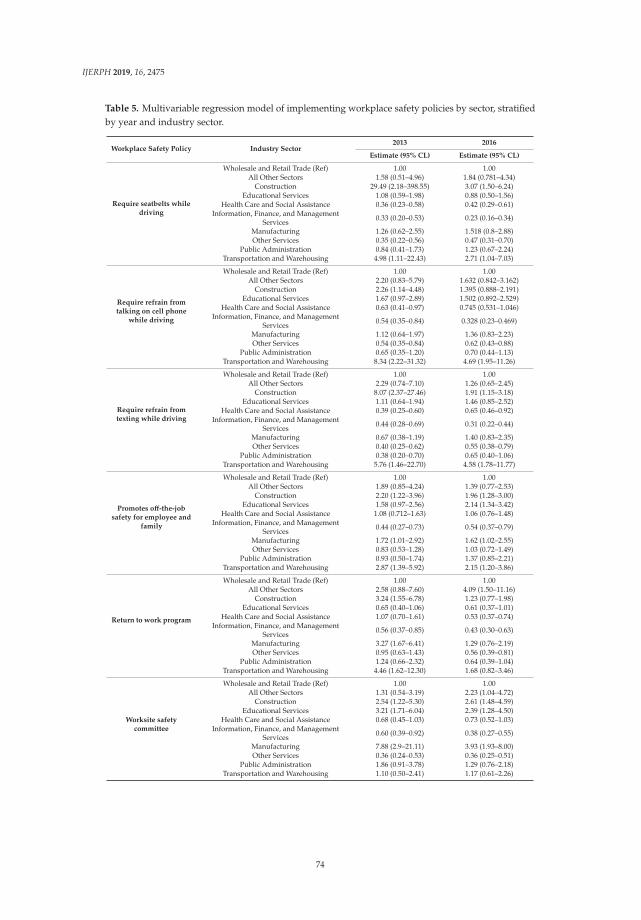
IJERPH 2019, 16, 2475
Table 5. Multivariable regression model of implementing workplace safety policies by sector, stratifiedby year and industry sector.
Workplace Safety Policy Industry Sector2013 2016
Estimate (95% CL) Estimate (95% CL)
Require seatbelts whiledriving
Wholesale and Retail Trade (Ref) 1.00 1.00All Other Sectors 1.58 (0.51–4.96) 1.84 (0.781–4.34)
Construction 29.49 (2.18–398.55) 3.07 (1.50–6.24)Educational Services 1.08 (0.59–1.98) 0.88 (0.50–1.56)
Health Care and Social Assistance 0.36 (0.23–0.58) 0.42 (0.29–0.61)Information, Finance, and Management
Services 0.33 (0.20–0.53) 0.23 (0.16–0.34)
Manufacturing 1.26 (0.62–2.55) 1.518 (0.8–2.88)Other Services 0.35 (0.22–0.56) 0.47 (0.31–0.70)
Public Administration 0.84 (0.41–1.73) 1.23 (0.67–2.24)Transportation and Warehousing 4.98 (1.11–22.43) 2.71 (1.04–7.03)
Require refrain fromtalking on cell phone
while driving
Wholesale and Retail Trade (Ref) 1.00 1.00All Other Sectors 2.20 (0.83–5.79) 1.632 (0.842–3.162)
Construction 2.26 (1.14–4.48) 1.395 (0.888–2.191)Educational Services 1.67 (0.97–2.89) 1.502 (0.892–2.529)
Health Care and Social Assistance 0.63 (0.41–0.97) 0.745 (0.531–1.046)Information, Finance, and Management
Services 0.54 (0.35–0.84) 0.328 (0.23–0.469)
Manufacturing 1.12 (0.64–1.97) 1.36 (0.83–2.23)Other Services 0.54 (0.35–0.84) 0.62 (0.43–0.88)
Public Administration 0.65 (0.35–1.20) 0.70 (0.44–1.13)Transportation and Warehousing 8.34 (2.22–31.32) 4.69 (1.95–11.26)
Require refrain fromtexting while driving
Wholesale and Retail Trade (Ref) 1.00 1.00All Other Sectors 2.29 (0.74–7.10) 1.26 (0.65–2.45)
Construction 8.07 (2.37–27.46) 1.91 (1.15–3.18)Educational Services 1.11 (0.64–1.94) 1.46 (0.85–2.52)
Health Care and Social Assistance 0.39 (0.25–0.60) 0.65 (0.46–0.92)Information, Finance, and Management
Services 0.44 (0.28–0.69) 0.31 (0.22–0.44)
Manufacturing 0.67 (0.38–1.19) 1.40 (0.83–2.35)Other Services 0.40 (0.25–0.62) 0.55 (0.38–0.79)
Public Administration 0.38 (0.20–0.70) 0.65 (0.40–1.06)Transportation and Warehousing 5.76 (1.46–22.70) 4.58 (1.78–11.77)
Promotes off-the-jobsafety for employee and
family
Wholesale and Retail Trade (Ref) 1.00 1.00All Other Sectors 1.89 (0.85–4.24) 1.39 (0.77–2.53)
Construction 2.20 (1.22–3.96) 1.96 (1.28–3.00)Educational Services 1.58 (0.97–2.56) 2.14 (1.34–3.42)
Health Care and Social Assistance 1.08 (0.712–1.63) 1.06 (0.76–1.48)Information, Finance, and Management
Services 0.44 (0.27–0.73) 0.54 (0.37–0.79)
Manufacturing 1.72 (1.01–2.92) 1.62 (1.02–2.55)Other Services 0.83 (0.53–1.28) 1.03 (0.72–1.49)
Public Administration 0.93 (0.50–1.74) 1.37 (0.85–2.21)Transportation and Warehousing 2.87 (1.39–5.92) 2.15 (1.20–3.86)
Return to work program
Wholesale and Retail Trade (Ref) 1.00 1.00All Other Sectors 2.58 (0.88–7.60) 4.09 (1.50–11.16)
Construction 3.24 (1.55–6.78) 1.23 (0.77–1.98)Educational Services 0.65 (0.40–1.06) 0.61 (0.37–1.01)
Health Care and Social Assistance 1.07 (0.70–1.61) 0.53 (0.37–0.74)Information, Finance, and Management
Services 0.56 (0.37–0.85) 0.43 (0.30–0.63)
Manufacturing 3.27 (1.67–6.41) 1.29 (0.76–2.19)Other Services 0.95 (0.63–1.43) 0.56 (0.39–0.81)
Public Administration 1.24 (0.66–2.32) 0.64 (0.39–1.04)Transportation and Warehousing 4.46 (1.62–12.30) 1.68 (0.82–3.46)
Worksite safetycommittee
Wholesale and Retail Trade (Ref) 1.00 1.00All Other Sectors 1.31 (0.54–3.19) 2.23 (1.04–4.72)
Construction 2.54 (1.22–5.30) 2.61 (1.48–4.59)Educational Services 3.21 (1.71–6.04) 2.39 (1.28–4.50)
Health Care and Social Assistance 0.68 (0.45–1.03) 0.73 (0.52–1.03)Information, Finance, and Management
Services 0.60 (0.39–0.92) 0.38 (0.27–0.55)
Manufacturing 7.88 (2.9–21.11) 3.93 (1.93–8.00)Other Services 0.36 (0.24–0.53) 0.36 (0.25–0.51)
Public Administration 1.86 (0.91–3.78) 1.29 (0.76–2.18)Transportation and Warehousing 1.10 (0.50–2.41) 1.17 (0.61–2.26)
74
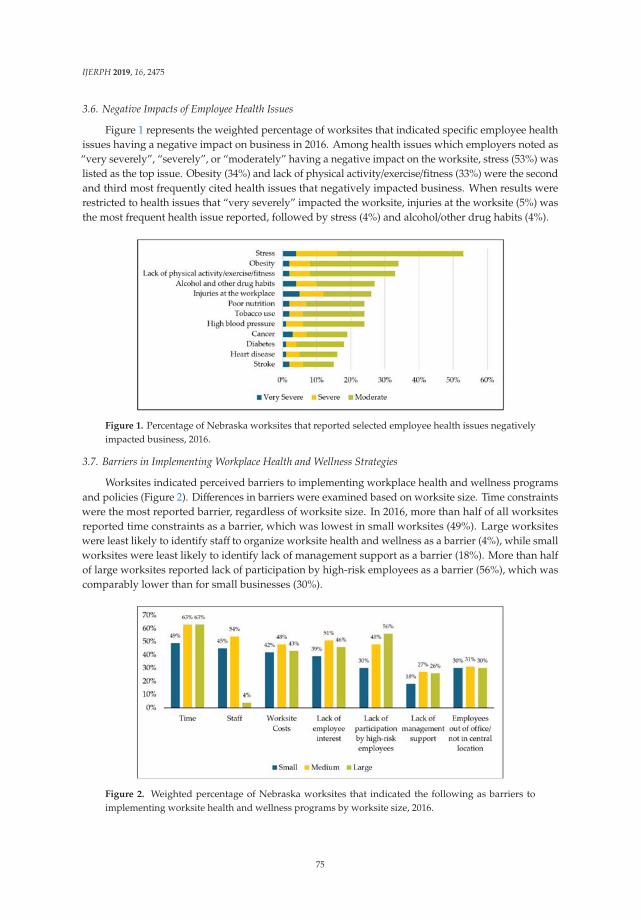
IJERPH 2019, 16, 2475
3.6. Negative Impacts of Employee Health Issues
Figure 1 represents the weighted percentage of worksites that indicated specific employee healthissues having a negative impact on business in 2016. Among health issues which employers noted as“very severely”, “severely”, or “moderately” having a negative impact on the worksite, stress (53%) waslisted as the top issue. Obesity (34%) and lack of physical activity/exercise/fitness (33%) were the secondand third most frequently cited health issues that negatively impacted business. When results wererestricted to health issues that “very severely” impacted the worksite, injuries at the worksite (5%) wasthe most frequent health issue reported, followed by stress (4%) and alcohol/other drug habits (4%).
Figure 1. Percentage of Nebraska worksites that reported selected employee health issues negativelyimpacted business, 2016.
3.7. Barriers in Implementing Workplace Health and Wellness Strategies
Worksites indicated perceived barriers to implementing workplace health and wellness programsand policies (Figure 2). Differences in barriers were examined based on worksite size. Time constraintswere the most reported barrier, regardless of worksite size. In 2016, more than half of all worksitesreported time constraints as a barrier, which was lowest in small worksites (49%). Large worksiteswere least likely to identify staff to organize worksite health and wellness as a barrier (4%), while smallworksites were least likely to identify lack of management support as a barrier (18%). More than halfof large worksites reported lack of participation by high-risk employees as a barrier (56%), which wascomparably lower than for small businesses (30%).
Figure 2. Weighted percentage of Nebraska worksites that indicated the following as barriers toimplementing worksite health and wellness programs by worksite size, 2016.
75
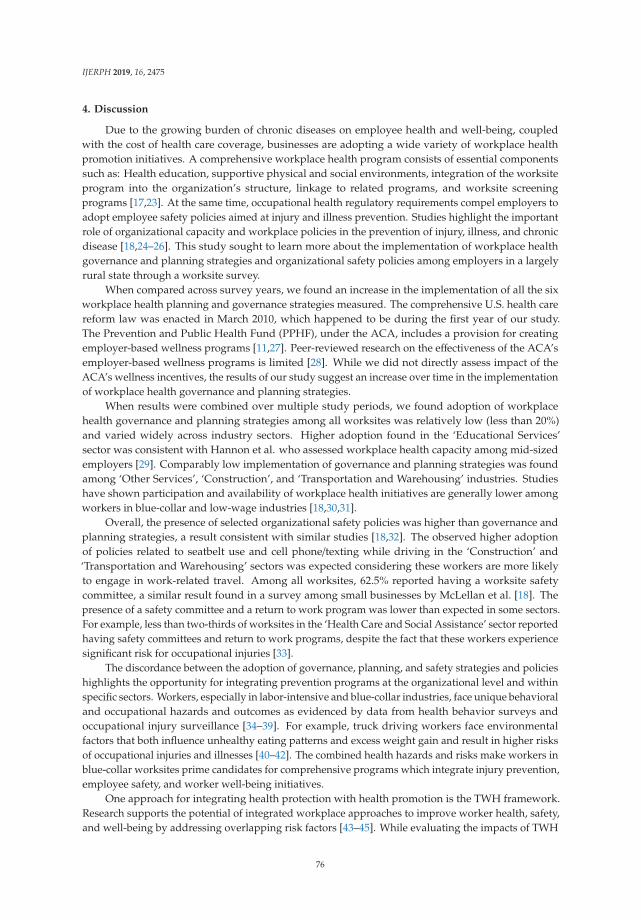
IJERPH 2019, 16, 2475
4. Discussion
Due to the growing burden of chronic diseases on employee health and well-being, coupledwith the cost of health care coverage, businesses are adopting a wide variety of workplace healthpromotion initiatives. A comprehensive workplace health program consists of essential componentssuch as: Health education, supportive physical and social environments, integration of the worksiteprogram into the organization’s structure, linkage to related programs, and worksite screeningprograms [17,23]. At the same time, occupational health regulatory requirements compel employers toadopt employee safety policies aimed at injury and illness prevention. Studies highlight the importantrole of organizational capacity and workplace policies in the prevention of injury, illness, and chronicdisease [18,24–26]. This study sought to learn more about the implementation of workplace healthgovernance and planning strategies and organizational safety policies among employers in a largelyrural state through a worksite survey.
When compared across survey years, we found an increase in the implementation of all the sixworkplace health planning and governance strategies measured. The comprehensive U.S. health carereform law was enacted in March 2010, which happened to be during the first year of our study.The Prevention and Public Health Fund (PPHF), under the ACA, includes a provision for creatingemployer-based wellness programs [11,27]. Peer-reviewed research on the effectiveness of the ACA’semployer-based wellness programs is limited [28]. While we did not directly assess impact of theACA’s wellness incentives, the results of our study suggest an increase over time in the implementationof workplace health governance and planning strategies.
When results were combined over multiple study periods, we found adoption of workplacehealth governance and planning strategies among all worksites was relatively low (less than 20%)and varied widely across industry sectors. Higher adoption found in the ‘Educational Services’sector was consistent with Hannon et al. who assessed workplace health capacity among mid-sizedemployers [29]. Comparably low implementation of governance and planning strategies was foundamong ‘Other Services’, ‘Construction’, and ‘Transportation and Warehousing’ industries. Studieshave shown participation and availability of workplace health initiatives are generally lower amongworkers in blue-collar and low-wage industries [18,30,31].
Overall, the presence of selected organizational safety policies was higher than governance andplanning strategies, a result consistent with similar studies [18,32]. The observed higher adoptionof policies related to seatbelt use and cell phone/texting while driving in the ‘Construction’ and‘Transportation and Warehousing’ sectors was expected considering these workers are more likelyto engage in work-related travel. Among all worksites, 62.5% reported having a worksite safetycommittee, a similar result found in a survey among small businesses by McLellan et al. [18]. Thepresence of a safety committee and a return to work program was lower than expected in some sectors.For example, less than two-thirds of worksites in the ‘Health Care and Social Assistance’ sector reportedhaving safety committees and return to work programs, despite the fact that these workers experiencesignificant risk for occupational injuries [33].
The discordance between the adoption of governance, planning, and safety strategies and policieshighlights the opportunity for integrating prevention programs at the organizational level and withinspecific sectors. Workers, especially in labor-intensive and blue-collar industries, face unique behavioraland occupational hazards and outcomes as evidenced by data from health behavior surveys andoccupational injury surveillance [34–39]. For example, truck driving workers face environmentalfactors that both influence unhealthy eating patterns and excess weight gain and result in higher risksof occupational injuries and illnesses [40–42]. The combined health hazards and risks make workers inblue-collar worksites prime candidates for comprehensive programs which integrate injury prevention,employee safety, and worker well-being initiatives.
One approach for integrating health protection with health promotion is the TWH framework.Research supports the potential of integrated workplace approaches to improve worker health, safety,and well-being by addressing overlapping risk factors [43–45]. While evaluating the impacts of TWH
76
IJERPH 2019, 16, 2475
framework is an emerging field, several studies have shown that TWH interventions can effectivelyaddress injuries and chronic diseases in specific worker populations [46–50]. While the current studydid not evaluate specific integrated TWH interventions or programs, in our 2016 survey we foundthat only 15.6% of worksites reported a coordinated program for occupational health and safety withhealth promotion (data not shown).
Our findings on the impact of employer’s perceived health issues demonstrate a business case forTWH approaches. We found stress, obesity, physical activity, alcohol/drug use, and workplace injurieswere the top five employee health issues reported by worksites which negatively affect business. Theseresults highlight the complex and interconnected worker health dynamic which could be addressedwith an integrated approach. Worksite stress, for example, is associated with negative health outcomessuch as increased risk of cardiovascular disease and metabolic syndrome [51,52]. Evidence alsosupports the relationship between workplace injuries and chronic disease [36,53–55].
Our results regarding barriers suggest challenges in implementing workplace health initiatives canbe attributed to both the employers and the employees, similar to other studies [14,25]. More than halfof businesses stated that time constraints were a barrier to successful workplace health and wellnessat their worksite. For these worksites, having a coordinator who is responsible for employee healthpromotion or a health promotion/wellness committee could help to provide a platform for employeeengagement and collaboration to drive effective worksite health planning and implementation efforts.
Generally, small worksites were less likely to report barriers; no barrier was reported higher than50% among small worksites. Worksite costs and time barriers were less likely to be reported amongsmall worksites, which was a similar result in a survey among Australian workplaces [56]. There aremany opportunities for workplace health and wellness programs in small businesses to be successfuland well-accepted among employees. For example, the process of implementing new initiatives iscomparatively less bureaucratic and easier to implement, a greater proportion of employees’ preferencesmay be incorporated, and employees may have greater personal accountability [14].
There were several limitations to this study. Given the self-report nature of the worksite survey,this study was susceptible to selection bias. Large worksites were more likely to complete the surveycompared to small and medium sized worksites, and these large worksites may be more likely to havecertain workplace health or safety initiatives. Furthermore, nonresponse rates increased over timeamong large and small businesses which was unexplained. This nonresponse increase could accountfor the significant increase in trends observed in Table 2. To mitigate selection bias, reminders weresent to potential respondents during all three years of survey collection. Weighting was also performedto adjust for the effect of nonresponses across worksite size (Table S3).
The relationship between worksite size and industry sector should be considered when interpretingthe results. Generally, certain industries like ‘Construction’ tend to be smaller establishments whileindustries such as ‘Manufacturing’ tend to be larger. This association held true between worksite sizeand industry sector in our sample (p < 0.0001) (Table S4). Additionally, surveys were addressed toeither the business owner, manager, or human resource representative, but the worksite informationcollected may result in misclassification if the representative was not the most appropriate respondent.Lastly, the data represents the views of a single worksite, thus caution is warranted when interpretingour results since evidence suggests that employees’ perceptions may vary from employers’ [57].
Despite these limitations, the findings can be used to guide recommendations for future workplacehealth and safety promotion research and practice. To our knowledge, this is the first study to describethe adoption and trends of specific workplace health governance and planning strategies using multiplepoint-in-time surveys. The data also fill a critical gap which no recent, publicly available, and existingdata on workplace health governance and planning strategies and organizational safety policies bydetailed industry sector. Lastly, our study had a relatively large sample size, especially for just one state.
The scope of this study did not allow for assessing the employee utilization of workplacehealth programs, thus observational studies are needed to verify the validity of these survey results.Furthermore, employee outcome data as well as employees’ perspectives need to be taken into
77
IJERPH 2019, 16, 2475
consideration. While disparities in uptake of workplace health initiatives have been observed in thisstudy as well as others, further research is needed to examine how to better engage high risk andunderserved worker populations [14,30]. The majority of small businesses in Nebraska are in ruralsettings; therefore, a follow-up study on the urban and rural differences in the adoption of workplacehealth and safety strategies is warranted.
5. Conclusions
Results of this multi-year worksite survey show progress in workplace health initiatives amongbusinesses in Nebraska. Our findings support the need for targeted approaches to buildingorganizational capacity for comprehensive, integrated workplace health and safety programs inindustries most impacted by chronic diseases and workplace injuries. The opportunity to advanceworker health, safety, and well-being using TWH strategies is greater in blue-collar industries whereadoption of governance and planning strategies were low. Public health practitioners should focus onhow businesses can address the most common barriers to implementation relative to business size.Targeting promotion of workplace health programs in small business may be fruitful as they may facefewer obstacles.
Supplementary Materials: The following are available online at http://www.mdpi.com/1660-4601/16/14/2475/s1,Table S1: Survey questions on workplace health governance, planning, and safety policies., Table S2. Worksitesizes related to response rates., Table S3. Testing responses of worksites associated over time with nonresponse.,Table S4. Industry sector by worksite size among respondents.
Author Contributions: Conceptualization, A.S., D.S. and R.W.; Methodology, R.W, A.S and D.S.; Software, D.S.and A.S.; Validation, D.S. and B.C.; Formal Analysis, D.S. and A.S.; Investigation, B.C.; Resources, B.C.; DataCuration, A.S, D.S. and B.C.; Writing—Original Draft Preparation, D.S., A.S. and R.W.; Writing—Review & Editing,D.S., A.S. and R.W.; Supervision, R.W.; Project Administration, D.S.; Funding Acquisition, D.S., A.S. and B.C.
Funding: This project was supported by Cooperative Agreement Numbers 2B01OT00936, NU58DP004819, and5U60OH010897, funded by the Centers for Disease Control and Prevention, as well as by the Nebraska Departmentof Health and Human Services, Tobacco Free Nebraska Program as a result of the Tobacco Master SettlementAgreement. Its contents are solely the responsibility of the authors and do not necessarily represent the officialviews of the Centers for Disease Control and Prevention, the Department of Health and Human Services, or theNebraska Department of Health and Human Services.
Acknowledgments: We would like to thank the Nebraska Department Labor for their assistance in identifyingsample frame information. We also thank the Bureau of Sociological Research (BOSR), University ofNebraska—Lincoln for their contributions to survey design, collection, weighting, and data management.
Conflicts of Interest: The authors declare no conflict of interest.
References
1. Kochanek, K.D.; Murphy, S.L.; Xu, J. Deaths: Final data for 2011. Natl. Vital Stat. Rep. 2015, 63, 1–120.[PubMed]
2. Gerteis, J.; Izrael, D.; LeRoy, L.; Deitz, D.; Ricciardi, R.; Miller, T.; Basu, J. Multiple Chronic Conditions Chartbook;Agency for Healthcare Research and Quality: Rockville, MD, USA, 2014.
3. National Center for Chronic Disease Prevention and Health Promotion. The Power of Prevention: ChronicDisease . . . the Public Health Challenge of the 21st Century 2009. Available online: https://www.cdc.gov/chronicdisease/pdf/2009-Power-of-Prevention.pdf (accessed on 19 January 2019).
4. U.S. Bureau of Labor Statistics. Current Population Survey: Labor Force Statistics. Available online:https://data.bls.gov/timeseries/LNS12000000 (accessed on 4 April 2019).
5. Aldana, S.G. Financial impact of health promotion programs: A comprehensive review of the literature. Am.J. Health Promot. AJHP 2001, 15, 296–320. [CrossRef] [PubMed]
6. Soler, R.E.; Leeks, K.D.; Razi, S.; Hopkins, D.P.; Griffith, M.; Aten, A.; Chattopadhyay, S.K.; Smith, S.C.;Habarta, N.; Goetzel, R.Z.; et al. A systematic review of selected interventions for worksite health promotion.The assessment of health risks with feedback. Am. J. Prev. Med. 2010, 38, S237–S262. [CrossRef] [PubMed]
7. Baicker, K.; Cutler, D.; Song, Z. Workplace wellness programs can generate savings. Health Aff. Proj. Hope2010, 29, 304–311. [CrossRef] [PubMed]
78
IJERPH 2019, 16, 2475
8. Goetzel, R.Z.; Ozminkowski, R.J. The health and cost benefits of work site health-promotion programs. Annu.Rev. Public Health 2008, 29, 303–323. [CrossRef] [PubMed]
9. Pelletier, K.R. A review and analysis of the clinical and cost-effectiveness studies of comprehensive healthpromotion and disease management programs at the worksite: update VIII 2008 to 2010. J. Occup. Environ.Med. 2011, 53, 1310–1331. [CrossRef] [PubMed]
10. Ortman, J.; Velkoff, V.; Hogan, H. An Aging Nation: The Older Population in the United States; Current PopulationReports; U.S. Census Bureau: Washington, DC, USA, 2014; p. 28.
11. Anderko, L.; Roffenbender, J.S.; Goetzel, R.Z.; Howard, J.; Millard, F.; Wildenhaus, K.; Desantis, C.; Novelli, W.Promoting prevention through the affordable care act: Workplace wellness. Prev. Chronic. Dis. 2012, 9, E175.[CrossRef] [PubMed]
12. Goetzel, R.Z.; Pei, X.; Tabrizi, M.J.; Henke, R.M.; Kowlessar, N.; Nelson, C.F.; Metz, R.D. Ten modifiablehealth risk factors are linked to more than one-fifth of employer-employee health care spending. Health Aff.Proj. Hope 2012, 31, 2474–2484. [CrossRef]
13. Koh, H.K.; Sebelius, K.G. Promoting prevention through the Affordable Care Act. N. Engl. J. Med. 2010, 363,1296–1299. [CrossRef]
14. McCoy, K.; Stinson, K.; Scott, K.; Tenney, L.; Newman, L.S. Health promotion in small business: A systematicreview of factors influencing adoption and effectiveness of worksite wellness programs. J. Occup. Environ.Med. 2014, 56, 579–587. [CrossRef]
15. Mattke, S.; Liu, H.H.; Caloyeras, J.P.; Huang, C.Y.; Van Busum, K.R.; Khodyakov, D.; Shier, V. WorkplaceWellness Programs Study: Final Report; RAND Corporation: Santa Monica, CA, USA, 2013.
16. Goetzel, R.Z.; Henke, R.M.; Tabrizi, M.; Pelletier, K.R.; Loeppke, R.; Ballard, D.W.; Grossmeier, J.;Anderson, D.R.; Yach, D.; Kelly, R.K.; et al. Do workplace health promotion (wellness) programs work?J. Occup. Environ. Med. 2014, 56, 927–934. [CrossRef] [PubMed]
17. Centers for Disease Control and Prevention. Workplace Health Promotion: Planning/Workplace Governance.Available online: https://www.cdc.gov/workplacehealthpromotion/planning/index.html (accessed on30 January 2019).
18. McLellan, D.L.; Cabán-Martinez, A.J.; Nelson, C.C.; Pronk, N.P.; Katz, J.N.; Allen, J.D.; Davis, K.L.;Wagner, G.R.; Sorensen, G. Organizational characteristics influence implementation of worksite healthprotection and promotion programs: Evidence from smaller businesses. J. Occup. Environ. Med. Am. Coll.Occup. Environ. Med. 2015, 57, 1009–1016. [CrossRef] [PubMed]
19. Centers for Disease Control and Prevention. CDC Worksite Health ScoreCard Manual: An Assessment Toolto Promote Employee Health and Well-Being; U.S. Department of Health and Human Services: Atlanta, GA,USA, 2019.
20. Tamers, S.L.; Chosewood, L.C.; Childress, A.; Hudson, H.; Nigam, J.; Chang, C.-C. Total worker health2014–2018: The novel approach to worker safety, health, and well-being evolves. Int. J. Environ. Res. Public.Health 2019, 16, E321. [CrossRef] [PubMed]
21. NIOSH. Fundamentals of Total Worker Health Approaches: Essential Elements for Advancing Worker Safety, Health,and Well-Being; U.S. Department of Health and Human Services, Public Health Service, Centers for DiseaseControl and Prevention, National Institute for Occupational Safety and Health: Cincinnati, OH, USA, 2016.
22. Kish, L. Weighting for unequal pi. J. Off. Stat. 1992, 183–200.23. Pronk, N. Best practice design principles of worksite health and wellness programs. ACSMs Health Fit. J.
2014, 18, 42–46. [CrossRef]24. Payne, J.; Cluff, L.; Lang, J.; Matson-Koffman, D.; Morgan-Lopez, A. Elements of a workplace culture of
health, perceived organizational support for health, and lifestyle risk. Am. J. Health Promot. AJHP 2018, 32,1555–1567. [CrossRef]
25. Linnan, L.; Bowling, M.; Childress, J.; Lindsay, G.; Blakey, C.; Pronk, S.; Wieker, S.; Royall, P. Results of the2004 national worksite health promotion survey. Am. J. Public Health 2008, 98, 1503–1509. [CrossRef]
26. Cooklin, A.; Joss, N.; Husser, E.; Oldenburg, B. Integrated approaches to occupational health and safety: Asystematic review. Am. J. Health Promot. AJHP 2017, 31, 401–412. [CrossRef]
27. Haberkorn, J. Health policy brief: The prevention and public health fund. Health Aff. (Millwood) 2012.[CrossRef]
28. Chait, N.; Glied, S. Promoting prevention under the affordable care act. Annu. Rev. Public Health 2018, 39,507–524. [CrossRef]
79
IJERPH 2019, 16, 2475
29. Hannon, P.A.; Garson, G.; Harris, J.R.; Hammerback, K.; Sopher, C.J.; Clegg-Thorp, C. Workplace healthpromotion implementation, readiness, and capacity among mid-sized employers in low-wage industries: Anational survey. J. Occup. Environ. Med. Am. Coll. Occup. Environ. Med. 2012, 54, 1337–1343. [CrossRef][PubMed]
30. Glasgow, R.E.; McCaul, K.D.; Fisher, K.J. Participation in worksite health promotion: A critique of theliterature and recommendations for future practice. Health Educ. Q. 1993, 20, 391–408. [CrossRef] [PubMed]
31. Stiehl, E.; Shivaprakash, N.; Thatcher, E.; Ornelas, I.J.; Kneipp, S.; Baron, S.L.; Muramatsu, N. Worksite healthpromotion for low-wage workers: A scoping literature review. Am. J. Health Promot. AJHP 2018, 32, 359–373.[CrossRef] [PubMed]
32. Merchant, J.A.; Lind, D.P.; Kelly, K.M.; Hall, J.L. An employee total health management-based survey of Iowaemployers. J. Occup. Environ. Med. Am. Coll. Occup. Environ. Med. 2013, 55, S73–S77. [CrossRef] [PubMed]
33. Gomaa, A.E.; Tapp, L.C.; Luckhaupt, S.E.; Vanoli, K.; Sarmiento, R.F.; Raudabaugh, W.M.; Nowlin, S.;Sprigg, S.M. Occupational traumatic injuries among workers in health care facilities—United States,2012–2014. MMWR Morb. Mortal. Wkly. Rep. 2015, 64, 405–410. [PubMed]
34. Helmkamp, J.C.; Lincoln, J.E.; Sestito, J.; Wood, E.; Birdsey, J.; Kiefer, M. Risk factors, health behaviors, andinjury among adults employed in the transportation, warehousing, and utilities Super SECTOR. Am. J. Ind.Med. 2013, 56, 556–568. [CrossRef]
35. Sieber, W.K.; Robinson, C.F.; Birdsey, J.; Chen, G.X.; Hitchcock, E.M.; Lincoln, J.E.; Nakata, A.; Sweeney, M.H.Obesity and other risk factors: The national survey of U.S. long-haul truck driver health and injury. Am. J.Ind. Med. 2014, 57, 615–626. [CrossRef]
36. Marcum, J.L.; Chin, B.; Anderson, N.J.; Bonauto, D.K. Self-reported work-related injury orillness—Washington, 2011–2014. MMWR Morb. Mortal. Wkly. Rep. 2017, 66, 302–306. [CrossRef]
37. Luckhaupt, S.E.; Calvert, G.M. Prevalence of coronary heart disease or stroke among workers aged <55Years—United States, 2008–2012. MMWR Morb. Mortal. Wkly. Rep. 2014, 63, 645–649.
38. Dong, X.S.; Wang, X.; Largay, J.A. Occupational and non-occupational factors associated with work-relatedinjuries among construction workers in the USA. Int. J. Occup. Environ. Health 2015, 21, 142–150. [CrossRef]
39. U.S. Bureau of Labor Statistics. 2017 Survey of Occupational Injuries & Illnesses Charts Package. Availableonline: https://www.bls.gov/iif/osch0062.pdf (accessed on 30 January 2019).
40. Apostolopoulos, Y.; Sönmez, S.; Mona, S.; Haldeman, L.; Strack, R.; Jones, V. Barriers to truck drivers’ healthyeating: Environmental influences and health promotion strategies. J. Workplace Behav. Health 2011, 26,122–143. [CrossRef]
41. Lemke, M.; Apostolopoulos, Y. Health and wellness programs for commercial motor-vehicle drivers:Organizational assessment and new research directions. Workplace Health Saf. 2015, 63, 71–80. [CrossRef]
42. Anderson, N.J.; Smith, C.K.; Byrd, J.L. Work-related injury factors and safety climate perception in truckdrivers. Am. J. Ind. Med. 2017, 60, 711–723. [CrossRef]
43. Pronk, N.P. Integrated worker health protection and promotion programs: Overview and perspectives onhealth and economic outcomes. J. Occup. Environ. Med. Am. Coll. Occup. Environ. Med. 2013, 55, S30–S37.[CrossRef]
44. Sorensen, G.; McLellan, D.; Dennerlein, J.T.; Pronk, N.P.; Allen, J.D.; Boden, L.I.; Okechukwu, C.A.;Hashimoto, D.; Stoddard, A.; Wagner, G.R. Integration of health protection and health promotion: Rationale,indicators, and metrics. J. Occup. Environ. Med. Am. Coll. Occup. Environ. Med. 2013, 55, S12–S18. [CrossRef]
45. Loeppke, R.R.; Schill, A.L.; Chosewood, L.C.; Grosch, J.W.; Allweiss, P.; Burton, W.N.; Barnes-Farrell, J.L.;Goetzel, R.Z.; Heinen, L.; Hudson, T.W.; et al. Advancing workplace health protection and promotion for anaging workforce. J. Occup. Environ. Med. 2013, 55, 500–506. [CrossRef]
46. Anger, W.K.; Kyler-Yano, J.; Vaughn, K.; Wipfli, B.; Olson, R.; Blanco, M. Total worker health intervention forconstruction workers alters safety, health, well-being measures. J. Occup. Environ. Med. 2018, 60, 700–709.[CrossRef]
47. Peters, S.E.; Grant, M.P.; Rodgers, J.; Manjourides, J.; Okechukwu, C.A.; Dennerlein, J.T. A cluster randomizedcontrolled trial of a Total Worker Health® intervention on commercial construction sites. Int. J. Environ. Res.Public. Health 2018, 15, E2354. [CrossRef]
48. Anger, W.K.; Elliot, D.L.; Bodner, T.; Olson, R.; Rohlman, D.S.; Truxillo, D.M.; Kuehl, K.S.; Hammer, L.B.;Montgomery, D. Effectiveness of total worker health interventions. J. Occup. Health Psychol. 2015, 20, 226–247.[CrossRef]
80
IJERPH 2019, 16, 2475
49. Carr, L.J.; Leonhard, C.; Tucker, S.; Fethke, N.; Benzo, R.; Gerr, F. Total worker health Intervention increasesactivity of sedentary workers. Am. J. Prev. Med. 2016, 50, 9–17. [CrossRef]
50. Bradley, C.J.; Grossman, D.C.; Hubbard, R.A.; Ortega, A.N.; Curry, S.J. Integrated interventions for improvingtotal worker health: A panel report from the National Institutes of Health pathways to prevention workshop:Total worker health—What’s work got to do with it? Ann. Intern. Med. 2016, 165, 279–283. [CrossRef]
51. Fishta, A.; Backé, E.-M. Psychosocial stress at work and cardiovascular diseases: An overview of systematicreviews. Int. Arch. Occup. Environ. Health 2015, 88, 997–1014. [CrossRef]
52. Chandola, T.; Brunner, E.; Marmot, M. Chronic stress at work and the metabolic syndrome: Prospectivestudy. BMJ 2006, 332, 521–525. [CrossRef]
53. Kubo, J.; Goldstein, B.A.; Cantley, L.F.; Tessier-Sherman, B.; Galusha, D.; Slade, M.D.; Chu, I.M.; Cullen, M.R.Contribution of health status and prevalent chronic disease to individual risk for workplace injury in themanufacturing environment. Occup. Environ. Med. 2014, 71, 159–166. [CrossRef]
54. Thiese, M.S.; Hanowski, R.J.; Kales, S.N.; Porter, R.J.; Moffitt, G.; Hu, N.; Hegmann, K.T. Multiple conditionsincrease preventable crash risks among truck drivers in a cohort study. J. Occup. Environ. Med. 2017, 59,205–211. [CrossRef]
55. Schulte, P.A.; Pandalai, S.; Wulsin, V.; Chun, H. Interaction of occupational and personal risk factors inworkforce health and safety. Am. J. Public Health 2012, 102, 434–448. [CrossRef]
56. Taylor, A.W.; Pilkington, R.; Montgomerie, A.; Feist, H. The role of business size in assessing the uptake ofhealth promoting workplace initiatives in Australia. BMC Public Health 2016, 16, 353. [CrossRef]
57. Grosch, J.W.; Alterman, T.; Petersen, M.R.; Murphy, L.R. Worksite health promotion programs in the U.S.:Factors associated with availability and participation. Am. J. Health Promot. AJHP 1998, 13, 36–45. [CrossRef]
© 2019 by the authors. Licensee MDPI, Basel, Switzerland. This article is an open accessarticle distributed under the terms and conditions of the Creative Commons Attribution(CC BY) license (http://creativecommons.org/licenses/by/4.0/).
81
International Journal of
Environmental Research
and Public Health
Article
Effect of a Job Demand-Control-Social Support Modelon Accounting Professionals’ Health Perception
José Joaquín Del Pozo-Antúnez 1, Antonio Ariza-Montes 2,3,* , Francisco Fernández-Navarro 4
and Horacio Molina-Sánchez 1
1 Financial Economic and Accounting Department, Universidad Loyola Andalucía, 14004 Córdoba, Spain;[email protected] (J.J.D.P.-A.); [email protected] (H.M.-S.)
2 Management Department, Universidad Loyola Andalucía, 14004 Córdoba, Spain3 Department of Business Administration, Universidad Autónoma de Chile, 7500912 Santiago, Chile4 Quantitative Methods Department, Universidad Loyola Andalucía, 14004 Córdoba, Spain;
[email protected]* Correspondence: [email protected]
Received: 23 September 2018; Accepted: 27 October 2018; Published: 1 November 2018
Abstract: The Job Demand-Control and Job Demand-Control-Support (JDCS) models constitute thetheoretical approaches used to analyze the relationship between the characteristics of labor andoccupational health. Few studies have investigated the main effects and multiplicative model inrelation to the perceived occupational health of professional accountants. Accountants are subjectto various types of pressure in performing their work; this pressure influences their health and,ultimately, their ability to perform a job well. The objective of this study is to investigate the effectsof job demands on the occupational health of 739 accountants, as well as the role of the moderatorthat internal resources (locus of control) and external resources (social support) have in occupationalhealth. The proposed hypotheses are tested by applying different models of neural networks usingthe algorithm of the Extreme Learning Machine. The results confirm the relationship between certainstress factors that affect the health of the accountants, as well as the direct effect that the recognitionof superiors in occupational health has. Additionally, the results highlight the moderating effect ofprofessional development and the support of superiors on the job’s demands.
Keywords: Perceived Occupational Health (POH); Job Demands-Control-Social Support (JD-R)model; professional accountants
1. Introduction
As indicated by Reference [1], workplace health management is crucial for improvements inpsychosocial working conditions and health. Promoting healthy work environments is a matter ofethics as well as business interest, since the most competitive companies are those with mentally andphysically healthy workers due to policies supporting and protecting their health [2]. There is nodoubt that work is part of the social dimension of health. The National Institute for OccupationalSafety and Health (NIOSH) recognizes the importance of the well-being of workers, their familiesand communities through a series of factors linked to the employment relationship, such as wages,hours of work, workload and stress levels, interactions with co-workers and supervisors, access topaid leave, and health-promoting workplaces [3]. Therefore, Total Worker Health promotes an integralintervention in health where measures aimed at the protection of the health of employees are combinedwith others supportive of well-being. From this perspective, Total Worker Health integrates theindividual dimension of health with the organizational dimension and the environment [4]. The JobDemand-Control (JDC) model [5] and the Job Demand-Control-Support (JDCS) model [6,7] constitutethe most widely used theoretical approaches to understanding and interpreting the relationships
IJERPH 2018, 15, 2437; doi:10.3390/ijerph15112437 www.mdpi.com/journal/ijerph82
IJERPH 2018, 15, 2437
between the characteristics of health, work and well-being [8]. In fact, according to Reference [9],the occupational stress literature is dominated by these models.
Undoubtedly, every effort to improve the integral health of workers translates into greaterworking efficiency, as shown by the meta-analysis by Reference [10]. The JDCS model warns that thegreatest risks to physical and mental health are manifested among workers who experience a highisolation-strain (iso-strain) job—that is, those that are subject to high job demands in a context of lowcontrol or decision latitude and low social support (iso-strain hypothesis). However, empirical evidenceof this three-way interaction effect is still limited, primarily by the variety that exists in terms of thecharacteristics and conditions of labor between different jobs and occupations. Many authors, such asReference [11], indicate that the samples used to test the JDCS model should be as homogeneous aspossible, although they are heterogeneous with respect to the level of exposure of workers to the laborenvironment variables. This circumstance suggests the need to carry out research in occupations withsimilar characteristics. In addition, not all professions are subject to the same degree of strain, but someoccupations tend to combine certain conditions that make workers in those jobs more vulnerable interms of their physical and mental health [12].
Accountants play an important role in the financial market because they provide accurateinformation for decision making. Expert judgement and mental equilibrium are required for sounddecisions. Despite this, an important gap of research exists in relation to pressures on accountantsand its effects. Recently, a professional publication has shown how leading firms of accountants havetaken steps to improve their health at work: Training the team leaders on issues of occupational health,creating spaces for healthier work practices, knowledge of such risks, sharing experiences among teammembers, etc. [13].
A profession as important as accounting is subject to heavy job demands that may affect one’sperceived occupational health (POH). Occupational health is the result of the confluence of a numberof stress factors and mechanism moderators in organizations. The effect of stressors on accountantshas been studied in terms of different effects: For example, dysfunctional behaviour [14–16],personal well-being [17,18], labor satisfaction [17], performance [17] or turnover intention [17,19–22].This research used theoretical frameworks compatible with those that explain the effect of the jobdemands in occupational health deterioration and, in particular, one of its major manifestations:Burnout [17,19–26]. Thus, the literature on the accountancy profession has identified several maincategories of stressors, which highlight role overload, role conflict and role ambiguity [23]. The JobDemand-Job Control-Social Support (JDCS) model provides a holistic framework to investigatethe direct effects and moderators of these stressors on occupational health. To our knowledge,this model has not has been tested on a group of accountants, so this paper covers an importantgap in the literature.
This paper tries to cover gaps in the research on this topic in the European context. Thus,the objective of this study is to investigate the effects of job demands on the occupational health of theaccountants, as well as the role of the moderator that internal resources (locus of control) and externalresources (social support) have in occupational health. To meet the objectives of this research, Section 2presents the theoretical framework and hypotheses that are derived from the framework. Section 3describes the empirical study design and methodology used, which are based mainly on the analysisof neural networks. Section 4 displays the main results. The article ends with a discussion of the results(Section 5) and the main limitations of the study and future lines of research (Section 6).
2. Theoretical Framework and Hypothesis Development
This work deals with the study of the health of accountants based on a theoretical framework thatuses the Job Demand-Control-Support (JDCS) model formulated by References [5–7]. Different authorshave used this model to explain the effect of the job demands on occupational health [27–29].
83
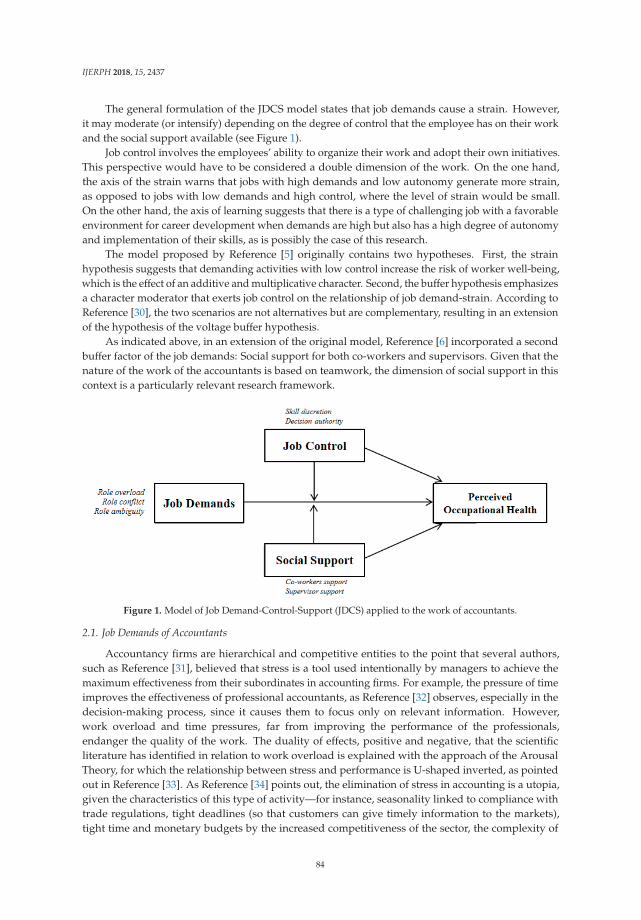
IJERPH 2018, 15, 2437
The general formulation of the JDCS model states that job demands cause a strain. However,it may moderate (or intensify) depending on the degree of control that the employee has on their workand the social support available (see Figure 1).
Job control involves the employees’ ability to organize their work and adopt their own initiatives.This perspective would have to be considered a double dimension of the work. On the one hand,the axis of the strain warns that jobs with high demands and low autonomy generate more strain,as opposed to jobs with low demands and high control, where the level of strain would be small.On the other hand, the axis of learning suggests that there is a type of challenging job with a favorableenvironment for career development when demands are high but also has a high degree of autonomyand implementation of their skills, as is possibly the case of this research.
The model proposed by Reference [5] originally contains two hypotheses. First, the strainhypothesis suggests that demanding activities with low control increase the risk of worker well-being,which is the effect of an additive and multiplicative character. Second, the buffer hypothesis emphasizesa character moderator that exerts job control on the relationship of job demand-strain. According toReference [30], the two scenarios are not alternatives but are complementary, resulting in an extensionof the hypothesis of the voltage buffer hypothesis.
As indicated above, in an extension of the original model, Reference [6] incorporated a secondbuffer factor of the job demands: Social support for both co-workers and supervisors. Given that thenature of the work of the accountants is based on teamwork, the dimension of social support in thiscontext is a particularly relevant research framework.
Figure 1. Model of Job Demand-Control-Support (JDCS) applied to the work of accountants.
2.1. Job Demands of Accountants
Accountancy firms are hierarchical and competitive entities to the point that several authors,such as Reference [31], believed that stress is a tool used intentionally by managers to achieve themaximum effectiveness from their subordinates in accounting firms. For example, the pressure of timeimproves the effectiveness of professional accountants, as Reference [32] observes, especially in thedecision-making process, since it causes them to focus only on relevant information. However,work overload and time pressures, far from improving the performance of the professionals,endanger the quality of the work. The duality of effects, positive and negative, that the scientificliterature has identified in relation to work overload is explained with the approach of the ArousalTheory, for which the relationship between stress and performance is U-shaped inverted, as pointedout in Reference [33]. As Reference [34] points out, the elimination of stress in accounting is a utopia,given the characteristics of this type of activity—for instance, seasonality linked to compliance withtrade regulations, tight deadlines (so that customers can give timely information to the markets),tight time and monetary budgets by the increased competitiveness of the sector, the complexity of
84
IJERPH 2018, 15, 2437
some decisions of the audit, manipulation of information by customers. However, scientific researchcan provide useful tools that contribute to coping and managing stress better.
The Stress Diagnosis Survey (SDS) of Reference [35] is one of the most used tools to analyze thedemands that cause greater stress to the accountants. The SDS considers two categories of stressors:Individual and organizational. Individual stress includes role conflict, role ambiguity, quantitativeand qualitative overload, time pressures, responsibility, professional careers and the scope of the work.Organizational factors include internal policy, development of human resources, compensation policy,participation, underutilization, style of supervision and organizational structure [36–38].
The model of Reference [23] is a reference for some work done later in the accountingfield [17,21,24]. Nevertheless, as is noted above, perhaps the theoretical framework that is moreaccepted to explain the influence of the employment context in the well-being of employees is theJDCS model. However, in the specific field of audit accounting, its use has been much more limited.Thus, the relationship between stressors and the quality of the work of audit under this frameworkis explained by Reference [39], noting that the quality of the audit work is not affected by stressfulsituations if it remains under control. These authors warn that the buffering effect does not occurin the first year in which a client is audited. This will manifest in successive years as experience isacquired with the customer since personal competencies are enhanced to address work that translatesinto less stress.
This research uses the classification of the job demands that Reference [23] discusses around threebroad categories of stressors: Work overload, role conflict and role ambiguity.
2.1.1. Work Overload
Work overload is observed the factor that most influences the deterioration of occupationalhealth [38]. This is produced by taking on a large number of engagements, the tight time allowanceto carry out the work or by the imposition of overly tight deadlines. If the prestige of the accountantincreases, the demand for their services increases too, resulting in the paradox that excess demand onactual capacity may harm the work quality [40].
Another troubling circumstance is that increasing competition forces price adjustment and reducesthe budgets of the implementation of the engagements. This can lead to two dysfunctional practices:Reduce the scope of procedures, again compromising the quality of the work; or underreportingtime [41–43]. Time pressure inversely affects the quality of work. Performing audit judgements thatentail a high level of subjectivity means that the professional accountant may be tempted to relievepressure by skewing his own judgement. In this way, professional accountants who work with moretime pressure assessed a lower risk of significant error in the audited financial statements, which leadsthem to decrease the intensity of the procedures and the workload [16,44]. In addition, reporting lessthan the actual number of hours worked (time underreporting) produces a double negative effect.On the one hand, planning future engagements considers the budget timetable of the previous year,thus conditioning the planning of future work. On the other hand, the evaluation of a professional’sperformance is distorted and is expected within an unrealistic time frame. Underreporting time isconsidered a more ethical strategy than devoting fewer hours than necessary when the budget is tootight [45].
Work overload also occurs when deadlines are so tight that they cause negative consequencesfor the quality of the work [46,47]. For example, professional accountants tended to consider lessimportant errors detected on tight deadlines, especially when these deadlines have been establishedby the own professional accountants [48]. The obligation to comply with the rule of law creates peaksand concentration of work, which result in work overload and higher role conflict, which leads toemotional exhaustion among professional accountants, as References [25,26] have shown.
85
IJERPH 2018, 15, 2437
2.1.2. Role Conflict
Economic effects arising from the financial information prepared by accountants can sometimeslead to conflicts of an ethical nature. For example, the auditors attempt to preserve relations withcustomers. Therefore, using findings that may have a negative influence on the client, their judgementstend to be more relaxed, especially if the work contains a high level of subjectivity (for example,judgements on the materiality of the deviations identified in the internal control [48]). Thus, as theclient portfolio of the professional accountant expands, the independence level increases, thus reducingthe role conflict but increasing the workload [49].
Role conflict is more likely to occur at lower levels of a professional career due to the pressurefrom superiors (managers and partners) on these individuals, which has come to be called “pressureby obedience”. This pressure may cause less-skilled team members to violate professional standardsto meet the demands of their superiors [50].
All of the above issues translate into greater role conflict, which, according to Reference [34],cause greater stress and lower job satisfaction, thus affecting the health of the accountants.
2.1.3. Role Ambiguity
Another factor that can affect the quality of the work of professional accountants is the lack ofunderstanding of the tasks to be carried out [15]. As indicated by Reference [31], the risk of significanterrors during the performance of work creates a sense of fear among professional accountants.This sensation may have both positive (e.g., stimulates professional diligence) and negative effects(since it can induce the adoption of defensive strategies). What does appear clear is that the accountantsexperience less comfort to perform more complex tasks than when they perform more routine tasks [51].
Undoubtedly, as Reference [34] proposed, all these elements of role ambiguity have a negativeinfluence on satisfaction and perception of performance.
2.2. Job Control
The negative effects that generate the high job demands can be buffered or intensified dependingon the degree of control that the accountant has on the activity. This control is highlighted mainly bytwo factors: The possibility of applying one’s own skills (skill discretion) and the level of autonomyover decisions that affect you (decision authority) [5]. In a recent study, professionals with greatercompetence and autonomy experienced less role ambiguity [52]. This circumstance occurs becausehigher levels of competition allowed attention to the complexity associated with the tasks of theprofession with less pressure. At the same time, these authors found that less autonomy reducedaccess to information, which resulted in greater ambiguity.
There is evidence that shows that the degree of job autonomy in decision-making, such as theability to decide one’s workload, moderates some variables related to occupational health, such asstress [53]. Although the work overload may cause adverse effects on the quality of the work, the factis that accountancy firms are impregnated with an organizational culture that accepts, encouragesand imposes high standards of work that translate into levels of high demand. Despite this, there isempirical evidence showing that if the accountant chooses the workload voluntarily, harmful effectson the quality of the work are not produced.
Job autonomy in the field of auditing can cause dysfunctional behaviours; in fact, in a sample ofChinese professional accountants, the dysfunctional behaviour increased because the professional hadgreater autonomy [54]. In a positive sense, these authors also noted that accountants perceived jobautonomy as a sign of support from the organization, which resulted in greater job satisfaction.
The pressure caused by tight time budgets also leads to dysfunctional behaviours. However,these vary at different hierarchical levels and are more likely in positions requiring less experience—forexample, in roles with less autonomy in the activity planning [46]. In addition, these authors observed
86
IJERPH 2018, 15, 2437
that the perception of a greater degree of involvement in time programming has a positive influenceon the achievement of the budgetary targets.
On the other hand, control over the activity also manifests itself when accountants can fullydisplay their abilities. This situation makes work exciting and encourages accountants to do theirbest work rather than adopting dysfunctional behaviours [47]. In this way, because the content of thetasks corresponds to the level of professional development, stressors are cushioned by the incentivethat involves applying one’s own professional competencies. Professional judgement develops asexperience is gained. In the early professional stages, tasks are more structured and require a levelof minor professional judgement. Over time, the responsibility of professional accountants on morecomplex decisions leads to higher ambiguity. Without a doubt, the experience provides greater comfortin complex decision-making, in keeping with the principles of Social Cognitive Theory. The experienceleads to better assessments of the risk of significant errors [44,55], which determines greater controlof the activities and leads to highly stimulating work when personal skills are applied to help solvecomplex situations. Finally, because experience is gained when a customer increases knowledge aboutsuch situations [56,57], improving control over activities and diluting the negative effects of workoverload may result in the quality of the work of the professional accountant [58].
2.3. Social Support
Several authors believe that quality relations between the accountancy firms and their professionalsdevelop more intensely when they perceived a fair deal and when they feel supported by theorganization, which reduces burnout and intention to leave the organization [19,22].
Collectivism exerts a positive influence on the level of well-being of professional accountants,which is measured by its three components: Job satisfaction, work-life balance and life satisfaction [18].For these authors, as the engagements become more complex, professional accountants developa feeling of belonging to the work and a spirit of team-oriented organization. In this context,the behaviour of superiors is influential, since they create an organizational culture, which defineswhat practices are encouraged and desired by the firm. Thus, if superiors expressly and honestly rejectthe practices that generate stress (such as the underreporting the hours spent in completing work),subordinates feel that their stress levels are alleviated.
In this sense, there is a negative relationship between job autonomy and counterproductivebehaviours, an effect that is compensated for and reversed by a set of factors, among which perceivedorganizational support stands out [54]. This circumstance suggests that the negative consequencesassociated with job autonomy are mitigated in organizations that promote positive attitudes amongtheir employees. In addition, firms that promote values and ethical behaviour increase the level ofsocialization of its professionals, significantly reducing dysfunctional practices that could arise fromtime pressures [45].
Social support depends greatly on one’s superiors. The style of leadership of these superiors hasa direct effect on the performance of teams and in superior-subordinate relations, even in relationsbetween the members of the team. Team performance improves when superiors stimulate innovation,serve the personal needs of team members, offer positive reinforcement and conform to the budgetsschedules [59]. More recently, in an investigation on accountants, leaders who promote a strong teamculture achieve smoother communication and greater cohesion among members [60].
Feelings emerge in opposite directions when subordinates do not feel supported by theirimmediate supervisor. This is something that happens all too often in accountancy firms dueto the feeling of fear that is cultivated more or less informally with the intention of stimulatingmonitoring, promoting self-improvement, mitigating the anaesthetizing effect of habit and maintainingreputation [31]. This feeling is more unusual because auditors are accountable in more instances andwhen more complex tasks become especially intense [51].
87
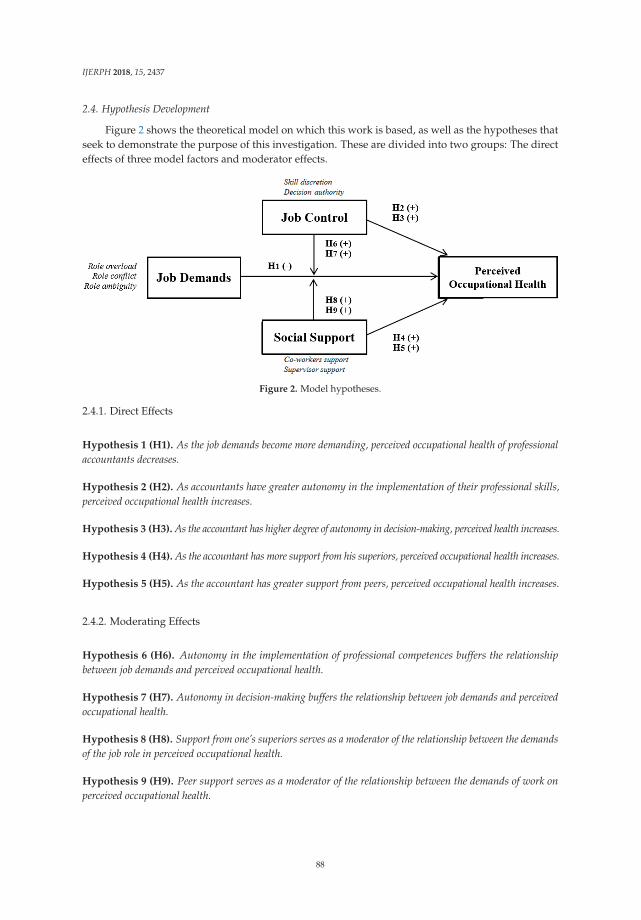
IJERPH 2018, 15, 2437
2.4. Hypothesis Development
Figure 2 shows the theoretical model on which this work is based, as well as the hypotheses thatseek to demonstrate the purpose of this investigation. These are divided into two groups: The directeffects of three model factors and moderator effects.
Figure 2. Model hypotheses.
2.4.1. Direct Effects
Hypothesis 1 (H1). As the job demands become more demanding, perceived occupational health of professionalaccountants decreases.
Hypothesis 2 (H2). As accountants have greater autonomy in the implementation of their professional skills,perceived occupational health increases.
Hypothesis 3 (H3). As the accountant has higher degree of autonomy in decision-making, perceived health increases.
Hypothesis 4 (H4). As the accountant has more support from his superiors, perceived occupational health increases.
Hypothesis 5 (H5). As the accountant has greater support from peers, perceived occupational health increases.
2.4.2. Moderating Effects
Hypothesis 6 (H6). Autonomy in the implementation of professional competences buffers the relationshipbetween job demands and perceived occupational health.
Hypothesis 7 (H7). Autonomy in decision-making buffers the relationship between job demands and perceivedoccupational health.
Hypothesis 8 (H8). Support from one’s superiors serves as a moderator of the relationship between the demandsof the job role in perceived occupational health.
Hypothesis 9 (H9). Peer support serves as a moderator of the relationship between the demands of work onperceived occupational health.
88
IJERPH 2018, 15, 2437
3. Design of the Empirical Research
3.1. Sample
The data used for the development of this research were obtained from the sixth EuropeanWorking Conditions Survey, which was developed by the European Foundation for the Improvementof the Conditions of Life and Work in 2015 [61]. This survey analyzes the working conditions in the 27countries of the European Union, providing valuable information on different aspects of the workingconditions in Europe: Attitudes, perceptions and behavior of employees. The population consists ofall persons aged 15 or above who are employed or self-employed and whose usual place of residenceis in one of the member states of the European Union. The field work was carried out in 2015 based on43,850 valid surveys.
To achieve the objectives of the present research, a sub-sample of 739 professional accountantswere extracted using codes 2411 (accountants) and 3313 (accounting associate professionals) of theInternational Standard Classification of Occupations.
Of the respondents, 75.2% are women, while the remaining 24.8% are men. The average age ofthe professional accountants is 43.9 years. Most respondents working in the private sector (82.5%)with a contract mainly have indefinite work contracts (88.8%) that are an average of 10.9 years old.With respect to the main variable of this research, it should be noted that 17.7% of respondentsbelieve that the development of the work directly affects their health, compared to 82.3% whoconsidered otherwise.
3.2. Measures
The dependent variable of this research is the perceived occupational health of professionalaccountants. A single item measures this variable: Whether the professionals perceive that their workdirectly affects their health. The respondents had three response options: No; yes, mainly positively;and yes, mainly negatively.
The job demands were measured using 7 items grouped into three categories: Role overload (e.g.,“Does your job involve working with tight deadlines?”), role ambiguity (e.g., “Do you know what isexpected of you at work?”) and role conflict (e.g., “Does your job involve being in situations that areemotionally disturbing for you?”).
The scale of job control integrates 4 items that measure skill discretion (e.g., “Does your jobinvolve solving unforeseen problems on your own?”) and 7 items that assess the decision authority(e.g., “Are you consulted before objectives are set for your work?” or “Do you have a say in the choiceof your work colleagues?”).
Finally, the scale of social support measures support from superiors with 7 items(e.g., “Your immediate supervisor provides useful feedback on your work” or “Your immediateboss encourages and supports your development”), while the support of co-workers is determined bya unique item that ask directly if “your colleagues help and support you.”
3.3. Methodology
The methodology proposed in this research is developed in three phases: Preparation of theconstructs of the first order from the application of a factor analysis, analysis of neural networks withthe Extreme Learning Machine algorithm, and finally, interpretation of the resulting model using asensitivity analysis.
A factor analysis was run with a rotation promax on the original data set. Promax rotationallows the factors obtained to be correlated (unlike the varimax rotation or orthogonal rotation).Following the recommendations of Reference [62], items that were not correlated with any specificfactor were excluded from the analysis, while the loading used for other factor was 0.40. Variables thatare grouped without any logical meaning according to the nature of the problem were also eliminated.The factor analysis revealed the existence of first-order factors for the constructs: Job Demands (JD),
89
IJERPH 2018, 15, 2437
Skill Discretion (SD), Decision Authority (DA) and Supervisor Support (SS). The construct Co-WorkerSupport (WS) was composed of a single item. Since the input variables were represented in differentranges, it was decided to standardize them to a [0, 1] scale linearly according to the function min (max).
The main analysis was carried out with artificial neural networks. This method has shownsatisfactory results in solving complex problems and constitutes a useful tool in data analysisof different areas or disciplines: Medicine, economics, engineering, biology and psychology [63].Increasingly, more authors appreciate their applicability with regard to models derived fromclassic statistics [64,65]. From a methodological perspective, the priority themes that apply neuralnetworks deal with the classification of patterns (classification and prediction) and approximation offunctions [63]. It is possible that the growing interest in neural networks lies in its capacity for thetreatment of nonlinear problems [66], since better yields are achieved because there is independencefrom the fulfilment of the theoretical assumptions of traditional techniques. Neural networks haveproven to be an effective tool for classifying cases under the non-linearity hypothesis. A neural networkis a linear model in which the basis functions can be a sigmoid type. In the case that concerns us,the analysis was performed using a neural network in a single layer, which allows for modellinginteractions of an order greater than two (and not only multiplicative); interactions will be key toanalyzing the moderator effect of job control and social support. The parameters of the model havebeen estimated using the algorithm Extreme Learning Machine [67]. In this algorithm, the weightsof the input layer to the hidden layer (which models the nonlinear part of the system) are initializedrandomly. In addition, the parameters that bind the hidden layer with the layer’s output are estimatedanalytically after solving a problem of least squares with regularization.
To finish the investigation, a sensitivity analysis was conducted. The main disadvantage of themodels of neural networks is that they are considered a “black box” type, since they are effective atfinding hidden relationships between inputs and outputs with a high capacity for approximation,but they do not provide information on how they have managed to do so. This limitation causes manyacademics to scrap the use of these models in their research. A sensitivity analysis is used to overcomethis restriction. The present study uses a global sensitivity analysis inspired by a decompositionfunctional ANOVA [68]. This method makes it possible to decompose the nonlinear function on a setof elements associated with the parts of the independent variables, the interactions of the variable twoby two, to the interactions between variables three to three and so on until all interactions of the inputvariables are analyzed. This methodology was already proposed for the classification problem andhas been adapted ad hoc in this study for the case of regression [69]. To evaluate the stability of themethod, an analysis with two subsamples that gave rise to two estimates of parameters of sensitivity(estimate 1 and 2 estimate) was performed.
4. Results
In the case of factor analysis, the construct Job Demands (JD) was reduced to a single componentthat explained 35.38% of total variance (the other elements presented eigenvalues below one).The construct Job Control (JC) was composed of two elements: Skill Discretion (SD) and DecisionAuthority (DA). These are summarized in two factors that explained 38.55% and 46.84% of variance,respectively. The construct Social Support (SS) was composed, as explained above, by two elements:Supervisor Support (SS) and Co-Worker Support (WS). The first is represented by a factor that explained75.54% of variance, while the second was a construct consisting of a single item.
First, we analyze the mean square error (MSE) of the linear regression, including interactionsconsidered in this research, compared to the model of the trained neural network according to ExtremeLearning Machine. The classical model earned an MSE of 31.8862 and a neural network 11.4588 MSE,which justifies that the neural network model summarizes data more effectively than the classicmodel. The result of the regularization was cross-validated, resulting in a value of 10E3. In addition,the number of hidden layer neurons was fixed at 500.
90
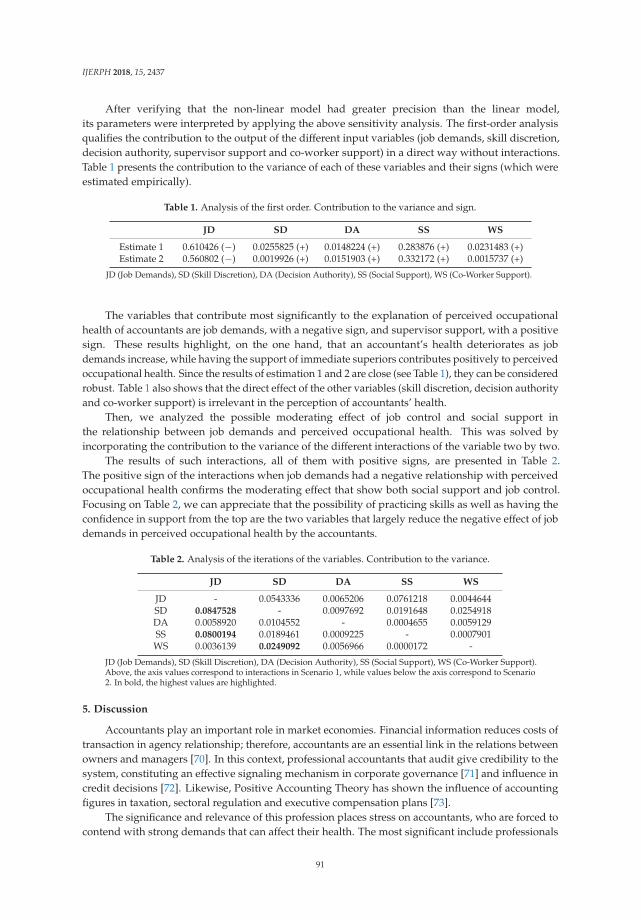
IJERPH 2018, 15, 2437
After verifying that the non-linear model had greater precision than the linear model,its parameters were interpreted by applying the above sensitivity analysis. The first-order analysisqualifies the contribution to the output of the different input variables (job demands, skill discretion,decision authority, supervisor support and co-worker support) in a direct way without interactions.Table 1 presents the contribution to the variance of each of these variables and their signs (which wereestimated empirically).
Table 1. Analysis of the first order. Contribution to the variance and sign.
JD SD DA SS WS
Estimate 1 0.610426 (−) 0.0255825 (+) 0.0148224 (+) 0.283876 (+) 0.0231483 (+)Estimate 2 0.560802 (−) 0.0019926 (+) 0.0151903 (+) 0.332172 (+) 0.0015737 (+)
JD (Job Demands), SD (Skill Discretion), DA (Decision Authority), SS (Social Support), WS (Co-Worker Support).
The variables that contribute most significantly to the explanation of perceived occupationalhealth of accountants are job demands, with a negative sign, and supervisor support, with a positivesign. These results highlight, on the one hand, that an accountant’s health deteriorates as jobdemands increase, while having the support of immediate superiors contributes positively to perceivedoccupational health. Since the results of estimation 1 and 2 are close (see Table 1), they can be consideredrobust. Table 1 also shows that the direct effect of the other variables (skill discretion, decision authorityand co-worker support) is irrelevant in the perception of accountants’ health.
Then, we analyzed the possible moderating effect of job control and social support inthe relationship between job demands and perceived occupational health. This was solved byincorporating the contribution to the variance of the different interactions of the variable two by two.
The results of such interactions, all of them with positive signs, are presented in Table 2.The positive sign of the interactions when job demands had a negative relationship with perceivedoccupational health confirms the moderating effect that show both social support and job control.Focusing on Table 2, we can appreciate that the possibility of practicing skills as well as having theconfidence in support from the top are the two variables that largely reduce the negative effect of jobdemands in perceived occupational health by the accountants.
Table 2. Analysis of the iterations of the variables. Contribution to the variance.
JD SD DA SS WS
JD - 0.0543336 0.0065206 0.0761218 0.0044644SD 0.0847528 - 0.0097692 0.0191648 0.0254918DA 0.0058920 0.0104552 - 0.0004655 0.0059129SS 0.0800194 0.0189461 0.0009225 - 0.0007901WS 0.0036139 0.0249092 0.0056966 0.0000172 -
JD (Job Demands), SD (Skill Discretion), DA (Decision Authority), SS (Social Support), WS (Co-Worker Support).Above, the axis values correspond to interactions in Scenario 1, while values below the axis correspond to Scenario2. In bold, the highest values are highlighted.
5. Discussion
Accountants play an important role in market economies. Financial information reduces costs oftransaction in agency relationship; therefore, accountants are an essential link in the relations betweenowners and managers [70]. In this context, professional accountants that audit give credibility to thesystem, constituting an effective signaling mechanism in corporate governance [71] and influence incredit decisions [72]. Likewise, Positive Accounting Theory has shown the influence of accountingfigures in taxation, sectoral regulation and executive compensation plans [73].
The significance and relevance of this profession places stress on accountants, who are forced tocontend with strong demands that can affect their health. The most significant include professionals
91
IJERPH 2018, 15, 2437
who work with tight deadlines, with significant seasonality (since most companies issue financialreports at the same time, coinciding with the calendar year) and in an environment of extremecompetition, which reduces prices and increases pressure on resource allocation.
In this context of strain, the accountant must “juggle” to put into practice the independence,judgement, and professional skepticism that international auditing agencies require. Therefore,any deterioration in the health of these professionals, which alter their emotional balance,will decisively affect the judgement of the professional accountant and the quality of their work.
The present paper is relevant in the European context and investigates the effects of job demandsin occupational health perceived by the accountants, as well as the moderator role that job controlexerts over work and the social support of colleagues and superiors. The results, after the applicationof a neural network model, confirm some of the hypotheses raised in this research, both with regard tothe outcomes and the effects of the moderators.
On the one hand, in relation to the direct effects of the job demands, job control and social supporton perceived occupational health (H1 to H5), it has been shown that job demands are the factor thatbest explains the deterioration of accountants’ health, which is in line with the prior literature that hasverified the existence of this relationship in other manifestations of loss of health, such as burnout [38].The other variable that exerts an important influence on perceived occupational health is supervisorsupport—in this case, in a positive sense. This result is consistent with the model of an organizationstaffed by professional accountants and is based mainly on professional talent. The implementation ofprofessional talent requires the support and trust of the organization. The results of this study highlightbetter occupational health among professionals who receive explicit support from their superiors.On the other hand, job control does not exert a significant direct effect on perceived occupationalhealth, possibly because the work of the accountants is structured and formalized, leaving little roomfor individual initiative.
Otherwise, the JDCS model discusses a number of mechanisms that contribute to cushioningthe pernicious effect of the job demands on perceived occupational health. The results derived fromthe neural network model suggest that these mechanisms indeed improve the perception of one’sown occupational health—specifically, the implementation of vocational skills and perception ofgreater support of hierarchical superiors. Accounting firms are characterized by their high levelof hierarchy and fierce pyramidal structure. This design requires a high degree of staff turnover,which allows the channels of promotion to be open [74]. Since accountants’ immediate superiorsevaluate them, support from superiors is one of the mechanisms for recognition with greater impacton the development of a healthy work environment [41]. In a qualitative study, the importance ofsuperiors in the self-esteem of subordinates is underlined: “To hear my senior say I’ve done a goodjob is a real boost to my morale!”. The comment of this assistant illustrates the process governing herapproach to auditing: She was congratulated for her work, and she takes the compliment personally(“I’m doing a good job”), thus strengthening her identity, and this prospect is precisely what motivatesher to do her best [31]. To fulfil their expectations in terms of self-achievement, some auditors gofurther. Undoubtedly, support of one’s superiors and a feeling of justice decrease the feeling of burnoutamong accountants [19,22]. In addition, the confidence of being supported by the organization and itsmanagers in a competitive environment where lawsuits are frequent contributes to a vital balance [18].
The other variable with a significant moderating effect in the relationship between job demandand perceived occupational health is the possibility of practicing personal skills (skill discretion).The analysis of this effect, which has much to do with the concept of hardiness, is especially relevantin the profession discussed in this research. People with hardy personalities perceive stimulatingand challenging situations as stressful (commitment dimension), probably because they believe thatstress factors are controllable thanks to their professional skills (skill discretion), thus transformingrisk into an opportunity for personal growth (challenge dimension). Commitment and challengeshow a significant relationship with exhaustion, one of the fundamental dimensions of burnout,as point out Reference [26]. This result offers the possibility of aligning the needs of firms to respond
92
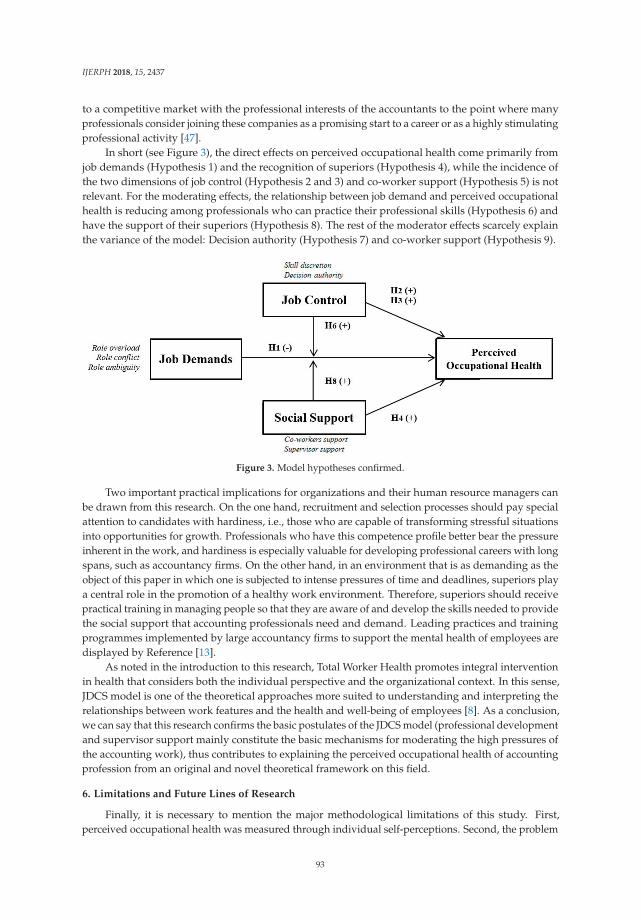
IJERPH 2018, 15, 2437
to a competitive market with the professional interests of the accountants to the point where manyprofessionals consider joining these companies as a promising start to a career or as a highly stimulatingprofessional activity [47].
In short (see Figure 3), the direct effects on perceived occupational health come primarily fromjob demands (Hypothesis 1) and the recognition of superiors (Hypothesis 4), while the incidence ofthe two dimensions of job control (Hypothesis 2 and 3) and co-worker support (Hypothesis 5) is notrelevant. For the moderating effects, the relationship between job demand and perceived occupationalhealth is reducing among professionals who can practice their professional skills (Hypothesis 6) andhave the support of their superiors (Hypothesis 8). The rest of the moderator effects scarcely explainthe variance of the model: Decision authority (Hypothesis 7) and co-worker support (Hypothesis 9).
Figure 3. Model hypotheses confirmed.
Two important practical implications for organizations and their human resource managers canbe drawn from this research. On the one hand, recruitment and selection processes should pay specialattention to candidates with hardiness, i.e., those who are capable of transforming stressful situationsinto opportunities for growth. Professionals who have this competence profile better bear the pressureinherent in the work, and hardiness is especially valuable for developing professional careers with longspans, such as accountancy firms. On the other hand, in an environment that is as demanding as theobject of this paper in which one is subjected to intense pressures of time and deadlines, superiors playa central role in the promotion of a healthy work environment. Therefore, superiors should receivepractical training in managing people so that they are aware of and develop the skills needed to providethe social support that accounting professionals need and demand. Leading practices and trainingprogrammes implemented by large accountancy firms to support the mental health of employees aredisplayed by Reference [13].
As noted in the introduction to this research, Total Worker Health promotes integral interventionin health that considers both the individual perspective and the organizational context. In this sense,JDCS model is one of the theoretical approaches more suited to understanding and interpreting therelationships between work features and the health and well-being of employees [8]. As a conclusion,we can say that this research confirms the basic postulates of the JDCS model (professional developmentand supervisor support mainly constitute the basic mechanisms for moderating the high pressures ofthe accounting work), thus contributes to explaining the perceived occupational health of accountingprofession from an original and novel theoretical framework on this field.
6. Limitations and Future Lines of Research
Finally, it is necessary to mention the major methodological limitations of this study. First,perceived occupational health was measured through individual self-perceptions. Second, the problem
93
IJERPH 2018, 15, 2437
of social desirability is a setback of studies that ask about how labor conditions affect employees.Self-perception and the social desirability may cause bias in responses. Third, the relationship betweenthe variables being investigated cannot be considered causally since we studied cross-sectional data,not experimental data. Finally, the study is limited to the scope of the European Union. Future studiesshould investigate the influence of the JDCS model in professional accountants who develop theiractivities in other cultural contexts.
7. Conclusions
Scarce studies have explored the main effects and multiplicative model in relation to theperceived occupational health of professional accountants. The Job Demand-Control and JobDemand-Control-Support (JDCS) models adopted in this article are an appropriate theoreticalframework to analyze the relationship between the characteristics of labor and occupational health.
In conclusion, the obtained results confirm the relationship between certain stress factors thataffect the health of the accountants, as well as the direct effect that has the recognition of superiorsin occupational health. Additionally, the results highlight the moderating effect of professionaldevelopment and the support of superiors on the job’s demands.
The implications of these findings could assist human resource managers in facilitating, to someextent, good social relationships amongst accountants.
Author Contributions: For research articles with several authors, a short paragraph specifying their individualcontributions must be provided. The following statements should be used “Conceptualization, H.M.-S., A.A.-M.and J.J.D.P.-A.; Methodology, F.F.-N.; Software, F.F.-N.; Validation, F.F.-N.; Formal Analysis, H.M.-S., A.A.-M.;Investigation, H.M.-S., A.A.-M. and J.J.D.P.-A.; Resources, H.M.-S. and J.J.D.P.-A.; Data Curation, A.A.-M. andJ.J.D.P.-A. Writing-Original Draft Preparation, J.J.D.P.-A.; Writing-Review & Editing, H.M.-S. and A.A.-M.;Visualization, H.M.-S. and A.A.-M.; Supervision, H.M.-S. and A.A.-M. and F.F.-N.; Project Administration,A.A.-M.; Funding Acquisition, N/A”, please turn to the CRediT taxonomy for the term explanation. Authorshipmust be limited to those who have contributed substantially to the work reported.
Funding: This research received no external funding.
Acknowledgments: We thank Eurofound for providing the data set for this research. Reference [60], EuropeanWorking Conditions Survey Integrated Data File, 1991–2015, [data collection], UK Data Service. SN: 7363,https://doi.org/10.5255/UKDA-SN-7363-4.
Conflicts of Interest: The authors declare no conflict of interest.
References
1. Shain, M.; Kramer, D. Health promotion in the workplace: Framing the concept; reviewing the evidence.Occup. Environ. Med. 2004, 61, 643–648. [CrossRef] [PubMed]
2. World Health Organization (WHO). Healthy Workplaces: A WHO Global Model for Action; World HealthOrganization: Geneva, Switzerland, 2010; Available online: http://www.who.int/occupational_health/publications/healthy_workplaces_model_action.pdf (accessed on 12 September 2018).
3. NIOSH. Fundamentals of Total Worker Health Approaches: Essential Elements for Advancing Worker Safety, Health,and Well-Being; U.S. Publication No. 2017-112; Department of Health and Human Services, Centers forDisease Control and Prevention, National Institute for Occupational Safety and Health—DHHS (NIOSH):Cincinnati, OH, USA, 2016. Available online: https://www.cdc.gov/niosh/docs/2017-112/pdfs/2017_112.pdf?id=10.26616/NIOSHPUB2017112 (accessed on 12 September 2018).
4. Schulte, P.; Pandalai, S.; Wulsin, V.; HeeKyonung, C. Interaction of Occupational and Personal Risk Factorsin Workforce Health and Safety. Am. J. Public Health 2012, 102, 434–448. [CrossRef] [PubMed]
5. Karasek, R. Job demands, job decision latitude, and mental strain: Implications for job redesign.Adm. Sci. Quart. 1979, 24, 285–308. [CrossRef]
6. Johnson, J.V.; Hall, E.M. Job strain, work place social support, and cardiovascular disease: A cross-sectionalstudy of a random sample of the Swedish working population. Am. J. Public Health 1988, 78, 1336–1342.[CrossRef] [PubMed]
7. Karasek, R.A.; Theorell, T. Healthy Work: Stress, Productivity and the Reconstruction of Working Life; Basic Books:New York, NY, USA, 1990.
94
IJERPH 2018, 15, 2437
8. Ibrahim, R.Z.A.R.; Ohtsuka, K. Review of the job demand-control and job demand-control-support models:Elusive moderating predictor effects and cultural implications. Southeast Asia Psychol. J. 2014, 1, 10–21.
9. Haly, M.K. A review of contemporary research on the relationship between occupational stress and socialsupport: Where are we now? Aust. J. Organ. Psychol. 2009, 2, 44–63. [CrossRef]
10. Ford, M.T.; Cerasoli, C.P.; Higgins, J.A.; Decesare, A.L. Relationships between psychological, physical,and behavioural health and work performance: A review and meta-analysis. Work Stress 2011, 25, 185–204.[CrossRef]
11. Janssen, P.P.; Bakker, A.B.; De Jong, A. A test and refinement of the Demand–Control–Support Model in theconstruction industry. Int. J. Stress Manag. 2001, 8, 315–332. [CrossRef]
12. Eurofound. Occupational Profiles in Working Conditions: Identification of Groups with Multiple Disadvantages.Available online: https://www.eurofound.europa.eu/publications/report/2014/working-conditions/occupational-profiles-in-working-conditions-identification-of-groups-with-multiple-disadvantages(accessed on 9 September 2018).
13. Skoulding, L. What Are the Big Four Doing to Support Mental Health in the Workplace. Accountancy Age.May 2018. Available online: https://www.accountancyage.com/2018/05/17/what-are-the-big-four-doing-to-support-mental-health-in-the-workplace/ (accessed on 29 October 2018).
14. Utary, A.R. Effect of Time Budget Pressure on Dysfunctional Audit and Audit Quality, Informationtechnology as Moderator. Int. J. Econ. Res. 2014, 11, 689–698.
15. Svanström, T. Time Pressure, Training Activities and Dysfunctional Auditor Behaviour: Evidence from SmallAudit Firms. Int. J. Audit. 2016, 20, 40–51. [CrossRef]
16. Broberg, P.; Tagesson, T.; Argento, D.; Gyllengham, N.; Mårtensson, O. Explaining the influence of timebudget pressure on audit quality in Sweden. J. Manag. Gov. 2017, 21, 331–350. [CrossRef]
17. Jones, A.; Strand Norman, C.; Wier, B. Healthy Lifestyle as a Coping Mechanism for Role Stress in PublicAccounting. Behav. Res. Account. 2010, 22, 21–41. [CrossRef]
18. Umans, T.; Broberg, T.; Schmidt, M.; Nilsson, P.; Olsson, E. Feeling well by being together: Study of Swedishauditors. Work 2016, 54, 79–86. [CrossRef] [PubMed]
19. Herda, D.N.; Lavelle, J.J. The Auditor-Audit Firm Relationship and Its Effect on Burnout and TurnoverIntention. Account. Horiz. 2012, 26, 707–723. [CrossRef]
20. Pradana, A.; Salehudin, I. Work overload and turnover intention of junior auditors in Greater Jakarta,Indonesia. South East Asian J. Manag. 2015, 9, 108–124.
21. Chong, V.K.; Monroe, G.S. The impact of the antecedents and consequences of job burnout on junioraccountants’ turnover intentions: A structural equation modelling approach. Account. Financ. 2015, 55,105–132. [CrossRef]
22. Cannon, N.H.; Herda, D.N. Auditors’ Organizational Commitment, Burnout, and Turnover Intention:A Replication. Behav. Res. Account. 2016, 28, 69–74. [CrossRef]
23. Fogarty, T.J.; Singh, J.; Rhoads, G.K.; Moore, R.K. Antecedents and Consequences of Burnout in Accounting:Beyond the Role Stress Model. Behav. Res. Account. 2000, 12, 31–67.
24. Almer, E.D.; Kaplan, S.E. The Effects of Flexible Work Arrangements on Stressors, Burnout, and BehavioralJob Outcomes in Public Accounting. Behav. Res. Account. 2002, 14, 1–34. [CrossRef]
25. Sweeney, J.T.; Summers, S.L. The effect of busy season workload on public accountants’ job burnout.Behav. Res. Account. 2002, 14, 223–245. [CrossRef]
26. Law, D.W.; Sweeney, J.T.; Summers, S.L. An Examination of the influences of contextual and individualvariables on public accountants’ exhaustation. Adv. Account. Behav. Res. 2016, 11, 129–153.
27. Rafferty, Y.; Friend, R.; Landsbergis, P.A. The association between job skill discretion, decision authority andburnout. Work Stress 2001, 15, 73–85. [CrossRef]
28. De Jonge, J.; Dollard, M.F.; Dormann, C.; Le Blanc, P.M.; Houtman, I.L.D. The Demand-Control Model:Specific demands, specific control, and well-defined groups. Int. J. Stress Manag. 2000, 7, 269–287. [CrossRef]
29. Brouwers, A.; Evers, W.J.G.; Tomic, W. Self-efficacy in eliciting social support and burnout amongsecondary-school teachers. J. Appl. Soc. Psychol. 2001, 32, 1474–1491. [CrossRef]
30. Hausser, J.A.; Mojzisch, A.; Niesel, M.; Schulz-Hardt, S. Ten years on: A review of recent research on the JobDemand-Control (-Support) model and psychological well-being. Work Stress 2010, 24, 1–35. [CrossRef]
31. Guénin-Paracini, H.; Marsch, B.; Marché Paillé, A. Fear and risk in the audit process. Account. Organ. Soc.2014, 39, 264–288. [CrossRef]
95
IJERPH 2018, 15, 2437
32. Glover, S.M. The Influence of Time Pressure and Accountability on Auditors’ Processing of NondiagnosticInformation. J. Account. Res. 1997, 35, 213–226. [CrossRef]
33. Pietsch, C.P.; Messier, W.F., Jr. The Effects of Time Pressure on Belief Revision in Accounting: A Review ofRelevant Literature within a Pressure-Arousal-Effort-Performance Framework. Behav. Res. Account. 2017, 29,51–71. [CrossRef]
34. Rebele, J.E.; Michaels, R.E. Independent Auditors’ Role Stress: Antecedents, Outcome, and ModeratingVariables. Behav. Res. Account. 1990, 2, 124–153.
35. Ivancevich, J.M.; Matteson, M.T. Stress Diagnostic Survey; University of Houston: Houston, TX, USA, 1983.36. Collins, K.M. Stress and departures from the public accounting profession: A study of gender differences.
Account. Horiz. 1993, 7, 29–38.37. Larson, L.L.; Meier, H.H.; Poznanski, P.J.; Murff, E.J.T. Concepts and Consequences of Internal Auditor Job
Stress. J. Account. Financ. Res. 2004, 12, 35–46.38. Larson, L.L.; Tipton Murff, E.J. An Analysis of Job Stress Outcomes among Bank Internal Auditors.
Bank Account. Financ. 2006, 19, 39–43.39. Yan, H.; Xie, S. How does auditors’ work stress affect audit quality? Empirical evidence from the Chinese
stock market. China J. Account. Res. 2016. [CrossRef]40. Pritchard, A.C.; Ferris, S.P.; Jagannathan, J. Too Busy to Mind the Business? Monitoring by Directors with
Multiple Board Appointments. J. Financ. 2003, 58, 1087–1111. [CrossRef]41. Pierce, B.; Sweeney, B. Cost–Quality Conflict in Audit Firms: An Empirical Investigation. Eur. Account. Rev.
2004, 13, 415–441. [CrossRef]42. Nehme, R.; Al Mutawa, A.; Jizi, M. Dysfunctional Behavior of External Auditors. The collision of time
budget and time deadline. Evidence from developing country. J. Dev. Areas 2016, 50, 373–388. [CrossRef]43. Baldacchino, P.J.; Tabone, N.; Agius, J.; Bezzina, F. Organizational Culture, Personnel Characteristics and
Dysfunctional Audit Behavior. IUP J. Account. Res. Audit Pract. 2016, 15, 34–63.44. Sayed Hussin, S.A.H.; Iskandard, T.M.; Saleh, N.M.; Jaffar, R. Professional Skepticism and Auditors’
Assessment of Misstatement Risks: The Moderating Effects of Experience and Time Budget Pressure.Econ. Sociol. 2017, 10, 225–250. [CrossRef] [PubMed]
45. Espinosa-Pike, M.; Barrainkua, I. El efecto de los valores profesionales y la cultura organizativa en larespuesta de los auditores a las presiones de tiempo. Span. J. Financ. Account. 2017, 46, 507–534. [CrossRef]
46. McNamara, S.M.; Liyanatachchi, G.A. Time Budget pressure and auditor dysfunctional behaviour within anoccupational stress model. Account. Bus. Public Interest 2008, 7, 1–43.
47. Umar, M.; Sitorus, S.M.; Surya, R.L.; Shauki, E.R.; Diyanti, V. Pressure, Dysfunctional Behavior, FraudDetection and Role of Information Technology in the Audit Process. Aust. Account. Bus. Financ. J. 2017, 11,102–115. [CrossRef]
48. Bennett, G.B.; Hartfield, R.C. Do Approaching Deadlines Influence Auditors’ Materiality Assessments?Audit. J. Pract. Theory 2017, 36, 29–48. [CrossRef]
49. DeAngelo, L. Auditor size and audit quality. J. Account. Econ. 1981, 3, 189–199. [CrossRef]50. DeZoort, F.T.; Lord, A.T. An Investigation of Obedience Pressure Effects in Auditor’ Judgments.
Behav. Res. Account. 1994, 6, 1–30.51. Bagley, P.L. Negative Affect: A Consequence of Multiple Accountabilities in Auditing. Audit. J. Pract. Theory
2010, 29, 141–157. [CrossRef]52. Fazli, S.; Muhammaddun, Z.; Ahmad, A. The Effects of Personal Organizational Factors on Role Ambiguity
amongst Internal Auditors. Int. J. Audit. 2014, 18, 105–114. [CrossRef]53. Goodwin, J.; Wu, D. What is the Relationship between Audit Partner Busyness and Audit Quality?
Contemp. Account. Res. 2015, 33, 341–377. [CrossRef]54. Brink, A.G.; Emerson, D.J.; Yang, L. Job Autonomy and Counterproductive Behaviors in Chinese Accountants:
The Role of Job-Related Attitudes. J. Int. Account. Res. 2016, 15, 115–131. [CrossRef]55. Knapp, C.A.; Knapp, M.C. The effects of experience and explicit fraud risk assessment in detecting fraud
with analytical procedures. Account. Organ. Soc. 2001, 26, 25–37. [CrossRef]56. Chen, C.-Y.; Lin, C.-J.; Lin, Y.-C. Audit Partner Tenure, Audit Firm Tenure, and Discretionary Accruals:
Does Long Auditor Tenure Impair Earnings Quality? Contemp. Account. Res. 2008, 25, 415–445. [CrossRef]57. Gul, F.A.; Fung, S.; Jaggi, B. Earnings quality: Some evidence on the role of auditor tenure and auditors’
industry expertise. J. Account. Econ. 2009, 47, 265–287. [CrossRef]
96
IJERPH 2018, 15, 2437
58. Gul, F.A.; Ma, S.; Lai, K. Busy Auditors, Partner-Client Tenure, and Audit Quality. Evidence from anEmerging Market. J. Int. Account. Res. 2017, 16, 83–105. [CrossRef]
59. Pratt, J.; Jiambalvo, J. Relationships between leader behavior and audit team performance.Account. Organ. Soc. 1981, 6, 133–142. [CrossRef]
60. Nelson, M.W.; Proell, C.A.; Randel, A.E. Team-Oriented Leadership and Auditors’ Willingness to RaiseAudit Issues. Account. Rev. 2016, 91, 1781–1805. [CrossRef]
61. Eurofound. European Working Conditions Survey Integrated Data File, 1991–2015, [Data Collection]; SN: 7363;UK Data Service: Colchester, UK, 2017. [CrossRef]
62. Laher, S. Using exploratory factor analysis in personality research: Best-practice recommendations. SA J.Ind. Psychol. 2010, 36, 1–7. [CrossRef]
63. Cajal, B.; Jiménez, R.; Losilla, J.M.; Montaño, J.J.; Navarro, J.B.; Palmer, A.; Pitarque, A.; Portell, M.I.;Rodrigo, M.F.; Ruíz, J.C.; et al. Las redes neuronales artificiales en psicología: Un estudio bibliométrico.Metodología de las Ciencias del Comportamiento 2001, 3, 53–64.
64. Bonilla, M.; Puertas, R. Análisis de las Redes Neuronales: Aplicación a Problemas de Predicción y ClasificaciónFinanciera; Servei de Publicacions, Universitat de València: Valencia, Spain, 1997.
65. West, P.; Brockett, P.; Golden, L. A comparative analysis of neural networks and statistical methods forpredicting consumer choice. Mark. Sci. 1997, 16, 370–391. [CrossRef]
66. Pitarque, A.; Ruiz, J.C.; Roy, J.F. Las redes neuronales como herramientas estadísticas no paramétricas declasificación. Psicothema 2000, 12, 459–463.
67. Huang, G.B.; Zhu, Q.Y.; Siew, C.K. Extreme Learning Machine: Theory and Applications. Neurocomputing2006, 70, 489–501. [CrossRef]
68. Sobol, I.M. Global sensitivity indices for nonlinear mathematical models and their monte carlo estimates.Math. Comput. Simul. 2001, 55, 271–280. [CrossRef]
69. Fernandez Navarro, F.; Carbonero, M.; Becerra, D.; Torres, M. Global Sensitivity Estimates for Neuralnetworks classifiers. IEEE Trans. Neural Netw. Learn. Syst. 2017, 28, 2592–2604. [CrossRef] [PubMed]
70. Jensen, M.C.; Meckling, W.H. Theory of the firm: Managerial behavior, agency costs and ownership structure.J. Financ. Econ. 1976, 3, 305–360. [CrossRef]
71. Ashbaugh, H.; Warfield, T.D. Audits as a Corporate Governance Mechanism: Evidence from the GermanMarket. J. Int. Account. Res. 2003, 2, 1–21. [CrossRef]
72. Durendez Gómez-Guillamón, A. The usefulness of the audit report in investment and financing decisions.Manag. Audit. J. 2003, 18, 549–559. [CrossRef]
73. Watts, R.L.; Zimmerman, J.L. Towards a Positive Theory of the Determination of Accounting Standards.Account. Rev. 1978, 53, 112–134.
74. Collins, K.M.; Killough, L.N. An Empirical Examination of Stress in Public Accounting. Account. Organ. Soc.1992, 17, 535–547. [CrossRef]
© 2018 by the authors. Licensee MDPI, Basel, Switzerland. This article is an open accessarticle distributed under the terms and conditions of the Creative Commons Attribution(CC BY) license (http://creativecommons.org/licenses/by/4.0/).
97
International Journal of
Environmental Research
and Public Health
Article
Challenging Cognitive Demands at Work, RelatedWorking Conditions, and Employee Well-Being
Sophie-Charlotte Meyer * and Lena Hünefeld
German Federal Institute for Occupational Safety and Health, D-44149 Dortmund, Germany;[email protected]* Correspondence: [email protected]; Tel.: +49-(0)-231-9071-2709
Received: 8 October 2018; Accepted: 11 December 2018; Published: 19 December 2018
Abstract: In times of digitalized workplaces the extent of challenging cognitive demands at workis rising and employees increasingly have to manage new and unlearned tasks. Yet, these workcharacteristics have received little attention on how they relate to the worker’s well-being. Thus,we analyze associations between cognitive work demands—also in interaction with other jobcharacteristics—and indicators of employee well-being. The analyses are based on the BIBB/BAuAEmployment Survey 2018, a cross-section that is representative for the German working populationand covers approximately 20,000 employed individuals. Ordinary least squares (OLS) regressionssuggest that cognitive demands are associated with a higher probability of feeling fatigued. Incontrast, the results with respect to the employees’ self-rated health status and job satisfaction areambiguous, depending on which cognitive demand is considered. Overall, the findings indicatethat cognitive demands might be related to both resource and demand, depending on the individualresources of employees.
Keywords: cognitive demands; occupational health; employee well-being; working conditions
1. Introduction
The world of work is undergoing permanent changes, which imply new challenges fororganizations and individuals [1]. In globalized markets, organizations need to be more flexible, lesshierarchical, and continually reorganizing to maintain competitiveness and prosperity. Furthermore,changes in the world of work are enabled and accelerated by digitization processes [2–4]. On the onehand, new technologies—such as information and communication technologies—are introduced as astrategy for adapting to constant market pressure. On the other hand, new technologies are again thebasis for fundamental reorganization within organizations [5]. This results in a cycle of changes andthe developments occur at an increased speed [3,4]. Overall, the world of work becomes more flexible,more unpredictable, and changes at an accelerated pace.
All these phenomena involve altered job demands for employees and lead to changes in jobquality. Besides an intensification of work effort [6–8], as well as planning and decision-makingdemands [9–11], increases in cognitive and learning demands at work are discussed as outcomes ofchange in the working world [2,12,13]. Generating new knowledge, as well as problem solving, hasbecome an integral part of employees’ work tasks [14,15]. Furthermore, employees have to acquire newskills constantly in order to adapt to rapidly changing demands at work [12]. Therefore, maintainingone´s skills has become more difficult due to increasing skill variety in recent years [11] and employeesare more frequently confronted with tasks they have not learned or they are not familiar with. Copingwith the new requirements and tasks is becoming increasingly relevant, not only for everyday workinglife but also for personal development, regarding competencies and skills learned in order to maintainemployability [16–18].
IJERPH 2018, 15, 2911; doi:10.3390/ijerph15122911 www.mdpi.com/journal/ijerph98
IJERPH 2018, 15, 2911
In the past decades, research on the quality of work has often focused on work intensificationand autonomy [19], showing that an appropriate balance between work requirements and autonomyis particularly important for a good quality of work, and in turn for employee well-being [20–27].However, empirical studies on learning and cognitive demands are scarce and so far little is knownabout how these demands relate to the well-being of employees. The existing studies predominatelyfocus on learning demands and point to an ambivalent picture regarding the relationship between thesedemands and employee well-being [13,28]. Moreover, the studies are based on non-representativesurvey data with small sample sizes, rendering it difficult to generalize the findings for the entireworking population. There is also no distinct definition between learning or cognitive demands andboth terms are largely used interchangeably. While both refer to confrontation with new tasks atwork and the requirement to acquire new knowledge, learning demands can be understood as asuperordinate term that includes cognitive demands [29]. In general, learning demands can be definedas demands which “require employees to acquire knowledge and skills that are necessary to performtheir jobs effectively” [13]. Cognitive demands involve confrontation with new tasks, unpredictabledevelopments, and solving routine problems [28]. Using this definition, it remains unclear whetheran individual learning process is achieved or not and which demands contribute to the cognitivedevelopment of the employees [30].
In this study, we add to the existing literature and empirically explore the relationship betweencognitive demands and employee well-being. The analyses are based on the German BIBB/BAuAEmployment Survey 2018, a large representative cross-section providing recent data on the work andhealth situation of the working population in Germany (approximately 20,000 respondents). In a firststep, we explore the determinants of cognitive demands in order to identify groups frequently facingcognitive demands at work. To measure cognitive demands, we considere three different variables:facing new tasks, improving work, and doing unlearned things. Analyzing the status quo is crucialin order to identify groups of workers with an increased need for additional training or assistance tocope with new requirements. This is of particular relevance as cognitive demands will likely becomemore prominent in the future and will gradually affect the whole working population. In a secondstep, we analyze the relationship between cognitive demands—also in interaction with other workdemands—and employee well-being. We consider indicator variables for fatigue, self-rated health,and job satisfaction to measure employee well-being.
2. Work–Stress Theories and the Role of Cognitive Demands
Researchers developed different theoretical models to describe the relationship between differentworking conditions and employee health (e.g., Job Demands Control Model (JDC) [25], JobDemands-Resources Model (JD-R) [31], or Action Regulation Theory (ART) [32]. While these modelsconsider various working conditions, only a few explicitly include cognitive demands. In the contextof our study, two models are of particular importance. Firstly, we rely on the integrated model ofpsychosocial work characteristics and the consequences of job strain introduced by Glaser et al. [28].Based on various theories and models [33–35] on the impact of working conditions on attitudes andhealth, the authors [28] developed a model embedding learning demands, work-related resources,and job stressors in order to predict processes of learning, performance, and health impairment. Animportant assumption of this model—in line with Karasek [25]—is that not all working conditionsshould be defined as job demands, regardless of their impact on employee well-being. When cognitivedemands are predisposed as working conditions that trigger effort-driven processes and are thusassociated with physical and psychological costs, the potential positive effects of cognitive demandsfor skill acquisition and performance are neglected. The absence of cognitive demands at work couldalso be negatively related to employee well-being and motivation [28]. Therefore, the authors combinethe assumptions of different work-stress theories, including the challenge–hindrance framework thatdistinguishes between challenge and hindrance demands [36]. Hindrance demands are supposed toreduce personal growth and promote strain and health impairments [36,37]. Challenge demands also
99
IJERPH 2018, 15, 2911
trigger strain, but they are also supposed to have a motivating effect and enable employees to learn andto further develop their own personality. The classification of job demands as challenge or hindrancedemands depends on the individual assessment of employees. Therefore, the cognitive appraisals(challenge and hindrance appraisal) of individuals are the important explanatory mechanisms behindthe positive and negative effects of job demands on a workers well-being [13,38–40]. In line withthis framework, Glaser et al. [28] distinguish between beneficial learning (e.g., task variety andcognitive demands), work-related resources (e.g., autonomy and social support), and stressors oradverse conditions (e.g., overload and conflicts). The proposed model predicts a positive effect oflearning demands on personality development and a negative effect of stressors or adverse conditionson health. Empirical analyses exploring this model indicate that problem solving and learningrequirements are crucial for creativity and motivation. Other studies confirm these results. Forinstance, Prem et al. [13] find a significant relationship between learning demands and personaldevelopment. Personal development was in turn positively associated with vitality in this study.Furthermore, Crawford et al. [41] show that the correlation between work demands and engagementstrongly depends on the specific type of work demand. Demands that were appraised by workers ashindrance were negatively associated with engagement and demands that were appraised by workersas challenges were positively associated with engagement. However, the study of Glaser et al. [28] alsoshowed that learning requirements may be detrimental to health if accompanied by work overload.The authors thus demonstrate—in line with other studies [30,42]—the importance of the interaction ofcognitive demands with other working conditions for employee well-being. Based on the model ofGlaser et al. [28], we assume that cognitive demands might be both positively and negatively relatedto the personal development of employees, and in turn also to their attitudes and health. Furthermore,we assume that autonomy and work intensification moderate the effect of cognitive demands onemployee well-being.
Secondly, person–environment fit theories (P–E fit) are crucial to explain why cognitive demandsat work could have different consequences for different groups of employees. All P–E fit theoriesassume that the extent to which people fit their work environments has significant consequences(e.g., with respect to their satisfaction, performance, stress, productivity, or turnover). A better fit isassociated with better outcomes [43–45]. Moreover, Kristof-Brown and Guay [46] showed that stressis a consequence of a poor person–environment fit. The fit of the individual and the environmentis determined by the fulfilment of needs resulting in favorable attitudes, such as job satisfaction ororganizational commitment [47,48]. In addition, P–E fit is a reciprocal and ongoing process wherebyindividuals shape their environments and environments shape individuals [49]. Work environmentsare associated with cognitive demands to varying degrees. Furthermore, individuals also differ interms of their needs at work and require different conditions in order to achieve favorable attitudes. Inline with the P–E fit theories, we suppose that cognitive demands at work do not equally meet theneeds of different employment groups. Consequently, we expect that the probability of perceivingcognitive demands at work as stressful varies across different groups of employees (e.g., with respectto different socio-demographic groups, such as gender or educational level).
3. Data and Methods
The analyses are based on the BIBB/BAuA Employment Survey 2018, a representativecross-sectional survey covering approximately 20,000 employed individuals in Germany who work atleast 10 h per week and are at least 15 years old [50] (see Table A1 for an overview). The BIBB/BAuAEmployment Survey is representative for the German labor force, including employed as well asself-employed individuals, and covers various occupational groups. For the analyses, we excludeindividuals above the age of 65, as working individuals above that age (age 65 ≈ statutory retirementage in Germany) are a selective and highly heterogeneous group (e.g., self-employed, as well asindividuals depending on additional income to increase their pension). Further, the analyses arerestricted to individuals with valid data for the included variables. The analysis sample amounts
100
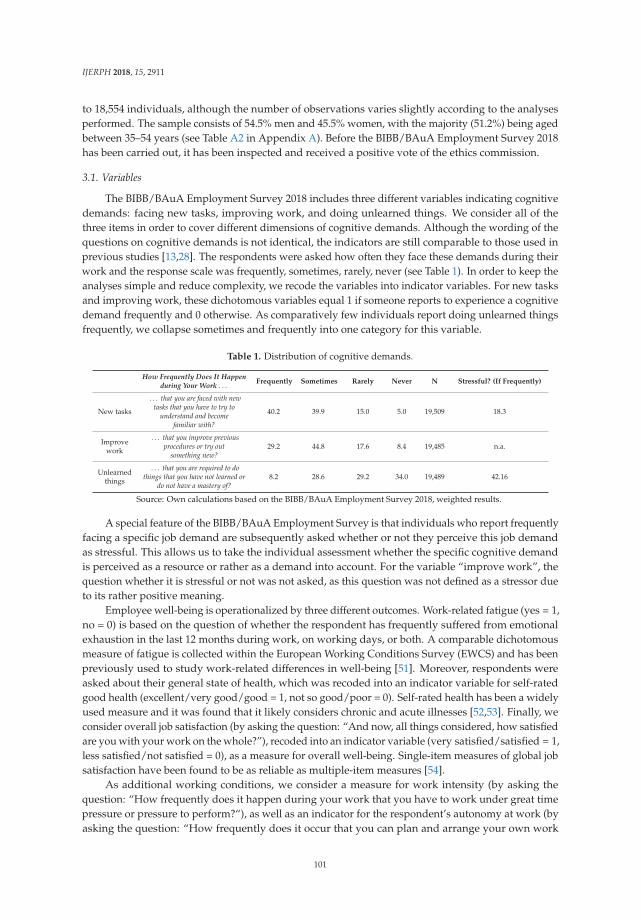
IJERPH 2018, 15, 2911
to 18,554 individuals, although the number of observations varies slightly according to the analysesperformed. The sample consists of 54.5% men and 45.5% women, with the majority (51.2%) being agedbetween 35–54 years (see Table A2 in Appendix A). Before the BIBB/BAuA Employment Survey 2018has been carried out, it has been inspected and received a positive vote of the ethics commission.
3.1. Variables
The BIBB/BAuA Employment Survey 2018 includes three different variables indicating cognitivedemands: facing new tasks, improving work, and doing unlearned things. We consider all of thethree items in order to cover different dimensions of cognitive demands. Although the wording of thequestions on cognitive demands is not identical, the indicators are still comparable to those used inprevious studies [13,28]. The respondents were asked how often they face these demands during theirwork and the response scale was frequently, sometimes, rarely, never (see Table 1). In order to keep theanalyses simple and reduce complexity, we recode the variables into indicator variables. For new tasksand improving work, these dichotomous variables equal 1 if someone reports to experience a cognitivedemand frequently and 0 otherwise. As comparatively few individuals report doing unlearned thingsfrequently, we collapse sometimes and frequently into one category for this variable.
Table 1. Distribution of cognitive demands.
How Frequently Does It Happenduring Your Work . . . Frequently Sometimes Rarely Never N Stressful? (If Frequently)
New tasks
. . . that you are faced with newtasks that you have to try to
understand and becomefamiliar with?
40.2 39.9 15.0 5.0 19,509 18.3
Improvework
. . . that you improve previousprocedures or try out
something new?29.2 44.8 17.6 8.4 19,485 n.a.
Unlearnedthings
. . . that you are required to dothings that you have not learned or
do not have a mastery of?8.2 28.6 29.2 34.0 19,489 42.16
Source: Own calculations based on the BIBB/BAuA Employment Survey 2018, weighted results.
A special feature of the BIBB/BAuA Employment Survey is that individuals who report frequentlyfacing a specific job demand are subsequently asked whether or not they perceive this job demandas stressful. This allows us to take the individual assessment whether the specific cognitive demandis perceived as a resource or rather as a demand into account. For the variable “improve work”, thequestion whether it is stressful or not was not asked, as this question was not defined as a stressor dueto its rather positive meaning.
Employee well-being is operationalized by three different outcomes. Work-related fatigue (yes = 1,no = 0) is based on the question of whether the respondent has frequently suffered from emotionalexhaustion in the last 12 months during work, on working days, or both. A comparable dichotomousmeasure of fatigue is collected within the European Working Conditions Survey (EWCS) and has beenpreviously used to study work-related differences in well-being [51]. Moreover, respondents wereasked about their general state of health, which was recoded into an indicator variable for self-ratedgood health (excellent/very good/good = 1, not so good/poor = 0). Self-rated health has been a widelyused measure and it was found that it likely considers chronic and acute illnesses [52,53]. Finally, weconsider overall job satisfaction (by asking the question: “And now, all things considered, how satisfiedare you with your work on the whole?”), recoded into an indicator variable (very satisfied/satisfied = 1,less satisfied/not satisfied = 0), as a measure for overall well-being. Single-item measures of global jobsatisfaction have been found to be as reliable as multiple-item measures [54].
As additional working conditions, we consider a measure for work intensity (by asking thequestion: “How frequently does it happen during your work that you have to work under great timepressure or pressure to perform?“), as well as an indicator for the respondent’s autonomy at work (byasking the question: “How frequently does it occur that you can plan and arrange your own work
101
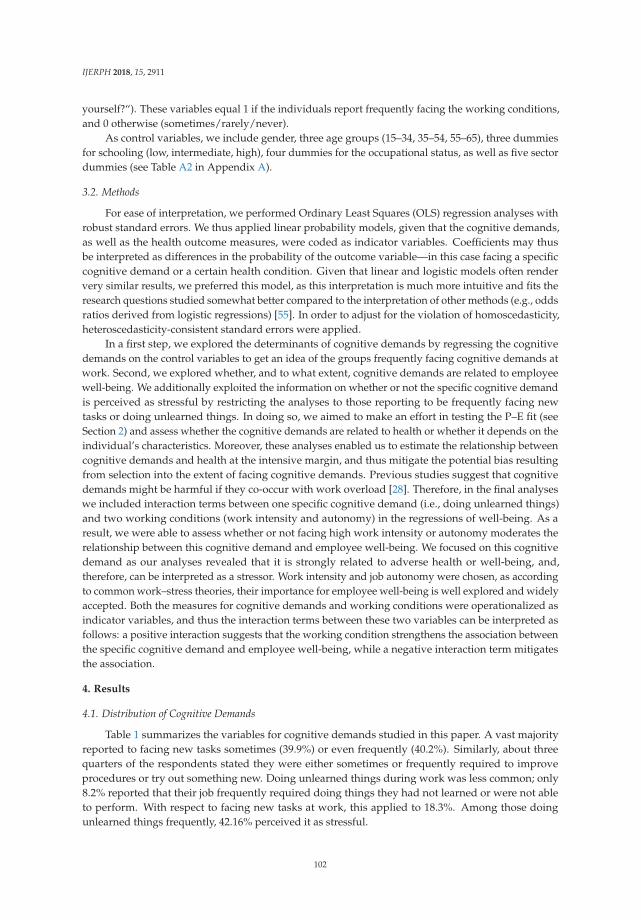
IJERPH 2018, 15, 2911
yourself?“). These variables equal 1 if the individuals report frequently facing the working conditions,and 0 otherwise (sometimes/rarely/never).
As control variables, we include gender, three age groups (15–34, 35–54, 55–65), three dummiesfor schooling (low, intermediate, high), four dummies for the occupational status, as well as five sectordummies (see Table A2 in Appendix A).
3.2. Methods
For ease of interpretation, we performed Ordinary Least Squares (OLS) regression analyses withrobust standard errors. We thus applied linear probability models, given that the cognitive demands,as well as the health outcome measures, were coded as indicator variables. Coefficients may thusbe interpreted as differences in the probability of the outcome variable—in this case facing a specificcognitive demand or a certain health condition. Given that linear and logistic models often rendervery similar results, we preferred this model, as this interpretation is much more intuitive and fits theresearch questions studied somewhat better compared to the interpretation of other methods (e.g., oddsratios derived from logistic regressions) [55]. In order to adjust for the violation of homoscedasticity,heteroscedasticity-consistent standard errors were applied.
In a first step, we explored the determinants of cognitive demands by regressing the cognitivedemands on the control variables to get an idea of the groups frequently facing cognitive demands atwork. Second, we explored whether, and to what extent, cognitive demands are related to employeewell-being. We additionally exploited the information on whether or not the specific cognitive demandis perceived as stressful by restricting the analyses to those reporting to be frequently facing newtasks or doing unlearned things. In doing so, we aimed to make an effort in testing the P–E fit (seeSection 2) and assess whether the cognitive demands are related to health or whether it depends on theindividual’s characteristics. Moreover, these analyses enabled us to estimate the relationship betweencognitive demands and health at the intensive margin, and thus mitigate the potential bias resultingfrom selection into the extent of facing cognitive demands. Previous studies suggest that cognitivedemands might be harmful if they co-occur with work overload [28]. Therefore, in the final analyseswe included interaction terms between one specific cognitive demand (i.e., doing unlearned things)and two working conditions (work intensity and autonomy) in the regressions of well-being. As aresult, we were able to assess whether or not facing high work intensity or autonomy moderates therelationship between this cognitive demand and employee well-being. We focused on this cognitivedemand as our analyses revealed that it is strongly related to adverse health or well-being, and,therefore, can be interpreted as a stressor. Work intensity and job autonomy were chosen, as accordingto common work–stress theories, their importance for employee well-being is well explored and widelyaccepted. Both the measures for cognitive demands and working conditions were operationalized asindicator variables, and thus the interaction terms between these two variables can be interpreted asfollows: a positive interaction suggests that the working condition strengthens the association betweenthe specific cognitive demand and employee well-being, while a negative interaction term mitigatesthe association.
4. Results
4.1. Distribution of Cognitive Demands
Table 1 summarizes the variables for cognitive demands studied in this paper. A vast majorityreported to facing new tasks sometimes (39.9%) or even frequently (40.2%). Similarly, about threequarters of the respondents stated they were either sometimes or frequently required to improveprocedures or try out something new. Doing unlearned things during work was less common; only8.2% reported that their job frequently required doing things they had not learned or were not ableto perform. With respect to facing new tasks at work, this applied to 18.3%. Among those doingunlearned things frequently, 42.16% perceived it as stressful.
102
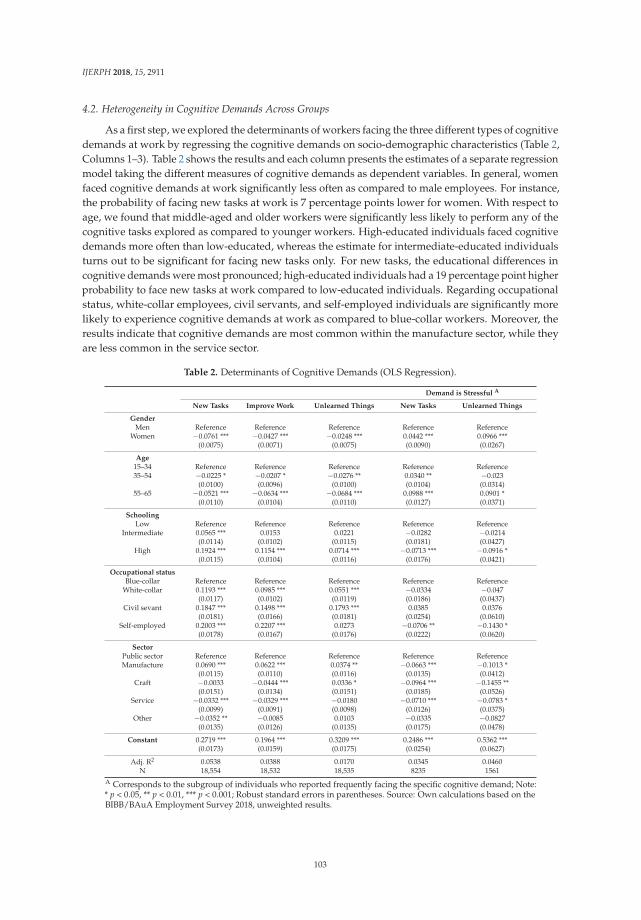
IJERPH 2018, 15, 2911
4.2. Heterogeneity in Cognitive Demands Across Groups
As a first step, we explored the determinants of workers facing the three different types of cognitivedemands at work by regressing the cognitive demands on socio-demographic characteristics (Table 2,Columns 1–3). Table 2 shows the results and each column presents the estimates of a separate regressionmodel taking the different measures of cognitive demands as dependent variables. In general, womenfaced cognitive demands at work significantly less often as compared to male employees. For instance,the probability of facing new tasks at work is 7 percentage points lower for women. With respect toage, we found that middle-aged and older workers were significantly less likely to perform any of thecognitive tasks explored as compared to younger workers. High-educated individuals faced cognitivedemands more often than low-educated, whereas the estimate for intermediate-educated individualsturns out to be significant for facing new tasks only. For new tasks, the educational differences incognitive demands were most pronounced; high-educated individuals had a 19 percentage point higherprobability to face new tasks at work compared to low-educated individuals. Regarding occupationalstatus, white-collar employees, civil servants, and self-employed individuals are significantly morelikely to experience cognitive demands at work as compared to blue-collar workers. Moreover, theresults indicate that cognitive demands are most common within the manufacture sector, while theyare less common in the service sector.
Table 2. Determinants of Cognitive Demands (OLS Regression).
Demand is Stressful A
New Tasks Improve Work Unlearned Things New Tasks Unlearned Things
GenderMen Reference Reference Reference Reference Reference
Women −0.0761 *** −0.0427 *** −0.0248 *** 0.0442 *** 0.0966 ***(0.0075) (0.0071) (0.0075) (0.0090) (0.0267)
Age15–34 Reference Reference Reference Reference Reference35–54 −0.0225 * −0.0207 * −0.0276 ** 0.0340 ** −0.023
(0.0100) (0.0096) (0.0100) (0.0104) (0.0314)55–65 −0.0521 *** −0.0634 *** −0.0684 *** 0.0988 *** 0.0901 *
(0.0110) (0.0104) (0.0110) (0.0127) (0.0371)
SchoolingLow Reference Reference Reference Reference Reference
Intermediate 0.0565 *** 0.0153 0.0221 −0.0282 −0.0214(0.0114) (0.0102) (0.0115) (0.0181) (0.0427)
High 0.1924 *** 0.1154 *** 0.0714 *** −0.0713 *** −0.0916 *(0.0115) (0.0104) (0.0116) (0.0176) (0.0421)
Occupational statusBlue-collar Reference Reference Reference Reference Reference
White-collar 0.1193 *** 0.0985 *** 0.0551 *** −0.0334 −0.047(0.0117) (0.0102) (0.0119) (0.0186) (0.0437)
Civil sevant 0.1847 *** 0.1498 *** 0.1793 *** 0.0385 0.0376(0.0181) (0.0166) (0.0181) (0.0254) (0.0610)
Self-employed 0.2003 *** 0.2207 *** 0.0273 −0.0706 ** −0.1430 *(0.0178) (0.0167) (0.0176) (0.0222) (0.0620)
SectorPublic sector Reference Reference Reference Reference ReferenceManufacture 0.0690 *** 0.0622 *** 0.0374 ** −0.0663 *** −0.1013 *
(0.0115) (0.0110) (0.0116) (0.0135) (0.0412)Craft −0.0033 −0.0444 *** 0.0336 * −0.0964 *** −0.1455 **
(0.0151) (0.0134) (0.0151) (0.0185) (0.0526)Service −0.0332 *** −0.0329 *** −0.0180 −0.0710 *** −0.0783 *
(0.0099) (0.0091) (0.0098) (0.0126) (0.0375)Other −0.0352 ** −0.0085 0.0103 −0.0335 −0.0827
(0.0135) (0.0126) (0.0135) (0.0175) (0.0478)
Constant 0.2719 *** 0.1964 *** 0.3209 *** 0.2486 *** 0.5362 ***(0.0173) (0.0159) (0.0175) (0.0254) (0.0627)
Adj. R2 0.0538 0.0388 0.0170 0.0345 0.0460N 18,554 18,532 18,535 8235 1561
A Corresponds to the subgroup of individuals who reported frequently facing the specific cognitive demand; Note:* p < 0.05, ** p < 0.01, *** p < 0.001; Robust standard errors in parentheses. Source: Own calculations based on theBIBB/BAuA Employment Survey 2018, unweighted results.
103
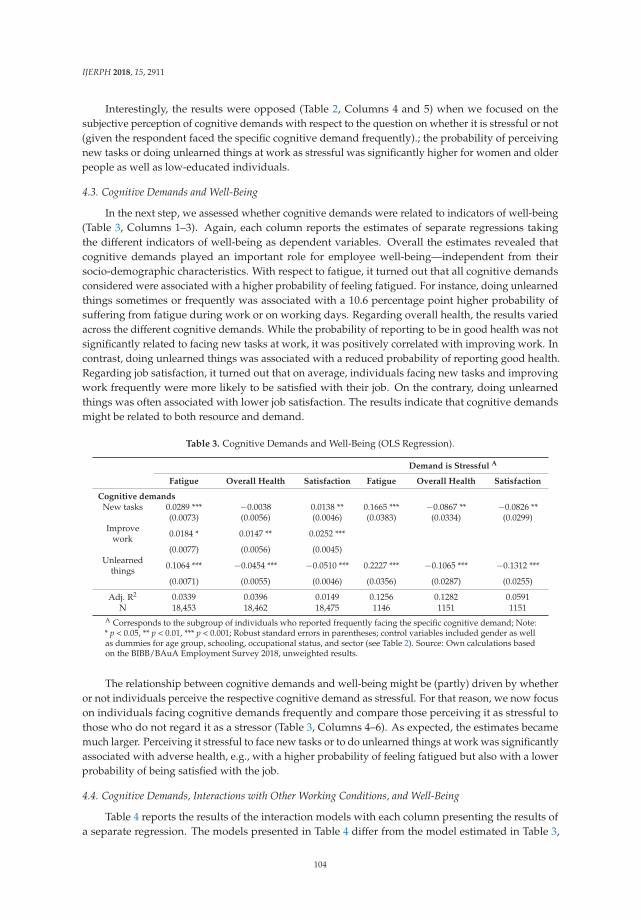
IJERPH 2018, 15, 2911
Interestingly, the results were opposed (Table 2, Columns 4 and 5) when we focused on thesubjective perception of cognitive demands with respect to the question on whether it is stressful or not(given the respondent faced the specific cognitive demand frequently).; the probability of perceivingnew tasks or doing unlearned things at work as stressful was significantly higher for women and olderpeople as well as low-educated individuals.
4.3. Cognitive Demands and Well-Being
In the next step, we assessed whether cognitive demands were related to indicators of well-being(Table 3, Columns 1–3). Again, each column reports the estimates of separate regressions takingthe different indicators of well-being as dependent variables. Overall the estimates revealed thatcognitive demands played an important role for employee well-being—independent from theirsocio-demographic characteristics. With respect to fatigue, it turned out that all cognitive demandsconsidered were associated with a higher probability of feeling fatigued. For instance, doing unlearnedthings sometimes or frequently was associated with a 10.6 percentage point higher probability ofsuffering from fatigue during work or on working days. Regarding overall health, the results variedacross the different cognitive demands. While the probability of reporting to be in good health was notsignificantly related to facing new tasks at work, it was positively correlated with improving work. Incontrast, doing unlearned things was associated with a reduced probability of reporting good health.Regarding job satisfaction, it turned out that on average, individuals facing new tasks and improvingwork frequently were more likely to be satisfied with their job. On the contrary, doing unlearnedthings was often associated with lower job satisfaction. The results indicate that cognitive demandsmight be related to both resource and demand.
Table 3. Cognitive Demands and Well-Being (OLS Regression).
Demand is Stressful A
Fatigue Overall Health Satisfaction Fatigue Overall Health Satisfaction
Cognitive demandsNew tasks 0.0289 *** −0.0038 0.0138 ** 0.1665 *** −0.0867 ** −0.0826 **
(0.0073) (0.0056) (0.0046) (0.0383) (0.0334) (0.0299)Improve
work 0.0184 * 0.0147 ** 0.0252 ***
(0.0077) (0.0056) (0.0045)Unlearned
things 0.1064 *** −0.0454 *** −0.0510 *** 0.2227 *** −0.1065 *** −0.1312 ***
(0.0071) (0.0055) (0.0046) (0.0356) (0.0287) (0.0255)
Adj. R2 0.0339 0.0396 0.0149 0.1256 0.1282 0.0591N 18,453 18,462 18,475 1146 1151 1151
A Corresponds to the subgroup of individuals who reported frequently facing the specific cognitive demand; Note:* p < 0.05, ** p < 0.01, *** p < 0.001; Robust standard errors in parentheses; control variables included gender as wellas dummies for age group, schooling, occupational status, and sector (see Table 2). Source: Own calculations basedon the BIBB/BAuA Employment Survey 2018, unweighted results.
The relationship between cognitive demands and well-being might be (partly) driven by whetheror not individuals perceive the respective cognitive demand as stressful. For that reason, we now focuson individuals facing cognitive demands frequently and compare those perceiving it as stressful tothose who do not regard it as a stressor (Table 3, Columns 4–6). As expected, the estimates becamemuch larger. Perceiving it stressful to face new tasks or to do unlearned things at work was significantlyassociated with adverse health, e.g., with a higher probability of feeling fatigued but also with a lowerprobability of being satisfied with the job.
4.4. Cognitive Demands, Interactions with Other Working Conditions, and Well-Being
Table 4 reports the results of the interaction models with each column presenting the results ofa separate regression. The models presented in Table 4 differ from the model estimated in Table 3,
104
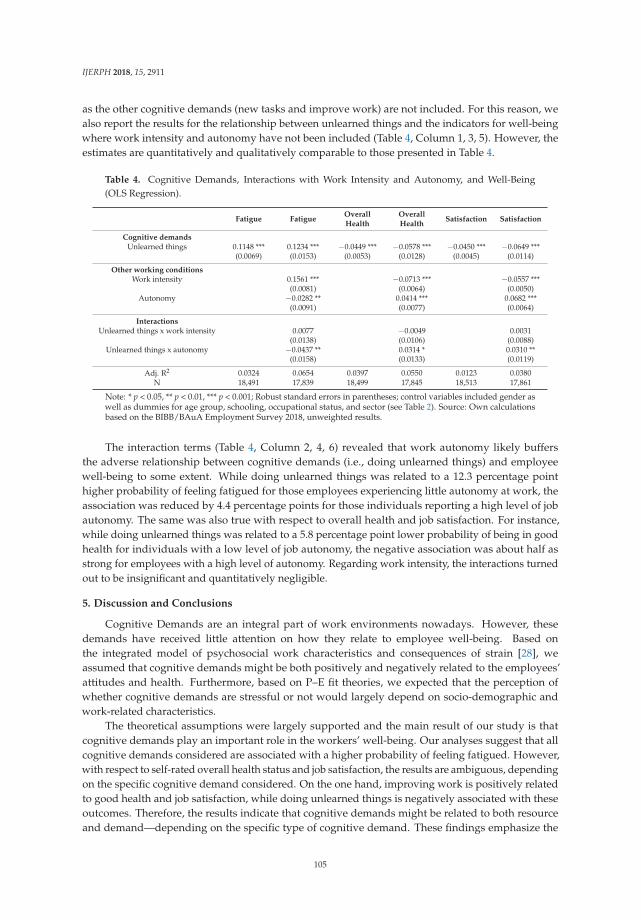
IJERPH 2018, 15, 2911
as the other cognitive demands (new tasks and improve work) are not included. For this reason, wealso report the results for the relationship between unlearned things and the indicators for well-beingwhere work intensity and autonomy have not been included (Table 4, Column 1, 3, 5). However, theestimates are quantitatively and qualitatively comparable to those presented in Table 4.
Table 4. Cognitive Demands, Interactions with Work Intensity and Autonomy, and Well-Being(OLS Regression).
Fatigue FatigueOverallHealth
OverallHealth
Satisfaction Satisfaction
Cognitive demandsUnlearned things 0.1148 *** 0.1234 *** −0.0449 *** −0.0578 *** −0.0450 *** −0.0649 ***
(0.0069) (0.0153) (0.0053) (0.0128) (0.0045) (0.0114)
Other working conditionsWork intensity 0.1561 *** −0.0713 *** −0.0557 ***
(0.0081) (0.0064) (0.0050)Autonomy −0.0282 ** 0.0414 *** 0.0682 ***
(0.0091) (0.0077) (0.0064)
InteractionsUnlearned things x work intensity 0.0077 −0.0049 0.0031
(0.0138) (0.0106) (0.0088)Unlearned things x autonomy −0.0437 ** 0.0314 * 0.0310 **
(0.0158) (0.0133) (0.0119)
Adj. R2 0.0324 0.0654 0.0397 0.0550 0.0123 0.0380N 18,491 17,839 18,499 17,845 18,513 17,861
Note: * p < 0.05, ** p < 0.01, *** p < 0.001; Robust standard errors in parentheses; control variables included gender aswell as dummies for age group, schooling, occupational status, and sector (see Table 2). Source: Own calculationsbased on the BIBB/BAuA Employment Survey 2018, unweighted results.
The interaction terms (Table 4, Column 2, 4, 6) revealed that work autonomy likely buffersthe adverse relationship between cognitive demands (i.e., doing unlearned things) and employeewell-being to some extent. While doing unlearned things was related to a 12.3 percentage pointhigher probability of feeling fatigued for those employees experiencing little autonomy at work, theassociation was reduced by 4.4 percentage points for those individuals reporting a high level of jobautonomy. The same was also true with respect to overall health and job satisfaction. For instance,while doing unlearned things was related to a 5.8 percentage point lower probability of being in goodhealth for individuals with a low level of job autonomy, the negative association was about half asstrong for employees with a high level of autonomy. Regarding work intensity, the interactions turnedout to be insignificant and quantitatively negligible.
5. Discussion and Conclusions
Cognitive Demands are an integral part of work environments nowadays. However, thesedemands have received little attention on how they relate to employee well-being. Based onthe integrated model of psychosocial work characteristics and consequences of strain [28], weassumed that cognitive demands might be both positively and negatively related to the employees’attitudes and health. Furthermore, based on P–E fit theories, we expected that the perception ofwhether cognitive demands are stressful or not would largely depend on socio-demographic andwork-related characteristics.
The theoretical assumptions were largely supported and the main result of our study is thatcognitive demands play an important role in the workers’ well-being. Our analyses suggest that allcognitive demands considered are associated with a higher probability of feeling fatigued. However,with respect to self-rated overall health status and job satisfaction, the results are ambiguous, dependingon the specific cognitive demand considered. On the one hand, improving work is positively relatedto good health and job satisfaction, while doing unlearned things is negatively associated with theseoutcomes. Therefore, the results indicate that cognitive demands might be related to both resourceand demand—depending on the specific type of cognitive demand. These findings emphasize the
105
IJERPH 2018, 15, 2911
immanent assumption of Glaser et al.’s [28] model that a fine-grained distinction of job demands isneeded to analyze the associations between working conditions and the employees’ attitudes andhealth. Furthermore, the results strengthen the theoretical challenge–hindrance framework. Cognitivedemands trigger strain, but they can also have a satisfying effect. That is because cognitive demandsoften involve task variation or learning, which likely improves the employees’ personal developmentand might thus be health-enhancing in the long run [19]. However, how the cognitive demands aredesigned seems to be crucial, and whether or not these demands co-occur with other job demands andif employees assess cognitive demands as stressful. While facing new tasks and improving work are tosome extent positively related to well-being, doing unlearned things is consistently negatively relatedto employee well-being. In addition, perception of stress in relation to facing new tasks or to doingunlearned things at work is significantly associated with a higher probability of feeling fatigued, butalso with a lower probability of being satisfied with the job. This result strengthens the importanceof the challenge and hindrance appraisal as an explanatory mechanism for the relationship betweencognitive demands and well-being. The challenge appraisal thus reflects the perception of situationsenabling personal development. In contrast, the hindrance appraisal is related to individual frustrationdue to the prevention of the fulfilment of self-relevant goals [13,38,40]. The interaction analyses furtherreveal that autonomy might mitigate the negative association between doing unlearned things andwell-being to some extent. In line with previous studies and theories, this finding further emphasizesthe role of autonomy as an important resource to buffer stressors at work [34,56]. Overall, our findingssupport the idea that specific working conditions might be related to both demand and resource andthat more research based on integrated models of different working conditions, including cognitivedemands, are needed.
Moreover, our analyses on the determinants of cognitive demands reveal that different groupsof employees face cognitive demands at work to varying degrees. A vast majority reported facingnew tasks at work, while doing unlearned things during work was less common. This might partlybe attributable to the relatively negative wording of this question (see Table 1). Moreover, the threevariables are also different from a theoretical perspective; performing new tasks and improvingprocedures at work also refer to task variation, which might be interpreted as a resource, not onlyas a stressor. The analyses also indicate that the extent to which individuals perceive cognitivedemands as stressful varies across different groups of employees. High-educated employees mostfrequently report facing cognitive demands as compared to low-educated employees. As expected,this suggests that knowledge-intensive occupations in particular are exposed to cognitive demands. Incontrast, the probability of perceiving cognitive demands at work as stressful is significantly higherfor low-educated individuals. This is in accordance with the assumptions derived from the P–E fittheories. Cognitive demands are an integral part of the work of high-educated employees and thusprobably also a significant part of the satisfaction of needs. It can also be assumed that highly educatedindividuals are more likely to actively ask for new tasks to reach job satisfaction of needs. In addition,high-educated employees often dispose of more resources at work, such as a higher level of autonomy,as compared to low-educated employees [57]. Our findings emphasize that the match of individualneeds and requirements in the workplace is crucial. Future research should focus on this in more depthin order to investigate the impact of different cognitive demands with regard to content and varyingdegrees of difficulty on the attitudes and health of different employment groups.
5.1. Limitations
Although this study is the first examining the relationship between cognitive demands andemployee well-being based on a large data set representative for the German working population,there are some limitations that have to be acknowledged. First, the interpretation is limited due tothe cross-sectional nature of the study. Thus, the analyses allow alternative explanations as we arenot able to account for reverse causality or unobserved heterogeneity. Consequently, future researchshould elaborate on this, for example by replicating the analyses within a longitudinal study design.
106
IJERPH 2018, 15, 2911
Second, all measures were based on self-reports from participants, raising the risk of overestimatedresults due to common method biases [58]. However, various authors point out that subjective viewsare certainly an important indicator of objective health-related outcomes [59]. Self-reports may not betoo problematic when investigating interaction effects: Common method effects are likely attenuatingrather than strengthening interactions [60]. Third, we used single items to measure cognitive demands.Although single item measures are found to be valid [55,61], studies and theories presented at thebeginning of the paper suggest that cognitive demands might be a multi-dimensional concept on whichfuture research should focus on. Finally, our analyses are based on the whole working populationrendering knowledge on the relationship between cognitive demands and employee well-being ina general sense, which can be interpreted as a first step in discovering this issue. In order to betterunderstand this relationship, future research should elaborate on the heterogeneity across groups, forexample by performing subgroup analyses with respect to gender, age groups, and educational level,but also occupations. This is crucial in order to derive concrete recommendations for action.
5.2. Practical Implications
This study adds to the limited research on the relationship between cognitive demands andemployee well-being. Our results indicate that cognitive demands are both stressors and resources.Considering the rise of new (communication) technologies [62], cognitive demands at work seemto be an important but widely neglected topic in modern societies. On the one hand, the resultsunderline the beneficial effects of cognitive demands at work. Cognitive demands should be includedin work tasks, giving employees the opportunity to improve their personal development. However,the cognitive demands should not over-strain employees. Organizations have the responsibility todesign workplaces according to the needs of their employees. To ensure that the employer is informedabout the cognitive demands of their employees, cognitive demands should also be included in the riskassessment and be a part of employee appraisals. Furthermore, organizations could create competenceteams in which employees could exchange information on new challenges and learn from each other.Finally, organizations should offer additional training in order to support employees in developingindividual coping strategies by considering the needs of different groups of employees.
Author Contributions: Conceptualization, S.-C.M. and L.H.; data curation, S.-C.M.; methodology, S.-C.M.;writing—original draft, S.-C.M. and L.H.
Funding: This research received no external funding.
Acknowledgments: We would like to thank three anonymous referees for their valuable comments which helpedto improve earlier versions of this paper.
Conflicts of Interest: The authors declare no conflict of interest.
Appendix A
Table A1. Overview of BIBB/BAuA Employment Survey.
BIBB/BAuA Employment Survey
Data ownerGerman Federal Institute for Vocational Education and Training (BIBB)and the German Federal Institute for Occupational Safety and Health(BAuA)
SurveyRepeated cross-section, conducted every six years (comparable since2006); Latest survey carried out in 2018
Interview Telephone interviews (CATI) since 2006
Sample Approximately 20.000 employees
107
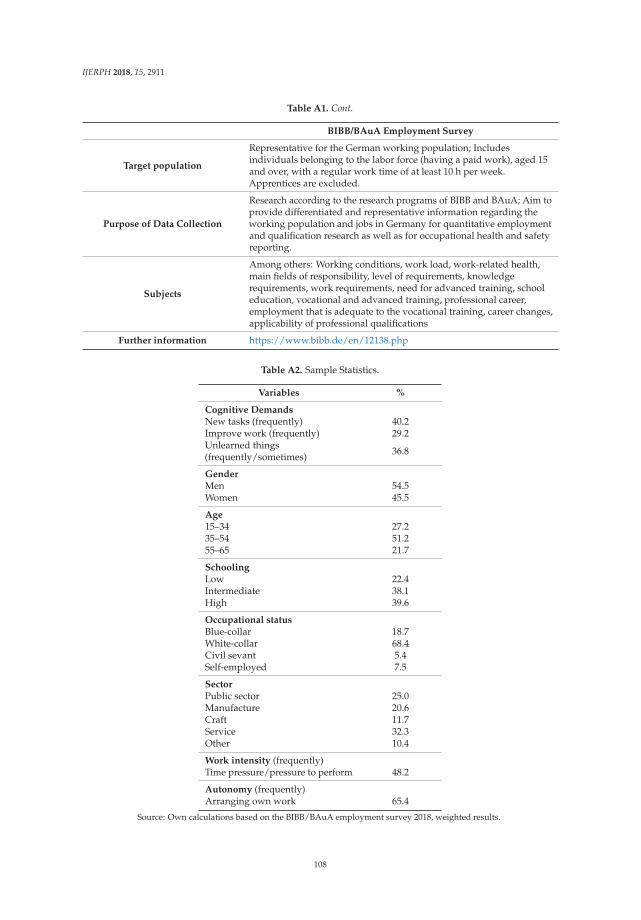
IJERPH 2018, 15, 2911
Table A1. Cont.
BIBB/BAuA Employment Survey
Target population
Representative for the German working population; Includesindividuals belonging to the labor force (having a paid work), aged 15and over, with a regular work time of at least 10 h per week.Apprentices are excluded.
Purpose of Data Collection
Research according to the research programs of BIBB and BAuA; Aim toprovide differentiated and representative information regarding theworking population and jobs in Germany for quantitative employmentand qualification research as well as for occupational health and safetyreporting.
Subjects
Among others: Working conditions, work load, work-related health,main fields of responsibility, level of requirements, knowledgerequirements, work requirements, need for advanced training, schooleducation, vocational and advanced training, professional career,employment that is adequate to the vocational training, career changes,applicability of professional qualifications
Further information https://www.bibb.de/en/12138.php
Table A2. Sample Statistics.
Variables %
Cognitive DemandsNew tasks (frequently) 40.2Improve work (frequently) 29.2Unlearned things(frequently/sometimes) 36.8
GenderMen 54.5Women 45.5
Age15–34 27.235–54 51.255–65 21.7
SchoolingLow 22.4Intermediate 38.1High 39.6
Occupational statusBlue-collar 18.7White-collar 68.4Civil sevant 5.4Self-employed 7.5
SectorPublic sector 25.0Manufacture 20.6Craft 11.7Service 32.3Other 10.4
Work intensity (frequently)Time pressure/pressure to perform 48.2
Autonomy (frequently)Arranging own work 65.4
Source: Own calculations based on the BIBB/BAuA employment survey 2018, weighted results.
108
IJERPH 2018, 15, 2911
References
1. Cascio, W.F. The changing world of work. In Oxford Handbook of Positive Psychology and Work; Linley, P.A.,Harrington, S., Garcea, N., Eds.; Oxford University Press: Oxford, UK, 2010; pp. 13–14.
2. Korunka, C.; Kubicek, B. Job Demands in a Changing World of Work. In Job Demands in a Changing World ofWork; Springer: Berlin, Germany, 2017; pp. 1–5.
3. Rosa, H. Alienation and Acceleration: Towards a Critical Theory of Late-Modern Temporality; NSU Press: Malmö,Sweden, 2010.
4. Rosa, H. High-Speed Society: Social Acceleration, Power, and Modernity; Penn State Press: University Park, PA,USA, 2010.
5. Castells, M. The Rise of the Network Society; John Wiley & Sons: Oxford, UK, 2011.6. Burchell, B.; Ladipo, D.; Wilkinson, F. Job Insecurity and Work Intensification; Routledge: Abingdon, UK, 2005.7. Green, F. Work intensification, discretion, and the decline in well-being at work. East. Econ. J. 2004, 30,
615–625.8. Green, F.; McIntosh, S. The intensification of work in Europe. Labour Econ. 2001, 8, 291–308. [CrossRef]9. Allvin, M.; Aronsson, G.; Hagström, T.; Johansson, G.; Lundberg, U. Work Without Boundaries: Psychological
Perspectives on the New Working Life; John Wiley & Sons: Hoboken, NJ, USA, 2011.10. Flecker, J.; Fibich, T.; Kraemer, K. Socio-economic changes and the reorganization of work. In Job Demands in
a Changing World of Work; Springer: Berlin, Germany, 2017; pp. 7–24.11. Wood, L.A. The Changing Nature of Jobs: A Meta-Analysis Examining Changes in Job Characterisitcs Over Time;
University of Georgia Athens: Athens, GA, USA, 2011.12. Loon, M.; Casimir, G. Job-demand for learning and job-related learning: The moderating effect of need for
achievement. J. Manag. Psychol. 2008, 23, 89–102. [CrossRef]13. Prem, R.; Ohly, S.; Kubicek, B.; Korunka, C. Thriving on challenge stressors? Exploring time pressure
and learning demands as antecedents of thriving at work. J. Organ. Behav. 2017, 38, 108–123. [CrossRef][PubMed]
14. Paulsson, K.; Sundin, L. Learning at work-a combination of experience based learning and theoreticaleducation. Behav. Inf. Technol. 2000, 19, 181–188. [CrossRef]
15. Shalley, C.E.; Gilson, L.L.; Blum, T.C. Interactive effects of growth need strength, work context, and jobcomplexity on self-reported creative performance. Acad. Manag. J. 2009, 52, 489–505. [CrossRef]
16. Kubicek, B.; Paškvan, M.; Korunka, C. Development and validation of an instrument for assessing jobdemands arising from accelerated change: The intensification of job demands scale (IDS). Eur. J. Work Organ.Psychol. 2015, 24, 898–913. [CrossRef]
17. Obschonka, M.; Silbereisen, R.K.; Wasilewski, J. Constellations of new demands concerning careers andjobs: Results from a two-country study on social and economic change. J. Vocat. Behav. 2012, 80, 211–223.[CrossRef]
18. Nijhof, W.J. Lifelong learning as a European skill formation policy. Hum. Resour. Dev. Rev. 2005, 4, 401–417.[CrossRef]
19. Rau, R.; Buyken, D. Current Status of Knowledge About Health Risk From Mental Workload: Evidence Basedon a Systematic Review of Reviews. Zeitschrift für Arbeits-und Organisationspsychologie 2015, 59, 113–129.
20. Bonde, J.P.E. Psychosocial factors at work and risk of depression: A systematic review of the epidemiologicalevidence. Occup. Environ. Med. 2008, 65, 438–445. [CrossRef] [PubMed]
21. Demerouti, E.; Bakker, A.B.; de Jonge, J.; Janssen, P.P.; Schaufeli, W.B. Burnout and engagement at work as afunction of demands and control. Scand. J. Work Environ. Health 2001, 27, 279–286. [CrossRef]
22. Kivimäki, M.; Nyberg, S.T.; Batty, G.D.; Fransson, E.I.; Heikkilä, K.; Alfredsson, L.; Bjorner, J.B.; Borritz, M.;Burr, H.; Casini, A.; et al. Job strain as a risk factor for coronary heart disease: A collaborative meta-analysisof individual participant data. Lancet 2012, 380, 1491–1497. [CrossRef]
23. Kivimäki, M.; Virtanen, M.; Elovainio, M.; Kouvonen, A.; Väänänen, A.; Vahtera, J. Work stress in the etiologyof coronary heart disease—A meta-analysis. Scand. J. Work Environ. Health 2006, 32, 431–442. [CrossRef][PubMed]
24. Landsbergis, P.A.; Dobson, M.; Koutsouras, G.; Schnall, P. Job strain and ambulatory blood pressure: Ameta-analysis and systematic review. Am. J. Public Health 2013, 103, e61–e71. [CrossRef] [PubMed]
109
IJERPH 2018, 15, 2911
25. Karasek, R. Job demands, job decision latitude, and mental strain: Implications for job redesign. Adm. Sci. Q.1979, 24, 285–308. [CrossRef]
26. Karasek, R. Demand/Control model: A social-emotional, and psychological approach to stress risk and activebehavior development. In ILO Encyclopedia of Occupational Health and Safety; ILO: Geneva, Switzerland, 1998.
27. Steptoe, A.; Kivimäki, M. Stress and cardiovascular disease: An update on current knowledge. Annu. Rev.Public Health 2013, 34, 337–354. [CrossRef] [PubMed]
28. Glaser, J.; Seubert, C.; Hornung, S.; Herbig, B. The impact of learning demands, work-related resources, andjob stressors on creative performance and health. J. Pers. Psychol. 2015, 14, 37–48. [CrossRef]
29. Büssing, A.; Glaser, J. Das Tätigkeits-und Arbeitsanalyseverfahren für das Krankenhaus-Selbstbeobachtungsversion(TAA-KH-S); Hogrefe: Göttingen, Germany, 2002.
30. Layer, J.K.; Karwowski, W.; Furr, A. The effect of cognitive demands and perceived quality of work life onhuman performance in manufacturing environments. Int. J. Ind. Ergon. 2009, 39, 413–421. [CrossRef]
31. Bakker, A.B.; Demerouti, E. The job demands-resources model: State of the art. J. Manag. Psychol. 2007, 22,309–328. [CrossRef]
32. Hacker, W. Action regulation theory: A practical tool for the design of modern work processes? Eur. J. WorkOrgan. Psychol. 2003, 12, 105–130. [CrossRef]
33. Hackman, J.R.; Oldham, G.R. Motivation through the design of work: Test of a theory. Organ. Behav. Hum.Perform. 1976, 16, 250–279. [CrossRef]
34. Richter, P.; Hacker, W. Belastung und Beanspruchung: Streß, Ermüdung und Burnout im Arbeitsleben [Workloadand Strain: Stress, Fatigue, and Burnout in Working Life]; Asanger: Heidelberg, Germany, 1998.
35. Karasek, R.A.; Theorell, T. Health Work; Basic Book: New York, NY, USA, 1990.36. Cavanaugh, M.A.; Boswell, W.R.; Roehling, M.V.; Boudreau, J.W. An empirical examination of self-reported
work stress among US managers. J. Appl. Psychol. 2000, 85, 65–74. [CrossRef] [PubMed]37. Podsakoff, N.P.; LePine, J.A.; LePine, M.A. Differential challenge stressor-hindrance stressor relationships
with job attitudes, turnover intentions, turnover, and withdrawal behavior: A meta-analysis. J. Appl. Psychol.2007, 92, 438–454. [CrossRef]
38. Folkman, S.; Lazarus, R.S. If it changes it must be a process: Study of emotion and coping during three stagesof a college examination. J. Pers. Soc. Psychol. 1985, 48, 150–170. [CrossRef]
39. LePine, J.A.; Podsakoff, N.P.; LePine, M.A. A meta-analytic test of the challenge stressor–hindrance stressorframework: An explanation for inconsistent relationships among stressors and performance. Acad. Manag. J.2005, 48, 764–775. [CrossRef]
40. Searle, B.J.; Auton, J.C. The merits of measuring challenge and hindrance appraisals. Anxiety Stress Coping2015, 28, 121–143. [CrossRef]
41. Crawford, E.R.; LePine, J.A.; Rich, B.L. Linking job demands and resources to employee engagement andburnout: A theoretical extension and meta-analytic test. J. Appl. Psychol. 2010, 95, 834–848. [CrossRef]
42. Jinnett, K.; Schwatka, N.; Tenney, L.; Brockbank, C.V.; Newman, L.S. Chronic conditions, workplace safety,and job demands contribute to absenteeism and job performance. Health Aff. 2017, 36, 237–244. [CrossRef]
43. Kristof-Brown, A.L.; Zimmerman, R.D.; Johnson, E.C. Consequences of individualis’ fit at work: A meta-analysis of person-job, person-organization, person-group, and person-supervisor fit. Pers. Psychol. 2005, 58,281–342. [CrossRef]
44. Caplan, R.D. Person-environment fit theory and organizations: Commensurate dimensions, time perspectives,and mechanisms. J. Vocat. Behav. 1987, 31, 248–267. [CrossRef]
45. Su, R.; Murdock, C.; Rounds, J. Person-environment fit. In APA Handbook of Career Intervention; Hartung, P.J.,Savickas, M.L., Wals, W.B., Eds.; American Psychological Association: Washington, DC, USA, 2015; pp. 81–98.
46. Kristof-Brown, A.L.; Guay, R.P. Person–environment fit. In PA Handbooks in Psychology. APA Handbook ofIndustrial and Organizational Psychology; Zedeck, S., Ed.; American Psychological Association: Washington,DC, USA, 2011.
47. Arthur, W., Jr.; Bell, S.T.; Villado, A.J.; Doverspike, D. The use of person-organization fit in employmentdecision making: An assessment of its criterion-related validity. J. Appl. Psychol. 2006, 91, 786–801. [CrossRef]
48. Greguras, G.J.; Diefendorff, J.M. Different fits satisfy different needs: Linking person-environment fit toemployee commitment and performance using self-determination theory. J. Appl. Psychol. 2009, 94, 465–477.[CrossRef] [PubMed]
110
IJERPH 2018, 15, 2911
49. Rounds, J.B.; Tracey, T.J. From Trait-and-Factor to Person-Environment Fit Counseling: Theory and Process;Lawrence Erlbaum Associates, Inc.: Hillsdale, NJ, USA, 1990.
50. Rohrbach-Schmidt, D.; Hall, A. BIBB/BAuA Employment Survey 2012; BIBB-FDZ Data and MethodologicalReport; Bundesinstitut für Berufsbildung (BIBB): Bonn, Germany, 2013.
51. Benach, J.; Gimeno, D.; Benavides, F.G.; Martínez, J.M.; Torné Mdel, M. Types of employment and health inthe European Union: Changes from 1995 to 2000. Eur. J. Public Health 2004, 14, 314–321. [CrossRef] [PubMed]
52. Simon, J.; De Boer, J.B.; Joung, I.M.; Bosma, H.; Mackenbach, J.P. How is your health in general? A qualitativestudy on self-assessed health. Eur. J. Public Health 2005, 15, 200–208. [CrossRef]
53. Idler, E.L.; Benyamini, Y. Self-rated health and mortality: A review of twenty-seven community studies.J. Health Soc. Behav. 1997, 38, 21–37. [CrossRef] [PubMed]
54. Wanous, J.P.; Reichers, A.E.; Hudy, M.J. Overall job satisfaction: How good are single-item measures? J. Appl.Psychol. 1997, 82, 247–252. [CrossRef]
55. Hellevik, O. Linear versus logistic regression when the dependent variable is a dichotomy. Qual. Quant.2009, 43, 59–74. [CrossRef]
56. Bakker, A.B.; Demerouti, E.; Euwema, M.C. Job resources buffer the impact of job demands on burnout.J. Occup. Health Psychol. 2005, 10, 170–180. [CrossRef]
57. Ross, C.E.; Wu, C.-L. Education, age, and the cumulative advantage in health. J. Health Soc. Behav. 1996, 37,104–120. [CrossRef]
58. Podsakoff, P.M.; MacKenzie, S.B.; Lee, J.Y.; Podsakoff, N.P. Common method biases in behavioral research:A critical review of the literature and recommended remedies. J. Appl. Psychol. 2003, 88, 879–903. [CrossRef][PubMed]
59. Marmot, M.G.; Fuhrer, R.; Ettner, S.L.; Marks, N.F.; Bumpass, L.L.; Ryff, C.D. Contribution of psychosocialfactors to socioeconomic differences in health. Milbank Q. 1998, 76, 403–448. [CrossRef] [PubMed]
60. Conway, N.; Briner, R.B. Full-time versus part-time employees: Understanding the links between workstatus, the psychological contract, and attitudes. J. Vocat. Behav. 2002, 61, 279–301. [CrossRef]
61. DeSalvo, K.B.; Bloser, N.; Reynolds, K.; He, J.; Muntner, P. Mortality prediction with a single general self-ratedhealth question. J. Gen. Intern. Med. 2006, 21, 267–275. [CrossRef] [PubMed]
62. Kompier, M.A. New systems of work organization and workers’ health. Scand. J. Work Environ. Health2006, 32, 421–430. [CrossRef] [PubMed]
© 2018 by the authors. Licensee MDPI, Basel, Switzerland. This article is an open accessarticle distributed under the terms and conditions of the Creative Commons Attribution(CC BY) license (http://creativecommons.org/licenses/by/4.0/).
111
International Journal of
Environmental Research
and Public Health
Article
Larger Workplaces, People-Oriented Culture, andSpecific Industry Sectors Are Associated withCo-Occurring Health Protection andWellness Activities
Aviroop Biswas 1,* , Colette N. Severin 1, Peter M. Smith 1,2,3, Ivan A. Steenstra 1,4 ,
Lynda S. Robson 1 and Benjamin C. Amick III 1,5
1 Institute for Work & Health, Toronto, ON M5G 2E9, Canada; [email protected] (C.N.S.);[email protected] (P.M.S.); [email protected] (I.A.S.); [email protected] (L.S.R.);[email protected] (B.C.A.)
2 Dalla Lana School of Public Health, University of Toronto, Toronto, ON M5T 3M7, Canada3 Centre of Occupational and Environmental Health, Monash University, Melbourne, VIC 3004, Australia4 Morneau Shepell, Toronto, ON M5S 3A9, Canada5 Florida International University, Miami, FL 33199, USA* Correspondence: [email protected]; Tel.: +1-416-927-2027 (ext. 2290)
Received: 29 October 2018; Accepted: 28 November 2018; Published: 4 December 2018
Abstract: Employers are increasingly interested in offering workplace wellness programs in addition tooccupational health and safety (OHS) activities to promote worker health, wellbeing, and productivity.Yet, there is a dearth of research on workplace factors that enable the implementation of OHS andwellness to inform the future integration of these activities in Canadian workplaces. This studyexplored workplace demographic factors associated with the co-implementation of OHS and wellnessactivities in a heterogenous sample of Canadian workplaces. Using a cross-sectional survey of1285 workplaces from 2011 to 2014, latent profiles of co-occurrent OHS and wellness activities wereidentified, and multinomial logistic regression was used to assess associations between workplacedemographic factors and the profiles. Most workplaces (84%) demonstrated little co-occurrence ofOHS and wellness activities. Highest co-occurrence was associated with large workplaces (odds ratio(OR) = 3.22, 95% confidence interval (CI) = 1.15–5.89), in the electrical and utilities sector (OR = 5.57,95% CI = 2.24–8.35), and a high people-oriented culture (OR = 4.70, 95% CI = 1.59–5.26). Promotingintegrated OHS and wellness approaches in medium to large workplaces, in select industries, andemphasizing a people-oriented culture were found to be important factors for implementing OHS andwellness in Canadian organizations. Informed by these findings, future studies should understand themechanisms to facilitate the integration of OHS and wellness in workplaces.
Keywords: workforce demographics; health promotion; injury prevention; occupational health
1. Introduction
The workplace is a social determinant of health, with employment and working conditions linkedto a range of health, functioning, and quality-of-life outcomes [1,2]. Work-related injuries and illnessesare associated with morbidity and substantial financial and social costs, and health hazards fromwork can also impact people’s personal lives and lifestyle [3,4]. Studies also show that lifestyle riskfactors (e.g., being a smoker, stressful lives outside of work, being obese, and heavy alcohol use) canincrease the likelihood of sustaining workplace injuries more so than among those without such riskfactors [5,6]. North American employers are required to provide occupational health and safety (OHS)activities that minimize negative health effect due to worker exposures to job-related risks and hazards.
IJERPH 2018, 15, 2739; doi:10.3390/ijerph15122739 www.mdpi.com/journal/ijerph112
IJERPH 2018, 15, 2739
In comparison, workplace health promotion or wellness activities are voluntarily provided by someemployers to improve worker wellbeing through health behavior changes and are shown to have shortand long-term health and productivity benefits [7,8].
There has been a shift in thinking about how workplaces can better integrate safety into theoverall wellbeing of their workforce [9]. Wellness and OHS programs share the goal of protectingand improving worker health and given these overlaps it makes sense to integrate both. IntegratingOHS and wellness activities is expected to have greater effects on health, safety, and wellbeing thanif the activities operated separately from each other [10,11]. This approach, commonly referred to asTotal Worker Health® in the US, is widely endorsed by international health and labor agencies [12–14]with the consensus that it will lead to improvements in the long-term well-being of workers and theirfamilies, and reduce pressures on healthcare and social security systems [13,14].
Several studies have demonstrated links between the characteristics of workplaces (workplacedemographic factors) and the implementation and integration of OHS and wellness activities. Forexample, the manufacturing sector reports a higher number of OHS and wellness activities than othersectors [15,16], and smaller workplaces are likely to offer fewer OHS and wellness programs than largerorganizations [15,17,18]. Examining workplaces in the US Midwest, McLellan et al. found leadershipsupport and having an OHS committee to be important contributors to implementing integratedapproaches [19]. Tremblay et al. examined Massachusetts employers and found a high degree ofcoordinated activities among unionized workplaces and in construction, healthcare, manufacturing,and entertainment industries [18]. These and other studies are limited in their focus on smallworkplaces [17,19] and sampled few larger workplaces [18]. A greater focus on medium to largein addition to smaller workplaces can further uncover factors enabling integrated activities as largerworkplaces are likely to have more resources to support these activities [20]. Furthermore, much ofthe research examining relationships between workplace factors and the implementation of OHS andwellness have focused on US workplaces and little is known about the extent that these activitiesco-occur in Canadian workplaces. To inform research and policy recommendations towards thewidespread adoption of integrated worker health approaches in Canada, research evidence is neededto understand the extent that OHS and wellness activities co-occur as a necessary first step towardsidentifying the current status quo and the workplace factors that can be amenable targets for integratedapproaches in the future.
The objective of this study was to explore the workplace demographic factors associated with theconcurrent implementation of OHS and wellness activities in Canadian workplaces. The study hastwo research questions (RQ): RQ1—“What is the extent that OHS and wellness activities co-occur inworkplaces?” RQ2—“Are there associations between workplace demographic characteristics and theco-occurrence of OHS and wellness activities?” These questions were explored in a cross-section of alarge, heterogenous sample of small, medium, and large workplaces in Ontario, Canada. Informedby evidence from US studies, we hypothesized that large and unionized workplaces in specificindustry sectors have a higher co-occurrence of OHS and wellness activities than workplaces withother demographic characteristics.
2. Materials and Methods
2.1. Data Sources
This study analyzed data from the Ontario Leading Indicators Project (OLIP), a cross-sectionalsurvey conducted by researchers at the Institute for Work & Health from 2011 to 2014 in partnershipwith health and safety associations in Ontario, Canada. The aim of the OLIP study was to identifyleading indicator measures for workplaces to improve their health and safety performance beforeinjuries and illnesses occur. Study details are available elsewhere [21]. Briefly, OHS and wellnessdata were collected in collaboration with four OHS associations representing employers from mostlabor sectors in Ontario. The target population consisted of organizations registered with the
113
IJERPH 2018, 15, 2739
Workplace Safety & Insurance Board (WSIB), an organization responsible for workers’ compensation toapproximately 62.5% of Ontario’s workforce [22]. Workplace Safety & Insurance Board compensationcoverage is optional for certain workers such as independent contractors, sole proprietors, and partnersin partnerships. Organizations included in the study analysis had at least one full-time employee inthe following industries: education, electrical and utilities, agriculture, manufacturing, municipal,healthcare, service, pulp and paper, forestry, and mining. Other industries were not examined.
2.2. Sampling and Recruitment
Workplaces were identified by random stratified sampling based on the following variables:industrial sector, geographic region, and size. Study recruitment took place from 15 March 2011, to 27August 2012, which began with the OLIP study’s health and safety association partners making initialcontact with organizations to solicit their interest. If an organization consented to take part in the study,the person most knowledgeable about health and safety at their organization completed an onlineEnglish-language questionnaire. Respondents were also given the option to complete the questionnaireby mail or phone. Questionnaires were administered to each respondent in a random sequence. Threeto ten follow-up e-mails or phone calls were sent to remind participants to complete questionnaires.The study was approved by the University of Toronto’s research ethics board (protocol 25363).
2.3. Measures
2.3.1. Independent Variables: Workplace Demographic Characteristics
The independent variables used in the analysis were workplace demographic characteristicschosen a priori from the available literature as they were found to be linked to the co-occurrence of OHSand wellness activities. The following variables were examined, workplace size (four categories; smalland without a Joint Health and Safety Committee, JHSC (reference category)), union status (unionized,non-unionized (reference category), don’t know), industry sector (eight sectors; manufacturing sector(reference category)). Workplace culture factors previously found to be associated with OHS andwellness implementation [19,23] were examined using a measure of workplace health and safetyleadership (lowest = 1 (reference category), highest = 4), and a measure of people-oriented culture(lowest = 1 (reference category), highest = 4) (Supplementary Table S1).
Union status (i.e., at least part of the workforce is represented by a union) was self-reported in theOLIP questionnaire. Questionnaire responses were linked to corresponding 2009 WSIB administrativerecords to obtain additional information on a workplace’s industry sector classification. Workplacesize was self-reported and categorized according to Statistics Canada classifications [24] as follows,small workplaces had 1 to 99 employees, medium workplaces had 100 to 499 employees, and largeworkplaces had ≥500 employees. Workplace size was a proxy of OHS infrastructure and accordingly,small workplaces were further classified by whether they reported having a JHSC (consists of labor andmanagement representatives regularly meet to deal with health and safety issues). This categorizationwas based on the mandatory Ontario labor requirement that workplaces with >20 employees musthave a JHSC. An organization’s leadership support and culture were examined using two subscalesselected a priori from the Organizational Policies and Practices questionnaire [25,26]: Health and SafetyLeadership (six items) and People-Oriented Culture (four items). Participants rated the extent theirorganization achieved these subscales on a five-point scale from 0% (never) to 100% (always). Eachsubscale item was averaged to a score ranging from 0 (low) to 4 (high).
2.3.2. Occupational Health and Safety and Wellness Activities
A workplace’s OHS activities were measured by the availability of factors related to safe andeffective OHS performance as an alternative measure to the number of OHS activities offered byworkplaces as these can vary by working conditions and industry sector. For example, workplacesin high hazard industries are likely to overrepresent higher OHS activities than other workplaces.
114
IJERPH 2018, 15, 2739
Occupational health and safety performance was measured using the Institute for Work & Health’sOrganizational Performance Metric (IWH-OPM) tool, which has been shown to be predictive (i.e.,valid and reliable) of future injury and illness rates [27,28]. The eight-item IWH-OPM tool wasdeveloped by a consensus process among a team of researchers and health and safety professionals [28].For each IWH-OPM item, respondents rated the percent of time that certain practices occurred in theirworkplace, from 1 (0–20%) to 5 (80–100%). Scores for each item were summed to estimate a total OHSperformance score, with a highest score of 40 (a score of 5 for all items) indicating that all eight OHSpractices took place most to all the time in a workplace.
A workplace’s wellness activities were assessed by dichotomous (“yes” or “no”) responses tothe question: “during the last 12 months, did your company offer any of the following programs toemployees and/or their families?” The range of wellness activities were selected from the literatureand the Centers for Disease Control and Prevention’s Workplace Health Model [29,30]. Wellnessprograms included screenings (blood pressure, diabetes, cholesterol, and cancer), smoking cessationclasses, physical activity and/or fitness classes, and educational resources. Wellness policies includedflexible work hours to engage in wellness activities, encouraging fitness breaks, and healthy foodchoices. Supportive environments for wellness activities included providing shower facilities, signageto encourage stair use, and on-site fitness facilities or walking trails. The total number of wellnessactivities was derived from a total score of 25 possible options.
2.3.3. Outcome Variable: Co-Occurrence of Occupational Health and Safety and Wellness Activities
Occupational health and safety performance and wellness activities were examined as continuousvariables and categorized into profiles based on similar response probability patterns for the totalscores of each activity.
2.4. Analyses
Statistical analyses were conducted using commercially-available statistical software, SAS v. 9.4(SAS Institute Inc., Cary, NC, USA) [31] and Mplus v. 8.0 (Muthén & Muthén, Los Angeles, CA,USA) [32], and tests were two-sided with significance set at p = 0.05. Workplaces represented byOLIP questionnaire responses were statistically weighted to permit inferences from the sample to acomparable population of Ontario organizations based on strata of workplace size, region, and industrysector. For RQ1, mean values of OHS and wellness activities were compared separately accordingto workplace size, union status, industry sector, health and safety leadership, and people-orientedculture. Analysis of variance was used to examine differences in the mean OHS and wellness activitiesscores. Workplaces were assigned to ‘profiles’ based on the probability that they had similar numbersof OHS and wellness activities to other workplaces using Mplus’s latent profile analysis function.The latent profile analysis statistical technique aims to recover hidden groups from observed data,similar to clustering techniques, but is more flexible because the approach is based on an explicitmodel of the data, and accounts for the fact that recovered groups are uncertain [33]. Data on OHSperformance scores and number of wellness activities were transferred from SAS to Mplus andanalyzed as continuous variables in a mixture model with sample weights. Several models were fitwith increasing numbers of profiles (one profile, two profiles, three profiles etc.). A decision on themost suitable number of profiles fitting the data was made by inspecting model-fit statistics for theLo–Mendell–Rubin adjusted likelihood ratio test. The Lo–Mendell–Rubin test had a p-value of 0.58when comparing four profiles to three profiles, suggesting that three profiles sufficiently modelledthe data. For RQ2, associations between the latent profile groups and workplace demographiccharacteristics (independent variables) were estimated using multinomial logistic regression bytransferring latent profile probability data generated from Mplus back into SAS and matching them tocorresponding data from individual survey respondents. The odds of a co-occurrence profile associatedwith a workplace characteristic of interest compared to the odds of the lowest co-occurrence profile
115
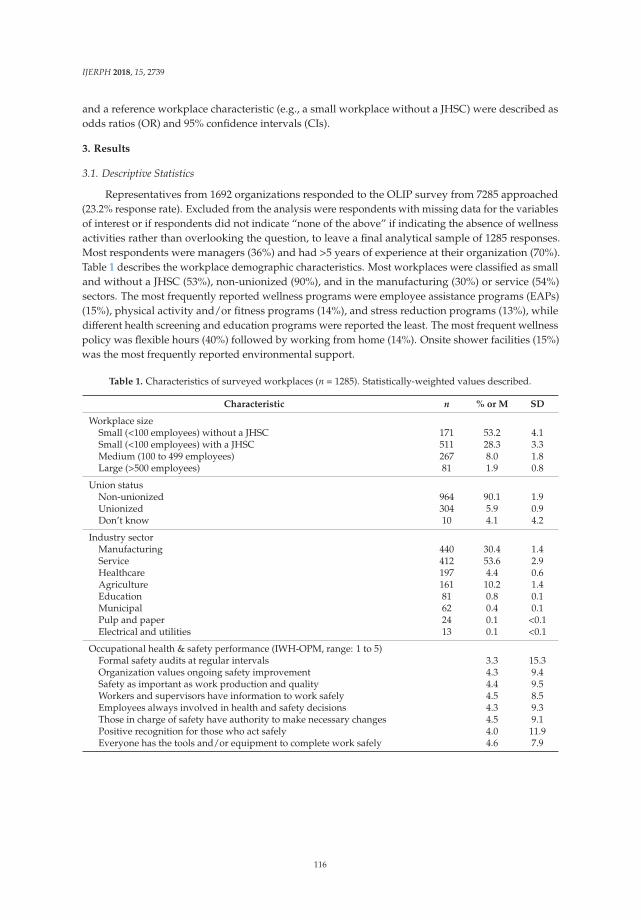
IJERPH 2018, 15, 2739
and a reference workplace characteristic (e.g., a small workplace without a JHSC) were described asodds ratios (OR) and 95% confidence intervals (CIs).
3. Results
3.1. Descriptive Statistics
Representatives from 1692 organizations responded to the OLIP survey from 7285 approached(23.2% response rate). Excluded from the analysis were respondents with missing data for the variablesof interest or if respondents did not indicate “none of the above” if indicating the absence of wellnessactivities rather than overlooking the question, to leave a final analytical sample of 1285 responses.Most respondents were managers (36%) and had >5 years of experience at their organization (70%).Table 1 describes the workplace demographic characteristics. Most workplaces were classified as smalland without a JHSC (53%), non-unionized (90%), and in the manufacturing (30%) or service (54%)sectors. The most frequently reported wellness programs were employee assistance programs (EAPs)(15%), physical activity and/or fitness programs (14%), and stress reduction programs (13%), whiledifferent health screening and education programs were reported the least. The most frequent wellnesspolicy was flexible hours (40%) followed by working from home (14%). Onsite shower facilities (15%)was the most frequently reported environmental support.
Table 1. Characteristics of surveyed workplaces (n = 1285). Statistically-weighted values described.
Characteristic n % or M SD
Workplace sizeSmall (<100 employees) without a JHSC 171 53.2 4.1Small (<100 employees) with a JHSC 511 28.3 3.3Medium (100 to 499 employees) 267 8.0 1.8Large (>500 employees) 81 1.9 0.8
Union statusNon-unionized 964 90.1 1.9Unionized 304 5.9 0.9Don’t know 10 4.1 4.2
Industry sectorManufacturing 440 30.4 1.4Service 412 53.6 2.9Healthcare 197 4.4 0.6Agriculture 161 10.2 1.4Education 81 0.8 0.1Municipal 62 0.4 0.1Pulp and paper 24 0.1 <0.1Electrical and utilities 13 0.1 <0.1
Occupational health & safety performance (IWH-OPM, range: 1 to 5)Formal safety audits at regular intervals 3.3 15.3Organization values ongoing safety improvement 4.3 9.4Safety as important as work production and quality 4.4 9.5Workers and supervisors have information to work safely 4.5 8.5Employees always involved in health and safety decisions 4.3 9.3Those in charge of safety have authority to make necessary changes 4.5 9.1Positive recognition for those who act safely 4.0 11.9Everyone has the tools and/or equipment to complete work safely 4.6 7.9
116
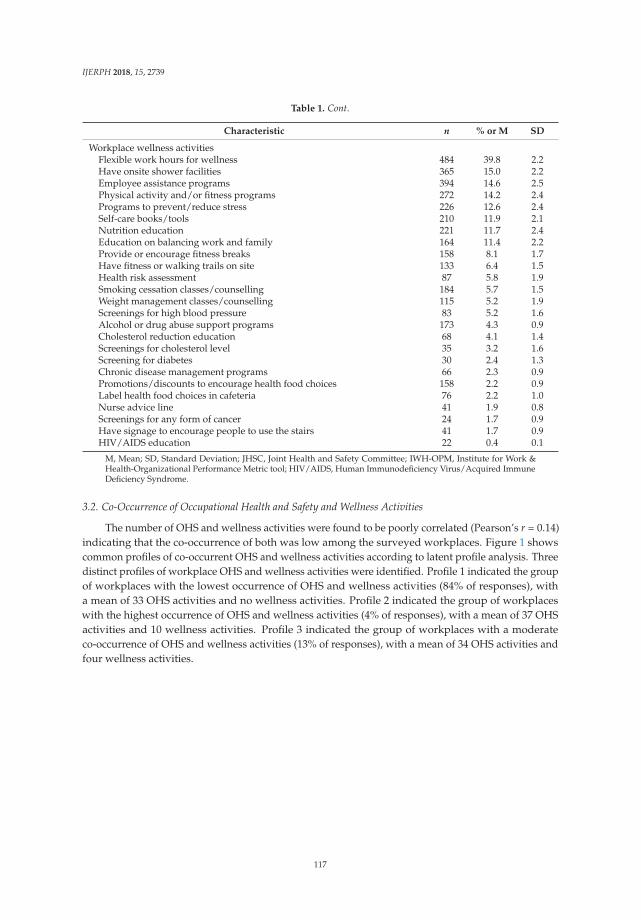
IJERPH 2018, 15, 2739
Table 1. Cont.
Characteristic n % or M SD
Workplace wellness activitiesFlexible work hours for wellness 484 39.8 2.2Have onsite shower facilities 365 15.0 2.2Employee assistance programs 394 14.6 2.5Physical activity and/or fitness programs 272 14.2 2.4Programs to prevent/reduce stress 226 12.6 2.4Self-care books/tools 210 11.9 2.1Nutrition education 221 11.7 2.4Education on balancing work and family 164 11.4 2.2Provide or encourage fitness breaks 158 8.1 1.7Have fitness or walking trails on site 133 6.4 1.5Health risk assessment 87 5.8 1.9Smoking cessation classes/counselling 184 5.7 1.5Weight management classes/counselling 115 5.2 1.9Screenings for high blood pressure 83 5.2 1.6Alcohol or drug abuse support programs 173 4.3 0.9Cholesterol reduction education 68 4.1 1.4Screenings for cholesterol level 35 3.2 1.6Screening for diabetes 30 2.4 1.3Chronic disease management programs 66 2.3 0.9Promotions/discounts to encourage health food choices 158 2.2 0.9Label health food choices in cafeteria 76 2.2 1.0Nurse advice line 41 1.9 0.8Screenings for any form of cancer 24 1.7 0.9Have signage to encourage people to use the stairs 41 1.7 0.9HIV/AIDS education 22 0.4 0.1
M, Mean; SD, Standard Deviation; JHSC, Joint Health and Safety Committee; IWH-OPM, Institute for Work &Health-Organizational Performance Metric tool; HIV/AIDS, Human Immunodeficiency Virus/Acquired ImmuneDeficiency Syndrome.
3.2. Co-Occurrence of Occupational Health and Safety and Wellness Activities
The number of OHS and wellness activities were found to be poorly correlated (Pearson’s r = 0.14)indicating that the co-occurrence of both was low among the surveyed workplaces. Figure 1 showscommon profiles of co-occurrent OHS and wellness activities according to latent profile analysis. Threedistinct profiles of workplace OHS and wellness activities were identified. Profile 1 indicated the groupof workplaces with the lowest occurrence of OHS and wellness activities (84% of responses), witha mean of 33 OHS activities and no wellness activities. Profile 2 indicated the group of workplaceswith the highest occurrence of OHS and wellness activities (4% of responses), with a mean of 37 OHSactivities and 10 wellness activities. Profile 3 indicated the group of workplaces with a moderateco-occurrence of OHS and wellness activities (13% of responses), with a mean of 34 OHS activities andfour wellness activities.
117
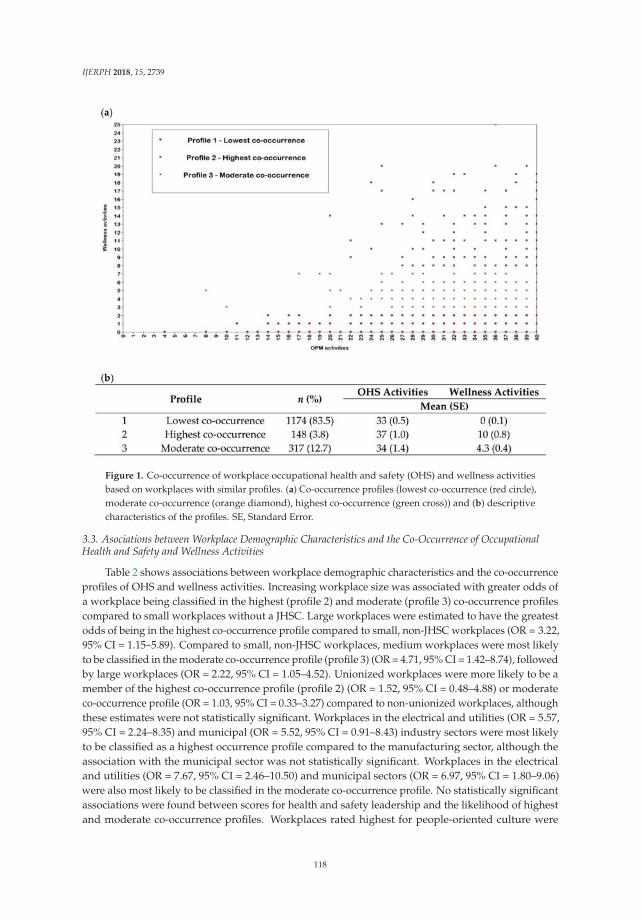
IJERPH 2018, 15, 2739
Figure 1. Co-occurrence of workplace occupational health and safety (OHS) and wellness activitiesbased on workplaces with similar profiles. (a) Co-occurrence profiles (lowest co-occurrence (red circle),moderate co-occurrence (orange diamond), highest co-occurrence (green cross)) and (b) descriptivecharacteristics of the profiles. SE, Standard Error.
3.3. Asociations between Workplace Demographic Characteristics and the Co-Occurrence of OccupationalHealth and Safety and Wellness Activities
Table 2 shows associations between workplace demographic characteristics and the co-occurrenceprofiles of OHS and wellness activities. Increasing workplace size was associated with greater odds ofa workplace being classified in the highest (profile 2) and moderate (profile 3) co-occurrence profilescompared to small workplaces without a JHSC. Large workplaces were estimated to have the greatestodds of being in the highest co-occurrence profile compared to small, non-JHSC workplaces (OR = 3.22,95% CI = 1.15–5.89). Compared to small, non-JHSC workplaces, medium workplaces were most likelyto be classified in the moderate co-occurrence profile (profile 3) (OR = 4.71, 95% CI = 1.42–8.74), followedby large workplaces (OR = 2.22, 95% CI = 1.05–4.52). Unionized workplaces were more likely to be amember of the highest co-occurrence profile (profile 2) (OR = 1.52, 95% CI = 0.48–4.88) or moderateco-occurrence profile (OR = 1.03, 95% CI = 0.33–3.27) compared to non-unionized workplaces, althoughthese estimates were not statistically significant. Workplaces in the electrical and utilities (OR = 5.57,95% CI = 2.24–8.35) and municipal (OR = 5.52, 95% CI = 0.91–8.43) industry sectors were most likelyto be classified as a highest occurrence profile compared to the manufacturing sector, although theassociation with the municipal sector was not statistically significant. Workplaces in the electricaland utilities (OR = 7.67, 95% CI = 2.46–10.50) and municipal sectors (OR = 6.97, 95% CI = 1.80–9.06)were also most likely to be classified in the moderate co-occurrence profile. No statistically significantassociations were found between scores for health and safety leadership and the likelihood of highestand moderate co-occurrence profiles. Workplaces rated highest for people-oriented culture were
118
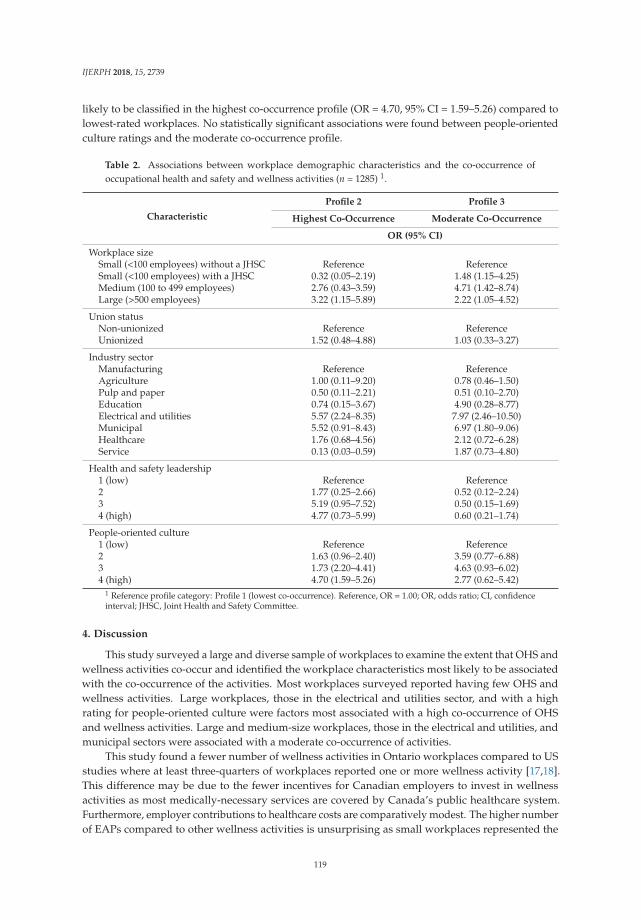
IJERPH 2018, 15, 2739
likely to be classified in the highest co-occurrence profile (OR = 4.70, 95% CI = 1.59–5.26) compared tolowest-rated workplaces. No statistically significant associations were found between people-orientedculture ratings and the moderate co-occurrence profile.
Table 2. Associations between workplace demographic characteristics and the co-occurrence ofoccupational health and safety and wellness activities (n = 1285) 1.
Characteristic
Profile 2 Profile 3
Highest Co-Occurrence Moderate Co-Occurrence
OR (95% CI)
Workplace sizeSmall (<100 employees) without a JHSC Reference ReferenceSmall (<100 employees) with a JHSC 0.32 (0.05–2.19) 1.48 (1.15–4.25)Medium (100 to 499 employees) 2.76 (0.43–3.59) 4.71 (1.42–8.74)Large (>500 employees) 3.22 (1.15–5.89) 2.22 (1.05–4.52)
Union statusNon-unionized Reference ReferenceUnionized 1.52 (0.48–4.88) 1.03 (0.33–3.27)
Industry sectorManufacturing Reference ReferenceAgriculture 1.00 (0.11–9.20) 0.78 (0.46–1.50)Pulp and paper 0.50 (0.11–2.21) 0.51 (0.10–2.70)Education 0.74 (0.15–3.67) 4.90 (0.28–8.77)Electrical and utilities 5.57 (2.24–8.35) 7.97 (2.46–10.50)Municipal 5.52 (0.91–8.43) 6.97 (1.80–9.06)Healthcare 1.76 (0.68–4.56) 2.12 (0.72–6.28)Service 0.13 (0.03–0.59) 1.87 (0.73–4.80)
Health and safety leadership1 (low) Reference Reference2 1.77 (0.25–2.66) 0.52 (0.12–2.24)3 5.19 (0.95–7.52) 0.50 (0.15–1.69)4 (high) 4.77 (0.73–5.99) 0.60 (0.21–1.74)
People-oriented culture1 (low) Reference Reference2 1.63 (0.96–2.40) 3.59 (0.77–6.88)3 1.73 (2.20–4.41) 4.63 (0.93–6.02)4 (high) 4.70 (1.59–5.26) 2.77 (0.62–5.42)
1 Reference profile category: Profile 1 (lowest co-occurrence). Reference, OR = 1.00; OR, odds ratio; CI, confidenceinterval; JHSC, Joint Health and Safety Committee.
4. Discussion
This study surveyed a large and diverse sample of workplaces to examine the extent that OHS andwellness activities co-occur and identified the workplace characteristics most likely to be associatedwith the co-occurrence of the activities. Most workplaces surveyed reported having few OHS andwellness activities. Large workplaces, those in the electrical and utilities sector, and with a highrating for people-oriented culture were factors most associated with a high co-occurrence of OHSand wellness activities. Large and medium-size workplaces, those in the electrical and utilities, andmunicipal sectors were associated with a moderate co-occurrence of activities.
This study found a fewer number of wellness activities in Ontario workplaces compared to USstudies where at least three-quarters of workplaces reported one or more wellness activity [17,18].This difference may be due to the fewer incentives for Canadian employers to invest in wellnessactivities as most medically-necessary services are covered by Canada’s public healthcare system.Furthermore, employer contributions to healthcare costs are comparatively modest. The higher numberof EAPs compared to other wellness activities is unsurprising as small workplaces represented the
119
IJERPH 2018, 15, 2739
highest proportion of respondents in the study. The outsourcing of resources to EAPs can representa better investment for small workplaces compared to more costly investments in onsite wellnessactivities [20]. Small organizations also experience several obstacles to implementing wellness activitiessuch as constraints in assigning resources and dedicated staff for wellness initiatives, perceiving a lackof employee interest in participating in wellness activities, or have poor access to health promotionresources and wellness providers [20]. While stress management, physical activity promotion, andflexible hours were reported frequently, others such as healthy food choices and shower facilities wereless frequently reported. This suggests that workplaces might be primarily focusing on encouragingtheir workers to change their own behaviors. Yet only focusing on changing individual behaviorsis unlikely to lead to meaningful worker health improvements since a small percentage of workersparticipate in wellness activities without workplace policies and environmental supports also inplace [3].
A small proportion of workplaces indicated a moderate or high co-occurrence of OHS andwellness activities, and similar findings have also been reported elsewhere [17,18]. Medium andlarge organizations were more likely to provide moderate to high co-occurrence of OHS and wellnessactivities compared to small workplaces, while having a JHSC did not show meaningful differences inwellness activities among small workplaces. This suggests that medium- to large-size workplaces aremore likely than small workplaces to have the resources and supports in place to promote these effortsconcurrently. Workplaces in the service, agriculture, and pulp and paper sectors were least likely toreport co-occurring activities, while the electrical and utilities and municipal sectors were most likely.These differ from findings previously reported among employers in Massachusetts [18]. Whether thedifferences in our study reflect true differences in the employer population in Ontario compared toMassachusetts or reflects selection bias between the two studies, requires closer inspection. Furtherresearch is also needed to examine the workplace practices in sectors pertaining to low and highOHS and wellness activities to better understand the reasons for the implementation differences inCanada. Our findings also suggest that a people-oriented culture can at the very least support a higherimplementation of wellness activities. Employer efforts to create a workplace culture of trust andrespect might enhance workers’ receptivity and openness to messages and programs designed tochange behaviors and improve health [34,35].
Some limitations need to also be acknowledged when interpreting these findings. First, this wasa cross-sectional study and causal relationships cannot be directly inferred. Second, the responserate was low, although the study’s large initial sample size can facilitate the detection of more robustand reproducible statistical relationships than previous research with smaller sample sizes. We alsoreduced nonresponse bias by statistically weighting all modelling estimates to infer responses froma population of comparable organizations in the Ontario labor market. Third, our findings are onlygeneralizable to the industry sectors we sampled and future studies need to examine how our findingsrelate to other industries such as the finance, information, professional, and entertainment sectors.Fourth, our use of a self-reported survey is prone to recall and social desirability biases. Differentialmeasurement error is also possible across OHS and wellness activities. Respondents to the surveywere selected based on their knowledge of OHS activities in the workplace, not on wellness activities.As such, it is possible that respondents could estimate OHS activities more accurately than wellnessactivities. Fifth, it is possible that some wellness activities were counted more than once if theywere also provided as part of an EAP service (e.g., education, risk management tools, and self-carematerials). Nonetheless, we conducted a sensitivity analysis and found that co-occurrence profiles didnot meaningfully change when wellness activities that might be part of an EAP were removed. Lastly,the OLIP survey was not designed to collect detailed wellness information or the extent that these areintegrated and coordinated with OHS activities.
Integrated OHS and wellness activities are widely promoted as an effective approach to chronicdisease prevention [36]. This is partly explained by the emergence of evidence supporting the idea thatworkplace factors contribute to adverse health outcomes traditionally considered to be unrelated to
120
IJERPH 2018, 15, 2739
work (such as stress, heart disease, and mental health) [10,11,37]. While distinguishing workplaces bytheir implementation of OHS and wellness activities may not reflect a truly integrated worker healthapproach [23], our findings provide a better understanding of the workplace factors associated withhaving suitable resources to support an integrated approach in the Canadian labor market. In 2016, apanel report from the National Institute of Health Pathways to Prevention Workshop identified smallworkplaces as a priority area for supporting integrated approaches through Total Worker Health® [38].However, as our study and others have shown [15–18], there is a lack of demonstrated effectivenessin smaller workplaces in the concurrent adoption of health protection and wellness programming.Smaller workplaces might not integrate their OHS and wellness resources not because of a lack ofsupport or motivation per se, but because of a lack of resources, including personnel, which might makeit challenging to just perform traditional OHS hazard control alone [39]. Findings show that largerworkplaces, with a people-oriented culture, and in the electrical and utilities, and municipal sectors areassociated with more health protection and wellness resources that can be streamlined into integratedapproaches. The next logical step is to examine intermediate and long-term health and productivitychanges for these workplaces expected to benefit the most from co-occurring and integrated OHSand wellness activities. Subsequent findings can inform studies that are extended or scaled to otherindustries and smaller workplaces. Actionable recommendations whereby Canadian workplaces canintegrate their existing OHS and wellness activities and ingrain these within a workplace’s cultureis also an area of research that needs to be explored further. Integration can also be enabled by anintegrated safety and wellness committee, shared budgets and resources, and incentivizing employeesin health protection and health promotion efforts [23].
5. Conclusions
This study provides valuable information on the co-occurrence of OHS and wellness activitiesand identifies workplace demographic factors most associated with their implementation in Canadianworkplaces. Large workplaces, those in the electrical and utilities sector, and with a high rating forpeople-oriented culture are factors strongly related to the implementation of both OHS and wellnessand might benefit most from integrated worker health activities. Future research needs to understandhow to facilitate the uptake of OHS and wellness activities in workplaces with fewer concomitantorganizational resources to increase OHS and wellness implementation. Furthermore, our findingsneed to be verified in other workplace contexts that were not explored in this study, and the factors thatinfluence organizational change and worker participation need also to be better understood. Finally, itwill be important to understand how to streamline OHS and wellness activities in workplaces for anintegrated worker health approach.
Supplementary Materials: The following are available online at http://www.mdpi.com/1660-4601/15/12/2739/s1, Table S1: Ontario Leading Indicators Project (OLIP): survey variable names.
Author Contributions: Conceptualization, A.B. and B.C.A.III; Methodology, A.B.; Software, A.B.; Validation, A.B.and B.C.A.III; Formal Analysis, A.B.; Investigation, A.B.; Resources, A.B., P.M.S., and B.C.A.III; Data Curation,C.N.S. and B.C.A.III; Writing—Original draft preparation, A.B.; Writing—Review and editing, C.N.S., P.M.S.,L.S.R., I.A.S., and B.C.A.III; Visualization, A.B.; Supervision, B.C.A.III; Project Administration, C.N.S.; FundingAcquisition, C.N.S., P.M.S., L.S.R., I.A.S., and B.C.A.III.
Funding: This research was supported by a grant from the Workplace Safety and Insurance Board’s ResearchAdvisory Council (#09032) and the Province of Ontario, Canada.
Acknowledgments: The authors thank the other members of the ‘Ontario Leading Indicators Project’ researchteam: Sheilah Hogg-Johnson, Cameron Mustard, Michael Swift, Selahadin Ibrahim, and Sara Macdonald.The authors also provide a special thank you to our health and safety association partners in Ontario whohelped us recruit workplaces, and to the workplaces themselves for participating.
Conflicts of Interest: The authors declare no conflicts of interest. The funders had no role in the design of thestudy; in the collection, analyses, or interpretation of data; in the writing of the manuscript, or in the decision topublish the results.
121
IJERPH 2018, 15, 2739
References
1. Raphael, D. Social Determinants of Health: Canadian Perspectives; Canadian Scholars’ Press and Women’s Press:Toronto, ON, Canada, 2009; pp. 150–191.
2. Solar, O.; Irwin, A. A conceptual framework for action on the social determinants of health. In SocialDeterminants of Health Discussion Paper 2 (Policy and Practice); WHO Press: Geneva, Switzerland, 2010;pp. 32–33.
3. Schulte, P.A.; Pandalai, S.; Wulsin, V.; Chun, H. Interaction of occupational and personal risk factors inworkforce health and safety. Am. J. Public Health 2012, 102, 434–448. [CrossRef] [PubMed]
4. Ljungblad, C.; Granström, F.; Dellve, L.; Åkerlind, I. Workplace health promotion and working conditions asdeterminants of employee health. Int. J. Workplace Health Manag. 2014, 7, 89–104. [CrossRef]
5. Musich, S.; Napier, D.; Edington, D.W. The association of health risks with workers’ compensation costs.J. Occup. Environ. Med. 2001, 43, 534–541. [CrossRef] [PubMed]
6. Trogdon, J.; Finkelstein, E.; Hylands, T.; Dellea, P.; Kamal-Bahl, S. Indirect costs of obesity: A review of thecurrent literature. Obes. Rev. 2008, 9, 489–500. [CrossRef] [PubMed]
7. Conn, V.S.; Hafdahl, A.R.; Cooper, P.S.; Brown, L.M.; Lusk, S.L. Meta-analysis of workplace physical activityinterventions. Am. J. Prev. Med. 2009, 37, 330–339. [CrossRef] [PubMed]
8. Noblet, A.; LaMontagne, A.D. The role of workplace health promotion in addressing job stress.Health Promot. Int. 2006, 21, 346–353. [CrossRef]
9. Hymel, P.A.; Loeppke, R.R.; Baase, C.M.; Burton, W.N.; Hartenbaum, N.P.; Hudson, T.W.; McLellan, R.K.;Mueller, K.L.; Roberts, M.A.; Yarborough, C.M. Workplace health protection and promotion: A new pathwayfor a healthier—And safer—Workforce. J. Occup. Environ. Med. 2011, 53, 695–702. [CrossRef] [PubMed]
10. Sorensen, G.; Stoddard, A.M.; LaMontagne, A.D.; Emmons, K.; Hunt, M.K.; Youngstrom, R.; McLellan, D.;Christiani, D.C. A comprehensive worksite cancer prevention intervention: Behavior change results from arandomized controlled trial (United States). Cancer Causes Control 2002, 13, 493–502. [CrossRef]
11. Cooklin, A.; Joss, N.; Husser, E.; Oldenburg, B. Integrated approaches to occupational health and safety: Asystematic review. Am. J. Health Promot. 2017, 31, 401–412. [CrossRef]
12. World Health Organization. Healthy Workplaces: A WHO Global Model for Action. For Employers, Workers,Policy-Makers and Practitioners; World Health Organization: Geneva, Switzerland, 2010.
13. International Labour Organization. The SOLVE Training Package: Integrating Health Promotion intoWorkplace OSH Policies. Available online: http://www.ilo.org/safework/info/instr/WCMS_178438/lang--en/index.htm (accessed on 21 November 2018).
14. Schill, A.L.; Chosewood, L.C. The NIOSH Total Worker Health™ program: An overview. J. Occup.Environ. Med. 2013, 55, S8–S11. [CrossRef] [PubMed]
15. Hannon, P.A.; Garson, G.; Harris, J.R.; Hammerback, K.; Sopher, C.J.; Clegg-Thorp, C. Workplace healthpromotion implementation, readiness, and capacity among mid-sized employers in low-wage industries: Anational survey. J. Occup. Environ. Med. 2012, 54, 1337–1343. [CrossRef]
16. Sinclair, R.C.; Cunningham, T.R. Safety activities in small businesses. Saf. Sci. 2014, 64, 32–38. [CrossRef][PubMed]
17. McLellan, D.L.; Cabán-Martinez, A.J.; Nelson, C.C.; Pronk, N.P.; Katz, J.N.; Allen, J.D.; Davis, K.L.;Wagner, G.R.; Sorensen, G. Organizational characteristics influence implementation of worksite healthprotection and promotion programs: Evidence from smaller businesses. J. Occup. Environ. Med. 2015, 57,1009–1016. [CrossRef] [PubMed]
18. Tremblay, P.A.; Nobrega, S.; Davis, L.; Erck, E.; Punnett, L. Healthy workplaces? A survey of Massachusettsemployers. Am. J. Health Promot. 2013, 27, 390–400. [CrossRef] [PubMed]
19. McLellan, D.L.; Williams, J.A.; Katz, J.N.; Pronk, N.P.; Wagner, G.R.; Cabán-Martinez, A.J.; Nelson, C.C.;Sorensen, G. Key organizational characteristics for integrated approaches to protect and promote workerhealth in smaller enterprises. J. Occup. Environ. Med. 2017, 59, 289–294. [CrossRef]
20. McCoy, M.K.; Stinson, M.K.; Scott, M.K.; Tenney, M.L.; Newman, L.S. Health promotion in small business: Asystematic review of factors influencing adoption and effectiveness of worksite wellness programs. J. Occup.Environ. Med. 2014, 56, 579–587. [CrossRef] [PubMed]
122
IJERPH 2018, 15, 2739
21. Institute for Work & Health. Measures in the Ontario Leading Indicators Project (OLIP) Survey. Availableonline: https://www.iwh.on.ca/sites/iwh/files/iwh/reports/iwh_project_olip_about_the_measures_august_2013.pdf (accessed on 21 November 2018).
22. Workplace Safety and Insurance Board of Ontario. 2017 Highlights: By the Numbers. Available online:http://www.wsibstatistics.ca/S2/Workplaces%20%20WSIB%20By%20The%20Numbers_P.php (accessedon 21 November 2018).
23. Sorensen, G.; McLellan, D.; Dennerlein, J.T.; Pronk, N.P.; Allen, J.D.; Boden, L.I.; Okechukwu, C.A.;Hashimoto, D.; Stoddard, A.; Wagner, G.R. Integration of health protection and health promotion: Rationale,indicators, and metrics. J. Occup. Environ. Med. 2013, 55, S12. [CrossRef]
24. Leung, D.; Rispoli, L.; Chan, R. Small, Medium-Sized, and Large Businesses in the Canadian Economy:Measuring Their Contribution to Gross Domestic Product from 2001 to 2008. Available online: https://www150.statcan.gc.ca/n1/en/pub/11f0027m/11f0027m2012082-eng.pdf (accessed on 21 November 2018).
25. Amick, B.C.; Habeck, R.V.; Hunt, A.; Fossel, A.H.; Chapin, A.; Keller, R.B.; Katz, J.N. Measuring the impactof organizational behaviors on work disability prevention and management. J. Occup. Rehabil. 2000, 10,21–38. [CrossRef]
26. Hunt, H.A.; Habeck, R.V.; VanTol, B.; Scully, S.M. Disability Prevention among Michigan Employers, 1988–1993;Report No. 93-004; W.E. Upjohn Institute for Employment Research: Kalamazoo, MI, USA, 1993.
27. Shea, T.; De Cieri, H.; Donohue, R.; Cooper, B.; Sheehan, C. Leading indicators of occupational health andsafety: An employee and workplace level validation study. Saf. Sci. 2016, 85, 293–304. [CrossRef]
28. Institute for Work & Health. Benchmarking Organizational Leading Indicators for the Prevention andManagement of Injuries and Illnesses: Final Report. Available online: https://www.iwh.on.ca/sites/iwh/files/iwh/reports/iwh_report_benchmarking_organizational_leading_indicators_2011.pdf (accessed on 21November 2018).
29. Centers for Disease Control and Prevention. Workplace Health Model. Available online: https://www.cdc.gov/workplacehealthpromotion/pdf/WorkplaceHealth-model-update.pdf (accessed on 21 November 2018).
30. Goetzel, R.Z.; Henke, R.M.; Tabrizi, M.; Pelletier, K.R.; Loeppke, R.; Ballard, D.W.; Grossmeier, J.;Anderson, D.R.; Yach, D.; Kelly, R.K. Do workplace health promotion (wellness) programs work? J. Occup.Environ. Med. 2014, 56, 927–934. [CrossRef]
31. SAS Institute. Base SAS 9.4 Procedures Guide; SAS Institute: Cary, NC, USA, 2015.32. Muthén, L.K.; Muthén, B.O. Mplus User’s Guide, 7th ed.; Muthén & Muthén: Los Angeles, CA, USA, 2012.33. Oberski, D. Mixture models: Latent profile and latent class analysis. In Modern Statistical Methods for
Human-Computer Interaction; Springer: Geneva, Switzerland, 2016; pp. 275–287.34. Aldana, S.G.; Anderson, D.R.; Adams, T.B.; Whitmer, R.W.; Merrill, R.M.; George, V.; Noyce, J. A review
of the knowledge base on healthy worksite culture. J. Occup. Environ. Med. 2012, 54, 414–419. [CrossRef][PubMed]
35. Pronk, N.; Allen, C. Chapter 26: A culture of health: Creating and sustaining supportive organizationalenvironments for health. In ACSM’s Worksite Health Handbook. A Guide to Building Healthy and ProductiveCompanies, 2nd ed.; Pronk, N., Ed.; Human Kinetics Publishers: Champaign, IL, USA, 2009; pp. 224–230.
36. Feltner, C.; Peterson, K.; Weber, R.P.; Cluff, L.; Coker-Schwimmer, E.; Viswanathan, M.; Lohr, K.N.The effectiveness of Total Worker Health interventions: A systematic review for a National Institutesof Health Pathways to Prevention Workshop. Ann. Intern. Med. 2016, 165, 262–269. [CrossRef] [PubMed]
37. Anger, W.K.; Elliot, D.L.; Bodner, T.; Olson, R.; Rohlman, D.S.; Truxillo, D.M.; Kuehl, K.S.; Hammer, L.B.;Montgomery, D. Effectiveness of Total Worker Health interventions. J. Occup. Health Psychol. 2015, 20,226–247. [CrossRef] [PubMed]
123
IJERPH 2018, 15, 2739
38. Bradley, C.J.; Grossman, D.C.; Hubbard, R.A.; Ortega, A.N.; Curry, S.J. Integrated interventions for improvingTotal Worker Health: A panel report from the National Institutes of Health Pathways to Prevention Workshop:Total Worker Health—What’s Work Got to Do with It? Ann. Intern. Med. 2016, 165, 279–283. [CrossRef][PubMed]
39. Rohlman, D.S.; Campo, S.; Hall, J.; Robinson, E.L.; Kelly, K.M. What could Total Worker Health® look like insmall enterprises? Ann. Work Expo. Health 2018, 62, S34–S41. [CrossRef] [PubMed]
© 2018 by the authors. Licensee MDPI, Basel, Switzerland. This article is an open accessarticle distributed under the terms and conditions of the Creative Commons Attribution(CC BY) license (http://creativecommons.org/licenses/by/4.0/).
124
International Journal of
Environmental Research
and Public Health
Article
New Burnout Evaluation Model Based on the BriefBurnout Questionnaire: Psychometric Propertiesfor Nursing
María del Carmen Pérez-Fuentes 1,* , María del Mar Molero Jurado 1, África Martos Martínez 1
and José Jesús Gázquez Linares 1,2
1 Department of Psychology, Faculty of Psychology, University of Almería, 04120 Almería, Spain;[email protected] (M.d.M.M.J.); [email protected] (Á.M.M.); [email protected] (J.J.G.L.)
2 Department of Psychology, Universidad Autónoma de Chile, Región Metropolitana,Providencia 7500000, Chile
* Correspondence: [email protected]; Tel.: +34-950-015-598
Received: 19 November 2018; Accepted: 30 November 2018; Published: 2 December 2018
Abstract: Health care personnel are considered one of the worker sectors most exposed to heavierworkloads and work stress. One of the consequences associated with the exposure to chronic stress isthe development of burnout syndrome. Given that evaluating this syndrome requires addressingthe context in which they are to be used, the purpose of this work was to analyze the psychometricproperties and structure of the Burnout Brief Questionnaire (CBB), and to propose a more suitableversion for its application to health professionals, and more specifically nurses. The final study samplewas made up of 1236 working nursing professionals. An exploratory factorial analysis was carriedout and a new model was proposed through a confirmatory factorial analysis. Thus, validation of theCBB questionnaire for nursing health care personnel showed an adequate discrimination of the itemsand a high internal consistency of the scale. With respect to the factorial analysis, four factors wereextracted from the revised model. Specifically, these new factors, called job dissatisfaction, socialclimate, personal impact, and motivational abandonment, showed an adequate index of adjustment.Thus, the Brief Burnout Questionnaire Revised for nursing staff has favorable psychometric properties,and this model can be applied to all health care professionals.
Keywords: burnout; psychometric properties; nursing
1. Introduction
The number of health care workers in Spain increases year after year, as the number of officialassociation members testifies, in fields such as medicine, which in 2015 increased by 1.9%. The numberof nurses rose by 3.4% [1] to nearly 300,000 registered nurses according to the latest data from theNational Statistics Institute [2]. Furthermore, the role of nursing personnel is more and more important,and the emotional skills and stressful work climate of nurses must be taken into account, but notonly for them, as there are now studies analyzing these factors even in students of physiotherapy,for example [3]. Therefore, nurses are gradually facing situations and settings with more pressure andheavier workloads [4], which produce scenarios filled with strain and job stress [5].
According to the Encyclopedia of Mental Health, burnout syndrome is a type of responseto chronic emotional and interpersonal stress factors at work, which is recognized as a seriousoccupational hazard [6]. The presence of stressors at work maintained over long periods of timecan cause burnout in workers, especially those who maintain a constant direct care relationship withservice users, as is the case of health care personnel [7], although this syndrome may also be discussedin other areas [8–10].
IJERPH 2018, 15, 2718; doi:10.3390/ijerph15122718 www.mdpi.com/journal/ijerph125
IJERPH 2018, 15, 2718
The presence of burnout syndrome in workers leads to physical, occupational, and psychologicalconsequences, in particular, cardiovascular problems, pain, depressive symptoms, sleep problems,alcohol abuse, absenteeism, and job dissatisfaction [11]. Its appearance has also been associated with amultitude of individual and psychosocial variables [12,13].
One of the behaviors associated with this syndrome is demotivation [5,14]. Specifically,the deterioration of professional motivation, which affects almost half of nursing personnel [15],is a process derived from the perception of absence of reward and culminates in the individual’sdepersonalization [16]. Motivation, which refers to choices of ends and means, depends in largepart on an individual’s beliefs and values at the time a situation is evaluated. Motivation generatesfeelings that lead to action on the job, while demotivation creates limits and promotes expressionsof displeasure and distress [17]. According to a study by Achour et al. [18], lack of recognition andmotivation are two challenges that health care personnel must face as heavier workloads are assignedand measurements of performance become stricter. This directly affects their performance and jobsatisfaction [19]. So nursing professionals with the most intrinsic motivation (that is, motivated by theirown enjoyment of performing the task for humanitarian reasons) and extrinsic motivation (associatedwith economic characteristics and scheduling flexibility) show higher levels of job satisfaction andless burnout [20].
Job satisfaction specifically refers to the enjoyment individuals find in their job [21]. Lack ofsatisfaction in health care jobs has been associated with the presence of burnout in workers, and also withthe intention of quitting the profession and diminishing quality of the care given [22,23]. According toFarnaz et al. [24], job satisfaction in nursing is associated mainly with environmental factors, in detrimentto sociodemographic and individual factors, so improving satisfaction in job positions involves enrichingthe characteristics of the organizations nurses work in.
The workplaces with the highest quality, with regard to both setting and structure, are associatedwith greater well-being and lower levels of burnout among health care personnel [25,26]. Therefore,it is of vital importance that healthy work environments, where the psychological health of nursingstaff is given attention, be promoted [27]. In turn, study of the prevention, treatment, and measurementof severe widespread problems in this population, such as burnout syndrome, must continueto progress [28].
The most widely used instrument for the evaluation of burnout is the Maslach Burnout Inventory(MBI) [29]. This instrument was designed for evaluating professionals, such as nurses, who performtheir job while interacting with users of their service [30], and has been extensively described andvalidated internationally [31]. Its manual describes burnout as occurring at high levels of emotionalexhaustion and depersonalization, in combination with low scores in personal accomplishment.However, other studies [32] make use of alternative proposals to determine the presence of burnout,such as the definition by Poncet et al. [33], who estimated that this syndrome is present amongprofessionals with a cumulative score over –9 on the MBI.
Although there are studies confirming the Maslach Burnout Inventory questionnaire’s threedimensions [34–36], other studies have found factor structures based on two [37,38] and fivedimensions [39,40]. Densten [39], after confirmatory analysis of the instrument, found that the structurebased on five scales was more strongly supported than the model of three, or even four. Thus, while thedepersonalization factor was maintained in this new division of factors, emotional exhaustion wasdivided into “somatic strain” and “psychological strain,” while personal accomplishment was brokendown into “self-accomplishment” and “working with others.”
Another alternative instrument to the MBI for evaluating burnout is the Brief Burnout Questionnaire(CBB) [41]. The CBB comprises 21 items that evaluate not only the syndrome itself, but also its antecedentsand consequences. That is, it understands burnout as a process [42]. The instrument was validatedin teaching professionals, showing adequate convergent validity with the MBI on the total burnoutscale (but not, however, on all the syndrome factors), so the authors recommended it for evaluatingsome elements present in the burnout process (specifically antecedents, burnout, and consequences), but
126
IJERPH 2018, 15, 2718
not for direct evaluation of its specific components. Few studies have used this questionnaire [43–45],as shown in the review by Ahola et al. [46], who indicated that they were unaware of the existence of thequestionnaire’s validation. It has also been adapted for use with housewives [47], in which a three-factorstructure similar to the one found in the original questionnaire was found. However, this instrumenthas received some criticism. For example, in the validation done in a sample of teachers in AragonProvince, Spain [48], no significant differences were found on some of the scales between men andwomen, which might be due to the inappropriateness of the items in showing the behavior associated oneach scale. The results have also shown low reliability, and it was concluded that its use has generatedlittle validity, mainly because of its factor division [49].
According to Domínguez-Lara [50], the multifactor internal structure of burnout evaluationinstruments must be analyzed considering the context where they are going to be used, since eventhough the construct may have a good theoretical basis, the configuration of its structure may varywhen used in real environments. Therefore, the purpose of this study is to show that the CBB is a validmodel for different cultures and societies, as this scale has awakened great interest in recent years.In addition to analyzing its psychometric properties and structure, this study proposes the best versionor model for its application to health care professionals, and nurses in particular.
2. Materials and Methods
2.1. Participants
The sample was made up of 1352 nurses selected at random from several health centers,and therefore actively employed at the time data were collected. Subjects who did not completethe questionnaire or who gave random answers (detected by control questions) were eliminated fromthe study. The final sample consisted of a total of 1236 participants, of whom 69.3% (n = 857) wereworking under temporary contracts and the other 30.7% (n = 379) had permanent contracts.
The mean participant age was 31.50 years (SD = 6.18), in a range of 21 to 57 years. Of the wholesample, 84.5% (n = 1044) were women and 15.5% (n = 192) were men, with a mean age of 31.65 years(SD = 6.23) and 30.71 years (SD = 6.17), respectively. Their marital status was 55% (n = 680) single,42.1% (n = 520) married or in a stable relationship, 2.8% (n = 34) divorced or separated, and 0.2% (n = 2)widowed. In addition, 68.9% (n = 852) of the participants had no children, 14.5% (n = 179) had 1 child,13.2% (n = 163) had 2 children, and the remaining 3.3% (n = 41) had 3 or more.
Their distribution by area of work was 32% (n = 396) staff nurse and 21.9% (n = 271) on emergencyteams, while 11.4% (n = 141) were working in the ICU, 10.7% (n = 132) in surgery, 2.3% (n = 28) inoutpatient care, and 4% (n = 50) in the mental health unit. The remaining 17.6% (n = 218) were workingin other areas.
2.2. Instruments
An ad hoc questionnaire was prepared to collect sociodemographic data (age, sex, marital status,and degree) and to compile information on their profession and work experience: years of experience,employment situation (permanent or temporary), work shifts (rotating, 12 h or more, nights only,and morning/afternoon), and number of patients attended to in a workday.
The CBB [41] was used to evaluate burnout syndrome in the professionals. This instrumentconsists of 21 items in three blocks corresponding to antecedents of burnout and its elements andconsequences. Even though the purpose of the questionnaire is to evaluate the professional burnoutprocess, it includes factors proposed in the Maslach and Jackson model [29] and components thatprecede and support it. The answer format is a 5-point Likert-type scale. Items 2, 4, 8, 9, and 16 mustbe inverted and recoded after inversion to find the corresponding overall subscale scores.
127
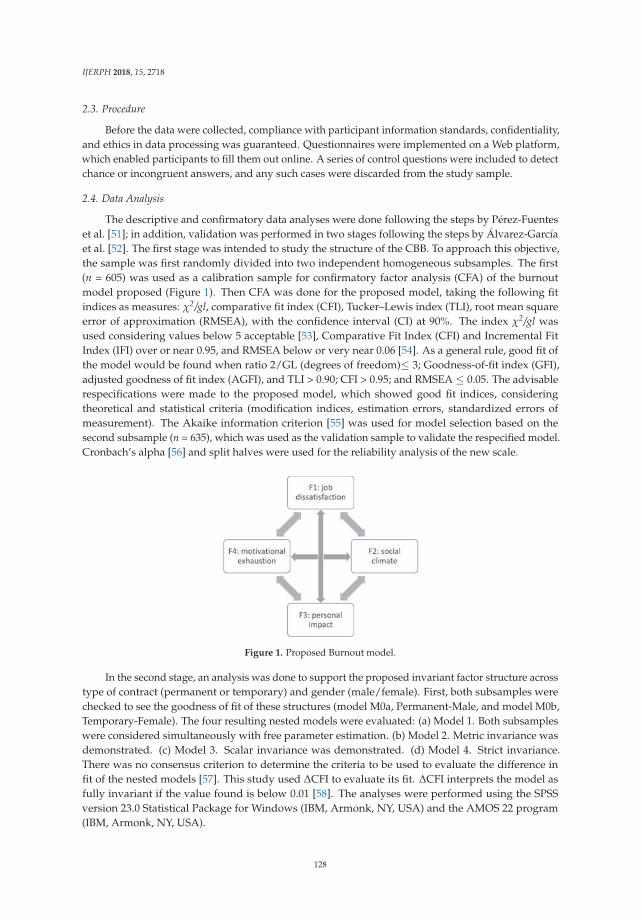
IJERPH 2018, 15, 2718
2.3. Procedure
Before the data were collected, compliance with participant information standards, confidentiality,and ethics in data processing was guaranteed. Questionnaires were implemented on a Web platform,which enabled participants to fill them out online. A series of control questions were included to detectchance or incongruent answers, and any such cases were discarded from the study sample.
2.4. Data Analysis
The descriptive and confirmatory data analyses were done following the steps by Pérez-Fuenteset al. [51]; in addition, validation was performed in two stages following the steps by Álvarez-Garcíaet al. [52]. The first stage was intended to study the structure of the CBB. To approach this objective,the sample was first randomly divided into two independent homogeneous subsamples. The first(n = 605) was used as a calibration sample for confirmatory factor analysis (CFA) of the burnoutmodel proposed (Figure 1). Then CFA was done for the proposed model, taking the following fitindices as measures: χ2/gl, comparative fit index (CFI), Tucker–Lewis index (TLI), root mean squareerror of approximation (RMSEA), with the confidence interval (CI) at 90%. The index χ2/gl wasused considering values below 5 acceptable [53], Comparative Fit Index (CFI) and Incremental FitIndex (IFI) over or near 0.95, and RMSEA below or very near 0.06 [54]. As a general rule, good fit ofthe model would be found when ratio 2/GL (degrees of freedom)≤ 3; Goodness-of-fit index (GFI),adjusted goodness of fit index (AGFI), and TLI > 0.90; CFI > 0.95; and RMSEA ≤ 0.05. The advisablerespecifications were made to the proposed model, which showed good fit indices, consideringtheoretical and statistical criteria (modification indices, estimation errors, standardized errors ofmeasurement). The Akaike information criterion [55] was used for model selection based on thesecond subsample (n = 635), which was used as the validation sample to validate the respecified model.Cronbach’s alpha [56] and split halves were used for the reliability analysis of the new scale.
Figure 1. Proposed Burnout model.
In the second stage, an analysis was done to support the proposed invariant factor structure acrosstype of contract (permanent or temporary) and gender (male/female). First, both subsamples werechecked to see the goodness of fit of these structures (model M0a, Permanent-Male, and model M0b,Temporary-Female). The four resulting nested models were evaluated: (a) Model 1. Both subsampleswere considered simultaneously with free parameter estimation. (b) Model 2. Metric invariance wasdemonstrated. (c) Model 3. Scalar invariance was demonstrated. (d) Model 4. Strict invariance.There was no consensus criterion to determine the criteria to be used to evaluate the difference infit of the nested models [57]. This study used ΔCFI to evaluate its fit. ΔCFI interprets the model asfully invariant if the value found is below 0.01 [58]. The analyses were performed using the SPSSversion 23.0 Statistical Package for Windows (IBM, Armonk, NY, USA) and the AMOS 22 program(IBM, Armonk, NY, USA).
128
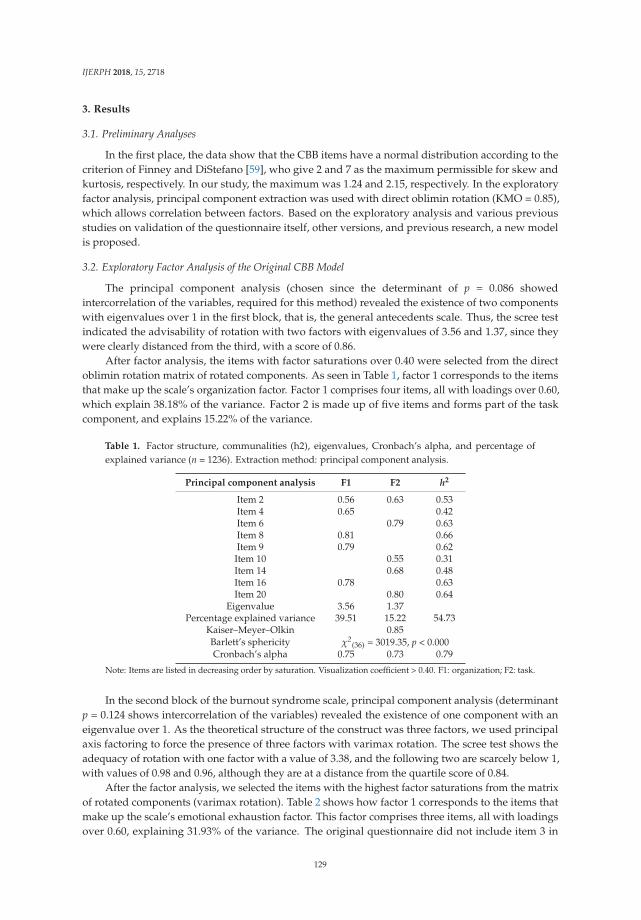
IJERPH 2018, 15, 2718
3. Results
3.1. Preliminary Analyses
In the first place, the data show that the CBB items have a normal distribution according to thecriterion of Finney and DiStefano [59], who give 2 and 7 as the maximum permissible for skew andkurtosis, respectively. In our study, the maximum was 1.24 and 2.15, respectively. In the exploratoryfactor analysis, principal component extraction was used with direct oblimin rotation (KMO = 0.85),which allows correlation between factors. Based on the exploratory analysis and various previousstudies on validation of the questionnaire itself, other versions, and previous research, a new modelis proposed.
3.2. Exploratory Factor Analysis of the Original CBB Model
The principal component analysis (chosen since the determinant of p = 0.086 showedintercorrelation of the variables, required for this method) revealed the existence of two componentswith eigenvalues over 1 in the first block, that is, the general antecedents scale. Thus, the scree testindicated the advisability of rotation with two factors with eigenvalues of 3.56 and 1.37, since theywere clearly distanced from the third, with a score of 0.86.
After factor analysis, the items with factor saturations over 0.40 were selected from the directoblimin rotation matrix of rotated components. As seen in Table 1, factor 1 corresponds to the itemsthat make up the scale’s organization factor. Factor 1 comprises four items, all with loadings over 0.60,which explain 38.18% of the variance. Factor 2 is made up of five items and forms part of the taskcomponent, and explains 15.22% of the variance.
Table 1. Factor structure, communalities (h2), eigenvalues, Cronbach’s alpha, and percentage ofexplained variance (n = 1236). Extraction method: principal component analysis.
Principal component analysis F1 F2 h2
Item 2 0.56 0.63 0.53Item 4 0.65 0.42Item 6 0.79 0.63Item 8 0.81 0.66Item 9 0.79 0.62Item 10 0.55 0.31Item 14 0.68 0.48Item 16 0.78 0.63Item 20 0.80 0.64
Eigenvalue 3.56 1.37Percentage explained variance 39.51 15.22 54.73
Kaiser–Meyer–Olkin 0.85Barlett’s sphericity χ2
(36) = 3019.35, p < 0.000Cronbach’s alpha 0.75 0.73 0.79
Note: Items are listed in decreasing order by saturation. Visualization coefficient > 0.40. F1: organization; F2: task.
In the second block of the burnout syndrome scale, principal component analysis (determinantp = 0.124 shows intercorrelation of the variables) revealed the existence of one component with aneigenvalue over 1. As the theoretical structure of the construct was three factors, we used principalaxis factoring to force the presence of three factors with varimax rotation. The scree test shows theadequacy of rotation with one factor with a value of 3.38, and the following two are scarcely below 1,with values of 0.98 and 0.96, although they are at a distance from the quartile score of 0.84.
After the factor analysis, we selected the items with the highest factor saturations from the matrixof rotated components (varimax rotation). Table 2 shows how factor 1 corresponds to the items thatmake up the scale’s emotional exhaustion factor. This factor comprises three items, all with loadingsover 0.60, explaining 31.93% of the variance. The original questionnaire did not include item 3 in
129
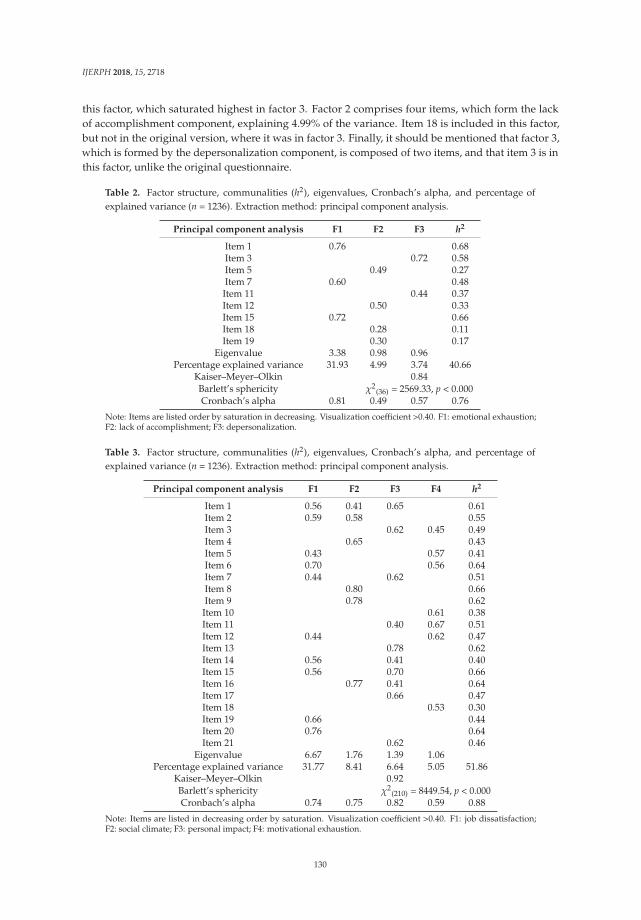
IJERPH 2018, 15, 2718
this factor, which saturated highest in factor 3. Factor 2 comprises four items, which form the lackof accomplishment component, explaining 4.99% of the variance. Item 18 is included in this factor,but not in the original version, where it was in factor 3. Finally, it should be mentioned that factor 3,which is formed by the depersonalization component, is composed of two items, and that item 3 is inthis factor, unlike the original questionnaire.
Table 2. Factor structure, communalities (h2), eigenvalues, Cronbach’s alpha, and percentage ofexplained variance (n = 1236). Extraction method: principal component analysis.
Principal component analysis F1 F2 F3 h2
Item 1 0.76 0.68Item 3 0.72 0.58Item 5 0.49 0.27Item 7 0.60 0.48
Item 11 0.44 0.37Item 12 0.50 0.33Item 15 0.72 0.66Item 18 0.28 0.11Item 19 0.30 0.17
Eigenvalue 3.38 0.98 0.96Percentage explained variance 31.93 4.99 3.74 40.66
Kaiser–Meyer–Olkin 0.84Barlett’s sphericity χ2
(36) = 2569.33, p < 0.000Cronbach’s alpha 0.81 0.49 0.57 0.76
Note: Items are listed order by saturation in decreasing. Visualization coefficient >0.40. F1: emotional exhaustion;F2: lack of accomplishment; F3: depersonalization.
Table 3. Factor structure, communalities (h2), eigenvalues, Cronbach’s alpha, and percentage ofexplained variance (n = 1236). Extraction method: principal component analysis.
Principal component analysis F1 F2 F3 F4 h2
Item 1 0.56 0.41 0.65 0.61Item 2 0.59 0.58 0.55Item 3 0.62 0.45 0.49Item 4 0.65 0.43Item 5 0.43 0.57 0.41Item 6 0.70 0.56 0.64Item 7 0.44 0.62 0.51Item 8 0.80 0.66Item 9 0.78 0.62Item 10 0.61 0.38Item 11 0.40 0.67 0.51Item 12 0.44 0.62 0.47Item 13 0.78 0.62Item 14 0.56 0.41 0.40Item 15 0.56 0.70 0.66Item 16 0.77 0.41 0.64Item 17 0.66 0.47Item 18 0.53 0.30Item 19 0.66 0.44Item 20 0.76 0.64Item 21 0.62 0.46
Eigenvalue 6.67 1.76 1.39 1.06Percentage explained variance 31.77 8.41 6.64 5.05 51.86
Kaiser–Meyer–Olkin 0.92Barlett’s sphericity χ2
(210) = 8449.54, p < 0.000Cronbach’s alpha 0.74 0.75 0.82 0.59 0.88
Note: Items are listed in decreasing order by saturation. Visualization coefficient >0.40. F1: job dissatisfaction;F2: social climate; F3: personal impact; F4: motivational exhaustion.
130
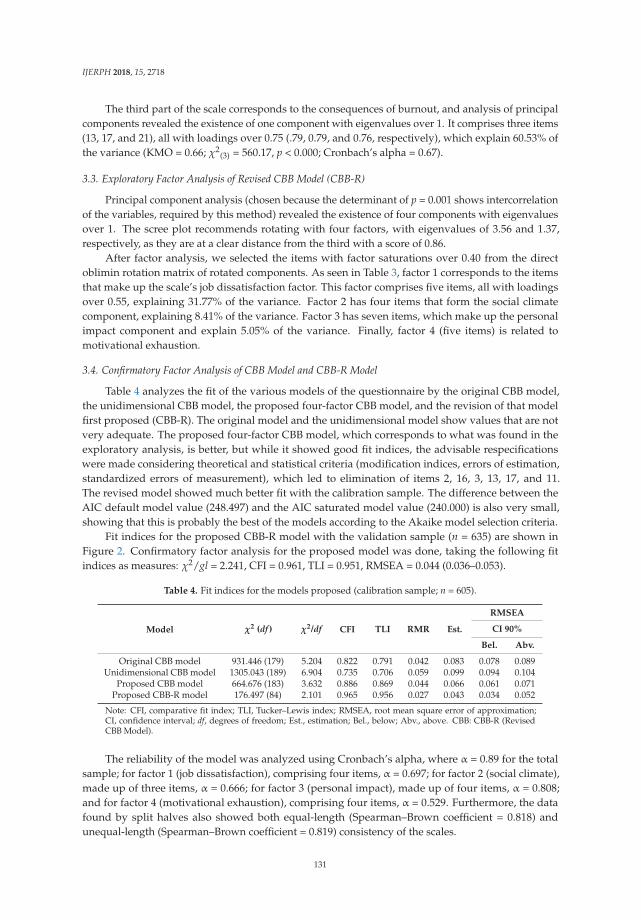
IJERPH 2018, 15, 2718
The third part of the scale corresponds to the consequences of burnout, and analysis of principalcomponents revealed the existence of one component with eigenvalues over 1. It comprises three items(13, 17, and 21), all with loadings over 0.75 (.79, 0.79, and 0.76, respectively), which explain 60.53% ofthe variance (KMO = 0.66; χ2
(3) = 560.17, p < 0.000; Cronbach’s alpha = 0.67).
3.3. Exploratory Factor Analysis of Revised CBB Model (CBB-R)
Principal component analysis (chosen because the determinant of p = 0.001 shows intercorrelationof the variables, required by this method) revealed the existence of four components with eigenvaluesover 1. The scree plot recommends rotating with four factors, with eigenvalues of 3.56 and 1.37,respectively, as they are at a clear distance from the third with a score of 0.86.
After factor analysis, we selected the items with factor saturations over 0.40 from the directoblimin rotation matrix of rotated components. As seen in Table 3, factor 1 corresponds to the itemsthat make up the scale’s job dissatisfaction factor. This factor comprises five items, all with loadingsover 0.55, explaining 31.77% of the variance. Factor 2 has four items that form the social climatecomponent, explaining 8.41% of the variance. Factor 3 has seven items, which make up the personalimpact component and explain 5.05% of the variance. Finally, factor 4 (five items) is related tomotivational exhaustion.
3.4. Confirmatory Factor Analysis of CBB Model and CBB-R Model
Table 4 analyzes the fit of the various models of the questionnaire by the original CBB model,the unidimensional CBB model, the proposed four-factor CBB model, and the revision of that modelfirst proposed (CBB-R). The original model and the unidimensional model show values that are notvery adequate. The proposed four-factor CBB model, which corresponds to what was found in theexploratory analysis, is better, but while it showed good fit indices, the advisable respecificationswere made considering theoretical and statistical criteria (modification indices, errors of estimation,standardized errors of measurement), which led to elimination of items 2, 16, 3, 13, 17, and 11.The revised model showed much better fit with the calibration sample. The difference between theAIC default model value (248.497) and the AIC saturated model value (240.000) is also very small,showing that this is probably the best of the models according to the Akaike model selection criteria.
Fit indices for the proposed CBB-R model with the validation sample (n = 635) are shown inFigure 2. Confirmatory factor analysis for the proposed model was done, taking the following fitindices as measures: χ2/gl = 2.241, CFI = 0.961, TLI = 0.951, RMSEA = 0.044 (0.036–0.053).
Table 4. Fit indices for the models proposed (calibration sample; n = 605).
Model χ2 (df ) χ2/df CFI TLI RMR Est.
RMSEA
CI 90%
Bel. Abv.
Original CBB model 931.446 (179) 5.204 0.822 0.791 0.042 0.083 0.078 0.089Unidimensional CBB model 1305.043 (189) 6.904 0.735 0.706 0.059 0.099 0.094 0.104
Proposed CBB model 664.676 (183) 3.632 0.886 0.869 0.044 0.066 0.061 0.071Proposed CBB-R model 176.497 (84) 2.101 0.965 0.956 0.027 0.043 0.034 0.052
Note: CFI, comparative fit index; TLI, Tucker–Lewis index; RMSEA, root mean square error of approximation;CI, confidence interval; df, degrees of freedom; Est., estimation; Bel., below; Abv., above. CBB: CBB-R (RevisedCBB Model).
The reliability of the model was analyzed using Cronbach’s alpha, where α = 0.89 for the totalsample; for factor 1 (job dissatisfaction), comprising four items, α = 0.697; for factor 2 (social climate),made up of three items, α = 0.666; for factor 3 (personal impact), made up of four items, α = 0.808;and for factor 4 (motivational exhaustion), comprising four items, α = 0.529. Furthermore, the datafound by split halves also showed both equal-length (Spearman–Brown coefficient = 0.818) andunequal-length (Spearman–Brown coefficient = 0.819) consistency of the scales.
131
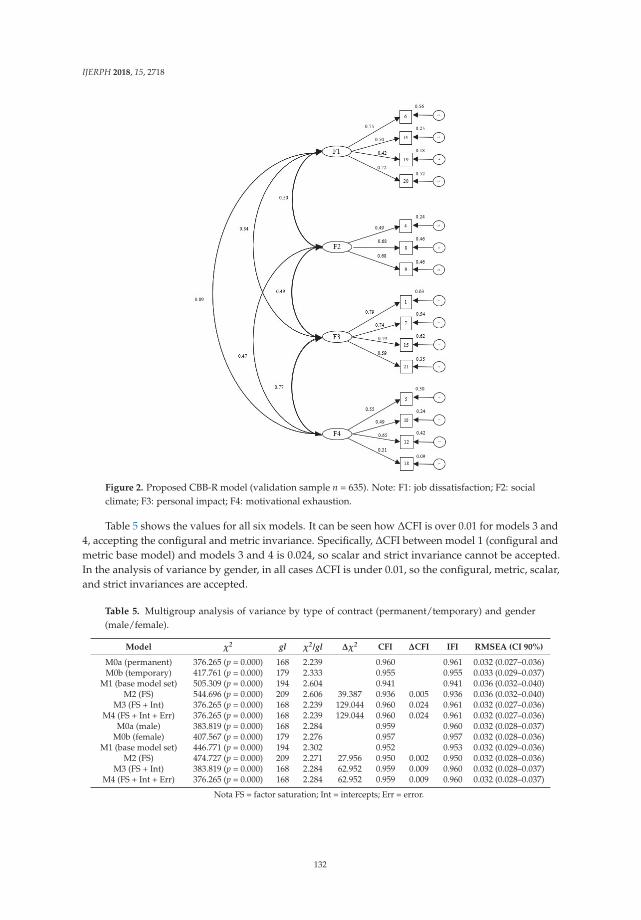
IJERPH 2018, 15, 2718
Figure 2. Proposed CBB-R model (validation sample n = 635). Note: F1: job dissatisfaction; F2: socialclimate; F3: personal impact; F4: motivational exhaustion.
Table 5 shows the values for all six models. It can be seen how ΔCFI is over 0.01 for models 3 and4, accepting the configural and metric invariance. Specifically, ΔCFI between model 1 (configural andmetric base model) and models 3 and 4 is 0.024, so scalar and strict invariance cannot be accepted.In the analysis of variance by gender, in all cases ΔCFI is under 0.01, so the configural, metric, scalar,and strict invariances are accepted.
Table 5. Multigroup analysis of variance by type of contract (permanent/temporary) and gender(male/female).
Model χ2 gl χ2/gl Δχ2 CFI ΔCFI IFI RMSEA (CI 90%)
M0a (permanent) 376.265 (p = 0.000) 168 2.239 0.960 0.961 0.032 (0.027–0.036)M0b (temporary) 417.761 (p = 0.000) 179 2.333 0.955 0.955 0.033 (0.029–0.037)
M1 (base model set) 505.309 (p = 0.000) 194 2.604 0.941 0.941 0.036 (0.032–0.040)M2 (FS) 544.696 (p = 0.000) 209 2.606 39.387 0.936 0.005 0.936 0.036 (0.032–0.040)
M3 (FS + Int) 376.265 (p = 0.000) 168 2.239 129.044 0.960 0.024 0.961 0.032 (0.027–0.036)M4 (FS + Int + Err) 376.265 (p = 0.000) 168 2.239 129.044 0.960 0.024 0.961 0.032 (0.027–0.036)
M0a (male) 383.819 (p = 0.000) 168 2.284 0.959 0.960 0.032 (0.028–0.037)M0b (female) 407.567 (p = 0.000) 179 2.276 0.957 0.957 0.032 (0.028–0.036)
M1 (base model set) 446.771 (p = 0.000) 194 2.302 0.952 0.953 0.032 (0.029–0.036)M2 (FS) 474.727 (p = 0.000) 209 2.271 27.956 0.950 0.002 0.950 0.032 (0.028–0.036)
M3 (FS + Int) 383.819 (p = 0.000) 168 2.284 62.952 0.959 0.009 0.960 0.032 (0.028–0.037)M4 (FS + Int + Err) 376.265 (p = 0.000) 168 2.284 62.952 0.959 0.009 0.960 0.032 (0.028–0.037)
Nota FS = factor saturation; Int = intercepts; Err = error.
132
IJERPH 2018, 15, 2718
4. Discussion
The validation of the CBB questionnaire for health care personnel in nursing shows adequatediscrimination of items. Cronbach’s alpha for this scale was 0.089, which shows its high internal consistency.
With respect to the factor analysis, four factors were extracted from the revised model,which differed from the original structure of the Brief Burnout Questionnaire [41]. This model wasproven to generate better fit of the data than the original. The percentage explained by this modelwas 51.86%, emphasizing the first factor, where all the items loaded over 0.55 and explained 31.77%of the variance. This factor, called job dissatisfaction, clusters indicators in two dimensions, burnoutfactors and burnout syndrome. This factor compiles items that refer to the balance between jobexpectations and reality, and how much enjoyment the individual finds in the job [21]. This coincideswith the proposal made by Moreno et al. [35], in their questionnaire for evaluating professionalburnout in doctors, where a factor referring to the loss of job expectations was included. Similarly,the second factor, made up of four items, groups indicators corresponding to the relationship theworker establishes with fellow workers and superiors at work. This factor, which is called socialclimate, responds to a cluster that may be due to the importance in developing burnout of chronicstressful interpersonal situations in the workplace [6]. The third factor grouped seven items, which inthe original questionnaire were in the burnout syndrome scale, except for one, which was on theconsequences scale. The cluster of these items is called the personal impact factor and refers to thedirect consequences exhaustion has on different areas of an employee’s life.
Finally, the fourth factor, called motivational exhaustion, combines five items that in the originalmodel were part of the burnout syndrome scale. The questions grouped under this factor ofmotivational exhaustion refer to the absence of job growth and stimulation for development in the jobposition. These are aspects that promote work demotivation, generate distress [17], and are among thechallenges health care personnel face most frequently [18].
Although this four-factor model showed adequate fit, after making the correspondingrespecifications according to theoretical and statistical criteria, items 2, 16, 3, 13, 17, and 11 wereeliminated, so all 21 items in the original questionnaire were not retained. The items that were finallykept in each of the factors in the Brief Burnout Questionnaire Revised were items 6, 14, 19, and 20 forjob dissatisfaction; 4, 8, and 9 in the social climate factor; 1, 7, 15, and 21 in personal impact; and 5, 10,12, and 18 in the motivational exhaustion factor.
The model fit improved considerably this way, and also showed consistency in the validationsample. Configural and metric invariance of the model across the type of job (permanent/temporary)is also assumed, and invariance in all cases (configural, metric, scalar, and strict) across gender. Giventhe divergence found when clustering items, inquiry into the adequacy of the structure reported bythe CBB-R for nursing personnel will have to continue. The multifactorial construct of burnout shownhere, which differs from the one reported by the authors of the original study, shows the need forfurther study of the internal structure of the evaluation instruments in this construct in the populationstudied [50]. In the process of adapting and validating instruments for certain populations, it must beknown whether the factor structure coincides or not with the terms of the original version, as the jobcharacteristics of each sample partly moderate the conditions where burnout appears. The proposedmodel also includes an analysis of all the burnout risk and protection factors now known as found inthe theoretical review.
5. Conclusions
The Brief Burnout Questionnaire Revised for health care personnel in nursing has favorablepsychometric properties. The internal consistency of the total scale and each of the factors is adequate,therefore the general fit is acceptable. However, it is recommended that goodness and fit of the modelcontinue to be analyzed to test the psychometric properties of the instrument in other groups, sincethis model of burnout can be applied to all care professionals.
133
IJERPH 2018, 15, 2718
This new evaluation model based on the CBB questionnaire adapted as an instrument forevaluation of the syndrome in health care personnel is intended to approach even closer to knowledgeof burnout, exploring the different facets that comprise it. Thus, the purpose of validating theinstrument was to approach burnout’s present reality. As a syndrome linked to the work environmentof individuals, burnout will continue to evolve with it, accumulating new factors workers must copewith that may also lead to burnout.
Author Contributions: M.d.M.M.J., Á.M.M., and M.d.C.P.-F. contributed to the conception and design of thereview. J.J.G.L. applied the search strategy. All authors applied the selection criteria. All authors completedthe assessment of risk of bias. All authors analyzed the data and interpreted data. M.d.M.M.J., M.d.C.P.-F.,and Á.M.M. wrote this manuscript. M.d.C.P.-F. and J.J.G.L. edited this manuscript. M.d.C.P.F. is responsible forthe overall project.
Funding: This research received no external funding.
Acknowledgments: The present study was undertaken in collaboration with the Excma. Diputación Provincialde Almería. Part of this work has been developed thanks to the financing of the 2018 Own Research Plan of theUniversity of Almería, for the help for the hiring of research personnel in predoctoral training, granted to ÁfricaMartos Martínez.
Conflicts of Interest: The authors declare no conflict of interest.
References
1. National Statistics Institute. España en Cifras; INE: Madrid, Spain, 2017.2. Profesionales Sanitarios Colegiados 2016. Available online: http://www.ine.es/jaxi/Datos.htm?path=/t15/
p416/a2016/l0/&file=s08004.px (accessed on 15 August 2018).3. González-Cabanach, R.; Souto-Gestal, A.; Fernández-Cervantes, R. Emotion regulation profiles and academic
stress in Physiotherapy students. Eur. J. Educ. Psychol. 2017, 10, 57–67. [CrossRef]4. Zhou, J.; Yang, Y.; Qiu, X.; Pan, H.; Ban, B.; Qiao, Z.; Wang, L.; Wang, W. Serial multiple mediation of
organizational commitment and job burnout in the relationship between psychological capital and anxiety inChinese female nurses: A cross-sectional questionnaire survey. Int. J. Nurs. Stud. 2018, 83, 75–82. [CrossRef][PubMed]
5. García-Camapayo, J.; Puebla-Guedea, M.; Herrera-Mercadal, P.; Daudén, E. Burnout Syndrome andDemotivation among Health Care Personnel. Managing Stressful Situations: The Importance of Teamwork.Actas Dermosifiliogr. 2016, 107, 400–406. [CrossRef]
6. Maslach, C. Burnout. In Encyclopedia of Mental Health, 2nd ed.; Friedman, H., Ed.; Elsevier: Oxford, UK, 2016;pp. 222–227. ISBN 978-0-12-397045-9.
7. Gómez, L.; Estrella, D. Síndrome de Burnout: Una revisión breve. Ciencia Humanismo Salud 2015, 2, 116–122.8. De Francisco, C.; Arce, C.; Vílchez, M.P.; Vales, A. Antecedents and consequences of burnout in athletes:
Perceived stress and depression. Int. J. Clin. Health Psychol. 2016, 16, 221–314. [CrossRef]9. Pérez-Fuentes, M.C.; Gázquez, J.J.; Ruiz, M.D.; Molero, M.M. Inventory of Overburden in Alzheimer’s Patient
Family Caregivers with no Specialized Training. Int. J. Clin. Health Psychol. 2017, 17, 56–64. [CrossRef][PubMed]
10. Martos, Á.; Pérez-Fuentes, M.C.; Molero, M.M.; Gázquez, J.J.; Simón, M.M.; Barragán, A.B. Burnout yengagement en estudiantes de Ciencias de la Salud. Eur. J Investig. 2018, 8, 23–36. [CrossRef]
11. Jodas, D.A.; Nesello, F.; Eumann, A.; Durán, A.; Lopez, F.; de Andrade, S.M. Physical, psychological andoccupational consequences of job burnout: A systematic review of prospective studies. PLoS ONE 2017,12, e0185781. [CrossRef]
12. Iorga, M.; Socolov, V.; Muraru, D.; Dirtu, C.; Soponaru, C.; Ilea, C.; Socolov, D.G. Factors Influencing BurnoutSyndrome in Obstetrics and Gynecology Physicians. BioMed Res. Int. 2017, 2017, 1–10. [CrossRef]
13. Schneider, A.; Weigl, M. Associations between psychosocial work factors and provider mental well-being inemergency departments: A systematic review. PLoS ONE 2018, 13, e0197375. [CrossRef]
14. Frenet, C.; Trépanier, S.G.; Demers, M.; Austin, S. Motivational pathways of occupational and organizationalturnover intention among newly registered nurses in Canada. Nurs. Outlook 2017, 65, 444–454. [CrossRef]
15. Obradovic, Z.; Obradovic, A.; Cesir-Skoro, I. Nurses and burnout síndrome. J. Health Biol. 2013, 3, 60–64.
134
IJERPH 2018, 15, 2718
16. Basinska, B.A.; Wilczek-Ruzyczka, E. The role of rewards and demansd in burnout among surgical nurses.Int. J. Occup. Med. Environ. Health 2013, 26, 593–604. [CrossRef]
17. Pucheu, A. ¿Existen diferencias en la motivación de distintas generaciones en enfermería? Rev. Méd. Clín.Las Condes 2018, 29, 336–342. [CrossRef]
18. Achour, N.; Munokaran, S.; Barker, F.; Soetanto, R. Staff Stress: The Sleeping Cell of Healthcare Failure.Procedia Eng. 2018, 212, 459–466. [CrossRef]
19. Contreras, F.; Espinal, L.; Pachón, A.M.; González, J. Burnout, liderazgo y satisfacción laboral en el personalasistencial de un hospital de tercer nivel en Bogotá. Perspect. Psicol. 2013, 9, 65–80. [CrossRef]
20. Dill, J.; Erickson, R.J.; Diefendorff, J.M. Motivation in caring labor: Implications for the well-being andemployment outcomes of nurses. Soc. Sci. Med. 2016, 167, 99–106. [CrossRef]
21. Kabir, M.N.; Parvin, M.M. Factors affecting employee job satisfaction of pharmaceutical sector. Aust. J. Bus.Manag. Res. 2011, 1, 113–123.
22. Elbarazi, I.; Loney, T.; Yousef, S.; Elias, A. Prevalence of and factors associated with burnout among healthcare professionals in Arab countries: A systematic review. BMC Health Serv. Res. 2017, 17, 1–10. [CrossRef]
23. Van Bogaert, P.; Van Heusden, D.; Verspuy, M.; Wouters, K.; Slootmans, S.; Van der Straeten, J.;Aken, V.; White, M. The Productive Ward Program™: A Two-Year Implementation Impact Review Using aLongitudinal Multilevel Study. Can. J. Nurs. Res. 2017, 49, 28–38. [CrossRef]
24. Farnaz, R.; Kalateh, A.; Hemmati, S.; Ebrahimzade, N.; Sarikhani, Y.; Heydari, S.T.; Lankarani, K.B.The impact of environmental and demographic factors on nursing job satisfaction. Electron. Phys. 2018, 10,6712–6717. [CrossRef]
25. Molero, M.M.; Pérez-Fuentes, M.C.; Gázquez, J.J.; Simón, M.M.; Martos, Á. Burnout Risk and ProtectionFactors in Certified Nursing Aides. Int. J. Environ. Res. Public Health 2018, 15, 1116. [CrossRef] [PubMed]
26. Mudallal, R.H.; Othman, W.M.; Al Hassan, N.F. Nurses’ Burnout: The Influence of Leader EmpoweringBehaviors, Work Conditions, and Demographic Traits. Inquiry 2017, 54, 1–10. [CrossRef] [PubMed]
27. Wei, H.; Sewell, K.A.; Woody, G.; Rose, M.A. The state of the science of nurse work environments in theUnited States: A systematic review. Int. J. Nurs. Sci. 2018, 5, 1–14. [CrossRef]
28. Pérez-Fuentes, M.C.; Molero, M.M.; Gázquez, J.J.; Oropesa, N.F. The Role of Emotional Intelligence inEngagement in Nurses. Int. J. Environ. Res. Public Health 2018, 15, 1915. [CrossRef]
29. Maslach, C.; Jackson, S.E. Maslach Burnout Inventory; Consulting Psychologists Press: Palo Alto, CA, USA, 1981.30. Squieres, A.; Finlayson, C.; Gerchow, L.; Cimiotti, J.P.; Matthews, A.; Schwendimann, R.; Griffiths, P.;
Busse, R.; Heinen, M.; Brzostek, T.; et al. Methodological considerations when translating “burnout”.Burn Res. 2014, 1, 59–68. [CrossRef] [PubMed]
31. Martins, S.; Teixera, C.M.; Carvalho, A.S.; Hernández-Marrero, P. Compared to Palliative Care, Working inIntensive Care More than Doubles the Chances of Burnout: Results from a Nationwide Comparative Study.PLoS ONE 2016, 11, e0162340. [CrossRef]
32. Merlani, P.; Verdon, M.; Businger, A.; Domenighetti, G.; Pargger, H.; Ricou, B. Burnout in ICU Caregivers:A Multicenter Study of Factors Associated to Centers. Am. J. Respir. Crit. 2011, 184, 1140–1146. [CrossRef]
33. Poncet, M.C.; Toullic, P.; Papazian, L.; Barnes, N.K.; Timsit, J.F.; Pochard, F.; Chevret, S.; Schlemmer, B.;Azoulay, E. Burnout Syndrome in Critical Care Nursing Staff. Am. J. Respir. Crit. 2007, 175, 698–704.[CrossRef]
34. Guerra, C.; Mújica, A.; Nahmias, A.; Rojas, N. Análisis psicométrico de la escala de conductas de autocuidadopara psicólogos clínicos. Rev. Latinoam. Psicol. 2011, 43, 319–328. [CrossRef]
35. Moreno, B.; Gálvez, M.; Garrosa, E.; Mingote, J.C. Nuevos planteamientos en la evaluación del burnout.La evaluación específica del desgaste profesional médico. Aten Prim. 2006, 38, 544–549. [CrossRef]
36. Pisanti, R.; Lombardo, C.; Lucidi, F.; Violani, C.; Lazzari, D. Psychometric properties of the Maslach BurnoutInventory for Human Services among Italian nurses: A test of alternative models. J. Adv. Nurs. 2013, 69,697–707. [CrossRef] [PubMed]
37. Kalliath, T.J.; O´Driscoll, M.P.; Gillespie, D.F.; Bluedorn, A.C. A test of the Maslach Burnout Inventory inthree samples of healthcare professionals. Work Stress 2000, 14, 35–50. [CrossRef]
38. Kim, H.; Ji, J. Factor structure and longitudinal invariance of the Maslach Burnout Inventory. Res. Soc.Work Pract. 2009, 19, 325–339. [CrossRef]
39. Densten, I.L. Re-thinking burnout. J. Organ. Behav. 2001, 22, 833–847. [CrossRef]
135
IJERPH 2018, 15, 2718
40. García, J.M.; Herrero, S.; León, J.L. Validez factorial del Maslach Burnout Inventory (MBI) en una muestra detrabajadores del Hospital Psiquiátrico Penitenciario de Sevilla. Apuntes Psicol. 2007, 25, 157–174.
41. Moreno-Jiménez, B.; Bustos, R.; Matallana, A.; Miralles, T. La evaluación del burnout. Problemas yalternativas. El CBB como evaluación de los elementos del proceso. Rev. Psicol. Trabajo Organ. 1997,13, 185–207.
42. Mingote, J.C.; Moreno, B.; Gálvez, M. Desgaste profesional y salud de los profesionales médicos: Revisión ypropuestas de prevención. Med. Clínica 2004, 123, 265–270. [CrossRef]
43. Blanco-Álvarez, T.M.; Thoen, M.A. Factores asociados al estrés laboral en policías penitenciarioscostarricenses. Rev. Costarric. Psicol. 2017, 36, 45–59. [CrossRef]
44. Correa-Correa, Z.; Muñoz-Zambrano, I.; Chaparro, A.F. Síndrome de Burnout en docentes de dosuniversidades de Popayán, Colombia. Rev. Salud Pública 2010, 12, 589–598. [CrossRef]
45. Roger, M.C.; Abalo, J.G.; Pérez, C.M.; Ochoa, I.I.; Abalo, R.G.; Abalo, Y. El control of burnout syndrome dedesgaste professional o burnout en enfermeria oncológica: Una experiencia de intervención. Terapia Psicol.2006, 24, 39–53.
46. Ahola, K.; Toppinen-Tanner, S.; Seppänen, J. Interventions to alleviate burnout symptoms and to supportreturn to work among employees with burnout: Systematic review and meta-analysis. Burn Res. 2017, 4,1–11. [CrossRef]
47. González-Ramírez, M.T.; Landero, R.; Moral de la Rubia, J.M. Cuestionario de Burnout para amas de casa(CUBAC): Evaluación de sus propiedades psicométricas y del Modelo Secuencial de Burnout. Univ. Psychol.2009, 8, 533–544.
48. Montero, J.; García-Campayo, J.; Andrés, E. Validez factorial de la estructura del Cuestionario Breve deBurnout (CBB) en una muestra de docentes en Aragón. Rev. Psicopatol. Psicol. Clin. 2009, 14, 123–132.[CrossRef]
49. Domínguez-Lara, S.; Fernández-Arata, M. Cuestionario breve de Burnout, ¿una elección adecuada?Enferm Clín. 2018, 28, 214–215. [CrossRef] [PubMed]
50. Domínguez-Lara, S.A. Análisis factorial y confiabilidad del Burnout Screening Inventory. Educ. Méd. 2017,19, 125–130. [CrossRef]
51. Pérez-Fuentes, M.C.; Molero, M.M.; Martos, A.; Barragán, A.B.; Gázquez, J.J.; Sánchez-Marchán, C. Spanishanalysis and validation of Peer Conflict Scale. Eur. J. Educ. Psychol. 2016, 9, 56–62. [CrossRef]
52. Álvarez-García, D.; Barreiro-Collazo, A.; Núñez, J.C.; Dobarro, A. Validity and reliability of theCyber-aggression Questionnaire for Adolescents (CYBA). Eur. J. Psychol. Appl. Legal Context 2017, 8,69–77. [CrossRef]
53. Bentler, P.M. EQS Structural Equations Program Manual; BMDP Statistical Software: Los Angeles, CA, USA, 1989.54. Hair, J.F.; Black, W.C.; Babin, B.J.; Anderson, R.E.; Tatham, R.L. Multivariate Data Analysis, 7th ed.; Pearson
Prentice Hall: Upper Saddle River, NJ, USA, 2006.55. Akaike, H. A new look at the statistical model identification. IEEE Trans. Autom. Control 1974, 19, 716–723.
[CrossRef]56. Cronbach, L.J. Coefficient alpha and the internal structure of tests. Psychometrika 1951, 16, 297–334. [CrossRef]57. Byrne, B.M.; Stewart, S.M. The MACS approach to testing for multigroup invariance of a second-order
structure: A walk through the process. Struct. Equ. Models 2006, 13, 287–321. [CrossRef]58. Cheung, G.W.; Rensvold, R.B. Evaluating goodness-of-fit indexes for testing measurement invariance.
Struct. Equ. Models 2002, 9, 233–255. [CrossRef]59. Finney, S.J.; DiStefano, C. Non-normal and categorical data in structural equation modeling. In Structural
Equation Modeling: A Second Course; Hancock, G.R., Mueller, R.O., Eds.; Information Age: Greenwich, CT,USA, 2006; pp. 269–314.
© 2018 by the authors. Licensee MDPI, Basel, Switzerland. This article is an open accessarticle distributed under the terms and conditions of the Creative Commons Attribution(CC BY) license (http://creativecommons.org/licenses/by/4.0/).
136
International Journal of
Environmental Research
and Public Health
Article
Employee Stress, Reduced Productivity, and Interestin a Workplace Health Program: A Case Study fromthe Australian Mining Industry
Tamara D. Street * , Sarah J. Lacey and Klaire Somoray
Wesley Medical Research, Brisbane, QLD 4066, Australia; [email protected] (S.J.L.);[email protected] (K.S.)* Correspondence: [email protected]; Tel.: +61-7-3271-1706
Received: 15 October 2018; Accepted: 23 December 2018; Published: 31 December 2018
Abstract: The Australian mining sector has an elevated industry prevalence of stress and high stressrelated productivity impairment costs. This study surveyed 897 employees from an Australianmining company to identify characteristics associated with: (a) high stress related productivityimpairment costs; and (b) likelihood of stressed employees wanting stress management assistance atwork. Groups associated with average annual productivity impairment costs in excess of $50,000 peremployee included: permanent day shift employees; employees who reported being stressed at workmost of the time; employees who reported being stress at work all of the time; and employees whowere contemplating better managing their stress in the next 6 months. Overall, 52% of employees whoidentified as being in the contemplation stage of change for stress management and 52% of employeeswho experienced stress most of the time reported wanting stress assistance with stress. However,only 33% of stressed permanent day shift employees and 36% of employees who experiencedstress all the time reported wanting stress assistance. To achieve a high return on investment whenimplementing workplace stress management programs in the mining industry, practitioners need tostrategically target health promotion to engage stressed employees with high productivity impairmentcosts and low desire for stress management assistance.
Keywords: work stress; productivity; impairment cost; stress management; employee characteristics;workplace health promotion; health and safety
1. Introduction
Stress management refers to the act of engaging in deliberate strategies to control ones levelof stress, particularly chronic stress. Managing employee stress is a priority for advancing workerhealth in the global mining industry. An elevated industry prevalence of stress and the high associatedpersonal and organisational costs of stress indicates a need for workplace health and safety riskmanagement action. In Australia where this study was conducted, research has identified thatpsychological distress is significantly more prevalent in Australian mining workforces than in thegeneral Australian population [1,2]. More specifically, in an adult Australia population sample, 11.7% ofrespondents had Kessler Psychological Distress Scale (K10) scores that indicated high/very highpsychological distress [3]. Comparatively, 28% of employees from mine sites in South Australia andWestern Australia [1], and 12.7% of employees from mine sites in New South Wales and Queensland [2]had K10 scores indicating high/very high psychological distress.
High economic costs of stress related absenteeism and presenteeism have been reported inthe Australian mining sector. For example, in a Queensland mining company work-related stressaccounted for the highest financial burden (compared across 25 medical conditions) [4]. Employeeswho reported experiencing stress at work were 19% less productive than employees who did not report
IJERPH 2019, 16, 94; doi:10.3390/ijerph16010094 www.mdpi.com/journal/ijerph137
IJERPH 2019, 16, 94
experiencing stress [4]. Furthermore, based on productive time lost calculations from Queensland andNew South Wales mines it has been estimated that psychological distress has an annual economic costof $153.8 million to the Australian coal mining industry, representing almost 9% of pre-tax operatingprofit [5].
Work-related stress has been linked to detrimental employee health outcomes. For example,a longitudinal study spanning 14 years found that higher levels of workplace stress were associatedwith an increased risk of metabolic syndrome, a precursor of coronary heart disease [6]. Workplacestress has also been indirectly linked to employees’ health through the experience of stress beingassociated with greater engagement in negative health behaviours such as tobacco smoking, inadequatediet, insufficient physical activity, and alcohol use [7,8]. It has been speculated that conditions associatedwith mining employment including long work rosters and remote work locations may increase therisk of miners experiencing stress [9]. Concerns for miners’ health have been raised with severalrecent public enquires into work practices associated with the Australian mining industry, such asfly-in fly-out (FIFO) or drive-in drive-out (DIDO) arrangements, and impacts on mental health andsuicide [10,11]. Some studies have found that Australian FIFO miners report work-life balancedifficulties and relationship stress [12] and family stress associated with frequent miner absence fromhome [13]. McPhedran and De Leo [9] recommend caution when interpreting associations betweenmining employment and stress noting that work practices, rather than employment industry, had adirect relationship with some stress measures. In their comparison of male miners to males in otheroccupations, they identified that mine employees on average worked longer hours than employeesin other occupations and working longer hours was independently associated with perceived lowerquality family relationships and higher levels of relationship stress [9].
There are many workplace risk management strategies with research evidence of effectiveness [14,15].Effective stress management has also been linked to improvements in other health behaviours. For instance,Lipschitz et al. [16] demonstrated that individuals who improved their stress management alsoincreased their likelihood of exercising and managing their depression over a period of six months.A key challenge for health and safety practitioners is engaging stressed employees to proactively seekstress management assistance. This is particularly important given that low help seeking behaviourshave been associated with the male-dominated mining industry [17].
Historically, studies have researched stress management strategies for adults assuming thatanyone who requires assistance with stress management is ready to change their behaviour,with limited consideration to the actual readiness of the individual [18]. Although existing workplacebased stress management studies have not specified the percentage of stressed employees who areprepared to adopt stress management practices, a population based study including 1085 adultsrecruited from national market research directories identified that at baseline measurement, over 80%of the sample were not ready to adopt stress management practices [18]. These individuals were notpracticing effective stress management behaviours, including physical activity, regular relaxation,taking time for social activities, and/or talking with others, and not intending to start practing stressmanagement strategies in the immediate future. Applying the Stages of Change Model of behaviourchange, these adults were classified as being in a pre-contemplation or contemplation stage of changefor stress management [18]. The randomised clinical trial study found that adults who participated in aStages of Change Model stage-matched stress management intervention, as compared longitudinally toa control group, had significantly greater progress towards stress management action and maintenancebehaviours, significantly lower stress levels, and were significantly more likely to be practicing healthystress management and avoiding unhealthy stress management behaviours [18].
Within a mining workforce, research has identified that stage of readiness was not associatedwith likelihood of wanting assistance with reducing or quitting smoking [19], but was associated withwanting assistance with healthy weight management [20]. It was found that employees who were inthe contemplative, preparation, and action stages for improving their eating habits were more likelyto desire assistance for healthy weight programs compared to employees in the pre-contemplative
138
IJERPH 2019, 16, 94
stage. Employees in the action and maintenance stages for improving their physical activity habitswere also more likely to desire assistance for healthy weight programs compared to employeesin the pre-contemplative stage [20]. Research is needed within a mining workforce to identify theprevalence of employees ready to adopt stress management assistance and to explore whether stageof readiness is associated with stress impairment productivity costs and likelihood of seeking stressmanagement assistance.
Although companies need to equitably provide health support for all employees, to maximizereturn on program investment targeted program promotion is critical to engage employees at riskof stress related health issues. In addition to understanding the employee characteristics associatedwith stress and readiness to change, practitioners would benefit from understanding if employeecharacteristics (including socio-demographic and work characteristic variables, e.g., age and job role)are associated with stress productivity costs and likelihood of seeking stress management assistance.
Research within the Australian mining sector suggests that certain employee demographic andwork characteristics are associated with greater risk for psychological distress [1,2]. More specifically,Bowers et al. [1] found that mining employees aged 25 to 35 years and shift-work employees(rostered as two weeks on, one week off) were more likely to report psychological distress. However,it is unclear from the available literature which employee characteristics are associated with highstress-related productivity impairment costs. Similarly, empirical research indicates that females andmiddle-aged persons [21–23] are significantly more likely to access professional services to addressstress management and other mental health concerns. Previous studies using a mining workforce alsoindicate that gender and age influence preference for health promotion programs [19]. For example,females and employees aged 24 years and under have been found to be more likely to want assistancefor smoking cessation [19].
The limited available research to date suggests that employee characteristics and employeereadiness for change may be associated with preference for health promotion programs such asthose that target stress management. The aim of this study was two-fold: (a) To investigate, withinemployees’ who reported high levels of stress, the relationship between employee characteristics,stage of change for stress management, and productivity impairment costs; and (b) The relationshipbetween employee characteristics, stage of change for stress management, and desire for assistancewith stress management through a workplace health promotion program. Although this case studyfocuses on the Australian mining workforce, it is likely that the findings will have practical applicationfor the development of stress management strategies in the global mining industry.
2. Materials and Methods
2.1. Participants
A sample of 897 employees from an Australian mining company were recruited to participate inthe study. Participants were aged between 17 and 73 years. Consistent with the organizations workforcecharacteristics, the majority of participants (74%) were male. It was not possible to calculate a responserate due to the recruitment process, however the mining organisation confirmed that the sample wasrepresentative of the workforce demographic characteristics. Furthermore, variance in survey responsesindicated that participants included a range of employees. Participant employment characteristicsare detailed in Table 1. Reported percentages exclude missing data and are, therefore, calculatedfrom different sample sizes as a few participants chose not to report some of their demographic andwork information.
Of the 893 employees who responded to the stress item (n = 4 were missing data), 375 employeesreported experiencing stress while at work ‘some of the time’ to ‘all of the time’ (refer Table 2).The majority of these stressed employees reported that they were not ready to adopt stress managementpractices, with 34.0% (n = 106) in the pre-contemplation stage and 22.8% (n = 71) in the contemplationstage. Of the stressed employees who were ready to adopt stress management behaviours, 6.4% (n = 20)
139
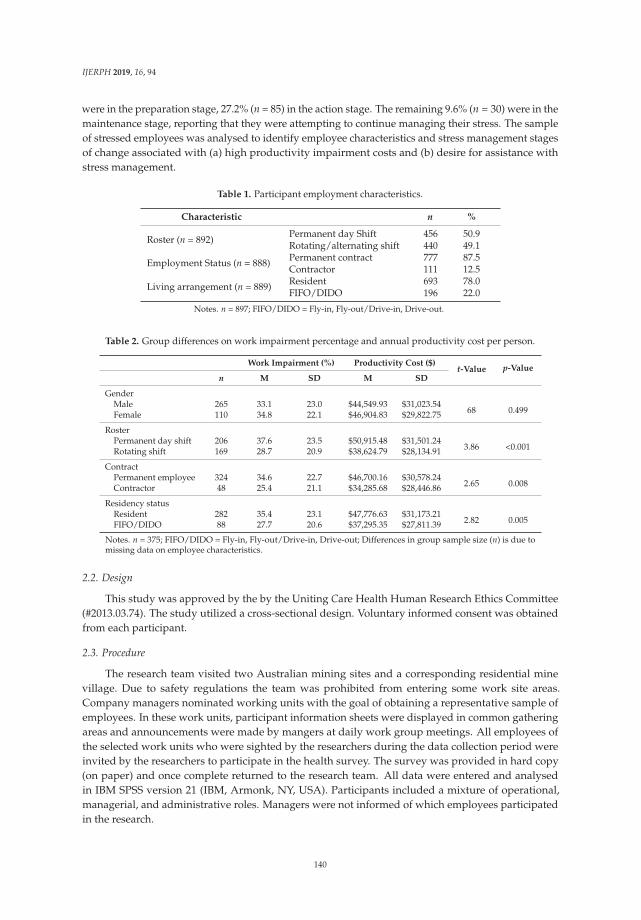
IJERPH 2019, 16, 94
were in the preparation stage, 27.2% (n = 85) in the action stage. The remaining 9.6% (n = 30) were in themaintenance stage, reporting that they were attempting to continue managing their stress. The sampleof stressed employees was analysed to identify employee characteristics and stress management stagesof change associated with (a) high productivity impairment costs and (b) desire for assistance withstress management.
Table 1. Participant employment characteristics.
Characteristic n %
Roster (n = 892)Permanent day Shift 456 50.9Rotating/alternating shift 440 49.1
Employment Status (n = 888) Permanent contract 777 87.5Contractor 111 12.5
Living arrangement (n = 889) Resident 693 78.0FIFO/DIDO 196 22.0
Notes. n = 897; FIFO/DIDO = Fly-in, Fly-out/Drive-in, Drive-out.
Table 2. Group differences on work impairment percentage and annual productivity cost per person.
Work Impairment (%) Productivity Cost ($)t-Value p-Value
n M SD M SD
GenderMale 265 33.1 23.0 $44,549.93 $31,023.54
68 0.499Female 110 34.8 22.1 $46,904.83 $29,822.75
RosterPermanent day shift 206 37.6 23.5 $50,915.48 $31,501.24
3.86 <0.001Rotating shift 169 28.7 20.9 $38,624.79 $28,134.91
ContractPermanent employee 324 34.6 22.7 $46,700.16 $30,578.24
2.65 0.008Contractor 48 25.4 21.1 $34,285.68 $28,446.86
Residency statusResident 282 35.4 23.1 $47,776.63 $31,173.21
2.82 0.005FIFO/DIDO 88 27.7 20.6 $37,295.35 $27,811.39
Notes. n = 375; FIFO/DIDO = Fly-in, Fly-out/Drive-in, Drive-out; Differences in group sample size (n) is due tomissing data on employee characteristics.
2.2. Design
This study was approved by the by the Uniting Care Health Human Research Ethics Committee(#2013.03.74). The study utilized a cross-sectional design. Voluntary informed consent was obtainedfrom each participant.
2.3. Procedure
The research team visited two Australian mining sites and a corresponding residential minevillage. Due to safety regulations the team was prohibited from entering some work site areas.Company managers nominated working units with the goal of obtaining a representative sample ofemployees. In these work units, participant information sheets were displayed in common gatheringareas and announcements were made by mangers at daily work group meetings. All employees ofthe selected work units who were sighted by the researchers during the data collection period wereinvited by the researchers to participate in the health survey. The survey was provided in hard copy(on paper) and once complete returned to the research team. All data were entered and analysedin IBM SPSS version 21 (IBM, Armonk, NY, USA). Participants included a mixture of operational,managerial, and administrative roles. Managers were not informed of which employees participatedin the research.
140
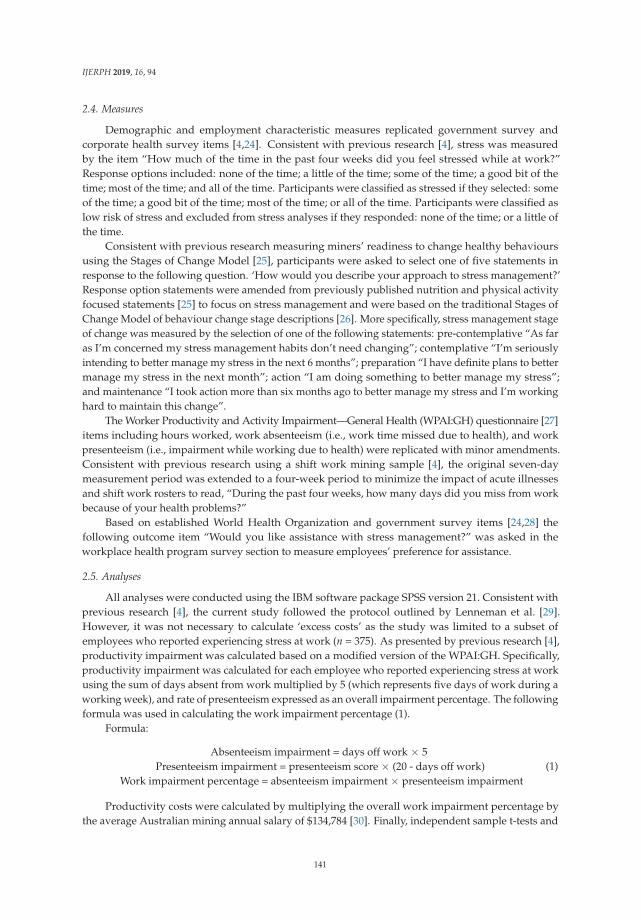
IJERPH 2019, 16, 94
2.4. Measures
Demographic and employment characteristic measures replicated government survey andcorporate health survey items [4,24]. Consistent with previous research [4], stress was measuredby the item “How much of the time in the past four weeks did you feel stressed while at work?”Response options included: none of the time; a little of the time; some of the time; a good bit of thetime; most of the time; and all of the time. Participants were classified as stressed if they selected: someof the time; a good bit of the time; most of the time; or all of the time. Participants were classified aslow risk of stress and excluded from stress analyses if they responded: none of the time; or a little ofthe time.
Consistent with previous research measuring miners’ readiness to change healthy behavioursusing the Stages of Change Model [25], participants were asked to select one of five statements inresponse to the following question. ‘How would you describe your approach to stress management?’Response option statements were amended from previously published nutrition and physical activityfocused statements [25] to focus on stress management and were based on the traditional Stages ofChange Model of behaviour change stage descriptions [26]. More specifically, stress management stageof change was measured by the selection of one of the following statements: pre-contemplative “As faras I’m concerned my stress management habits don’t need changing”; contemplative “I’m seriouslyintending to better manage my stress in the next 6 months”; preparation “I have definite plans to bettermanage my stress in the next month”; action “I am doing something to better manage my stress”;and maintenance “I took action more than six months ago to better manage my stress and I’m workinghard to maintain this change”.
The Worker Productivity and Activity Impairment—General Health (WPAI:GH) questionnaire [27]items including hours worked, work absenteeism (i.e., work time missed due to health), and workpresenteeism (i.e., impairment while working due to health) were replicated with minor amendments.Consistent with previous research using a shift work mining sample [4], the original seven-daymeasurement period was extended to a four-week period to minimize the impact of acute illnessesand shift work rosters to read, “During the past four weeks, how many days did you miss from workbecause of your health problems?”
Based on established World Health Organization and government survey items [24,28] thefollowing outcome item “Would you like assistance with stress management?” was asked in theworkplace health program survey section to measure employees’ preference for assistance.
2.5. Analyses
All analyses were conducted using the IBM software package SPSS version 21. Consistent withprevious research [4], the current study followed the protocol outlined by Lenneman et al. [29].However, it was not necessary to calculate ‘excess costs’ as the study was limited to a subset ofemployees who reported experiencing stress at work (n = 375). As presented by previous research [4],productivity impairment was calculated based on a modified version of the WPAI:GH. Specifically,productivity impairment was calculated for each employee who reported experiencing stress at workusing the sum of days absent from work multiplied by 5 (which represents five days of work during aworking week), and rate of presenteeism expressed as an overall impairment percentage. The followingformula was used in calculating the work impairment percentage (1).
Formula:
Absenteeism impairment = days off work × 5Presenteeism impairment = presenteeism score × (20 - days off work)
Work impairment percentage = absenteeism impairment × presenteeism impairment(1)
Productivity costs were calculated by multiplying the overall work impairment percentage bythe average Australian mining annual salary of $134,784 [30]. Finally, independent sample t-tests and
141
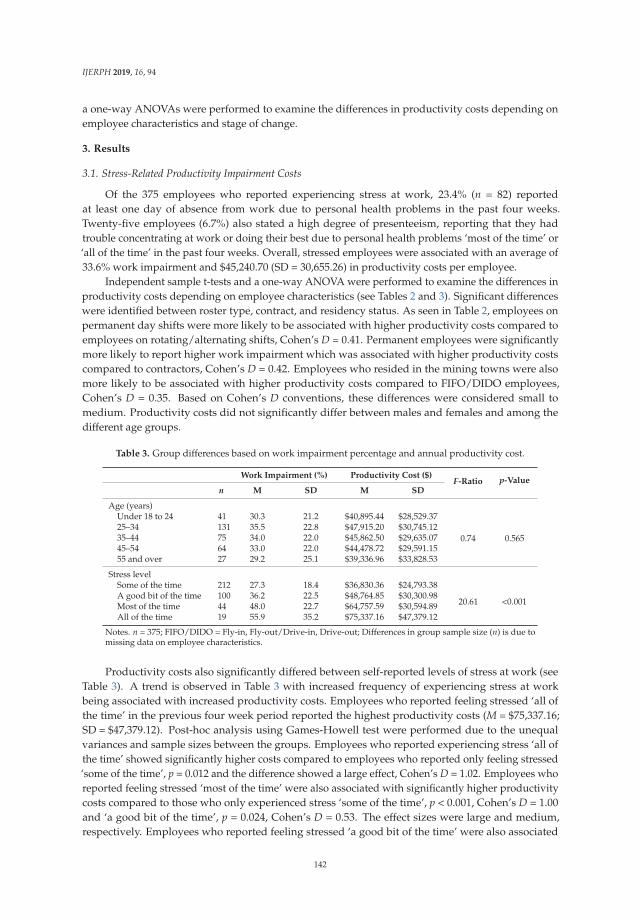
IJERPH 2019, 16, 94
a one-way ANOVAs were performed to examine the differences in productivity costs depending onemployee characteristics and stage of change.
3. Results
3.1. Stress-Related Productivity Impairment Costs
Of the 375 employees who reported experiencing stress at work, 23.4% (n = 82) reportedat least one day of absence from work due to personal health problems in the past four weeks.Twenty-five employees (6.7%) also stated a high degree of presenteeism, reporting that they hadtrouble concentrating at work or doing their best due to personal health problems ‘most of the time’ or‘all of the time’ in the past four weeks. Overall, stressed employees were associated with an average of33.6% work impairment and $45,240.70 (SD = 30,655.26) in productivity costs per employee.
Independent sample t-tests and a one-way ANOVA were performed to examine the differences inproductivity costs depending on employee characteristics (see Tables 2 and 3). Significant differenceswere identified between roster type, contract, and residency status. As seen in Table 2, employees onpermanent day shifts were more likely to be associated with higher productivity costs compared toemployees on rotating/alternating shifts, Cohen’s D = 0.41. Permanent employees were significantlymore likely to report higher work impairment which was associated with higher productivity costscompared to contractors, Cohen’s D = 0.42. Employees who resided in the mining towns were alsomore likely to be associated with higher productivity costs compared to FIFO/DIDO employees,Cohen’s D = 0.35. Based on Cohen’s D conventions, these differences were considered small tomedium. Productivity costs did not significantly differ between males and females and among thedifferent age groups.
Table 3. Group differences based on work impairment percentage and annual productivity cost.
Work Impairment (%) Productivity Cost ($)F-Ratio p-Value
n M SD M SD
Age (years)Under 18 to 24 41 30.3 21.2 $40,895.44 $28,529.37
0.74 0.56525–34 131 35.5 22.8 $47,915.20 $30,745.1235–44 75 34.0 22.0 $45,862.50 $29,635.0745–54 64 33.0 22.0 $44,478.72 $29,591.1555 and over 27 29.2 25.1 $39,336.96 $33,828.53
Stress levelSome of the time 212 27.3 18.4 $36,830.36 $24,793.38
20.61 <0.001A good bit of the time 100 36.2 22.5 $48,764.85 $30,300.98Most of the time 44 48.0 22.7 $64,757.59 $30,594.89All of the time 19 55.9 35.2 $75,337.16 $47,379.12
Notes. n = 375; FIFO/DIDO = Fly-in, Fly-out/Drive-in, Drive-out; Differences in group sample size (n) is due tomissing data on employee characteristics.
Productivity costs also significantly differed between self-reported levels of stress at work (seeTable 3). A trend is observed in Table 3 with increased frequency of experiencing stress at workbeing associated with increased productivity costs. Employees who reported feeling stressed ‘all ofthe time’ in the previous four week period reported the highest productivity costs (M = $75,337.16;SD = $47,379.12). Post-hoc analysis using Games-Howell test were performed due to the unequalvariances and sample sizes between the groups. Employees who reported experiencing stress ‘all ofthe time’ showed significantly higher costs compared to employees who reported only feeling stressed‘some of the time’, p = 0.012 and the difference showed a large effect, Cohen’s D = 1.02. Employees whoreported feeling stressed ‘most of the time’ were also associated with significantly higher productivitycosts compared to those who only experienced stress ‘some of the time’, p < 0.001, Cohen’s D = 1.00and ‘a good bit of the time’, p = 0.024, Cohen’s D = 0.53. The effect sizes were large and medium,respectively. Employees who reported feeling stressed ‘a good bit of the time’ were also associated
142
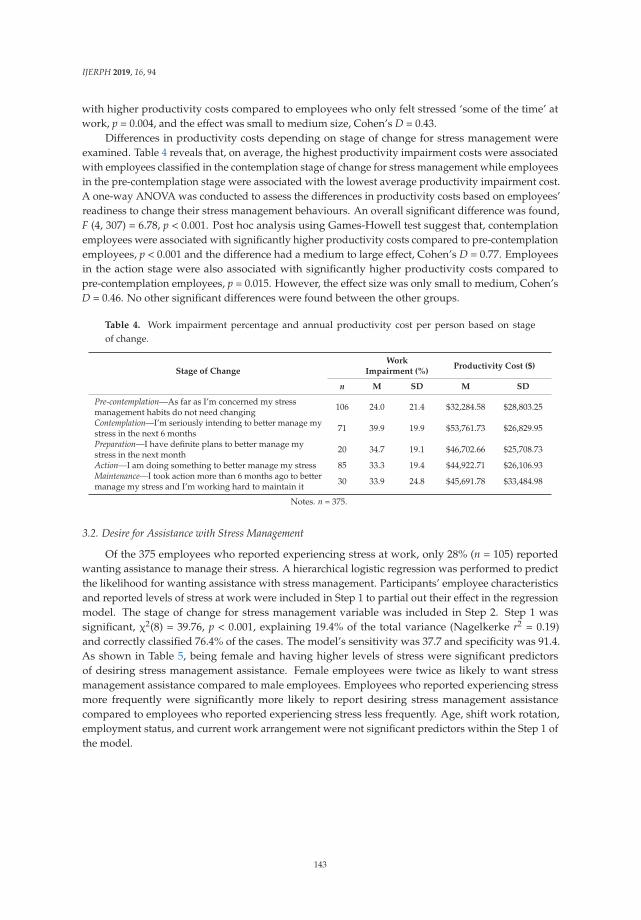
IJERPH 2019, 16, 94
with higher productivity costs compared to employees who only felt stressed ‘some of the time’ atwork, p = 0.004, and the effect was small to medium size, Cohen’s D = 0.43.
Differences in productivity costs depending on stage of change for stress management wereexamined. Table 4 reveals that, on average, the highest productivity impairment costs were associatedwith employees classified in the contemplation stage of change for stress management while employeesin the pre-contemplation stage were associated with the lowest average productivity impairment cost.A one-way ANOVA was conducted to assess the differences in productivity costs based on employees’readiness to change their stress management behaviours. An overall significant difference was found,F (4, 307) = 6.78, p < 0.001. Post hoc analysis using Games-Howell test suggest that, contemplationemployees were associated with significantly higher productivity costs compared to pre-contemplationemployees, p < 0.001 and the difference had a medium to large effect, Cohen’s D = 0.77. Employeesin the action stage were also associated with significantly higher productivity costs compared topre-contemplation employees, p = 0.015. However, the effect size was only small to medium, Cohen’sD = 0.46. No other significant differences were found between the other groups.
Table 4. Work impairment percentage and annual productivity cost per person based on stageof change.
Stage of ChangeWork
Impairment (%)Productivity Cost ($)
n M SD M SD
Pre-contemplation—As far as I’m concerned my stressmanagement habits do not need changing 106 24.0 21.4 $32,284.58 $28,803.25
Contemplation—I’m seriously intending to better manage mystress in the next 6 months 71 39.9 19.9 $53,761.73 $26,829.95
Preparation—I have definite plans to better manage mystress in the next month 20 34.7 19.1 $46,702.66 $25,708.73
Action—I am doing something to better manage my stress 85 33.3 19.4 $44,922.71 $26,106.93Maintenance—I took action more than 6 months ago to bettermanage my stress and I’m working hard to maintain it 30 33.9 24.8 $45,691.78 $33,484.98
Notes. n = 375.
3.2. Desire for Assistance with Stress Management
Of the 375 employees who reported experiencing stress at work, only 28% (n = 105) reportedwanting assistance to manage their stress. A hierarchical logistic regression was performed to predictthe likelihood for wanting assistance with stress management. Participants’ employee characteristicsand reported levels of stress at work were included in Step 1 to partial out their effect in the regressionmodel. The stage of change for stress management variable was included in Step 2. Step 1 wassignificant, χ2(8) = 39.76, p < 0.001, explaining 19.4% of the total variance (Nagelkerke r2 = 0.19)and correctly classified 76.4% of the cases. The model’s sensitivity was 37.7 and specificity was 91.4.As shown in Table 5, being female and having higher levels of stress were significant predictorsof desiring stress management assistance. Female employees were twice as likely to want stressmanagement assistance compared to male employees. Employees who reported experiencing stressmore frequently were significantly more likely to report desiring stress management assistancecompared to employees who reported experiencing stress less frequently. Age, shift work rotation,employment status, and current work arrangement were not significant predictors within the Step 1 ofthe model.
143
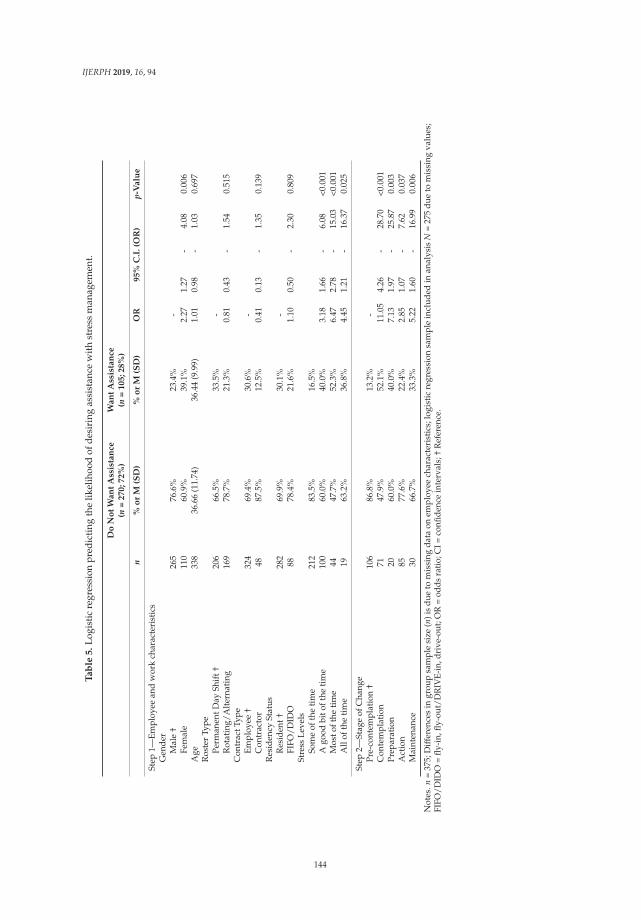
IJERPH 2019, 16, 94
Ta
ble
5.
Logi
stic
regr
essi
onpr
edic
ting
the
likel
ihoo
dof
desi
ring
assi
stan
cew
ith
stre
ssm
anag
emen
t.
Do
No
tW
an
tA
ssis
tan
ce(n
=270;72%
)W
an
tA
ssis
tan
ce(n
=105;28%
)
n%
or
M(S
D)
%o
rM
(SD
)O
R95%
C.I
.(O
R)
p-V
alu
e
Step
1—Em
ploy
eean
dw
ork
char
acte
rist
ics
Gen
der
Mal
e†
265
76.6
%23
.4%
-Fe
mal
e11
060
.9%
39.1
%2.
271.
27-
4.08
0.00
6A
ge33
836
.66
(11.
74)
36.4
4(9
.99)
1.01
0.98
-1.
030.
697
Ros
ter
Type
Perm
anen
tDay
Shif
t†20
666
.5%
33.5
%-
Rot
atin
g/A
lter
nati
ng16
978
.7%
21.3
%0.
810.
43-
1.54
0.51
5C
ontr
actT
ype
Empl
oyee
†32
469
.4%
30.6
%-
Con
trac
tor
4887
.5%
12.5
%0.
410.
13-
1.35
0.13
9R
esid
ency
Stat
usR
esid
ent†
282
69.9
%30
.1%
-FI
FO/D
IDO
8878
.4%
21.6
%1.
100.
50-
2.30
0.80
9St
ress
Leve
lsSo
me
ofth
eti
me
212
83.5
%16
.5%
Ago
odbi
toft
heti
me
100
60.0
%40
.0%
3.18
1.66
-6.
08<0
.001
Mos
toft
heti
me
4447
.7%
52.3
%6.
472.
78-
15.0
3<0
.001
All
ofth
eti
me
1963
.2%
36.8
%4.
451.
21-
16.3
70.
025
Step
2—St
age
ofC
hang
ePr
e-co
ntem
plat
ion
†10
686
.8%
13.2
%-
Con
tem
plat
ion
7147
.9%
52.1
%11
.05
4.26
-28
.70
<0.0
01Pr
epar
atio
n20
60.0
%40
.0%
7.13
1.97
-25
.87
0.00
3A
ctio
n85
77.6
%22
.4%
2.85
1.07
-7.
620.
037
Mai
nten
ance
3066
.7%
33.3
%5.
221.
60-
16.9
90.
006
Not
es.n
=37
5;D
iffer
ence
sin
grou
psa
mpl
esi
ze(n
)is
due
tom
issi
ngd
ata
onem
ploy
eech
arac
teri
stic
s;lo
gist
icre
gres
sion
sam
ple
incl
uded
inan
alys
isN
=27
5d
ueto
mis
sing
valu
es;
FIFO
/DID
O=
fly-i
n,fly
-out
/DR
IVE-
in,d
rive
-out
;OR
=od
dsra
tio;
CI=
confi
denc
ein
terv
als;
†R
efer
ence
.
144
IJERPH 2019, 16, 94
When the stages of readiness to change were added in the model, the second block was significant,χ2(4) = 32.65, p < 0.001, explaining an additional 13.9% of the total variance. Overall, the model wassignificant, χ2(12) = 72.42, p < 0.001 and explained 33.3% of the total variance (Nagelkerke r2 = 0.33)and accurately classified 78.2% of the cases. The model’s sensitivity was 49.4 and specificity was 89.4.Pre-contemplation employees were the reference category for the readiness to change one’s approachto stress management. As shown in Table 5, employees in all readiness stages were significantly morelikely to desire stress management assistance than stressed employees who reported that their stressmanagement habits do not need changing. However, it is important to note that the odds ratio’s lowerconfidence intervals for employees in the action stage nearly encompasses 1, indicating that being inthe action stage may not necessarily increase the employees’ likelihood to desire assistance for theirstress. The odds ratio of the action group in desiring assistance is also small (OR = 2.85) compared toemployees in the pre-contemplation stage. Examination of the other groups revealed that employeesin the contemplation stage showed the highest odds ratio, indicating that this group were 11.05 timesmore likely to want assistance for stress management compared to the pre-contemplation group.Furthermore, compared to the pre-contemplative employees, preparation employees were 7.13 timesand maintenance employees were 5.22 times more likely to desire assistance for stress management.
4. Discussion
Within a mining workforce sample, this study identified employee characteristics and stressmanagement stages of change associated with high stress-related productivity impairment costs anddesire for assistance with stress management. Of the employees who reported experiencing stress atwork, employee groups associated with significantly higher productivity impairment costs included:day shift workers; permanent contract employees; employees who reside within the mining towns;frequently stressed employees; employees intending to better manage their stress in the next sixmonths; and employees who are actively managing their stress. Although previous research hasreported that FIFO miners were at risk of stress due to their work arrangements [12,13] in the currentstudy they had lower stress impairment costs than permanent day shift employees.
The lower productivity impairment costs associated with alternating rosters, contractors andFIFO/DIDO employment may be related to the roles and responsibilities associated with the differenttypes of employees appointed to permanent day shifts versus alternating contracts. To protectparticipant anonymity the current study did not gather data regarding job position, however, theresearchers are aware that within the current sample, employees working permanent day shiftsincluded managers, professionals, administrative, and operational staff. Comparatively, employeeswith alternating rosters, FIFO/DIDO employment, and contractual work were more likely to beappointed to operational mining roles. A study by Ling et al. [5] showed that managers within thecoal mining industry had higher average lost productivity time costs compared to machine operatorsand trade workers. Managers were also associated with higher psychological distress [2].
In this mining workforce sample, employees in the contemplation stage for stress managementhad the highest average annual stress-related productivity impairment cost ($53,761 per employee).Although individuals who are classified as contemplative intend to improve their behaviour in thenext six months, they are considered not ready to self-initiate immediate changes [18]. Research hasshown in a national population based sample that a stage-matched stress management interventionwas effective in achieving rapid progression through the stages of effective stress management strategyadoption [18]. Given that the contemplation group for stress management in this study had highimpairment costs, savings could be achieved by assisting these employees to manage or removestress that is impacting on their work productivity. Future research should be conducted to identify ifimplementation of a stage of change matched stress management intervention could achieve similarresults in a mining workforce as achieved in the population based sample.
Consistent with previous research that found females were more likely to exhibit help-seekingbehaviours and access professional stress management or mental health support services [21–23],
145
IJERPH 2019, 16, 94
the current study found that females were significantly more likely to report wanting assistance withstress management. Although males and females had similar average impairment costs, the higherproportion of males in the mining workforce and the lower likelihood of males to want assistancesuggests that practitioners need to ensure that stress management promotion is appropriate forengaging males. Male employees appear to be unlikely to initiate help seeking behaviours despiteexperiencing stress at work. Given that this study found that higher frequency of experiencing stressat work was associated with higher impairment costs, it was encouraging to identify that higherstress frequency was also associated with greater desire for assistance with stress management.This suggests that workplace provided stress management assistance will likely appeal to highproductivity impairment cost employees that were frequently experiencing stress at work.
Similarly, stage of change for adoption of effective stress management behaviours analysesrevealed that employees in the contemplation stage had the both the highest cost impairment andhighest likelihood to report wanting assistance. By contrast, employees in the pre-contemplation stagewho believed their stress management habits did not need changing, were found to have both thelowest cost impairment and lowest likelihood to report wanting assistance. This again indicates thatworkplace provided stress management assistance will likely appeal to high productivity impairmentcost employees that were intending to improve their stress management in the next six months.
4.1. Limitations and Future Resarch
Limitations include the recruitment process, use of self-report data, and generalizability of results.Specifically, the recruitment of participants was restricted due to the operational demands to thosewhom attended the work site on the day and the researchers were unable to record the number ofemployees who were present but declined to participate. Therefore, it was not possible to accuratelyevaluate the extent to which the sample reflected the wider workforce of approximately 8000 employeesor response rate. Furthermore, it is not possible based on this case study to determine the extent towhich the results outlined herein are reflective of employees within the broader mining industry bothin Australia and globally. Additional studies are needed to longitudinally examine if demographicand work characteristics and employees’ readiness to change is associated with actual participation inworkplace stress management programs. The voluntary recruitment of participants could also haveexposed this study to a selection bias, with research participants potentially being more likely than theaverage employee to engage in healthy lifestyle behaviours.
4.2. Practical Implications
From a research perspective, future studies should explore whether permanent day shift and localemployment are significantly associated with higher productivity impairment costs after controllingfor the potential contribution of job role related responsibilities, job demands, and salaries. However,from a practical point of view, regardless of whether role or work arrangement is directly related toproductivity cost impairment, based on the current findings stress management strategies should beavailable to all employees with a particular focus on engaging employee groups with high impairmentcosts. Employee groups associated with average annual productivity impairment costs in excess of$50,000 per employee included: permanent day shift employees; employees who experienced stressat work most of the time; employees who experienced stress at work all of the time; and employeeswho were contemplating better managing their stress in the next 6 months. To guide effective stressmanagement in the Australian mining industry, future research should be conducted to identifywhether implementation of a stage-matched stress management intervention achieves similar resultsin a mining workforce as achieved in a population-based sample [18].
5. Conclusions
To effectively design and tailor stress management strategies for a mining workforce that willdeliver a high return on investment, practitioners must identify high cost employee groups and
146
IJERPH 2019, 16, 94
those receptive of participation in a workplace health promotion program. This study makes a novelcontribution to the workplace health literature by identifying characteristics in a mining workforceassociated with: (a) high stress related productivity impairment costs; and (b) characteristics of stressedemployees who desire assistance with stress management in an Australian mining company.
Overall, it is likely that the observed high productivity impairment costs associated with rosterand residential status (i.e., permanent day workers and local residents) is reflective of employeejob roles within these groups which may include persons who reside locally and are employed insupervisory or management roles. Therefore, a targeted workplace stress management program aimedat employees in such roles may result in the greatest return on investment.
Stage of change for stress management reflects an individuals’ readiness to change and desirefor assistance with stress management. According to the Stages of Change Model, individuals in theprecontemplation and contemplation stages are not attempting to manage their stress. Only 13.2%of employees in the precontemplation stage and 52.1% of employees in the contemplation stagereported wanting assistance with stress management. Therefore, workplace health promotion programstargeting stress management must, in the first instance, convince employees of the value and benefit ofparticipation in order to ensure high levels of enrolment that would result in the greatest benefit foremployees and return on investment for the organisation.
Overall, these findings suggest that, within the organisation presented in this study, workplaceprovided stress management assistance will likely appeal to over a third of the high the productivityimpairment cost employees. Furthermore, strategically targeted health promotion will be requiredto engage the remainder of the stressed employees with high productivity impairment costs and lowdesire for stress management assistance.
Author Contributions: T.D.S. and S.J.L. contributed equally to the project design and data collection. T.D.S.,S.J.L., and K.S. contributed equally to the data analysis and manuscript preparation. All authors contributedsubstantially to the work reported, and have read and approved the final manuscript.
Funding: This research received no external grant funding.
Acknowledgments: The authors acknowledge the corporate and community supporters who donated to WesleyMedical Research to advance health and medical research.
Conflicts of Interest: The authors declare no conflict of interest.
References
1. Bowers, J.; Lo, J.; Miller, P.; Mawren, D.; Jones, B. Psychological distress in remote mining and constructionworkers in Australia. Med. J. Aust. 2018, 208, 391–397. [CrossRef] [PubMed]
2. Considine, R.; Tynan, R.; James, C.; Wiggers, J.; Lewin, T.; Inder, K.; Perkins, D.; Handley, T.; Kelly, B.The contribution of individual, social and work characteristics to employee mental health in a coal miningindustry population. PLoS ONE 2017, 12, e0168445. [CrossRef] [PubMed]
3. Australian Bureau of Statistics. National Health Survey: First Results, 2014e15; Table 7 PsychologicalDistress—Australia. Available online: http://www.abs.gov.au/AUSSTATS/[email protected]/DetailsPage/4364.0.55.0012014-15?OpenDocument (accessed on 15 September 2018).
4. Street, T.D.; Lacey, S.J. Accounting for Employee Health: The Productivity Cost of Leading Health Risks.Health Promot. J. Aust. 2018. [CrossRef] [PubMed]
5. Ling, R.; Kelly, B.; Considine, R.; Tynan, R.; Searles, A.; Doran, C.M. The economic impact of psychologicaldistress in the Australian coal mining industry. J. Occup. Environ. Med. 2016, 58, e171–e176. [CrossRef]
6. Chandola, T.; Brunner, E.; Marmot, M. Chronic stress at work and the metabolic syndrome: Prospectivestudy. BMJ 2006, 332, 521–525. [CrossRef]
7. Eakin, J.M. Work-related determinants of health behavior. In Handbook of Health Behavior Research I: Personaland Social Determinants; Gochman, D., Ed.; Plenum Press: New York, NY, USA, 1997; pp. 337–357.
8. Siegrist, J.; Rodel, A. Work stress and health risk behavior. Scand. J. Work Environ. Health 2006, 32, 473–481.[CrossRef]
147
IJERPH 2019, 16, 94
9. McPhedran, S.; De Leo, D. Relationship quality, work-family stress, and mental health among Australianmale mining industry employees. J. Relationsh. Res. 2014, 5, 1–9. [CrossRef]
10. House of Representatives Committee. Cancer of the Bush or Salvation for Our Cities? Fly-In,Fly-Out and Drive-In, Drive-Out Workforce Practices in Regional Australia. Available online:https://www.aph.gov.au/Parliamentary_Business/Committees/House_of_Representatives_Committees?url=ra/fifodido/report/fullreport.pdf (accessed on 15 September 2018).
11. Education Health Standing Committee the Impact of FIFO Work Practices on Mental Health: Final Report.Available online: http://www.parliament.wa.gov.au/Parliament/commit.nsf/(Report+Lookup+by+Com+ID)/2E970A7A4934026448257E67002BF9D1/$file/20150617%20-%20Final%20Report%20w%20signature%20for%20website.htaccess (accessed on 15 September 2018).
12. Torkington, A.M.; Larkins, S.; Gupta, T.S. The psychosocial impacts of fly-in fly-out and drive-in drive-outmining on mining employees: A qualitative study. Aust. J. Rural Health 2011, 19, 135–141. [CrossRef]
13. Kaczmarek, E.; Sibbel, A.; Cowie, C. Australian military and Fly-In/Fly-Out (FIFO) mining families:A comparative study. Aust. J. Psychol. 2003, 55, 187–188.
14. Harvey, S.B.; Joyce, S.; Tan, L.; Johnson, A.; Nguyen, H.; Modini, M.; Groth, M. Developing a Mentally HealthyWorkplace: A Review of the Literature. 2014. Available online: https://www.headsup.org.au/docs/default-source/resources/developing-a-mentally-healthy-workplace_final-november-2014.pdf?sfvrsn=8 (accessedon 24 September 2018).
15. Richardson, K.M.; Rothstein, H.R. Effects of occupational stress management intervention programs:A meta-analysis. J. Occup. Health psychol. 2008, 13, 69. [CrossRef]
16. Lipschitz, J.M.; Paiva, A.L.; Redding, C.A.; Butterworth, S.; Prochaska, J.O. Co-occurrence and coactionof stress management with other health risk behaviors. J. Health Psychol. 2015, 20, 1002–1012. [CrossRef][PubMed]
17. Tynan, R.J.; Considine, R.; Rich, J.L.; Skehan, J.; Wiggers, J.; Lewin, T.J.; James, C.; Inder, K.; Baker, A.L.;Kay-Lambkin, F. Help-seeking for mental health problems by employees in the Australian Mining Industry.BMC Health Serv. Res. 2016, 16, 498. [CrossRef] [PubMed]
18. Evers, K.E.; Prochaska, J.O.; Johnson, J.L.; Mauriello, L.M.; Padula, J.A.; Prochaska, J.M. A randomized clinicaltrial of a population-and transtheoretical model-based stress-management intervention. Health Psychol. 2006,25, 521. [CrossRef] [PubMed]
19. Street, T.D.; Lacey, S.J. Employee characteristics and health belief variables related to smoking cessationengagement attitudes. Work 2018, 60, 75–83. [CrossRef] [PubMed]
20. Street, T.D.; Thomas, D.L. Beating obesity: Factors associated with interest in workplace weight managementassistance in the mining industry. Saf. Health Work 2017, 8, 89–93. [CrossRef] [PubMed]
21. Wang, P.S.; Aguilar-Gaxiola, S.; Alonso, J.; Angermeyer, M.C.; Borges, G.; Bromet, E.J.; Bruffaerts, R.;De Girolamo, G.; De Graaf, R.; Gureje, O. Use of mental health services for anxiety, mood, and substancedisorders in 17 countries in the WHO world mental health surveys. Lancet 2007, 370, 841–850. [CrossRef]
22. Burgess, P.M.; Pirkis, J.E.; Slade, T.N.; Johnston, A.K.; Meadows, G.N.; Gunn, J.M. Service use for mentalhealth problems: Findings from the 2007 National Survey of Mental Health and Wellbeing. Aust. N. Z.J. Psychiatry 2009, 43, 615–623. [CrossRef] [PubMed]
23. Olesen, S.C.; Butterworth, P.; Leach, L.S.; Kelaher, M.; Pirkis, J. Mental health affects future employment asjob loss affects mental health: Findings from a longitudinal population study. BMC Psychiatry 2013, 13, 144.[CrossRef]
24. Australian Bureau of Statistics. Australian Health Survey: Users Guide, 2011–2013 (No. 4363.0.55.001).Available online: http://www.abs.gov.au (accessed on 14 September 2018).
25. Lacey, S.J.; Street, T.D. Measuring healthy behaviours using the stages of change model: An investigationinto the physical activity and nutrition behaviours of Australian miners. BioPsychoSocial Med. 2017, 11, 30.[CrossRef]
26. Prochaska, J.O.; Butterworth, S.; Redding, C.A.; Burden, V.; Perrin, N.; Leo, M.; Flaherty-Robb, M.;Prochaska, J.M. Initial efficacy of MI, TTM tailoring and HRI’s with multiple behaviors for employeehealth promotion. Prev. Med. 2008, 46, 226–231. [CrossRef]
27. Reilly, M.C.; Zbrozek, A.S.; Dukes, E.M. The validity and reproducibility of a work productivity and activityimpairment instrument. Pharmacoeconomics 1993, 4, 353–365. [CrossRef] [PubMed]
148
IJERPH 2019, 16, 94
28. World Health Organization Regional. Guidelines for the Development of Healthy Workplaces. Availableonline: http://www.who.int/occupationalhealth/publications/wproguidelines/en/ (accessed on 15September 2018).
29. Lenneman, J.; Schwartz, S.; Giuseffi, D.L.; Wang, C. Productivity and health: An application of threeperspectives to measuring productivity. J. Occup. Environ. Med. 2011, 53, 55–61. [CrossRef] [PubMed]
30. Australian Bureau of Statistics. Employee Earnings and Hours, Australia. Available online: http://www.abs.gov.au/ausstats/[email protected]/mf/6306.0/ (accessed on 15 September 2018).
© 2018 by the authors. Licensee MDPI, Basel, Switzerland. This article is an open accessarticle distributed under the terms and conditions of the Creative Commons Attribution(CC BY) license (http://creativecommons.org/licenses/by/4.0/).
149
International Journal of
Environmental Research
and Public Health
Article
Association between Occupational Injury andSubsequent Employment Termination among NewlyHired Manufacturing Workers
Nathan C. Huizinga 1, Jonathan A. Davis 1,2 , Fred Gerr 1 and Nathan B. Fethke 1,3,*
1 Department of Occupational and Environmental Health, University of Iowa, Iowa City, IA 52242, USA;[email protected] (N.C.H.); [email protected] (J.A.D.); [email protected] (F.G.)
2 University of Iowa Injury Prevention Research Center, University of Iowa, Iowa City, IA 52242, USA3 Healthier Workforce Center of the Midwest, University of Iowa, Iowa City, IA 52242, USA* Correspondence: [email protected]
Received: 14 December 2018; Accepted: 31 January 2019; Published: 2 February 2019
Abstract: Few longitudinal studies have examined occupational injury as a predictor of employmenttermination, particularly during the earliest stages of employment when the risk of occupationalinjury may be greatest. Human resources (HR) records were used to establish a cohort of 3752 hourlyemployees newly hired by a large manufacturing facility from 2 January 2012, through 25 November2016. The HR records were linked with records of employee visits to an on-site occupational healthcenter (OHC) for reasons consistent with occupational injury. Cox regression methods were then usedto estimate the risk of employment termination following a first-time visit to the OHC, with time totermination as the dependent variable. Analyses were restricted to the time period ending 60 calendardays from the date of hire. Of the 3752 employees, 1172 (31.2%) terminated employment prior to 60days from date of hire. Of these, 345 terminated voluntarily and 793 were terminated involuntarily.The risk of termination for any reason was greater among those who visited the OHC during thefirst 60 days of employment than among those who did not visit the OHC during the first 60 days ofemployment (adjusted hazard ratio = 2.58, 95% CI = 2.12–3.15). The magnitude of effect was similarregardless of the nature of the injury or the body area affected, and the risk of involuntary terminationwas generally greater than the risk of voluntary termination. The results support activities to manageworkplace safety and health hazards in an effort to reduce employee turnover rates.
Keywords: turnover; employment duration; occupational injury; manufacturing; newly-hired workers
1. Introduction
In certain occupational contexts, such as knowledge-based work, some level of employee turnoveris considered potentially healthy for an organization (e.g., by providing opportunities to replace poorperformers) [1,2]. More broadly, however, it is widely believed that a high level of turnover is amarker for one or more undesirable characteristics of the employment circumstance, including safetyand health hazards [3–5]. Increased levels of employee turnover are also commonly associated withdecreased organizational performance and profitability [3,5,6]. Thus, understanding and mitigatingfactors leading to employee turnover is an important business management strategy.
An increased risk of occupational injury during the earliest periods of employment has beenobserved in numerous studies spanning many decades [7,8]. Examinations of early data compiled bythe US Bureau of Labor Statistics observed that both the proportion and incidence rates of occupationalinjuries were greatest during the first three months of employment [9,10]. Many subsequent studiesalso observed greater injury frequencies, prevalence, or incidence rates among employees with thelowest job tenure. For example, from 1995 to 2004, 28% of >86,000 injuries among mining workers
IJERPH 2019, 16, 433; doi:10.3390/ijerph16030433 www.mdpi.com/journal/ijerph150
IJERPH 2019, 16, 433
occurred among those in the first year of employment, while 33% occurred among those employed1–5 years [11]. Among logging workers, the rate of workers’ compensation claims (from 1999 to2003) was more than double among those with two or fewer months of job tenure (vs. those with>2 months of job tenure) [12]. In addition, substantially greater incidence rates and relative risksof first-time workers’ compensation claims involving lost work days were observed among thoseemployed (across a range of industrial sectors) for less than one month (vs. those employed for atleast 13 months) [13]. This effect was consistent across injury event classifications, including thosetypical of acute, traumatic injuries (e.g., contact with objects/equipment and falls) and those typical ofmore chronic, musculoskeletal outcomes (e.g., repetitive motion). Recent meta-analyses also suggestthat negative impacts of turnover on safety outcomes (e.g., occupational injury rates) are among thestrongest drivers of reduced organizational financial performance [14]. Thus, if turnover levels arehigh, then an employer will find itself continuously (i) replenishing its workforce with new employeesat greatest risk of injury and associated costs (e.g., workers’ compensation) and (ii) incurring potentiallyavoidable costs associated with hiring and training new employees.
While employment duration or worker experience has frequently been examined as a riskfactor for occupational injury, occupational injury has less often been examined as a risk factor foremployment duration (or termination). The relationship between occupational injury and employeeturnover, if any, is likely complex. Cree and Kelloway [15] suggested a model whereby employees’turnover intentions are influenced by the perception of risk associated with the work, which itself is afunction of (i) employees’ “accident history,” either direct (i.e., actual injury experience) or indirect(i.e., knowledge of others’ injury experiences) and (ii) the attitudes of coworkers, supervisors, andmanagement regarding workplace safety and health. In this context, it is important to note thatturnover intentions relate to voluntary employment termination, which is also influenced by factorsnot directly related to workplace safety and health, such the availability of alternative employmentoptions [16]. Associations between occupational injury and subsequent employment termination(both voluntary and involuntary) have been recently observed among health care workers [17,18].It is not known, however, if the associations observed among health care workers also apply tomanufacturing settings, in which entry into the workforce may not require specific knowledge andskills, and in which workers may not be afforded the same level of autonomy [19].
The objective of this study was to estimate the association between occupationalinjury and subsequent employment termination among newly hired manufacturing workers.Specifically, we merged human resources information with information from an on-site occupationalhealth center to create a time history for each worker in relation to both occupational injury eventsand employment duration (and/or termination). We also restricted our analyses to the first 60 daysfrom the date of hire, and hypothesized that those experiencing an occupational injury during thistime were more likely to terminate employment (for both voluntary and involuntary reasons) prior to60 days from the date of hire.
2. Materials and Methods
2.1. Study Overview
A cohort of all hourly employees newly hired from 2 January 2012 through 25 November 2016by a large manufacturing facility in the US Midwest was established using the employer’s humanresources records database. We did not include employees newly hired into administrative, managerial,or other salaried positions (e.g., engineering). Occupational injury data from the same time periodwere extracted from a separate database maintained by the facility’s on-site occupational healthcenter. The two datasets were linked using an identification number assigned to each employee. Theemployer redacted all personal identifiers from the merged dataset prior to delivery to the researchteam. Written approval was obtained from the employer for use of the merged (de-identified) dataset,
151
IJERPH 2019, 16, 433
and the University of Iowa Institutional Review Board determined that the study did not meet theregulatory definition of human subjects’ research.
2.2. Study Facility and Setting
The study facility produces consumer-grade household appliances. At any given time during thestudy period, the facility employed approximately 2300 hourly workers and occupied approximately232,000 m2 of production space. Production employees were organized by a labor union. Productionoutput during the study period was roughly 5000 completed products per day across three mainproduct assembly lines and one premium product line. Human resources onboarding and basicsafety training for new hires occurred during the first four hours of each of the first two days ofemployment. The facility also has a dedicated training area used to orient new hires to the materials,equipment (e.g., machinery and tools), and processes that are common throughout the productionareas. New hires practice simulated production tasks in the training area, gaining proficiency whilelearning expectations for compliance with safety policies in a hands-on manner. During the secondfour hours of each of the first two days of employment, new hires shadowed a current employee tolearn the production processes required of the jobs to which they were assigned. Transition fromshadowing to full-time production activities was expected by the third day of employment.
2.3. Probationary Period
Based on the collective bargaining agreement between workers and management, each newhourly employee was considered “probationary” for a period of 60 calendar days from the date of hire.During the probationary period, new employees (i) were not under the jurisdiction of the collectivebargaining agreement, (ii) had limited access to overtime work, and (iii) were unable to request jobreassignment within the facility. After 60 calendar days from the date of hire, each employee wasconsidered a “regular” employee subject to all collective bargaining provisions regardless of formalaffiliation with the labor organization.
The 60-day probationary period is also consistent with estimates of the time required to recovercosts associated with hiring and training unskilled workers [20]. Facility management estimated thatthe hiring and training costs associated with each new hire were $5500 (on average). New hires at thestudy facility earn an average initial wage of approximately 15.00 $/h. Assuming the value of labor isequivalent to the pay rate, hiring and training costs would be recovered after 367 work hours, or justover 45 8-hour work days. Generally, 45 8-hour work days will occur within 60 calendar days from thedate of hire.
2.4. Study Sample
The human resources database included records on 3834 employees hired during the observationperiod. For employees hired multiple times during the observation period, only the first instancewas included in the final dataset (resulting in exclusion of 13 records). Employees hired between26 September 2016 and 25 November 2016, were also excluded (69 records) in order to ensure allemployees in the final dataset had the potential to work the full 60-day probationary period. Therefore,the final study sample included 3752 employees.
2.5. Employment Termination
The primary outcome event was any termination of employment during the 60-day probationaryperiod, dichotomized as “yes” or “no.” Outcome variables were created using information availablein the human resources records database. Information was also available regarding the reasonfor termination, as recorded by the employer. We classified the following reasons as involuntaryterminations: termination without pay, violation of workplace violence policy, absenteeism,unsatisfactory performance, and safety violation. We classified the following reasons as voluntaryterminations: personal reasons, return to school, relocation, another job, and “3-day no call/no show.”
152
IJERPH 2019, 16, 433
The “3-day no call/no show” reason refers to an employer policy stating that an employee willbe terminated if he/she is absent for three consecutive work days and does not communicate anexplanation for the absence. We considered such a circumstance a voluntary termination, in contrast toabsenteeism, which was related to the number of absent days regardless of communication betweenthe employee and the employer (which we considered an involuntary termination). Terminations alsooccurred for other reasons for which neither involuntary nor voluntary could be assigned, including:promotion from hourly to salaried employment, catastrophic injury outside of work that removed theemployee from the workforce, and unspecified circumstances.
2.6. Occupational Health Center Visits
The primary predictor variable was the occurrence of any first-time visit to the on-site occupationalhealth center (OHC) within 60 calendar days from the date of hire (i.e., early OHC visit, dichotomizedas yes/no), regardless of the nature of injury/event or the body part/area affected. Secondarypredictor variables were created by classifying early OHC visits according to (i) the “nature ofinjury,” recorded in the OHC database as repetitive strain, acute sprain/strain, struck/caught/injuredby, cut/puncture/scrape, slip/trip/fall, temperature extreme, and a variety of other descriptors(e.g., chemical burns, allergic reactions, and foreign objects in eye, among others), and (ii) the “bodypart/area affected,” recorded in the OHC database as abdominal area, chest area, a variety of lowerextremity areas (hips, knees, ankles, feet, thighs, and calves), head/eye, low back, shoulder/arm,wrist/hand, upper back/neck, and other (e.g., heat-related). To manage small cell sizes for analysispurposes, the nature of injury categories were collapsed to repetitive strain, acute sprain/strain,and general occupational injuries (i.e., all others). Collapsing the nature of injury categories alsoseparated injuries that typically result from exposure to physical risk factors for musculoskeletaloutcomes from injuries that typically result from exposure to other hazards. The body part/areaaffected categories were also collapsed to low back, shoulder/arm, wrist/hand, and other (i.e., all otherbody parts/areas) to manage small sizes.
Primary and secondary predictor variables were created from information available in the OHCdatabase. Employer policy required the immediate reporting of acute occupational injuries as wellas signs and symptoms consistent with non-acute adverse musculoskeletal health outcomes to OHCnursing staff. Nursing staff were required to document all OHC visits, including the employee number,the date of the visit, the nature of the injury/event which brought the employee to the center, as well asthe body part/area affected. The OHC database did not contain information regarding other, personalhealth concerns for which an employee might seek care.
2.7. Demographic Variables
Demographic variables available for each new hire included gender, age, and race/ethnicity.Age was analyzed as a continuous variable. Race/ethnicity was categorized as White/Caucasian,Black/African-American, Hispanic/Latino(a) and other (including Asian/Pacific islanders, Alaskannatives and American Indians).
2.8. Job Characteristics
The human resources records database included information about the work shift towhich each new hire was assigned, categorized as First (7:00 a.m.–3:30 p.m., Monday–Friday),Second (3:30 p.m.–11:30 p.m., Monday–Friday), Third (11:30 p.m.–7:00 a.m., Monday–Friday),and Premium (5:00 a.m.–3:30 p.m., Monday–Thursday). In addition, information was availablefor job classification and assigned department. At the study facility, a department is an organizationalunit consisting of a group of production tasks under the supervision of one or more production teamleaders. We used the job classification and department information to assign a “nature of work” toeach new hire, categorized as assembly, fabrication, inspection, material handling, or maintenance.
153
IJERPH 2019, 16, 433
Assembly work was machine-paced and cyclic. Workers in the assembly classification performedone or more production tasks according to a standard sequence of steps, with a cycle time typically onthe order of 35 seconds. Assembly work involved a range of hand-intensive activities, including manualmanipulation and installation of parts and the use of both manual and powered hand tools. Fabricationwork involved the operation of in-house machinery and fabrication equipment (e.g., presses, vacuumforming machines, and foam injection machines, among many others). Fabrication work was oftencyclic, but self-paced rather than machine-paced (in contrast to assembly work). Fabrication areasreceived daily orders for parts to support the assembly lines and workers would feed raw materialinto the equipment and either manipulate manual controls or operate digital interfaces. Inspectionwork involved visual inspection of the completed products or sub-assemblies. Inspection workwas distributed throughout the assembly lines but, in contrast to assembly work, was not alwayscyclic and involved less biomechanically demanding activity (e.g., placing/scanning bar code labelsand completing paperwork). Material handling generally involved the use of powered industrialvehicles and manual push/pull carts to transport parts and completed products throughout the facility.Finally, maintenance work involved electrical work, powered industrial vehicle repair, tool and diemaintenance, as well as repair of assembly and fabrication equipment.
2.9. Statistical Analyses
The duration of employment was dichotomized as ≤60 days (i.e., termination of employmentduring the probationary period) and >60 days (i.e., working at least to end of the probationaryperiod). The demographic variables (gender, age, race/ethnicity) and job characteristic variables(shift, and nature of work) were then stratified and summarized by duration of employment fordescriptive purposes. Age was reported using the mean and standard deviation; all other variableswere reported using observation frequencies and proportions.
We calculated incidence rates of OHC visits to provide additional context to the analysis.Specifically, incidence rates were calculated as the number of first-time OHC visits divided by the totalperson-time at risk of visiting the OHC across the full duration of the study period (i.e., 2 January 2012to 25 November 2016). For employees with an OHC visit, person-time at risk was censored on the dateof the first OHC visit recorded in the OHC database. For employees with no OHC visit, person-timewas censored on either (i) the date at which employment was terminated or (ii) the end of the studyperiod. In addition, we calculated incidence rates of first-time OHC visits that occurred during the60-day probationary period (i.e., early OHC visits). The same censoring criteria were used for thesecalculations, although each employee contributed a maximum of 60 days of person-time at risk ofvisiting the OHC.
Hazard ratios (HRs) of the crude associations between early OHC visits and time to terminationduring the 60-day probationary period were estimated using Cox regression methods [21,22].Nine models were constructed, each representing one of the combinations of one OHC visit definition(any early OHC visit, nature of injury, or body part/area affected) and one time to terminationdefinition (any, involuntary, or voluntary). In all models, the referent category was limited to thoseemployees without an early OHC visit. Time-varying measures of the three OHC visit variables(listed immediately above) were created to capture person-time both before and following an OHCvisit [23]. Specifically, among those with an early OHC visit, the number of days from the date ofhire to the date of the early OHC visit was analyzed as unexposed time (but time while still at risk ofemployment termination), while the number of days from the date of the early OHC visit to the date onwhich person-time was censored was analyzed as exposed time. Among those without an early OHCvisit, all person-time of observation was analyzed as unexposed time. Also, in models with involuntarytermination as the outcome event, we included person-time accumulated among those with voluntaryor other terminations because these employees were still at risk of involuntary termination prior to thetime of voluntary or other termination. Similarly, in models with voluntary termination as the outcomeevent, we included person-time accumulated among those with involuntary or other terminations
154
IJERPH 2019, 16, 433
because these employees were still at risk of voluntary termination prior to the time of involuntary orother termination.
For all crude analyses, the proportional hazards assumption was tested by including interactionterms between each predictor variable and time; no statistically significant interaction terms wereobserved, indicating that the proportional hazards assumption was not violated. Cox regressionmethods were also used to estimate crude associations between each demographic and jobcharacteristic variable and time to each of the termination types (any, involuntary, and voluntary).
Adjusted associations between early OHC visits and time to termination were also estimatedusing Cox regression. As in the crude analyses, models were constructed for each combination of oneOHC visit definition and one time to termination definition (i.e., nine total models). Demographic andjob characteristic variables crudely associated with the risk of employment termination (with p < 0.10)were included in all multivariable models. No further model specification criteria were applied(e.g., backward elimination) given the small number of available demographic and job characteristicvariables relative to the sample size.
To assess bias of the adjusted hazard ratios between early OHC visits and time to involuntarytermination potentially introduced by retaining in the analyses person-time accumulated among thosewith voluntary or other termination (and vice versa), additional analyses were conducted with datasets(i) restricted only to those with involuntary or no termination (i.e., excluding those with voluntary orother termination) and (ii) restricted only to those with voluntary or no termination (i.e., excludingthose with involuntary or other termination). All statistical procedures were performed using SAS(version 9.4, SAS Institute, Inc., Cary, NC, USA).
3. Results
A summary of demographic and job characteristic variables is provided in Table 1. The mean ageof the 3752 employees was 33.9 ± 10.9 years, and 68.0% were male. 58.4% of the employees identifiedas white/Caucasian, 39.1% as black/African-American, 2.7% as Hispanic/Latino, and 3.4% as otherracial/ethnic designations. Larger proportions of new hires were placed into the first (34.6%) andsecond (43.7%) shifts compared to third (18.7%) and premium (3.0%) shifts. A substantial majority(87.2%) was assigned to assembly work.
1172 (31.2%) of the new hires were employed 60 days or less. Of these, 793 (67.7%) were terminatedfor involuntary reasons, 345 (20.4%) for voluntary reasons, and 34 (2.9%) for other reasons (Table 1).Differences in the distributions of demographic and job characteristic variables between employmentduration strata (i.e., employed >60 days vs. employed ≤60 days) were generally small. However,those employed ≤60 days were less frequently male, more frequently white/Caucasian, and morefrequently assigned to assembly work. In addition, a smaller proportion of those employed ≤60 dayswas assigned to the premium product line, although the number of new hires in this category wasrelatively small.
Employees contributed a total of 856,845 person-days (2348 person-years (PY)) of observationduring the study period (2 January 2012–25 November 2016). During this time, a total of 1090 first-timeOHC visits were recorded, yielding an overall incidence rate (IR) of 46.4/100PY. Of the 1090 first-timevisits, 453 (41.6%) were classified as general occupational injuries (IR = 19.3/100PY), 429 (39.3%) asrepetitive strain (IR = 18.3/100PY), and 208 (19.1%) as acute sprain/strain (IR = 8.9/100PY). The bodypart/area affected most commonly was the wrist/hand (29.3%), followed by the shoulder/arm (25.2%)and the low back (10.9%), with other body parts/areas accounting for the remainder (34.6%).
155
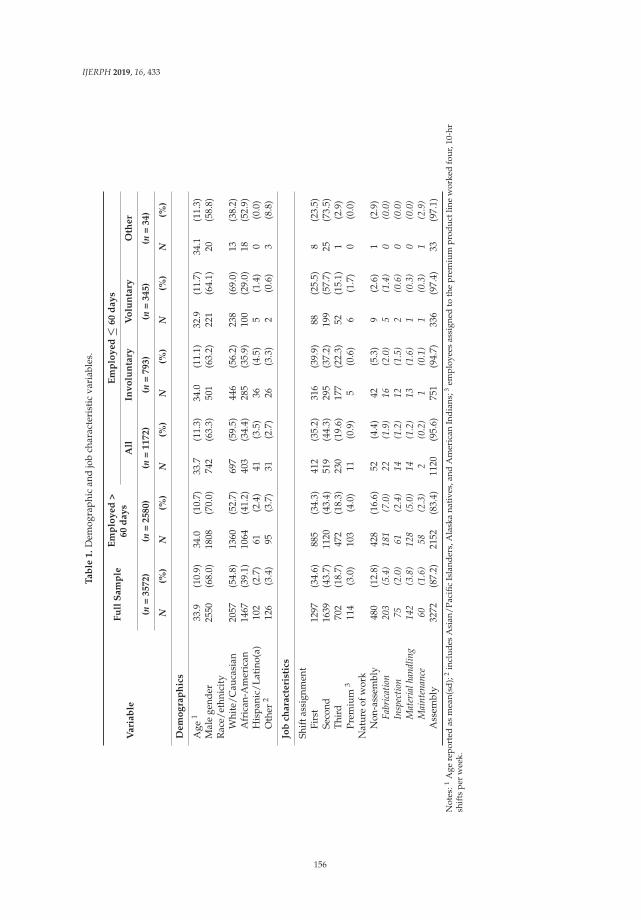
IJERPH 2019, 16, 433
Ta
ble
1.
Dem
ogra
phic
and
job
char
acte
rist
icva
riab
les.
Va
ria
ble
Fu
llS
am
ple
Em
plo
ye
d>
60
da
ys
Em
plo
ye
d≤
60
da
ys
All
Inv
olu
nta
ryV
olu
nta
ryO
the
r
(n=
35
72
)(n
=2
58
0)
(n=
11
72
)(n
=7
93
)(n
=3
45
)(n
=3
4)
N(%
)N
(%)
N(%
)N
(%)
N(%
)N
(%)
De
mo
gra
ph
ics
Age
133
.9(1
0.9)
34.0
(10.
7)33
.7(1
1.3)
34.0
(11.
1)32
.9(1
1.7)
34.1
(11.
3)M
ale
gend
er25
50(6
8.0)
1808
(70.
0)74
2(6
3.3)
501
(63.
2)22
1(6
4.1)
20(5
8.8)
Rac
e/et
hnic
ity
Whi
te/C
auca
sian
2057
(54.
8)13
60(5
2.7)
697
(59.
5)44
6(5
6.2)
238
(69.
0)13
(38.
2)A
fric
an-A
mer
ican
1467
(39.
1)10
64(4
1.2)
403
(34.
4)28
5(3
5.9)
100
(29.
0)18
(52.
9)H
ispa
nic/
Lati
no(a
)10
2(2
.7)
61(2
.4)
41(3
.5)
36(4
.5)
5(1
.4)
0(0
.0)
Oth
er2
126
(3.4
)95
(3.7
)31
(2.7
)26
(3.3
)2
(0.6
)3
(8.8
)
Job
cha
ract
eri
stic
s
Shif
tass
ignm
ent
Firs
t12
97(3
4.6)
885
(34.
3)41
2(3
5.2)
316
(39.
9)88
(25.
5)8
(23.
5)Se
cond
1639
(43.
7)11
20(4
3.4)
519
(44.
3)29
5(3
7.2)
199
(57.
7)25
(73.
5)Th
ird
702
(18.
7)47
2(1
8.3)
230
(19.
6)17
7(2
2.3)
52(1
5.1)
1(2
.9)
Prem
ium
311
4(3
.0)
103
(4.0
)11
(0.9
)5
(0.6
)6
(1.7
)0
(0.0
)N
atur
eof
wor
kN
on-a
ssem
bly
480
(12.
8)42
8(1
6.6)
52(4
.4)
42(5
.3)
9(2
.6)
1(2
.9)
Fabr
icat
ion
203
(5.4
)18
1(7
.0)
22(1
.9)
16(2
.0)
5(1
.4)
0(0
.0)
Insp
ectio
n75
(2.0
)61
(2.4
)14
(1.2
)12
(1.5
)2
(0.6
)0
(0.0
)M
ater
ialh
andl
ing
142
(3.8
)12
8(5
.0)
14(1
.2)
13(1
.6)
1(0
.3)
0(0
.0)
Mai
nten
ance
60(1
.6)
58(2
.3)
2(0
.2)
1(0
.1)
1(0
.3)
1(2
.9)
Ass
embl
y32
72(8
7.2)
2152
(83.
4)11
20(9
5.6)
751
(94.
7)33
6(9
7.4)
33(9
7.1)
Not
es:1
Age
repo
rted
asm
ean(
sd);
2in
clud
esA
sian
/Pac
ific
Isla
nder
s,A
lask
ana
tive
s,an
dA
mer
ican
Ind
ians
;3em
ploy
ees
assi
gned
toth
epr
emiu
mpr
oduc
tlin
ew
orke
dfo
ur,1
0-hr
shif
tspe
rw
eek.
156
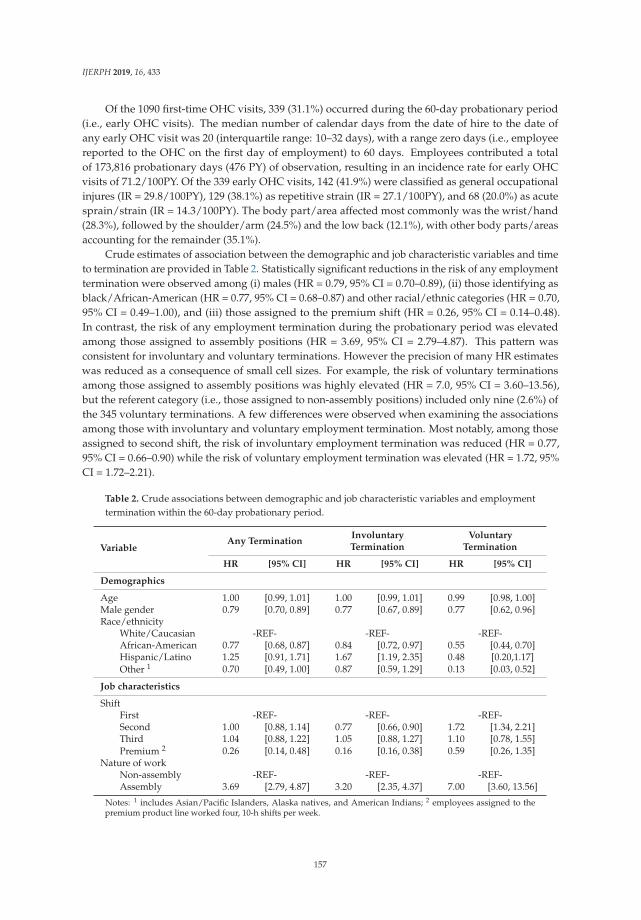
IJERPH 2019, 16, 433
Of the 1090 first-time OHC visits, 339 (31.1%) occurred during the 60-day probationary period(i.e., early OHC visits). The median number of calendar days from the date of hire to the date ofany early OHC visit was 20 (interquartile range: 10–32 days), with a range zero days (i.e., employeereported to the OHC on the first day of employment) to 60 days. Employees contributed a totalof 173,816 probationary days (476 PY) of observation, resulting in an incidence rate for early OHCvisits of 71.2/100PY. Of the 339 early OHC visits, 142 (41.9%) were classified as general occupationalinjures (IR = 29.8/100PY), 129 (38.1%) as repetitive strain (IR = 27.1/100PY), and 68 (20.0%) as acutesprain/strain (IR = 14.3/100PY). The body part/area affected most commonly was the wrist/hand(28.3%), followed by the shoulder/arm (24.5%) and the low back (12.1%), with other body parts/areasaccounting for the remainder (35.1%).
Crude estimates of association between the demographic and job characteristic variables and timeto termination are provided in Table 2. Statistically significant reductions in the risk of any employmenttermination were observed among (i) males (HR = 0.79, 95% CI = 0.70–0.89), (ii) those identifying asblack/African-American (HR = 0.77, 95% CI = 0.68–0.87) and other racial/ethnic categories (HR = 0.70,95% CI = 0.49–1.00), and (iii) those assigned to the premium shift (HR = 0.26, 95% CI = 0.14–0.48).In contrast, the risk of any employment termination during the probationary period was elevatedamong those assigned to assembly positions (HR = 3.69, 95% CI = 2.79–4.87). This pattern wasconsistent for involuntary and voluntary terminations. However the precision of many HR estimateswas reduced as a consequence of small cell sizes. For example, the risk of voluntary terminationsamong those assigned to assembly positions was highly elevated (HR = 7.0, 95% CI = 3.60–13.56),but the referent category (i.e., those assigned to non-assembly positions) included only nine (2.6%) ofthe 345 voluntary terminations. A few differences were observed when examining the associationsamong those with involuntary and voluntary employment termination. Most notably, among thoseassigned to second shift, the risk of involuntary employment termination was reduced (HR = 0.77,95% CI = 0.66–0.90) while the risk of voluntary employment termination was elevated (HR = 1.72, 95%CI = 1.72–2.21).
Table 2. Crude associations between demographic and job characteristic variables and employmenttermination within the 60-day probationary period.
VariableAny Termination
InvoluntaryTermination
VoluntaryTermination
HR [95% CI] HR [95% CI] HR [95% CI]
Demographics
Age 1.00 [0.99, 1.01] 1.00 [0.99, 1.01] 0.99 [0.98, 1.00]Male gender 0.79 [0.70, 0.89] 0.77 [0.67, 0.89] 0.77 [0.62, 0.96]Race/ethnicity
White/Caucasian -REF- -REF- -REF-African-American 0.77 [0.68, 0.87] 0.84 [0.72, 0.97] 0.55 [0.44, 0.70]Hispanic/Latino 1.25 [0.91, 1.71] 1.67 [1.19, 2.35] 0.48 [0.20,1.17]Other 1 0.70 [0.49, 1.00] 0.87 [0.59, 1.29] 0.13 [0.03, 0.52]
Job characteristics
ShiftFirst -REF- -REF- -REF-Second 1.00 [0.88, 1.14] 0.77 [0.66, 0.90] 1.72 [1.34, 2.21]Third 1.04 [0.88, 1.22] 1.05 [0.88, 1.27] 1.10 [0.78, 1.55]Premium 2 0.26 [0.14, 0.48] 0.16 [0.16, 0.38] 0.59 [0.26, 1.35]
Nature of workNon-assembly -REF- -REF- -REF-Assembly 3.69 [2.79, 4.87] 3.20 [2.35, 4.37] 7.00 [3.60, 13.56]
Notes: 1 includes Asian/Pacific Islanders, Alaska natives, and American Indians; 2 employees assigned to thepremium product line worked four, 10-h shifts per week.
157
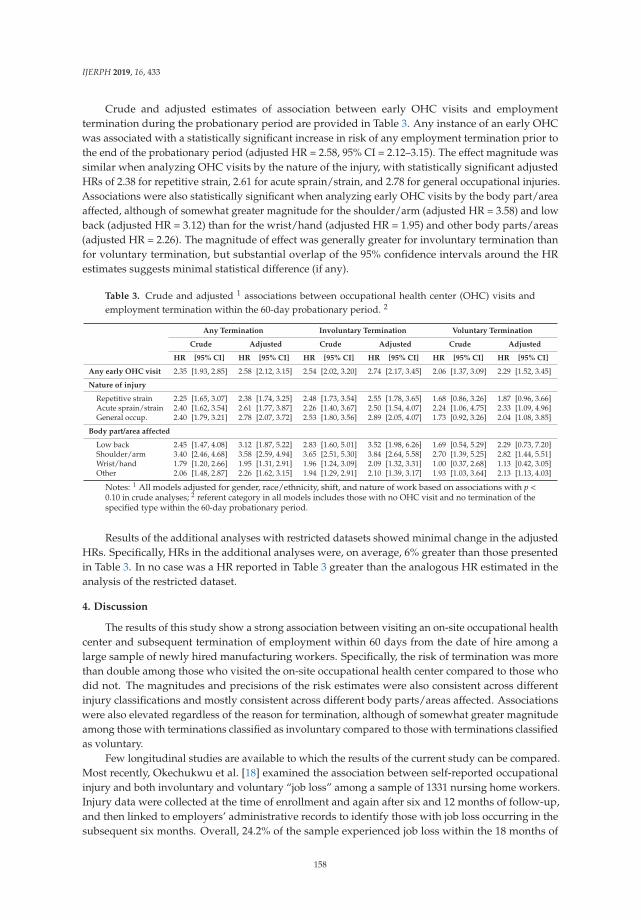
IJERPH 2019, 16, 433
Crude and adjusted estimates of association between early OHC visits and employmenttermination during the probationary period are provided in Table 3. Any instance of an early OHCwas associated with a statistically significant increase in risk of any employment termination prior tothe end of the probationary period (adjusted HR = 2.58, 95% CI = 2.12–3.15). The effect magnitude wassimilar when analyzing OHC visits by the nature of the injury, with statistically significant adjustedHRs of 2.38 for repetitive strain, 2.61 for acute sprain/strain, and 2.78 for general occupational injuries.Associations were also statistically significant when analyzing early OHC visits by the body part/areaaffected, although of somewhat greater magnitude for the shoulder/arm (adjusted HR = 3.58) and lowback (adjusted HR = 3.12) than for the wrist/hand (adjusted HR = 1.95) and other body parts/areas(adjusted HR = 2.26). The magnitude of effect was generally greater for involuntary termination thanfor voluntary termination, but substantial overlap of the 95% confidence intervals around the HRestimates suggests minimal statistical difference (if any).
Table 3. Crude and adjusted 1 associations between occupational health center (OHC) visits andemployment termination within the 60-day probationary period. 2
Any Termination Involuntary Termination Voluntary Termination
Crude Adjusted Crude Adjusted Crude Adjusted
HR [95% CI] HR [95% CI] HR [95% CI] HR [95% CI] HR [95% CI] HR [95% CI]
Any early OHC visit 2.35 [1.93, 2.85] 2.58 [2.12, 3.15] 2.54 [2.02, 3.20] 2.74 [2.17, 3.45] 2.06 [1.37, 3.09] 2.29 [1.52, 3.45]
Nature of injury
Repetitive strain 2.25 [1.65, 3.07] 2.38 [1.74, 3.25] 2.48 [1.73, 3.54] 2.55 [1.78, 3.65] 1.68 [0.86, 3.26] 1.87 [0.96, 3.66]Acute sprain/strain 2.40 [1.62, 3.54] 2.61 [1.77, 3.87] 2.26 [1.40, 3.67] 2.50 [1.54, 4.07] 2.24 [1.06, 4.75] 2.33 [1.09, 4.96]General occup. 2.40 [1.79, 3.21] 2.78 [2.07, 3.72] 2.53 [1.80, 3.56] 2.89 [2.05, 4.07] 1.73 [0.92, 3.26] 2.04 [1.08, 3.85]
Body part/area affected
Low back 2.45 [1.47, 4.08] 3.12 [1.87, 5.22] 2.83 [1.60, 5.01] 3.52 [1.98, 6.26] 1.69 [0.54, 5.29] 2.29 [0.73, 7.20]Shoulder/arm 3.40 [2.46, 4.68] 3.58 [2.59, 4.94] 3.65 [2.51, 5.30] 3.84 [2.64, 5.58] 2.70 [1.39, 5.25] 2.82 [1.44, 5.51]Wrist/hand 1.79 [1.20, 2.66] 1.95 [1.31, 2.91] 1.96 [1.24, 3.09] 2.09 [1.32, 3.31] 1.00 [0.37, 2.68] 1.13 [0.42, 3.05]Other 2.06 [1.48, 2.87] 2.26 [1.62, 3.15] 1.94 [1.29, 2.91] 2.10 [1.39, 3.17] 1.93 [1.03, 3.64] 2.13 [1.13, 4.03]
Notes: 1 All models adjusted for gender, race/ethnicity, shift, and nature of work based on associations with p <0.10 in crude analyses; 2 referent category in all models includes those with no OHC visit and no termination of thespecified type within the 60-day probationary period.
Results of the additional analyses with restricted datasets showed minimal change in the adjustedHRs. Specifically, HRs in the additional analyses were, on average, 6% greater than those presentedin Table 3. In no case was a HR reported in Table 3 greater than the analogous HR estimated in theanalysis of the restricted dataset.
4. Discussion
The results of this study show a strong association between visiting an on-site occupational healthcenter and subsequent termination of employment within 60 days from the date of hire among alarge sample of newly hired manufacturing workers. Specifically, the risk of termination was morethan double among those who visited the on-site occupational health center compared to those whodid not. The magnitudes and precisions of the risk estimates were also consistent across differentinjury classifications and mostly consistent across different body parts/areas affected. Associationswere also elevated regardless of the reason for termination, although of somewhat greater magnitudeamong those with terminations classified as involuntary compared to those with terminations classifiedas voluntary.
Few longitudinal studies are available to which the results of the current study can be compared.Most recently, Okechukwu et al. [18] examined the association between self-reported occupationalinjury and both involuntary and voluntary “job loss” among a sample of 1331 nursing home workers.Injury data were collected at the time of enrollment and again after six and 12 months of follow-up,and then linked to employers’ administrative records to identify those with job loss occurring in thesubsequent six months. Overall, 24.2% of the sample experienced job loss within the 18 months of
158
IJERPH 2019, 16, 433
observation, which is much lower than the frequency of employment termination observed in thecurrent study (in the current study, 31.2% of new hires were employed fewer than 60 days fromthe date of hire). Similar to the current study, statistically significant associations were observedbetween occupational injury and both voluntary and involuntary job loss, and the magnitude of theassociation was also greater for involuntary job loss. However, important differences in the studysample (nursing home workers with an average of 6.3 years of experience at the time of enrollment vs.newly hired manufacturing workers) and differences in the nature of work between the cohorts limitcomparisons between the results of our study and those reported in Okechukwu et al. [18].
The incidence rates of early OHC visits were approximately 50–60% greater than the incidencerates observed across the full study period, suggesting an increase in the risk of occupational injuryduring the earliest stages of employment. Gerr et al. [24] reported results from a prospective study ofphysical risk factors and upper extremity musculoskeletal outcomes among 386 workers at the samefacility as that of the current study. In contrast to the current study, Gerr et al. [24] ascertained incidentmusculoskeletal symptoms with a weekly self-reported survey and incident musculoskeletal disordersvia clinical evaluation (following a self-report of symptoms). Compared to the employees included inthe current study, participants of Gerr et al. [24] were experienced (average of 15.8 years at the facility atthe time of entry vs. all new hires), older (mean age 43.1 years vs. 33.9 years), and less frequently male(48.1% vs. 68.0%). Incidence rates were reported as 58/100PY for hand/arm symptoms, 19/100PYfor hand/arm disorders, 54/100PY for neck/shoulder symptoms, and 14/100PY for neck shoulderdisorders. Analogous incidences rates in the current study (by combining the nature of injury categorieswith the body part/area affected categories) were 8.5/100PY for OHC visits classified as either acutesprain/strain or repetitive strain and affecting the wrist/hand and 8.4/100PY for injuries classifiedas either acute sprain/strain or repetitive strain and affecting the neck/shoulder. The difference inincidence rates might appear to contradict the evidence suggesting that the risk of occupational injuryis greatest during the earliest stages of employment. However, the active case-finding approach usedby Gerr et al. [24] is expected to result in greater observed incidence rates than the use of passivesurveillance sources, such as the OHC database used in the current study [25]. It is possible that onlythose experiencing the greatest levels of musculoskeletal discomfort reported to the OHC. In addition,it is possible that some employees, upon experiencing musculoskeletal discomfort, elected to terminateemployment but did not report to the OHC.
Error in the ascertainment of dates of employment termination (of any type) was unlikely giventhe use of human resources data and inclusion of all newly hired employees in the study sample.While it is possible that some terminations were recorded one or more business days following theactual event, we have no way of validating the accuracy of the termination dates. Regardless, anyerror was unlikely to have differed systematically between those who visited the OHC and thosewho did not. However, the classification of each termination as involuntary or voluntary relied onour interpretation of the information included in the human resources database. We discussed ourtermination classification strategy with the employer prior to analyses. The only heterogeneity ofopinion occurred for the “3-day no-call/no-show” reason for termination (n = 216), which we classifiedas voluntary. Ultimately, we believe our choice was appropriate since the employee made an activedecision both to not report to work and to not communicate an explanation for the absence.
Errors in the ascertainment of exposure may have occurred. First, it is possible that someemployees experienced an occupational injury and did not report to the OHC (despite employerpolicy). If employment termination during the probationary period were more likely as a result ofthe unreported occupational injury, then the observed hazard ratios would have been attenuated.We believe it is likely that the dates of events classified as general occupational injuries (e.g., chemicalexposures and foreign objects in the eye) were captured accurately given their acute nature and thepolicy requiring employees to immediately report to the OHC. However, the date of an event classifiedas “acute sprain/strain” or “repetitive strain” does not necessarily reflect the date of symptom onset.Any lag between the onset of symptoms and the OHC visit date would increase the number of
159
IJERPH 2019, 16, 433
unexposed days and decrease the time to termination following the OHC visit date, and thereforeinflate the observed hazard ratios. However, we have no reason to believe that the frequency orduration of reporting lags were of sufficient magnitude to cause meaningful bias of the estimatedhazard ratios. Finally, the OHC was staffed by multiple occupational health nurses and so some(inter-observer) misclassification may have occurred of the nature of the injury/event which broughtthe employee to the center and/or the body part/area affected.
5. Conclusions
In summary, newly hired manufacturing workers who visited an on-site occupational healthcenter for reasons consistent with an occupational injury experienced increased risk employmenttermination within 60 days from the date of hire. In addition, the incidence rate of occupational healthcenter visits within 60 days from the date of hire was substantially greater than that observed overlonger time frames. Together, these results suggest that management of workplace safety and healthhazards to prevent the occurrence of occupational injury may reduce turnover rates.
Finally, the end of the study observation period (November 2016) corresponds approximately witha major shift in strategic production management practices at the study facility. Specifically, starting inearly 2017, the facility has adopted the “world-class manufacturing (WCM)” model attributed mostcommonly to Hayes and Wheelwright [26], reformulated by Schonberger [27], and further refinedand formalized by large, multi-national manufacturing enterprises such as Fiat Chrysler Automobiles.A key component of WCM is an organizational commitment to safety, such that “WCM cannot beimplemented when the company is not assuring a robust safety system” [28] (p. 600). We hope torevisit the analyses described in this manuscript after complete roll-out and maturation of the WCMsystems and procedures in order to evaluate the effect of WCM on occupational injury rates andemployee turnover.
Author Contributions: Conceptualization, N.C.H. and N.B.F.; Methodology, N.C.H., N.B.F., J.A.D. and F.G.;Formal analysis, N.C.H., N.B.F. and F.G.; Investigation, N.C.H. and N.B.F.; Resources, N.B.F.; Data curation, N.C.H.,N.B.F. and J.A.D.; Writing—original draft preparation, N.C.H. and N.B.F.; Writing—review and editing, N.C.H.,N.B.F., J.A.D. and F.G.; Visualization, N.C.H. and N.B.F.; Project administration, N.B.F.; Funding acquisition, N.B.F.
Funding: This research was supported by a grant from the National Institute for Occupational Safety and Health(NIOSH) for the Heartland Center for Occupational Health and Safety at the University of Iowa, grant numberT42OH008491. Additional support was provided by the NIOSH-funded Healthier Workforce Center of theMidwest at the University of Iowa, grant number U19OH008868.
Acknowledgments: The authors wish to thank the workers and management at the study facility for their supportof this project.
Conflicts of Interest: The authors declare no conflict of interest. The funders had no role in the design of thestudy; in the collection, analyses, or interpretation of data; in the writing of the manuscript, or in the decision topublish the results.
References
1. Meier, K.J.; Hicklin, A. Employee turnover and organizational performance: Testing a hypothesis fromclassical public administration. J. Publ. Adm. Res. Theor. 2007, 18, 573–590. [CrossRef]
2. Wynen, J.; Van Dooren, W.; Mattijs, J.; Deschamps, C. Linking turnover to organizational performance:The role of process conformance. Public Manag. Rev. 2018. [CrossRef]
3. Heavey, A.L.; Holwerda, J.A.; Hausknecht, J.P. Causes and consequences of collective turnover:A meta-analytic review. J. Appl. Psychol. 2013, 98, 412–453. [CrossRef] [PubMed]
4. Glebbeek, A.C.; Bax, E.H. Is high employee turnover really harmful? An empirical test using companyrecords. Acad. Manag. J. 2004, 47, 277–286.
5. Hausknecht, J.P.; Trevor, C.O. Collective turnover at the group, unit, and organizational levels: Evidence,issues, and implications. J. Manag. 2011, 37, 352–388. [CrossRef]
6. Park, T.-Y.; Shaw, J.D. Turnover rates and organizational performance: A meta-analysis. J. Appl. Psychol.2013, 98, 268–309. [CrossRef]
160
IJERPH 2019, 16, 433
7. Burt, C.D. New Employee Safety: Risk Factors and Management Strategies; Springer: Cham, Switzerland, 2016.8. Hom, P.W.; Lee, T.W.; Shaw, J.D.; Hausknecht, J.P. One hundred years of employee turnover theory and
research. J. Appl. Psychol. 2017, 102, 530–545. [CrossRef]9. Root, N.; Hoefer, M. The first work-injury data available from new BLS study. Mon. Lab. Rev. 1979, 102, 76–80.10. Siskind, F. Another look at the link between work injuries and job experience. Mon. Lab. Rev. 1982, 105, 38–40.11. Groves, W.; Kecojevic, V.; Komljenovic, D. Analysis of fatalities and injuries involving mining equipment.
J. Saf. Res. 2007, 38, 461–470. [CrossRef]12. Bell, J.L.; Grushecky, S.T. Evaluating the effectiveness of a logger safety training program. J. Saf. Res.
2006, 37, 53–61. [CrossRef] [PubMed]13. Breslin, F.C.; Smith, P. Trial by fire: A multivariate examination of the relation between job tenure and work
injuries. Occup. Environ. Med. 2006, 63, 27–32. [CrossRef] [PubMed]14. Hancock, J.I.; Allen, D.G.; Bosco, F.A.; McDaniel, K.R.; Pierce, C.A. Meta-analytic review of employee
turnover as a predictor of firm performance. J. Manag. 2013, 39, 573–603. [CrossRef]15. Cree, T.; Kelloway, E.K. Responses to occupational hazards: Exit and participation. J. Occup. Health Psychol.
1997, 2, 304. [CrossRef] [PubMed]16. Griffeth, R.W.; Hom, P.W.; Gaertner, S. A meta-analysis of antecedents and correlates of employee turnover:
Update, moderator tests, and research implications for the next millennium. J. Manag. 2000, 26, 463–488.[CrossRef]
17. Brewer, C.S.; Kovner, C.T.; Greene, W.; Tukov-Shuser, M.; Djukic, M. Predictors of actual turnover in anational sample of newly licensed registered nurses employed in hospitals. J. Adv. Nurs. 2012, 68, 521–538.[CrossRef] [PubMed]
18. Okechukwu, C.A.; Bacic, J.; Velasquez, E.; Hammer, L.B. Marginal structural modelling of associations ofoccupational injuries with voluntary and involuntary job loss among nursing home workers. Occup. Environ.Med. 2016, 73, 175–182. [CrossRef] [PubMed]
19. Young, A.E. Return to work following disabling occupational injury-facilitators of employment continuation.Scand. J. Work Environ. Health 2010, 473–483. [CrossRef]
20. Hinkin, T.R.; Tracey, J.B. The cost of turnover: Putting a price on the learning curve. Cornell Hotel Restaur.Adm. Q. 2000, 41, 14–21. [CrossRef]
21. Cox, D.R.; Oakes, D. Analysis of Survival Data; Chapman and Hall: London, UK, 1984.22. Kalbfleisch, J.D.; Prentice, R.L. The Statistical Analysis of Failure Time Data; John Wiley and Sons: New York,
NY, USA, 1980.23. Fisher, L.D.; Lin, D.Y. Time-dependent covariates in the Cox proportional-hazards regression model.
Annu. Rev. Public Health 1999, 20, 145–157. [CrossRef]24. Gerr, F.; Fethke, N.B.; Merlino, L.; Anton, D.; Rosecrance, J.; Jones, M.P.; Marcus, M.; Meyers, A.R. A
prospective study of musculoskeletal outcomes among manufacturing workers: I. Effects of physical riskfactors. Hum. Factors 2014, 56, 112–130. [CrossRef] [PubMed]
25. Silverstein, B.A.; Stetson, D.S.; Keyserling, W.M.; Fine, L.J. Work-related musculoskeletal disorders:Comparison of data sources for surveillance. Am. J. Ind. Med. 1997, 31, 600–608. [CrossRef]
26. Hayes, R.H.; Wheelwright, S.C. Restoring Our Competitive Edge: Competing Through Manufacturing; Wiley:New York, NY, USA, 1984; Volume 30.
27. Schonberger, R.J. World Class Manufacturing; Simon and Schuster: New York, NY, USA, 2008.28. Chiarini, A.; Vagnoni, E. World-class manufacturing by Fiat. Comparison with Toyota Production System
from a Strategic Management, Management Accounting, Operations Management and PerformanceMeasurement dimension. Int. J. Prod. Res. 2015, 53, 590–606. [CrossRef]
© 2019 by the authors. Licensee MDPI, Basel, Switzerland. This article is an open accessarticle distributed under the terms and conditions of the Creative Commons Attribution(CC BY) license (http://creativecommons.org/licenses/by/4.0/).
161
International Journal of
Environmental Research
and Public Health
Article
It Doesn’t End There: Workplace Bullying,Work-to-Family Conflict, and EmployeeWell-Being in Korea
Gyesook Yoo 1 and Soomi Lee 2,* ID
1 Department of Child and Family Studies, Kyung Hee University, Seoul 02447, Korea; [email protected] Department of Biobehavioral Health, Pennsylvania State University, State College, PA 16802, USA* Correspondence: [email protected]
Received: 7 June 2018; Accepted: 20 July 2018; Published: 22 July 2018
Abstract: Workplace bullying entails negative consequences on workers’ life. Yet, there is lackof research on workplace bullying in an Asian context. Moreover, less is known about thepotential mechanisms linking workplace bullying and employee well-being. This study examinedthe associations between workplace bullying and Korean employees’ well-being (quality of life,occupational health) and whether the associations were mediated by work-to-family conflict.Cross-sectional data came from 307 workers in South Korea who were employed in healthcare,education, and banking industries. Analyses adjusted for industry, age, gender, education,marital status, and work hours. Employees who had more exposure to workplace bullyingreported lower levels of quality of life and occupational health. These associations were mediatedby work-to-family conflict, such that more exposure to workplace bullying was associated withgreater work-to-family conflict, which, in turn, was associated with lower levels of quality of lifeand occupational health. These mediating pathways were consistent across the three industries.Korean employees who experience more workplace bullying may bring unfinished work stress tothe home (thus greater work-to-family conflict), which impairs their well-being. Future researchmay need to consider the role of work-to-family conflict when targeting to reduce the negativeconsequences of workplace bullying.
Keywords: workplace bullying; quality of life; occupational health; work-to-family conflict;Korean workplaces
1. Introduction
Workplace bullying entails negative consequences on workers’ life, by exposing workers tonegative acts of co-workers, supervisors or subordinates [1,2]. The prevalence of workplace bullying ishigh across nations [3] and it is becoming an increasingly serious issue in South Korea (Korea, hereafter)in recent years. The vast majority of Korean employees (87%) report they have experienced someform of bullying within the previous six months [4]. The rate of workplace bullying experiences iseven higher among employees who work long hours and non-regular employees who may have jobinsecurity [5]. Workplace bullying may impair employees’ mental and physical health. However,there is lack of empirical research focusing on workplace bullying in Korea and its associations withKorean employees’ well-being. Moreover, less is known about potential mediating mechanisms linkingworkplace bullying and employee well-being [6].
Work-to-family conflict is a possible mediator between workplace bullying and employeewell-being. Work-to-family conflict refers to time-based, strain-based, and behavior-based interroleconflict between mutually incompatible demands from work and family domains in some respect [7].According to the work-family interface model [7–9], negative experiences and stressors from
IJERPH 2018, 15, 1548; doi:10.3390/ijerph15071548 www.mdpi.com/journal/ijerph162
IJERPH 2018, 15, 1548
workplaces often spill over into employees’ personal and family life via work-to-family conflict [10–13].Work-to-family conflict, in turn, is associated with employees’ negative health and well-beingoutcomes [14–19].
Based on the work-family interface model, previous studies have paid much attention to thenegative work-to-family spillover effects of employees’ emotional labor, abusive supervision, and socialostracism at workplaces [10–13,20–23]. However, there has been lack of research examining thenegative work-to-family spillover effects originate from workplace bullying. To address this gap inoccupational literature, this study examines the potential mediating role of work-to-family conflictin the link between workplace bullying and employee well-being outcomes assessed by quality oflife and occupational health. Most of existing studies on workplace bullying have been based onWestern samples, lacking in consideration of different cultural values on interpersonal relationships ororganizational hierarchies and cultures in non-Western countries [6,23,24]. Findings from the Koreanemployee sample may enrich our understanding of the mechanism in which workplace bullyingimpairs employee well-being in a cultural context where employees are particularly vulnerable toexperiencing workplace bullying and work-to-family conflict.
1.1. Theoretical and Empirical Background Linking Workplace Bullying to Employee Well-Being
Workplace bullying is generally defined as situations where an employee is exposed to negativeactions on the part of co-workers, supervisors or subordinates repeatedly and over a period of time [25].It is different from workplace violence [26] or occupational stalking [27] in its nature of repetition,persistency, hostile intentionality of negative acts, and power imbalance. Some forms of workplacebullying behaviors include wrong or unjust judgement about a bullied employee’s work performance,criticizing one’s personal life, restricting expression of personal opinion, assigning meaningless tasks,and backbiting. Such negative actions are unwanted and resented by the victim employees and maycause humiliation and distress in victims and also potentially in observers [28].
Previous research has observed the negative consequences of workplace bullying on employees’health and well-being, including deterioration of psychological well-being, complaints about physicaland somatic symptoms, and poor quality of life [29–32]. Both the victims of bullying and the observersreport more general stress and mental stress than those without bullying experiences [33]. There mayalso be a long-term health consequences of workplace bullying. A 3-wave follow-up study from Danishemployees in a period of four years has shown that negative health problems caused by workplacebullying (e.g., poor self-rated health, sick-leave, depressive disorders, and sleep problems) last overseveral years even after bullying was discontinued [34].
1.2. Work-to-Family Conflict as a Mediating Mechanism
Work-family conflict refers to “a form of interrole conflict in which the role pressures from work and familydomains are mutually incompatible in some respect” ([7], p. 77), which includes time-based, strain-based,and behavior-based conflict. The work-family interface model [7–9] suggests that negative experiencesfrom work often spill over into employees’ non-work domains and interfere with family and personalactivities (i.e., work-to-family conflict) that are critical for employee well-being. The emotional andstrain-based work demands can threaten employees’ psychological resources including needs forautonomy, competence, and relatedness and hamper their involvement to meet role requirements infamily and personal domains [35–39]. Through this work-to-family conflict mechanism, employeesmay transmit their negative emotions toward and come into conflict with family members, therebytheir family roles, relationships, and family time may be negatively influenced [23,40]. Previousstudies found the effects of work-to-family conflict on employee’s psychological distress [17,19],somatic symptoms and health complaints [14–16], and occupational well-being [18].
Many studies have examined work-to-family conflict consequences associated with employees’emotional labor, non-supportive or abusive supervision, psychopathic leadership, and ostracism inworkplaces [10–13,20–23]. Scant empirical research has been done on the work-to-family conflict
163
IJERPH 2018, 15, 1548
effect on the link between workplace bullying and employee well-being outcomes such as qualityof life and occupational health. Employees who are frequently exposed to workplace bullying mayexperience considerable strain at work in trying to defend and protect themselves. This consumption ofvictims’ physical and psychological resources might negatively spill over into their family and personaldomains, which could impair well-being. One of the rare studies of this kind was recently performedby Sanz-Vergel and Rodríguez-Muñoz [41], who examined the mediating effect of work-to-familyconflict on the relationship between workplace bullying and employees’ health problems in thetelecommunications sector in Spain. They found that work-to-family conflict partially mediatedthe positive association between employee’s workplace bullying experiences and health problemsincluding somatic symptoms, anxiety, and insomnia. Thus, based on the work-family interfacemodel [7–9], we could propose that more exposure to workplace bullying is associated with lowerwell-being outcomes, mediated by higher work-to-family conflict.
1.3. Extent of Workplace Bullying in Korean Workplaces
Contextual characteristics in a certain culture and nation may influence on the people’s work andfamily life [42]. According to the well-known Hofstede’s cultural dimensions, Korea is considered tobe a society with high levels of power distance, uncertainty avoidance, collectivism, Confucianism,and restraint [43,44]. In this culture, Korean workplaces have tended to have strong hierarchy oftop-down organizational culture with the hard work ethic for long hours and let the group intereststake precedence over the individual rights of employees [42,45,46], which is more likely to be abreeding ground for workplace bullying acts and behaviors [47]. For example, abusive supervisors orcolleagues might exploit the victim’s work-oriented attitude by top-down leadership or collectivisticpeer pressure.
According to Seo’s survey in 2010, 4% of Korean employees working in healthcare, manufacturing,service, and financial industries were the victims of workplace bullying and only 13.4% reported thatthey had never experienced any forms of workplace bullying during the past six months [4]. Among anumber of Korean industries, employees working in education, banking, and healthcare industriesseem more vulnerable; about 25% of education industry workers were the victims of workplacebullying and banking industry workers reported average 34 exposure to workplace bullying permonth [5]. The most frequent negative acts experienced by the respondents were ‘being urged toresign’, ‘ideas or opinions being ignored’, and ‘being humiliated’. Especially, employees in education,banking, and healthcare sectors came under pressure to resign once a week. Employees who workedlong hours or non-regular workers reported more exposure to workplace bullying [5].
Although workplace bullying is one of the major social problems in Korea and the mediais paying attention to the recent suicide cases of employees due to severe stress from workplacebullying [48], this topic has received little scholarly attention. There has been lack of knowledgeabout the prevalence, antecedents, consequences, and mechanisms of bullying in Korean workplaces.To examine the associations between workplace bullying, work-to-family conflict, and employeewell-being, the current study used data collected from employees in education, banking, and healthcareindustries in Korea, where workplace bullying is a particular concern.
1.4. Present Study
Building on the work-family interface model [7–9], we examined the cross-sectional associationsbetween workplace bullying, work-to-family conflict, and employees’ well-being outcomes. Using datacollected from three service industries (i.e., healthcare, education, and banking) in Korea, we tested themediating role of work-to-family conflict in the associations of workplace bullying with quality of lifeand occupational health, two outcomes reflecting employees’ overall well-being. Our hypotheses areas follows, with specific paths are illustrated in Figure 1.
164
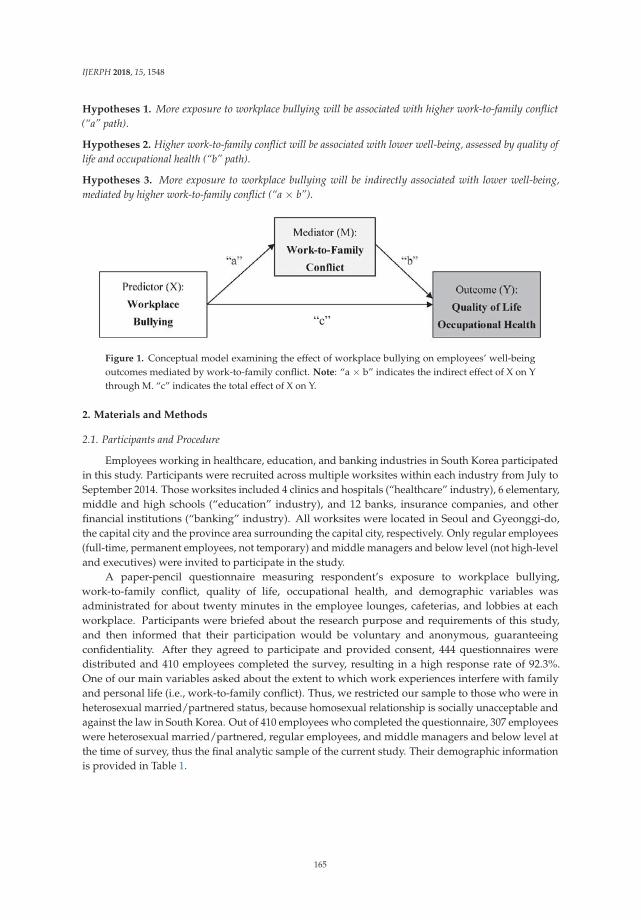
IJERPH 2018, 15, 1548
Hypotheses 1. More exposure to workplace bullying will be associated with higher work-to-family conflict(“a” path).
Hypotheses 2. Higher work-to-family conflict will be associated with lower well-being, assessed by quality oflife and occupational health (“b” path).
Hypotheses 3. More exposure to workplace bullying will be indirectly associated with lower well-being,mediated by higher work-to-family conflict (“a × b”).
Figure 1. Conceptual model examining the effect of workplace bullying on employees’ well-beingoutcomes mediated by work-to-family conflict. Note: “a × b” indicates the indirect effect of X on Ythrough M. “c” indicates the total effect of X on Y.
2. Materials and Methods
2.1. Participants and Procedure
Employees working in healthcare, education, and banking industries in South Korea participatedin this study. Participants were recruited across multiple worksites within each industry from July toSeptember 2014. Those worksites included 4 clinics and hospitals (“healthcare” industry), 6 elementary,middle and high schools (“education” industry), and 12 banks, insurance companies, and otherfinancial institutions (“banking” industry). All worksites were located in Seoul and Gyeonggi-do,the capital city and the province area surrounding the capital city, respectively. Only regular employees(full-time, permanent employees, not temporary) and middle managers and below level (not high-leveland executives) were invited to participate in the study.
A paper-pencil questionnaire measuring respondent’s exposure to workplace bullying,work-to-family conflict, quality of life, occupational health, and demographic variables wasadministrated for about twenty minutes in the employee lounges, cafeterias, and lobbies at eachworkplace. Participants were briefed about the research purpose and requirements of this study,and then informed that their participation would be voluntary and anonymous, guaranteeingconfidentiality. After they agreed to participate and provided consent, 444 questionnaires weredistributed and 410 employees completed the survey, resulting in a high response rate of 92.3%.One of our main variables asked about the extent to which work experiences interfere with familyand personal life (i.e., work-to-family conflict). Thus, we restricted our sample to those who were inheterosexual married/partnered status, because homosexual relationship is socially unacceptable andagainst the law in South Korea. Out of 410 employees who completed the questionnaire, 307 employeeswere heterosexual married/partnered, regular employees, and middle managers and below level atthe time of survey, thus the final analytic sample of the current study. Their demographic informationis provided in Table 1.
165
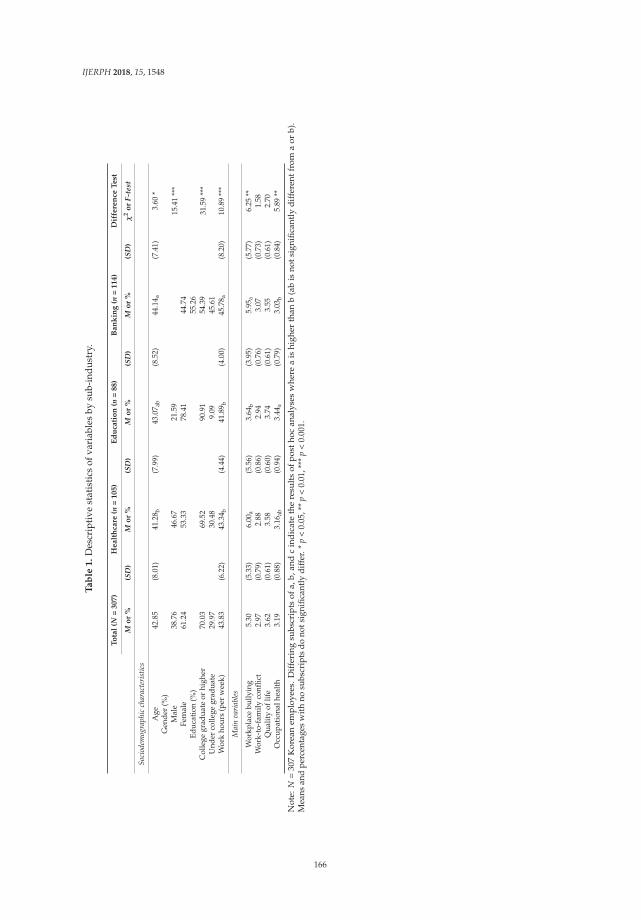
IJERPH 2018, 15, 1548
Ta
ble
1.
Des
crip
tive
stat
isti
csof
vari
able
sby
sub-
indu
stry
.
To
tal
(N=
307)
Healt
hca
re(n
=105)
Ed
uca
tio
n(n
=88)
Ban
kin
g(n
=114)
Dif
fere
nce
Test
Mo
r%
(SD
)M
or
%(S
D)
Mo
r%
(SD
)M
or
%(S
D)
χ2
or
F-te
st
Soci
odem
ogra
phic
char
acte
rist
ics
Age
42.8
5(8
.01)
41.2
8 b(7
.99)
43.0
7 ab
(8.5
2)44
.14 a
(7.4
1)3.
60*
Gen
der
(%)
15.4
1**
*M
ale
38.7
646
.67
21.5
9Fe
mal
e61
.24
53.3
378
.41
44.7
4Ed
ucat
ion
(%)
55.2
631
.59
***
Col
lege
grad
uate
orhi
gher
70.0
369
.52
90.9
154
.39
Und
erco
llege
grad
uate
29.9
730
.48
9.09
45.6
1W
ork
hour
s(p
erw
eek)
43.8
3(6
.22)
43.3
4 b(4
.44)
41.8
9 b(4
.00)
45.7
8 a(8
.20)
10.8
9**
*
Mai
nva
riab
les
Wor
kpla
cebu
llyin
g5.
30(5
.33)
6.00
a(5
.56)
3.64
b(3
.95)
5.95
a(5
.77)
6.25
**W
ork-
to-f
amily
confl
ict
2.97
(0.7
9)2.
88(0
.86)
2.94
(0.7
6)3.
07(0
.73)
1.58
Qua
lity
oflif
e3.
62(0
.61)
3.58
(0.6
0)3.
74(0
.61)
3.55
(0.6
1)2.
70O
ccup
atio
nalh
ealt
h3.
19(0
.88)
3.16
ab(0
.94)
3.44
a(0
.79)
3.03
b(0
.84)
5.89
**
Not
e:N
=30
7K
orea
nem
plo
yees
.D
iffe
ring
subs
crip
tsof
a,b,
and
cin
dic
ate
the
resu
lts
ofp
osth
ocan
alys
esw
here
ais
high
erth
anb
(ab
isno
tsig
nifi
cant
lyd
iffe
rent
from
aor
b).
Mea
nsan
dpe
rcen
tage
sw
ith
nosu
bscr
ipts
dono
tsig
nific
antl
ydi
ffer
.*p
<0.
05,*
*p
<0.
01,*
**p
<0.
001.
166
IJERPH 2018, 15, 1548
2.2. Measures
2.2.1. Workplace Bullying
Exposure to workplace bullying was measured by twenty-two items of the Negative ActsQuestionnaire (NAQ-Revised) [49]. Employees were asked to report the extent to which they had beenexposed to specific negative behaviors at their workplace within the previous six months. Sample itemsinclude “Someone withholding information which affects your performance”, “Being ordered to dowork below your level of competence”, and “Having your opinions and views ignored”. Each itemwas rated on a 5-point scale such as 0 = never, 1 = now and then, 2 = monthly, 3 = every week, and 4 = daily.Some previous studies considered a frequency of roughly weekly exposure over about 6 monthsas severe cases of workplace bullying [1]. To capture the effect of any exposure to workplacebullying in this study, we considered responses 1 or higher as having exposure to workplace bullying(=1 vs. 0 = no exposure to workplace bullying). Then we summed the binary indicators across 22 itemsto create total workplace bullying exposure variable; higher scores representing more exposure toworkplace bullying. The Cronbach’s alpha for the 22 items was 0.92.
2.2.2. Work-to-Family Conflict
Work-to-family conflict was measured with four items of the Work to Family Conflict Scale [50],in which employees were asked to report the extent to which they had experienced work conflictswith family in the past year. Each item was rated on a 5-point scale from 1 = never to 5 = all of thetime. Sample items include “Your job reduces the effort you can give to activities at home”, “Stress atwork makes you irritable at home”, and “Your job makes you feel tired to do the things that needattention at home”. The mean of the 4 items was calculated, with higher scores representing greaterwork-to-family conflict. The Cronbach’s alpha for the 4 items was 0.82.
2.2.3. Quality of Life
Employees’ perceptions of their quality of life were assessed via six items excerpted from theQuality of Life Scale-Parent Form [51]. Respondents rated their satisfaction in family life, time forwork, family and leisure, and financial well-being on a 5-point Likert scale from 1 = very dissatisfied to5 = very satisfied. Example items read, “How satisfied are you with your family life?”, “How satisfiedare you with your time?”, and “How satisfied are you with your financial well-being?” The mean ofthe 6 items was calculated, with higher scores representing higher quality of life. The Cronbach’s alphafor the 6 items was 0.81.
2.2.4. Occupational Health
To assess employees’ overall perceived health affected by their occupation, we used two itemsadapted from Zoller’s [52] interview question in terms of physical and psychological aspects. The itemsread, “How does your job affect your physical health?” and “How does your job affect your mentalhealth?” Responses were coded as 1 = very negatively, 2 = negatively, 3 = neither negatively nor positively,4 = positively, 5 = very positively. The mean of the two items was calculated, such that higher scoresreflected greater occupational health.
2.2.5. Covariates
We controlled for employees’ sociodemographic and work characteristics as covariates, includingage, gender, education level, and work hours. Age and work hours as continuous variables wereself-reported in years and hours, respectively. Gender (0 = male, 1 = female) and education level(0 = under college graduate, 1 = college graduate or higher) were dummy coded. In addition, we consideredpotential differences by industry. In our sample, the banking industry had the largest number of
167
IJERPH 2018, 15, 1548
employees (see Table 1) and thus served as the reference group (1 = healthcare, 2 = education, 3 = banking;reference group).
2.3. Analytic Strategy
We used multiple mediation analyses with bootstrapping method using the SAS PROCESSmacro [53]. This method allows for the estimation of the indirect effect, based on the product (×) ofthe effect of a predictor on a mediator and the effect of the mediator on an outcome. The indirect effectreflects “a × b” in Figure 1. The bootstrapping method also produces a bias-corrected confidenceinterval for the indirect effect [53]. In all models, we set the number of bootstrap samples to 10,000.
3. Results
Table 1 shows descriptive results of our variables and comparisons by industry. Beginning withsociodemographic characteristics, the average age of our sample was 42.85 years (SD = 8.01) andbanking industry employees were older than healthcare industry employees (no difference witheducation industry employees). Sixty-one percent were women, with a higher proportion of womenin the education industry (78%). The majority of the employees (70%) were college graduates orhad higher education; this trend was more apparent in the education industry (91%) than in thebanking industry (54%). The mean work hours was 43.83 h per week (SD = 6.22) and banking industryemployees worked significantly longer hours than those in the other two industries.
In terms of our main variables, the mean exposure to workplace bullying for an average employeewas not so high (M = 5.30 on a 0–22 range scale); yet, there was a great variability between employees(SD = 5.33). More than half of employees (54%) endorsed one particular item, “Someone withholdinginformation which affects your performance.” Employees in the healthcare and banking industriesreported significantly more exposure to workplace bullying than those in the education industry(with no difference between healthcare and banking). Our sample of employees reported a moderatelevel of work-to-family conflict (M = 2.97 on a 5 point scale) and a high level of quality of life(M = 3.62 on a 5 point scale), on average, with no differences by industry. The mean level of occupationalhealth was moderate (M = 3.19 on a 5 point scale), and it was higher for education industry employeesthan for banking industry employees.
Table 2 shows results of the mediation model examining the effect of workplace bullying onquality of life through work-to-family conflict. The first column presents the results of “a” path,the association of workplace bullying with work-to-family conflict adjusting for covariates. Employeesin the healthcare and education industries reported lower work-to-family conflict than those inthe banking industry. Women (vs. men), employees with college or higher education (vs. not),and those with longer work hours reported higher work-to-family conflict. After controlling forthese effects, there was a significant association of workplace bullying with work-to-family conflict,such that more exposure to workplace bullying was associated with higher work-to-family conflict.Moreover, higher work-to-family conflict was associated with lower quality of life (“b” path, secondcolumn). Before including work-to-family conflict, there was a significant negative association ofworkplace bullying with quality of life (“c” path; B = −0.034, SE = 0.007, p < 0.001); this association wasslightly reduced after including work-to-family conflict (“c’” path; B = −0.027, SE = 0.007, p < 0.001).The association was found after adjusting for industry, sociodemographic characteristics, and workhours (none of them were significant). On the whole, then, the model revealed a significant indirecteffect of workplace bullying on quality of life mediated by work-to-family conflict. Twenty percent ofthe total effect of workplace bullying on quality of life was explained by the indirect effect throughwork-to-family conflict.
Table 3 shows results of the mediation model examining the effect of workplace bullying onoccupational health through work-to-family conflict. Consistent with the previous model (Table 2),more exposure to workplace bullying was associated with higher work-to-family conflict (“a” path).Further, higher work-to-family conflict was associated with lower occupational health (“b” path).
168
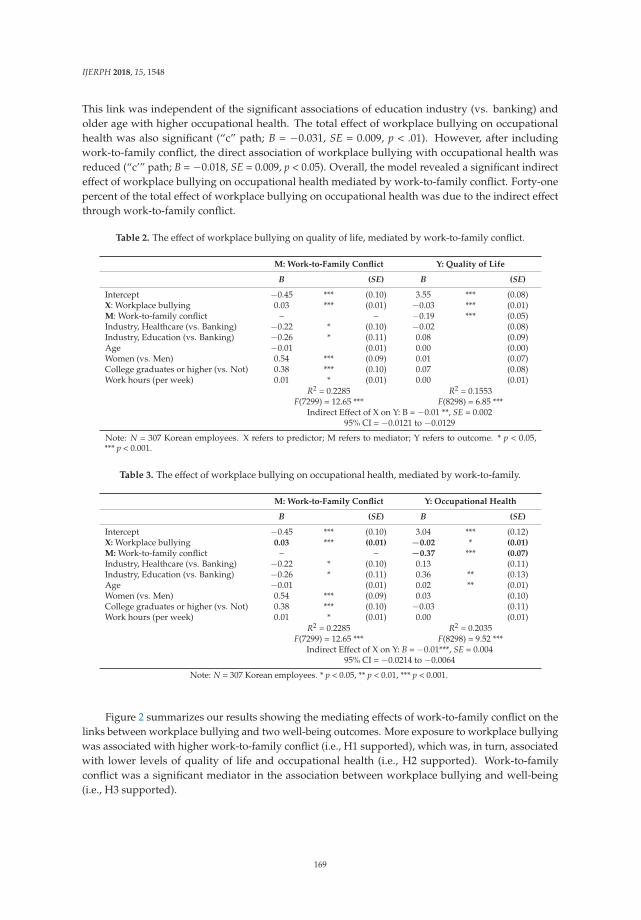
IJERPH 2018, 15, 1548
This link was independent of the significant associations of education industry (vs. banking) andolder age with higher occupational health. The total effect of workplace bullying on occupationalhealth was also significant (“c” path; B = −0.031, SE = 0.009, p < .01). However, after includingwork-to-family conflict, the direct association of workplace bullying with occupational health wasreduced (“c’” path; B = −0.018, SE = 0.009, p < 0.05). Overall, the model revealed a significant indirecteffect of workplace bullying on occupational health mediated by work-to-family conflict. Forty-onepercent of the total effect of workplace bullying on occupational health was due to the indirect effectthrough work-to-family conflict.
Table 2. The effect of workplace bullying on quality of life, mediated by work-to-family conflict.
M: Work-to-Family Conflict Y: Quality of Life
B (SE) B (SE)
Intercept −0.45 *** (0.10) 3.55 *** (0.08)X: Workplace bullying 0.03 *** (0.01) −0.03 *** (0.01)M: Work-to-family conflict – – −0.19 *** (0.05)Industry, Healthcare (vs. Banking) −0.22 * (0.10) −0.02 (0.08)Industry, Education (vs. Banking) −0.26 * (0.11) 0.08 (0.09)Age −0.01 (0.01) 0.00 (0.00)Women (vs. Men) 0.54 *** (0.09) 0.01 (0.07)College graduates or higher (vs. Not) 0.38 *** (0.10) 0.07 (0.08)Work hours (per week) 0.01 * (0.01) 0.00 (0.01)
R2 = 0.2285 R2 = 0.1553F(7299) = 12.65 *** F(8298) = 6.85 ***
Indirect Effect of X on Y: B = −0.01 **, SE = 0.00295% CI = −0.0121 to −0.0129
Note: N = 307 Korean employees. X refers to predictor; M refers to mediator; Y refers to outcome. * p < 0.05,*** p < 0.001.
Table 3. The effect of workplace bullying on occupational health, mediated by work-to-family.
M: Work-to-Family Conflict Y: Occupational Health
B (SE) B (SE)
Intercept −0.45 *** (0.10) 3.04 *** (0.12)X: Workplace bullying 0.03 *** (0.01) −0.02 * (0.01)M: Work-to-family conflict – – −0.37 *** (0.07)Industry, Healthcare (vs. Banking) −0.22 * (0.10) 0.13 (0.11)Industry, Education (vs. Banking) −0.26 * (0.11) 0.36 ** (0.13)Age −0.01 (0.01) 0.02 ** (0.01)Women (vs. Men) 0.54 *** (0.09) 0.03 (0.10)College graduates or higher (vs. Not) 0.38 *** (0.10) −0.03 (0.11)Work hours (per week) 0.01 * (0.01) 0.00 (0.01)
R2 = 0.2285 R2 = 0.2035F(7299) = 12.65 *** F(8298) = 9.52 ***
Indirect Effect of X on Y: B = −0.01***, SE = 0.00495% CI = −0.0214 to −0.0064
Note: N = 307 Korean employees. * p < 0.05, ** p < 0.01, *** p < 0.001.
Figure 2 summarizes our results showing the mediating effects of work-to-family conflict on thelinks between workplace bullying and two well-being outcomes. More exposure to workplace bullyingwas associated with higher work-to-family conflict (i.e., H1 supported), which was, in turn, associatedwith lower levels of quality of life and occupational health (i.e., H2 supported). Work-to-familyconflict was a significant mediator in the association between workplace bullying and well-being(i.e., H3 supported).
169
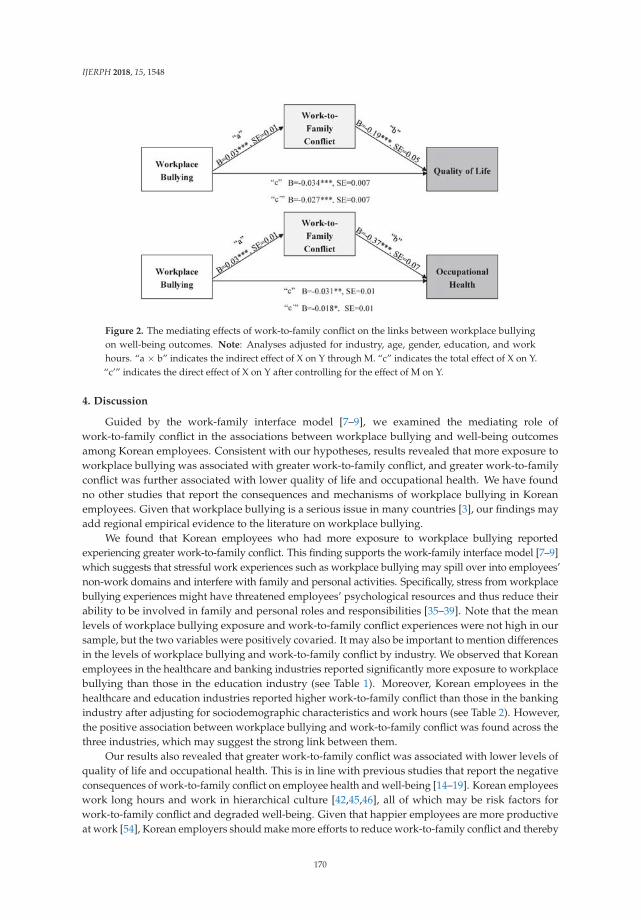
IJERPH 2018, 15, 1548
Figure 2. The mediating effects of work-to-family conflict on the links between workplace bullyingon well-being outcomes. Note: Analyses adjusted for industry, age, gender, education, and workhours. “a × b” indicates the indirect effect of X on Y through M. “c” indicates the total effect of X on Y.“c’” indicates the direct effect of X on Y after controlling for the effect of M on Y.
4. Discussion
Guided by the work-family interface model [7–9], we examined the mediating role ofwork-to-family conflict in the associations between workplace bullying and well-being outcomesamong Korean employees. Consistent with our hypotheses, results revealed that more exposure toworkplace bullying was associated with greater work-to-family conflict, and greater work-to-familyconflict was further associated with lower quality of life and occupational health. We have foundno other studies that report the consequences and mechanisms of workplace bullying in Koreanemployees. Given that workplace bullying is a serious issue in many countries [3], our findings mayadd regional empirical evidence to the literature on workplace bullying.
We found that Korean employees who had more exposure to workplace bullying reportedexperiencing greater work-to-family conflict. This finding supports the work-family interface model [7–9]which suggests that stressful work experiences such as workplace bullying may spill over into employees’non-work domains and interfere with family and personal activities. Specifically, stress from workplacebullying experiences might have threatened employees’ psychological resources and thus reduce theirability to be involved in family and personal roles and responsibilities [35–39]. Note that the meanlevels of workplace bullying exposure and work-to-family conflict experiences were not high in oursample, but the two variables were positively covaried. It may also be important to mention differencesin the levels of workplace bullying and work-to-family conflict by industry. We observed that Koreanemployees in the healthcare and banking industries reported significantly more exposure to workplacebullying than those in the education industry (see Table 1). Moreover, Korean employees in thehealthcare and education industries reported higher work-to-family conflict than those in the bankingindustry after adjusting for sociodemographic characteristics and work hours (see Table 2). However,the positive association between workplace bullying and work-to-family conflict was found across thethree industries, which may suggest the strong link between them.
Our results also revealed that greater work-to-family conflict was associated with lower levels ofquality of life and occupational health. This is in line with previous studies that report the negativeconsequences of work-to-family conflict on employee health and well-being [14–19]. Korean employeeswork long hours and work in hierarchical culture [42,45,46], all of which may be risk factors forwork-to-family conflict and degraded well-being. Given that happier employees are more productiveat work [54], Korean employers should make more efforts to reduce work-to-family conflict and thereby
170
IJERPH 2018, 15, 1548
improve their employees’ well-being. For example, a workplace intervention designed to increasesupervisor support may reduce work-to-family conflict [55], and by doing so, improve employeehealth and well-being [14,56].
Combining these results, this study observed that workplace bullying was associated withemployee well-being (i.e., quality of life, occupational health), and this association was partiallymediated by work-to-family conflict. Before adding work-to-family conflict in our analytic models,workplace bullying was significantly associated with quality of life and occupational health. However,these associations became weaker after including work-to-family conflict. Although not fully mediated,considerable proportions in the total effects of workplace bullying on quality of life (24%) andoccupational health (41%) were explained by work-to-family conflict. This study contributes tounderstanding the mechanisms in which workplace bullying is linked to Korean employees’ well-being.Future research may need to consider other potential mechanisms linking workplace bullying andemployee well-being, as we found that work-to-family conflict did not fully mediate the association.
4.1. Practical Implications
Korea currently has no legal definition and laws on workplace bullying. This study urges that it’sabout time to develop rules to reduce workplace bullying incidences in Korea as well as to protectKorean workers from its negative consequences. Most of European countries and parts of Canada andAustralia have established laws and regulations against workplace bullying [57,58]. Their practices andsuccess stories may guide Korean government’s legislation. In addition, work and life balance ratherthan achieving goals and career success is a continuously important topic among Korean employeesbecause many Korean workplaces are highly competitive and demand individual sacrifice for the largerorganization. The mediating effects of work-to-family conflict on the negative associations betweenworkplace bullying and employee well-being found in this study suggest that each workplace needsto implement work-life balance policies and establish ethical standards and infrastructure [59] for theprevention and handling of workplace bullying. Workplace bullying may also involve substantial costsfor the community due to degraded health as well as for the employers in terms of lost productivity.In order to legislate against workplace bullying in Korea, a business case needs to be made. Findingsfrom this study may also provide broader implications for other countries who have similar issues ofwork and family life with Korea and want to improve their own workplace practices.
4.2. Limitations and Future Directions
Several of this study’s limitations provide useful directions for future research. First, we usedself-reports of workplace bullying, work-to-family conflict, quality of life, and occupational healththat may pose a risk for common-method bias [60]. For example, an employee who experienced moreworkplace bullying might have responded negatively to the items of quality of life and occupationalhealth. Future research may benefit from incorporating objective measures of well-being, such asclinical health measures or biomarkers of stress. Second, our sample was purposely selected frommultiple worksites in three industries (healthcare, education, and banking) in South Korea, and thus itis not representative of Korean employees. In the future, it is necessary to include workplace bullyingitems in a national survey so that we can draw national-level inference about the negative influence ofworkplace bullying. It may also be that our measure of workplace bullying may not fully capture thereal phenomenon of workplace bullying. According to Seo [5], only about 38% of victim employeesin Korea report the incidents of bullying, because of their perception that some extent of bullying isunavoidable in Korean workplace culture. As such, we may underestimate the extent of workplacebullying. Future research may need to improve the validity of workplace bullying measure by culturaland occupational contexts. More specific measurements about workplace bullying are also needed.For example, there may be differences between men and women in the experience of workplacebullying consequences of it [61]. Moreover, more regional analyses are needed to see whether findingsfrom our study are replicated in other settings. Finally, our cross-sectional analyses cannot determine
171
IJERPH 2018, 15, 1548
the direction of effect. Although our analytic models imply that workplace bullying is a predictor,work-to-family conflict is a mediator, and quality of life and occupational health are outcomes, there isno temporal order between the variables and causality can operate in other directions. Future researchshould include multiple time points to identify the direction of effect.
5. Conclusions
Findings from this study highlight that workplace bullying is an important work-derived stressorassociated with Korean employees’ work-to-family conflict and well-being outcomes. All of ourresearch hypotheses were supported: More exposure to workplace bullying was associated with lowerlevels of quality of life and occupational health among Korean employees; specifically, the negativeassociations were mediated by greater work-to-family conflict. At the most basic level, both workplacebullying and work-to-family conflict are societal concerns, and thus future research should continueto focus on this topic by examining multiple pathways linking workplace bullying to well-beingoutcomes in diverse employee samples across countries. A more harmonious workplace may improvethe employees’ well-being, which may ultimately enhance productivity and health at the larger society.
Author Contributions: Conceptualization, G.Y. & S.L.; Data Collection, G.Y.; Methodology and Formal Analysis,S.L.; Writing–Original Draft Preparation, Review & Editing, G.Y. & S.L.
Funding: This research received no external funding.
Conflicts of Interest: The authors declared no potential conflicts of interest with respect to the research, authorship,and/or publication of this article.
References
1. Einarsen, S.; Hoel, H.; Zapf, D.; Cooper, C.L. The concept of bullying and harassment at work: The Europeantradition. In Bullying and Harassment in the Workplace: Developments in Theory, Research, and Practice;Einarsen, S., Ed.; Taylor and Francis: Boca Raton, FL, USA, 2011; pp. 3–40.
2. Leymann, H. The content and development of mobbing at work. Eur. J. Work Organ. Psychol. 1996, 5, 165–184.[CrossRef]
3. Samnani, A.K.; Singh, P. 20 Years of workplace bullying research: A review of the antecedents andconsequences of bullying in the workplace. Aggress. Violent Behav. 2012, 17, 581–589. [CrossRef]
4. Seo, Y. Workplace bullying in Korea. KRIVET Issue Br. 2013, 20, 1–4.5. Seo, Y. The state of workplace bullying by job sector in Korea. KRIVET Issue Br. 2015, 77, 1–4.6. Rai, A.; Agarwal, U. Workplace bullying: A review and future research directions. South Asian J. Manag.
2016, 23, 27–56.7. Greenhaus, J.H.; Beutell, N.J. Sources of conflict between work and family roles. Acad. Manag. Rev. 1985, 10,
76–88. [CrossRef]8. Grzywacz, J.G.; Marks, N.F. Reconceptualizing the work-family interface: An ecological perspective on the
correlates of positive and negative spillover between work and family. J. Occup. Health Psychol. 2000, 5,111–126. [CrossRef] [PubMed]
9. Greenhaus, J.H.; Parasuraman, S. A work-nonwork interactive perspective of stress and its consequences.J. Organ. Behav. Manag. 1987, 8, 37–60. [CrossRef]
10. Hoobler, J.M.; Brass, D.J. Abusive supervision and family undermining as displaced aggression.J. Appl. Psychol. 2006, 91, 1125–1133. [CrossRef] [PubMed]
11. Carlson, D.; Ferguson, M.; Hunter, E.; Whitten, D. Abusive supervision and work-family conflict: The paththrough emotional labor and burnout. Leadersh. Q. 2012, 23, 849–859. [CrossRef]
12. Carlson, D.; Ferguson, M.; Perrewe, P.L.; Whitten, D. The fallout from abusive supervision: An examiniationof subordinates and their partners. Pers. Psychol. 2011, 64, 937–961. [CrossRef]
13. Tepper, B.J. Consequences of abusive supervision. Acad. Manag. J. 2000, 43, 178–190.14. Buxton, O.M.; Lee, S.; Beverly, C.; Berkman, L.F.; Moen, P.; Kelly, E.L.; Hammer, L.B.; Almeida, D.M.
Work-family conflict and employee sleep: Evidence from IT workers in the Work, Family and Health Study.Sleep 2016, 39, 1871–1882. [CrossRef] [PubMed]
172
IJERPH 2018, 15, 1548
15. Geurts, S.; Rutte, C.; Peeters, M. Antecedents and consequences of work–home interference among medicalresidents. Soc. Sci. Med. 1999, 48, 1135–1148. [CrossRef]
16. Kinnunen, U.; Geurts, S.; Mauno, S. Work-to-family conflict and its relationship with satisfaction andwell-being: A one-year longitudinal study on gender differences. Work Stress 2004, 18, 1–22. [CrossRef]
17. De Lange, A.H.; Taris, T.W.; Kompier, M.A.J.; Houtman, I.L.D.; Bongers, P.M. “The very best of themillennium”: Longitudinal research and the demand-control-(support) model. J. Occup. Health Psychol. 2003,8, 282–305. [CrossRef] [PubMed]
18. Lee, S.; Davis, K.D.; Neuendorf, C.; Grandey, A.; Lam, C.B.; Almeida, D.M. Individual- and organization-levelwork-to-family spillover are uniquely associated with hotel managers’ work exhaustion and satisfaction.Front. Psychol. 2016, 7. [CrossRef] [PubMed]
19. Simon, M.; Kümmerling, A.; Hasselhorn, H.M. Work-home conflict in the European nursing profession.Int. J. Occup. Environ. Health 2004, 10, 384–391. [CrossRef] [PubMed]
20. Thomas, L.T.; Ganster, D.C. Impact of family-supportive work variables on work-family conflict and strain:A control perspective. J. Appl. Psychol. 1995, 80, 6–15. [CrossRef]
21. Wagner, D.T.; Barnes, C.M.; Scott, B.A. Driving it home: How workplace emotional labor harms employeehome life. Pers. Psychol. 2014, 67, 487–516. [CrossRef]
22. Frye, N.K.; Breaugh, J.A. Family-friendly policies, supervisor support, work-family conflict, family-workconflict, and satisfaction: A test of a conceptual model. J. Bus. Psychol. 2004, 19, 197–220. [CrossRef]
23. Liu, J.; Kwan, H.K.; Lee, C.; Hui, C. Work-to-family spillover effects of workplace ostracism: The role ofwork-home segmentation preferences. Hum. Resour. Manag. 2013, 52, 75–93. [CrossRef]
24. Zhu, Y.; Li, D. Negative spillover impact of perceptions of organizational politics on work-family conflict inChina. Soc. Behav. Pers. 2015, 43, 705–714. [CrossRef]
25. Einarsen, S. Harassment and bullying at work: A review of the Scandinavian approach. Aggress. Violent Behav.2000, 5, 379–401. [CrossRef]
26. Acquadro Maran, D.; Varetto, A.; Zedda, M.; Magnavita, N. Workplace violence toward hospital staff andvolunteers: A survey of an Italian sample. J. Aggress. Maltreat. Trauma 2018, 27, 76–95. [CrossRef]
27. Acquadro Maran, D.; Varetto, A.; Zedda, M.; Franscini, M. Health care professionals as victims of stalking:Characteristics of the stalking campaign, consequences, and motivation in Italy. J. Interpers. Violence 2017, 32,2605–2625. [CrossRef] [PubMed]
28. Hauge, L.J.; Skogstad, A.; Einarsen, S. Relationships between stressful work environments and bullying:Results of a large representative study. Work Stress 2007, 21, 220–242. [CrossRef]
29. Arenas, A.; Giorgi, G.; Montani, F.; Mancuso, S.; Perez, J.F.; Mucci, N.; Arcangeli, G. Workplace bullyingin a sample of italian and spanish employees and its relationship with job satisfaction, and psychologicalwell-being. Front. Psychol. 2015, 6, 1–10. [CrossRef] [PubMed]
30. Casimir, G.; McCormack, D.; Djurkovic, N.; Nsubuga-Kyobe, A. Psychosomatic model of workplace bullying:Australian and Ugandan schoolteachers. Empl. Relat. 2012, 34, 411–428. [CrossRef]
31. Dehue, F.; Bolman, C.; Völlink, T.; Pouwelse, M. Coping with bullying at work and health related problems.Int. J. Stress Manag. 2012, 19, 175–197. [CrossRef]
32. Shahtahmasebi, S. Quality of life: A case report of bullying in the workplace. Sci. World J. 2004, 4, 118–123.[CrossRef] [PubMed]
33. Vartia, M.A.L. Consequences of workplace bullying with respect to the well-being of its targets and theobservers of bullying. Scand. J. Work Environ. Health 2001, 27, 63–69. [CrossRef] [PubMed]
34. Bonde, J.P.; Gullander, M.; Hansen, Å.M.; Grynderup, M.; Persson, R.; Hogh, A.; Willert, M.V.; Kaerlev, L.;Rugulies, R.; Kolstad, H.A. Health correlates of workplace bullying: A 3-wave prospective follow-up study.Scand. J. Work Environ. Health 2016, 42, 17–25. [CrossRef] [PubMed]
35. Edwards, J.R.; Rothbard, N.P. Mechanisms linking work and family: Clarifying the relationship betweenwork and family constructs. Acad. Manag. Rev. 2000, 25, 178–199. [CrossRef]
36. Frone, M.R.; Russell, M.; Cooper, M.L. Antecedents and outcomes of work-family conflict: Testing a modelof the work-family interface. J. Appl. Psychol. 1992, 77, 65–78. [CrossRef] [PubMed]
37. Voydanoff, P. Toward a conceptualization of perceived work-family fit and balance: A demands and resourcesapproach. J. Marriage Fam. 2005, 67, 822–836. [CrossRef]
38. Voydanoff, P. The effects of work demands and resources on work-to-family conflict and facilitation.J. Marriage Fam. 2004, 66, 398–412. [CrossRef]
173
IJERPH 2018, 15, 1548
39. Trépanier, S.G.; Fernet, C.; Austin, S. Workplace bullying and psychological health at work: The mediating roleof satisfaction of needs for autonomy, competence and relatedness. Work Stress 2013, 27, 123–140. [CrossRef]
40. Jones, F.; Fletcher, B.C. An empirical study of occupational stress transmission in working couples. Hum. Relat.1993, 46, 881–903. [CrossRef]
41. Sanz-Vergel, A.I.; Rodríguez-Muñoz, A. The effect of workplace bullying on health: The mediating role ofwork-family conflict. Rev. Psicol. Trab. Organ. 2011, 27, 93–102. [CrossRef]
42. Yoo, G. The effects of Confucian work views and gender role attitudes on job & family involvements anddemands for family-friendly policies. J. Fam. Relat. 2010, 14, 91–108.
43. Kim, E.A. Hofstede’s cultural dimensions: Comparison of South Korea and the United States. In Proceedingsof the 2015 Cambridge Business & Economics Conference, Cambridge, UK, 1–2 July 2015.
44. Hofstede, G.; Bond, M.H. The Confucius connection: From cultural roots to economic growth. Organ. Dyn.1988, 16, 5–21. [CrossRef]
45. Lee, S.; Duvander, A.-Z.; Zarit, S.H. How can family policies reconcile fertility and women’s employment?Comparisons between South Korea and Sweden. Asian J. Women’s Stud. 2016, 22. [CrossRef] [PubMed]
46. Lee, E. The influence of Confucian work value on the job involvement, job satisfaction, and organizationalcommitment. Korean J. Ind. Organ. Psychol. 2001, 14, 1–25.
47. Seo, Y.N.; Leather, P.; Coyne, I. South Korean culture and history: The implications for workplace bullying.Aggress. Violent Behav. 2012, 17, 419–422. [CrossRef]
48. Kim, H. Nurses Not Adequately Covered by the Psychological Counseling Service. Available online:http://news.donga.com/3/all/20180221/88765753/1 (accessed on 21 February 2018).
49. Einarsen, S.; Hoel, H. Measuring Bullying and Harassment in the Workplace. Development and Validity of theRevised Negative Acts Questionnaire: A Manual; University of Bergen: Bergen, Norway, 2006.
50. Grzywacz, J.G.; Bass, B.L. Work, family, and mental health: Testing different models of work-family fit.J. Marriage Fam. 2003, 65, 248–261. [CrossRef]
51. Olson, D.H.; Barnes, H.L. Quality of life. In Family Social Science; Olson, D.H., McCubbin, H.I., Barnes, H.L.,Larsen, A.S., Muxen, M., Wilson, M., Eds.; University of Minnesota: St. Paul, MN, USA, 1985.
52. Zoller, H.M. Health on the line: Identity and disciplinary control in employee occupational health and safetydiscourse. J. Appl. Commun. Res. 2003, 31, 118–139. [CrossRef]
53. Hayes, A.F. Introduction to Mediation, Moderation, and Conditional Process Analysis: A Regression-Based Approach;Guilford Publications: New York, NY, USA, 2013.
54. Zelenski, J.M.; Murphy, S.A.; Jenkins, D.A. The happy-productive worker thesis revisited. J. Happiness Stud.2008, 9, 521–537. [CrossRef]
55. Kelly, E.L.; Moen, P.; Oakes, J.M.; Fan, W.; Okechukwu, C.; Davis, K.D.; Hammer, L.B.; Kossek, E.E.; King, R.B.;Hanson, G.C.; et al. Changing work and work-family conflict: Evidence from the Work, Family, and HealthNetwork. Am. Sociol. Rev. 2014, 79, 485–516. [CrossRef] [PubMed]
56. Almeida, D.M.; Lee, S.; Walter, K.N.; Lawson, K.M.; Kelly, E.L.; Buxton, O.M. The effects of a workplaceintervention on employees’ cortisol awakening response. Community Work Fam. 2018, 21, 151–167. [CrossRef]
57. Sanders, D.E.; Pattison, P.; Bible, J.D. Legislating “NICE”: Analysis and assessment of proposed workplacebullying prohibitions. South Law J. 2012, 22, 1–36.
58. Squelch, J.; Guthrie, R. The Australian legal framework for workplace bullying. Comp. Labor Law Policy J.2010, 32, 15–54.
59. Einarsen, K.; Mykletun, R.J.; Einarsen, S.V.; Skogstad, A.; Salin, D. Ethical infrastructure and successfulhandling of workplace bullying. Nord. J. Work Life Stud. 2017, 7. [CrossRef]
60. Podsakoff, P.M.; MacKenzie, S.B.; Lee, J.-Y.; Podsakoff, N.P. Common method variance in behavioral research:A critical review of the literature and recommended remedies. J. Appl. Psychol. 2003, 88, 879–903. [CrossRef][PubMed]
61. Hoel, H.; Cooper, C.L.; Faragher, B. The experience of bullying in Great Britain: The impact of organizationalstatus. Eur. J. Work Organ. Psychol. 2001, 10, 443–465. [CrossRef]
© 2018 by the authors. Licensee MDPI, Basel, Switzerland. This article is an open accessarticle distributed under the terms and conditions of the Creative Commons Attribution(CC BY) license (http://creativecommons.org/licenses/by/4.0/).
174
International Journal of
Environmental Research
and Public Health
Article
Identifying Barriers and Supports to Breastfeeding inthe Workplace Experienced by Mothers in theNew Hampshire Special Supplemental NutritionProgram for Women, Infants, and Children Utilizingthe Total Worker Health Framework
Eric A. Lauer 1,*, Karla Armenti 1 , Margaret Henning 2 and Lissa Sirois 3
1 Institute on Disability, New Hampshire Occupational Health Surveillance Program, University of NewHampshire, College of Health and Human Services, Durham, NH 03824, USA; [email protected]
2 Department of Public Health, Keene State College, Keene, NH 03435, USA; [email protected] State Director, Special Supplemental Nutrition Program for Women, Infants, and Children, New Hampshire
Department of Health and Human Services, Concord, NH 03301, USA; [email protected]* Correspondence: [email protected]
Received: 10 January 2019; Accepted: 11 February 2019; Published: 13 February 2019
Abstract: Variations in the barriers and contributors to breastfeeding across industries have notbeen well characterized for vulnerable populations such as mothers participating in the SpecialSupplemental Nutrition Program for Women, Infants, and Children (WIC). Our study used the TotalWorker Health Framework to characterize workplace factors acting as barriers and/or contributors tobreastfeeding among women participating in the New Hampshire WIC. Surveys were collected fromWIC mothers (n = 682), which asked about employment, industry, and workplace accommodation andsupports related to breastfeeding in the workplace. We found workplace policy factors supportingbreastfeeding (i.e., having paid maternity leave, other maternity leave, and a breastfeeding policy)varied by industry. Women in specific service-oriented industries (i.e., accommodation and retail)reported the lowest rates of breastfeeding initiation and workplace supports for breastfeeding andpumping. Further, how a woman hoped to feed and having a private pumping space at workwere significantly associated with industry, breastfeeding initiation, and breastfeeding duration.A substantial portion of women reported being not sure about their workplace environment,policies, and culture related to breastfeeding. Additional studies with larger sample sizes of womenparticipating in WIC are needed to further characterize the barriers to breastfeeding associated withspecific industries.
Keywords: total worker health; breastfeeding; industry; workplace accommodations; work environment;work culture; work policy; health promotion; occupational health surveillance
1. Introduction
Over the last two decades, the global public health community established that working outsidethe home was negatively associated with breastfeeding [1–4]. The World Health Organization hasrecently recognized the need for increased supports to improve breastfeeding duration and initiationrates, recommending women breastfeed for two years [5]. However, research in the United States(U.S.) found only 49% of women breastfeed for 6 months and breastfeeding initiation was impacted byworking or planning to work postpartum [1,3,6,7]. Studies have found that breastfeeding incidenceand duration were lower among employed, working-age women [1,3,8–10].
Moreover, women planning to work full-time postpartum were less likely to initiate breastfeedingthan women who planned to work part-time and women were more likely to cease breastfeeding
IJERPH 2019, 16, 529; doi:10.3390/ijerph16040529 www.mdpi.com/journal/ijerph175
IJERPH 2019, 16, 529
the first month prior or subsequent to returning to work [1,4]. Employment was also associated withbreastfeeding less than two to three months postpartum [2]. Women who return to full-time employmentsix to twelve weeks postpartum were more than 50% less likely to meet their breastfeeding intentions,and women who return to full-time employment less than 6 weeks postpartum were more than twice aslikely to not meet their breastfeeding intentions, compared to women who do not work [11].
Having identified this disparity, recent research has recognized the need to explore factors thatinfluence breastfeeding cessation when returning to work [12]. Mothers themselves report multiplebarriers to breastfeeding once returning to work, such as a lack of flexibility in the work schedule toallow for milk expression; lack of accommodations to express and/or store human milk; and concernsabout support from supervisors and colleagues [13,14]. A woman’s breastfeeding duration is alsoinfluenced by the existence and quality of maternity leave including its length, paid or unpaid status,and the attitudes, policies, and practices at her place of employment [15]. Among working women orwomen returning to work, research has found breastfeeding initiation and duration were lower forlow-income women and women with less than a high school education [4,11]. However, this literaturedoes not characterize specific, practical worksite factors that influence breastfeeding disparities amongvulnerable populations.
1.1. Special Supplemental Nutrition Program for Women, Infants, and Children
Breastfeeding disparities experienced by low-income women due to individual, social,and environmental barriers are well documented [5,16]. Breastfeeding prevalence among low-incomewomen, specifically women enrolled in the Special Supplemental Nutrition Program for Women,Infants, and Children (WIC), continues to be below national targets established in Healthy People2020 [17]. Nationally, WIC mothers have lower rates of breastfeeding than non-participants, despiteWIC’s efforts to encourage breastfeeding through the Loving Support Makes Breastfeeding Workcampaign and the WIC Peer Counseling Program [18–20]. Among WIC participants, barriers tobreastfeeding include embarrassment toward breastfeeding in public, early return to work or school,infant behavior, lactation complications, lack of self-efficacy, low income, limited social support, lesseducation, and unsupportive childcare [21–24].
The type of employment generally obtained by WIC eligible mothers further contributes tothe disparities found in the U.S. WIC eligible mothers are more likely to have low-income jobs inchildcare, home healthcare, or in one of the service industries [25]. These jobs are less likely to haveflexible schedules or have paid-for breaks to express breast milk, both of which contribute to themothers decision-making about continuing to breastfeed or early weaning [16]. These industries alsousually lack workplace lactation policies and supports, which influence a woman’s choice to continuebreastfeeding upon returning to work [12].
The studies among WIC mothers identify a vulnerable population at risk of experiencingdisparities in breastfeeding, which vary by employment type. However, employment supports andpolicies for breastfeeding are geographically and industry-dependent. For example, in New Hampshire(NH), according to the 2016 NH WIC Pediatric Nutrition Surveillance data, 76.8% of WIC mothersinitiate breastfeeding after delivery, compared to 87.4% of all mothers in New Hampshire [26,27].Further, previous studies have found that NH WIC mothers are less likely to have ever breastfed thanother mothers in the U.S. or NH, and WIC mothers’ breastfeeding duration was significantly relatedto employment status [21,28]. Additional state-specific research is needed to better understand andcharacterize breastfeeding disparities across employment types among WIC mothers.
1.2. The Total Worker Health Program and Benefits of Breastfeeding
The Total Worker Health (TWH) Program, created by the National Institute for OccupationalSafety and Health (NIOSH) in 2012, supports protective and preventive efforts to improve the healthand well-being of workers [29]. The TWH framework for worker well-being provides agreed-upondefinitions and measures of worker well-being based on comprehensive, multidisciplinary literature
176
IJERPH 2019, 16, 529
reviews and expert panels consisting of occupational safety and health researchers [30]. The frameworkprovides an opportunity to explore and characterize worksite factors that could improve breastfeedingbehavior and supports for WIC mothers.
Breastfeeding-friendly worksites have been associated with benefits for both mothers andemployers that include reduced employee absenteeism, increased employee retention, increasedemployee morale and loyalty, healthcare cost savings, and positive public relations and companyimage [31,32]. Although having space alone is not associated with increased duration of breastfeeding,women need the knowledge, support, encouragement, and environment to be successful in reachingtheir goals [33]. For every 1000 babies not breastfed, there are an extra 2033 physician visits, 212 daysof hospitalization, and 609 prescriptions written [34].
1.3. Study Considerations
To the best of our knowledge there have been no studies exploring breastfeeding behavioracross industries among WIC mothers. Using the TWH framework to characterize workplace factorsfor breastfeeding, this study examined the barriers and contributors to breastfeeding experienced bymothers in the NH WIC Program and focused on identifying workplace polices, supports, and practicesthat encourage or discourage breastfeeding after returning to work.
2. Methods
2.1. Study Design and Site Selection
This study used a cross-sectional design to survey women utilizing the WIC services in NH.In order to represent the entire state, all four local agencies providing WIC services in NH withcatchment areas covering all ten counties in the state were utilized in the study.
2.2. Survey Development
As a first step towards designing this survey, a state-wide collaboration of multiple NH agencies,local coalitions, programs, and universities partnered to inform a questionnaire of breastfeeding in theworkplace among NH WIC program participants. The team consisted of faculty and staff from theInstitute on Disability, New Hampshire Occupational Health Surveillance Program in the University ofNew Hampshire’s College of Health and Human Services, Keene State College Department of PublicHealth and Department of Health Science, New Hampshire Department of Health and Human Services’Division of Public Health Services, the Director of the New Hampshire WIC Nutrition Program,and a subcommittee of the New Hampshire Breastfeeding Taskforce. Based on a literature review ofbreastfeeding in the workplace and using focus groups, online feedback, and expert commentariesand reviews, a nine-page survey was iteratively developed to identify and measure person- andenvironment-level barriers and supports to breastfeeding initiation and continuation in the workplace.
Informed by prior breastfeeding studies of women using NH WIC services, survey questionswere categorized into worker well-being domains operationalized by the NIOSH TWH Program [29].The domains included in this study were (1) workplace physical environment and safety climate,(2) workplace policies and culture, (3) health status, and (4) work evaluation and experience [30].The survey items used in this study identified concepts in the workplace related to the supports,knowledge/training, policies, physical space, and culture that encourage or discourage breastfeedingafter returning to work.
Question content (i.e., concepts, topics, and phrasing) was based broadly on the existingliterature and the state-wide partnership formed for this study. Survey questions were also includedfrom (1) the Monadnock Region’s Community Coalition for the Promotion of Breastfeeding Surveyimplemented in the Keene and Manchester NH WIC Programs, and (2) lactation support questionsfrom the Centers for Disease Control and Prevention’s Worksite Health ScoreCard [21,35]. Wherepossible, questions offered multiple choice responses similar to the‘Monadnock Region’s Promotion of
177
IJERPH 2019, 16, 529
Breastfeeding Survey, where the respondent could check more than one response [21]. This research,combined with the NH Breastfeeding Taskforce’s experience and feedback, found breastfeeding to bea sensitive topic and recommended an anonymous survey with multiple choice responses to allowmothers to answer more honestly and in a fast, efficient manner.
When answering work questions, survey participants were instructed to reply for their currentjob, and if they were currently on maternity leave or recently left their job, they were asked to respondfor their most recent job. Further, some survey items also included a step-wise, conditional designwhere participants were only asked to answer some secondary questions that were dependent onresponses to the previous question in the survey. Topics with conditional questions included maternityleave, breastfeeding policies, break times for pumping at work, reactions to breastfeeding at work,and supports for breastfeeding longer at work.
The paper survey was pilot-tested for feasibility in the spring of 2016 using a random 1% of eachthe four local WIC agencies caseload. The results of the pilot informed the survey design and ensuredthe viability of a multi-agency study design. Once the survey was finalized, the University of NewHampshire Institutional Review Board granted approval for data collection. The study was conductedin accordance with the Declaration of Helsinki and the protocol was approved by the University ofNew Hampshire Research Integrity Services Institutional Review Board as IRB#6491.
2.3. Survey Eligibility and Administration.
Study eligibility criteria required women be enrolled in the WIC program and the birth mother oftheir child or that their child was enrolled in the WIC Program. Each local WIC office’s breastfeedingcoordinator directed survey implementation at their respective agency. WIC participants were recruitedby referrals from WIC staff, and flyers in the WIC offices. Surveys were offered to all womenparticipating in the NH WIC program that visited local agency offices during August, September,and October of 2016. Surveys were administered in English and staff were available for respondentquestions while completing the survey. Immediately prior to administration, respondents receivedinstructions as to the purpose, audience, risks, benefits, and completion of the survey. Surveys werecompleted immediately onsite and took approximately 15 minutes to finish.
2.4. Sample Size
A total of 682 mothers responded to the survey. This degree of survey participation representsapproximately 5.0% of the total WIC caseload in NH at the time of the study.
2.5. Data Collection
Paper surveys were completed during an office visit to WIC agencies while participants wereat a WIC appointment receiving benefits or waiting to be called for their appointment. As the studyproceeded, agency staff collected and periodically sent surveys to the research team. A student enteredeach respondent’s data into an online version of the survey designed in Qualtrics Software to create anexcel data file.
2.6. Variables
2.6.1. Demographics
Age was coded as 15 to 17, 18 to 34, and 35 and over. Race/ethnicity was coded as non-HispanicWhite, and Other.
2.6.2. Breastfeeding
“Breastfeeding initiation” was based on three questions including: (1) declared breastfeedingstatus (currently breastfeeding, previously breastfed, planning to breastfeed, or never breastfed);(2) “One week after you gave birth, how were you feeding your baby?”, with responses of breast
178
IJERPH 2019, 16, 529
milk only, formula only, both breast milk and formula; and (3) “How old was your baby when youstopped breastfeeding completely?”, with responses of one through thirteen months or baby has notstopped breastfeeding. Ever having breastfed was defined as reporting currently breastfed, previouslybreastfed, feeding breast milk one week after birth (only or in combination with formula), havingstopped breastfeeding, or having a baby that has not stopped breastfeeding. Never having breastfedwas defined as reporting planning to breastfeed, never having breastfed, not feeding with breast milkthe first week after birth, not having stopped breastfeeding, and not having a baby that continuesto breastfeed.
“Duration of breastfeeding” was based on the declared breastfeeding status and the question:“How old was your baby when you stopped breastfeeding completely?” (see “Breastfeeding initiation”for all response categories). Breastfeeding for less than 4 months was defined conditionally on havingreported previously breastfeeding and having stopped breastfeeding after one, two, or three months.Breastfeeding for greater than or equal to 4 months was defined conditionally on having reportedpreviously breastfeeding and having stopped breastfeeding after four or months.
“Reason for stopping breastfeeding” was based on the question: “What were your reasons forstopping breastfeeding?” Responses were categorized as physiological (difficulty nursing or latching;not enough milk, milk dried up; too painful, too hard, nipples too sore; I got sick, my baby got sick,had to stop for medical reasons), other commitments (too much time, I went back to school, I wentback to work), and met goal (I met my goal). More than one reason could be reported.
2.6.3. Employment and Industry
“Employment status” was based on the question: “What is your employment status?” Responseswere categorized as full-time, part-time, and other. Other included individuals not in the labor force,unemployed, in school, disabled, seasonal workers, and/or stay at home mothers.
“Industry” was coded according to 2012 Census Industry Classification Codes. Industry responseswere combined into broader categories to increase the number of responses in those categories foranalysis purposes. “Accommodation, food, and hospitality” included responses from women workingin restaurant, travel and hotel jobs. “Healthcare” included women working in healthcare or in ahospital setting as well as working in home healthcare, as a licensed nursing assistant, or in anassisted living or nursing home environment. “Retail” included women working in grocery, clothing,convenience, and department stores. “Other” included all other industries with sample sizes toosmall to consider separately. This included but was not limited to education, social assistance services,manufacturing, and other services. Study participants were asked to respond to the industry questiononly if they were currently employed or planning to return to work.
2.6.4. During Pregnancy
“Hoping to feed” was based on the question: “While you were pregnant, how had you hoped tofeed your baby?”, with responses of breastfeeding only, formula only, or a combination of breastfeedingand formula. “Received information” was based on the question: “Did you receive information aboutbreastfeeding during pregnancy?”, with responses of yes or no.
2.6.5. Total Worker Health Well-Being Domains
Policies and Culture
“Paid maternity leave” was based on the question: “Does your workplace offer paid maternityleave and is it separate from any other leave such as sick and or vacation leave?”, with responses ofyes, no, and “not sure.” Conditional on having reported no to having paid maternity leave, “othermaternity leave” was based on the question: “can employees take paid maternity leave using otherleave such as sick time or vacation time?”, with responses of yes, no, and ”not sure.” “Breastfeedingpolicy” was based on the question: “Does your workplace have a written policy on breastfeeding
179
IJERPH 2019, 16, 529
or pumping?”, with responses of yes, no, and ”not sure.” “Seen policy” was conditional on havingreported yes to having a breastfeeding policy at work and based on the question: “Have you seenor do you have a copy of the written policy on breastfeeding at your workplace?”, with responses ofyes, no, and ”not sure.” “Pumping break times” was based on the question: “Does your workplaceprovide break times to allow mothers to pump breastmilk?”, with responses of yes, no, and ”not sure.”Conditional on having reported yes to having break times for pumping, “flexible breaks” was basedon the question: “Is the break time flexible (e.g., you can take it when you need to)?”, with responsesof yes, no, and ”not sure.”
Physical environment and Safety Climate
“Private pumping space” was based on the question: “Does your workplace have a privatespace (NOT bathroom, or closet) for you to use a breast pump?”, with responses of yes, no, and ”notsure.” “Onsite items” was based on the question: “Does your workplace offer the following itemson-site for employees to use when expressing breastmilk?”, with responses categorized as utilities(electrical outlet and/or nearby sink) and physical (chair and/or space with locked door). More thanone item could be reported. “Supportive coworkers” was based on the question: “Are your co-workerssupportive of mothers who need to use a breast pump during work?”, with responses of yes, no,and ”not sure.” “Supportive supervisor” was based on the question: “Is your supervisor supportive ofmothers who need to use a breast pump during work?”, with responses of yes, no, and ”not sure.”
Health Behavior
“Pumped at work” was based on the question: “Have you had to use a breast pump at work?”,with responses of yes, no, and ”not sure.”
Work Evaluation and Experience
“Reaction to pumping” was conditional on having reported yes to having pumped at work andbased on the question: “What type of reaction, if any, have you received from those you work with?”,with responses categorized as negative (negative reactions only or some positive and some negativereactions) and positive (no reactions given or positive reactions only). “Pumped longer if easier” wasbased on the question: “Would you have continued breastfeeding longer if it was easier to pump atwork?”, with responses of yes, no, and ”not sure.” Conditional on having reported yes to breastfeedinglonger if it was easier at work, “factors” asked people to report what factors would have made it easier,with responses categorized as policy (a copy of the company policy, supportive coworkers, supportivesupervisor, or flexible time/hours), and environment (a place to store breastmilk or a private space forpumping). More than one factor could be reported.
2.7. Statistical Analysis
All analyses were conducted using SAS Version 9.4 (SAS Institute Inc., Cary, NC, USA). Univariateand bivariate methods were used to estimate counts and percentages. Bivariate associations incontingency tables were tested either using Fisher’s exact tests or Fisher’s exact tests with Freemanand Halton’s adaptations for non-standard RowxColumn tables [36]. Monte Carlo estimation with10,000,000 samples was used to calculate Fisher–Freeman–Halton statistics for tables within industry.Statistical significance was determined based on an alpha of 0.05 with Bonferroni corrections dependenton the number of questions in a given worker well-being domain or survey topic. Estimateswere considered marginally significant if they met the alpha criteria of 0.05 but were no longersignificant after Bonferroni correction. Analyses and categorization of questions about demographics,employment status, and during pregnancy included not reported as a category to account fornonresponse. For Total Worker Health well-being questions, directed towards people who wereemployed, on maternity leave, or recently employed, nonresponse was not included.
180
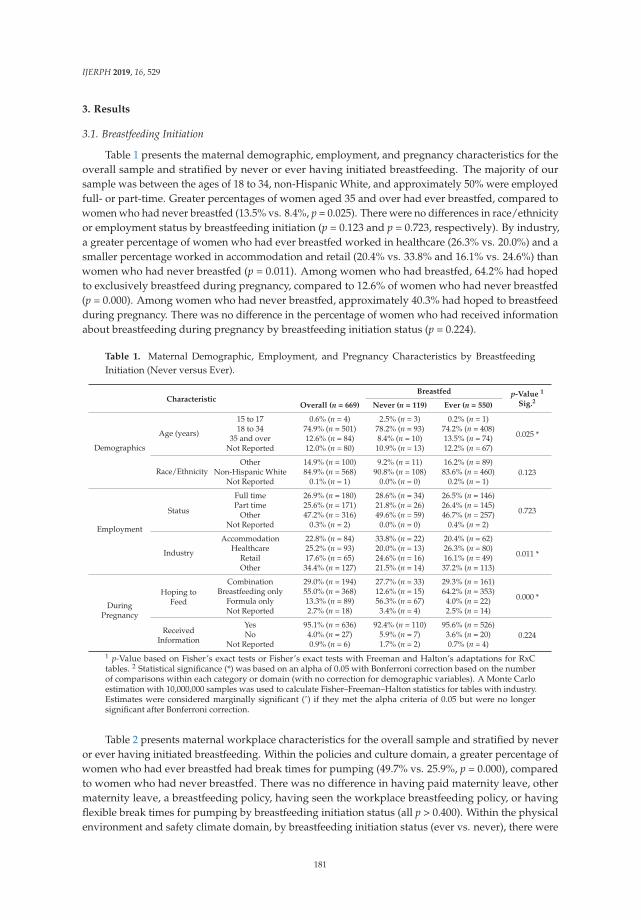
IJERPH 2019, 16, 529
3. Results
3.1. Breastfeeding Initiation
Table 1 presents the maternal demographic, employment, and pregnancy characteristics for theoverall sample and stratified by never or ever having initiated breastfeeding. The majority of oursample was between the ages of 18 to 34, non-Hispanic White, and approximately 50% were employedfull- or part-time. Greater percentages of women aged 35 and over had ever breastfed, compared towomen who had never breastfed (13.5% vs. 8.4%, p = 0.025). There were no differences in race/ethnicityor employment status by breastfeeding initiation (p = 0.123 and p = 0.723, respectively). By industry,a greater percentage of women who had ever breastfed worked in healthcare (26.3% vs. 20.0%) and asmaller percentage worked in accommodation and retail (20.4% vs. 33.8% and 16.1% vs. 24.6%) thanwomen who had never breastfed (p = 0.011). Among women who had breastfed, 64.2% had hopedto exclusively breastfeed during pregnancy, compared to 12.6% of women who had never breastfed(p = 0.000). Among women who had never breastfed, approximately 40.3% had hoped to breastfeedduring pregnancy. There was no difference in the percentage of women who had received informationabout breastfeeding during pregnancy by breastfeeding initiation status (p = 0.224).
Table 1. Maternal Demographic, Employment, and Pregnancy Characteristics by BreastfeedingInitiation (Never versus Ever).
CharacteristicBreastfed p-Value 1
Sig.2Overall (n = 669) Never (n = 119) Ever (n = 550)
Demographics
Age (years)
15 to 17 0.6% (n = 4) 2.5% (n = 3) 0.2% (n = 1)
0.025 *18 to 34 74.9% (n = 501) 78.2% (n = 93) 74.2% (n = 408)
35 and over 12.6% (n = 84) 8.4% (n = 10) 13.5% (n = 74)Not Reported 12.0% (n = 80) 10.9% (n = 13) 12.2% (n = 67)
Race/EthnicityOther 14.9% (n = 100) 9.2% (n = 11) 16.2% (n = 89)
0.123Non-Hispanic White 84.9% (n = 568) 90.8% (n = 108) 83.6% (n = 460)Not Reported 0.1% (n = 1) 0.0% (n = 0) 0.2% (n = 1)
Employment
Status
Full time 26.9% (n = 180) 28.6% (n = 34) 26.5% (n = 146)
0.723Part time 25.6% (n = 171) 21.8% (n = 26) 26.4% (n = 145)
Other 47.2% (n = 316) 49.6% (n = 59) 46.7% (n = 257)Not Reported 0.3% (n = 2) 0.0% (n = 0) 0.4% (n = 2)
Industry
Accommodation 22.8% (n = 84) 33.8% (n = 22) 20.4% (n = 62)
0.011 *Healthcare 25.2% (n = 93) 20.0% (n = 13) 26.3% (n = 80)
Retail 17.6% (n = 65) 24.6% (n = 16) 16.1% (n = 49)Other 34.4% (n = 127) 21.5% (n = 14) 37.2% (n = 113)
DuringPregnancy
Hoping toFeed
Combination 29.0% (n = 194) 27.7% (n = 33) 29.3% (n = 161)
0.000 *Breastfeeding only 55.0% (n = 368) 12.6% (n = 15) 64.2% (n = 353)
Formula only 13.3% (n = 89) 56.3% (n = 67) 4.0% (n = 22)Not Reported 2.7% (n = 18) 3.4% (n = 4) 2.5% (n = 14)
ReceivedInformation
Yes 95.1% (n = 636) 92.4% (n = 110) 95.6% (n = 526)0.224No 4.0% (n = 27) 5.9% (n = 7) 3.6% (n = 20)
Not Reported 0.9% (n = 6) 1.7% (n = 2) 0.7% (n = 4)1 p-Value based on Fisher’s exact tests or Fisher’s exact tests with Freeman and Halton’s adaptations for RxCtables. 2 Statistical significance (*) was based on an alpha of 0.05 with Bonferroni correction based on the numberof comparisons within each category or domain (with no correction for demographic variables). A Monte Carloestimation with 10,000,000 samples was used to calculate Fisher–Freeman–Halton statistics for tables with industry.Estimates were considered marginally significant (ˆ) if they met the alpha criteria of 0.05 but were no longersignificant after Bonferroni correction.
Table 2 presents maternal workplace characteristics for the overall sample and stratified by neveror ever having initiated breastfeeding. Within the policies and culture domain, a greater percentage ofwomen who had ever breastfed had break times for pumping (49.7% vs. 25.9%, p = 0.000), comparedto women who had never breastfed. There was no difference in having paid maternity leave, othermaternity leave, a breastfeeding policy, having seen the workplace breastfeeding policy, or havingflexible break times for pumping by breastfeeding initiation status (all p > 0.400). Within the physicalenvironment and safety climate domain, by breastfeeding initiation status (ever vs. never), there were
181
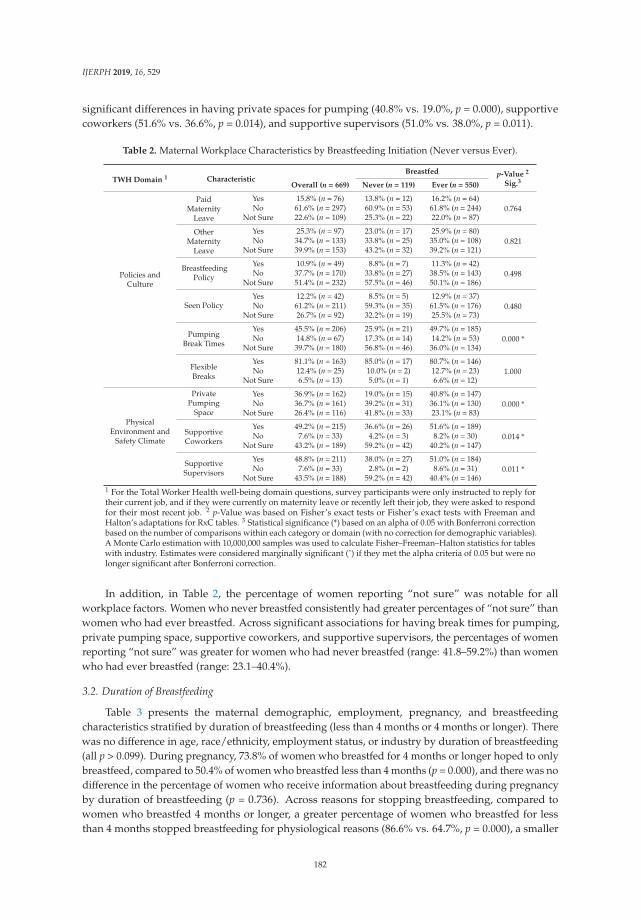
IJERPH 2019, 16, 529
significant differences in having private spaces for pumping (40.8% vs. 19.0%, p = 0.000), supportivecoworkers (51.6% vs. 36.6%, p = 0.014), and supportive supervisors (51.0% vs. 38.0%, p = 0.011).
Table 2. Maternal Workplace Characteristics by Breastfeeding Initiation (Never versus Ever).
TWH Domain 1 CharacteristicBreastfed p-Value 2
Sig.3Overall (n = 669) Never (n = 119) Ever (n = 550)
Policies andCulture
PaidMaternity
Leave
Yes 15.8% (n = 76) 13.8% (n = 12) 16.2% (n = 64)0.764No 61.6% (n = 297) 60.9% (n = 53) 61.8% (n = 244)
Not Sure 22.6% (n = 109) 25.3% (n = 22) 22.0% (n = 87)
OtherMaternity
Leave
Yes 25.3% (n = 97) 23.0% (n = 17) 25.9% (n = 80)0.821No 34.7% (n = 133) 33.8% (n = 25) 35.0% (n = 108)
Not Sure 39.9% (n = 153) 43.2% (n = 32) 39.2% (n = 121)
BreastfeedingPolicy
Yes 10.9% (n = 49) 8.8% (n = 7) 11.3% (n = 42)0.498No 37.7% (n = 170) 33.8% (n = 27) 38.5% (n = 143)
Not Sure 51.4% (n = 232) 57.5% (n = 46) 50.1% (n = 186)
Seen PolicyYes 12.2% (n = 42) 8.5% (n = 5) 12.9% (n = 37)
0.480No 61.2% (n = 211) 59.3% (n = 35) 61.5% (n = 176)Not Sure 26.7% (n = 92) 32.2% (n = 19) 25.5% (n = 73)
PumpingBreak Times
Yes 45.5% (n = 206) 25.9% (n = 21) 49.7% (n = 185)0.000 *No 14.8% (n = 67) 17.3% (n = 14) 14.2% (n = 53)
Not Sure 39.7% (n = 180) 56.8% (n = 46) 36.0% (n = 134)
FlexibleBreaks
Yes 81.1% (n = 163) 85.0% (n = 17) 80.7% (n = 146)1.000No 12.4% (n = 25) 10.0% (n = 2) 12.7% (n = 23)
Not Sure 6.5% (n = 13) 5.0% (n = 1) 6.6% (n = 12)
PhysicalEnvironment and
Safety Climate
PrivatePumping
Space
Yes 36.9% (n = 162) 19.0% (n = 15) 40.8% (n = 147)0.000 *No 36.7% (n = 161) 39.2% (n = 31) 36.1% (n = 130)
Not Sure 26.4% (n = 116) 41.8% (n = 33) 23.1% (n = 83)
SupportiveCoworkers
Yes 49.2% (n = 215) 36.6% (n = 26) 51.6% (n = 189)0.014 *No 7.6% (n = 33) 4.2% (n = 3) 8.2% (n = 30)
Not Sure 43.2% (n = 189) 59.2% (n = 42) 40.2% (n = 147)
SupportiveSupervisors
Yes 48.8% (n = 211) 38.0% (n = 27) 51.0% (n = 184)0.011 *No 7.6% (n = 33) 2.8% (n = 2) 8.6% (n = 31)
Not Sure 43.5% (n = 188) 59.2% (n = 42) 40.4% (n = 146)1 For the Total Worker Health well-being domain questions, survey participants were only instructed to reply fortheir current job, and if they were currently on maternity leave or recently left their job, they were asked to respondfor their most recent job. 2 p-Value was based on Fisher’s exact tests or Fisher’s exact tests with Freeman andHalton’s adaptations for RxC tables. 3 Statistical significance (*) based on an alpha of 0.05 with Bonferroni correctionbased on the number of comparisons within each category or domain (with no correction for demographic variables).A Monte Carlo estimation with 10,000,000 samples was used to calculate Fisher–Freeman–Halton statistics for tableswith industry. Estimates were considered marginally significant (ˆ) if they met the alpha criteria of 0.05 but were nolonger significant after Bonferroni correction.
In addition, in Table 2, the percentage of women reporting “not sure” was notable for allworkplace factors. Women who never breastfed consistently had greater percentages of “not sure” thanwomen who had ever breastfed. Across significant associations for having break times for pumping,private pumping space, supportive coworkers, and supportive supervisors, the percentages of womenreporting “not sure” was greater for women who had never breastfed (range: 41.8–59.2%) than womenwho had ever breastfed (range: 23.1–40.4%).
3.2. Duration of Breastfeeding
Table 3 presents the maternal demographic, employment, pregnancy, and breastfeedingcharacteristics stratified by duration of breastfeeding (less than 4 months or 4 months or longer). Therewas no difference in age, race/ethnicity, employment status, or industry by duration of breastfeeding(all p > 0.099). During pregnancy, 73.8% of women who breastfed for 4 months or longer hoped to onlybreastfeed, compared to 50.4% of women who breastfed less than 4 months (p = 0.000), and there was nodifference in the percentage of women who receive information about breastfeeding during pregnancyby duration of breastfeeding (p = 0.736). Across reasons for stopping breastfeeding, compared towomen who breastfed 4 months or longer, a greater percentage of women who breastfed for lessthan 4 months stopped breastfeeding for physiological reasons (86.6% vs. 64.7%, p = 0.000), a smaller
182
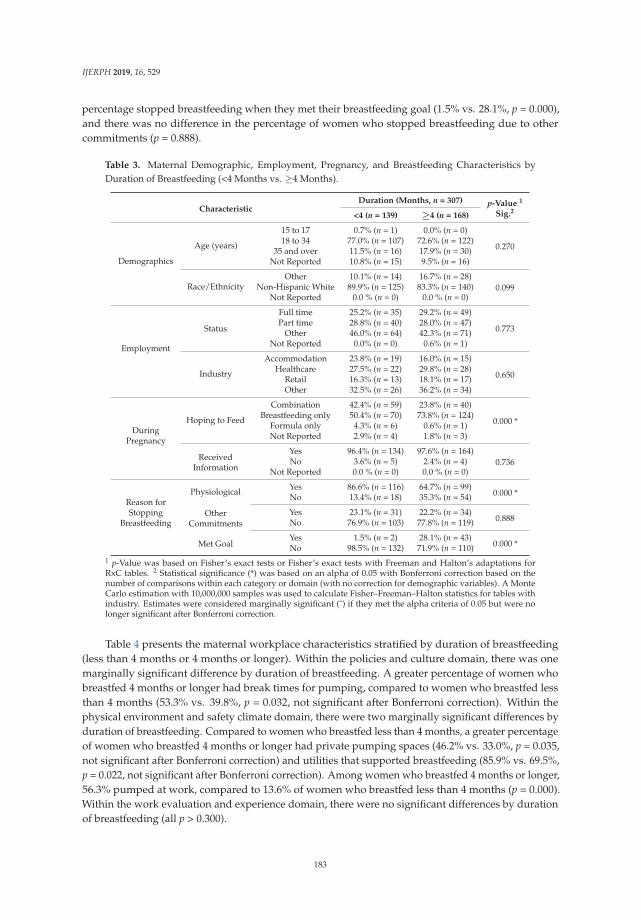
IJERPH 2019, 16, 529
percentage stopped breastfeeding when they met their breastfeeding goal (1.5% vs. 28.1%, p = 0.000),and there was no difference in the percentage of women who stopped breastfeeding due to othercommitments (p = 0.888).
Table 3. Maternal Demographic, Employment, Pregnancy, and Breastfeeding Characteristics byDuration of Breastfeeding (<4 Months vs. ≥4 Months).
CharacteristicDuration (Months, n = 307) p-Value 1
Sig.2<4 (n = 139) ≥4 (n = 168)
Demographics
Age (years)
15 to 17 0.7% (n = 1) 0.0% (n = 0)
0.27018 to 34 77.0% (n = 107) 72.6% (n = 122)
35 and over 11.5% (n = 16) 17.9% (n = 30)Not Reported 10.8% (n = 15) 9.5% (n = 16)
Race/EthnicityOther 10.1% (n = 14) 16.7% (n = 28)
0.099Non-Hispanic White 89.9% (n = 125) 83.3% (n = 140)Not Reported 0.0 % (n = 0) 0.0 % (n = 0)
Employment
Status
Full time 25.2% (n = 35) 29.2% (n = 49)
0.773Part time 28.8% (n = 40) 28.0% (n = 47)
Other 46.0% (n = 64) 42.3% (n = 71)Not Reported 0.0% (n = 0) 0.6% (n = 1)
Industry
Accommodation 23.8% (n = 19) 16.0% (n = 15)
0.650Healthcare 27.5% (n = 22) 29.8% (n = 28)
Retail 16.3% (n = 13) 18.1% (n = 17)Other 32.5% (n = 26) 36.2% (n = 34)
DuringPregnancy
Hoping to Feed
Combination 42.4% (n = 59) 23.8% (n = 40)
0.000 *Breastfeeding only 50.4% (n = 70) 73.8% (n = 124)
Formula only 4.3% (n = 6) 0.6% (n = 1)Not Reported 2.9% (n = 4) 1.8% (n = 3)
ReceivedInformation
Yes 96.4% (n = 134) 97.6% (n = 164)0.736No 3.6% (n = 5) 2.4% (n = 4)
Not Reported 0.0 % (n = 0) 0.0 % (n = 0)
Reason forStopping
Breastfeeding
Physiological Yes 86.6% (n = 116) 64.7% (n = 99)0.000 *No 13.4% (n = 18) 35.3% (n = 54)
OtherCommitments
Yes 23.1% (n = 31) 22.2% (n = 34)0.888No 76.9% (n = 103) 77.8% (n = 119)
Met GoalYes 1.5% (n = 2) 28.1% (n = 43)
0.000 *No 98.5% (n = 132) 71.9% (n = 110)1 p-Value was based on Fisher’s exact tests or Fisher’s exact tests with Freeman and Halton’s adaptations forRxC tables. 2 Statistical significance (*) was based on an alpha of 0.05 with Bonferroni correction based on thenumber of comparisons within each category or domain (with no correction for demographic variables). A MonteCarlo estimation with 10,000,000 samples was used to calculate Fisher–Freeman–Halton statistics for tables withindustry. Estimates were considered marginally significant (ˆ) if they met the alpha criteria of 0.05 but were nolonger significant after Bonferroni correction.
Table 4 presents the maternal workplace characteristics stratified by duration of breastfeeding(less than 4 months or 4 months or longer). Within the policies and culture domain, there was onemarginally significant difference by duration of breastfeeding. A greater percentage of women whobreastfed 4 months or longer had break times for pumping, compared to women who breastfed lessthan 4 months (53.3% vs. 39.8%, p = 0.032, not significant after Bonferroni correction). Within thephysical environment and safety climate domain, there were two marginally significant differences byduration of breastfeeding. Compared to women who breastfed less than 4 months, a greater percentageof women who breastfed 4 months or longer had private pumping spaces (46.2% vs. 33.0%, p = 0.035,not significant after Bonferroni correction) and utilities that supported breastfeeding (85.9% vs. 69.5%,p = 0.022, not significant after Bonferroni correction). Among women who breastfed 4 months or longer,56.3% pumped at work, compared to 13.6% of women who breastfed less than 4 months (p = 0.000).Within the work evaluation and experience domain, there were no significant differences by durationof breastfeeding (all p > 0.300).
183
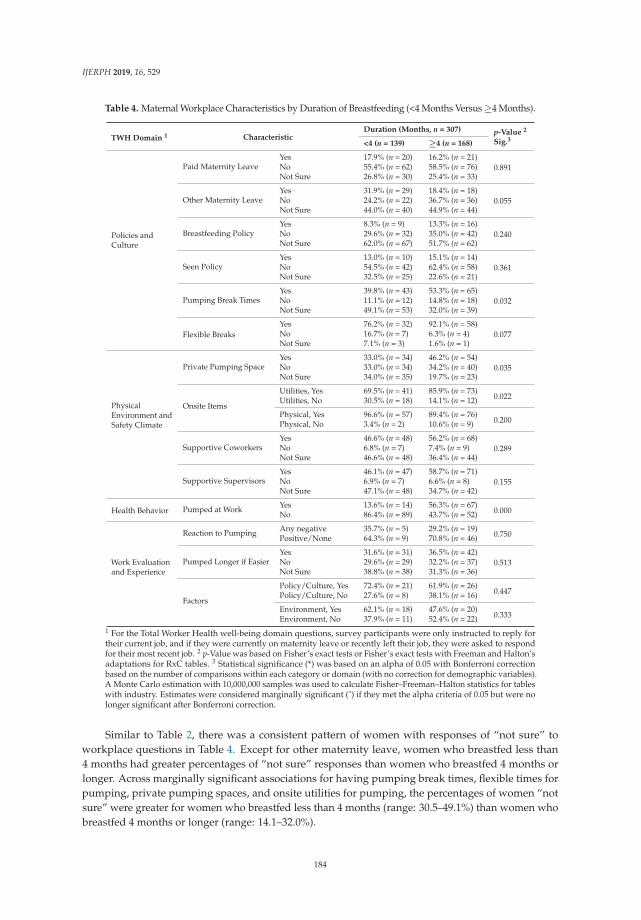
IJERPH 2019, 16, 529
Table 4. Maternal Workplace Characteristics by Duration of Breastfeeding (<4 Months Versus ≥4 Months).
TWH Domain 1 CharacteristicDuration (Months, n = 307) p-Value 2
Sig.3<4 (n = 139) ≥4 (n = 168)
Policies andCulture
Paid Maternity LeaveYes 17.9% (n = 20) 16.2% (n = 21)
0.891No 55.4% (n = 62) 58.5% (n = 76)Not Sure 26.8% (n = 30) 25.4% (n = 33)
Other Maternity LeaveYes 31.9% (n = 29) 18.4% (n = 18)
0.055No 24.2% (n = 22) 36.7% (n = 36)Not Sure 44.0% (n = 40) 44.9% (n = 44)
Breastfeeding PolicyYes 8.3% (n = 9) 13.3% (n = 16)
0.240No 29.6% (n = 32) 35.0% (n = 42)Not Sure 62.0% (n = 67) 51.7% (n = 62)
Seen PolicyYes 13.0% (n = 10) 15.1% (n = 14)
0.361No 54.5% (n = 42) 62.4% (n = 58)Not Sure 32.5% (n = 25) 22.6% (n = 21)
Pumping Break TimesYes 39.8% (n = 43) 53.3% (n = 65)
0.032No 11.1% (n = 12) 14.8% (n = 18)Not Sure 49.1% (n = 53) 32.0% (n = 39)
Flexible BreaksYes 76.2% (n = 32) 92.1% (n = 58)
0.077No 16.7% (n = 7) 6.3% (n = 4)Not Sure 7.1% (n = 3) 1.6% (n = 1)
PhysicalEnvironment andSafety Climate
Private Pumping SpaceYes 33.0% (n = 34) 46.2% (n = 54)
0.035No 33.0% (n = 34) 34.2% (n = 40)Not Sure 34.0% (n = 35) 19.7% (n = 23)
Onsite Items
Utilities, Yes 69.5% (n = 41) 85.9% (n = 73)0.022Utilities, No 30.5% (n = 18) 14.1% (n = 12)
Physical, Yes 96.6% (n = 57) 89.4% (n = 76)0.200Physical, No 3.4% (n = 2) 10.6% (n = 9)
Supportive CoworkersYes 46.6% (n = 48) 56.2% (n = 68)
0.289No 6.8% (n = 7) 7.4% (n = 9)Not Sure 46.6% (n = 48) 36.4% (n = 44)
Supportive SupervisorsYes 46.1% (n = 47) 58.7% (n = 71)
0.155No 6.9% (n = 7) 6.6% (n = 8)Not Sure 47.1% (n = 48) 34.7% (n = 42)
Health Behavior Pumped at Work Yes 13.6% (n = 14) 56.3% (n = 67)0.000No 86.4% (n = 89) 43.7% (n = 52)
Work Evaluationand Experience
Reaction to Pumping Any negative 35.7% (n = 5) 29.2% (n = 19)0.750Positive/None 64.3% (n = 9) 70.8% (n = 46)
Pumped Longer if EasierYes 31.6% (n = 31) 36.5% (n = 42)
0.513No 29.6% (n = 29) 32.2% (n = 37)Not Sure 38.8% (n = 38) 31.3% (n = 36)
Factors
Policy/Culture, Yes 72.4% (n = 21) 61.9% (n = 26)0.447Policy/Culture, No 27.6% (n = 8) 38.1% (n = 16)
Environment, Yes 62.1% (n = 18) 47.6% (n = 20)0.333Environment, No 37.9% (n = 11) 52.4% (n = 22)
1 For the Total Worker Health well-being domain questions, survey participants were only instructed to reply fortheir current job, and if they were currently on maternity leave or recently left their job, they were asked to respondfor their most recent job. 2 p-Value was based on Fisher’s exact tests or Fisher’s exact tests with Freeman and Halton’sadaptations for RxC tables. 3 Statistical significance (*) was based on an alpha of 0.05 with Bonferroni correctionbased on the number of comparisons within each category or domain (with no correction for demographic variables).A Monte Carlo estimation with 10,000,000 samples was used to calculate Fisher–Freeman–Halton statistics for tableswith industry. Estimates were considered marginally significant (ˆ) if they met the alpha criteria of 0.05 but were nolonger significant after Bonferroni correction.
Similar to Table 2, there was a consistent pattern of women with responses of “not sure” toworkplace questions in Table 4. Except for other maternity leave, women who breastfed less than4 months had greater percentages of “not sure” responses than women who breastfed 4 months orlonger. Across marginally significant associations for having pumping break times, flexible times forpumping, private pumping spaces, and onsite utilities for pumping, the percentages of women “notsure” were greater for women who breastfed less than 4 months (range: 30.5–49.1%) than women whobreastfed 4 months or longer (range: 14.1–32.0%).
184
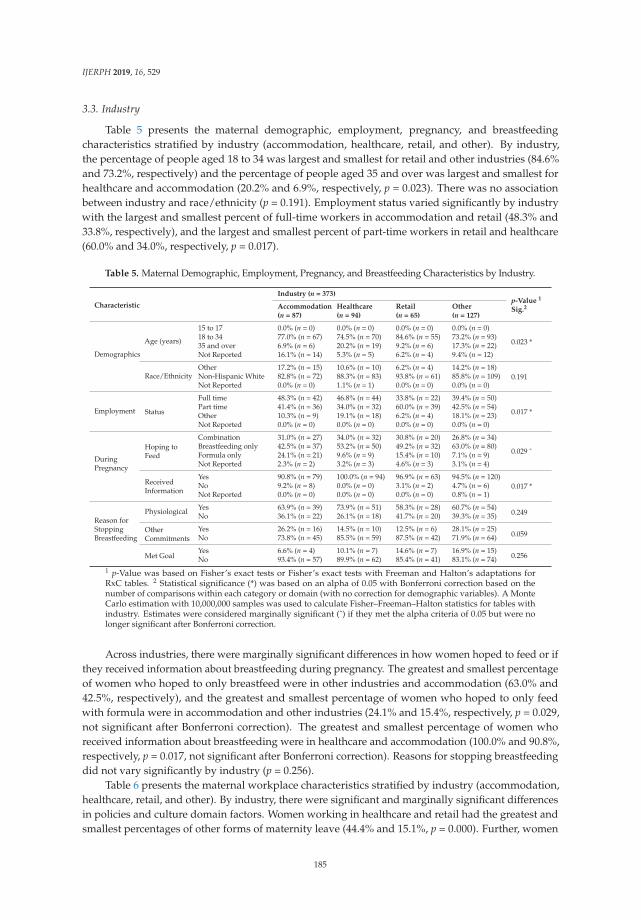
IJERPH 2019, 16, 529
3.3. Industry
Table 5 presents the maternal demographic, employment, pregnancy, and breastfeedingcharacteristics stratified by industry (accommodation, healthcare, retail, and other). By industry,the percentage of people aged 18 to 34 was largest and smallest for retail and other industries (84.6%and 73.2%, respectively) and the percentage of people aged 35 and over was largest and smallest forhealthcare and accommodation (20.2% and 6.9%, respectively, p = 0.023). There was no associationbetween industry and race/ethnicity (p = 0.191). Employment status varied significantly by industrywith the largest and smallest percent of full-time workers in accommodation and retail (48.3% and33.8%, respectively), and the largest and smallest percent of part-time workers in retail and healthcare(60.0% and 34.0%, respectively, p = 0.017).
Table 5. Maternal Demographic, Employment, Pregnancy, and Breastfeeding Characteristics by Industry.
Characteristic
Industry (n = 373)p-Value 1
Sig.2Accommodation Healthcare Retail Other(n = 87) (n = 94) (n = 65) (n = 127)
Demographics
Age (years)
15 to 17 0.0% (n = 0) 0.0% (n = 0) 0.0% (n = 0) 0.0% (n = 0)
0.023 *18 to 34 77.0% (n = 67) 74.5% (n = 70) 84.6% (n = 55) 73.2% (n = 93)35 and over 6.9% (n = 6) 20.2% (n = 19) 9.2% (n = 6) 17.3% (n = 22)Not Reported 16.1% (n = 14) 5.3% (n = 5) 6.2% (n = 4) 9.4% (n = 12)
Race/EthnicityOther 17.2% (n = 15) 10.6% (n = 10) 6.2% (n = 4) 14.2% (n = 18)
0.191Non-Hispanic White 82.8% (n = 72) 88.3% (n = 83) 93.8% (n = 61) 85.8% (n = 109)Not Reported 0.0% (n = 0) 1.1% (n = 1) 0.0% (n = 0) 0.0% (n = 0)
Employment Status
Full time 48.3% (n = 42) 46.8% (n = 44) 33.8% (n = 22) 39.4% (n = 50)
0.017 *Part time 41.4% (n = 36) 34.0% (n = 32) 60.0% (n = 39) 42.5% (n = 54)Other 10.3% (n = 9) 19.1% (n = 18) 6.2% (n = 4) 18.1% (n = 23)Not Reported 0.0% (n = 0) 0.0% (n = 0) 0.0% (n = 0) 0.0% (n = 0)
DuringPregnancy
Hoping toFeed
Combination 31.0% (n = 27) 34.0% (n = 32) 30.8% (n = 20) 26.8% (n = 34)
0.029 ˆBreastfeeding only 42.5% (n = 37) 53.2% (n = 50) 49.2% (n = 32) 63.0% (n = 80)Formula only 24.1% (n = 21) 9.6% (n = 9) 15.4% (n = 10) 7.1% (n = 9)Not Reported 2.3% (n = 2) 3.2% (n = 3) 4.6% (n = 3) 3.1% (n = 4)
ReceivedInformation
Yes 90.8% (n = 79) 100.0% (n = 94) 96.9% (n = 63) 94.5% (n = 120)0.017 *No 9.2% (n = 8) 0.0% (n = 0) 3.1% (n = 2) 4.7% (n = 6)
Not Reported 0.0% (n = 0) 0.0% (n = 0) 0.0% (n = 0) 0.8% (n = 1)
Reason forStoppingBreastfeeding
Physiological Yes 63.9% (n = 39) 73.9% (n = 51) 58.3% (n = 28) 60.7% (n = 54)0.249No 36.1% (n = 22) 26.1% (n = 18) 41.7% (n = 20) 39.3% (n = 35)
OtherCommitments
Yes 26.2% (n = 16) 14.5% (n = 10) 12.5% (n = 6) 28.1% (n = 25)0.059No 73.8% (n = 45) 85.5% (n = 59) 87.5% (n = 42) 71.9% (n = 64)
Met GoalYes 6.6% (n = 4) 10.1% (n = 7) 14.6% (n = 7) 16.9% (n = 15)
0.256No 93.4% (n = 57) 89.9% (n = 62) 85.4% (n = 41) 83.1% (n = 74)1 p-Value was based on Fisher’s exact tests or Fisher’s exact tests with Freeman and Halton’s adaptations forRxC tables. 2 Statistical significance (*) was based on an alpha of 0.05 with Bonferroni correction based on thenumber of comparisons within each category or domain (with no correction for demographic variables). A MonteCarlo estimation with 10,000,000 samples was used to calculate Fisher–Freeman–Halton statistics for tables withindustry. Estimates were considered marginally significant (ˆ) if they met the alpha criteria of 0.05 but were nolonger significant after Bonferroni correction.
Across industries, there were marginally significant differences in how women hoped to feed or ifthey received information about breastfeeding during pregnancy. The greatest and smallest percentageof women who hoped to only breastfeed were in other industries and accommodation (63.0% and42.5%, respectively), and the greatest and smallest percentage of women who hoped to only feedwith formula were in accommodation and other industries (24.1% and 15.4%, respectively, p = 0.029,not significant after Bonferroni correction). The greatest and smallest percentage of women whoreceived information about breastfeeding were in healthcare and accommodation (100.0% and 90.8%,respectively, p = 0.017, not significant after Bonferroni correction). Reasons for stopping breastfeedingdid not vary significantly by industry (p = 0.256).
Table 6 presents the maternal workplace characteristics stratified by industry (accommodation,healthcare, retail, and other). By industry, there were significant and marginally significant differencesin policies and culture domain factors. Women working in healthcare and retail had the greatest andsmallest percentages of other forms of maternity leave (44.4% and 15.1%, p = 0.000). Further, women
185
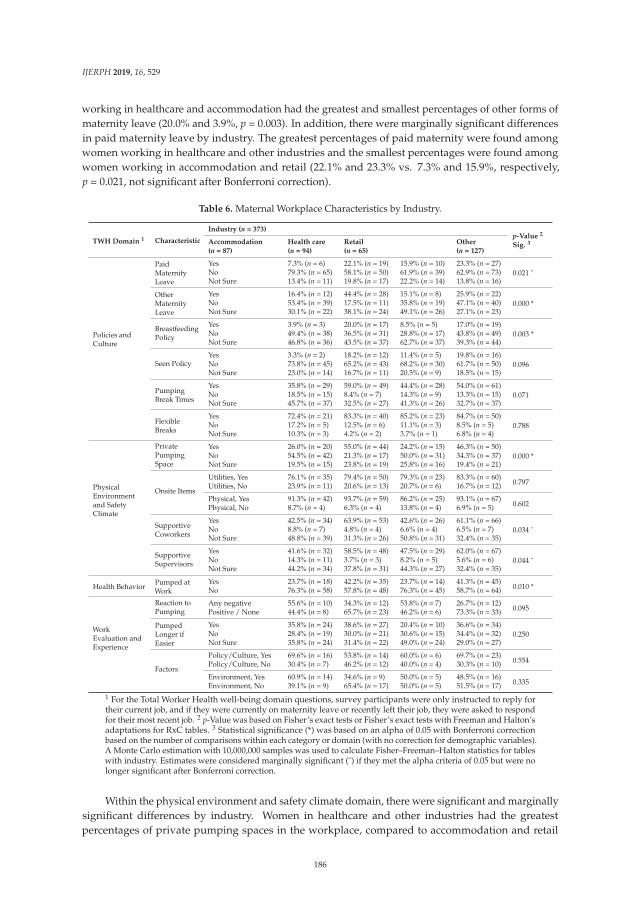
IJERPH 2019, 16, 529
working in healthcare and accommodation had the greatest and smallest percentages of other forms ofmaternity leave (20.0% and 3.9%, p = 0.003). In addition, there were marginally significant differencesin paid maternity leave by industry. The greatest percentages of paid maternity were found amongwomen working in healthcare and other industries and the smallest percentages were found amongwomen working in accommodation and retail (22.1% and 23.3% vs. 7.3% and 15.9%, respectively,p = 0.021, not significant after Bonferroni correction).
Table 6. Maternal Workplace Characteristics by Industry.
TWH Domain 1 Characteristic
Industry (n = 373)p-Value 2
Sig. 3Accommodation Health care Retail Other(n = 87) (n = 94) (n = 65) (n = 127)
Policies andCulture
PaidMaternityLeave
Yes 7.3% (n = 6) 22.1% (n = 19) 15.9% (n = 10) 23.3% (n = 27)0.021 ˆNo 79.3% (n = 65) 58.1% (n = 50) 61.9% (n = 39) 62.9% (n = 73)
Not Sure 13.4% (n = 11) 19.8% (n = 17) 22.2% (n = 14) 13.8% (n = 16)
OtherMaternityLeave
Yes 16.4% (n = 12) 44.4% (n = 28) 15.1% (n = 8) 25.9% (n = 22)0.000 *No 53.4% (n = 39) 17.5% (n = 11) 35.8% (n = 19) 47.1% (n = 40)
Not Sure 30.1% (n = 22) 38.1% (n = 24) 49.1% (n = 26) 27.1% (n = 23)
BreastfeedingPolicy
Yes 3.9% (n = 3) 20.0% (n = 17) 8.5% (n = 5) 17.0% (n = 19)0.003 *No 49.4% (n = 38) 36.5% (n = 31) 28.8% (n = 17) 43.8% (n = 49)
Not Sure 46.8% (n = 36) 43.5% (n = 37) 62.7% (n = 37) 39.3% (n = 44)
Seen PolicyYes 3.3% (n = 2) 18.2% (n = 12) 11.4% (n = 5) 19.8% (n = 16)
0.096No 73.8% (n = 45) 65.2% (n = 43) 68.2% (n = 30) 61.7% (n = 50)Not Sure 23.0% (n = 14) 16.7% (n = 11) 20.5% (n = 9) 18.5% (n = 15)
PumpingBreak Times
Yes 35.8% (n = 29) 59.0% (n = 49) 44.4% (n = 28) 54.0% (n = 61)0.071No 18.5% (n = 15) 8.4% (n = 7) 14.3% (n = 9) 13.3% (n = 15)
Not Sure 45.7% (n = 37) 32.5% (n = 27) 41.3% (n = 26) 32.7% (n = 37)
FlexibleBreaks
Yes 72.4% (n = 21) 83.3% (n = 40) 85.2% (n = 23) 84.7% (n = 50)0.788No 17.2% (n = 5) 12.5% (n = 6) 11.1% (n = 3) 8.5% (n = 5)
Not Sure 10.3% (n = 3) 4.2% (n = 2) 3.7% (n = 1) 6.8% (n = 4)
PhysicalEnvironmentand SafetyClimate
PrivatePumpingSpace
Yes 26.0% (n = 20) 55.0% (n = 44) 24.2% (n = 15) 46.3% (n = 50)0.000 *No 54.5% (n = 42) 21.3% (n = 17) 50.0% (n = 31) 34.3% (n = 37)
Not Sure 19.5% (n = 15) 23.8% (n = 19) 25.8% (n = 16) 19.4% (n = 21)
Onsite Items
Utilities, Yes 76.1% (n = 35) 79.4% (n = 50) 79.3% (n = 23) 83.3% (n = 60)0.797Utilities, No 23.9% (n = 11) 20.6% (n = 13) 20.7% (n = 6) 16.7% (n = 12)
Physical, Yes 91.3% (n = 42) 93.7% (n = 59) 86.2% (n = 25) 93.1% (n = 67)0.602Physical, No 8.7% (n = 4) 6.3% (n = 4) 13.8% (n = 4) 6.9% (n = 5)
SupportiveCoworkers
Yes 42.5% (n = 34) 63.9% (n = 53) 42.6% (n = 26) 61.1% (n = 66)0.034 ˆNo 8.8% (n = 7) 4.8% (n = 4) 6.6% (n = 4) 6.5% (n = 7)
Not Sure 48.8% (n = 39) 31.3% (n = 26) 50.8% (n = 31) 32.4% (n = 35)
SupportiveSupervisors
Yes 41.6% (n = 32) 58.5% (n = 48) 47.5% (n = 29) 62.0% (n = 67)0.044 ˆNo 14.3% (n = 11) 3.7% (n = 3) 8.2% (n = 5) 5.6% (n = 6)
Not Sure 44.2% (n = 34) 37.8% (n = 31) 44.3% (n = 27) 32.4% (n = 35)
Health Behavior Pumped atWork
Yes 23.7% (n = 18) 42.2% (n = 35) 23.7% (n = 14) 41.3% (n = 45)0.010 *No 76.3% (n = 58) 57.8% (n = 48) 76.3% (n = 45) 58.7% (n = 64)
WorkEvaluation andExperience
Reaction toPumping
Any negative 55.6% (n = 10) 34.3% (n = 12) 53.8% (n = 7) 26.7% (n = 12)0.095Positive / None 44.4% (n = 8) 65.7% (n = 23) 46.2% (n = 6) 73.3% (n = 33)
PumpedLonger ifEasier
Yes 35.8% (n = 24) 38.6% (n = 27) 20.4% (n = 10) 36.6% (n = 34)0.250No 28.4% (n = 19) 30.0% (n = 21) 30.6% (n = 15) 34.4% (n = 32)
Not Sure 35.8% (n = 24) 31.4% (n = 22) 49.0% (n = 24) 29.0% (n = 27)
Factors
Policy/Culture, Yes 69.6% (n = 16) 53.8% (n = 14) 60.0% (n = 6) 69.7% (n = 23)0.554Policy/Culture, No 30.4% (n = 7) 46.2% (n = 12) 40.0% (n = 4) 30.3% (n = 10)
Environment, Yes 60.9% (n = 14) 34.6% (n = 9) 50.0% (n = 5) 48.5% (n = 16)0.335Environment, No 39.1% (n = 9) 65.4% (n = 17) 50.0% (n = 5) 51.5% (n = 17)
1 For the Total Worker Health well-being domain questions, survey participants were only instructed to reply fortheir current job, and if they were currently on maternity leave or recently left their job, they were asked to respondfor their most recent job. 2 p-Value was based on Fisher’s exact tests or Fisher’s exact tests with Freeman and Halton’sadaptations for RxC tables. 3 Statistical significance (*) was based on an alpha of 0.05 with Bonferroni correctionbased on the number of comparisons within each category or domain (with no correction for demographic variables).A Monte Carlo estimation with 10,000,000 samples was used to calculate Fisher–Freeman–Halton statistics for tableswith industry. Estimates were considered marginally significant (ˆ) if they met the alpha criteria of 0.05 but were nolonger significant after Bonferroni correction.
Within the physical environment and safety climate domain, there were significant and marginallysignificant differences by industry. Women in healthcare and other industries had the greatestpercentages of private pumping spaces in the workplace, compared to accommodation and retail
186
IJERPH 2019, 16, 529
(55.0% and 46.3% vs. 26.0% and 24.2%, respectively, p = 0.000). Further, women in healthcare and“other” industries had the greatest percentages of supportive coworkers in the workplace, comparedto accommodation and retail (63.9% and 61.1% vs. 42.5% and 42.6%, respectively, p = 0.034, notsignificant after Bonferroni correction), and women in healthcare and “other” industries had thegreatest percentages of supportive supervisors in the workplace, compared to accommodation andretail (58.5% and 62.0% vs. 41.6% and 47.5%, respectively, p = 0.044, not significant after Bonferronicorrection). Within the health behavior domain, greater percentages of women in healthcare andother industries pumped at work, compared to women in accommodation and retail (42.2% and 41.3%vs. 23.7% and 23.7%, respectively, p = 0.010). There were no significant differences within the workevaluation and experience domain factors by industry (all p > 0.095)
Similar to Tables 2 and 4, patterns emerged when examining responses of “not sure” in Table 6.Across significant effects, women working in retail had the greatest percentages of “not sure” andwomen working in other industries had the smallest percentages of ”not sure.”
4. Discussion
4.1. Findings
Based on previous research and the TWH model, this study explored, among WIC participants andby industry, factors that encourage and/or discourage the initiation and continuation of breastfeeding;pumping at work; and the workplace behaviors, policies, culture, environment, and safety climateassociated with breastfeeding and pumping. Our study confirmed the results of a previous studyof WIC participants and found that breastfeeding initiation was associated with age, race/ethnicity,and hoping or planning to breastfeed [13]. Further, also similar to this previous study, we found thatbreastfeeding initiation was not associated with employment status.
Our study did find, however, significant associations between industry and breastfeedinginitiation, pumping at work, and the policies and physical environment related to breastfeedingand pumping. Confirming previous findings, we found that women in specific service-orientedindustries (i.e., accommodation and retail) reported the lowest rates of breastfeeding initiation andworkplace supports for breastfeeding and pumping [12]. Compared to healthcare and all otherindustries, women who worked in accommodation or retail had the smallest percentages of everhaving breastfed, planning to only breastfeed, receiving information on breastfeeding while pregnant,paid maternity leave, a breastfeeding policy, private pumping spaces, and having pumped at work.
Notably, workplace policy factors supporting breastfeeding (i.e., having paid maternity leave,other maternity leave, and a breastfeeding policy) varied by industry but were not associatedwith breastfeeding initiation or duration. Further, how a woman hoped to feed and having aprivate pumping space at work were significantly associated with industry, breastfeeding initiation,and breastfeeding duration.
Our study confirms previous findings by Snyder et al. (2018) that having a breastfeeding policy,a space to pump, and coworker and supervisor support towards pumping at work vary by industrywith the highest rates found among women in a professional industry (i.e., healthcare) [12]. Further,we also found women in service-oriented industries reported the lowest rates of having breastfedfor four or more months. In contrast to Snyder et al. (2018), the majority of women in our study didnot have or were “not sure” about each of these factors. Further, also unlike Synder et al. (2018),the majority of women in our study had not met their goal when they stopped breastfeeding.
4.2. Limitations
This study was cross-sectional and we were unable to assess the temporality of associations such ashaving received information on breastfeeding, how a woman hoped to feed her child, and subsequentbreastfeeding behavior. We were also unable to assess supervisor or coworker support of pumpingin the workplace pre-partum and its impact on pumping behavior. Survey responses were based on
187
IJERPH 2019, 16, 529
self-report and subject to several biases including but not limited to response bias, nonresponse bias,recall bias, and observation bias. Women who were employed, initiated breastfeeding, or had difficultybreastfeeding may have been more likely to take the survey, respond to all survey questions, and moreaccurately remember their breastfeeding experiences.
The survey also directed women who were currently on maternity leave or who had recentlyleft their job to also respond to workplace questions. This may have resulted in increased rates ofemployment, having breastfed, and difficulties breastfeeding than in the entire WIC population. Due tothis design effect, we were also unable to reliably identify and analyze the rates of women who werepregnant or gave birth and decided to no longer work (and their workplace environment).
Income, a key factor in the initiation and duration of breastfeeding, was not collected in this study.However, we assumed study participants were of a similar, lower socioeconomic status given theyhad qualified for the WIC program. All WIC families are at or below 185% of the family poverty levelunless they adjunctively qualified through participation in the Supplemental Nutrition AssistanceProgram, Temporary Assistance for Needy Families Program, and/or Medicaid. The types of jobs andindustries reported in our study reflect the low to moderate income of WIC participants. Our studyalso did not collect the age of the child and we were unable to determine who was still on paidmaternity leave at the time of survey administration. Categories for industry were especially broaddue to small sample sizes and we were not able to calculate numerous factors related to industry andoccupation, employment, and the workplace including occupation alone, additional industries, size ofthe workplace (greater than or less than 50 people), and exempt versus non-exempt jobs.
Many breastfeeding studies focusing on workplace support by employment type are limited totheir sample population [12,21]. This study is limited to women participating in the WIC programand/or mothers with children participating in the WIC program and our findings may not begeneralizable outside of this population.
5. Conclusions
5.1. Implications
Our study illustrates how breastfeeding worksite supports are critical to TWH and well-beingand suggests that women with a supportive environment are more likely to initiate breastfeedingand breastfeed longer compared to those without a supportive environment. When women beginthe WIC program, they are often overwhelmed with the demands of working and caring for theirfamily on a limited income. Although women are encouraged to explore their specific workplacepolicies and environment during breastfeeding education sessions and counseling appointments,these factors may contribute to the high rates of “not sure” reported in this study. Recently, there hasbeen increased attention to breastfeeding support within the workplace to ensure compliance withthe Patient Protection and Affordable Care Act (2010), which amended Section 7 of the Fair LaborStandards Act to require employers to provide: (1) “reasonable break time for an employee to expressbreast milk for her nursing child for 1 year after the child’s birth each time such employee has needto express the milk,” and (2) “a place, other than a bathroom, that is shielded from view and freefrom intrusion from coworkers and the public, which may be used by an employee to express breastmilk.” [37,38]. This study was conducted six years after the law was enacted and women still reportednot having space or flexible time at work to express breast milk.
5.2. Recommendations
Currently, there are numerous ambiguities across breastfeeding research, policies, and practice atthe state and federal level. There is a need to make clear connections between federal statutes, publichealth research, official company-specific policies, and actual practices in the workplace, especiallythe transparent designation of a workplace contact for breastfeeding policies and practice. Humanresource or occupational health personnel in the workforce who write policies or design lactation space
188
IJERPH 2019, 16, 529
should be educated on core components that make up comprehensive lactation programs. Managersand supervisors need to be aware of the unique, acute, and transient needs of breastfeeding mothersreturning to work specific to their job class, duties, schedules, and locations. Providing educationand training directed toward leadership, supervisors, and human resource personnel regarding thebenefits of breastfeeding for both employees and employers and the supports needed when returningto work should be included in any TWH framework. In addition, our study found that many womenwere unaware of their employer’s benefits for lactation support after returning to work, demonstratingthe need for improved communication and awareness about the benefits of health-related employerpolicies in the context of the TWH framework.
5.3. Future Research
Additional studies with larger sample sizes of women participating in WIC, characterizing thebarriers to breastfeeding associated with specific industries and subpopulations, would inform futureinterventions, policy development, and education for employers of this population. Currently, lackof support for breastfeeding across industries is only discussed anecdotally, especially within theWIC program. Given our sample population, we suggest that an equality lens be considered inproviding and communicating lactation support; studies should examine whether or not women areafraid to ask about the breastfeeding policies in their workplace, how employers disseminate healthbenefit information, and the availability and visibility of spaces for breastfeeding in the workplace.More broadly, learning about workplace policies and attitudes towards breastfeeding often involvesspeaking with coworkers and supervisors suggesting worksite power imbalances between employeeand employer be examined. Future studies should also consider the high rates of “not sure” reported inthis study in response to questions about workplace support and policies for breastfeeding. In order tobetter educate WIC participants, methods to improve the provision or dissemination of informationalmaterials should be explored.
5.4. Final Remarks
In breastfeeding research, policy, and practice a variety of social justices are being addressedby agencies, leaders, and grass roots groups that believe breastfeeding is a human right that shouldnot be denied or sacrificed when returning to work after having a baby. The priorities for theseorganizations include equal access to prenatal and postpartum lactation care and support, as well astargeted, evidence-based approaches to address the large disparities in workplace accommodationsfound in this study.
Author Contributions: E.A.L. cleaned and curated the data, conducted the formal data analyses using statisticalsoftware, and wrote and edited the original article draft (sections including the introduction, methodology,results, discussion, and conclusion). K.A., M.H., and L.S. conceptualized the overarching research goals andaims; led the investigation, project administration, and collection of survey data; and participated in the surveydevelopment. K.A., M.H., and L.S. also assisted with writing and reviewing the introduction, methods, discussion,and conclusions of the article.
Funding: This research was funded by the National Institute for Occupational Safety and Health CooperativeAgreement #U60 OH010910, NH Occupational Health Surveillance Program: Fundamental.
Acknowledgments: We would like to thank the efforts of University of New Hampshire Master of Public HealthProgram Field Study students Ashley Valdes and Kyle Dopfel and the New Hampshire Breastfeeding Task ForceBoard of Directors.
Conflicts of Interest: The authors have no conflicts of interest to disclose. The funder had no role in the design ofthe study; the collection, analyses, and interpretation of data; the writing of the manuscript; or the decision topublish the results.
References
1. Fein, S.B.; Roe, B. The effect of work status on initiation and duration of breast-feeding. Am. J. Public Health1998, 88, 1042–1046. [CrossRef] [PubMed]
189
IJERPH 2019, 16, 529
2. Gielen, A.C.; Faden, R.R.; O’Campo, P.; Brown, C.H.; Paige, D.M. Maternal employment during the earlypostpartum period: Effects on initiation and continuation of breast-feeding. Pediatrics 1991, 87, 298–305.[PubMed]
3. Hawkins, S.S.; Griffiths, L.J.; Dezateux, C.; Law, C.; Millennium Cohort Study Child Health Group. Maternalemployment and breast-feeding initiation: Findings from the Millennium Cohort Study. Paediatr. Perinat.Epidemiol. 2007, 21, 242–247. [CrossRef] [PubMed]
4. Kimbro, R.T. On-the-job moms: Work and breastfeeding initiation and duration for a sample of low-incomewomen. Matern. Child Health J. 2006, 10, 19–26. [CrossRef] [PubMed]
5. Horta, B.L.; Victora, C.G. Long-Term Effects of Breastfeeding: A Systematic Review. Available online:http://apps.who.int/iris/bitstream/handle/10665/79198/9789241505307_eng.pdf?sequence=1 (accessedon 17 December 2018).
6. National Center for Chronic Disease Prevention and Health Promotion. Breastfeeding Report Card.Available online: https://www.cdc.gov/breastfeeding/pdf/2014breastfeedingreportcard.pdf (accessedon 6 November 2018).
7. Mirkovic, K.R.; Perrine, C.G.; Scanlon, K.S.; Grummer-Strawn, L.M. In the United States, a Mother’s Plans forInfant Feeding Are Associated with Her Plans for Employment. J. Hum. Lact. 2014, 30, 292–297. [CrossRef]
8. Lindberg, L. Trends in the relationship between breastfeeding and postpartum employment in the UnitedStates. Soc. Biol. 1996, 43, 191–202. [CrossRef] [PubMed]
9. Ryan, A.S.; Zhou, W.; Arensberg, M.B. The effect of employment status on breastfeeding in the United States.Women’s Health Issues 2006, 16, 243–251. [CrossRef] [PubMed]
10. Roe, B.; Whittington, L.A.; Fein, S.B.; Teisl, M.F. The conflict between breast-feeding and maternalemployment: Expectations and realities. Presented at the Annual Meeting of the Population Association ofAmerica, New Orleans, LA, USA, 9–11 May 1996; pp. 2, 27.
11. Mirkovic, K.R.; Perrine, C.G.; Scanlon, K.S.; Grummer-Strawn, L.M. Maternity leave duration andfull-time/part-time work status are associated with US mothers’ ability to meet breastfeeding intentions.J. Hum. Lact. 2014, 30, 416–419. [CrossRef]
12. Snyder, K.; Hansen, K.; Brown, S.; Portratz, A.; White, K.; Dinkel, D. Workplace Breastfeeding Support Variesby Employment Type: The Service Workplace Disadvantage. Breastfeed. Med. 2018, 13, 23–27. [CrossRef]
13. Murtagh, L.; Moulton, A.D. Working mothers, breastfeeding, and the law. Am. J. Public Health 2011, 101,217–223. [CrossRef]
14. Haviland, B.; James, K.; Killman, M.; Trbovich, K. Policy Brief: Supporting Breastfeeding in theWorkplace. Available online: http://www.asphn.org/resource_files/657/657_resource_file2.pdf (accessedon 11 November 2018).
15. Dagher, R.K.; McGovern, P.M.; Schold, J.D.; Randall, X.J. Determinants of breastfeeding initiation andcessation among employed mothers: A prospective cohort study. BMC Preg. Childbirth 2016, 16, 194.[CrossRef] [PubMed]
16. United States Public Health Service, Office of the Surgeon General; Centers for Disease Control andPrevention (U.S.); United States Department of Health and Human Services, Office on Women’s Health.The Surgeon General’s Call to Action to Support Breastfeeding 2011; U.S. Department of Health and HumanServices, U.S. Public Health Service, Office of the Surgeon General: Rockville, MD, USA, 2011; (pp. 1 onlineresource (1 PDF file ( vi, 88 p). Available online: http://www.ncbi.nlm.nih.gov/books/NBK52682 (accessedon 12 February 2019).
17. Centers for Disease Control and Prevention. Breastfeeding Among U.S. Children Born 2009–2015, CDC NationalImmunization Survey: Rates of Any and Exclusive Breastfeeding by Socio-Demographics among Children Bornin 2015 (Percentage +/- Half 95% Confidence Interval). Available online: https://www.cdc.gov/breastfeeding/data/nis_data/rates-any-exclusive-bf-socio-dem-2015.htm (accessed on 17 December 2018).
18. Briefel, R.R.; Deming, D.M.; Reidy, K.C. Parents’ Perceptions and Adherence to Children’s Diet and ActivityRecommendations: The 2008 Feeding Infants and Toddlers Study. Prev. Chron. Dis. 2015, 12, E159. [CrossRef][PubMed]
19. Houghtaling, B.; Byker Shanks, C.; Jenkins, M. Likelihood of Breastfeeding Within the USDA’s Food andNutrition Service Special Supplemental Nutrition Program for Women, Infants, and Children Population.J. Hum. Lact. 2017, 33, 83–97. [CrossRef] [PubMed]
190
IJERPH 2019, 16, 529
20. Jenkins, A.L.; Tavengwa, N.V.; Chasekwa, B.; Chatora, K.; Taruberekera, N.; Mushayi, W.; Madzima, R.C.;Mbuya, M.N. Addressing social barriers and closing the gender knowledge gap: Exposure to road shows isassociated with more knowledge and more positive beliefs, attitudes and social norms regarding exclusivebreastfeeding in rural Zimbabwe. Matern. Child Nutr. 2012, 8, 459–470. [CrossRef] [PubMed]
21. Dunn, R.L.; Kalich, K.A.; Fedrizzi, R.; Phillips, S. Barriers and Contributors to Breastfeeding in WIC Mothers:A Social Ecological Perspective. Breastfeed. Med. 2015, 10, 493–501. [CrossRef] [PubMed]
22. Darfour-Oduro, S.A.; Kim, J. WIC mothers’ social environment and postpartum health on breastfeedinginitiation and duration. Breastfeed. Med. 2014, 9, 524–529. [CrossRef] [PubMed]
23. Hedberg, I.C. Barriers to breastfeeding in the WIC population. MCN Am. J. Matern. Child Nurs. 2013, 38,244–249. [CrossRef]
24. Holmes, A.V.; Chin, N.P.; Kaczorowski, J.; Howard, C.R. A barrier to exclusive breastfeeding for WICenrollees: Limited use of exclusive breastfeeding food package for mothers. Breastfeed. Med. 2009, 4, 25–30.[CrossRef]
25. Chaudry, A.; Pedroza, J.; Sandstrom, H. How Employment Constraints Affect Low-Income Working Parents’Child Care Decisions. Available online: https://www.urban.org/sites/default/files/publication/32731/412513-How-Employment-Constraints-Affect-Low-Income-Working-Parents-Child-Care-Decisions.PDF(accessed on 18 December 2018).
26. New Hampshire Health Wisdom. New Hampshire WIC Pediatric Nutrition Surveillance (PedNSS):Breastfeeding. Available online: https://wisdom.dhhs.nh.gov/c10/epht/pediatricnutrition/wic1.html#breastfeeding (accessed on 1 January 2018).
27. Centers for Disease Control and Prevention. Breastfeeding Report Card. Available online: https://www.cdc.gov/breastfeeding/data/reportcard.htm (accessed on 1 January 2018).
28. Dunn, R.L.; Kalich, K.A.; Henning, M.J.; Fedrizzi, R. Engaging field-based professionals in a qualitativeassessment of barriers and positive contributors to breastfeeding using the social ecological model.Matern. Child Health J. 2015, 19, 6–16. [CrossRef]
29. National Institute for Occupational Safety and Health. Total Worker Health. Available online: https://www.cdc.gov/niosh/twh/default.html (accessed on 18 December 2018).
30. Chari, R.; Chang, C.C.; Sauter, S.L.; Petrun Sayers, E.L.; Cerully, J.L.; Schulte, P.; Schill, A.L.; Uscher-Pines, L.Expanding the Paradigm of Occupational Safety and Health: A New Framework for Worker Well-Being.J. Occup. Environ. Med. 2018, 60, 589–593. [CrossRef]
31. Stuebe, A.M. Enabling women to achieve their breastfeeding goals. Obstet. Gynecol. 2014, 123, 643–652.[CrossRef] [PubMed]
32. Carothers, C.; Hare, I. The business case for breastfeeding. Breastfeed. Med. 2010, 5, 229–231. [CrossRef][PubMed]
33. Tsai, S.Y. Employee perception of breastfeeding-friendly support and benefits of breastfeeding as a predictorof intention to use breast-pumping breaks after returning to work among employed mothers. Breastfeed. Med.2014, 9, 16–23. [CrossRef] [PubMed]
34. Ball, T.M.; Wright, A.L. Health care costs of formula-feeding in the first year of life. Pediatrics 1999, 103,870–876.
35. Centers for Disease Control and Prevention. The CDC Worksite Health ScoreCard: An Assessment Toolfor Employers to Prevent Heart Disease, Stroke, and Related Health Conditions. Available online: https://www.cdc.gov/workplacehealthpromotion/pdf/hsc-manual.pdf (accessed on 15 September 2018).
36. Freeman, G.H.; Halton, J.H. Note on an exact treatment of contingency, goodness of fit and other problemsof significance. Biometrika 1951, 38, 141–149. [CrossRef]
37. 111th Congress. Patient Protection and Affordable Care Act. Public Law 111-148 2010. Available online: http://www.gpo.gov/fdsys/pkg/PLAW-111publ148/pdf/PLAW111publ148.pdf (accessed on 24 September 2018).
38. U.S. Department of Labor Wage and Hour Division. Frequently Asked Questions—Break Time for NursingMothers. Available online: https://www.dol.gov/whd/nursingmothers/faqBTNM.htm (accessed on17 December 2018).
© 2019 by the authors. Licensee MDPI, Basel, Switzerland. This article is an open accessarticle distributed under the terms and conditions of the Creative Commons Attribution(CC BY) license (http://creativecommons.org/licenses/by/4.0/).
191
International Journal of
Environmental Research
and Public Health
Article
A Cluster Randomized Controlled Trial of a TotalWorker Health® Intervention on CommercialConstruction Sites
Susan E. Peters 1 , Michael P. Grant 1 , Justin Rodgers 2, Justin Manjourides 2,
Cassandra A. Okechukwu 1 and Jack T. Dennerlein 1,3,*
1 Harvard Center for Work, Health and Wellbeing, Harvard T.H. Chan School of Public Health, Boston,MA 02115, USA; [email protected] (S.E.P.); [email protected] (M.P.G.);[email protected] (C.A.O.)
2 Department of Health Sciences, Bouvé College of Health Sciences, Northeastern University, Boston,MA 02115, USA; [email protected] (J.R.); [email protected] (J.M.)
3 Department of Physical Therapy, Movement and Rehabilitation Science, Bouvé College of Health Sciences,Northeastern University, Boston, MA 02115, USA
* Correspondence: [email protected]
Received: 7 October 2018; Accepted: 23 October 2018; Published: 25 October 2018
Abstract: This study evaluated the efficacy of an integrated Total Worker Health® program, “All theRight Moves”, designed to target the conditions of work and workers’ health behaviors through anergonomics program combined with a worksite-based health promotion Health Week intervention.A matched-pair cluster randomized controlled trial was conducted on ten worksites (five intervention(n = 324); five control sites (n = 283)). Worker surveys were collected at all sites pre- and post-exposure at one- and six-months. Linear and logistic regression models evaluated the effect ofthe intervention on pain and injury, dietary and physical activity behaviors, smoking, ergonomicpractices, and work limitations. Worker focus groups and manager interviews supplemented theevaluation. After controlling for matched intervention and control pairs as well as covariates,at one-month following the ergonomics program we observed a significant improvement in ergonomicpractices (B = 0.20, p = 0.002), and a reduction in incidences of pain and injury (OR = 0.58, p = 0.012)in the intervention group. At six months, we observed differences in favor of the interventiongroup for a reduction in physically demanding work (B = −0.25, p = 0.008), increased recreationalphysical activity (B = 35.2, p = 0.026) and higher consumption of fruits and vegetables (B = 0.87,p = 0.008). Process evaluation revealed barriers to intervention implementation fidelity and uptake,including a fissured multiemployer worksite, the itinerant nature of workers, competing productionpressures, management support, and inclement weather. The All the Right Moves program hada positive impact at the individual level on the worksites with the program. For the longer term,the multi-organizational structure in the construction work environment needs to be considered tofacilitate more upstream, long-term changes.
Keywords: organizational intervention; health promotion; injury prevention; musculoskeletal;ergonomics; mixed-methods study; construction industry; safety management; health risk behaviors;occupational health
1. Introduction
Internationally, construction workers have higher rates of musculoskeletal disorders, and chronicdiseases related to obesity, lack of physical activity and smoking than workers in other industries [1–4].In construction workers, musculoskeletal disorders have a one-year pain prevalence rate (at least one
IJERPH 2018, 15, 2354; doi:10.3390/ijerph15112354 www.mdpi.com/journal/ijerph192
IJERPH 2018, 15, 2354
episode of pain in the last year) of 51% for the back, 37% for the lower extremities, 32% for the upperextremities, and 24% for the neck in construction workers [5]. The high prevalence of musculoskeletaland cardiovascular disorders causes a sizable burden to employers, insurers, and society as a whole,attributing to work absenteeism, healthcare costs, work schedule delays, and high turnover [6–8].In 2014, approximately 33% of absenteeism was attributed to musculoskeletal symptoms [9].
Construction workers also have high rates of chronic health issues. Over 70% of constructionworkers are overweight [10]. Obese construction workers are at increased risk of receiving disabilitybenefits for cardiovascular disease and musculoskeletal disorders [11,12]. This risk is even higher forobese workers with high physical job demands, especially for those with musculoskeletal disorders [11].Specifically, construction workers also have the highest prevalence of smoking (39%) of all occupationalgroups [1]. The risk of chronic lung disease and cancers is also amplified by the combined effects ofsmoking with other respiratory exposures, such as dust, silica, and asbestos [13–15].
Extensive research has linked these injury and poor health outcomes to individual factors, as wellas the conditions of work, including job demands, physical work environment and psychosocial workfactors (e.g., supervisor support and worker collegiality) [7]. Construction workers’ injuries and poorhealth have been associated with the high physical demands, prolonged exposure to awkward postures,whole body vibration, long working hours, and psychosocial hazards in the work environment [2,16].
While these factors are prevalent in the construction industry, the complex work organization ofconstruction work provides additional challenges for implementing traditional workplace preventionprograms. The hierarchical structure between the site owners, general contractors, and subcontractingcompanies results in a fissured workplace [17]. The dynamic nature of these worksites results inworkers moving on and off the site day-to-day. In addition, construction has high workforce turnoverwithin the company, further complicating the number of workers transitioning in and out of theworkforce, which has been linked to higher injury rates [18,19].
Integrated approaches that address the work environment to improve both occupational safetyand health outcomes, and worker wellbeing outcomes, are acknowledged as being the mostsuccessful [20,21]. However, these integrated and comprehensive interventions for constructionworksites need further investigation [20–25]. To date, most integrated approaches for constructionworkers have been individual-based, or those provided through labor unions [24,26]. Manyworksite-based safety interventions for construction worksites have focused on using simplecampaigns (such as poster and leaflet educational material) [27,28], training programs [29,30],behavioral management programs [10,31,32], or new, task-specific ergonomic tools and methods [33,34].The intervention, “All the Right Moves” (ARM) described in this study, tested a different approachbased on integrated approaches promoted by The National Institute for Occupational Safety andHealth (NIOSH) Total Worker Health® program. Such approaches target the conditions of work thataffect workers injuries and health outcomes [7,35]. The ARM intervention targeted the conditionsof work through a worksite-based ergonomics program integrated into current work practices andon-site opportunities for workers to improve their health behaviors. The project’s goal was to developand determine the feasibility of an integrated health promotion and health protection worksite-basedprogram designed specifically for the dynamic nature of a commercial construction work site.
The purpose of this study was to examine the intervention—ARM, on commercial constructionsites, using a mixed methods approach. The specific aims of this project were to examine the efficacy ofan integrated program including: (1) a soft tissue injury prevention program on workers’ perception ofworksite ergonomic practices, new pain and injury incidences, and work limitations; and (2) a healthpromotion/health coaching (Health Week) program for diet, leisure time physical activity, and reducedsmoking behaviors.
193
IJERPH 2018, 15, 2354
2. Materials and Methods
2.1. Study Design and Randomization
We conducted a cluster randomized control trial on ten (five matched pairs) commercialconstruction sites (five intervention; five control) across the Boston metropolitan area, Massachusetts,United States between 2014 and 2015. Construction sites were matched within each general contractingcompany that agreed to participate in the study. Each pair of worksites was matched based onapproximate size, scope, and phase of construction. This ensured that each matched pair consistedof similar organizational and worksite factors, such as similar existing company health and safetymanagement systems [36]. Within each matched pair, one site was randomly assigned to eitheran intervention or a control group. A blocked randomization sequence was generated using aweb-based random number generator by a member of the research team, who then allocated thepairs to either intervention or control. All workers within a specific worksite received the sameintervention (or control) as allocated. Randomization and allocation of randomization sequenceoccurred as soon as two construction sites within a general contractor agreed to participate regardlessof their assignment to control or intervention. The intervention groups received the intervention, ARM,whilst the control group received no intervention. Due to the pragmatic nature of the intervention,neither interventionists nor participants were blinded.
2.2. Recruitment and Eligibility
Construction sites were recruited through construction site owners and general contractors. To beeligible to participate in the study, worksites had to be in operation for 4 months or longer, and have30 or more workers. Before the intervention commenced, a recruitment meeting was conducted witheach site owner or general contractor to provide an overview of the study, programmatic activities,and to obtain leadership commitment. These recruitment meetings were conducted by the interventionprimary investigator (J.T.D). Once a general contractor agreed, additional meetings with the leadershipof each of the selected sites provided further leadership commitment and agreement for the study totake place on their sites.
Workers were introduced to the study by the research team and the general contractor safetymanager, at a “safety stand-down” or toolbox talk. During the study, all new workers on a site wereoriented to the study at their new-worker onsite safety orientation. Individual construction workerswere surveyed within each site after a study launch meeting and at new-hire safety orientations forthose workers who started after study commencement. Surveyed workers at each site were eligible ifthey were aged 18–65, and were English literate. All surveyed workers self-nominated and providedverbal consent during the survey process
All subjects gave their informed consent for inclusion before they participated in any datacollection activities. The study was conducted in accordance with the Declaration of Helsinki, and theprotocol was approved by the Ethics Committee of Harvard T.H. Chan School of Public HealthInstitutional Review Board (IRB-13-1948).
2.3. The “All the Right Moves” (ARM) Intervention
The ARM intervention was designed to integrate intervention components into the companies’existing safety and health practices on the sites. The intervention components were first developed andvetted with researchers and construction safety professionals, based on evidence-based organizationalinterventions and our own studies in the construction industry [4,18,37]. Following this process,the components of the interventions were piloted on commercial construction sites not involvedin this trial. Managers and workers from the pilot sites provided qualitative feedback on programcomponents, and the feedback was used to modify the intervention components. The changes wereagain vetted with these workers to refine the intervention components. This feedback was crucial toensure intervention-organization fit, worker buy-in, and feasibility of implementing the components.
194
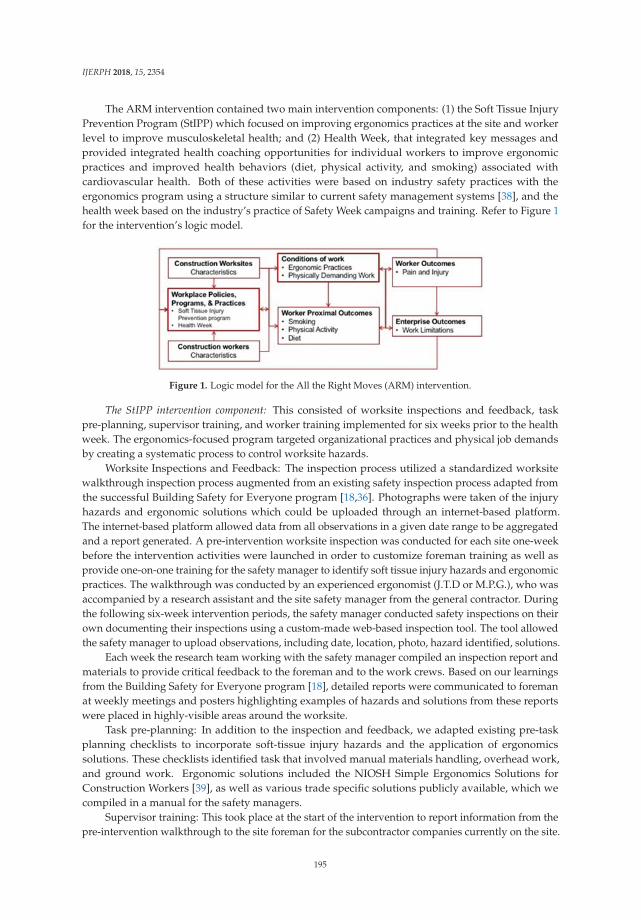
IJERPH 2018, 15, 2354
The ARM intervention contained two main intervention components: (1) the Soft Tissue InjuryPrevention Program (StIPP) which focused on improving ergonomics practices at the site and workerlevel to improve musculoskeletal health; and (2) Health Week, that integrated key messages andprovided integrated health coaching opportunities for individual workers to improve ergonomicpractices and improved health behaviors (diet, physical activity, and smoking) associated withcardiovascular health. Both of these activities were based on industry safety practices with theergonomics program using a structure similar to current safety management systems [38], and thehealth week based on the industry’s practice of Safety Week campaigns and training. Refer to Figure 1for the intervention’s logic model.
Figure 1. Logic model for the All the Right Moves (ARM) intervention.
The StIPP intervention component: This consisted of worksite inspections and feedback, taskpre-planning, supervisor training, and worker training implemented for six weeks prior to the healthweek. The ergonomics-focused program targeted organizational practices and physical job demandsby creating a systematic process to control worksite hazards.
Worksite Inspections and Feedback: The inspection process utilized a standardized worksitewalkthrough inspection process augmented from an existing safety inspection process adapted fromthe successful Building Safety for Everyone program [18,36]. Photographs were taken of the injuryhazards and ergonomic solutions which could be uploaded through an internet-based platform.The internet-based platform allowed data from all observations in a given date range to be aggregatedand a report generated. A pre-intervention worksite inspection was conducted for each site one-weekbefore the intervention activities were launched in order to customize foreman training as well asprovide one-on-one training for the safety manager to identify soft tissue injury hazards and ergonomicpractices. The walkthrough was conducted by an experienced ergonomist (J.T.D or M.P.G.), who wasaccompanied by a research assistant and the site safety manager from the general contractor. Duringthe following six-week intervention periods, the safety manager conducted safety inspections on theirown documenting their inspections using a custom-made web-based inspection tool. The tool allowedthe safety manager to upload observations, including date, location, photo, hazard identified, solutions.
Each week the research team working with the safety manager compiled an inspection report andmaterials to provide critical feedback to the foreman and to the work crews. Based on our learningsfrom the Building Safety for Everyone program [18], detailed reports were communicated to foremanat weekly meetings and posters highlighting examples of hazards and solutions from these reportswere placed in highly-visible areas around the worksite.
Task pre-planning: In addition to the inspection and feedback, we adapted existing pre-taskplanning checklists to incorporate soft-tissue injury hazards and the application of ergonomicssolutions. These checklists identified task that involved manual materials handling, overhead work,and ground work. Ergonomic solutions included the NIOSH Simple Ergonomics Solutions forConstruction Workers [39], as well as various trade specific solutions publicly available, which wecompiled in a manual for the safety managers.
Supervisor training: This took place at the start of the intervention to report information from thepre-intervention walkthrough to the site foreman for the subcontractor companies currently on the site.
195
IJERPH 2018, 15, 2354
The training curriculum included information about the intervention, programmatic activities, injuryhazards and ergonomic solutions identified from the first worksite inspection, and a few basic solutionsfrom the NIOSH Simple Solutions [39], as well as expectations for the duration of the interventionimplementation. The training was conducted during a mandatory weekly foreman meeting. Safetymanagers for each site also received this training, as well as trainings on how to use the web-basedworksite inspection tool.
Worker training consisted of an “Ergonomics Toolbox Talk” (i.e., full company break in normalwork to discuss an observed safety concern) that consisted of providing a few of the key messagesfrom the supervisor training. The toolbox talk took place at the start of the intervention for workersalready on the worksite and during new worker safety orientations, for workers coming onto the siteafter the initial launch meetings.
Health Week: This health promotion intervention was modeled after the existing safety weekin construction (one week each year that is dedicated to raising awareness of workplace safety).The key goal of Health Week was to provide health education through toolbox talks and engageworkers in programs to facilitate health behaviors through an opt-in health coaching program. HealthWeek targeted psychosocial factors and individual health-related behaviors by engaging workers inone-on-one discussions about their health and connecting them with relevant resources to improvetheir health behaviors. Toolbox talks were held during workers’ break times each day of Health Week.Scripts and one-page toolbox cards were developed by the research team and a health promotionconsultant, and then vetted with construction companies before being used. Topics included benefitsof health coaching, soft tissue injury prevention, smoking cessation, energy balance (diet and physicalactivity) and a wrap-up session. Free web-based and phone resources were provided for each relevanttopic. In addition, resources included free telephone-based health coaching provided by a largehealth-care organization. For active smokers, nicotine replacement therapy (NRT) (two-week supply)was provided free of charge.
Because of the success of individualized health coaching in construction workers, and prior resultsdemonstrating dynamic workers movement between sites, Health Week encouraged workers to signup and participate in health coaching program [40,41]. The health coaching program consisted of up tofour telephone sessions by a trained health coach at no cost to the worker. The focus of these sessionswas soft tissue injury prevention, dietary behaviors, physical activity and smoking cessation. Workerswere able to select which of these topics they would receive coaching for. Each day workers werereminded to sign up for health coaching and those who did sign up were put into a lottery to win aUSD$50 gift card to a large hardware-chain store.
2.4. Control Site Activities
For the control sites, all workers completed surveys at the same time intervals as the interventionsites. Workers were introduced to the study at an initial toolbox talk or at new worker orientation.They were also asked to complete surveys, at the same time intervals as the intervention sites. For thedata collection periods, a banner with the program’s logo was posted on the control group sites, similarto the intervention sites. No other information was provided, and no other activities were completedon control sites.
2.5. Worker Survey Data Collection
Workers completed surveys on-site at baseline—either at the initial work-site toolbox talk or atnew worker orientations for workers joining the site after the launch of the project. Workers alsocompleted surveys at two follow-up intervals, after completion of the StIPP program and one weekprior to health week (FU1), and six months after health week (FU2). Due to the flow of workers onsite, follow-up 1 occurred from 1 to 5 weeks post baseline survey. Baseline and FU1 surveys werecollected on site and FU2 was collected via mail delivery. Workers were incentivized with a USD$5 giftcard for completion of FU1 surveys, and USD$20 for FU2 surveys. The surveys contained questions
196
IJERPH 2018, 15, 2354
on perceived work environment, ergonomic practices, health behaviors and worker health outcomes.The baseline survey also contained additional sociodemographic questions. The primary outcomeswere health outcomes (pain and work limitations). Secondary worker proximal outcomes includedhealth behaviors and safety practices. Workers who consented to participate were tracked via phonecall or text to complete follow-up surveys at one (FU1) and six months (FU2) if they were no longer atthe original study site.
2.6. Primary and Secondary Outcome Measures
Musculoskeletal pain and injury was measured with items adapted from the Nordic MSK Paininstrument [42]. We examined the probability of a worker having a new incidence of pain and/orinjury at the follow-up time points using the question: “Have you needed to reduce or alter yourwork because of injury or musculoskeletal pain?” The questionnaire timeframe was adapted for thethree different surveys to allow us to capture a change in pain and/or injury incidence followingintervention roll-out. For baseline, the respondents were asked to answer the question with respect tolast 12 months. For FU1, this was since they started work on the control/intervention site, and for FU2,it was for the preceding 6 months. Pain (without injury) was measured by asking: “During the past3 months, have you had pain or aching in any of the areas shown on the diagram?”
Dietary behaviors were measured with three variables: “healthy diet”, “unhealthy diet”,and “dietary balance” at FU2 only [43,44]. Healthy diet was measured using six questions aboutthe weekly frequency with which participants consumed the following types of foods and beverages:fruits, 100% orange or grapefruit juice, other 100% fruit juices, vegetables, baked potatoes, and salad.Unhealthy diet was measured with questions on the weekly consumption of fried foods, sugaredsnacks, fast foods, and sugar-sweetened beverages. Dietary balance was calculated as the sum ofhealthy diet and unhealthy diet multiplied by negative one, so that positive dietary balance indicateda healthier diet and negative dietary balance indicated a less healthy diet.
Physical activity was measured using a modified version of the Centers for Disease Control andPrevention Behavioral Risk Factor and Surveillance System Physical Activity Measure at FU2 only [45].It included items on time spent walking and participating in both vigorous and moderate physicalactivities both at home and work during the last seven days.
Smoking status was categorized as a current smoker, former smoker, or never smoker [46]. Currentsmokers were those who currently smoke and have smoked at least 100 cigarettes in their lifetime.Former smokers were those who had smoked at least 100 cigarettes in their lifetime but do not currentlysmoke. Never smokers were those who had smoked less than 100 cigarettes and do not currentlysmoke. Current smokers were further differentiated according to the magnitude of their smokingbehavior, measured by smoking frequency, smoking quantity, and contemplation.
2.7. Other Variables Measured
Ergonomic Practices were measured using three items from Amick et al. [47]: “Ergonomicstrategies are used to improve the design of work”, “Ergonomic factors are considered in taskpre-planning and in purchasing new tools or equipment”, and “Ergonomic factors are considered insafety and health inspections”. These were rated on a 5-point scale ranging from 1 = strongly agree to5 = strongly disagree. Ergonomic practice items were coded for the analysis so that higher scores ofergonomic practices represented better ergonomic practices.
Work limitations were measured using the eight question short-form Work LimitationsQuestionnaire, which contained domains on time, physical, mental and interpersonal demands [48].Responses on a 5-point Likert scale were coded for the analysis so that higher values on the worklimitations scale represented more or higher work limitations.
Physically demanding job demands were measured by two ordinal variables stemming from thefollowing questions: “Please indicate how physically demanding your job is over the last 7 days”, on ascale ranging from 1 = “not at all physically demanding” to 5 = “extremely physically demanding”.
197
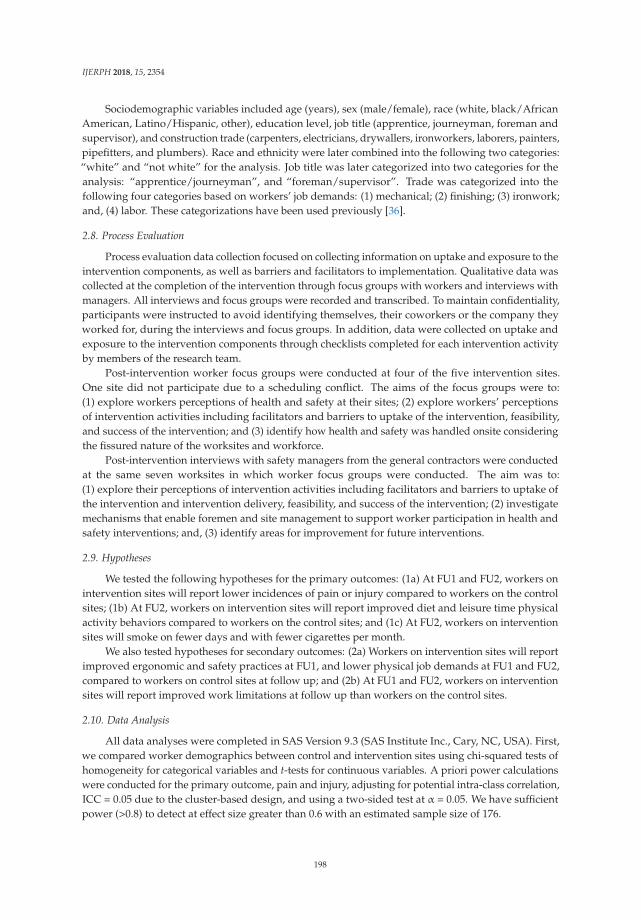
IJERPH 2018, 15, 2354
Sociodemographic variables included age (years), sex (male/female), race (white, black/AfricanAmerican, Latino/Hispanic, other), education level, job title (apprentice, journeyman, foreman andsupervisor), and construction trade (carpenters, electricians, drywallers, ironworkers, laborers, painters,pipefitters, and plumbers). Race and ethnicity were later combined into the following two categories:“white” and “not white” for the analysis. Job title was later categorized into two categories for theanalysis: “apprentice/journeyman”, and “foreman/supervisor”. Trade was categorized into thefollowing four categories based on workers’ job demands: (1) mechanical; (2) finishing; (3) ironwork;and, (4) labor. These categorizations have been used previously [36].
2.8. Process Evaluation
Process evaluation data collection focused on collecting information on uptake and exposure to theintervention components, as well as barriers and facilitators to implementation. Qualitative data wascollected at the completion of the intervention through focus groups with workers and interviews withmanagers. All interviews and focus groups were recorded and transcribed. To maintain confidentiality,participants were instructed to avoid identifying themselves, their coworkers or the company theyworked for, during the interviews and focus groups. In addition, data were collected on uptake andexposure to the intervention components through checklists completed for each intervention activityby members of the research team.
Post-intervention worker focus groups were conducted at four of the five intervention sites.One site did not participate due to a scheduling conflict. The aims of the focus groups were to:(1) explore workers perceptions of health and safety at their sites; (2) explore workers’ perceptionsof intervention activities including facilitators and barriers to uptake of the intervention, feasibility,and success of the intervention; and (3) identify how health and safety was handled onsite consideringthe fissured nature of the worksites and workforce.
Post-intervention interviews with safety managers from the general contractors were conductedat the same seven worksites in which worker focus groups were conducted. The aim was to:(1) explore their perceptions of intervention activities including facilitators and barriers to uptake ofthe intervention and intervention delivery, feasibility, and success of the intervention; (2) investigatemechanisms that enable foremen and site management to support worker participation in health andsafety interventions; and, (3) identify areas for improvement for future interventions.
2.9. Hypotheses
We tested the following hypotheses for the primary outcomes: (1a) At FU1 and FU2, workers onintervention sites will report lower incidences of pain or injury compared to workers on the controlsites; (1b) At FU2, workers on intervention sites will report improved diet and leisure time physicalactivity behaviors compared to workers on the control sites; and (1c) At FU2, workers on interventionsites will smoke on fewer days and with fewer cigarettes per month.
We also tested hypotheses for secondary outcomes: (2a) Workers on intervention sites will reportimproved ergonomic and safety practices at FU1, and lower physical job demands at FU1 and FU2,compared to workers on control sites at follow up; and (2b) At FU1 and FU2, workers on interventionsites will report improved work limitations at follow up than workers on the control sites.
2.10. Data Analysis
All data analyses were completed in SAS Version 9.3 (SAS Institute Inc., Cary, NC, USA). First,we compared worker demographics between control and intervention sites using chi-squared tests ofhomogeneity for categorical variables and t-tests for continuous variables. A priori power calculationswere conducted for the primary outcome, pain and injury, adjusting for potential intra-class correlation,ICC = 0.05 due to the cluster-based design, and using a two-sided test at α = 0.05. We have sufficientpower (>0.8) to detect at effect size greater than 0.6 with an estimated sample size of 176.
198
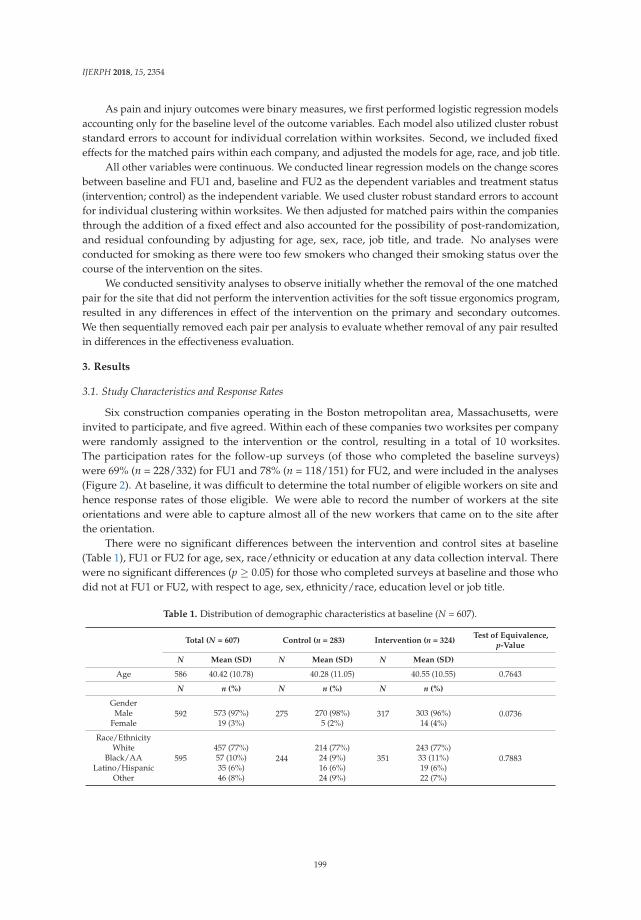
IJERPH 2018, 15, 2354
As pain and injury outcomes were binary measures, we first performed logistic regression modelsaccounting only for the baseline level of the outcome variables. Each model also utilized cluster robuststandard errors to account for individual correlation within worksites. Second, we included fixedeffects for the matched pairs within each company, and adjusted the models for age, race, and job title.
All other variables were continuous. We conducted linear regression models on the change scoresbetween baseline and FU1 and, baseline and FU2 as the dependent variables and treatment status(intervention; control) as the independent variable. We used cluster robust standard errors to accountfor individual clustering within worksites. We then adjusted for matched pairs within the companiesthrough the addition of a fixed effect and also accounted for the possibility of post-randomization,and residual confounding by adjusting for age, sex, race, job title, and trade. No analyses wereconducted for smoking as there were too few smokers who changed their smoking status over thecourse of the intervention on the sites.
We conducted sensitivity analyses to observe initially whether the removal of the one matchedpair for the site that did not perform the intervention activities for the soft tissue ergonomics program,resulted in any differences in effect of the intervention on the primary and secondary outcomes.We then sequentially removed each pair per analysis to evaluate whether removal of any pair resultedin differences in the effectiveness evaluation.
3. Results
3.1. Study Characteristics and Response Rates
Six construction companies operating in the Boston metropolitan area, Massachusetts, wereinvited to participate, and five agreed. Within each of these companies two worksites per companywere randomly assigned to the intervention or the control, resulting in a total of 10 worksites.The participation rates for the follow-up surveys (of those who completed the baseline surveys)were 69% (n = 228/332) for FU1 and 78% (n = 118/151) for FU2, and were included in the analyses(Figure 2). At baseline, it was difficult to determine the total number of eligible workers on site andhence response rates of those eligible. We were able to record the number of workers at the siteorientations and were able to capture almost all of the new workers that came on to the site afterthe orientation.
There were no significant differences between the intervention and control sites at baseline(Table 1), FU1 or FU2 for age, sex, race/ethnicity or education at any data collection interval. Therewere no significant differences (p ≥ 0.05) for those who completed surveys at baseline and those whodid not at FU1 or FU2, with respect to age, sex, ethnicity/race, education level or job title.
Table 1. Distribution of demographic characteristics at baseline (N = 607).
Total (N = 607) Control (n = 283) Intervention (n = 324)Test of Equivalence,
p-Value
N Mean (SD) N Mean (SD) N Mean (SD)
Age 586 40.42 (10.78) 40.28 (11.05) 40.55 (10.55) 0.7643
N n (%) N n (%) N n (%)
Gender592 275 317 0.0736Male 573 (97%) 270 (98%) 303 (96%)
Female 19 (3%) 5 (2%) 14 (4%)
Race/Ethnicity
595 244 351 0.7883White 457 (77%) 214 (77%) 243 (77%)
Black/AA 57 (10%) 24 (9%) 33 (11%)Latino/Hispanic 35 (6%) 16 (6%) 19 (6%)
Other 46 (8%) 24 (9%) 22 (7%)
199
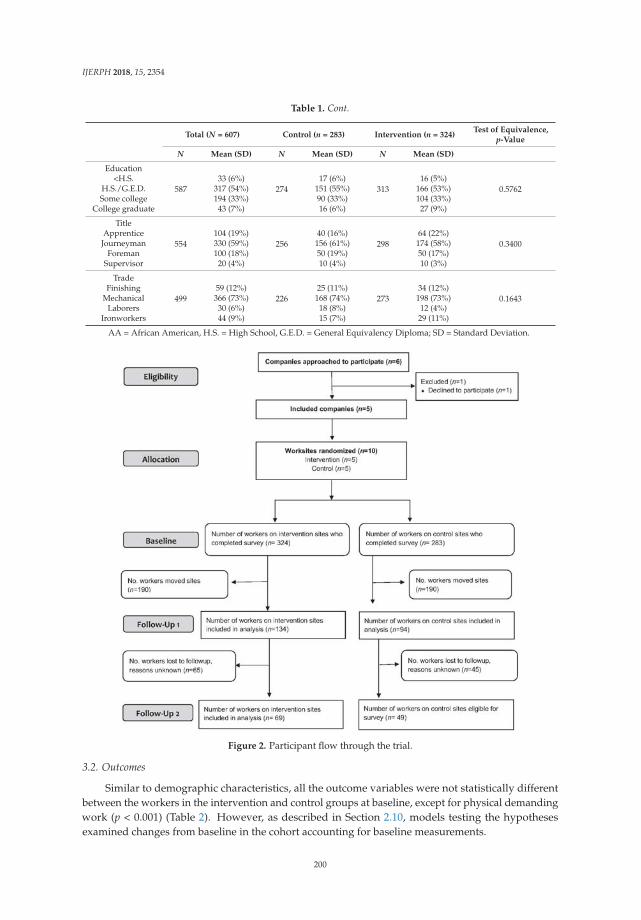
IJERPH 2018, 15, 2354
Table 1. Cont.
Total (N = 607) Control (n = 283) Intervention (n = 324)Test of Equivalence,
p-Value
N Mean (SD) N Mean (SD) N Mean (SD)
Education
587 274 313 0.5762<H.S. 33 (6%) 17 (6%) 16 (5%)
H.S./G.E.D. 317 (54%) 151 (55%) 166 (53%)Some college 194 (33%) 90 (33%) 104 (33%)
College graduate 43 (7%) 16 (6%) 27 (9%)
Title
554 256 298 0.3400Apprentice 104 (19%) 40 (16%) 64 (22%)
Journeyman 330 (59%) 156 (61%) 174 (58%)Foreman 100 (18%) 50 (19%) 50 (17%)
Supervisor 20 (4%) 10 (4%) 10 (3%)
Trade
499 226 273 0.1643Finishing 59 (12%) 25 (11%) 34 (12%)
Mechanical 366 (73%) 168 (74%) 198 (73%)Laborers 30 (6%) 18 (8%) 12 (4%)
Ironworkers 44 (9%) 15 (7%) 29 (11%)
AA = African American, H.S. = High School, G.E.D. = General Equivalency Diploma; SD = Standard Deviation.
Figure 2. Participant flow through the trial.
3.2. Outcomes
Similar to demographic characteristics, all the outcome variables were not statistically differentbetween the workers in the intervention and control groups at baseline, except for physical demandingwork (p < 0.001) (Table 2). However, as described in Section 2.10, models testing the hypothesesexamined changes from baseline in the cohort accounting for baseline measurements.
200
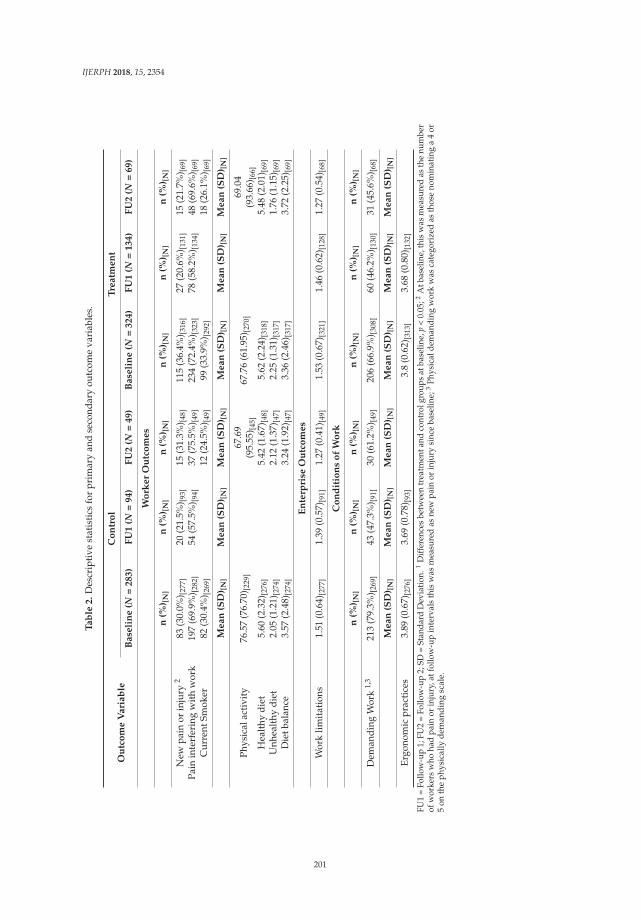
IJERPH 2018, 15, 2354
Ta
ble
2.
Des
crip
tive
stat
isti
csfo
rpr
imar
yan
dse
cond
ary
outc
ome
vari
able
s.
Ou
tco
me
Va
ria
ble
Co
ntr
ol
Tre
atm
en
t
Ba
seli
ne
(N=
28
3)
FU
1(N
=9
4)
FU
2(N
=4
9)
Ba
seli
ne
(N=
32
4)
FU
1(N
=1
34
)F
U2
(N=
69
)
Wo
rke
rO
utc
om
es
n(%
) [N
]n
(%) [
N]
n(%
) [N
]n
(%) [
N]
n(%
) [N
]n
(%) [
N]
New
pain
orin
jury
283
(30.
0%) [2
77]
20(2
1.5%
) [93]
15(3
1.3%
) [48]
115
(36.
4%) [3
16]
27(2
0.6%
) [131
]15
(21.
7%) [6
9]Pa
inin
terf
erin
gw
ith
wor
k19
7(6
9.9%
) [282
]54
(57.
5%) [9
4]37
(75.
5%) [4
9]23
4(7
2.4%
) [323
]78
(58.
2%) [1
34]
48(6
9.6%
) [69]
Cur
rent
Smok
er82
(30.
4%) [2
69]
12(2
4.5%
) [49]
99(3
3.9%
) [292
]18
(26.
1%) [6
9]
Me
an
(SD
) [N
]M
ea
n(S
D) [
N]
Me
an
(SD
) [N
]M
ea
n(S
D) [
N]
Me
an
(SD
) [N
]M
ea
n(S
D) [
N]
Phys
ical
acti
vity
76.5
7(7
6.70
) [229
]67
.69
(95.
55) [4
5]67
.76
(61.
95) [2
70]
69.0
4(9
3.66
) [66]
Hea
lthy
diet
5.60
(2.3
2)[2
76]
5.42
(1.6
7)[4
8]5.
62(2
.24)
[318
]5.
48(2
.01)
[69]
Unh
ealt
hydi
et2.
05(1
.21)
[274
]2.
12(1
.37)
[47]
2.25
(1.3
1)[3
17]
1.76
(1.1
5)[6
9]D
ietb
alan
ce3.
57(2
.48)
[274
]3.
24(1
.92)
[47]
3.36
(2.4
6)[3
17]
3.72
(2.2
5)[6
9]
En
terp
rise
Ou
tco
me
s
Wor
klim
itat
ions
1.51
(0.6
4)[2
77]
1.39
(0.5
7)[9
1]1.
27(0
.41)
[49]
1.53
(0.6
7)[3
21]
1.46
(0.6
2)[1
28]
1.27
(0.5
4)[6
8]
Co
nd
itio
ns
of
Wo
rk
n(%
) [N
]n
(%) [
N]
n(%
) [N
]n
(%) [
N]
n(%
) [N
]n
(%) [
N]
Dem
andi
ngW
ork
1,3
213
(79.
3%) [2
69]
43(4
7.3%
) [91]
30(6
1.2%
) [49]
206
(66.
9%) [3
08]
60(4
6.2%
) [130
]31
(45.
6%) [6
8]
Me
an
(SD
) [N
]M
ea
n(S
D) [
N]
Me
an
(SD
) [N
]M
ea
n(S
D) [
N]
Me
an
(SD
) [N
]M
ea
n(S
D) [
N]
Ergo
nom
icpr
acti
ces
3.89
(0.6
7)[2
76]
3.69
(0.7
8)[9
3]3.
8(0
.62)
[313
]3.
68(0
.80)
[132
]
FU1
=Fo
llow
-up
1;FU
2=
Follo
w-u
p2;
SD=
Stan
dard
Dev
iatio
n.1
Diff
eren
ces
betw
een
trea
tmen
tand
cont
rolg
roup
sat
base
line,
p<
0.05
;2A
tbas
elin
e,th
isw
asm
easu
red
asth
enu
mbe
rof
wor
kers
who
had
pain
orin
jury
,atf
ollo
w-u
pin
terv
als
this
was
mea
sure
das
new
pain
orin
jury
sinc
eba
selin
e;3
Phys
ical
dem
andi
ngw
ork
was
cate
gori
zed
asth
ose
nom
inat
ing
a4
or5
onth
eph
ysic
ally
dem
andi
ngsc
ale.
201
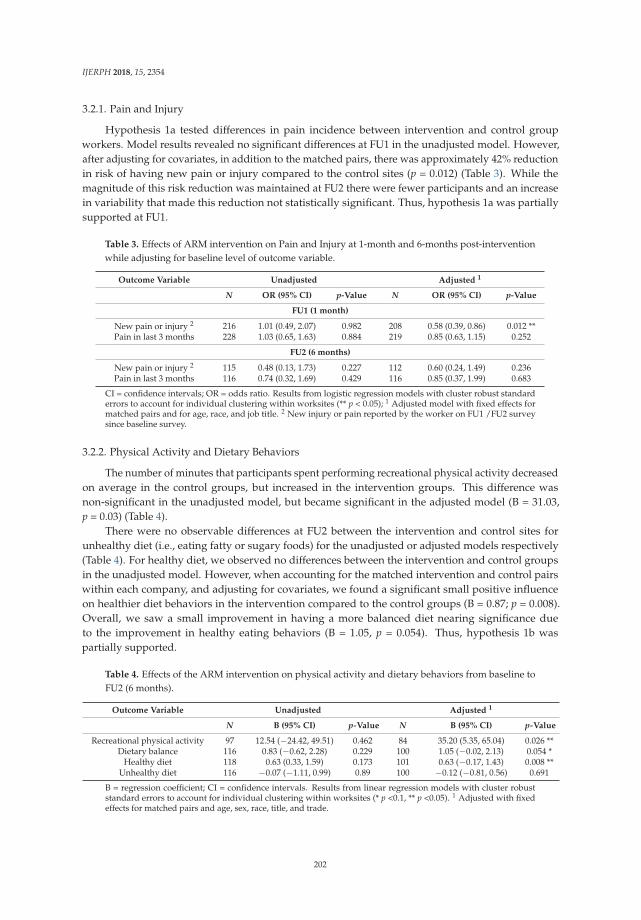
IJERPH 2018, 15, 2354
3.2.1. Pain and Injury
Hypothesis 1a tested differences in pain incidence between intervention and control groupworkers. Model results revealed no significant differences at FU1 in the unadjusted model. However,after adjusting for covariates, in addition to the matched pairs, there was approximately 42% reductionin risk of having new pain or injury compared to the control sites (p = 0.012) (Table 3). While themagnitude of this risk reduction was maintained at FU2 there were fewer participants and an increasein variability that made this reduction not statistically significant. Thus, hypothesis 1a was partiallysupported at FU1.
Table 3. Effects of ARM intervention on Pain and Injury at 1-month and 6-months post-interventionwhile adjusting for baseline level of outcome variable.
Outcome Variable Unadjusted Adjusted 1
N OR (95% CI) p-Value N OR (95% CI) p-Value
FU1 (1 month)
New pain or injury 2 216 1.01 (0.49, 2.07) 0.982 208 0.58 (0.39, 0.86) 0.012 **Pain in last 3 months 228 1.03 (0.65, 1.63) 0.884 219 0.85 (0.63, 1.15) 0.252
FU2 (6 months)
New pain or injury 2 115 0.48 (0.13, 1.73) 0.227 112 0.60 (0.24, 1.49) 0.236Pain in last 3 months 116 0.74 (0.32, 1.69) 0.429 116 0.85 (0.37, 1.99) 0.683
CI = confidence intervals; OR = odds ratio. Results from logistic regression models with cluster robust standarderrors to account for individual clustering within worksites (** p < 0.05); 1 Adjusted model with fixed effects formatched pairs and for age, race, and job title. 2 New injury or pain reported by the worker on FU1 /FU2 surveysince baseline survey.
3.2.2. Physical Activity and Dietary Behaviors
The number of minutes that participants spent performing recreational physical activity decreasedon average in the control groups, but increased in the intervention groups. This difference wasnon-significant in the unadjusted model, but became significant in the adjusted model (B = 31.03,p = 0.03) (Table 4).
There were no observable differences at FU2 between the intervention and control sites forunhealthy diet (i.e., eating fatty or sugary foods) for the unadjusted or adjusted models respectively(Table 4). For healthy diet, we observed no differences between the intervention and control groupsin the unadjusted model. However, when accounting for the matched intervention and control pairswithin each company, and adjusting for covariates, we found a significant small positive influenceon healthier diet behaviors in the intervention compared to the control groups (B = 0.87; p = 0.008).Overall, we saw a small improvement in having a more balanced diet nearing significance dueto the improvement in healthy eating behaviors (B = 1.05, p = 0.054). Thus, hypothesis 1b waspartially supported.
Table 4. Effects of the ARM intervention on physical activity and dietary behaviors from baseline toFU2 (6 months).
Outcome Variable Unadjusted Adjusted 1
N B (95% CI) p-Value N B (95% CI) p-Value
Recreational physical activity 97 12.54 (−24.42, 49.51) 0.462 84 35.20 (5.35, 65.04) 0.026 **Dietary balance 116 0.83 (−0.62, 2.28) 0.229 100 1.05 (−0.02, 2.13) 0.054 *
Healthy diet 118 0.63 (0.33, 1.59) 0.173 101 0.63 (−0.17, 1.43) 0.008 **Unhealthy diet 116 −0.07 (−1.11, 0.99) 0.89 100 −0.12 (−0.81, 0.56) 0.691
B = regression coefficient; CI = confidence intervals. Results from linear regression models with cluster robuststandard errors to account for individual clustering within worksites (* p <0.1, ** p <0.05). 1 Adjusted with fixedeffects for matched pairs and age, sex, race, title, and trade.
202
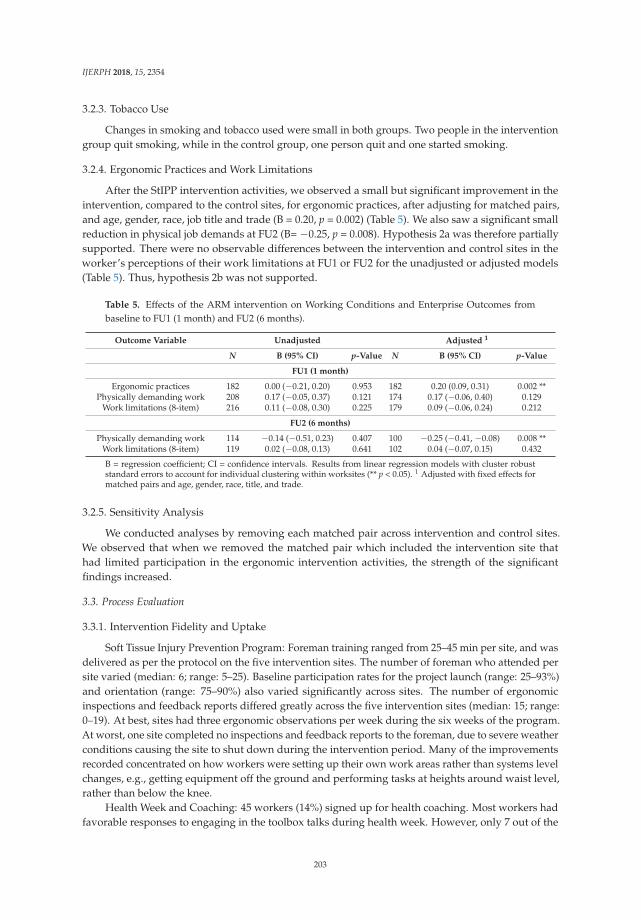
IJERPH 2018, 15, 2354
3.2.3. Tobacco Use
Changes in smoking and tobacco used were small in both groups. Two people in the interventiongroup quit smoking, while in the control group, one person quit and one started smoking.
3.2.4. Ergonomic Practices and Work Limitations
After the StIPP intervention activities, we observed a small but significant improvement in theintervention, compared to the control sites, for ergonomic practices, after adjusting for matched pairs,and age, gender, race, job title and trade (B = 0.20, p = 0.002) (Table 5). We also saw a significant smallreduction in physical job demands at FU2 (B= −0.25, p = 0.008). Hypothesis 2a was therefore partiallysupported. There were no observable differences between the intervention and control sites in theworker’s perceptions of their work limitations at FU1 or FU2 for the unadjusted or adjusted models(Table 5). Thus, hypothesis 2b was not supported.
Table 5. Effects of the ARM intervention on Working Conditions and Enterprise Outcomes frombaseline to FU1 (1 month) and FU2 (6 months).
Outcome Variable Unadjusted Adjusted 1
N B (95% CI) p-Value N B (95% CI) p-Value
FU1 (1 month)
Ergonomic practices 182 0.00 (−0.21, 0.20) 0.953 182 0.20 (0.09, 0.31) 0.002 **Physically demanding work 208 0.17 (−0.05, 0.37) 0.121 174 0.17 (−0.06, 0.40) 0.129
Work limitations (8-item) 216 0.11 (−0.08, 0.30) 0.225 179 0.09 (−0.06, 0.24) 0.212
FU2 (6 months)
Physically demanding work 114 −0.14 (−0.51, 0.23) 0.407 100 −0.25 (−0.41, −0.08) 0.008 **Work limitations (8-item) 119 0.02 (−0.08, 0.13) 0.641 102 0.04 (−0.07, 0.15) 0.432
B = regression coefficient; CI = confidence intervals. Results from linear regression models with cluster robuststandard errors to account for individual clustering within worksites (** p < 0.05). 1 Adjusted with fixed effects formatched pairs and age, gender, race, title, and trade.
3.2.5. Sensitivity Analysis
We conducted analyses by removing each matched pair across intervention and control sites.We observed that when we removed the matched pair which included the intervention site thathad limited participation in the ergonomic intervention activities, the strength of the significantfindings increased.
3.3. Process Evaluation
3.3.1. Intervention Fidelity and Uptake
Soft Tissue Injury Prevention Program: Foreman training ranged from 25–45 min per site, and wasdelivered as per the protocol on the five intervention sites. The number of foreman who attended persite varied (median: 6; range: 5–25). Baseline participation rates for the project launch (range: 25–93%)and orientation (range: 75–90%) also varied significantly across sites. The number of ergonomicinspections and feedback reports differed greatly across the five intervention sites (median: 15; range:0–19). At best, sites had three ergonomic observations per week during the six weeks of the program.At worst, one site completed no inspections and feedback reports to the foreman, due to severe weatherconditions causing the site to shut down during the intervention period. Many of the improvementsrecorded concentrated on how workers were setting up their own work areas rather than systems levelchanges, e.g., getting equipment off the ground and performing tasks at heights around waist level,rather than below the knee.
Health Week and Coaching: 45 workers (14%) signed up for health coaching. Most workers hadfavorable responses to engaging in the toolbox talks during health week. However, only 7 out of the
203
IJERPH 2018, 15, 2354
45 workers who signed up for health coaching participated in the first phone call, and only threecompleted four weeks of health coaching.
Workers signed up for health coaching for dietary behaviors, physical activity and smokingcessation. No workers signed up for coaching on soft tissue injury prevention. Qualitatively, workersreported getting benefit from the smoking cessation toolbox talks. Providing NRT kits was popular;however, due to privacy issues and poor follow-up rates, we were unable to link the NRT distributionto the surveys and effects on smoking quit rates. One worker reported: “I think tobacco was good forme and my guys. Most of them smoke, so I think it was good for them. The NRT inspired some ofthe workers to give quitting a try.” Other topics of interest raised in the focus groups included stressmanagement, alcohol consumption and appropriate pain management.
There were no adverse events reported by the participants for participating in either StIPP orHealth Week.
3.3.2. Barriers to Intervention Implementation
Based on key informant interviews on the intervention sites, while indicating it was good to havethe ergonomics inspections and topics at the forefront of the workers’ and subcontractors’ activities,workers mentioned a number of barriers to fully implementing the intervention.
Fissured workplace issues: A key barrier was the capability of subcontractor companies to makechanges in working conditions. While the program trained the foreman of the subcontractors with afocus on pre-task planning, the subcontractors did not have the systems in place or the available toolsto assist in changing the working conditions.
Production pressures and unpredictable schedules: The site that conducted no ergonomicsinspections had large production pressures as the construction schedule was delayed significantlydue to unusual winter weather. For example, one safety manager observed that production pressurescould be a driving factor: “I think it’s the schedules . . . Because they rush around, it’s hard for them totake a step back and really evaluate how they’re doing things. They’re just trying to do it as quicklyas possible.”
Management support and worker buy-in: Focus group participants and key informants reportedthat programs needed buy-in and support from upper management for interventions to be successful.This is especially true with respect to training and data collection which, by necessity, must beconducted on the worksite during working hours. For instance, general contractors could allowfor extra training related to the ARM program and build it into the contracts of the subcontractors.That way, the time needed for training purposes and intervention delivery would be agreed to aheadof time and budgeted into the contracts signed by both parties. To illustrate this point, one safetymanager noted: “A health and safety program would have a lot more buy-in and success on a site if itwas written into the contract... An owner or GC [general contractor] would have to financially supportthe program running on their site.”
4. Discussion
The goal of this study was to evaluate the efficacy of a construction worksite-based integratedintervention targeting both the conditions of work, and workers’ health behaviors, simultaneously.We observed short-term improvements in ergonomic practices and in incidences of pain and injuryafter an injury prevention program. We also observed an improvement in physical activity andhealthier dietary behaviors, such as increased consumption of fruits and vegetables, after a healthpromotion Health Week program.
At the individual level, we found a significant improvement in ergonomic practices, and areduction in incidences of pain and injury, which supported the hypothesized pathways for theprogram. As promoted by NIOSH, ergonomic practices focus on workers modifying or establishingwork procedures to reduce the risk of injuries [39,49]. While we did not quantify exposure tospecific ergonomic hazards, the StIPP focused on workers’ setting up their work more ergonomically.
204
IJERPH 2018, 15, 2354
For example, working at knuckle level instead of on the ground, and using appropriate tools toreduce extreme postures associated with overhead work and manual materials handling. The programtargeted the conditions of work directly controlled by the workers themselves (Figure 2) [7]. Givingsuch control to workers is important in reducing disability, as it gives workers opportunities to adapttheir work in order to better manage their own musculoskeletal symptoms and health [50,51].
While we were encouraged that an improvement in ergonomics practices occurred, results alsoindicated that the program was not successful at addressing system level components. For example,while we saw ergonomics practices improve, we saw no significant change in the physical demands onthe workers. Hence, we suspect that the intervention changed the way people completed their workbut had limited effect on the physical demands of the job. In addition, the process evaluation revealedseveral important barriers and facilitators to our program at the organizational level. First, managementand worker buy-in were identified to be integral to the success of the soft tissue injury preventionprogram. This was perceived to be key in a work environment that is fast-paced, unpredictable,and with tight production schedules tied to the requirements of the general contractor. For example,there was little time to complete task preplanning or for the safety manager to complete inspectionprotocols for injury hazards and ergonomic solutions. When management support for health andsafety programs is not observed by the workers, other competing factors are often prioritized overhealth and safety, especially ergonomic practices [52]. This was quite evident on one site which hadmajor delays due to the winter storms of 2015 in the Boston metropolitan area. Due to the loss ofalmost a month of production, competing safety and schedule priorities would supersede programdelivery. Similar challenges to program delivery have been reported by others in the constructionindustry [53].
While we have had past success with a worksite safety program integrated within the complexstructure associated with multiple employers, a large barrier to a systems approach ergonomicsprogram was the challenge faced by subcontractors to make changes, even those changes that couldimprove site safety on their own worksite. Unlike our previous program that was designed tore-enforce existing safety practices [36], the ARM program required subcontractors to implementnew, or modify existing practices and tools, that may be specific to their trade. Our program focusedon simple ergonomics solutions that individual workers could implement to their own work [39].However, more complex or system-level changes would require the involvement of multiple groups orstakeholders [54]. Ergonomics solutions in a fissured workplace require all site employers to take onelements of the program to effectively and systematically influence the overall conditions of work [17].
Moreover, system-level changes require better upfront planning before construction begins, suchas during the bidding process for a job by setting out requirements from the multiple employers, and inthe contracts for the jobs. The key informant interviews supported this concept. Expectations regardingsafety programs in the contract is standard procedure in larger projects, especially owner-insuredprograms. An example is with respect to safety training, in which owners, especially public entities,require that construction workers have a minimum of OSHA-10 training to be onsite [55]. Whilstothers require their contracting companies complete safety prequalification safety surveys, or havewritten safety management programs. Thus, including ergonomics in the contractual language mayset up better expectations for a program.
Other researchers in the construction industry have also found mixed findings with respectto improvements in pain and injury and perceived physical effort after implementing ergonomicinterventions, including participatory ergonomics programs [33,56–58]. In these studies, reasons forintervention failure were generally associated with the intervention not being delivered as intended orimplemented at all of the sites [28,57]. In our study, intervention delivery occurred as per the protocolin four of the five sites during the intervention period. However, since the ergonomics programstopped after six weeks and workers often moved from sites before the follow-up data collection wascompleted, we also attributed this to our loss of significance at the six-month follow-up. Although we
205
IJERPH 2018, 15, 2354
observed that on average the reduction in pain and injury incidences, and improvements in ergonomicpractices were maintained, there was reduction in power due to loss to follow up.
In contrast, the Health Week had many successes in overcoming some of these barriers associatedwith the multiemployer structure. For one, it simply required the participation of the workers andlittle, if any, infrastructure. In theory, the Health Week might have addressed some conditions ofwork regarding psychosocial factors around health, like supervisor or co-worker support. Anecdotally,we observed foremen and co-workers being supportive of ensuring their co-workers signed up forhealth coaching or NRT. Some foremen would cover for their workers to allow them to participatein the week’s activities. We also observed workers talking about eating healthier food with theircoworkers during the week.
Another major strength of the Health Week was how it aligned with companies’ current practiceson the worksite and also with the interests and goals of the workers. This was also found in previousformative work we completed that found that policies, programs and practices are supported bymanagement and workers alike if they can be easily integrated into company’s business structures andalign with workers’ goals and needs [59,60]. Health Week was in a familiar format for the workersand companies alike. We modelled Health Week after the industry’s standard practice of safety weekwhere contractors have a specific theme and perform a series of outreach activities for workers toprovide information on resources and best practices. Thus, due to the familiar format, workers mayhave been more receptive to the daily topics. Although the uptake on NRT and individualized healthcoaching was low, we did see improvements in workers’ health behaviors, including higher intake offruits and vegetables, and increased amount of time per week engaged in recreational physical activity.This finding is similar to the results of a health promotion intervention conducted in the Netherlands,which found that onsite group coaching sessions resulted in changes in physical activity, and dietarybehaviors, but did not improve musculoskeletal symptoms [61].
Methodological Considerations
Research in construction has challenges with loss to follow up due to the dynamic nature ofconstruction with workers coming and going on worksites as the construction job requires specifictrades during the timeline of the study [18,36]. The issue of poor follow-up rates can lead to bias;however, usually towards the null [62]. This is predominately due to the itinerant nature of constructionworkers [18]. This resulted in our analyses at FU2 being underpowered for some of our outcomes(such as pain and injury) where the effect size was similar to FU1. Similar findings have been found inrelated interventions [63].
Another challenge was the success of integrating the injury prevention and health promotionactivities in this environment. Integration was achieved by linking the two programs by name and keymessaging in the planning and implementation phases. In addition, messaging around Health Weekincluded training on both injury prevention and health promotion giving workers the tools to improvetheir working conditions, as well as giving them control for their health. The ergonomics programprior to Health Week did have health messaging but without any specific health promotion activities.
One limitation was that our intervention depended on the participation of the general contractorsafety managers, whose involvement and dedication to the study varied across sites and betweengeneral contractors. This aspect of the intervention was by design, as we considered it important forintegration and sustainability into current company processes, that the ergonomics inspections wereperformed by the safety managers. Giving the safety managers latitude to decide how invested theywere in the program allowed us to assess the feasibility of the intervention being adopted without theaid of study staff. This would ensure that our observations were realistic and representative of barriersand facilitators to the intervention’s delivery by non-study staff.
Further, this study involved worksites in commercial construction only. Thus, the results may notbe generalizable to other types of construction (i.e., residential or industrial). However, commercialconstruction accounts for a large portion of U.S. construction activities, and represents an important
206
IJERPH 2018, 15, 2354
area for injury prevention research. Similarly, the construction workforce in the Boston metropolitanarea may not be representative of commercial construction workers in other parts of the country orworld, where work practices, demographics, and union membership differ.
Despite these limitations, our study had several strengths, most notably the study design andthe wide variety of general contractors and sites recruited into the study. The cluster randomizedcontrol trial design is a novel approach in commercial construction. Typically, approaches toimprove the health and safety of construction workers have often focused on the individual worker,targeting workers when they are enrolled in apprentice programs [64,65], targeting workers throughsocial media campaigns via posters at worksites and/or brochures sent to union members [66,67],and engineering controls for specific tasks [68]. However, best practice involves system-levelapproaches that comprehensively address workplace systems relevant to the control of hazardsand worker safety, health, and well-being [20]. This study was fortunate to be able to recruit fivemajor general contractors operating in the Boston metropolitan area and gain access to ten differentconstruction sites for the purpose of evaluating the ARM intervention. Furthermore, delivering theintervention through mid-level managers (through a combination of the general contractor safetymanagers and subcontractor foremen) was a strength of the study. This focused intervention efforts onthose who were in the best positions to make changes to the conditions of work.
The ergonomics inspection and communication protocol provided a method to identify broadareas for improving ergonomics in the dynamic construction work environment. It is important tounderstand the challenges and successes of intervention delivery in order to inform and improve futureworksite-based interventions. It appears that the largest barriers to the success of the intervention werethe inability of subcontractors to make changes to their worksite and the variability in the involvementand dedication to the study across different worksites and general contractors. These are real-world,as well as research study challenges. Subcontractors did not have the systems in place, or the availabletools, to assist in changing their working conditions. Competing safety and production prioritiesalso influenced the level of management commitment to the study. Additionally, construction safetyresearch may have broader implications for an increasing number of industries that are becoming asdynamic and variable as construction, as more services once housed in a single facility are outsourcedto multiple employers [17].
5. Conclusions
The ARM program had a positive impact at the individual level on the worksites that implementedthe program. The trial saw improved ergonomics practices, as well as, reduction in new pain andinjury, and improved diet and physical activity, as reported by the workers. A number of obstacleswere encountered which made integrating a health promotion and injury prevention interventioninto the multi-employer, outcome-driven, dynamic work environment challenging. Process trackingsuggested that our intervention had less impact at the systems/organizational level in terms ofchanging organizational programs and practices, due to the complex organizational structures on site.For the longer term, more organizations in the multiple employer environment should be involved inthe implementation to facilitate more upstream changes.
Author Contributions: Conceptualization, J.T.D., C.A.O. and M.P.G.; Methodology, J.T.D., C.A.O. and M.P.G.;Formal Analysis, S.E.P., J.M., J.R.; Investigation, J.T.D., M.P.G. and C.A.O.; Resources, J.T.D.; Data Curation, M.P.G.;Writing—Original Draft Preparation, S.E.P.; Writing—Review & Editing, S.E.P., J.T.D., M.P.G., J.R., J.M. and C.A.O.;Visualization, S.E.P. and J.T.D.; Project Administration, J.T.D.; Funding Acquisition, J.T.D., C.A.O. and J.M.
Funding: This research was funded by a grant from the National Institute for Occupational Safety and Health(NIOSH) for the Center for Work, Health and Well-being at the Harvard T.H. Chan School of Public Health, grantnumber U19 OH008861. Additional funding was provided by the NIOSH Education and Research Center at theHarvard Chan School, grant number T42OH008416.
Acknowledgments: The authors thank Glorian Sorensen, Greg Wagner, Jeffrey Katz, Emily Sparer, KristinIronside, Andrea Sheldon, Kincaid Lowe, and Mia Goldwasser from the Harvard T.H. Chan School of Public
207
IJERPH 2018, 15, 2354
Health Center for Work, Health, and Wellbeing. The authors also provide a special and extra thank you to all ofour construction company partners in the Boston metropolitan area.
Conflicts of Interest: The authors declare no conflict of interest. The funders had no role in the design of thestudy; in the collection, analyses, or interpretation of data; in the writing of the manuscript, or in the decision topublish the results.
References
1. Bush, D.M.; Lipari, R.N. The CBHSQ Report: Short Report—Substance Use and Substance Use Disorder byIndustry; Substance Abuse and Mental Health Services Administration: Rockville, MD, USA, 2015.
2. The Center for Construction Research and Training. The Construction Chart Book. The U.S. ConstructionIndustry and Its Workers, 6th ed.; The Center for Construction Research and Training: Silver Spring, MD,USA, 2018.
3. Punnett, L.; Warren, N.; Henning, R.; Nobrega, S.; Cherniack, M. CPH-NEW Research Team. Participatoryergonomics as a model for integrated programs to prevent chronic disease. J. Occup. Environ. Med. 2013, 55,S19–S24. [CrossRef] [PubMed]
4. Caban-Martinez, A.J.; Lowe, K.A.; Herrick, R.; Kenwood, C.; Gagne, J.J.; Becker, J.F.; Schneider, S.P.;Dennerlein, J.T.; Sorensen, G. Construction workers working in musculoskeletal pain and engaging inleisure-time physical activity: Findings from a mixed-methods pilot study. Am. J. Ind. Med. 2014, 57, 819–825.[CrossRef] [PubMed]
5. Umer, W.; Antwi-Afari, M.F.; Li, H.; Szeto, G.P.Y.; Wong, A.Y.L. The prevalence of musculoskeletal symptomsin the construction industry: A systematic review and meta-analysis. Int. Arch. Occup. Environ. Health 2018,91, 125–144. [CrossRef] [PubMed]
6. Pronk, N.P.; McLellan, D.L.; McGrail, M.P.; Olson, S.M.; McKinney, Z.J.; Katz, J.N.; Wagner, G.R.; Sorensen, G.Measurement tools for integrated worker health protection and promotion: Lessons learned from theSafewell Project. J. Occup. Environ. Med. 2016, 58, 651–658. [CrossRef] [PubMed]
7. Sorensen, G.; McLellan, D.L.; Sabbath, E.L.; Dennerlein, J.T.; Nagler, E.M.; Hurtado, D.A.; Pronk, N.P.;Wagner, G.R. Integrating worksite health protection and health promotion: A conceptual model forintervention and research. Prev. Med. 2016, 91, 188–196. [CrossRef] [PubMed]
8. McLellan, D.; Moore, W.; Nagler, E.; Sorensen, G. Implementing an Integrated Approach Weaving Worker Health,Safety, and Well-being into the Fabric of Your Organization; Harvard Center for Work, Health and Wellbeing:Boston, MA, USA, 2017; pp. 1–141.
9. Bureau of Labor Statistics. Nonfatal Occupational Injuries and Illnesses Requiring Days Away from Work.Available online: https://www.bls.gov/news.release/osh2.toc.htm (accessed on 1 June 2018).
10. Viester, L.; Verhagen, E.; Bongers, P.M.; van der Beek, A.J. Effectiveness of a Worksite Intervention for MaleConstruction Workers on Dietary and Physical Activity Behaviors, Body Mass Index, and Health Outcomes:Results of a Randomized Controlled Trial. Am. J. Health Promot. 2018, 32, 795–805. [CrossRef] [PubMed]
11. Robroek, S.J.W.; Jarvholm, B.; van der Beek, A.J.; Proper, K.I.; Wahlstrom, J.; Burdorf, A. Influence ofobesity and physical workload on disability benefits among construction workers followed up for 37 years.Occup. Environ. Med. 2017, 74, 621–627. [CrossRef] [PubMed]
12. Viester, L.; Verhagen, E.A.; Oude Hengel, K.M.; Koppes, L.L.; van der Beek, A.J.; Bongers, P.M.The relation between body mass index and musculoskeletal symptoms in the working population.BMC Musculoskelet. Disord. 2013, 14, 238. [CrossRef] [PubMed]
13. Dietz, A.; Ramroth, H.; Urban, T.; Ahrens, W.; Becher, H. Exposure to cement dust, related occupationalgroups and laryngeal cancer risk: Results of a population based case-control study. Int. J. Cancer 2004, 108,907–911. [CrossRef] [PubMed]
14. Kurihara, N.; Wada, O. Silicosis and smoking strongly increase lung cancer risk in silica-exposed workers.Ind. Health 2004, 42, 303–314. [CrossRef] [PubMed]
15. Lee, P.N. Relation between exposure to asbestos and smoking jointly and the risk of lung cancer.Occup. Environ. Med. 2001, 58, 145–153. [CrossRef] [PubMed]
16. Institute of Medicine and National Research Council. Musculoskeletal Disorders and the Workplaces: LowBack and Upper Extremities; The National Academies Press: Washington, DC, USA, 2001; pp. 1–512.ISBN 978-0-309-13200-2.
208
IJERPH 2018, 15, 2354
17. Weil, D. The Fissured Workplace: Why Work Became So Bad for So Many and What Can Be Done to Improve it;Harvard University Press: Cambridge, MA, USA, 2014; pp. 1–424. ISBN 9780674975446.
18. Sparer, E.H.; Herrick, R.F.; Dennerlein, J.T. Development of a safety communication and recognition programfor construction. New Solut. 2015, 25, 42–58. [CrossRef] [PubMed]
19. Breslin, F.C.; Smith, P. Trial by fire: A multivariate examination of the relation between job tenure and workinjuries. Occup. Environ. Med. 2006, 63, 27–32. [CrossRef] [PubMed]
20. Sorensen, G.; Barbeau, E.M. Integrating occupational health, safety and worksite health promotion:Opportunities for research and practice. Med. Lav. 2006, 97, 240–257. [PubMed]
21. Magnavita, N. Obstacles and future prospects: Considerations on health promotion activities for olderworkers in Europe. Int. J. Environ. Res. Public Health 2018, 15, 662. [CrossRef] [PubMed]
22. Bradley, C.J.; Grossman, D.C.; Hubbard, R.A.; Ortega, A.N.; Curry, S.J. integrated interventions for improvingtotal worker health: A panel report from the national institutes of health pathways to prevention workshop:Total Worker Health-What’s work got to do with it? Ann. Intern. Med. 2016, 165, 279–283. [CrossRef][PubMed]
23. De Boer, A.G.; Burdorf, A.; van Duivenbooden, C.; Frings-Dresen, M.H. The effect of individual counsellingand education on work ability and disability pension: A prospective intervention study in the constructionindustry. Occup. Environ. Med. 2007, 64, 792–797. [CrossRef]
24. Okechukwu, C.A.; Krieger, N.; Chen, J.; Sorensen, G.; Li, Y.; Barbeau, E.M. The association of workplacehazards and smoking in a U.S. multiethnic working-class population. Public Health Rep. 2010, 125, 225–233.[CrossRef] [PubMed]
25. Oude Hengel, K.M.; Blatter, B.M.; Joling, C.I.; van der Beek, A.J.; Bongers, P.M. Effectiveness of anintervention at construction worksites on work engagement, social support, physical workload, and need forrecovery: Results from a cluster randomized controlled trial. BMC Public Health 2012, 12, 1008. [CrossRef][PubMed]
26. Okechukwu, C.A.; Krieger, N.; Sorensen, G.; Li, Y.; Barbeau, E.M. MassBuilt: Effectiveness ofan apprenticeship site-based smoking cessation intervention for unionized building trades workers.Cancer Cause. Control 2009, 20, 887–894. [CrossRef] [PubMed]
27. Saarela, K.L. A poster campaign for improving safety on shipyard scaffolds. J. Saf. Res. 1989, 20, 177–185.[CrossRef]
28. Van der Molen, H.F.; Basnet, P.; Hoonakker, P.L.; Lehtola, M.M.; Lappalainen, J.; Frings-Dresen, M.H.;Haslam, R.; Verbeek, J.H. Interventions to prevent injuries in construction workers. Cochrane DatabaseSyst. Rev. 2018, 2, CD006251. [CrossRef] [PubMed]
29. Bena, A.; Berchialla, P.; Coffano, M.E.; Debernardi, M.L.; Icardi, L.G. Effectiveness of the training program forworkers at construction sites of the high-speed railway line between Torino and Novara: Impact on injuryrates. Am. J. Ind. Med. 2009, 52, 965–972. [CrossRef] [PubMed]
30. Caban-Martinez, A.J.; Moore, K.J.; Clarke, T.C.; Davila, E.P.; Clark, J.D.; Lee, D.J.; Fleming, L.E. HealthPromotion at the Construction Work Site: The Lunch Truck Pilot Study. Workplace Health Saf. 2018. [CrossRef][PubMed]
31. Lingard, H.; Rowlinson, S. Behavior-based safety management in Hong Kong’s construction industry.J. Saf. Res. 1997, 28, 243–256. [CrossRef]
32. Wickizer, T.M.; Kopjar, B.; Franklin, G.; Joesch, J. Do drug-free workplace programs prevent occupationalinjuries? Evidence from Washington State. Health Serv. Res. 2004, 39, 91–110. [CrossRef] [PubMed]
33. Van der Molen, H.F.; Sluiter, J.K.; Hulshof, C.T.; Vink, P.; van Duivenbooden, C.; Holman, R.;Frings-Dresen, M.H. Implementation of participatory ergonomics intervention in construction companies.Scand. J. Work Environ. Health 2005, 31, 191–204. [CrossRef] [PubMed]
34. Hess, J.A.; Hecker, S.; Weinstein, M.; Lunger, M. A participatory ergonomics intervention to reduce riskfactors for low-back disorders in concrete laborers. Appl. Ergon. 2004, 35, 427–441. [CrossRef] [PubMed]
35. Sorensen, G.; McLellan, D.; Dennerlein, J.T.; Pronk, N.P.; Allen, J.D.; Boden, L.I.; Okechukwu, C.A.;Hashimoto, D.; Stoddard, A.; Wagner, G.R. Integration of health protection and health promotion: Rationale,indicators, and metrics. J. Occup. Environ. Med. 2013, 55, S12–S18. [CrossRef] [PubMed]
36. Sparer, E.H.; Catalano, P.J.; Herrick, R.F.; Dennerlein, J.T. Improving safety climate through a communicationand recognition program for construction: A mixed methods study. Scand. J. Work Environ. Health 2016, 42,329–337. [CrossRef] [PubMed]
209
IJERPH 2018, 15, 2354
37. Sparer, E.H.; Okechukwu, C.A.; Manjourides, J.; Herrick, R.F.; Katz, J.N.; Dennerlein, J.T. Length of timespent working on a commercial construction site and the associations with worker characteristics. Am. J.Ind. Med. 2015, 58, 964–973. [CrossRef] [PubMed]
38. American National Standards Institute. ANSI Essential Requirements: Due Process Requirements for AmericanNational Standards; American National Standards Institute: New York, NY, USA, 2012; pp. 1–27.
39. The National Institute for Occupational Safety and Health. Simple Solutions: Ergonomics for ConstructionWorkers. DHHS (NIOSH) Publication No. 2007-122. Available online: https://www.cdc.gov/niosh/docs/2007-122/default.html (accessed on 1 June 2018).
40. Oude Hengel, K.M.; Joling, C.I.; Proper, K.I.; Blatter, B.M.; Bongers, P.M. A worksite prevention program forconstruction workers: Design of a randomized controlled trial. BMC Public Health 2010, 10, 336. [CrossRef][PubMed]
41. Viester, L.; Verhagen, E.A.; Proper, K.I.; van Dongen, J.M.; Bongers, P.M.; van der Beek, A.J. VIP inconstruction: Systematic development and evaluation of a multifaceted health programme aiming toimprove physical activity levels and dietary patterns among construction workers. BMC Public Health 2012,12, 89. [CrossRef] [PubMed]
42. Kuorinka, I.; Jonsson, B.; Kilbom, A.; Vinterberg, H.; Biering-Sorensen, F.; Andersson, G.; Jorgensen, K.Standardized Nordic Questionnaires for the analysis of musculoskeletal symptoms. Appl. Ergon. 1987, 18,233–237. [CrossRef]
43. Harley, A.E.; Yang, M.; Stoddard, A.M.; Adamkiewicz, G.; Walker, R.; Tucker-Seeley, R.D.; Allen, J.D.;Sorensen, G. Patterns and Predictors of Health Behaviors Among Racially/Ethnically Diverse Residents ofLow-Income Housing Developments. Am. J. Health Promot. 2014, 29, 59–67. [CrossRef] [PubMed]
44. Prochaska, J.J.; Velicer, W.F.; Nigg, C.R.; Prochaska, J.O. Methods of quantifying change in multiple riskfactor interventions. Prev. Med. 2008, 46, 260–265. [CrossRef] [PubMed]
45. Pierannunzi, C.; Hu, S.S.; Balluz, L. A systematic review of publications assessing reliability and validity ofthe Behavioral Risk Factor Surveillance System (BRFSS), 2004–2011. BMC Med. Res. Methodol. 2013, 13, 49.[CrossRef] [PubMed]
46. Cigarette Smoking among Adults—United States, 1992, and Changes in the Definition of Current CigaretteSmoking. MMWR. Morb. Mortal. Wkly. Rep. 1994, 43, 342. Available online: https://www.cdc.gov/mmwr/preview/mmwrhtml/00033250.htm (accessed on 1 June 2018).
47. Amick, B.C.; Habeck, R.V.; Hunt, A.; Fossel, A.H.; Chapin, A.; Keller, R.B.; Katz, J.N. Measuring the impactof organizational behaviors on work disability prevention and management. J. Occup. Rehabil. 2000, 10,21–38. [CrossRef]
48. Lerner, D.; Amick, B.C.; Rogers, W.H.; Malspeis, S.; Bungay, K.; Cynn, D. The Work Limitations Questionnaire.Med. Care 2001, 39, 72–85. [CrossRef] [PubMed]
49. Marras, W.S.; Lavender, S.A.; Leurgans, S.E.; Fathallah, F.A.; Ferguson, S.A.; Allread, W.G.; Rajulu, S.L.Biomechanical risk factors for occupationally related low back disorders. Ergonomics 1995, 38, 377–410.[CrossRef] [PubMed]
50. Tveito, T.H.; Shaw, W.S.; Huang, Y.H.; Nicholas, M.; Wagner, G. Managing pain in the workplace: A focusgroup study of challenges, strategies and what matters most to workers with low back pain. Disabil. Rehabil.2010, 32, 2035–2045. [CrossRef] [PubMed]
51. Dennerlein, J.T. Chronic low back pain: A successful intervention for desk-bound workers.Occup. Environ. Med. 2018, 75, 319–320. [CrossRef] [PubMed]
52. Harvard Business Review. 7 Ways to Improve Operations without Sacrificing Worker Safety by DavidMichaels. Available online: https://hbr.org/2018/03/7-ways-to-improve-operations-without-sacrificing-worker-safety (accessed on 21 March 2018).
53. Dasgupta, P.; Sample, M.; Buchholz, B.; Brunette, M. Is worker involvement an ergonomic solution forconstruction intervention challenges: A systematic review. Theory Issues Ergon. Sci. 2017, 18, 433–441.[CrossRef]
54. Dale, A.M.; Jaegers, L.; Welch, L.; Barnidge, E.; Weaver, N.; Evanoff, B.A. Facilitators and barriers to theadoption of ergonomic solutions in construction. Am. J. Ind. Med. 2017, 60, 295–305. [CrossRef] [PubMed]
55. Occupational Safety and Health Administration. Training Requirements in OSHA Standards. OSHA 2254-09R2015. Available online: https://www.osha.gov/Publications/osha2254.pdf (accessed on 1 June 2018).
210
IJERPH 2018, 15, 2354
56. Boschman, J.S.; Frings-Dresen, M.H.W.; van der Molen, H.F. Use of Ergonomic Measures Related toMusculoskeletal Complaints among Construction Workers: A 2-year Follow-up Study. Saf. Health Work 2015,6, 90–96. [CrossRef] [PubMed]
57. Visser, S.; van der Molen, H.F.; Sluiter, J.K.; Frings-Dresen, M.H.W. The process evaluation of two alternativeparticipatory ergonomics intervention strategies for construction companies. Ergonomics 2018, 61, 1156–1172.[CrossRef] [PubMed]
58. Dale, A.M.; Jaegers, L.; Welch, L.; Gardner, B.T.; Buchholz, B.; Weaver, N.; Evanoff, B.A. Evaluation of aparticipatory ergonomics intervention in small commercial construction firms. Am. J. Ind. Med. 2016, 59,465–475. [CrossRef] [PubMed]
59. Dennerlein, J.T.; O’Day, E.T.; Mulloy, D.F.; Somerville, J.; Stoddard, A.M.; Kenwood, C.; Teeple, E.; Boden, L.I.;Sorensen, G.; Hashimoto, D. Lifting and exertion injuries decrease after implementation of an integratedhospital-wide safe patient handling and mobilisation programme. Occup. Environ. Med. 2017, 74, 336–343.[CrossRef] [PubMed]
60. Sorensen, G.; Sparer, E.; Williams, J.A.R.; Gundersen, D.; Boden, L.I.; Dennerlein, J.T.; Hashimoto, D.;Katz, J.N.; McLellan, D.L.; Okechukwu, C.A.; et al. Measuring best practices for workplace safety, healthand wellbeing: The Workplace Integrated Safety and Health assessment. J. Occup. Environ. Med. 2018, 60,430–439. [CrossRef] [PubMed]
61. Viester, L.; Verhagen, E.A.; Bongers, P.M.; van der Beek, A.J. The effect of a health promotion interventionfor construction workers on work-related outcomes: Results from a randomized controlled trial. Int. Arch.Occup. Environ. Health 2015, 88, 789–798. [CrossRef] [PubMed]
62. Manjourides, J.; Sparer, E.H.; Okechukwu, C.A.; Dennerlein, J.T. The Effect of Workforce Mobility onIntervention Effectiveness Estimates. Ann. Work Expo. Health 2018, 62, 259–268. [CrossRef] [PubMed]
63. Magnavita, N. Medical surveillance, continuous health promotion and a participatory intervention in a smallcompany. Int. J. Environ. Res. Public Health 2018, 15, 662. [CrossRef] [PubMed]
64. Sokas, R.K.; Jorgensen, E.; Nickels, L.; Gao, W.; Gittleman, J.L. An intervention effectiveness study of hazardawareness training in the construction building trades. Public Health Rep. 2009, 124, 160–168. [CrossRef][PubMed]
65. The Center for Construction Research and Training. Diffusing Ergonomic Innovations in Construction(Completed—2004–2009). Available online: http://orcehs.org/wiki/display/orcehs/Construction+Ergonomics(accessed on 31 October 2010).
66. Strickland, J.R.; Smock, N.; Casey, C.; Poor, T.; Kreuter, M.W.; Evanoff, B.A. Development of targetedmessages to promote smoking cessation among construction trade workers. Health Educ. Res. 2015, 30,107–120. [CrossRef] [PubMed]
67. Dale, A.M.; Strand, J.; Schneider, S.; Cain, C.; Rempel, D. Piloting of a social marketing campaign to reducemusculoskeletal risks related to manual materials handling on construction projects. Occup. Environ. Med.2018, 75. [CrossRef]
68. Rempel, D.; Star, D.; Barr, A.; Janowitz, I. Overhead drilling: Comparing three bases for aligning a drillingjig to vertical. J. Saf. Res. 2010, 41, 247–251. [CrossRef] [PubMed]
© 2018 by the authors. Licensee MDPI, Basel, Switzerland. This article is an open accessarticle distributed under the terms and conditions of the Creative Commons Attribution(CC BY) license (http://creativecommons.org/licenses/by/4.0/).
211
International Journal of
Environmental Research
and Public Health
Article
From Research-to-Practice: An Adaptation andDissemination of the COMPASS Program forHome Care Workers
Ryan Olson 1,2,3,*, Jennifer A. Hess 4, Kelsey N. Parker 1, Sharon V. Thompson 1,5,
Anjali Rameshbabu 1, Kristy Luther Rhoten 1 and Miguel Marino 6
1 Oregon Institute of Occupational Health Sciences, Oregon Health & Science University (OHSU),Portland, OR 97239, USA; [email protected] (K.N.P.); [email protected] (S.V.T.);[email protected] (A.R.); [email protected] (K.L.R.)
2 Oregon Health & Science University (OHSU)-Portland State University School of Public Health,Portland, OR 97239, USA
3 Department of Psychology, Portland State University, Portland, OR 97201, USA4 Labor Education and Research Center, University of Oregon, Eugene, OR 97403, USA; [email protected] Division of Nutritional Sciences, University of Illinois at Urbana-Champaign, Urbana, IL 61801, USA6 Department of Family Medicine, Oregon Health & Science University, Portland, OR 97239, USA;
[email protected]* Correspondence: [email protected]; Tel.: +1-503-494-2501
Received: 18 October 2018; Accepted: 24 November 2018; Published: 7 December 2018
Abstract: The COMmunity of Practice And Safety Support (COMPASS) program was developed toprevent injuries and advance the health and well-being of home care workers. The program integrateselements of peer-led social support groups with scripted team-based programs to help workerslearn together, solve problems, set goals, make changes, and enrich their supportive professionalnetwork. After a successful pilot study and randomized controlled trial, COMPASS was adaptedfor the Oregon Home Care Commission’s training system for statewide dissemination. The adaptedprogram included fewer total meetings (7 versus 13), an accelerated meeting schedule (every twoweeks versus monthly), and a range of other adjustments. The revised approach was piloted withfive groups of workers (total n = 42) and evaluated with pre- and post-program outcome measures.After further adjustments and planning, the statewide rollout is now in progress. In the adaptationpilot several psychosocial, safety, and health outcomes changed by a similar magnitude relative tothe prior randomized controlled trial. Preliminary training evaluation data (n = 265) show high meanratings indicating that workers like the program, find the content useful, and intend to make changesafter meetings. Facilitating factors and lessons learned from the project may inform future similarefforts to translate research into practice.
Keywords: home care workers; workplace; occupational; safety; health; well-being; dissemination
1. Introduction
For many Americans, especially older adults, home care workers (HCWs) are a vital source ofdaily personal support that facilitates their ability to “age in place.” With a growing proportion ofaging adults in the US population in coming years, the currently estimated 2.9 million home careand personal care aides is projected to increase by 41% between 2016 and 2026. This growth rate isconsiderably higher than the 7% average growth for all US occupations [1].
HCWs face job demands that are unique and multi-faceted, and they often lack resourcesor supports to help them meet such demands [2]. Despite the important service they provide incommunities, HCWs remain poorly compensated with a median income of $23,130 that is considerably
IJERPH 2018, 15, 2777; doi:10.3390/ijerph15122777 www.mdpi.com/journal/ijerph212
IJERPH 2018, 15, 2777
lower than the median for all US workers [1]. Nearly half the nation’s HCWs rely on low-incometax credits and federal assistance programs to make ends meet [3]. HCWs face a number of physicaldemands and exposures as they assist older adults with activities of daily living, such as walking andother movements, personal hygiene, dressing, bathing, cooking, and housekeeping. Thus, HCWs oftensuffer from musculoskeletal strain, are exposed to infectious agents and hazardous chemicals, andare at-risk for puncture injuries from sharps when clients do not discard them properly [4]. Further,because they work alone within the homes of their clients, HCWs lack many occupational safetyand health protections that are commonly available for employees in more traditional workplaces(e.g., supervision, environmental safety audits, employer assessment and correction of hazards,co-worker support, safety committees, and safety training) [2]. The degree of worker vulnerabilitydiffers for independent contractors compared to those who work for home care agencies, but most allHCWs experience deficits in protections to some degree.
Although HCWs report high satisfaction from the close relationships they develop with clients [4],some home care clients may engage in very challenging behaviors, including verbal and physicalaggression. HCWs report incidents of verbal and sexual harassment, which are associated with stress,depression, sleep problems, and burnout [5]. The unique profile of challenges for HCWs points to thecritical need for interventions geared toward protecting their safety, health, and well-being.
Research with this socially important workgroup has led to the development of effectiveinterventions to reduce blood and body fluid exposures [6], reduce musculoskeletal pain [7], andimprove physical fitness and work ability [8]. Socially supportive group interventions have producedlong-term improvements in well-being for family caregivers [9] and improved a range of safety, health,and well-being factors among independent HCWs serving consumer-employers in publicly fundedprograms in Oregon [10]. In addition to experimentally evaluated programs, there are valuableresources for HCWs developed through participatory methods. For example, the Safe Home CareProject provides resources on safe cleaning and disinfection and on safe practices to reduce risk ofinjuries from sharps and blood-borne exposures (University of Massachusetts, Lowell, Safe HomeCare, n.d. [11]). The Caring for Yourself While Caring for Others handbook (National Institute forOccupational Safety and Health [NIOSH] n.d. [12]) provides a checklist of potentially hazardouswork tasks, along with tips and tools for preventing exposures and injuries for each family of tasks.The handbook also addresses communication strategies and workplace stress. Helpful illustrationsshow workers examples and non-examples of safe practices and tool use, and overall, the book isdesigned to help facilitate conversations between workers and their clients (or with their familymembers or workplace supervisors) about improving workplace safety.
1.1. Translating Evidence-Based Interventions into Practice
In the healthcare domain, Balas and Boren [13] stated that “ . . . it takes an average of 17 years forresearch evidence to reach clinical practice” (p. 66). For nine clinical procedures established effectivein landmark trials, the authors reported current rates of procedure use between 17.0% to 70.4%. Evenin medicine, there are very long time lines to realize variable degrees of adoption.
Typically, an intervention’s reach beyond the research setting is limited by constraints such asa lack of funding to facilitate its usability and scalability or the absence of structures or partners tomarket it to potential adopters. In some cases, an intervention’s features may not encourage its transferto practice (e.g., too complex, costly, or effortful to implement). Moreover, intervention researchers aretypically evaluated and rewarded for obtaining competitive grants, conducting innovative and highquality research, and publishing research findings. Occupational incentives are not typically alignedfor investigators to adapt, commercialize, market, and disseminate the evidence-based programs theycreate or study. These types of barriers include the overarching culture of peer review, which tends toemphasize factors related to the internal validity of intervention studies over issues related to externalvalidity (e.g., factors that influence participation, adoption, and implementation). To illustrate, in areview of health promotion intervention research using the widely recognized RE-AIM framework,
213
IJERPH 2018, 15, 2777
Bull and colleagues [14] reported that just 25% of studies reported information on adoption, and only12.5% reported implementation data.
In order to overcome some of these barriers, Harris and colleagues [15] proposed a disseminationframework that addresses the gap between scientists and end users of evidence-based health promotioninterventions. Their approach relies on a motivated “disseminator” or intermediary organizationto help researchers adapt, market, and disseminate interventions. In their model, researchers andintermediary disseminating organizations form a reciprocal relationship that generates “DisseminationResources” that are then marketed to end users—primarily by the disseminating organization.The authors provided two examples of interventions that were successfully disseminated throughthis approach that had reached nearly 2000 employers and community based adopters at the time ofthe publication.
Systematic reviews of research on the translation of community-based interventions into practicesuggest additional facilitators for success. Matthews and colleagues [16] shared that translatingphysical activity interventions into practice was facilitated by tailoring an intervention to suit theintended adopter, partnering strategically with receptive organizations, and adequately trainingimplementers. In another review, Estabrooks and Glasgow [17] shared that interventions are moretranslation-friendly if they are perceived by the intended users as being more advantageous thanexisting practices, compatible with their current needs and values, feasible to deliver and implement,able to be tested for potential adoption, and have demonstrated effectiveness among stakeholders [18].
Other dissemination research highlights the importance of commitment from organizationalleaders (including financial support) and the presence of workplace champions. The successfullarge-scale adoption of the evidence-based Stand Up Australia intervention (disseminated as theBeUpstanding ProgramTM) was attributed by researchers in part to a strong partnership with andtimely funding support from the adopter (government, in this case). The authors also reported theimportance of packaging the intervention into an online toolkit, and then transferring the toolkit to aworkplace champion. The toolkit helped champions by providing practical strategies for making abusiness case for the intervention, obtaining buy-in from organizational leaders, and how to deliver andevaluate the program [19]. Qualitative research with adopters and non-adopters of the evidence-basedPHLAME wellness program for firefighters highlighted the importance of a committed chief andthe presence of a workplace wellness champion at adopting fire stations (i.e., the “champ-and-chief”model of adoption) [20].
1.2. Translating Home Care Worker Interventions for Practice
Although evidence-based and useful interventions for HCWs and other caregivers are available,we were unable to find any peer-reviewed publications regarding their dissemination. Therefore, wereached out for phone interviews with contacts for caregiver programs or resources we were familiarwith. The principal investigator for the Safe Home Care Project (M. Quinn, personal communication,5 October 2018) indicated that its dissemination occurs via fact sheets containing safety and healtheducation, publications in scientific journals, and articles within HCW trade association magazines.The Health Education Program, a supportive group program for family caregivers, is distributed bythe principal investigator when requested by caregiver agencies (R. Toseland, 26 September 2018).The Caring For Yourself While Caring For Others handbook, developed by the Labor OccupationalHealth Program in partnership with NIOSH for Alameda County workers in California, was lateradopted within the Alameda County Health Consortium. However, its current dissemination channelsoutside of being downloadable through its website are unknown (L. Stock, 26 September 2018).In these selected cases, translation, dissemination, and adoption efforts have not been systematicallydescribed, and appear to have been supported by dedicated principal investigators or partners withoutfunding or formal systemic support following initial development and evaluation research.
In our view, an important way to address this gap and inform future translation and disseminationefforts, is to publish qualitative and quantitative descriptions of barriers, facilitators, and successes
214
IJERPH 2018, 15, 2777
in dissemination after interventions are established to be effective. On this theme, the current paperreports the process and results of a successful intervention adaptation and dissemination effort inprogress. The COMmunity of Practice And Safety Support (COMPASS) program was designed toadvance the safety, health, and well-being of HCWs. The intervention’s peer-led and supportivegroup tactics are aimed at creating a protective occupational social support structure for typicallyisolated HCWs. Developed using a Total Worker Health® approach, COMPASS simultaneously focusedon reducing hazards for injuries and illnesses, while also promoting factors to advance workers’health and well-being. The intervention was developed with labor and governmental partners,and was demonstrated effective through a cluster randomized controlled trial (RCT). A range offactors showed significant improvements, including workers’ experienced community of practice,safety behaviors (including ergonomic tool use), and health factors (such as fruit and vegetableconsumption [10]). Following the RCT, COMPASS was adapted for dissemination with the OregonHome Care Commission (OHCC), pilot tested in its adapted form, and is now being rolled outstatewide by the OHCC as a paid training opportunity available to roughly 60% of Oregon’s homecare workforce. The current project describes original and adapted programs, results from the pilottest of the adapted program, and preliminary training evaluation data from the COMPASS rollout bythe OHCC.
2. Materials and Methods
The COMPASS research program began formally in 2011 as a research project within the OregonHealthy Workforce Center, a Center of Excellence in Total Worker Health® (NIOSH U19OH010154).Over the life of the program, all COMPASS research procedures have been reviewed and approved bythe Oregon Health & Science University Human Subjects Institutional Review Board. Researchpartners include the Service Employees International Union Local 503 and the OHCC. Aftersupporting initial development and evaluation research, both the union and the OHCC continuedsupport for the intervention’s translation into practice, with the OHCC as the ultimate adoptingorganization. The OHCC is housed within Oregon’s Department of Human Services as a componentof state-supported Services for Seniors and People with Disabilities. The OHCC is charged withdefining qualifications for HCWs and other caregivers who provide services for consumers whoqualify for publicly funded care. These HCWs work as independent contractors without a supportinghome care agency, supervisor, or co-workers, and are employed directly by their clients who arereferred to as “consumer-employers.” The OHCC operates a training system offering over 20 coursetopics for HCWs and personal support workers throughout the state, manages a registry to matchworkers with consumer-employers (or consumer-employers with workers), and serves as the employerof record for collective bargaining with the union.
The original three-year long COMPASS research project [21] included intervention developmentfollowed by a pilot study [22] and cluster RCT [10]. The original trial design involved baseline,6 month, and 12 month measurements. Participants were recruited from among the population ofHCWs caring for consumer-employers who qualified for publicly funded home care services throughthe OHCC managed system. As the RCT was underway, the Oregon Healthy Workforce Centerapplied for and was awarded an additional two years of funding. In that extended two-year agendaan additional follow-up measurement was added (≈24 months post-baseline), as well as qualitativeresearch focused on caregivers’ experiences at work and in the COMPASS program [2]. Furtherresearch was planned to conduct interviews with leaders and workers at private home care agencies toinform future dissemination in that industry segment. However, when the opportunity arose to adaptand potentially disseminate COMPASS within the OHCC training system, dissemination aims withprivate agencies were postponed and the intervention was adapted and piloted for dissemination in theCommission’s training program. Translation and dissemination efforts continued after research grantfunding for COMPASS ended in 2016. Further adaptation of the intervention materials and processwas completed with financial support from the Commission and the Oregon Institute of Occupational
215
IJERPH 2018, 15, 2777
Health Sciences at Oregon Health & Science University. In the Fall of 2017 COMPASS was added tothe OHCC’s training system as a paid course offering for workers. Below we describe the methods foreach phase of the COMPASS research with an emphasis on how intervention materials and processeswere adapted, piloted, and translated into practice.
2.1. COMPASS Pilot and Randomized Controlled Trial
The original COMPASS intervention development and evaluation has been described in previouspublications in detail. However, a high-level summary is needed to understand how materials andprocesses were modified for translation into practice. COMPASS is a supportive group program thatis peer-led and scripted. Intervention tactics employed were modeled on effective social supportgroups [9,23,24] and scripted team-based health promotion programs [25–28]. Original interventionresources developed included two types of guidebooks: a group leader guidebook with additionalinstructions and activity answers, and a group member guidebook without those group-leader specificinstructions and activity answers. In both the pilot and RCT, groups met monthly to complete ascripted meeting that followed a ritualized structure. Each meeting involved a WorkLife check-in,educational lesson, goal setting and follow-up, a healthy meal break, and a WorkLife support activity.
The curriculum was developed in two phases so the RCT could begin while investigatorscontinued to develop and pilot test additional scripted meetings. In the first phase, leader and memberversions of guidebook one were developed with seven scripted meetings that were evaluated byworkers (n = 16) in the published pilot study, and then revised and evaluated in the first half of the RCTintervention phase (16 clusters of workers, n = 149). In addition to the scripted meetings, guidebookone included an “Extras” section with additional resources for workers, including the Gershon HomeHazard Checklist, the NIOSH Caring for Yourself While Caring for Others handbook, and perforatedcards printed with templates for behavioral self-monitoring activities. Pages for tracking attendanceand goals were also included. In an unpublished phase of the pilot study, guidebook two (six additionalmeetings) was developed and then evaluated with a subgroup of pilot participants (n ≈ 6) as the RCTbegan using guidebook one. Guidebook two was also modified based on pilot results, and then usedin the second half of the RCT intervention phase. The second guidebook included a slightly differentstructure. In the educational lesson component, groups chose from a menu of homework reading topicoptions to read before the next meeting; these topics were then discussed at the next meeting usinga structured discussion guide. Like the first guidebook, the second guidebook included forms fortracking attendance and goal completion and perforated cards printed with templates for behavioralself-monitoring activities.
Seven of the eight original RCT intervention groups were led by a permanent peer-leader whowas involved in the published pilot study. The eighth group lacked a peer-leader from the pilot,and was therefore led by two peer co-leaders who volunteered for this role at their group’s firstmeeting. Guidebook materials were supported with a peer leader toolkit of ergonomic tools andobjects for activities (slide boards, transfer belts, anti-friction disks, Gimme-A-Lift, and tennis balls),as well as resource giveaways used for completing “take home goals” (knee pads, step counters, andwrist bead counters for behavioral self-monitoring). Workers also received pay and incentives forattending meetings and research data collection waves, and were recognized with participation-basedincentives for earning individual and/or group certification. During the first six months, participantsobtained individual certification if they attended five team meetings and completed five individualgoals; teams were certified if the entire team completed five team goals. During the second six monthsindividual certification was earned if the participant attended at least four meetings and completedeight individual goals (one repeat goal and one new goal were selected each meeting); team certificationwas awarded if all team members completed four or more team goals. Those who earned individualcertification obtained a $60 gift certificate and certified teams received COMPASS jackets (first sixmonths) and COMPASS umbrellas or a team patch (second six months). Participants were paid $11 anhour through the grant for study-related activities prior to October 2013, and $15 an hour thereafter
216
IJERPH 2018, 15, 2777
following a state-wide wage increase. Supplemental incentives included a $30 retention bonus atfollow-up research data collection periods, lottery drawings for supplemental compensation awardstotaling $1000 (many small awards were drawn), and additional gifts at baseline (COMPASS tote bag),6 months (COMPASS t-shirt), and 12 months (COMPASS lunch bag).
2.2. COMPASS Adaptation and Pilot for the OHCC
During the development and research phases for COMPASS investigators solicited union andOHCC input, provided regular updates to the OHCC training committee and the union to informthem of progress and findings, and periodically discussed the future of the program. Following thesuccessful RCT, and in response to ongoing dialogue about the program, the OHCC requested thatinvestigators adapt COMPASS to be offered as a paid training course in their system. One motivationfor this decision expressed by OHCC leaders was an interest in cultivating leadership skills amongHCWs. A plan for adapting COMPASS guidebook one was worked out collaboratively, implementedby researchers, and then pilot tested. Adjustments to the approach were guided by OHCC practicalneeds, but with a commitment to retaining core evidence-based tactics. Adjustments included: a fastercycle time, where groups met every other week instead of once a month; reduction of total meetingsto seven (e.g., only topics from guidebook one); the use of professional OHCC-contracted trainers toserve as group facilitators who would lead the first meeting and then support each group as a “guideon the side” thereafter; using rotating volunteer peer-leaders at meetings two through seven; removingthe meal served during breaks; replacing some original group and individual goals to attend relatedOHCC trainings with new goals focused on workers making targeted work-environment and behaviorchanges; and incentive adjustments. The long-term strategic plan also included proposed adjustmentsto training evaluation questions for all OHCC training courses in order to accommodate a peer-ledcourse series like COMPASS. Table 1 summarizes COMPASS guidebook one original topics and goals,as well as adaptations (most adaptations were made prior to the adaptation pilot, but some weremade afterward).
The adaptation pilot involved five COMPASS groups led by four OHCC facilitators in threeOregon cities. This sampling approach was selected to provide a check that the adjusted process wasfunctional across multiple facilitators and groups, and that the intervention was changing targetedoutcomes by a similar magnitude (effect size) relative to the effective version evaluated in the RCT.Workers received hourly wages for attending COMPASS adaptation pilot meetings, just as they wouldfor attending other courses offered by the OHCC (workers receive wages for any non-duplicated courseannually). Pilot participants received an additional $15 for completing surveys and/or taking part in aninterview with study staff. Plans were also made for COMPASS to satisfy safety training requirements(completion of two safety courses every two years) for workers to be listed on the OHCC registryfor finding (or being found by) potential new Medicaid/Medicare-funded consumer-employers.The adapted program was supported with the same ergonomic toolkit and resource giveaways as theintervention as implemented in the RCT. However, no incentives were provided for individual orgroup certification. Instead, printed paper certificates were awarded based on attendance. As notedabove, professional trainers under contract with the OHCC were identified to serve as COMPASSfacilitators. The research team created a half-day orientation and facilitator training workshop toprepare facilitators for their role. This training included a history of the program and research findings,description and handouts on the role of facilitators, and practice with scripted guidebook activitieswith coaching from researchers. Guidebooks and other materials for implementation were provided tofacilitators before their first group meeting.
217
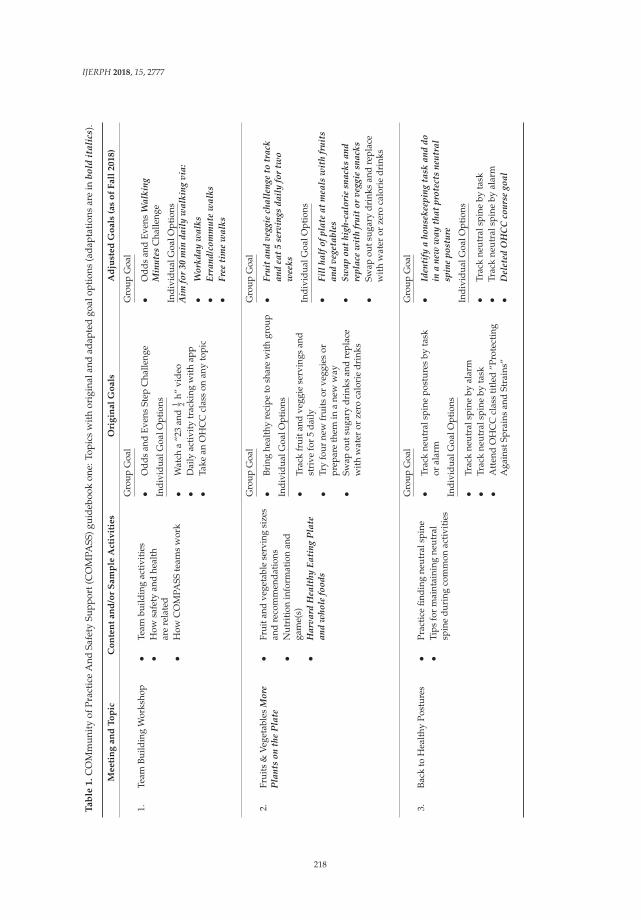
IJERPH 2018, 15, 2777
Ta
ble
1.
CO
Mm
unit
yof
Prac
tice
And
Safe
tySu
ppor
t(C
OM
PASS
)gui
debo
okon
e:To
pics
wit
hor
igin
alan
dad
apte
dgo
alop
tion
s(a
dapt
atio
nsar
ein
bold
ital
ics)
.
Me
eti
ng
an
dT
op
icC
on
ten
ta
nd
/or
Sa
mp
leA
ctiv
itie
sO
rig
ina
lG
oa
lsA
dju
ste
dG
oa
ls(a
so
fF
all
20
18
)
1.Te
amBu
ildin
gW
orks
hop
•Te
ambu
ildin
gac
tivi
ties
•H
owsa
fety
and
heal
thar
ere
late
d•
How
CO
MPA
SSte
ams
wor
k
Gro
upG
oal
•O
dds
and
Even
sSt
epC
halle
nge
Indi
vidu
alG
oalO
ptio
ns
•W
atch
a“2
3an
d1 2
h”vi
deo
•D
aily
acti
vity
trac
king
wit
hap
p•
Take
anO
HC
Ccl
ass
onan
yto
pic
Gro
upG
oal
•O
dds
and
Even
sW
alki
ngM
inut
esC
halle
nge
Indi
vidu
alG
oalO
ptio
nsA
imfo
r30
min
dail
yw
alki
ngvi
a:
•W
orkd
ayw
alks
•Er
rand
/com
mut
ew
alks
•Fr
eeti
me
wal
ks
2.Fr
uits
&Ve
geta
bles
Mor
eP
lant
son
the
Pla
te•
Frui
tand
vege
tabl
ese
rvin
gsi
zes
and
reco
mm
enda
tion
s•
Nut
riti
onin
form
atio
nan
dga
me(
s)•
Har
vard
Hea
lthy
Eati
ngP
late
and
who
lefo
ods
Gro
upG
oal
•Br
ing
heal
thy
reci
peto
shar
ew
ithgr
oup
Indi
vidu
alG
oalO
ptio
ns
•Tr
ack
frui
tand
vegg
iese
rvin
gsan
dst
rive
for
5da
ily•
Try
four
new
frui
tsor
vegg
ies
orpr
epar
eth
emin
ane
ww
ay•
Swap
outs
ugar
ydr
inks
and
repl
ace
wit
hw
ater
orze
roca
lori
edr
inks
Gro
upG
oal
•Fr
uit
and
vegg
iech
alle
nge
totr
ack
and
eat
5se
rvin
gsda
ily
for
two
wee
ks
Indi
vidu
alG
oalO
ptio
ns
•Fi
llha
lfof
plat
eat
mea
lsw
ith
frui
tsan
dve
geta
bles
•Sw
apou
thi
gh-c
alor
iesn
acks
and
repl
ace
wit
hfr
uit
orve
ggie
snac
ks•
Swap
outs
ugar
ydr
inks
and
repl
ace
wit
hw
ater
orze
roca
lori
edr
inks
3.Ba
ckto
Hea
lthy
Post
ures
•Pr
acti
cefin
ding
neut
rals
pine
•Ti
psfo
rm
aint
aini
ngne
utra
lsp
ine
duri
ngco
mm
onac
tivi
ties
Gro
upG
oal
•Tr
ack
neut
rals
pine
post
ures
byta
skor
alar
m
Indi
vidu
alG
oalO
ptio
ns
•Tr
ack
neut
rals
pine
byal
arm
•Tr
ack
neut
rals
pine
byta
sk•
Att
end
OH
CC
clas
sti
tled
“Pro
tect
ing
Aga
inst
Spra
ins
and
Stra
ins”
Gro
upG
oal
•Id
enti
fya
hous
ekee
ping
task
and
doin
ane
ww
ayth
atpr
otec
tsne
utra
lsp
ine
post
ure
Indi
vidu
alG
oalO
ptio
ns
•Tr
ack
neut
rals
pine
byta
sk•
Trac
kne
utra
lspi
neby
alar
m•
Del
eted
OH
CC
cour
sego
al
218
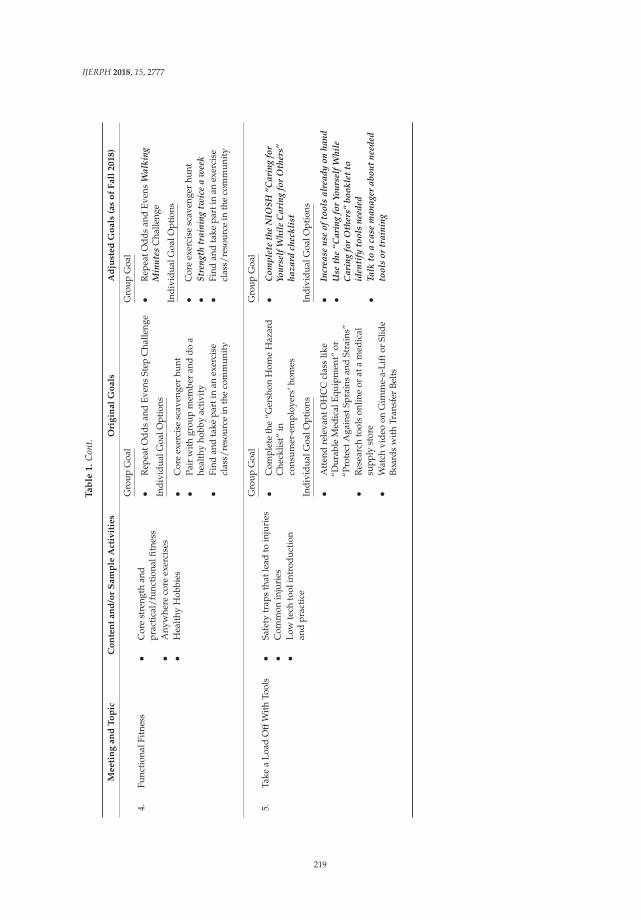
IJERPH 2018, 15, 2777
Ta
ble
1.
Con
t.
Me
eti
ng
an
dT
op
icC
on
ten
ta
nd
/or
Sa
mp
leA
ctiv
itie
sO
rig
ina
lG
oa
lsA
dju
ste
dG
oa
ls(a
so
fF
all
20
18
)
4.Fu
ncti
onal
Fitn
ess
•C
ore
stre
ngth
and
prac
tica
l/fu
ncti
onal
fitne
ss•
Any
whe
reco
reex
erci
ses
•H
ealt
hyH
obbi
es
Gro
upG
oal
•R
epea
tOdd
san
dEv
ens
Step
Cha
lleng
e
Indi
vidu
alG
oalO
ptio
ns
•C
ore
exer
cise
scav
enge
rhu
nt•
Pair
wit
hgr
oup
mem
ber
and
doa
heal
thy
hobb
yac
tivi
ty•
Find
and
take
part
inan
exer
cise
clas
s/re
sour
cein
the
com
mun
ity
Gro
upG
oal
•R
epea
tOdd
san
dEv
ens
Wal
king
Min
utes
Cha
lleng
e
Indi
vidu
alG
oalO
ptio
ns
•C
ore
exer
cise
scav
enge
rhu
nt•
Stre
ngth
trai
ning
twic
ea
wee
k•
Find
and
take
part
inan
exer
cise
clas
s/re
sour
cein
the
com
mun
ity
5.Ta
kea
Load
Off
Wit
hTo
ols
•Sa
fety
trap
sth
atle
adto
inju
ries
•C
omm
onin
juri
es•
Low
tech
tool
intr
oduc
tion
and
prac
tice
Gro
upG
oal
•C
ompl
ete
the
“Ger
shon
Hom
eH
azar
dC
heck
list”
inco
nsum
er-e
mpl
oyer
s’ho
mes
Indi
vidu
alG
oalO
ptio
ns
•A
tten
dre
leva
ntO
HC
Ccl
ass
like
“Dur
able
Med
ical
Equi
pmen
t”or
“Pro
tect
Aga
inst
Spra
ins
and
Stra
ins”
•R
esea
rch
tool
son
line
orat
am
edic
alsu
pply
stor
e•
Wat
chvi
deo
onG
imm
e-a-
Lift
orSl
ide
Boar
dsw
ith
Tran
sfer
Belt
s
Gro
upG
oal
•C
ompl
ete
the
NIO
SH“C
arin
gfo
rYo
urse
lfW
hile
Car
ing
for
Oth
ers”
haza
rdch
eckl
ist
Indi
vidu
alG
oalO
ptio
ns
•In
crea
seus
eof
tool
sal
read
yon
hand
•U
seth
e“C
arin
gfo
rYo
urse
lfW
hile
Car
ing
for
Oth
ers”
book
let
toid
enti
fyto
ols
need
ed•
Talk
toa
case
man
ager
abou
tne
eded
tool
sor
trai
ning
219
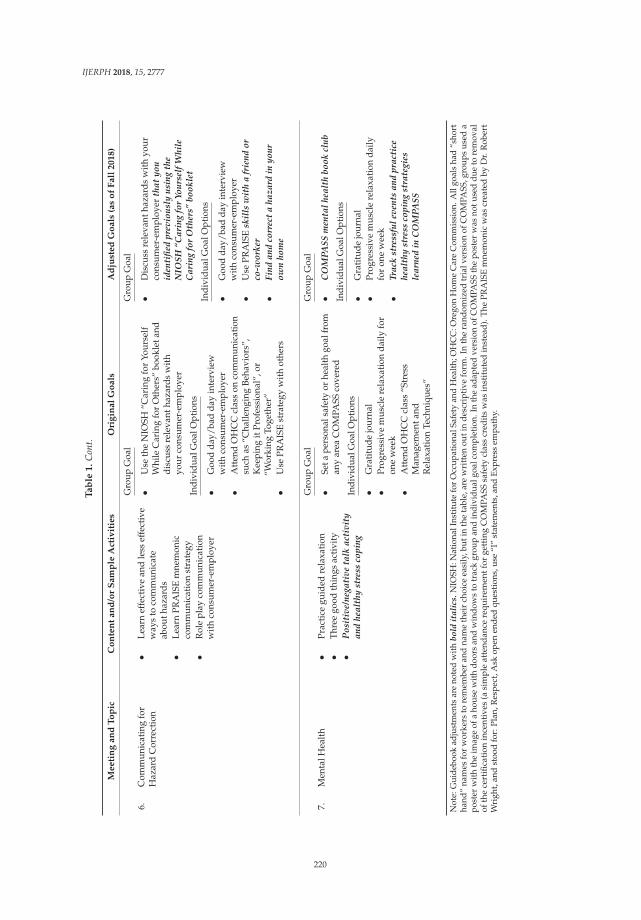
IJERPH 2018, 15, 2777
Ta
ble
1.
Con
t.
Me
eti
ng
an
dT
op
icC
on
ten
ta
nd
/or
Sa
mp
leA
ctiv
itie
sO
rig
ina
lG
oa
lsA
dju
ste
dG
oa
ls(a
so
fF
all
20
18
)
6.C
omm
unic
atin
gfo
rH
azar
dC
orre
ctio
n•
Lear
nef
fect
ive
and
less
effe
ctiv
ew
ays
toco
mm
unic
ate
abou
thaz
ards
•Le
arn
PRA
ISE
mne
mon
icco
mm
unic
atio
nst
rate
gy•
Rol
epl
ayco
mm
unic
atio
nw
ith
cons
umer
-em
ploy
er
Gro
upG
oal
•U
seth
eN
IOSH
“Car
ing
for
Your
self
Whi
leC
arin
gfo
rO
ther
s”bo
okle
tand
disc
uss
rele
vant
haza
rds
wit
hyo
urco
nsum
er-e
mpl
oyer
Indi
vidu
alG
oalO
ptio
ns
•G
ood
day/
bad
day
inte
rvie
ww
ith
cons
umer
-em
ploy
er•
Att
end
OH
CC
clas
son
com
mun
icat
ion
such
as“C
halle
ngin
gBe
havi
ors”
,K
eepi
ngit
Prof
essi
onal
”,or
“Wor
king
Toge
ther
”•
Use
PRA
ISE
stra
tegy
wit
hot
hers
Gro
upG
oal
•D
iscu
ssre
leva
ntha
zard
sw
ith
your
cons
umer
-em
ploy
erth
atyo
uid
enti
fied
prev
ious
lyus
ing
the
NIO
SH“C
arin
gfo
rYo
urse
lfW
hile
Car
ing
for
Oth
ers”
book
let
Indi
vidu
alG
oalO
ptio
ns
•G
ood
day/
bad
day
inte
rvie
ww
ith
cons
umer
-em
ploy
er•
Use
PRA
ISE
skil
lsw
ith
afr
iend
orco
-wor
ker
•Fi
ndan
dco
rrec
ta
haza
rdin
your
own
hom
e
7.M
enta
lHea
lth
•Pr
acti
cegu
ided
rela
xati
on•
Thre
ego
odth
ings
acti
vity
•P
osit
ive/
nega
tive
talk
acti
vity
and
heal
thy
stre
ssco
ping
Gro
upG
oal
•Se
tape
rson
alsa
fety
orhe
alth
goal
from
any
area
CO
MPA
SSco
vere
d
Indi
vidu
alG
oalO
ptio
ns
•G
rati
tude
jour
nal
•Pr
ogre
ssiv
em
uscl
ere
laxa
tion
daily
for
one
wee
k•
Att
end
OH
CC
clas
s“S
tres
sM
anag
emen
tand
Rel
axat
ion
Tech
niqu
es”
Gro
upG
oal
•C
OM
PASS
men
talh
ealt
hbo
okcl
ub
Indi
vidu
alG
oalO
ptio
ns
•G
rati
tude
jour
nal
•Pr
ogre
ssiv
em
uscl
ere
laxa
tion
daily
for
one
wee
k•
Trac
kst
ress
fule
vent
san
dpr
acti
cehe
alth
yst
ress
copi
ngst
rate
gies
lear
ned
inC
OM
PASS
Not
e:G
uide
book
adju
stm
ents
are
note
dw
ithbo
ldit
alic
s.N
IOSH
:Nat
iona
lIns
titut
efo
rO
ccup
atio
nalS
afet
yan
dH
ealth
;OH
CC
:Ore
gon
Hom
eC
are
Com
mis
sion
.All
goal
sha
d“s
hort
hand
”na
mes
for
wor
kers
tore
mem
ber
and
nam
eth
eir
choi
ceea
sily
,but
inth
eta
ble,
are
wri
tten
outi
nde
scri
ptiv
efo
rm.I
nth
era
ndom
ized
tria
lver
sion
ofC
OM
PASS
,gro
ups
used
apo
ster
with
the
imag
eof
aho
use
with
door
san
dw
indo
ws
totr
ack
grou
pan
din
divi
dual
goal
com
plet
ion.
Inth
ead
apte
dve
rsio
nof
CO
MPA
SSth
epo
ster
was
notu
sed
due
tore
mov
alof
the
cert
ifica
tion
ince
ntiv
es(a
sim
ple
atte
ndan
cere
quir
emen
tfor
gett
ing
CO
MPA
SSsa
fety
clas
scr
edit
sw
asin
stit
uted
inst
ead
).T
heP
RA
ISE
mne
mon
icw
ascr
eate
dby
Dr.
Rob
ert
Wri
ght,
and
stoo
dfo
r:Pl
an,R
espe
ct,A
skop
enen
ded
ques
tion
s,us
e“I
”st
atem
ents
,and
Expr
ess
empa
thy.
220
IJERPH 2018, 15, 2777
At baseline researchers collected direct measures of height (SECA 213 stadiometer; SECA, Chino,CA, USA) and weight (Tanita TBF-310GS; Tanita Corp, Arlington Heights, IL, USA), and surveymeasures of demographics, work history, and current work characteristics. Pre- and post-programevaluation measures emphasized outcomes from the prior RCT [10]. Survey scales/items includedexperienced community of practice [29]; frequency counts for five types of safety behaviors [10];fruit and vegetable consumption (single item 1–10+ servings daily, created for adaptation pilot);consumption of sugary drinks, snacks, and fast food meals [30]; frequency of meals brought fromhome [30]; weekly healthy physical activity levels [26]; and physical and psychological well-being [31].
2.3. Statewide Rollout of COMPASS in the OHCC Training System
In parallel with and following the adaptation pilot test, several efforts were initiated to supporteventual adoption and statewide rollout of COMPASS within the OHCC’s training system. Theseefforts included initiating negotiations for an interagency agreement between Oregon Health & ScienceUniversity (OHSU) and the Oregon Department of Human Services to govern the terms of use ofguidebooks; investigators requesting adjustments to the standard OHCC training evaluation questionsto accommodate a course series like COMPASS; and revisions to the OHCC version of the COMPASSguidebook in response to observing the pilot and in response to guidance from OHSU TechnologyTransfer and Business Development. We also explored whether other stakeholders, such as therelevant workers’ compensation insurer or an SEIU Health Trust, would support or fund parts of thedissemination effort. These conversations did not result in direct financial support for disseminationefforts, but helped guide sustainability decisions and resulted in in the addition of information aboutan Employee Assistance Program available to HCWs to the Extras section of COMPASS guidebooks.
Negotiations for terms of use of the program took quite a long time, in part due to the timing of theretirement of the OHCC’s Training Director and other staff turnover. Other hurdles involved navigatingunclear review and approval steps within the state government, and some long inter-agency responsetimes for document review requests. At the conclusion of over a year of episodic back-and-forthwork and hand-offs on the inter-agency research agreement, the ultimate terms granted the OHCCnon-exclusive rights to print and use COMPASS guidebooks in exchange for sharing long-termevaluation data with OHSU (5+ years). Evaluation data would include class attendance for COMPASSand non-COMPASS courses, class evaluations, and assisting OHSU in coordinating with the workers’compensation insurer to obtain injury claims data for workers who took COMPASS over the years andcross-sectional comparison groups of workers who either had not taken any training, and those whohad taken some training classes (but not COMPASS).
Within the OHCC training system, at the end of each class HCWs are asked to complete atraining evaluation (no names recorded) and leave it for their trainer to collect. Some of these originalevaluation items did not clearly apply to a peer-led and scripted program. For example, one itemasked workers to rate the degree to which “Information was presented in a variety of ways to facilitatelearning.” In COMPASS, all of the material is presented using a single scripted and peer-led method,and past research showed that this method produced large knowledge gains [22]. Two additional itemsasked students to rate the trainer’s performance (preparedness and communication effectiveness),but in COMPASS, there is a supporting facilitator rather than a traditional trainer. In addition torecommending adjustments to questions like those above, researchers also requested additionalquestions that asked workers to rate their intentions to make changes as a result of the training.
To further strengthen the program and streamline dissemination, COMPASS guidebooks werefurther adjusted in ways to support their use in the OHCC training system. Giveaways for studentsthat had no funding stream within the state (or potential funding stream) to support their use in theOHCC version of COMPASS, and homework assignments facilitated with such giveaways (e.g., smallknee pads), were removed from the program. Investigators also replaced some activities with newones, and made adjustments to other activities to make them run more smoothly. With guidance from
221
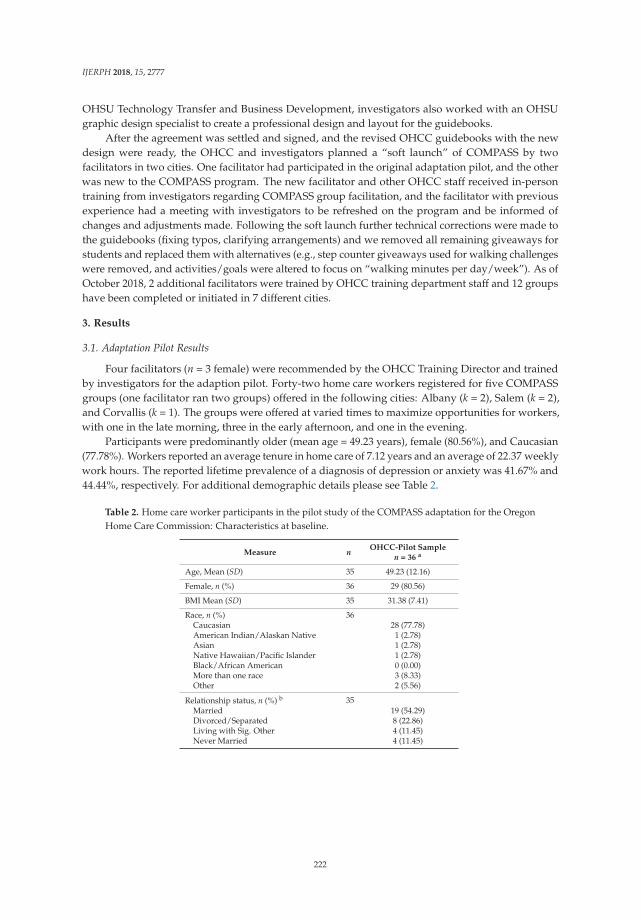
IJERPH 2018, 15, 2777
OHSU Technology Transfer and Business Development, investigators also worked with an OHSUgraphic design specialist to create a professional design and layout for the guidebooks.
After the agreement was settled and signed, and the revised OHCC guidebooks with the newdesign were ready, the OHCC and investigators planned a “soft launch” of COMPASS by twofacilitators in two cities. One facilitator had participated in the original adaptation pilot, and the otherwas new to the COMPASS program. The new facilitator and other OHCC staff received in-persontraining from investigators regarding COMPASS group facilitation, and the facilitator with previousexperience had a meeting with investigators to be refreshed on the program and be informed ofchanges and adjustments made. Following the soft launch further technical corrections were made tothe guidebooks (fixing typos, clarifying arrangements) and we removed all remaining giveaways forstudents and replaced them with alternatives (e.g., step counter giveaways used for walking challengeswere removed, and activities/goals were altered to focus on “walking minutes per day/week”). As ofOctober 2018, 2 additional facilitators were trained by OHCC training department staff and 12 groupshave been completed or initiated in 7 different cities.
3. Results
3.1. Adaptation Pilot Results
Four facilitators (n = 3 female) were recommended by the OHCC Training Director and trainedby investigators for the adaption pilot. Forty-two home care workers registered for five COMPASSgroups (one facilitator ran two groups) offered in the following cities: Albany (k = 2), Salem (k = 2),and Corvallis (k = 1). The groups were offered at varied times to maximize opportunities for workers,with one in the late morning, three in the early afternoon, and one in the evening.
Participants were predominantly older (mean age = 49.23 years), female (80.56%), and Caucasian(77.78%). Workers reported an average tenure in home care of 7.12 years and an average of 22.37 weeklywork hours. The reported lifetime prevalence of a diagnosis of depression or anxiety was 41.67% and44.44%, respectively. For additional demographic details please see Table 2.
Table 2. Home care worker participants in the pilot study of the COMPASS adaptation for the OregonHome Care Commission: Characteristics at baseline.
Measure n OHCC-Pilot Samplen = 36 a
Age, Mean (SD) 35 49.23 (12.16)
Female, n (%) 36 29 (80.56)
BMI Mean (SD) 35 31.38 (7.41)
Race, n (%) 36Caucasian 28 (77.78)American Indian/Alaskan Native 1 (2.78)Asian 1 (2.78)Native Hawaiian/Pacific Islander 1 (2.78)Black/African American 0 (0.00)More than one race 3 (8.33)Other 2 (5.56)
Relationship status, n (%) b 35Married 19 (54.29)Divorced/Separated 8 (22.86)Living with Sig. Other 4 (11.45)Never Married 4 (11.45)
222
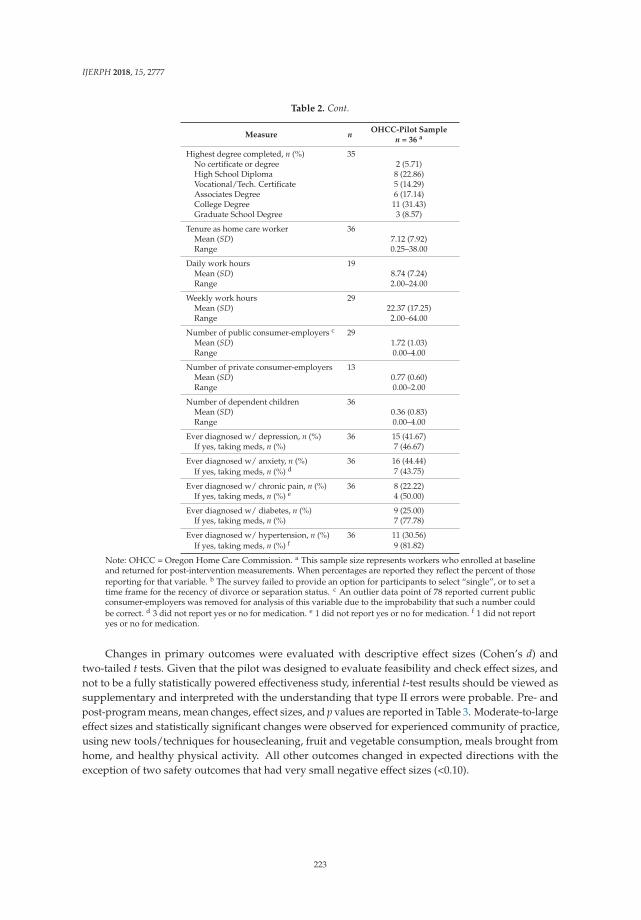
IJERPH 2018, 15, 2777
Table 2. Cont.
Measure n OHCC-Pilot Samplen = 36 a
Highest degree completed, n (%) 35No certificate or degree 2 (5.71)High School Diploma 8 (22.86)Vocational/Tech. Certificate 5 (14.29)Associates Degree 6 (17.14)College Degree 11 (31.43)Graduate School Degree 3 (8.57)
Tenure as home care worker 36Mean (SD) 7.12 (7.92)Range 0.25–38.00
Daily work hours 19Mean (SD) 8.74 (7.24)Range 2.00–24.00
Weekly work hours 29Mean (SD) 22.37 (17.25)Range 2.00–64.00
Number of public consumer-employers c 29Mean (SD) 1.72 (1.03)Range 0.00–4.00
Number of private consumer-employers 13Mean (SD) 0.77 (0.60)Range 0.00–2.00
Number of dependent children 36Mean (SD) 0.36 (0.83)Range 0.00–4.00
Ever diagnosed w/ depression, n (%) 36 15 (41.67)If yes, taking meds, n (%) 7 (46.67)
Ever diagnosed w/ anxiety, n (%) 36 16 (44.44)If yes, taking meds, n (%) d 7 (43.75)
Ever diagnosed w/ chronic pain, n (%) 36 8 (22.22)If yes, taking meds, n (%) e 4 (50.00)
Ever diagnosed w/ diabetes, n (%) 9 (25.00)If yes, taking meds, n (%) 7 (77.78)
Ever diagnosed w/ hypertension, n (%) 36 11 (30.56)If yes, taking meds, n (%) f 9 (81.82)
Note: OHCC = Oregon Home Care Commission. a This sample size represents workers who enrolled at baselineand returned for post-intervention measurements. When percentages are reported they reflect the percent of thosereporting for that variable. b The survey failed to provide an option for participants to select “single”, or to set atime frame for the recency of divorce or separation status. c An outlier data point of 78 reported current publicconsumer-employers was removed for analysis of this variable due to the improbability that such a number couldbe correct. d 3 did not report yes or no for medication. e 1 did not report yes or no for medication. f 1 did not reportyes or no for medication.
Changes in primary outcomes were evaluated with descriptive effect sizes (Cohen’s d) andtwo-tailed t tests. Given that the pilot was designed to evaluate feasibility and check effect sizes, andnot to be a fully statistically powered effectiveness study, inferential t-test results should be viewed assupplementary and interpreted with the understanding that type II errors were probable. Pre- andpost-program means, mean changes, effect sizes, and p values are reported in Table 3. Moderate-to-largeeffect sizes and statistically significant changes were observed for experienced community of practice,using new tools/techniques for housecleaning, fruit and vegetable consumption, meals brought fromhome, and healthy physical activity. All other outcomes changed in expected directions with theexception of two safety outcomes that had very small negative effect sizes (<0.10).
223
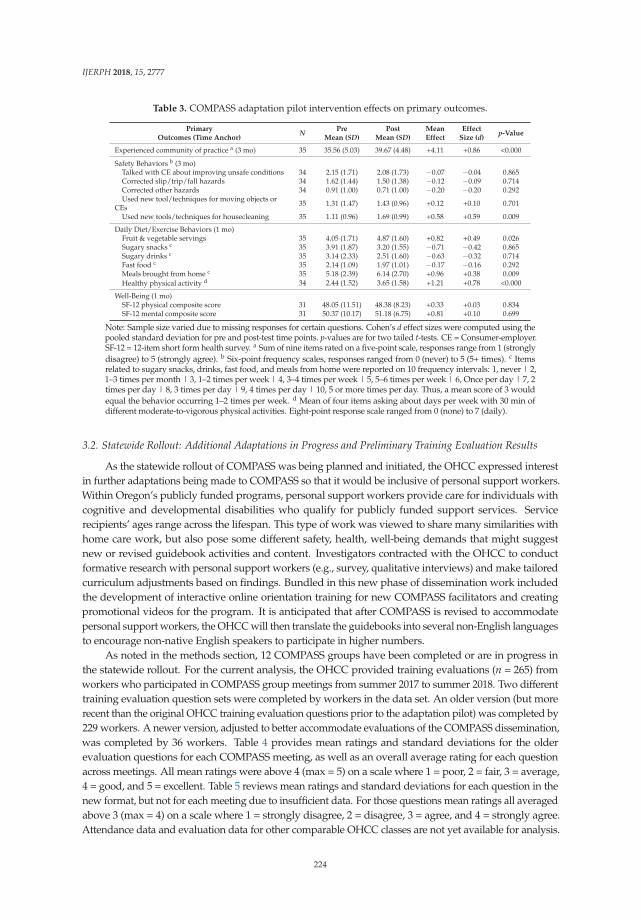
IJERPH 2018, 15, 2777
Table 3. COMPASS adaptation pilot intervention effects on primary outcomes.
PrimaryOutcomes (Time Anchor)
N PreMean (SD)
PostMean (SD)
MeanEffect
EffectSize (d)
p-Value
Experienced community of practice a (3 mo) 35 35.56 (5.03) 39.67 (4.48) +4.11 +0.86 <0.000
Safety Behaviors b (3 mo)Talked with CE about improving unsafe conditions 34 2.15 (1.71) 2.08 (1.73) −0.07 −0.04 0.865Corrected slip/trip/fall hazards 34 1.62 (1.44) 1.50 (1.38) −0.12 −0.09 0.714Corrected other hazards 34 0.91 (1.00) 0.71 (1.00) −0.20 −0.20 0.292Used new tool/techniques for moving objects or
CEs 35 1.31 (1.47) 1.43 (0.96) +0.12 +0.10 0.701
Used new tools/techniques for housecleaning 35 1.11 (0.96) 1.69 (0.99) +0.58 +0.59 0.009
Daily Diet/Exercise Behaviors (1 mo)Fruit & vegetable servings 35 4.05 (1.71) 4.87 (1.60) +0.82 +0.49 0.026Sugary snacks c 35 3.91 (1.87) 3.20 (1.55) −0.71 −0.42 0.865Sugary drinks c 35 3.14 (2.33) 2.51 (1.60) −0.63 −0.32 0.714Fast food c 35 2.14 (1.09) 1.97 (1.01) −0.17 −0.16 0.292Meals brought from home c 35 5.18 (2.39) 6.14 (2.70) +0.96 +0.38 0.009Healthy physical activity d 34 2.44 (1.52) 3.65 (1.58) +1.21 +0.78 <0.000
Well-Being (1 mo)SF-12 physical composite score 31 48.05 (11.51) 48.38 (8.23) +0.33 +0.03 0.834SF-12 mental composite score 31 50.37 (10.17) 51.18 (6.75) +0.81 +0.10 0.699
Note: Sample size varied due to missing responses for certain questions. Cohen’s d effect sizes were computed using thepooled standard deviation for pre and post-test time points. p-values are for two tailed t-tests. CE = Consumer-employer.SF-12 = 12-item short form health survey. a Sum of nine items rated on a five-point scale, responses range from 1 (stronglydisagree) to 5 (strongly agree). b Six-point frequency scales, responses ranged from 0 (never) to 5 (5+ times). c Itemsrelated to sugary snacks, drinks, fast food, and meals from home were reported on 10 frequency intervals: 1, never | 2,1–3 times per month | 3, 1–2 times per week | 4, 3–4 times per week | 5, 5–6 times per week | 6, Once per day | 7, 2times per day | 8, 3 times per day | 9, 4 times per day | 10, 5 or more times per day. Thus, a mean score of 3 wouldequal the behavior occurring 1–2 times per week. d Mean of four items asking about days per week with 30 min ofdifferent moderate-to-vigorous physical activities. Eight-point response scale ranged from 0 (none) to 7 (daily).
3.2. Statewide Rollout: Additional Adaptations in Progress and Preliminary Training Evaluation Results
As the statewide rollout of COMPASS was being planned and initiated, the OHCC expressed interestin further adaptations being made to COMPASS so that it would be inclusive of personal support workers.Within Oregon’s publicly funded programs, personal support workers provide care for individuals withcognitive and developmental disabilities who qualify for publicly funded support services. Servicerecipients’ ages range across the lifespan. This type of work was viewed to share many similarities withhome care work, but also pose some different safety, health, well-being demands that might suggestnew or revised guidebook activities and content. Investigators contracted with the OHCC to conductformative research with personal support workers (e.g., survey, qualitative interviews) and make tailoredcurriculum adjustments based on findings. Bundled in this new phase of dissemination work includedthe development of interactive online orientation training for new COMPASS facilitators and creatingpromotional videos for the program. It is anticipated that after COMPASS is revised to accommodatepersonal support workers, the OHCC will then translate the guidebooks into several non-English languagesto encourage non-native English speakers to participate in higher numbers.
As noted in the methods section, 12 COMPASS groups have been completed or are in progress inthe statewide rollout. For the current analysis, the OHCC provided training evaluations (n = 265) fromworkers who participated in COMPASS group meetings from summer 2017 to summer 2018. Two differenttraining evaluation question sets were completed by workers in the data set. An older version (but morerecent than the original OHCC training evaluation questions prior to the adaptation pilot) was completed by229 workers. A newer version, adjusted to better accommodate evaluations of the COMPASS dissemination,was completed by 36 workers. Table 4 provides mean ratings and standard deviations for the olderevaluation questions for each COMPASS meeting, as well as an overall average rating for each questionacross meetings. All mean ratings were above 4 (max = 5) on a scale where 1 = poor, 2 = fair, 3 = average,4 = good, and 5 = excellent. Table 5 reviews mean ratings and standard deviations for each question in thenew format, but not for each meeting due to insufficient data. For those questions mean ratings all averagedabove 3 (max = 4) on a scale where 1 = strongly disagree, 2 = disagree, 3 = agree, and 4 = strongly agree.Attendance data and evaluation data for other comparable OHCC classes are not yet available for analysis.
224
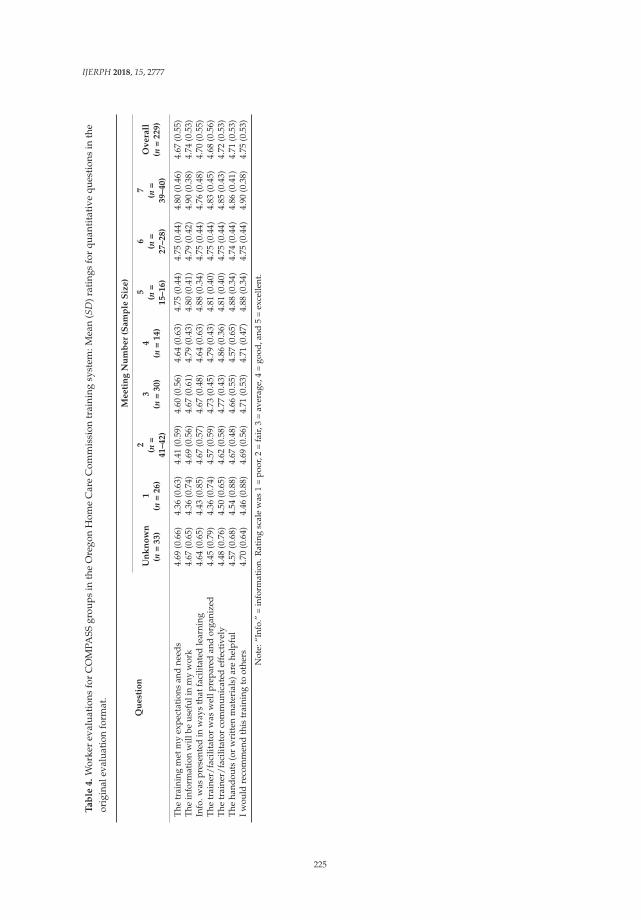
IJERPH 2018, 15, 2777
Ta
ble
4.
Wor
ker
eval
uat
ions
for
CO
MPA
SSgr
oup
sin
the
Ore
gon
Hom
eC
are
Com
mis
sion
trai
ning
syst
em:M
ean
(SD
)rat
ings
for
quan
tita
tive
ques
tion
sin
the
orig
inal
eval
uati
onfo
rmat
.
Qu
est
ion
Me
eti
ng
Nu
mb
er
(Sa
mp
leS
ize
)
Un
kn
ow
n(n
=3
3)
1(n
=2
6)
2(n
=4
1–
42
)
3(n
=3
0)
4(n
=1
4)
5(n
=1
5–
16
)
6(n
=2
7–
28
)
7(n
=3
9–
40
)
Ov
era
ll(n
=2
29
)
The
trai
ning
met
my
expe
ctat
ions
and
need
s4.
69(0
.66)
4.36
(0.6
3)4.
41(0
.59)
4.60
(0.5
6)4.
64(0
.63)
4.75
(0.4
4)4.
75(0
.44)
4.80
(0.4
6)4.
67(0
.55)
The
info
rmat
ion
will
beus
eful
inm
yw
ork
4.67
(0.6
5)4.
36(0
.74)
4.69
(0.5
6)4.
67(0
.61)
4.79
(0.4
3)4.
80(0
.41)
4.79
(0.4
2)4.
90(0
.38)
4.74
(0.5
3)In
fo.w
aspr
esen
ted
inw
ays
that
faci
litat
edle
arni
ng4.
64(0
.65)
4.43
(0.8
5)4.
67(0
.57)
4.67
(0.4
8)4.
64(0
.63)
4.88
(0.3
4)4.
75(0
.44)
4.76
(0.4
8)4.
70(0
.55)
The
trai
ner/
faci
litat
orw
asw
ellp
repa
red
and
orga
nize
d4.
45(0
.79)
4.36
(0.7
4)4.
57(0
.59)
4.73
(0.4
5)4.
79(0
.43)
4.81
(0.4
0)4.
75(0
.44)
4.83
(0.4
5)4.
68(0
.56)
The
trai
ner/
faci
litat
orco
mm
unic
ated
effe
ctiv
ely
4.48
(0.7
6)4.
50(0
.65)
4.62
(0.5
8)4.
77(0
.43)
4.86
(0.3
6)4.
81(0
.40)
4.75
(0.4
4)4.
85(0
.43)
4.72
(0.5
3)Th
eha
ndou
ts(o
rw
ritt
enm
ater
ials
)are
help
ful
4.57
(0.6
8)4.
54(0
.88)
4.67
(0.4
8)4.
66(0
.55)
4.57
(0.6
5)4.
88(0
.34)
4.74
(0.4
4)4.
86(0
.41)
4.71
(0.5
3)Iw
ould
reco
mm
end
this
trai
ning
toot
hers
4.70
(0.6
4)4.
46(0
.88)
4.69
(0.5
6)4.
71(0
.53)
4.71
(0.4
7)4.
88(0
.34)
4.75
(0.4
4)4.
90(0
.38)
4.75
(0.5
3)
Not
e:“I
nfo.
”=
info
rmat
ion.
Rat
ing
scal
ew
as1
=po
or,2
=fa
ir,3
=av
erag
e,4
=go
od,a
nd5
=ex
celle
nt.
225
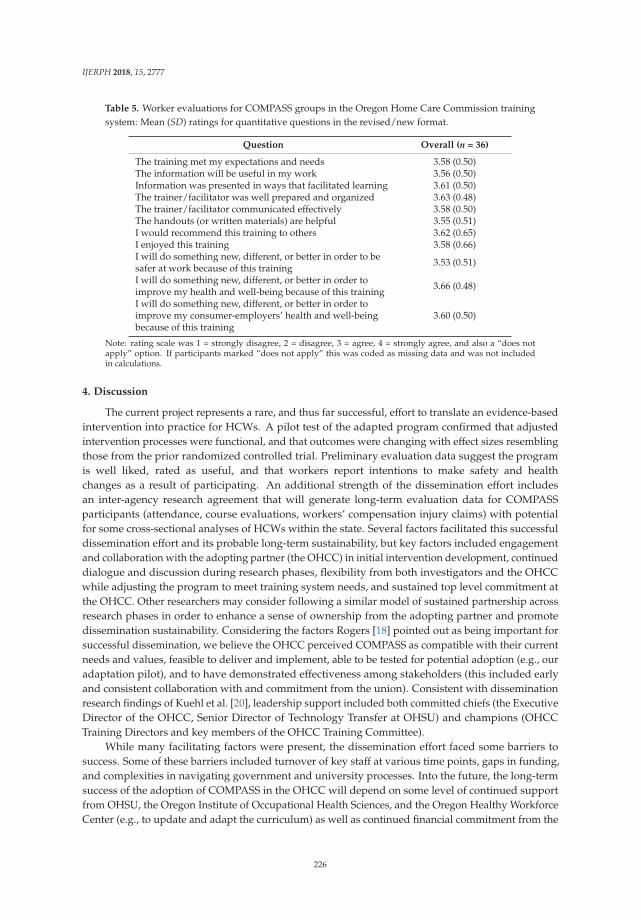
IJERPH 2018, 15, 2777
Table 5. Worker evaluations for COMPASS groups in the Oregon Home Care Commission trainingsystem: Mean (SD) ratings for quantitative questions in the revised/new format.
Question Overall (n = 36)
The training met my expectations and needs 3.58 (0.50)The information will be useful in my work 3.56 (0.50)Information was presented in ways that facilitated learning 3.61 (0.50)The trainer/facilitator was well prepared and organized 3.63 (0.48)The trainer/facilitator communicated effectively 3.58 (0.50)The handouts (or written materials) are helpful 3.55 (0.51)I would recommend this training to others 3.62 (0.65)I enjoyed this training 3.58 (0.66)I will do something new, different, or better in order to besafer at work because of this training 3.53 (0.51)
I will do something new, different, or better in order toimprove my health and well-being because of this training 3.66 (0.48)
I will do something new, different, or better in order toimprove my consumer-employers’ health and well-beingbecause of this training
3.60 (0.50)
Note: rating scale was 1 = strongly disagree, 2 = disagree, 3 = agree, 4 = strongly agree, and also a “does notapply” option. If participants marked “does not apply” this was coded as missing data and was not includedin calculations.
4. Discussion
The current project represents a rare, and thus far successful, effort to translate an evidence-basedintervention into practice for HCWs. A pilot test of the adapted program confirmed that adjustedintervention processes were functional, and that outcomes were changing with effect sizes resemblingthose from the prior randomized controlled trial. Preliminary evaluation data suggest the programis well liked, rated as useful, and that workers report intentions to make safety and healthchanges as a result of participating. An additional strength of the dissemination effort includesan inter-agency research agreement that will generate long-term evaluation data for COMPASSparticipants (attendance, course evaluations, workers’ compensation injury claims) with potentialfor some cross-sectional analyses of HCWs within the state. Several factors facilitated this successfuldissemination effort and its probable long-term sustainability, but key factors included engagementand collaboration with the adopting partner (the OHCC) in initial intervention development, continueddialogue and discussion during research phases, flexibility from both investigators and the OHCCwhile adjusting the program to meet training system needs, and sustained top level commitment atthe OHCC. Other researchers may consider following a similar model of sustained partnership acrossresearch phases in order to enhance a sense of ownership from the adopting partner and promotedissemination sustainability. Considering the factors Rogers [18] pointed out as being important forsuccessful dissemination, we believe the OHCC perceived COMPASS as compatible with their currentneeds and values, feasible to deliver and implement, able to be tested for potential adoption (e.g., ouradaptation pilot), and to have demonstrated effectiveness among stakeholders (this included earlyand consistent collaboration with and commitment from the union). Consistent with disseminationresearch findings of Kuehl et al. [20], leadership support included both committed chiefs (the ExecutiveDirector of the OHCC, Senior Director of Technology Transfer at OHSU) and champions (OHCCTraining Directors and key members of the OHCC Training Committee).
While many facilitating factors were present, the dissemination effort faced some barriers tosuccess. Some of these barriers included turnover of key staff at various time points, gaps in funding,and complexities in navigating government and university processes. Into the future, the long-termsuccess of the adoption of COMPASS in the OHCC will depend on some level of continued supportfrom OHSU, the Oregon Institute of Occupational Health Sciences, and the Oregon Healthy WorkforceCenter (e.g., to update and adapt the curriculum) as well as continued financial commitment from the
226
IJERPH 2018, 15, 2777
OHCC/state of Oregon to fund guidebook printing and wages for facilitators and workers. Stable statefunding for both the OHCC and the Oregon Institute of Occupational Health Sciences will be key, aswell as continued NIOSH funding for the Oregon Healthy Workforce Center. Thus, investigators andpartners at the OHCC will need to plan ahead, anticipating courses of action if any one of these sourcesof support is disrupted. This includes evolving structures at the Oregon Institute of OccupationalHealth Sciences to support translation and dissemination of evidence-based programs created by itsinvestigators and their collaborators.
Looking outside of the state of Oregon in the US, we recommend that researchers who aim todevelop, evaluate, and disseminate interventions for similar populations investigate institutionalstructures and potential partners within their target region. For publicly funded HCWs in Oregon,both union and governmental partners were equally engaged through intervention development andevaluation phases, but governmental partners played the most central role in the dissemination phasebecause of their ownership of the training system for publicly funded HCWs. In contrast, in ourneighboring state of Washington, an SEIU 775 Benefits Group “owns” and operates training programsfor publicly funded HCWs. Therefore, development and evaluation phases of an intervention forHCWs in Washington would similarly need to involve both government and labor partners, but duringa dissemination phase, the union benefits group would play the most central collaborative role.
Given that the literature on translation of Total Worker Health® interventions into practice is inits infancy, future dissemination and implementation science with effective programs is stronglyencouraged. For example, if interest in COMPASS expanded and resources are available to study anew dissemination effort, research could systematically evaluate organizational readiness factors andmeasure adoption and implementation of the program across multiple new organizations. Such futuredissemination science with any particular Total Worker Health®-informed intervention may be fruitfullyguided by recommendations and tools from Dugan and Punnett [32]. Based on their experiencedeveloping the Healthy Workplace Participatory Program, the authors provide examples of potentialdissemination and implementation studies and tools, such as the Five and Ten D&I Evaluation Tool toassess specific implementation outcomes.
5. Conclusions
HCWs are a priority population for protective interventions that advance their safety, health, andwell-being. Rapidly growing in number, HCWs help some of our most vulnerable citizens remainin their homes and enjoy a higher quality of life. In-home care may also create critical cost-savingsin the healthcare system by preventing older adults from transitioning prematurely to long-termcare facilities. While some interventions have research evidence for their effectiveness, and othervaluable tools and resources are available, we could not find a descriptive or empirical paper abouta successful research-to-practice intervention dissemination effort with HCWs. In this regard, thecurrent description of the adaptation and dissemination of COMPASS with the OHCC may helpguide future similar efforts with other partners or in other states. Consistent with previous findingsin the dissemination science literature, the success of the current effort was facilitated by severalfavorable factors that can be cultivated in future projects by other intervention scientists. These includeearly engagement and collaboration with industry and labor in the development of interventions,designing for feasibility and repeatability of intervention tactics, and sustained engagement overtime to foster strong relationships and top-level leadership commitment over the long term. We alsobelieve flexibility and persistence from all parties was essential for overcoming barriers as they arose.This persistence included a commitment to the effort during times when resources for disseminationefforts were scarce or uncertain. We are optimistic with continued contingency and structural planningthat the rollout of COMPASS will be sustained within the OHCC, with the ultimate potential toimprove the safety, health, and well-being of approximately 60% of the Oregon home care work force.
227
IJERPH 2018, 15, 2777
Author Contributions: All authors contributed substantially to the work reported. Conceptualization, R.O.,J.A.H., S.V.T., K.L.R., and M.M.; Methodology, R.O., J.A.H., S.V.T., K.L.R, K.N.P., and M.M.; Formal Analysis,K.N.P. and R.O.; Investigation, S.V.T., K.L.R., K.N.P. and R.O.; Data Curation, S.V.T., K.L.R., K.N.P. and R.O.;Writing-Original Draft Preparation, R.O. and A.R.; Writing-Review & Editing, R.O., J.A.H., S.V.T., A.R., K.N.P.,and K.L.R.; Visualization, R.O. and A.R.; Supervision, R.O.; Project Administration, S.V.T. and K.N.P.; FundingAcquisition, R.O., J.A.H., S.V.T., K.N.P, and M.M.
Funding: This research was funded by the National Institute for Occupational Safety & Health grant number(U19 OH010154), a contract from the Oregon Home Care Commission, and the Oregon Institute of OccupationalHealth Sciences.
Acknowledgments: We thank the leadership and staff at the Oregon Home Care Commission for their long-termcollaboration and commitment to the project (Cheryl Miller, Roberta Lilly, Kristen Eisenman, Leslie Houston,Kelly Rosenau, and many others). The Service Employees International Union Local 503 provided critical supportduring the development and evaluation of COMPASS, including feedback, guidance, and use of meeting spacesfor groups. We are grateful for Diane Elliot’s collaboration and contributions as a Co-Investigator during thepilot and RCT phases of the project. The “Fruits & Vegetables” and “Jeopardy” activities in the second meetingof COMPASS guidebook one (pre-dissemination editions) were developed by Diane Elliot, MD, FACSM, KerryKuehl, MD, DrPH, and Linn Goldberg, MD, FACSM, Division of Health Promotion and Sports Medicine, OHSU.Brad Wipfli and Robert Wright made important contributions to scripted content in Communication for HazardCorrection and Mental Health meetings in COMPASS guidebook one, and we thank Brian Luke Seaward for hispermission to adapt a stress coping activity for the disseminated version of the guidebooks. We thank KristenEisenman, Paul Weaver, Sydney Running, Vinesa Faaogea, and Lisa Olson for training evaluation data entry andprocessing. We also thank student interns and volunteers involved with the adaptation and dissemination phasesof the project, including Teala Alvord and Claire Boenisch.
Conflicts of Interest: The authors declare no conflict of interest. The funders had no role in the design of thestudy; in the analyses or interpretation of data; in the writing of the manuscript, and in the decision to publish theresults. The Oregon Home Care Commission played a collaborative role in planning COMPASS adaptations anddissemination strategies, and also collected and shared training evaluation data for the dissemination phase ofthe project.
References
1. Bureau of Labor Statistics. Occupational Outlook Handbook. Home Health Aides and Personal Care Aides.Available online: https://www.bls.gov/ooh/healthcare/home-health-aides-and-personal-care-aides.htm(accessed on 19 September 2018).
2. Mabry, L.; Parker, K.N.; Thompson, S.V.; Bettencourt, K.M.; Haque, A.; Luther Rhoten, K.; Wright, R.R.;Hess, J.A.; Olson, R. Protecting workers in the home care industry: Workers’ experienced job demands,resource gaps, and benefits following a socially supportive intervention. Home Health Care Serv. Q. 2018,1–18. [CrossRef] [PubMed]
3. Jacobs, K.; Perry, I.; MacGillvary, J. The High Public Cost of Low Wages; UC Berkeley: Berkeley, CA, USA, 2015.4. Quinn, M.M.; Markkanen, P.K.; Galligan, C.J.; Sama, S.R.; Kriebel, D.; Gore, R.J.; Brouillette, N.M.; Okyere, D.;
Sun, C.; Punnett, L.; et al. Occupational health of home care aides: Results of the safe home care survey.Occup. Environ. Med. 2016, 73, 237–245. [CrossRef] [PubMed]
5. Hanson, G.C.; Perrin, N.A.; Moss, H.; Laharnar, N.; Glass, N. Workplace violence against homecare workersand its relationship with workers health outcomes: A cross-sectional study. BMC Public Health 2015, 15, 11.[CrossRef] [PubMed]
6. Amuwo, S.; Lipscomb, J.; McPhaul, K.; Sokas, R.K. Reducing occupational risk for blood and body fluidexposure among home care aides: An intervention effectiveness study. Home Health Care Serv. Q. 2013, 32,234–248. [CrossRef] [PubMed]
7. Horneij, E.; Hemborg, B.; Jensen, I.; Ekdahl, C. No significant differences between intervention programmeson neck, shoulder and low back pain: A prospective randomized study among home-care personnel.J. Rehabil. Med. 2001, 33, 170–176. [CrossRef] [PubMed]
8. Pohjonen, T.; Ranta, R. Effects of worksite physical exercise intervention on physical fitness, perceived healthstatus, and work ability among home care workers: Five-year follow-up. Prev. Med. 2001, 32, 465–475.[CrossRef] [PubMed]
9. Toseland, R.W. Long-term effectiveness of peer-led and professionally led support groups for caregivers.Soc. Serv. Rev. 1990, 64, 308–327. [CrossRef]
228
IJERPH 2018, 15, 2777
10. Olson, R.; Thompson, S.V.; Elliot, D.L.; Hess, J.A.; Rhoten, K.L.; Parker, K.N.; Wright, R.R.; Wipfli, B.;Bettencourt, K.M.; Buckmaster, A.; et al. Safety and health support for home care workers: The COMPASSrandomized controlled trial. Am. J. Public Health 2016, 106, 1823–1832. [CrossRef]
11. UMassLowell Safe Home Care and Sustainable Hospitals Program. Safe Home Care Resources. Available online:https://www.uml.edu/Research/SHCH/Safe-Home-Care/Research-Areas/ (accessed on 7 October 2018).
12. National Institute for Occupational Safety and Health. Caring for Yourself While Caring for Others. Availableonline: https://www.cdc.gov/niosh/docs/2015-102/default.html (accessed on 7 October 2018).
13. Balas, E.A.; Boren, S.A. Managing Clinical Knowledge for Health Care Improvement. In Yearbook of MedicalInformatics; Schattauer Verlagsgesellschaft mbH: Stuttgart, Germany, 2000; pp. 65–70.
14. Bull, S.S.; Gillette, C.; Glasgow, R.E.; Estabrooks, P. Work site health promotion research: To what extent canwe generalize the results and what is needed to translate research to practice? Health Educ. Behav. 2003, 30,537–549. [CrossRef]
15. Harris, J.R.; Cheadle, A.; Hannon, P.A.; Lichiello, P.; Forehand, M.; Mahoney, E.; Snyder, S.; Yarrow, J. A frameworkfor disseminating evidence-based health promotion practices. Prev. Chronic Dis. 2012, 9, 110081. [CrossRef]
16. Matthews, L.; Kirk, A.; Macmillan, F.; Mutrie, N. Can physical activity interventions for adults withtype 2 diabetes be translated into practice settings? A systematic review using the RE-AIM framework.Transl. Behav. Med. 2014, 4, 60–78. [CrossRef] [PubMed]
17. Estabrooks, P.A.; Glasgow, R.E. Translating effective clinic-based physical activity interventions into practice.Am. J. Prev. Med. 2006, 31, S45–S56. [CrossRef] [PubMed]
18. Rogers, E.M. Diffusion of Innovations, 5th ed.; Free Press: New York, NY, USA, 2003.19. Healy, G.N.; Goode, A.; Schultz, D.; Lee, D.; Leahy, B.; Dunstan, D.W.; Gilson, N.D.; Eakin, E.G.
The BeUpstanding Program: Scaling up the Stand Up Australia workplace intervention for translationinto practice. AIMS Public Health 2016, 3, 341–347. [CrossRef] [PubMed]
20. Kuehl, H.; Mabry, L.; Elliot, D.L.; Kuehl, K.S.; Favorite, K.C. Factors in adoption of a fire department wellnessprogram: Champ-and-chief model. J. Occup. Environ. Med. 2013, 55, 424–429. [CrossRef] [PubMed]
21. Olson, R.; Elliot, D.; Hess, J.; Thompson, S.; Luther, K.; Wipfli, B.; Wright, R.; Buckmaster, A.M.The COMmunity of Practice And Safety Support (COMPASS) Total Worker Health study among homecare workers: Study protocol for a randomized controlled trial. Trials 2014, 15, 411. [CrossRef] [PubMed]
22. Olson, R.; Wright, R.R.; Elliot, D.L.; Hess, J.A.; Thompson, S.; Buckmaster, A.; Luther, K.; Wipfli, B.The COMPASS pilot study: A Total Worker Health intervention for home care workers. J. Occup.Environ. Med. 2015, 57, 406–416. [CrossRef] [PubMed]
23. Toseland, R.W.; Rossiter, C.M.; Labrecque, M.S. The effectiveness of peer-led and professionally led groupsto support family caregivers. Gerontologist 1989, 29, 465–471. [CrossRef] [PubMed]
24. Delbecq, J.; DeSchryver Mueller, C. The Ignatian Faculty Forum: A transformative faculty formation program.Connections 2012, 12, 5–9.
25. Elliot, D.L.; Goldberg, L.; Moe, E.L.; DeFrancesco, C.L.; Durham, M.B.; Hix-Small, H. Preventing substanceuse and disordered eating: Initial outcomes of the ATHENA (Athletes Targeting Healthy Exercise & NutritionAlternatives) program. Arch. Pediatr. Adolesc. Med. 2004, 158, 1043–1049.
26. Elliot, D.L.; Goldberg, L.; Kuehl, K.S.; Moe, E.L.; Breger, R.K.R.; Pickering, M.A. The PHLAME (PromotingHealthy Lifestyles: Alternative Models’ Effects) firefighter study: Outcomes of two models of behaviorchange. J. Occup. Environ. Med. 2007, 49, 204–213. [CrossRef]
27. Goldberg, L.; Elliot, D.L.; Clarke, G.N.; MacKinnon, D.P.; Zoref, L.; Moe, E.; Green, C.; Wolf, S.L.The adolescents training and learning to avoid steroids (ATLAS) prevention program: Background andresults of a model intervention. Arch. Pediatr. Adolesc. Med. 1996, 150, 713–721. [CrossRef] [PubMed]
28. Kuehl, K.S.; Elliot, D.L.; Goldberg, L.; MacKinnon, D.P.; Vila, B.J.; Smith, J.L.; Miocevic, M.; O’Rourke, H.P.;Valente, M.; DeFrancesco, C. The safety and health improvement: Enhancing Law Enforcement DepartmentsStudy: Feasibility and findings. Front. Public Health 2014, 2, 38. [CrossRef] [PubMed]
29. Cadiz, D.; Sawyer, J.E.; Griffith, T.L. Developing and validating field measurement scales for absorptivecapacity and experienced community of practice. Educ. Psychol. Meas. 2009, 69, 1035–1058. [CrossRef]
30. Buxton, O.M.; Quintilliani, L.M.; Yang, M.H.; Ebbeling, C.B.; Stoddard, A.M.; Pereira, L.K.; Sorensen, G.Association of sleep adequacy with more healthful food choices and positive workplace experiences amongmotor freight workers. Am. J. Public Health 2009, 99, S636–S643. [CrossRef] [PubMed]
229

IJERPH 2018, 15, 2777
31. Ware, J.E.J.; Kosinkski, M.; Keller, S.D. A 12-item short-form health survey: Construction of the scales andpreliminary tests of reliability and validity. Med. Care 1996, 34, 220–233. [CrossRef] [PubMed]
32. Dugan, A.G.; Punnett, L. Dissemination and implementation research for occupational safety and health.Occup. Health Sci. 2017, 1, 29–45. [CrossRef] [PubMed]
© 2018 by the authors. Licensee MDPI, Basel, Switzerland. This article is an open accessarticle distributed under the terms and conditions of the Creative Commons Attribution(CC BY) license (http://creativecommons.org/licenses/by/4.0/).
230
International Journal of
Environmental Research
and Public Health
Article
Implementation of the Healthy WorkplaceParticipatory Program in a Retail Setting:A Feasibility Study and Framework for Evaluation
Jaime R. Strickland * , Anna M. Kinghorn, Bradley A. Evanoff and Ann Marie Dale
Division of General Medical Sciences, Washington University School of Medicine, Saint Louis, MO 63110, USA;[email protected] (A.M.K.); [email protected] (B.A.E.); [email protected] (A.M.D.)* Correspondence: [email protected]; Tel.: +1-314-454-7337
Received: 31 December 2018; Accepted: 14 February 2019; Published: 18 February 2019
Abstract: Participatory methods used in Total Worker Health® programs have not been well studied,and little is known about what is needed to successfully implement these programs. We conducteda participatory health promotion program with grocery store workers using the Healthy WorkplaceParticipatory Program (HWPP) from the Center for the Promotion of Health in the New EnglandWorkplace. We recruited a design team made up of six line-level workers and a steering committeewith management and union representatives; a research team member facilitated the program. Usinga formal evaluation framework, we measured program implementation including workplace context,fidelity to HWPP materials, design team and steering committee engagement, program outputs,and perceptions of the program. The HWPP was moderately successful in this setting, but requireda substantial amount of worker and facilitator time. Design team members did not have the skillsneeded to move through the process and the steering committee did not offer adequate supportto compensate for the team’s shortfall. The evaluation framework provided a simple and practicalmethod for identifying barriers to program delivery. Future studies should address these barriers todelivery and explore translation of this program to other settings.
Keywords: Total Worker Health; participatory methods; program implementation; organizationalreadiness; process evaluation; logic model
1. Introduction
More than one-third of current U.S. workers suffer from at least one chronic disease, includingheart disease, cancer, diabetes, stroke, and musculoskeletal disorders [1,2]. Working adults withchronic disease are more likely to have a reduced working capacity and greater difficulty staying atwork than their healthy peers [3,4]. These chronic health conditions have an enormous impact in thelives of workers, but they also place a burden on their employers [3,5]. Healthy behaviors can reducethe effects of chronic conditions for better work (fewer missed days, increased productivity) and health(less musculoskeletal pain, improved mental health) outcomes [5–10].
The workplace is an ideal place for supporting healthy behaviors, since workers spenda large portion of their day in the work environment and coworkers and supervisors can providesubstantial support. Traditionally, worksite health promotion programs have been separate fromother occupational health and safety efforts, and usually target only the individual, ignoring workorganization and work environment factors that affect worker behavior. The National Institute forOccupational Safety and Health (NIOSH’s) Total Worker Health® (TWH) approach highlights the needfor “policies, programs, and practices that integrate protection from work-related safety and healthhazards with promotion of injury and illness prevention efforts to advance worker well-being” [11].The TWH approach recognizes that work is a social determinant of health, and that workplace factors
IJERPH 2019, 16, 590; doi:10.3390/ijerph16040590 www.mdpi.com/journal/ijerph231
IJERPH 2019, 16, 590
such as work hours, relationships with coworkers and supervisors, and access to health and wellnessprograms have important effects on worker health and well-being. Further, TWH principles recognizethe Hierarchy of Controls framework to illustrate that system-level interventions are more effectivethan individual-level interventions [12].
Regardless of the level of intervention, the most effective interventions are those that take intoconsideration the unique characteristics and perspectives of the end users [13,14]. Participatorymethods such as Participatory Action Research and Participatory Ergonomics promote the inclusionof end users in the intervention development process [14–20]. These end users may be line-levelworkers who directly benefit from the intervention, managers or others who implement and monitorinterventions, or others who are impacted by the interventions in some way. Including these usersin the process allows their perspectives to be considered in identifying both workplace healthhazards and possible barriers to adopting or participating in the planned interventions. Participatorymethods are increasingly being used in Total Worker Health research and practice [14,17,21–28].The most thoroughly studied participatory program in the TWH literature to date is the HealthyWorkplace Participatory Program (HWPP) developed by the Center for the Promotion of Health in theNew England Workplace (CPH-NEW). The HWPP is a worker-management participatory programdesigned to develop solutions for workplace problems that involve front-line workers. The freelyavailable online program includes step-by-step guidance for assembling the participants, identifyingproblems, and developing and implementing solutions. The developers note the importance oforganizational readiness and leadership support, and have recently developed a checklist to measureorganizational readiness as well as a Process Evaluation Rating Sheet (PERS) and ManagementDashboard [18,29]. This promising and relatively new program has been used in various worksettings including corrections facilities, real estate, non-profit healthcare and social assistance agencies,and state government executive offices [28,30]. Publications to date provide little practical advicefor implementing the HWPP program (e.g., characteristics most important for success, total timecommitment, expectations of the design team, facilitator role). Further, the TWH literature as a wholediscusses the utility of participatory approaches, but offers little guidance on how to comprehensivelyevaluate both implementation and efficacy of these programs while simultaneously considering thecontexts in which they are delivered [12,13,31,32].
We sought to evaluate the feasibility of conducting a participatory health promotion programin a retail grocery store setting. We partnered with a regional grocery store chain who expressedinterest in supporting their workers’ health. Using the HWPP as a facilitation guide, we formed ateam of grocery store workers and evaluated their ability to create meaningful and relevant workplacehealth activities that promote and support healthy behaviors in their workforce. The purpose ofthis paper is twofold: (1) to inform others considering a participatory intervention by describing theimplementation of this HWPP program, and (2) to describe a framework for evaluating complex TWHinterventions, such as the HWPP.
2. Materials and Methods
2.1. Overview and Employer Context
This study was an extension of a partnership with a labor union and several regional grocerystore chains who had participated in a preliminary study examining workplace factors related tohealth behaviors and obesity [33,34]. Upon completion of that study, we approached our partnersabout piloting the HWPP in one store. We explained that the goal of the program was to develop andimplement health and wellness initiatives to promote health in the workplace setting and supportworkers’ efforts to make positive health changes; one of the grocers agreed to participate.
The study period was from September 2014 to June 2016, during which time we piloted the HWPPprogram, collected process measures, and collected baseline and follow-up worker assessments by
232
IJERPH 2019, 16, 590
surveys and focus groups. The Institutional Review Board at Washington University approved allresearch activities and all participants provided informed consent.
2.2. Program Description
2.2.1. HWPP Model and IDEAS Tool
The HWPP model includes a design team made up of front-line workers and a steering committeecomprised of multiple management levels [35]. These two teams work together, with the help ofa program facilitator, to create health and wellness activities for their workplace. The model uses theIntervention Design and Analysis Scorecard (IDEAS Tool) which includes seven steps: (1) identifyproblems and contributing factors, (2) develop intervention objectives and activities, (3) set selectioncriteria, (4) apply selection criteria, (5A) rate intervention activities, (5B) select intervention activities,(6) plan and implement intervention activities, and 7) monitor and evaluate intervention activities [21,36]. With the guidance of the facilitator, the design team works through these steps using worksheetsto create intervention options (Steps 1–5A) to present to the steering committee (Step 5B); both teamswork together to implement and monitor the intervention activities (Steps 6–7).
2.2.2. Planning & Roles
At study initiation, the research team met with the grocer’s management to describe the study andoutline the project’s goal: To trial a participatory process as a method to generate ideas that promoteworker health. They outlined the rationale for participatory programs and discussed the expectationsand roles of both the employer (i.e., grocer) and research team. The grocer was willing to trial theprogram in one store and agreed to: (1) help form a representative steering committee and designteam; (2) assist with scheduling design team meetings and allowing design team members to meetduring work hours, provided they clock out for meetings; (3) provide a meeting space; and (4) provideaccess to store workers for data collection. It was expected that the research team would assumeresponsibility and costs for program facilitation and data collection. The research team also made thedecision to pay design team members for their time to attend meetings since they were not able tomeet on paid work time; they were paid $25 per meeting.
A research team member with experience in workplace interventions and group facilitationserved as the facilitator; two additional research team members assisted in program developmentand attended meetings to collect process measures. The facilitator’s role was to guide the DesignTeam through the IDEAS Tool by teaching them the process, planning and running team meetings,and acting as a liaison between the Design Team & Steering Committee. Along with the researchteam, the facilitator created an agenda and timeline based on the IDEAS Tool and activities from theHWPP toolkit [36]. The initial program plan consisted of seven, one-hour meetings over the course ofnine weeks, with two optional meetings scheduled if needed to complete steps 1–5A of the IDEASTool. Considering that the program was initiated within the context of a time-limited research study,the facilitator’s goal was to complete one or two cycles of the IDEAS Tool with the Design Team andidentify a leader from among the group who could assume the facilitator role and thus ensure programsustainability beyond the study period. Additionally, the HWPP model suggests that employerscollect baseline data on the workforce characteristics and health status, and environment or workprocesses that would aid the design team to creating meaningful interventions [35]. The researchteam took responsibility for collecting this data; we conducted worker surveys (n = 120) and focusgroups (n = 19) to gather information about current health status, behaviors, and health beliefs of storeworkers, as well as information about existing workplace supports for health [37–44]. The DesignTeam’s main role was to complete the IDEAS Tool worksheets, creating intervention options relevantto their work environment to present to the Steering Committee for consideration. After SteeringCommittee approval, the Design Team was to work together with the Steering Committee to finalizeand implement intervention activities. While the majority of the program was designed to take place
233
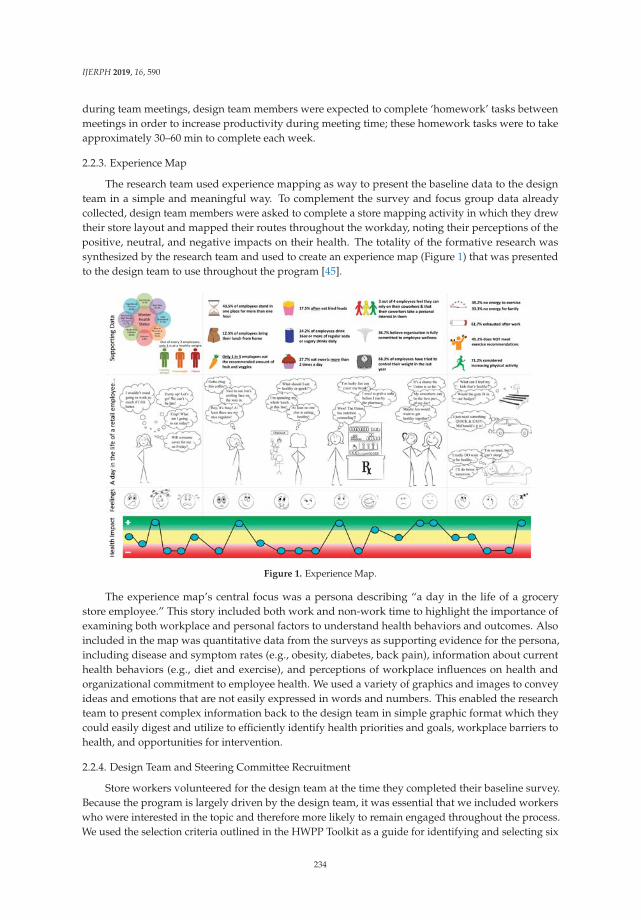
IJERPH 2019, 16, 590
during team meetings, design team members were expected to complete ‘homework’ tasks betweenmeetings in order to increase productivity during meeting time; these homework tasks were to takeapproximately 30–60 min to complete each week.
2.2.3. Experience Map
The research team used experience mapping as way to present the baseline data to the designteam in a simple and meaningful way. To complement the survey and focus group data alreadycollected, design team members were asked to complete a store mapping activity in which they drewtheir store layout and mapped their routes throughout the workday, noting their perceptions of thepositive, neutral, and negative impacts on their health. The totality of the formative research wassynthesized by the research team and used to create an experience map (Figure 1) that was presentedto the design team to use throughout the program [45].
Figure 1. Experience Map.
The experience map’s central focus was a persona describing “a day in the life of a grocerystore employee.” This story included both work and non-work time to highlight the importance ofexamining both workplace and personal factors to understand health behaviors and outcomes. Alsoincluded in the map was quantitative data from the surveys as supporting evidence for the persona,including disease and symptom rates (e.g., obesity, diabetes, back pain), information about currenthealth behaviors (e.g., diet and exercise), and perceptions of workplace influences on health andorganizational commitment to employee health. We used a variety of graphics and images to conveyideas and emotions that are not easily expressed in words and numbers. This enabled the researchteam to present complex information back to the design team in simple graphic format which theycould easily digest and utilize to efficiently identify health priorities and goals, workplace barriers tohealth, and opportunities for intervention.
2.2.4. Design Team and Steering Committee Recruitment
Store workers volunteered for the design team at the time they completed their baseline survey.Because the program is largely driven by the design team, it was essential that we included workerswho were interested in the topic and therefore more likely to remain engaged throughout the process.We used the selection criteria outlined in the HWPP Toolkit as a guide for identifying and selecting six
234
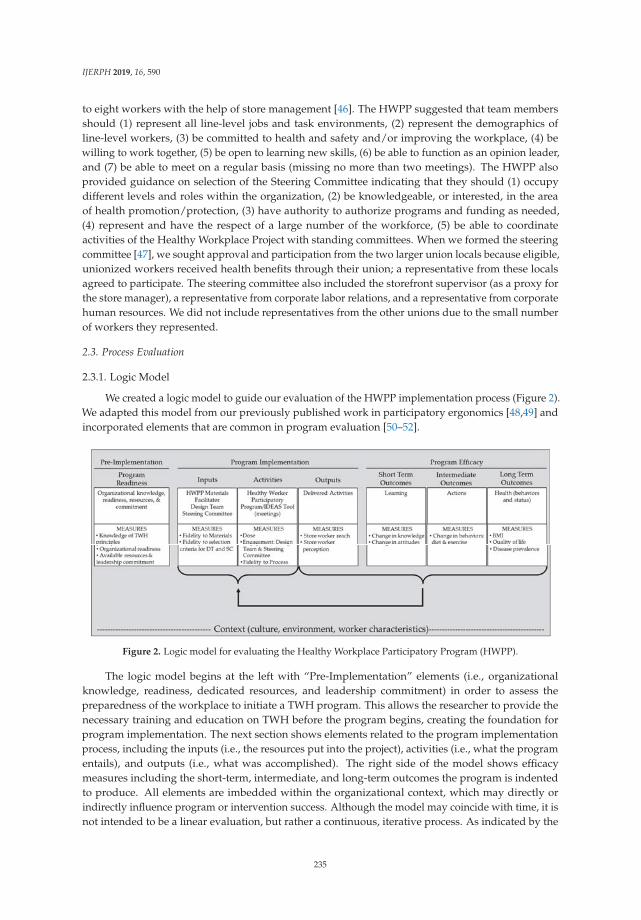
IJERPH 2019, 16, 590
to eight workers with the help of store management [46]. The HWPP suggested that team membersshould (1) represent all line-level jobs and task environments, (2) represent the demographics ofline-level workers, (3) be committed to health and safety and/or improving the workplace, (4) bewilling to work together, (5) be open to learning new skills, (6) be able to function as an opinion leader,and (7) be able to meet on a regular basis (missing no more than two meetings). The HWPP alsoprovided guidance on selection of the Steering Committee indicating that they should (1) occupydifferent levels and roles within the organization, (2) be knowledgeable, or interested, in the areaof health promotion/protection, (3) have authority to authorize programs and funding as needed,(4) represent and have the respect of a large number of the workforce, (5) be able to coordinateactivities of the Healthy Workplace Project with standing committees. When we formed the steeringcommittee [47], we sought approval and participation from the two larger union locals because eligible,unionized workers received health benefits through their union; a representative from these localsagreed to participate. The steering committee also included the storefront supervisor (as a proxy forthe store manager), a representative from corporate labor relations, and a representative from corporatehuman resources. We did not include representatives from the other unions due to the small numberof workers they represented.
2.3. Process Evaluation
2.3.1. Logic Model
We created a logic model to guide our evaluation of the HWPP implementation process (Figure 2).We adapted this model from our previously published work in participatory ergonomics [48,49] andincorporated elements that are common in program evaluation [50–52].
Figure 2. Logic model for evaluating the Healthy Workplace Participatory Program (HWPP).
The logic model begins at the left with “Pre-Implementation” elements (i.e., organizationalknowledge, readiness, dedicated resources, and leadership commitment) in order to assess thepreparedness of the workplace to initiate a TWH program. This allows the researcher to provide thenecessary training and education on TWH before the program begins, creating the foundation forprogram implementation. The next section shows elements related to the program implementationprocess, including the inputs (i.e., the resources put into the project), activities (i.e., what the programentails), and outputs (i.e., what was accomplished). The right side of the model shows efficacymeasures including the short-term, intermediate, and long-term outcomes the program is indentedto produce. All elements are imbedded within the organizational context, which may directly orindirectly influence program or intervention success. Although the model may coincide with time, it isnot intended to be a linear evaluation, but rather a continuous, iterative process. As indicated by the
235
IJERPH 2019, 16, 590
brackets, the evaluation of outputs and outcomes will be fed back to inform inputs and activities. Thiscircular process allows periodic evaluation and adjustment of the program as necessary. The evaluationin this paper focuses specifically on the implementation process within the context of a unionizedgrocery store setting. Due to time and resource limitations, we did not measure pre-implementationelements or program efficacy.
2.3.2. Data Collection
To measure program implementation, the research team collected both qualitative and quantitativedata using multiple tools. For each design team meeting, the research team completed field logs anddebriefing notes to measure dose (frequency and duration of meetings) and fidelity to the HWPPmaterials and IDEAS Tool, and rated four dimensions of team member engagement (offered new ideasduring meetings, actively participated in meeting, completed homework, and discussed projects withco-workers) on a 3-point scale (0 = no; 0.5 = somewhat; 1 = yes). The design team also rated their ownparticipation and completed meeting reflections [53]. After the completion of the program, the designteam members completed semi-structured interviews and a short survey to record final perceptions ofboth the program and the team’s ability to move forward with implementing solutions without thesupport of the research team. All store workers were surveyed about their awareness and utilizationof the implemented activities three months after they were implemented. The survey asked whatchanges related to health and wellness they had noticed in their store over the study period, and if theyhad participated in any of the health activities. We asked if any of the activities “helped them improve(their) eating/and or exercise habits,” what limitations prevented them from participating in the healthactivities listed, and if the activities were relevant to their life. We also conducted semi-structuredinterviews with five store workers to further gauge their perceptions of the activities implemented intheir workplace.
2.3.3. Data Analysis
We used SPSS v. 23 (IBM, Armonk, NY, USA) to run descriptive statistics for baselinedemographics and with store worker follow up surveys for program reach metrics (i.e., awarenessand use of activities). We rated all process components according to the measures described in ourlogic model. A process measure of design team participation was the average rating of each teammember’s engagement scores across meetings. Qualitative data was not systematically coded, but eachqualitative item was reviewed with consensus by the research team to summarize each process measure.Qualitative data was also used to provide descriptive information to support the quantitative results.
3. Results
3.1. Model Context
The participating grocery store chain offered a large, busy store that was located ina demographically diverse neighborhood. This store was chosen because of the diverse employee andcustomer demographics, as well as the store manager, who was enthusiastic about the program. Afterthe initiation of the program, this store manager was transferred to another store; the replacementmanager was not as invested in the study. During the project planning phase, store managementagreed to adjust work schedules of design team members so they would be scheduled to work onmeeting days, and could attend meetings immediately before or after their scheduled shift; this didnot always happen over the course of the program. Store management provided a space for the designteam to meet on site, although it was not always private due to limited space options in the store.
The selected store employed approximately 159 workers, roughly 40% of whom were full-timeemployees. We obtained baseline surveys from 120 workers (75% response rate); their demographicsare presented in Table 1. The majority of the workforce was unionized and represented by one of fivedifferent unions/locals within the store.
236
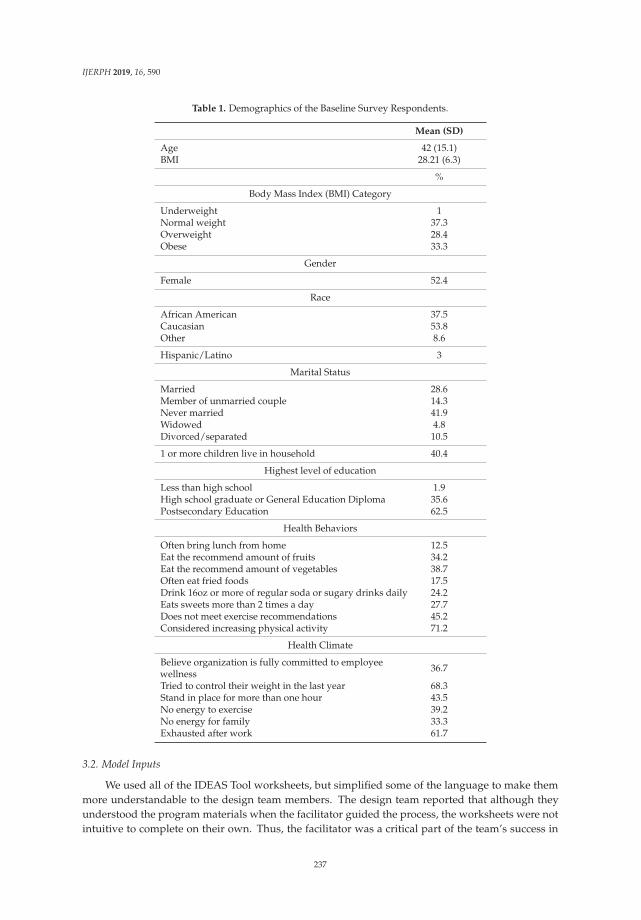
IJERPH 2019, 16, 590
Table 1. Demographics of the Baseline Survey Respondents.
Mean (SD)
Age 42 (15.1)BMI 28.21 (6.3)
%
Body Mass Index (BMI) Category
Underweight 1Normal weight 37.3Overweight 28.4Obese 33.3
Gender
Female 52.4
Race
African American 37.5Caucasian 53.8Other 8.6
Hispanic/Latino 3
Marital Status
Married 28.6Member of unmarried couple 14.3Never married 41.9Widowed 4.8Divorced/separated 10.5
1 or more children live in household 40.4
Highest level of education
Less than high school 1.9High school graduate or General Education Diploma 35.6Postsecondary Education 62.5
Health Behaviors
Often bring lunch from home 12.5Eat the recommend amount of fruits 34.2Eat the recommend amount of vegetables 38.7Often eat fried foods 17.5Drink 16oz or more of regular soda or sugary drinks daily 24.2Eats sweets more than 2 times a day 27.7Does not meet exercise recommendations 45.2Considered increasing physical activity 71.2
Health Climate
Believe organization is fully committed to employeewellness 36.7
Tried to control their weight in the last year 68.3Stand in place for more than one hour 43.5No energy to exercise 39.2No energy for family 33.3Exhausted after work 61.7
3.2. Model Inputs
We used all of the IDEAS Tool worksheets, but simplified some of the language to make themmore understandable to the design team members. The design team reported that although theyunderstood the program materials when the facilitator guided the process, the worksheets were notintuitive to complete on their own. Thus, the facilitator was a critical part of the team’s success in
237
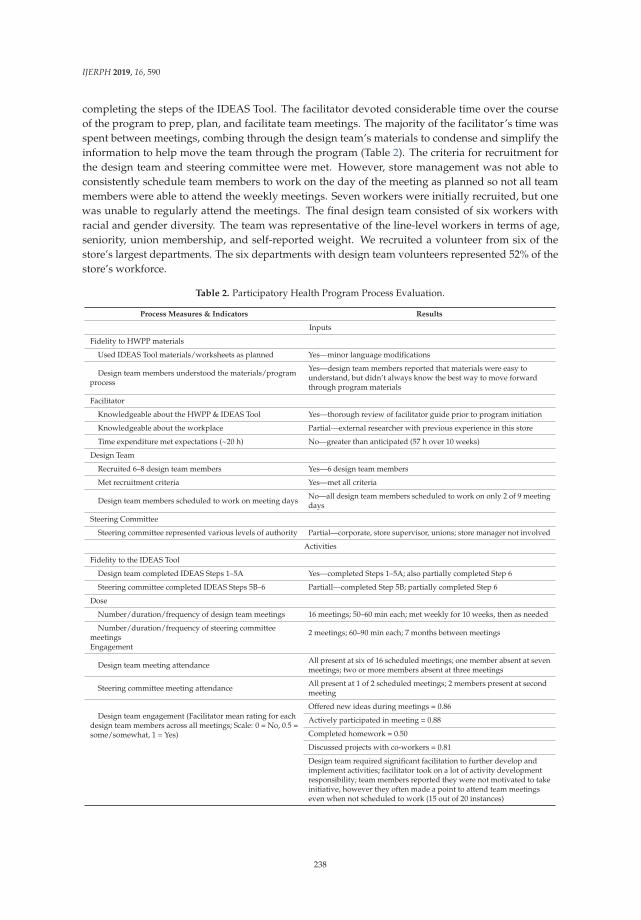
IJERPH 2019, 16, 590
completing the steps of the IDEAS Tool. The facilitator devoted considerable time over the courseof the program to prep, plan, and facilitate team meetings. The majority of the facilitator’s time wasspent between meetings, combing through the design team’s materials to condense and simplify theinformation to help move the team through the program (Table 2). The criteria for recruitment forthe design team and steering committee were met. However, store management was not able toconsistently schedule team members to work on the day of the meeting as planned so not all teammembers were able to attend the weekly meetings. Seven workers were initially recruited, but onewas unable to regularly attend the meetings. The final design team consisted of six workers withracial and gender diversity. The team was representative of the line-level workers in terms of age,seniority, union membership, and self-reported weight. We recruited a volunteer from six of thestore’s largest departments. The six departments with design team volunteers represented 52% of thestore’s workforce.
Table 2. Participatory Health Program Process Evaluation.
Process Measures & Indicators Results
Inputs
Fidelity to HWPP materials
Used IDEAS Tool materials/worksheets as planned Yes—minor language modifications
Design team members understood the materials/programprocess
Yes—design team members reported that materials were easy tounderstand, but didn’t always know the best way to move forwardthrough program materials
Facilitator
Knowledgeable about the HWPP & IDEAS Tool Yes—thorough review of facilitator guide prior to program initiation
Knowledgeable about the workplace Partial—external researcher with previous experience in this store
Time expenditure met expectations (~20 h) No—greater than anticipated (57 h over 10 weeks)
Design Team
Recruited 6–8 design team members Yes—6 design team members
Met recruitment criteria Yes—met all criteria
Design team members scheduled to work on meeting days No—all design team members scheduled to work on only 2 of 9 meetingdays
Steering Committee
Steering committee represented various levels of authority Partial—corporate, store supervisor, unions; store manager not involved
Activities
Fidelity to the IDEAS Tool
Design team completed IDEAS Steps 1–5A Yes—completed Steps 1–5A; also partially completed Step 6
Steering committee completed IDEAS Steps 5B–6 Partiall—completed Step 5B; partially completed Step 6
Dose
Number/duration/frequency of design team meetings 16 meetings; 50–60 min each; met weekly for 10 weeks, then as needed
Number/duration/frequency of steering committeemeetings 2 meetings; 60–90 min each; 7 months between meetings
Engagement
Design team meeting attendance All present at six of 16 scheduled meetings; one member absent at sevenmeetings; two or more members absent at three meetings
Steering committee meeting attendance All present at 1 of 2 scheduled meetings; 2 members present at secondmeeting
Design team engagement (Facilitator mean rating for eachdesign team members across all meetings; Scale: 0 = No, 0.5 =some/somewhat, 1 = Yes)
Offered new ideas during meetings = 0.86
Actively participated in meeting = 0.88
Completed homework = 0.50
Discussed projects with co-workers = 0.81
Design team required significant facilitation to further develop andimplement activities; facilitator took on a lot of activity developmentresponsibility; team members reported they were not motivated to takeinitiative, however they often made a point to attend team meetingseven when not scheduled to work (15 out of 20 instances)
238
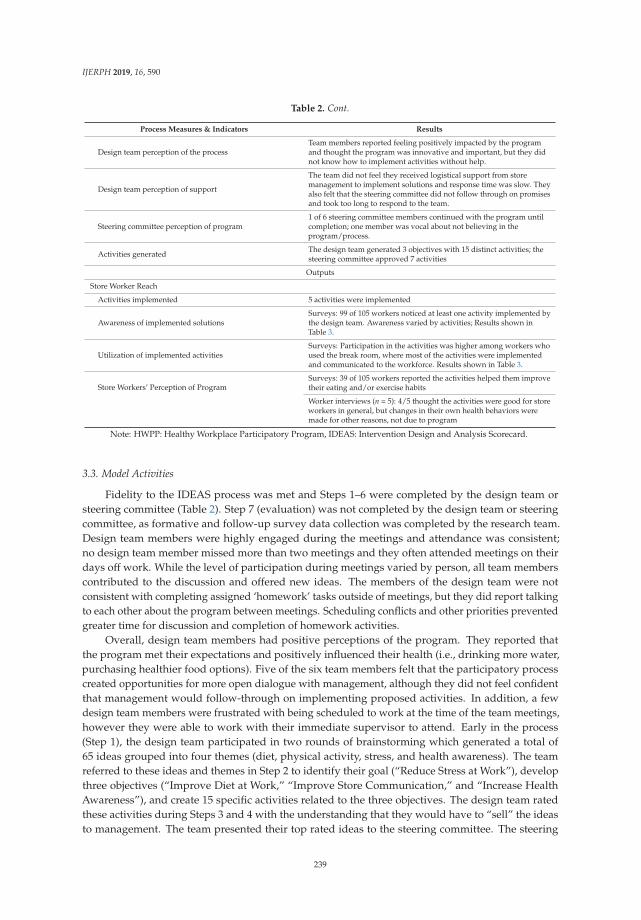
IJERPH 2019, 16, 590
Table 2. Cont.
Process Measures & Indicators Results
Design team perception of the processTeam members reported feeling positively impacted by the programand thought the program was innovative and important, but they didnot know how to implement activities without help.
Design team perception of support
The team did not feel they received logistical support from storemanagement to implement solutions and response time was slow. Theyalso felt that the steering committee did not follow through on promisesand took too long to respond to the team.
Steering committee perception of program1 of 6 steering committee members continued with the program untilcompletion; one member was vocal about not believing in theprogram/process.
Activities generated The design team generated 3 objectives with 15 distinct activities; thesteering committee approved 7 activities
Outputs
Store Worker Reach
Activities implemented 5 activities were implemented
Awareness of implemented solutionsSurveys: 99 of 105 workers noticed at least one activity implemented bythe design team. Awareness varied by activities; Results shown inTable 3.
Utilization of implemented activitiesSurveys: Participation in the activities was higher among workers whoused the break room, where most of the activities were implementedand communicated to the workforce. Results shown in Table 3.
Store Workers’ Perception of ProgramSurveys: 39 of 105 workers reported the activities helped them improvetheir eating and/or exercise habits
Worker interviews (n = 5): 4/5 thought the activities were good for storeworkers in general, but changes in their own health behaviors weremade for other reasons, not due to program
Note: HWPP: Healthy Workplace Participatory Program, IDEAS: Intervention Design and Analysis Scorecard.
3.3. Model Activities
Fidelity to the IDEAS process was met and Steps 1–6 were completed by the design team orsteering committee (Table 2). Step 7 (evaluation) was not completed by the design team or steeringcommittee, as formative and follow-up survey data collection was completed by the research team.Design team members were highly engaged during the meetings and attendance was consistent;no design team member missed more than two meetings and they often attended meetings on theirdays off work. While the level of participation during meetings varied by person, all team memberscontributed to the discussion and offered new ideas. The members of the design team were notconsistent with completing assigned ‘homework’ tasks outside of meetings, but they did report talkingto each other about the program between meetings. Scheduling conflicts and other priorities preventedgreater time for discussion and completion of homework activities.
Overall, design team members had positive perceptions of the program. They reported thatthe program met their expectations and positively influenced their health (i.e., drinking more water,purchasing healthier food options). Five of the six team members felt that the participatory processcreated opportunities for more open dialogue with management, although they did not feel confidentthat management would follow-through on implementing proposed activities. In addition, a fewdesign team members were frustrated with being scheduled to work at the time of the team meetings,however they were able to work with their immediate supervisor to attend. Early in the process(Step 1), the design team participated in two rounds of brainstorming which generated a total of65 ideas grouped into four themes (diet, physical activity, stress, and health awareness). The teamreferred to these ideas and themes in Step 2 to identify their goal (“Reduce Stress at Work”), developthree objectives (“Improve Diet at Work,” “Improve Store Communication,” and “Increase HealthAwareness”), and create 15 specific activities related to the three objectives. The design team ratedthese activities during Steps 3 and 4 with the understanding that they would have to “sell” the ideasto management. The team presented their top rated ideas to the steering committee. The steering
239
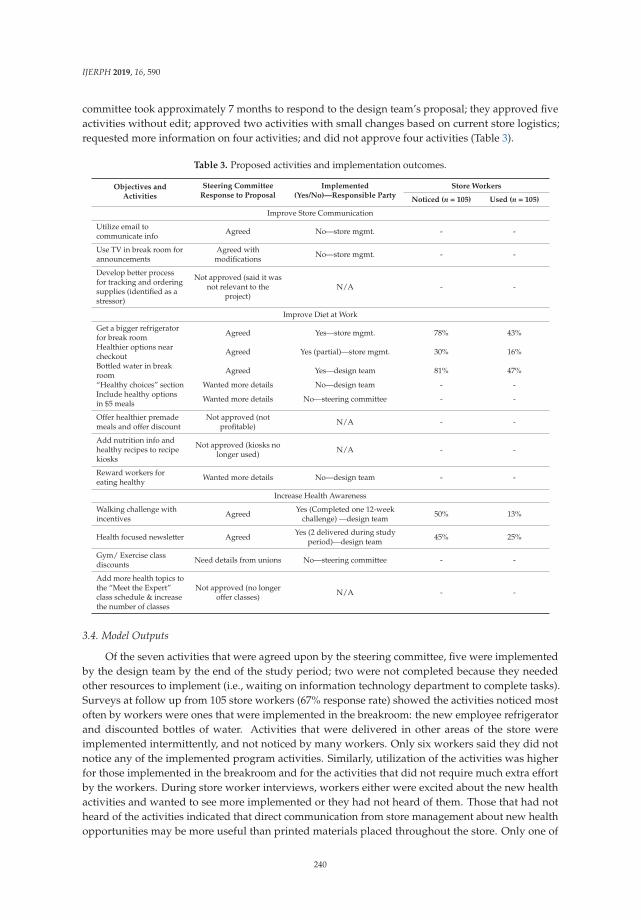
IJERPH 2019, 16, 590
committee took approximately 7 months to respond to the design team’s proposal; they approved fiveactivities without edit; approved two activities with small changes based on current store logistics;requested more information on four activities; and did not approve four activities (Table 3).
Table 3. Proposed activities and implementation outcomes.
Objectives andActivities
Steering CommitteeResponse to Proposal
Implemented(Yes/No)—Responsible Party
Store Workers
Noticed (n = 105) Used (n = 105)
Improve Store Communication
Utilize email tocommunicate info Agreed No—store mgmt. - -
Use TV in break room forannouncements
Agreed withmodifications No—store mgmt. - -
Develop better processfor tracking and orderingsupplies (identified as astressor)
Not approved (said it wasnot relevant to the
project)N/A - -
Improve Diet at Work
Get a bigger refrigeratorfor break room Agreed Yes—store mgmt. 78% 43%
Healthier options nearcheckout Agreed Yes (partial)—store mgmt. 30% 16%
Bottled water in breakroom Agreed Yes—design team 81% 47%
“Healthy choices” section Wanted more details No—design team - -Include healthy optionsin $5 meals Wanted more details No—steering committee - -
Offer healthier premademeals and offer discount
Not approved (notprofitable) N/A - -
Add nutrition info andhealthy recipes to recipekiosks
Not approved (kiosks nolonger used) N/A - -
Reward workers foreating healthy Wanted more details No—design team - -
Increase Health Awareness
Walking challenge withincentives Agreed Yes (Completed one 12-week
challenge) —design team 50% 13%
Health focused newsletter Agreed Yes (2 delivered during studyperiod)—design team 45% 25%
Gym/ Exercise classdiscounts Need details from unions No—steering committee - -
Add more health topics tothe “Meet the Expert”class schedule & increasethe number of classes
Not approved (no longeroffer classes) N/A - -
3.4. Model Outputs
Of the seven activities that were agreed upon by the steering committee, five were implementedby the design team by the end of the study period; two were not completed because they neededother resources to implement (i.e., waiting on information technology department to complete tasks).Surveys at follow up from 105 store workers (67% response rate) showed the activities noticed mostoften by workers were ones that were implemented in the breakroom: the new employee refrigeratorand discounted bottles of water. Activities that were delivered in other areas of the store wereimplemented intermittently, and not noticed by many workers. Only six workers said they did notnotice any of the implemented program activities. Similarly, utilization of the activities was higherfor those implemented in the breakroom and for the activities that did not require much extra effortby the workers. During store worker interviews, workers either were excited about the new healthactivities and wanted to see more implemented or they had not heard of them. Those that had notheard of the activities indicated that direct communication from store management about new healthopportunities may be more useful than printed materials placed throughout the store. Only one of
240
IJERPH 2019, 16, 590
the five workers reported health behavior changes based on an implemented program activity; otherworkers said that they appreciated the effort, but that none of the implemented activities impactedtheir personal behaviors.
4. Discussion
Implementation of the HWPP was moderately successful in the grocery store setting asdemonstrated by good fidelity to program materials, design team engagement in the IDEAS process,and the number of and uptake of program activities in a relatively short time period. This successcan be attributed mostly to the design team’s interest in the program and the extra time spent by thefacilitator to move the team along; leadership support, including lack of active participation by thestore management, was the main barrier to further success. The logic model provided an effectiveand simple framework for evaluating program implementation and allowed us to better understandthe workplace factors necessary for success, as well as challenges or barriers that might be overcomewith program modifications or additional resources. The HWPP offers multiple tools that can beused in conjunction with this model including the organizational readiness checklist to evaluatePre-Implementation and the Management Dashboard and PERS tools to evaluate the Inputs, Activities,and Outputs under Program Implementation.
The program inputs (i.e., HWPP program, design team, steering committee, and facilitator)provided a good structure for the program. The HWPP materials were extremely helpful for thefacilitator, although the language was somewhat confusing to the design team. High fidelity to therecruitment criteria led to high engagement and enthusiasm of design team members. The designteam’s interest in health and improving their store was vital to their success. The design team membershad strong and consistent attendance and participation during meetings, yet seemed to lack theskills needed to progress through all steps of the program. They proceeded well with the initialsteps to assess the workplace, identify problems, and come up with solutions, but struggled with thesubsequent steps required to create a realistic plan to present to the steering committee. It is likely thedesign team members had not previously had the need nor opportunity to use these skills in their jobs.Employees may develop these skills through their jobs or by participating in employee-managementteams for other business reasons. However, teams consisting of employees without these skills may beunable to effectively design and implement workplace changes without additional external support ortraining [18,19,54,55].
As a result, the team required substantial assistance from the facilitator to organize informationand develop plans to complete each step of the process. The time demands on the facilitator farexceeded our expectations. It is possible that the steering committee or store management could haveassisted the design team with some steps. We were careful to include various levels of leadership(including union representation) on the steering committee; however, there was a discrepancy betweenthe stated support (i.e., help with scheduling design team members and help rolling out solutions)and the actual support received (i.e., design team members often not scheduled to work on meetingdays and steering committee took little responsibility for implementing activities). Earlier and morefrequent involvement from the steering committee in the design team meetings may have mitigatedthe need for substantial facilitator resources.
The main program activity, the IDEAS Tool, was delivered as intended. With support from thefacilitator, the design team was able to meet, agree on a goal, and develop specific activities for eachobjective to propose to the steering committee (Steps 1–5A). The team’s inability to meet outside ofscheduled meetings and the steering committee’s prolonged delay in responding to the design team’sproposal left no time in the study period to complete IDEAS Step 7 (i.e., Evaluation), or initiate anothercycle of the IDEAS process. Without this entire action-feedback cycle, the potential for organizationallearning was decreased. This long delay also affected morale and enthusiasm, which resulted intwo members leaving the design team. Additionally, the design team’s meeting location may havebeen a problem for some team members. The onsite meeting space was not private; store managers
241
IJERPH 2019, 16, 590
and other employees frequently passed through the meeting space, causing the design team to feeluncomfortable sharing information. Despite these challenges, the program produced worthwhileoutputs, demonstrating program success and a positive design team-steering committee collaboration.Overall, the design team had a positive impression of the process noting an increased comradery withteam members and healthier behaviors as a result of the intervention. Some team members reporteda sense of self-efficacy for continuing the program, while others did not think they could continuewithout the research team there to facilitate and hold management accountable. Further, data fromsurveys and interviews showed that store workers were aware of and utilized the workplace activitiesdeveloped by the design team, indicating relevance to the target audience. Feedback about the methodsused for communicating the activities was helpful in explaining possible reasons for non-awareness.
We encountered several challenges during the program that are best described and understood inthe pre-implementation and context elements of the logic model. Most importantly, this pilot projectgrew out of an existing collaboration with a union and three regional grocers. During the planningphases, because only one grocer volunteered to participate and then offered only one store as the testsite, we did not have the opportunity to assess organizational readiness at the corporate or the storelevels, nor were we able to choose a site that demonstrated readiness to change. While the initial storemanager was enthusiastic, he was transferred to another store early in the study and the managerwho replaced him was not as invested. The new store manager’s lack of interest in the programfiltered down to the design team who felt that their efforts were not appreciated. Over time, the designteam’s level of enthusiasm and engagement in the process decreased. Many previous studies haveshown that lack of organizational readiness and leadership support are critical factors to programsuccess [18,19,28,55–57]. The HWPP program materials describe the importance of organizationalreadiness but do not provide guidance on how to prevent or remediate diminishing leadership supportduring the course of implementing the program. In our study, we found that the steering committeeand store management were less supportive of interventions that focused on addressing workplaceproblems (e.g., supply order process and communication) and had fewer concerns about those thatfocused on changing individual behaviors (e.g., walking program). It is possible that the steeringcommittee did not fully understand the purpose of the program and therefore were less willing tosupport the design team’s ideas. Assessing organizational and leadership knowledge of the TotalWorker Health approach may be an important part of determining program readiness and the need foreducation or training before and during program implementation.
We also faced obstacles related to the labor-management structure and agreements and differencesbetween the different unions. The design team was challenged to find activities that appliedto employees from the various unions, since the health benefits varied between different unions.This made it difficult for the design team to promote or build upon existing health resources. Dueto labor contracts, design team members were not allowed to meet on paid work time. The researchteam addressed this by paying team members for their time to attend meetings; we do not know ifthe team’s attendance and engagement would have been different had they been allowed to meeton paid work time. Scheduling design team members to work on meeting days also proved to bedifficult, which meant that design team members were asked to come in on their days off. Thesepayment and scheduling challenges made some design team members question management’s supportand willingness to follow through on proposed activities. The issue of paid time to participate ona design team is a problem when trying to implement a participatory program in hourly-paid workers.Management support should include compensating design team members for their time, and ensuringprotected time for team members to develop their ideas.
Research has demonstrated a clear link between worker health and productivity, and investingin employee health has become a popular strategy for improving business outcomes [19,55,56,58];however, many organizations struggle with supporting worker health initiatives when they competewith business objectives [59]. The design team members in this project recognized the need to fit theirideas into the broader business purpose and were thoughtful in creating activities that capitalized
242
IJERPH 2019, 16, 590
on existing resources or that could be marketed to retail customers in addition to store workers(e.g., premade healthy meals, healthy items near the checkout). While some activities were initiallysupported by the steering committee, they were not maintained over time because other initiatives,such as holiday product placement, took priority. Additionally, management put little effort intomaking the existing healthy options for customers more accessible to employees, suggesting thatbusiness needs were more important than worker health. This issue of competing interests betweenbusiness and health is an important contextual factor to consider in interpreting the outcomes of TWHinterventions and programs. Other contextual factors that we encountered in this study includedseasonality of the work, skill level of employees, rotating employee schedules, and need to putcustomers first. All of these factors likely influenced the result of the participatory process used in thisstudy, and may impact health and safety initiatives in the retail industry.
Our research study had several limitations. As described, workers were not able to attendmeetings during work time and therefore were paid by the research team to attend. The collection ofdata for the process evaluation may have had an impact on the program’s delivery. It is not known ifthe successful delivery of the program in one store will be generalizable to other retail locations, withdifferent workers, management, facilities, and culture. In addition, we have limited data on whetherthe observed program implementation had an effect on the health behaviors of workers.
There were also several strengths to the study, including our relationship with the store thatallowed us access to employees and support for the research, in addition to the facilitator’s strongrapport with the design team. The detailed process measures allowed us to evaluate the fidelity of theprogram implementation and note which components were problematic and should be improved infuture trials. The HWPP materials provided a useful structure and guide to make decisions throughoutthe process.
Participatory methods like those used in the HWPP may be useful in developing TWHinterventions that address a variety of work factors that affect worker health. Our recommendationsfor those who may choose to use this program are: (1) Assess organizational knowledge, readiness,resources, and commitment; build in time prior to implementation to educate leadership and ensurethat they understand the program goals, processes, and expectations; (2) Include and budget fora knowledgeable facilitator who has good communication, planning, and organizational skills;(3) Choose team members who are enthusiastic and have good communication, planning, andorganizational skills (or ensure that the steering committee can assist); (4) Schedule in-person meetingtime to complete the activities for each step (rather than assume the team will complete things outsideof meetings); (5) Customize the worksheets for the audience and add materials as necessary to aid theteam through the process; (6) Involve the steering committee early in the process and ask them at theonset of the program to play an active role in planning and implementing solutions; and (7) Build intime and resources for periodic evaluation and modifications that may result from the evaluation.
5. Conclusions
Participatory programs such as the HWPP show promise as a methodology for creating effectiveTotal Worker Health interventions. This approach is useful for developing activities that can be usedby workers and are relevant to their health. This is particularly important for workers in lower payingjobs or in jobs that have complex or chaotic work environments which present other challenges forgood health behaviors. The detailed evaluation showed that substantial resources are needed todeliver the program and that enthusiastic, consistent, and active support from management is a criticaldeterminant of success. The broader workplace context may also present challenges which should notbe minimized or ignored. Future research studies should explore creative approaches for addressingorganizational/contextual challenges that arise during participatory programs and should examinethe efficacy of participatory programs. The logic model in this paper offers a framework for evaluatingboth implementation and efficacy, while considering the unique organizational contexts in which theintervention occurs.
243
IJERPH 2019, 16, 590
Author Contributions: Conceptualization, J.R.S., B.A.E. and A.M.D.; Data curation, J.R.S. and A.M.K.; Formalanalysis, J.R.S., A.M.K. and A.M.D.; Funding acquisition, A.M.D.; Investigation, J.R.S., A.M.K. and A.M.D.;Methodology, J.R.S., B.A.E. and A.M.D.; Project administration, J.R.S.; Resources, J.R.S. and A.M.K.; Supervision,A.M.D.; Visualization, J.R.S. and A.M.D.; Writing—Original Draft, J.R.S. and A.M.K.; Writing—Review & Editing,B.A.E. and A.M.D.
Funding: This research was funded by Healthier Workforce Center of the Midwest, grant number CDC/NIOSHU19OH008868 and the Washington University Center for Diabetes Translation Research (WU-CDTR), grantnumber NIH/NIDDK P30DK09295.
Acknowledgments: We wish to thank our union and grocery store research partners, the design team members,and the steering committee for their support and effort during the program. We would also like to thank JessicaSchenk for all of her work on the project.
Conflicts of Interest: The authors declare no conflict of interest. The funders had no role in the design of thestudy, in the collection, analyses, or interpretation of data, in the writing of the manuscript, or in the decision topublish the results.
References
1. Dale, A.M.; Enke, C.; Buckner-Petty, S.; Hipp, J.A.; Marx, C.; Strickland, J.; Evanoff, B. Availability and Useof Workplace Supports for Health Promotion Among Employees of Small and Large Businesses. Am. J.Health Promot. 2018, 33, 30–38. [CrossRef] [PubMed]
2. Lerner, D.; Allaire, S.H.; Reisine, S.T. Work disability resulting from chronic health conditions. J. Occup.Environ. Med. 2005, 47, 253–264. [CrossRef] [PubMed]
3. Meraya, A.M.; Sambamoorthi, U. Chronic Condition Combinations and Productivity Loss Among EmployedNonelderly Adults (18 to 64 Years). J. Occup. Environ. Med. 2016, 58, 974–978. [CrossRef] [PubMed]
4. Vuong, T.D.; Wei, F.; Beverly, C.J. Absenteeism due to Functional Limitations Caused by Seven CommonChronic Diseases in US Workers. J. Occup. Environ. Med. 2015, 57, 779–784. [CrossRef] [PubMed]
5. Asay, G.R.B.; Roy, K.; Lang, J.E.; Payne, R.L.; Howard, D.H. Absenteeism and Employer Costs AssociatedWith Chronic Diseases and Health Risk Factors in the US Workforce. Prev. Chronic Dis. 2016, 13, E141.[CrossRef]
6. National Center for Chronic Disease Prevention and Health Promotion. Using the Workplace to Improvethe Nation’s Health: At a Glance 2016. Available online: https://www.cdc.gov/chronicdisease/resources/publications/aag/workplace-health.htm (accessed on 21 December 2018).
7. Froehlich-Grobe, K.; Jones, D.; Businelle, M.S.; Kendzor, D.E.; Balasubramanian, B.A. Impact of disabilityand chronic conditions on health. Disabil. Health J. 2016, 9, 600–608. [CrossRef]
8. Schopp, L.H.; Bike, D.H.; Clark, M.J.; Minor, M.A. Act Healthy: Promoting health behaviors and self-efficacyin the workplace. Health Educ. Res. 2015, 30, 542–553. [CrossRef] [PubMed]
9. Loeppke, R.; Taitel, M.; Haufle, V.; Parry, T.; Kessler, R.C.; Jinnett, K. Health and productivity as a businessstrategy: A multiemployer study. J. Occup. Environ. Med. 2009, 51, 411–428. [CrossRef] [PubMed]
10. Bauer, U.E.; Briss, P.A.; Goodman, R.A.; Bowman, B.A. Prevention of chronic disease in the 21st century:Elimination of the leading preventable causes of premature death and disability in the USA. Lancet 2014,384, 45–52. [CrossRef]
11. National Institute for Occupational Safety and Health. What is Total Worker Health? Available online:https://www.cdc.gov/niosh/twh/default.html (accessed on 19 December 2018).
12. Tamers, S.L.; Chosewood, L.C.; Childress, A.; Hudson, H.; Nigam, J.; Chang, C.-C. Total Worker Health®
2014–2018: The Novel Approach to Worker Safety, Health, and Well-Being Evolves. Int. J. Environ. Res.Public Health 2019, 16, 321. [CrossRef] [PubMed]
13. Feltner, C.; Peterson, K.; Palmieri Weber, R.; Cluff, L.; Coker-Schwimmer, E.; Viswanathan, M.; Lohr, K.N.The Effectiveness of Total Worker Health Interventions: A Systematic Review for a National Institutes ofHealth Pathways to Prevention Workshop. Ann. Intern. Med. 2016, 165, 262–269. [CrossRef] [PubMed]
14. Henning, R.; Warren, N.; Roberston, M.; Faghri, P.; Cherniack, M.; CPH-NEW Research Team.Workplace Health Protection and Promotion through Participatory Ergonomics: An Integrated Approach.Public Health Rep. 2009, 124, 26–35. [CrossRef] [PubMed]
244
IJERPH 2019, 16, 590
15. Van Eerd, D.; Cole, D.; Irvin, E.; Mahood, Q.; Keown, K.; Theberge, N.; Village, J.; St Vincent, M.; Cullen, K.Process and implementation of participatory ergonomic interventions: A systematic review. Ergonomics 2010,53, 1153–1166. [CrossRef] [PubMed]
16. Hignett, S.; Wilson, J.R.; Morris, W. Finding ergonomic solutions: Participatory approaches. Occup. Med. Oxf.2005, 55, 200–207. [CrossRef] [PubMed]
17. Faridi, Z.; Grunbaum, J.; Gray, B.; Franks, A.; Simoes, E. Community-based Participatory Research: NecessaryNext Steps. Prev. Chronic Dis. 2007, 4, A70. [PubMed]
18. Dugan, A.G.; Farr, D.A.; Namazi, S.; Henning, R.A.; Wallace, K.N.; El Ghaziri, M.; Punnett, L.;Dussetschleger, J.L.; Cherniack, M.G. Process evaluation of two participatory approaches: Implementing totalworker health(R) interventions in a correctional workforce. Am. J. Ind. Med. 2016, 59, 897–918. [CrossRef][PubMed]
19. Cherniack, M.; Dussetschleger, J.; Dugan, A.; Farr, D.; Namazi, S.; El Ghaziri, M.; Henning, R. Participatoryaction research in corrections: The HITEC 2 program. Appl. Ergon. 2016, 53, 169–180. [CrossRef] [PubMed]
20. Evanoff, B.A.; Bohr, P.C.; Wolf, L.D. Effects of a participatory ergonomics team among hospital orderlies.Am. J. Ind. Med. 1999, 35, 358–365. [CrossRef]
21. Robertson, M.; Henning, R.; Warren, N.; Nobrega, S.; Dove-Steinkamp, M.; Tibirica, L.; Bizarro, A.; CPH-NEWResearch Team. The Intervention Design and Analysis Scorecard: A planning tool for participatory designof integrated health and safety interventions in the workplace. J. Occup. Environ. Med. 2013, 55, S86–S88.[CrossRef] [PubMed]
22. Sorensen, G.; Stoddard, A.; Ockene, J.K.; Hunt, M.K.; Youngstrom, R. Worker participation in an integratedhealth promotion health protection program: Results from the WellWorks project. Health Educ. Q. 1996,23, 191–203. [CrossRef]
23. Baker, E.A.; Israel, B.A.; Schurman, S.J. A participatory approach to worksite health promotion. J. Ambul.Care Manag. 1994, 17, 68–81. [CrossRef]
24. Wallerstein, N.; Duran, B. Community-based participatory research contributions to intervention research:The intersection of science and practice to improve health equity. Am. J. Public Health 2010, 100, S40–S46.[CrossRef] [PubMed]
25. Punnett, L.; Cherniack, M.; Henning, R.; Morse, T.; Faghri, P.; CPH-NEW Research Team. Aconceptual framework for integrating workplace health promotion and occupational ergonomics programs.Public Health Rep. 2009, 124, 16–25. [CrossRef] [PubMed]
26. Kazutaka, K. Roles of Participatory Action-oriented Programs in Promoting Safety and Health at Work.Saf. Health Work 2012, 3, 155–165. [CrossRef] [PubMed]
27. Nobrega, S.; Champagne, N.; Abreu, M.; Goldstein-Gelb, M.; Montano, M.; Lopez, I.; Arevalo, J.; Bruce, S.;Punnett, L. Obesity/Overweight and the Role of Working Conditions: A Qualitative, ParticipatoryInvestigation. Health Promot. Pract. 2016, 17, 127–136. [CrossRef] [PubMed]
28. Nobrega, S.; Kernan, L.; Plaku-Alakbarova, B.; Robertson, M.; Warren, N.; Henning, R. Field tests ofa participatory ergonomics toolkit for Total Worker Health. Appl. Ergon. 2017, 60, 366–379. [CrossRef][PubMed]
29. Center for the Promotion of Health in the New England Workplace. Evaluate your Program.Available online: https://www.uml.edu/Research/CPH-NEW/Healthy-Work-Participatory-Program/Evaluate-Your-Program/default.aspx (accessed on 31 January 2019).
30. Robertson, M.M.; Henning, R.A.; Warren, N.; Nobrega, S.; Dove-Steinkamp, M.; Tibiriçá, L.; Bizarro, A.Participatory design of integrated safety and health interventions in the workplace: A case study usingthe Intervention Design and Analysis Scorecard (IDEAS) Tool. Int. J. Hum. Factors Ergon. 2015, 3, 303–326.[CrossRef]
31. Tamers, S.L.; Goetzel, R.; Kelly, K.M.; Luckhaupt, S.; Nigam, J.; Pronk, N.P.; Rohlman, D.S.; Baron, S.;Brosseau, L.M.; Bushnell, T.; et al. Research Methodologies for Total Worker Health(R): Proceedings Froma Workshop. J. Occup. Environ. Med. 2018, 60, 968–978. [CrossRef]
32. Zhang, Y.; Flum, M.; Kotejoshyer, R.; Fleishman, J.; Henning, R.; Punnett, L. Workplace ParticipatoryOccupational Health/Health Promotion Program: Facilitators and Barriers Observed in Three NursingHomes. J. Gerontol. Nurs. 2016, 42, 34–42. [CrossRef]
245
IJERPH 2019, 16, 590
33. Strickland, J.R.; Eyer, A.A.; Purnell, J.Q.; Kinghorn, A.M.; Herrick, C.; Evanoff, B.A. Enhancing WorkplaceWellness Efforts to Reduce Obesity: A Qualitative Study of Low-Wage Workers in St Louis, Missouri,2013–2014. Prev. Chronic Dis. 2015, 12, E67. [CrossRef]
34. Strickland, J.R.; Pizzorno, G.; Kinghorn, A.M.; Evanoff, B. Worksite Influences on Obesogenic Behaviorsin Low-Wage Workers in Saint Louis, Missouri, 2013–2014. Prev. Chronic Dis. 2015, 12, E66. [CrossRef][PubMed]
35. Center for the Promotion of Health in the New England Workplace. Intervention Design and AnalysisScorecard (IDEAS): CPH-NEW Intervention Planning Tool and Facilitator’s Guide. Available online: http://www.uml.edu/docs/FGuide_Mar3_Website_tcm18-102071.pdf (accessed on 31 January 2019).
36. Center for the Promotion of Health in the New England Workplace. CPH-NEW Healthy WorkplaceParticipatory Program. Available online: http://www.uml.edu/Research/Centers/CPH-NEW/Healthy-Work-Participatory-Program/default.aspx (accessed on 10 October 2016).
37. Kristensen, T.S. Job stress and cardiovascular disease: A theoretic critical review. J. Occup. Health Psychol.1996, 1, 246–260. [CrossRef] [PubMed]
38. Gilbody, S.; Richards, D.; Brealey, S.; Hewitt, C. Screening for depression in medical settings with the PatientHealth Questionnaire (PHQ): A diagnostic meta-analysis. J. Gen. Intern. Med. 2007, 22, 1596–1602. [CrossRef][PubMed]
39. Centers for Disease Control and Prevention. CDC National Healthy Worksite Program (NHWP) Employee HealthAssessment (CAPTURE); Centers for Disease Control and Prevention: Atlanta, GA, USA, 2005.
40. Fassi, M.E.; Bocquet, V.; Majery, N.; Lair, M.L.; Couffignal, S.; Mairiaux, P. Work ability assessment in a workerpopulation: Comparison and determinants of Work Ability Index and Work Ability score. BMC Public Health2013, 13, 305. [CrossRef] [PubMed]
41. Chau, J.Y.; Van Der Ploeg, H.P.; Dunn, S.; Kurko, J.; Bauman, A.E. Validity of the occupational sitting andphysical activity questionnaire. Med. Sci. Sports Exerc. 2012, 44, 118–125. [CrossRef] [PubMed]
42. Segal-Isaacson, C.; Wylie-Rosett, J.; Gans, K. Validation of a short dietary assessment questionnaire:The Rapid Eating and Activity Assessment for Participants Short Version (REAP-S). Diabetes Educ. 2004,30, 774–781. [CrossRef] [PubMed]
43. Ford, E.S.; Giles, W.H.; Dietz, W.H. Prevalence of the Metabolic Syndrome Among US AdultsFindingsFrom the Third National Health and Nutrition Examination Survey. JAMA 2002, 287, 356–359. [CrossRef][PubMed]
44. Zweber, Z.M. A Practical Scale for Multi-faceted Organizational Health Climate Assessment. Master’s Thesis,University of Conneticut, Storrs, CT, USA, 2012.
45. Strickland, J.; Kinghorn, A.; Evanoff, B.; Dale, A. Experience Mapping to Convey Complex Data and Aid inthe Design of Workplace Interventions. In Proceedings of the 12th International Conference on OccupationalStress and Health, Minneapolis, MN, USA, 7–10 June 2017.
46. Center for the Promotion of Health in the New England Workplace. CPH-NEW Healthy WorkplaceParticipatory Program: Select the Design Team. Available online: http://www.uml.edu/Research/Centers/CPH-NEW/Healthy-Work-Participatory-Program/form-design-team/select-team.aspx (accessed on31 January 2019).
47. Center for the Promotion of Health in the New England Workplace. CPH-NEW Healthy WorkplaceParticipatory Program: Select Steering Committee. Available online: https://www.uml.edu/Research/CPH-NEW/Healthy-Work-Participatory-Program/steering-committee/role.aspx (accessed on21 December 2018).
48. Jaegers, L.; Dale, A.M.; Weaver, N.; Buchholz, B.; Welch, L.; Evanoff, B. Development of a program logicmodel and evaluation plan for a participatory ergonomics intervention in construction. Am. J. Ind. Med.2014, 57, 351–361. [CrossRef] [PubMed]
49. Dale, A.M.; Jaegers, L.; Welch, L.; Gardner, B.T.; Buchholz, B.; Weaver, N.; Evanoff, B.A. Evaluation ofa participatory ergonomics intervention in small commercial construction firms. Am. J. Ind. Med. 2016,59, 465–475. [CrossRef] [PubMed]
50. Haines, H.; Wilson, J.R.; Vink, P.; Koningsveld, E. Validating a framework for participatory ergonomics(the PEF). Ergonomics 2002, 45, 309–327. [CrossRef]
246
IJERPH 2019, 16, 590
51. Driessen, M.T.; Proper, K.I.; Anema, J.R.; Bongers, P.M.; van der Beek, A.J. Process evaluation ofa participatory ergonomics programme to prevent low back pain and neck pain among workers.Implement. Sci. 2010, 5, 65. [CrossRef] [PubMed]
52. Pehkonen, I.; Takala, E.P.; Ketola, R.; Viikari-Juntura, E.; Leino-Arjas, P.; Hopsu, L.; Virtanen, T.; Haukka, E.;Holtari-Leino, M.; Nykyri, E.; et al. Evaluation of a participatory ergonomic intervention process in kitchenwork. Appl. Ergon. 2009, 40, 115–123. [CrossRef] [PubMed]
53. Pretty, J.; Guijt, I.; Scoones, I.; Thompson, J. A Trainer’s Guide for Participatory Learning and Action; InternationalInstitute for Environment and Development: London, UK, 1995.
54. Gjessing, C.C.; Schoenborn, T.F.; Cohen, A. Participatory Ergonomic Intervention in Meatpacking Plants;Department of Health and Human Services, Public Health Service, Centers for Disease Control andPrevention, National Institute for Occupational Safety and Health: Washington, DC, USA, 1994.
55. Burgess-Limerick, R. Participatory ergonomics: Evidence and implementation lessons. Appl. Ergon. 2018,68, 289–293. [CrossRef]
56. Dixon, S.M.; Theberge, N. Contextual factors affecting task distribution in two participatory ergonomicinterventions: A qualitative study. Ergonomics 2011, 54, 1005–1016. [CrossRef] [PubMed]
57. Ferraro, L.; Faghri, P.D.; Henning, R.; Cherniack, M.; Center for the Promotion of Health in the New EnglandWorkplace Team. Workplace-based participatory approach to weight loss for correctional employees. J. Occup.Environ. Med. 2013, 55, 147–155. [CrossRef] [PubMed]
58. Parkinson, M.D. Employer Health and Productivity Roadmap strategy. J. Occup. Environ. Med. 2013,55, S46–S51. [CrossRef] [PubMed]
59. Goetzel, R.Z.; Ozminkowski, R.J. The Health and Cost Benefits of Work Site Health-Promotion Programs.Annu. Rev. Public Health 2008, 29, 303–323. [CrossRef]
© 2019 by the authors. Licensee MDPI, Basel, Switzerland. This article is an open accessarticle distributed under the terms and conditions of the Creative Commons Attribution(CC BY) license (http://creativecommons.org/licenses/by/4.0/).
247
International Journal of
Environmental Research
and Public Health
Article
Prospective Evaluation of Fidelity, Impact andSustainability of Participatory Workplace HealthTeams in Skilled Nursing Facilities
Rajashree Kotejoshyer 1,*, Yuan Zhang 1, Marian Flum 1, Jane Fleishman 2 and Laura Punnett 1
1 Center for the Promotion of Health in the New England Workplace (CPHNEW), University of MassachusettsLowell, Lowell, MA 01854, USA; [email protected] (Y.Z.); [email protected] (M.F.);[email protected] (L.P.)
2 Center for Human Sexuality Studies, Widener University, Chester, PA 19013, USA; [email protected]* Correspondence: [email protected] or [email protected]; Tel.: +1-860-679-3857
Received: 5 March 2019; Accepted: 25 April 2019; Published: 27 April 2019
Abstract: Organizational features of work often pose obstacles to workforce health, and a participatorychange process may address those obstacles. In this research, an intervention program sought tointegrate occupational safety and health (OSH) with health promotion (HP) in three skilled nursingfacilities. Three facilities with pre-existing HP programs served as control sites. The intervention wasevaluated after 3–4 years through focus groups, interviews, surveys, and researcher observations.We assessed process fidelity in the intervention sites and compared the two groups on the scope oftopics covered (integration), program impact, and medium-term sustainability. The interventionmet with initial success as workers readily accepted and operationalized the concept of OSH/HPintegration in all three intervention facilities. Process fidelity was high at first but diminished overtime. At follow-up, team members in two intervention sites reported higher employee engagementand more attention to organizational issues. Two of the three control facilities remained statusquo, with little OSH/HP integration. The intervention had limited but positive impact on the workenvironment and health climate: staff awareness and participation in activities, and organizationalfactors such as decision-making, respect, communication, and sharing of opinions improved slightlyin all intervention sites. Resources available to the teams, management support, and changingcorporate priorities affected potential program sustainability.
Keywords: occupational safety and health; workplace health promotion; integration; participatoryworkplace program; process fidelity; program impact; sustainability
1. Introduction
A number of chronic diseases are known to be associated with psychosocial work stressors,especially low job control, and other organizational factors such as night shift and overtime work [1–5].It can be argued that because psychosocial job strain is an important predictor of health behaviors,a workplace health promotion (HP) program should seek to improve stressful working conditionsin order to support healthy behaviors. Workplace HP programs have traditionally focused insteadon trying to modify individual behaviors that increase disease risk. Workplace HP benefits are oftenunevenly distributed by worker socioeconomic status [6–8]. This may be, at least in part, becauselow-wage, low-status workers face more conditions at work which are obstacles both to the samehealth behaviors that are HP targets [8–10] and to HP participation [11].
A newer approach to workplace HP is that of enhancing its effectiveness by combining it withoccupational safety and health (OSH) protections. This concept of integrated employee health programshas been put forward by a few researchers [12,13], the World Health Organization [14], and the U.S.
IJERPH 2019, 16, 1494; doi:10.3390/ijerph16091494 www.mdpi.com/journal/ijerph248
IJERPH 2019, 16, 1494
National Institute of Occupational Safety and Health [15]. An integrated strategy has been evaluatedempirically by some investigators [16–18] but evidence is still sparse as to its effectiveness [19], in partbecause implementation approaches differ among investigators and thus are hard to compare [20].Meanwhile, the norm in most workplaces is still that safety programs and workplace HP programs aremanaged separately.
Healthcare work is physically and psychologically demanding, exposing workers to manyworkplace stressors that affect their safety and health and which simultaneously may interfere witheffective prevention measures [21–23]. We designed an intervention for the long-term healthcare sectorbased on a participatory model that engaged employees in examining and improving the physical,organizational, and psychosocial conditions at work that might impact their health and well-being.The program sought to bridge and integrate occupational safety and health with health promotion byidentifying higher-level determinants of employee health and safety [24].
We have previously proposed [9,25] that any workplace health program should involve theworkers in a decision-making role, both to ensure that obstacles to workers’ healthy behaviors arerecognized and addressed and to increase workers’ decision latitude, a well-known and key healthdeterminant. In a participatory approach, employees are actively engaged in problem identification,program design, implementation and evaluation of the program. The direct involvement of workersin the planning and design of interventions can benefit group and individual self-efficacy, which isconsistent with the concept of “sense of coherence” [26], an internal resource for overcoming stress,reducing burnout and other adverse outcomes [27,28]. Participatory ergonomics is one example withdemonstrated success as a way to reduce hazardous conditions in the workplace [29,30]. As discussedin depth by Jagosh et al. [31], “partnership synergy” provides a theoretical basis for assessing the linksamong participatory intervention context, mechanism(s), and outcomes (with elements also commonlyutilized in process evaluations).
This article reports our evaluation of process fidelity, extent of OSH/HP integration, health impact,and sustainability of the participatory intervention program. In line with the middle-range “partnershipsynergy” theory, we have relied on information collected before, during, and after the study to describethe context (institutions and workforce), evidence for posited mechanism of change (e.g., fidelityand amount of intervention), and short- and medium-term outcomes (institutional and individual).The intervention was compared three to four years after initiation in the three participatory interventionprogram (PIP) sites to three control sites with non-participatory health promotion (NPHP) programs.
2. Materials and Methods
This study, “Promoting Physical and Mental Health of Caregivers through TransdisciplinaryIntervention,” was carried out through the Center for the Promotion of Health in the New EnglandWorkplace (CPH-NEW), a Total Worker Health®Center for Excellence of the National Institute ofOccupational Safety and Health. At the time when this study began, “Total Worker Health” wasdefined by National Institute of Occupational Safety and Health as “a strategy integrating occupationalsafety and health protection with health promotion to prevent worker injury and illness and to advanceworker health and well-being.” The study was approved by the University of Massachusetts LowellInstitutional Review Board (protocol # 06-1403).
2.1. Setting and Sample
The project occurred within the context of a multi-year partnership with a large, for-profitlong-term care company, which operated over 200 nursing facilities in 12 states within the easternUnited States. In 2003–2006, the company had initiated a “safe resident handling” program in all of itsskilled nursing facilities. Some sites also had HP activities as of 2006, depending on local initiative;a corporate-sponsored wellness program began in 2011.
Within that context, this project component sought to improve the health and safety of nursinghome workers by creating participatory teams of non-supervisory workers to address integrated
249
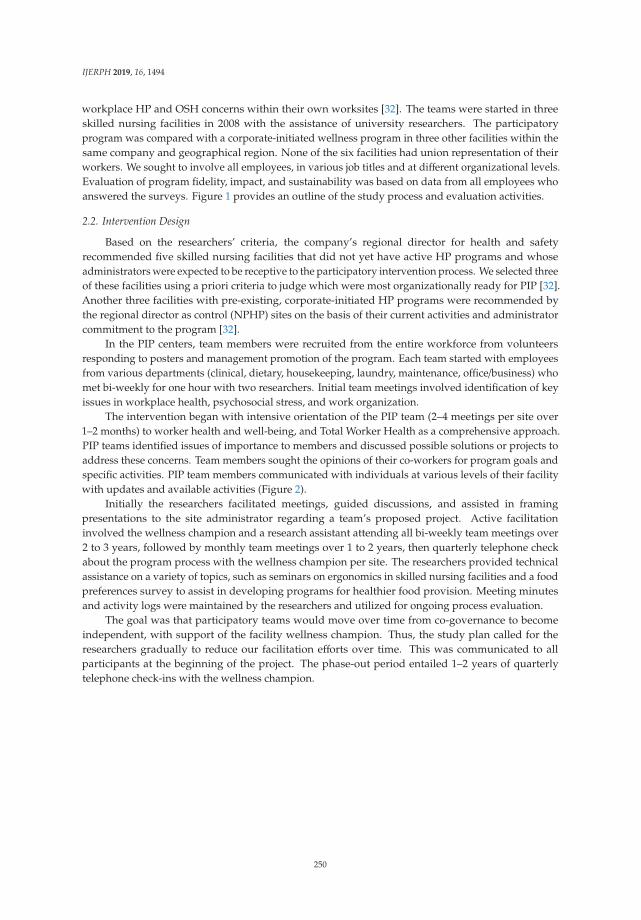
IJERPH 2019, 16, 1494
workplace HP and OSH concerns within their own worksites [32]. The teams were started in threeskilled nursing facilities in 2008 with the assistance of university researchers. The participatoryprogram was compared with a corporate-initiated wellness program in three other facilities within thesame company and geographical region. None of the six facilities had union representation of theirworkers. We sought to involve all employees, in various job titles and at different organizational levels.Evaluation of program fidelity, impact, and sustainability was based on data from all employees whoanswered the surveys. Figure 1 provides an outline of the study process and evaluation activities.
2.2. Intervention Design
Based on the researchers’ criteria, the company’s regional director for health and safetyrecommended five skilled nursing facilities that did not yet have active HP programs and whoseadministrators were expected to be receptive to the participatory intervention process. We selected threeof these facilities using a priori criteria to judge which were most organizationally ready for PIP [32].Another three facilities with pre-existing, corporate-initiated HP programs were recommended bythe regional director as control (NPHP) sites on the basis of their current activities and administratorcommitment to the program [32].
In the PIP centers, team members were recruited from the entire workforce from volunteersresponding to posters and management promotion of the program. Each team started with employeesfrom various departments (clinical, dietary, housekeeping, laundry, maintenance, office/business) whomet bi-weekly for one hour with two researchers. Initial team meetings involved identification of keyissues in workplace health, psychosocial stress, and work organization.
The intervention began with intensive orientation of the PIP team (2–4 meetings per site over1–2 months) to worker health and well-being, and Total Worker Health as a comprehensive approach.PIP teams identified issues of importance to members and discussed possible solutions or projects toaddress these concerns. Team members sought the opinions of their co-workers for program goals andspecific activities. PIP team members communicated with individuals at various levels of their facilitywith updates and available activities (Figure 2).
Initially the researchers facilitated meetings, guided discussions, and assisted in framingpresentations to the site administrator regarding a team’s proposed project. Active facilitationinvolved the wellness champion and a research assistant attending all bi-weekly team meetings over2 to 3 years, followed by monthly team meetings over 1 to 2 years, then quarterly telephone checkabout the program process with the wellness champion per site. The researchers provided technicalassistance on a variety of topics, such as seminars on ergonomics in skilled nursing facilities and a foodpreferences survey to assist in developing programs for healthier food provision. Meeting minutesand activity logs were maintained by the researchers and utilized for ongoing process evaluation.
The goal was that participatory teams would move over time from co-governance to becomeindependent, with support of the facility wellness champion. Thus, the study plan called for theresearchers gradually to reduce our facilitation efforts over time. This was communicated to allparticipants at the beginning of the project. The phase-out period entailed 1–2 years of quarterlytelephone check-ins with the wellness champion.
250
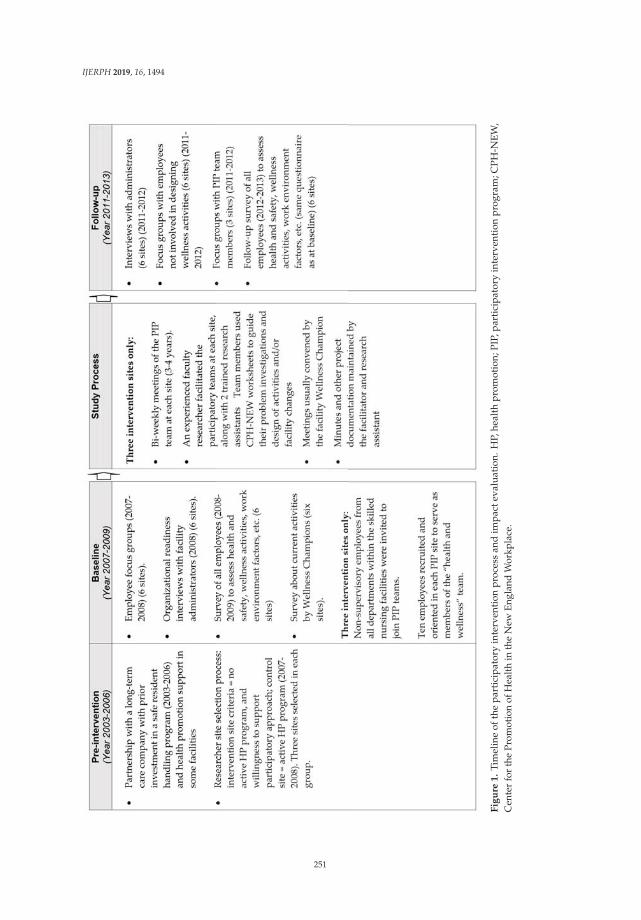
IJERPH 2019, 16, 1494
F
igu
re1
.Ti
mel
ine
ofth
ep
arti
cip
ator
yin
terv
enti
onp
roce
ssan
dim
pac
teva
luat
ion.
HP,
heal
thp
rom
otio
n;P
IP,p
arti
cip
ator
yin
terv
enti
onp
rogr
am;C
PH
-NE
W,
Cen
ter
for
the
Prom
otio
nof
Hea
lth
inth
eN
ewEn
glan
dW
orkp
lace
.
251
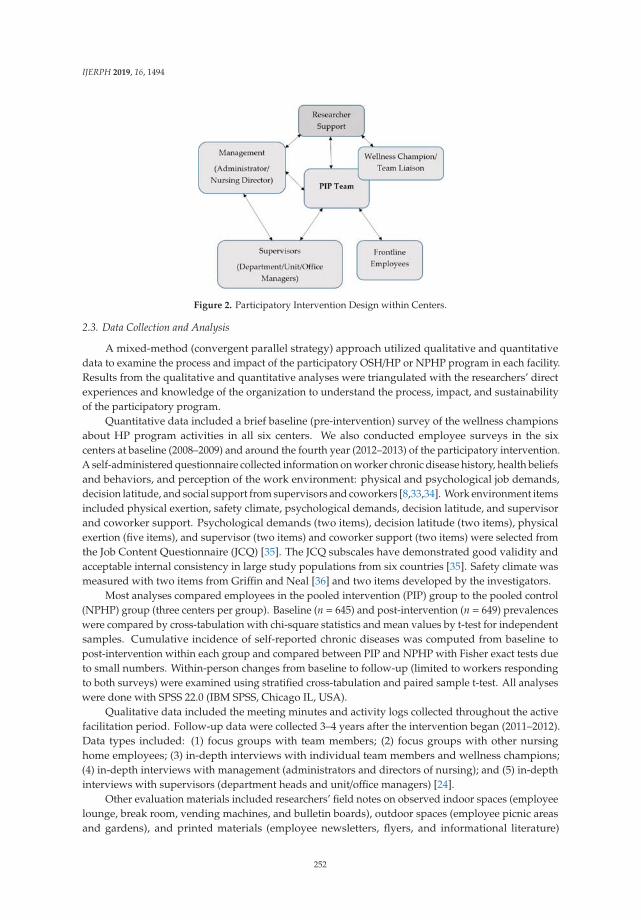
IJERPH 2019, 16, 1494
Figure 2. Participatory Intervention Design within Centers.
2.3. Data Collection and Analysis
A mixed-method (convergent parallel strategy) approach utilized qualitative and quantitativedata to examine the process and impact of the participatory OSH/HP or NPHP program in each facility.Results from the qualitative and quantitative analyses were triangulated with the researchers’ directexperiences and knowledge of the organization to understand the process, impact, and sustainabilityof the participatory program.
Quantitative data included a brief baseline (pre-intervention) survey of the wellness championsabout HP program activities in all six centers. We also conducted employee surveys in the sixcenters at baseline (2008–2009) and around the fourth year (2012–2013) of the participatory intervention.A self-administered questionnaire collected information on worker chronic disease history, health beliefsand behaviors, and perception of the work environment: physical and psychological job demands,decision latitude, and social support from supervisors and coworkers [8,33,34]. Work environment itemsincluded physical exertion, safety climate, psychological demands, decision latitude, and supervisorand coworker support. Psychological demands (two items), decision latitude (two items), physicalexertion (five items), and supervisor (two items) and coworker support (two items) were selected fromthe Job Content Questionnaire (JCQ) [35]. The JCQ subscales have demonstrated good validity andacceptable internal consistency in large study populations from six countries [35]. Safety climate wasmeasured with two items from Griffin and Neal [36] and two items developed by the investigators.
Most analyses compared employees in the pooled intervention (PIP) group to the pooled control(NPHP) group (three centers per group). Baseline (n = 645) and post-intervention (n = 649) prevalenceswere compared by cross-tabulation with chi-square statistics and mean values by t-test for independentsamples. Cumulative incidence of self-reported chronic diseases was computed from baseline topost-intervention within each group and compared between PIP and NPHP with Fisher exact tests dueto small numbers. Within-person changes from baseline to follow-up (limited to workers respondingto both surveys) were examined using stratified cross-tabulation and paired sample t-test. All analyseswere done with SPSS 22.0 (IBM SPSS, Chicago IL, USA).
Qualitative data included the meeting minutes and activity logs collected throughout the activefacilitation period. Follow-up data were collected 3–4 years after the intervention began (2011–2012).Data types included: (1) focus groups with team members; (2) focus groups with other nursinghome employees; (3) in-depth interviews with individual team members and wellness champions;(4) in-depth interviews with management (administrators and directors of nursing); and (5) in-depthinterviews with supervisors (department heads and unit/office managers) [24].
Other evaluation materials included researchers’ field notes on observed indoor spaces (employeelounge, break room, vending machines, and bulletin boards), outdoor spaces (employee picnic areasand gardens), and printed materials (employee newsletters, flyers, and informational literature)
252
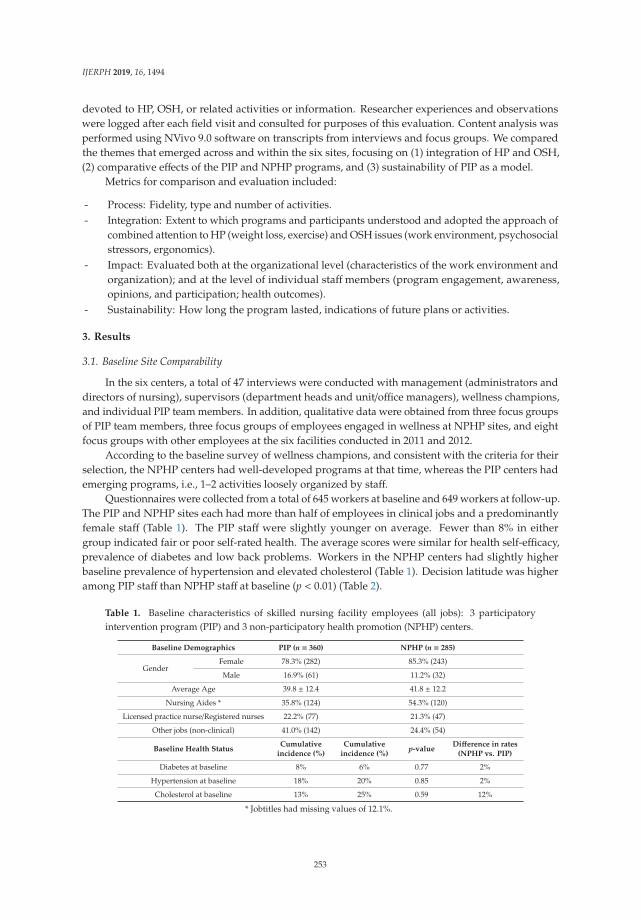
IJERPH 2019, 16, 1494
devoted to HP, OSH, or related activities or information. Researcher experiences and observationswere logged after each field visit and consulted for purposes of this evaluation. Content analysis wasperformed using NVivo 9.0 software on transcripts from interviews and focus groups. We comparedthe themes that emerged across and within the six sites, focusing on (1) integration of HP and OSH,(2) comparative effects of the PIP and NPHP programs, and (3) sustainability of PIP as a model.
Metrics for comparison and evaluation included:
- Process: Fidelity, type and number of activities.- Integration: Extent to which programs and participants understood and adopted the approach of
combined attention to HP (weight loss, exercise) and OSH issues (work environment, psychosocialstressors, ergonomics).
- Impact: Evaluated both at the organizational level (characteristics of the work environment andorganization); and at the level of individual staff members (program engagement, awareness,opinions, and participation; health outcomes).
- Sustainability: How long the program lasted, indications of future plans or activities.
3. Results
3.1. Baseline Site Comparability
In the six centers, a total of 47 interviews were conducted with management (administrators anddirectors of nursing), supervisors (department heads and unit/office managers), wellness champions,and individual PIP team members. In addition, qualitative data were obtained from three focus groupsof PIP team members, three focus groups of employees engaged in wellness at NPHP sites, and eightfocus groups with other employees at the six facilities conducted in 2011 and 2012.
According to the baseline survey of wellness champions, and consistent with the criteria for theirselection, the NPHP centers had well-developed programs at that time, whereas the PIP centers hademerging programs, i.e., 1–2 activities loosely organized by staff.
Questionnaires were collected from a total of 645 workers at baseline and 649 workers at follow-up.The PIP and NPHP sites each had more than half of employees in clinical jobs and a predominantlyfemale staff (Table 1). The PIP staff were slightly younger on average. Fewer than 8% in eithergroup indicated fair or poor self-rated health. The average scores were similar for health self-efficacy,prevalence of diabetes and low back problems. Workers in the NPHP centers had slightly higherbaseline prevalence of hypertension and elevated cholesterol (Table 1). Decision latitude was higheramong PIP staff than NPHP staff at baseline (p < 0.01) (Table 2).
Table 1. Baseline characteristics of skilled nursing facility employees (all jobs): 3 participatoryintervention program (PIP) and 3 non-participatory health promotion (NPHP) centers.
Baseline Demographics PIP (n = 360) NPHP (n = 285)
GenderFemale 78.3% (282) 85.3% (243)
Male 16.9% (61) 11.2% (32)
Average Age 39.8 ± 12.4 41.8 ± 12.2
Nursing Aides * 35.8% (124) 54.3% (120)
Licensed practice nurse/Registered nurses 22.2% (77) 21.3% (47)
Other jobs (non-clinical) 41.0% (142) 24.4% (54)
Baseline Health StatusCumulative
incidence (%)Cumulative
incidence (%)p-value
Difference in rates(NPHP vs. PIP)
Diabetes at baseline 8% 6% 0.77 2%
Hypertension at baseline 18% 20% 0.85 2%
Cholesterol at baseline 13% 25% 0.59 12%
* Jobtitles had missing values of 12.1%.
253
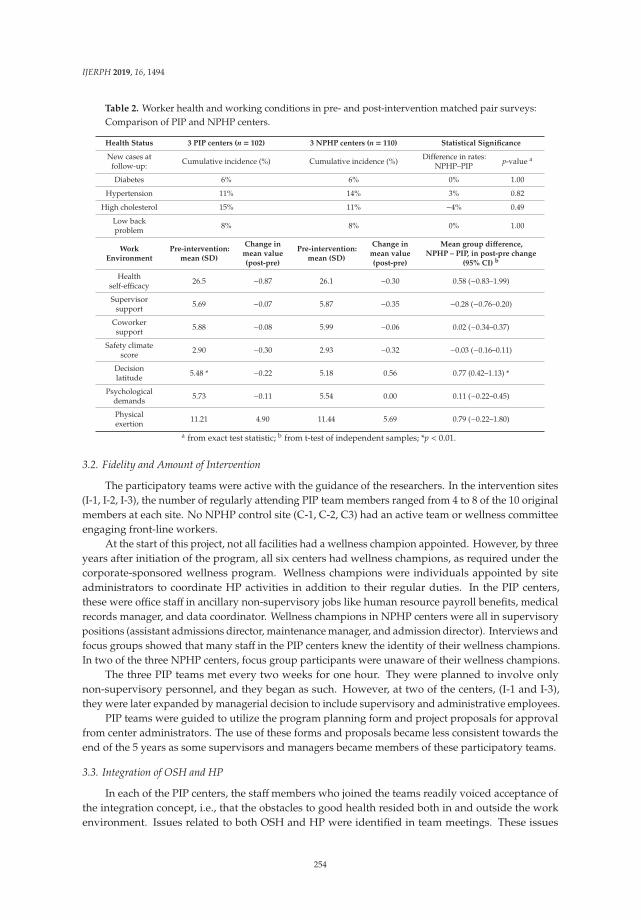
IJERPH 2019, 16, 1494
Table 2. Worker health and working conditions in pre- and post-intervention matched pair surveys:Comparison of PIP and NPHP centers.
Health Status 3 PIP centers (n = 102) 3 NPHP centers (n = 110) Statistical Significance
New cases atfollow-up: Cumulative incidence (%) Cumulative incidence (%) Difference in rates:
NPHP–PIP p-value a
Diabetes 6% 6% 0% 1.00
Hypertension 11% 14% 3% 0.82
High cholesterol 15% 11% −4% 0.49
Low backproblem 8% 8% 0% 1.00
WorkEnvironment
Pre-intervention:mean (SD)
Change inmean value(post-pre)
Pre-intervention:mean (SD)
Change inmean value(post-pre)
Mean group difference,NPHP – PIP, in post-pre change
(95% CI) b
Healthself-efficacy 26.5 −0.87 26.1 −0.30 0.58 (−0.83–1.99)
Supervisorsupport 5.69 −0.07 5.87 −0.35 −0.28 (−0.76–0.20)
Coworkersupport 5.88 −0.08 5.99 −0.06 0.02 (−0.34–0.37)
Safety climatescore 2.90 −0.30 2.93 −0.32 −0.03 (−0.16–0.11)
Decisionlatitude 5.48 * −0.22 5.18 0.56 0.77 (0.42–1.13) *
Psychologicaldemands 5.73 −0.11 5.54 0.00 0.11 (−0.22–0.45)
Physicalexertion 11.21 4.90 11.44 5.69 0.79 (−0.22–1.80)
a from exact test statistic; b from t-test of independent samples; *p < 0.01.
3.2. Fidelity and Amount of Intervention
The participatory teams were active with the guidance of the researchers. In the intervention sites(I-1, I-2, I-3), the number of regularly attending PIP team members ranged from 4 to 8 of the 10 originalmembers at each site. No NPHP control site (C-1, C-2, C3) had an active team or wellness committeeengaging front-line workers.
At the start of this project, not all facilities had a wellness champion appointed. However, by threeyears after initiation of the program, all six centers had wellness champions, as required under thecorporate-sponsored wellness program. Wellness champions were individuals appointed by siteadministrators to coordinate HP activities in addition to their regular duties. In the PIP centers,these were office staff in ancillary non-supervisory jobs like human resource payroll benefits, medicalrecords manager, and data coordinator. Wellness champions in NPHP centers were all in supervisorypositions (assistant admissions director, maintenance manager, and admission director). Interviews andfocus groups showed that many staff in the PIP centers knew the identity of their wellness champions.In two of the three NPHP centers, focus group participants were unaware of their wellness champions.
The three PIP teams met every two weeks for one hour. They were planned to involve onlynon-supervisory personnel, and they began as such. However, at two of the centers, (I-1 and I-3),they were later expanded by managerial decision to include supervisory and administrative employees.
PIP teams were guided to utilize the program planning form and project proposals for approvalfrom center administrators. The use of these forms and proposals became less consistent towards theend of the 5 years as some supervisors and managers became members of these participatory teams.
3.3. Integration of OSH and HP
In each of the PIP centers, the staffmembers who joined the teams readily voiced acceptance ofthe integration concept, i.e., that the obstacles to good health resided both in and outside the workenvironment. Issues related to both OSH and HP were identified in team meetings. These issues
254
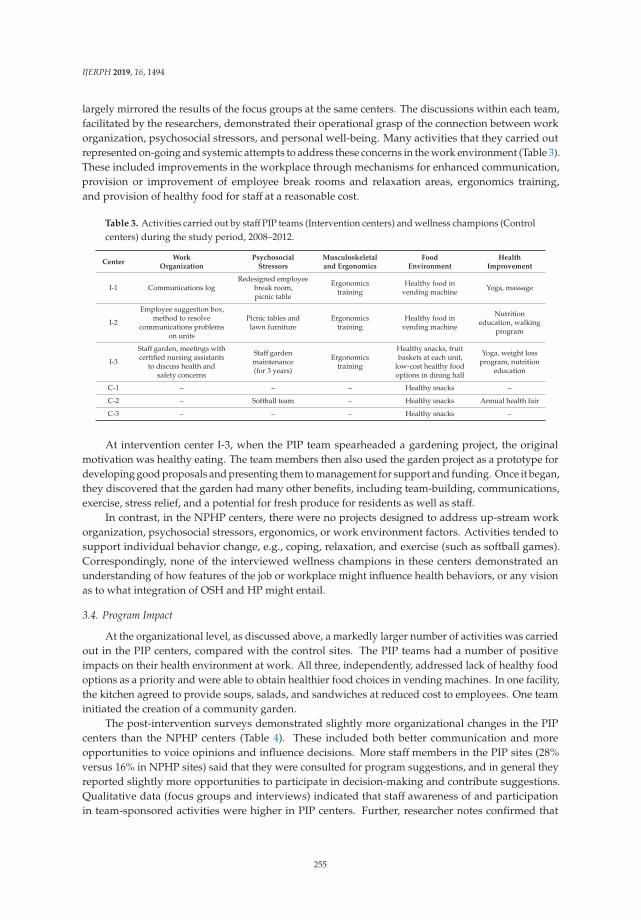
IJERPH 2019, 16, 1494
largely mirrored the results of the focus groups at the same centers. The discussions within each team,facilitated by the researchers, demonstrated their operational grasp of the connection between workorganization, psychosocial stressors, and personal well-being. Many activities that they carried outrepresented on-going and systemic attempts to address these concerns in the work environment (Table 3).These included improvements in the workplace through mechanisms for enhanced communication,provision or improvement of employee break rooms and relaxation areas, ergonomics training,and provision of healthy food for staff at a reasonable cost.
Table 3. Activities carried out by staff PIP teams (Intervention centers) and wellness champions (Controlcenters) during the study period, 2008–2012.
CenterWork
OrganizationPsychosocial
StressorsMusculoskeletaland Ergonomics
FoodEnvironment
HealthImprovement
I-1 Communications logRedesigned employee
break room,picnic table
Ergonomicstraining
Healthy food invending machine Yoga, massage
I-2
Employee suggestion box,method to resolve
communications problemson units
Picnic tables andlawn furniture
Ergonomicstraining
Healthy food invending machine
Nutritioneducation, walking
program
I-3
Staff garden, meetings withcertified nursing assistants
to discuss health andsafety concerns
Staff gardenmaintenance(for 3 years)
Ergonomicstraining
Healthy snacks, fruitbaskets at each unit,
low-cost healthy foodoptions in dining hall
Yoga, weight lossprogram, nutrition
education
C-1 – – – Healthy snacks –
C-2 – Softball team – Healthy snacks Annual health fair
C-3 – – – Healthy snacks –
At intervention center I-3, when the PIP team spearheaded a gardening project, the originalmotivation was healthy eating. The team members then also used the garden project as a prototype fordeveloping good proposals and presenting them to management for support and funding. Once it began,they discovered that the garden had many other benefits, including team-building, communications,exercise, stress relief, and a potential for fresh produce for residents as well as staff.
In contrast, in the NPHP centers, there were no projects designed to address up-stream workorganization, psychosocial stressors, ergonomics, or work environment factors. Activities tended tosupport individual behavior change, e.g., coping, relaxation, and exercise (such as softball games).Correspondingly, none of the interviewed wellness champions in these centers demonstrated anunderstanding of how features of the job or workplace might influence health behaviors, or any visionas to what integration of OSH and HP might entail.
3.4. Program Impact
At the organizational level, as discussed above, a markedly larger number of activities was carriedout in the PIP centers, compared with the control sites. The PIP teams had a number of positiveimpacts on their health environment at work. All three, independently, addressed lack of healthy foodoptions as a priority and were able to obtain healthier food choices in vending machines. In one facility,the kitchen agreed to provide soups, salads, and sandwiches at reduced cost to employees. One teaminitiated the creation of a community garden.
The post-intervention surveys demonstrated slightly more organizational changes in the PIPcenters than the NPHP centers (Table 4). These included both better communication and moreopportunities to voice opinions and influence decisions. More staff members in the PIP sites (28%versus 16% in NPHP sites) said that they were consulted for program suggestions, and in general theyreported slightly more opportunities to participate in decision-making and contribute suggestions.Qualitative data (focus groups and interviews) indicated that staff awareness of and participationin team-sponsored activities were higher in PIP centers. Further, researcher notes confirmed that
255
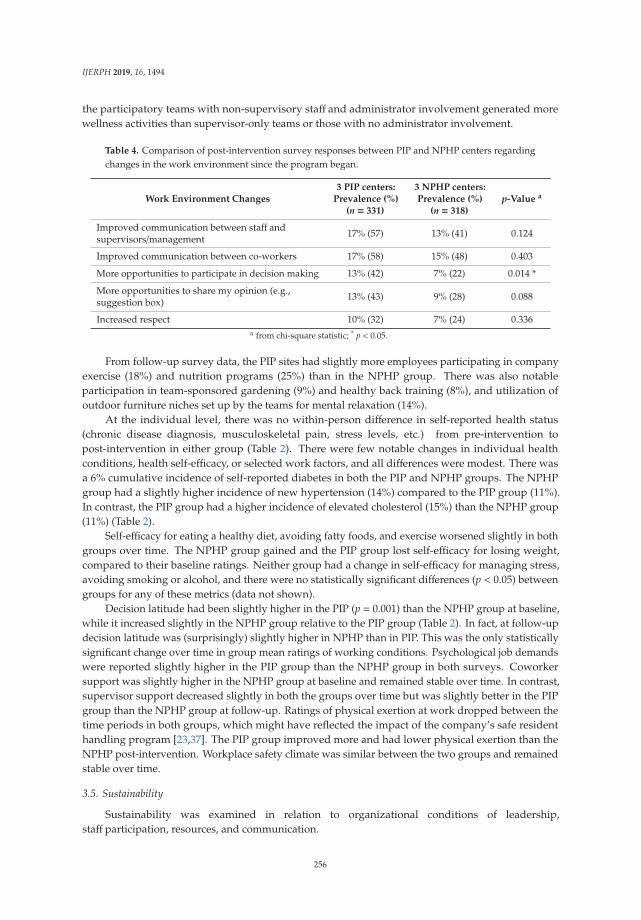
IJERPH 2019, 16, 1494
the participatory teams with non-supervisory staff and administrator involvement generated morewellness activities than supervisor-only teams or those with no administrator involvement.
Table 4. Comparison of post-intervention survey responses between PIP and NPHP centers regardingchanges in the work environment since the program began.
Work Environment Changes3 PIP centers:
Prevalence (%)(n = 331)
3 NPHP centers:Prevalence (%)
(n = 318)p-Value a
Improved communication between staff andsupervisors/management 17% (57) 13% (41) 0.124
Improved communication between co-workers 17% (58) 15% (48) 0.403
More opportunities to participate in decision making 13% (42) 7% (22) 0.014 *
More opportunities to share my opinion (e.g.,suggestion box) 13% (43) 9% (28) 0.088
Increased respect 10% (32) 7% (24) 0.336a from chi-square statistic; * p < 0.05.
From follow-up survey data, the PIP sites had slightly more employees participating in companyexercise (18%) and nutrition programs (25%) than in the NPHP group. There was also notableparticipation in team-sponsored gardening (9%) and healthy back training (8%), and utilization ofoutdoor furniture niches set up by the teams for mental relaxation (14%).
At the individual level, there was no within-person difference in self-reported health status(chronic disease diagnosis, musculoskeletal pain, stress levels, etc.) from pre-intervention topost-intervention in either group (Table 2). There were few notable changes in individual healthconditions, health self-efficacy, or selected work factors, and all differences were modest. There wasa 6% cumulative incidence of self-reported diabetes in both the PIP and NPHP groups. The NPHPgroup had a slightly higher incidence of new hypertension (14%) compared to the PIP group (11%).In contrast, the PIP group had a higher incidence of elevated cholesterol (15%) than the NPHP group(11%) (Table 2).
Self-efficacy for eating a healthy diet, avoiding fatty foods, and exercise worsened slightly in bothgroups over time. The NPHP group gained and the PIP group lost self-efficacy for losing weight,compared to their baseline ratings. Neither group had a change in self-efficacy for managing stress,avoiding smoking or alcohol, and there were no statistically significant differences (p < 0.05) betweengroups for any of these metrics (data not shown).
Decision latitude had been slightly higher in the PIP (p = 0.001) than the NPHP group at baseline,while it increased slightly in the NPHP group relative to the PIP group (Table 2). In fact, at follow-updecision latitude was (surprisingly) slightly higher in NPHP than in PIP. This was the only statisticallysignificant change over time in group mean ratings of working conditions. Psychological job demandswere reported slightly higher in the PIP group than the NPHP group in both surveys. Coworkersupport was slightly higher in the NPHP group at baseline and remained stable over time. In contrast,supervisor support decreased slightly in both the groups over time but was slightly better in the PIPgroup than the NPHP group at follow-up. Ratings of physical exertion at work dropped between thetime periods in both groups, which might have reflected the impact of the company’s safe residenthandling program [23,37]. The PIP group improved more and had lower physical exertion than theNPHP post-intervention. Workplace safety climate was similar between the two groups and remainedstable over time.
3.5. Sustainability
Sustainability was examined in relation to organizational conditions of leadership,staff participation, resources, and communication.
256
IJERPH 2019, 16, 1494
Leadership was vital for the sustainability of participatory programs. Administrative andsupervisor support for wellness towards PIP teams and employees were indicated in many formswithin the qualitative data. It included financial support, enabling staff to take time off for meetingsand activities, providing meeting space, and verbal encouragement.
Both management and supervisor support were cited in the qualitative data by many employeesand managers to be important for program sustainability. The effects of administrator support (andturnover) were mentioned as important in encouraging or discouraging team meetings and activities.Support from management (administrators and nursing directors) and from supervisors (departmentheads and unit/office managers) were examined separately.
Overall, the NPHP centers demonstrated higher management support than the PIP centers.Administrators in PIP centers discussed HP as part of their everyday work and considered theirwellness champions and teams as part of their organizational structure (except in I-2).
Supervisor support was perceived to be higher in two PIP centers, I-1 and I-3, and low at I-2.At the NPHP center C-2, many employees described their supervisors as being supportive to HPby allowing flexibility in their staff schedules and even covering for them while they participated inactivities. Other supervisors within this center were described to be supportive by participating inactivities themselves and motivating their staff to participate.
PIP teams were able to provide more activities for the staffmembers with the presence of leadershipsupport. When leadership support was absent, management in these centers talked about being facedwith other pressures, needing to make decisions in favor of other more urgent projects and programs.
Management changes in two PIP centers led to combining the existing PIP teams with other,previously inactive committees (“staff appreciation committee” in site I-1, and “fun committee” in I-3).In both cases, the non-supervisory PIP teams were converted to administrator-directed committeeswith different agendas and priorities.
Staff participation in programs and activities is obviously a key measure of program impactas well as likely sustainability. Perceived lack of staff participation in PIP teams and activities wasevaluated from the PIP team member interviews and focus groups.
All PIP team members stated in the focus groups that clinical staff had difficulty in getting time toattend team meetings or activities. Staff participation in team-sponsored activities was poor withincenter I-2. Researcher experience and logs showed that participation in PIP teams had been quite highat the start of the project, yet involvement of clinical staff diminished due to frustrations with theirdecision-making process and clinical responsibilities.
Employee participation in all three PIP teams dropped to a low number of non-supervisoryclinical staff at the end of year 3 of the intervention. Low participation of clinical staff in activities wereattributed to staffing shortages, time constraints, and clinical care responsibilities.
Resources mentioned in the interviews and focus groups included financial support from thecorporation, in-house/in-kind personal effort, and outside support. Although wellness was a statedgoal for both the PIP and NPHP centers, no funds were allocated in any of the facilities’ budgets foremployee wellness except in the first year (2008), when the corporation provided $700 per year foreach facility. After this line item was dropped, most facilities engaged in regular fund-raising for theirprograms and many of the key informants expressed frustration at the lack of funds for their programs.
In the PIP centers, several projects and especially the higher cost projects simply could not beimplemented without adequate resources. At one PIP site (I-2), much of their past activity had focusedon fund-raising, which detracted from effort and time that could otherwise have been spent on healthand wellness activities.
Using existing in-house resources was an opportunity for the PIP teams to benefit from theknowledge and skills of individual staff members. At Center I-1, one of the nurses offered yogaclasses and another offered massages; at I-3, the dietitian offered many in-house programs and servicesincluding a weight loss program, potlucks, and healthy recipes.
257
IJERPH 2019, 16, 1494
Team members in the PIP centers identified researcher involvement and guidance as a key outsideresource and a vital link to sustainability of the teams. At center I-2, most members believed thatthe PIP team would not continue without researcher support. The research team provided materialsupport to all three PIP centers, including ergonomic training sessions to staff members, tools andseedlings for the garden, and an exercise class instructor.
Among NPHP centers, the primary forms of outside support cited were discounts for gymmembership, health information, and free health screenings by group health insurance companies.In Center C-2, respondents also cited outside support from community programs along with insurancecompany services.
Communication was mentioned in the qualitative data as factors that are essential for sustaininga participatory health program.
Communication between the PIP teams or wellness champions with management as well aswith the employees was uneven in both the PIP and NPHP centers. Employees in the PIP centersreported having good communication except at the I-2 center, where both the employees and managersexpressed lack of communication as one of the largest stressors and most critical barriers to successfulprogram implementation. The administrator at center I-2 concurred about the lack of communicationbetween the PIP team and management. There appeared to be a trend towards better communicationin centers where there was focused attention on work organization issues. In centers where closed-doormanagement meetings were opened to staff or where the wellness champion utilized several methodsof communication (e.g., memos, flyers, announcements during meetings, etc.), it was viewed as asmaller problem or not a problem at all.
3.6. Differences Among Non-Intervention Centers
Despite the overall group differences, one NPHP center (C-2) exhibited some characteristics andactivities similar to the two positive PIP centers from the qualitative data from this center. Even withno official team at this center, the few employees involved in planning the activities had positivemanagement support and were successful in obtaining high staff participation. The administrator,supervisors, and employees appeared to see wellness as a part of their organizational culture.The employee focus group indicated that most of the employees at this center had very few complaints.Most people agreed that good communication existed between management and employees andbetween the people planning the wellness activities and the rest of the management and staff.While employees at other NPHP facilities appeared uncertain about the idea of integration, the facilitymanager at C-2 (with previous knowledge about ergonomics and musculoskeletal training) led thesafety committee and demonstrated interest in wellness. This manager shared ideas with the researchersabout opportunities for integrating OSH and HP within the center.
4. Discussion
This study evaluated a participatory, integrated OSH/HP intervention in three skillednursing facilities compared to three others with more traditional, non-participatory HP programs.Mixed qualitative and quantitative data collected over a four-year follow-up period demonstratedprogram feasibility, good process fidelity while the researchers were actively involved, meaningfulnessof the integration concept to worker representatives, and moderate program impact on someorganizational conditions of work. Sustainability, however, suffered due to lack of resources andinconsistent manager support.
4.1. Process Fidelity
Process fidelity was high initially in all three intervention sites; the program was introducedin a uniform manner by the researchers and proceeded as intended for the first two years or so.Members of the PIP teams were highly motivated and responsive to the organizing principles of workerpriority-setting and a combined focus on both work and non-work obstacles to health. The center
258
IJERPH 2019, 16, 1494
administrators permitted front-line staff to volunteer for the teams and assisted with the logistics ofscheduling meetings, although use of paid work time for meetings was inconsistent. Involvementof non-supervisory clinical employees in the planning of workplace HP projects was high in the PIPcenters at the start of the research project, although it diminished subsequently.
4.2. Integration
Compared to the traditional wellness programs in the control sites, the participatory teams in thethree PIP centers were far more likely to develop activities with a broad scope, encompassing elementsof both OSH and HP. Over time, the teams in the PIP centers addressed work organization, psychosocialstressors, physical ergonomics, in addition to taking an organizational approach to HP goals such asimproving the food environment at work. In contrast, the NPHP centers primarily supported individualbehavior change, with minimal attention to psychosocial stressors or the work environment. Consistentwith our findings, a previous intervention study reported higher blue-collar worker participation withOSH/HP interventions compared to standard HP interventions [16]. In particular, when management’sefforts to reduce workplace hazards were apparent, the workers were more likely to participate [16].In our study, administrative changes and logistical challenges appeared to cause worker participationin the teams to dwindle gradually.
4.3. Impact
The number and variety of workplace HP activities initiated during the study period were higherin the PIP centers than the NPHP centers. Two of the three PIP centers indicated improvement inorganizational factors. There were no larger corporate influences that would have produced thesepositive changes specifically in the three PIP centers, so it seems reasonable to consider them at leastpartially as outcomes of the integrated participatory program.
There was no evidence of major change in chronic illness incidence or the perception of healthstatus or behaviors following this participatory intervention, but the four-year follow-up period wastoo short for any such difference to be expected.
The study hypothesis was that the PIP teams would have more impact than the NPHP programs.In a participatory approach, employees are actively engaged in problem identification, decisionmaking, implementation, and evaluation of the program [38]. This approach has been argued tobenefit intervention effectiveness because employees are well-qualified to identify opportunities andobstacles present in their work environment [25], and also because participating in intervention designand implementation could reduce perceived lack of decision latitude [9,39]. Intervention study withassembly workers has demonstrated improved health and work performance in the participatorygroup compared to controls [40]. While there is substantial literature on participatory workplaceinterventions, the literature is more consistent about short-term and process benefits than longer-termones. It remains challenging to compile the evidence in such a way as to identify patterns that explaindifferences in impact.
4.4. Sustainability
Overall leadership support is widely recognized as crucial factors for a sustainable workforcehealth program of any type [16,32,41] and were so endorsed in the qualitative interviews in our study.Two PIP centers exhibited positive indicators with the participatory approach including essentialfactors such as support from the center that favored the continuation of meetings and activities.
Unfortunately, the initially high level of administrator supports and staff participation in projectplanning diminished somewhat over time. One of our goals was to incorporate the teams into otheractive committees with similar interests, in order to increase their long-term sustainability. In thetwo centers where this occurred, the teams were absorbed into committees without responsibility foremployee health.
259
IJERPH 2019, 16, 1494
Administrator changes also negatively impacted management support, financial resources,and time release for program participation—all identified as important for progress of the participatoryprogram [32]. Challenges to long-term PIP sustainability included communication barriers amongemployees, especially in different units, shifts, and job groups; excessive reliance on individualprogram champions at both site and regional levels; inconsistent corporate commitment to employeeHP; and lack of a reward system for champions’ or administrators’ efforts. These mostly pre-dated theparticipatory teams, although we had sought to screen centers for favorable conditions.
All six centers lacked financial resources to sustain even basic wellness programs, such as payingfor instructors in yoga, meditation, or fitness. It did not appear that employee health (other than saferesident handling, which had received a substantial investment) was perceived to generate a highenough return on investment to be sustained in this company.
4.5. Study Strengths and Limitations
A major strength of this study is the detailed information obtained from various data sources andthe triangulation of qualitative and quantitative data. Mixed methods research is valuable becauseit captures the information from various perspectives and can support qualitative and quantitativefindings [42]. This process evaluation is rich in detail and provides a comprehensive picture of theprogram. Further, the long follow-up period permits a reasonable understanding of the dynamicsover time.
On the other hand, evaluation of the PIP’s impact was limited by the fact that the sites were notselected at random. The three PIP sites were volunteered by their administrators in response to arecruitment effort by the investigators through a key regional staff member. The three NPHP siteswere also selected by the same regional representative, in response to the research team’s specifiedcriteria, and then approached for management agreement to permit data collection. As a consequence,there were some anticipated baseline differences between the two groups, both in prior HP activityand possibly in administrator interest in and initiative toward workforce well-being. A further issueis that the study results are not expected to be generalizable, except to other nursing homes withsimilar management interest and willingness. Nevertheless, the results do demonstrate the feasibilityof conducting a participatory change process in this sector, despite (in the U.S.A., at least) tight staffingand scheduling, coupled with low union representation to protect job security for those who voicetheir opinions about root causes of health and safety problems.
In theory, the gold standard for an intervention study is the randomized controlled trial. However,the benefits of randomization in reducing confounding are not realized except with a large sample.In this case, the intervention was carried out at the level of the entire facility (PIP). In practice, it was notlogistically or economically feasible for us to enroll a large number of facilities for such an intervention.Even with some alternative designs, such as the stepped-wedge [43], there is still concern aboutpotential confounding and often a randomization element, thus the number of intervention unitsremains important. One alternative is to compare the treatment groups on baseline characteristics thatmight influence the outcome, which we have done here. In fact, perceived working conditions werequite similar except for decision latitude; since that decreased later rather than increasing in the PIPgroup, the change in time was unlikely to be an artifact of a difference at baseline.
The other advantage of a randomized controlled trial is that with double-blinding, the possibilityof information bias can be greatly reduced. However, blinding of participants and researchersis also infeasible for organizational-level interventions. In turn, randomization and blindingmay have disadvantages for organizational-level interventions, such as limited capacity to assessmulti-dimensional interventions or evaluate process, quality, or performance, and incompatibilitywith community trust, choice, and participation often needed for successful program design andevaluation [44–46].
Another limitation of this study is the difficulty to show the actual impact of the participatoryprogram due to constant changes in the organization. For example, turnover in leadership in the study
260
IJERPH 2019, 16, 1494
sites appeared to affect program success with administrator changes in the PIP sites during the studyperiod. Similarly, employee turnover limited our ability to examine within-person changes over time,through reduced statistical power.
Participatory programs can be challenging to implement and evaluate in a research context becausekey elements cannot be controlled by the investigators; for example, interventions are selected anddesigned by workers after the program is already underway, and interventions addressing higher-levelorganizational obstacles may provoke institutional resistance that might not have been visible or evenpresent at the beginning of the project. These issues were known in advance and cannot be preventedeven when they are anticipated. It will always be the case that many organizations and workplaceswill refuse voluntary worker health improvement efforts, even when resources are offered to facilitatethe program. The criteria for selection of participatory intervention sites have been revised on thebasis of this experience, in an attempt to better inform decision-makers in advance about the expectedprocess and its potential benefits and costs.
5. Conclusions
The intervention program had some positive impacts on work organization in the interventioncenters. The fundamental Total Worker Health concept of integrating OSH and HP was intuitive tomany workers; they enthusiastically envisioned and sought to carry out integrated programming,and a number of activities improved the health climate in these workplaces. Active involvement ofnon-supervisory employees in program design and conduct appeared to benefit the work environmentand employee morale and engagement. Actively engaged leadership was no less important: programintensity and success fluctuated noticeably with changes in management. Both managers and employeescited the importance for success of factors such as employee program ownership, empowerment,and skill-building (setting appropriate goals, balancing of costs and benefits when weighing interventionalternatives, etc.).
Unfortunately, our planned reduction in researcher facilitation efforts was followed by anerosion of the previously high level of staff participation in project planning. It was disappointingto observe the decline in company commitment to the participatory employee teams despite theirdemonstrated feasibility and robust worker engagement, in contrast to the company workplace healthpromotion program.
Participatory OSH/HP is challenging in the long-term care sector due to highly demanding jobsand tight staffing. Managers and front-line workers have different perceptions of the long-term careenvironment [21], likely arising naturally from their positions in the occupational hierarchy and theirconsequent exposures to health and safety hazards. Improved systems of communication betweenlevels and program design are needed that support front-line workers to participate in identifying andresolving problems.
PIP team resources, breadth of worker participation, and management support were importantpreconditions for potential program sustainability. Future efforts should incorporate more robustorganizational structures to enhance these factors for program success. Lessons from this study mayguide other long-term care facilities to build a sustainable, integrated, and participatory program.
Author Contributions: Conceptualization, L.P., R.K.; methodology, R.K., L.P., M.F., Y.Z.; formal analysis, R.K., J.F.;investigation, L.P., M.F., R.K., Y.Z., J.F.; writing—original draft preparation, R.K., L.P., Y.Z., M.F.; writing—reviewand editing, R.K., L.P., Y.Z.; supervision, L.P.; funding acquisition, L.P.
Funding: The Center for the Promotion of Health in the New England Workplace is supported by Grant Number1 U19 OH008857 from the National Institute for Occupational Safety and Health (CDC). This work is solely theresponsibility of the authors and does not necessarily represent the official views of NIOSH.
Acknowledgments: Sandy Sun, project administration; Michelle Holmberg, Lara Blais, Jennifer Russell,and Shpend Qamili, workplace program implementation and facilitation; ProCare research team and numerousstudents who assisted with survey data collection, and Wing Hung Yuen for manuscript formatting.
261
IJERPH 2019, 16, 1494
Conflicts of Interest: The authors declare no conflict of interest. The funders had no role in the design of thestudy; in the collection, analyses, or interpretation of data; in the writing of the manuscript, or in the decision topublish the results.
References
1. Sara, J.D.; Prasad, M.; Eleid, M.F.; Zhang, M.; Widmer, R.J.; Lerman, A. Association Between Work-RelatedStress and Coronary Heart Disease: A Review of Prospective Studies Through the Job Strain, Effort-RewardBalance, and Organizational Justice Models. J. Am. Heart Assoc. 2018, 7. [CrossRef]
2. Caruso, C.C. Negative impacts of shiftwork and long work hours. Rehabil. Nurs. 2014, 39, 16–25. [CrossRef][PubMed]
3. Chandola, T.; Brunner, E.; Marmot, M. Chronic stress at work and the metabolic syndrome: Prospectivestudy. BMJ (Clinical research ed.) 2006, 332, 521–525. [CrossRef] [PubMed]
4. Wang, X.S.; Armstrong, M.E.; Cairns, B.J.; Key, T.J.; Travis, R.C. Shift work and chronic disease:The epidemiological evidence. Occup. Med. 2011, 61, 78–89. [CrossRef] [PubMed]
5. Magnusson Hanson, L.L.; Westerlund, H. Job strain and loss of healthy life years between ages 50 and 75by sex and occupational position: Analyses of 64 934 individuals from four prospective cohort studies.Occup. Environ. Med. 2018, 75, 486–493. [CrossRef] [PubMed]
6. Harris, J.R.; Huang, Y.; Hannon, P.A.; Williams, B. Low-socioeconomic status workers: Their health risks andhow to reach them. J. Occup. Environ. Med. 2011, 53, 132–138. [CrossRef] [PubMed]
7. Thompson, S.E.; Smith, B.A.; Bybee, R.F. Factors influencing participation in worksite wellness programsamong minority and underserved populations. Fam. Community Health 2005, 28, 267–273. [CrossRef]
8. Miranda, H.; Gore, R.J.; Boyer, J.; Nobrega, S.; Punnett, L. Health Behaviors and Overweight in NursingHome Employees: Contribution of Workplace Stressors and Implications for Worksite Health Promotion.Scientific World J. 2015, 2015, 915359. [CrossRef] [PubMed]
9. Punnett, L.; Cherniack, M.; Henning, R.; Morse, T.; Faghri, P.; Team, C.-N.R. A conceptual framework forintegrating workplace health promotion and occupational ergonomics programs. Public Health Rep. 2009,124 (Suppl. 1), 16–25. [CrossRef]
10. Nobrega, S.; Champagne, N.; Abreu, M.; Goldstein-Gelb, M.; Montano, M.; Lopez, I.; Arevalo, J.;Bruce, S.; Punnett, L. Obesity/Overweight and the Role of Working Conditions: A Qualitative, ParticipatoryInvestigation. Health Promot Pract. 2016, 17, 127–136. [CrossRef]
11. Jorgensen, M.B.; Villadsen, E.; Burr, H.; Punnett, L.; Holtermann, A. Does employee participation inworkplace health promotion depend on the working environment? A cross-sectional study of Danishworkers. BMJ Open 2016, 6, e010516. [CrossRef] [PubMed]
12. Baker, E.; Israel, B.A.; Schurman, S. The integrated model: implications for worksite health promotion andoccupational health and safety practice. Health Educ Q. 1996, 23, 175–190. [CrossRef] [PubMed]
13. DeJoy, D.M.; Parker, K.M.; Padilla, H.M.; Wilson, M.G.; Roemer, E.C.; Goetzel, R.Z. Combining environmentaland individual weight management interventions in a work setting: Results from the Dow chemical study.J. Occup. Environ. Med. 2011, 53, 245–252. [CrossRef] [PubMed]
14. World Health Organization. Healthy Workplaces: A Model for Action: for Employers, Workers, Policymakers andPractitioners; World Health Organization: Geneva, Switzerland, 2010.
15. Schill, A.L.; Chosewood, L.C. The NIOSH Total Worker Health program: An overview. J. Occup. Environ. Med.2013, 55, S8–S11. [CrossRef]
16. Hunt, M.K.; Lederman, R.; Stoddard, A.M.; LaMontagne, A.D.; McLellan, D.; Combe, C.; Barbeau, E.;Sorensen, G. Process evaluation of an integrated health promotion/occupational health model in WellWorks-2.Health Educ. Behav. 2005, 32, 10–26. [CrossRef] [PubMed]
17. Sorensen, G.; Stoddard, A.; Hunt, M.K.; Hebert, J.R.; Ockene, J.K.; Avrunin, J.S.; Himmelstein, J.;Hammond, S.K. The effects of a health promotion-health protection intervention on behavior change:The WellWorks Study. Am. J. Public Health 1998, 88, 1685–1690. [CrossRef] [PubMed]
18. Tveito, T.H.; Eriksen, H.R. Integrated health programme: A workplace randomized controlled trial.J. Adv. Nurs. 2009, 65, 110–119. [CrossRef] [PubMed]
262
IJERPH 2019, 16, 1494
19. Anger, W.K.; Elliot, D.L.; Bodner, T.; Olson, R.; Rohlman, D.S.; Truxillo, D.M.; Kuehl, K.S.; Hammer, L.B.;Montgomery, D. Effectiveness of total worker health interventions. J. Occup. Health Psychol. 2015, 20, 226–247.[CrossRef]
20. Feltner, C.; Peterson, K.; Palmieri Weber, R.; Cluff, L.; Coker-Schwimmer, E.; Viswanathan, M.; Lohr, K.N.The Effectiveness of Total Worker Health Interventions: A Systematic Review for a National Institutes ofHealth Pathways to Prevention Workshop. Ann. Intern. Med. 2016, 165, 262–269. [CrossRef] [PubMed]
21. Zhang, Y.; Flum, M.; Nobrega, S.; Blais, L.; Qamili, S.; Punnett, L. Work organization and health issues inlong-term care centers. J. Gerontol. Nurs. 2011, 37, 32–40. [CrossRef]
22. Kurowski, A.; Gore, R.; Buchholz, B.; Punnett, L. Differences among nursing homes in outcomes of a saferesident handling program. J. Healthc. Risk Manag. 2012, 32, 35–51. [CrossRef]
23. Kurowski, A.; Buchholz, B.; Punnett, L. A physical workload index to evaluate a safe resident handlingprogram for nursing home personnel. Hum. Factors 2014, 56, 669–683. [CrossRef] [PubMed]
24. Zhang, Y.; Flum, M.; Kotejoshyer, R.; Fleishman, J.; Henning, R.; Punnett, L. Workplace ParticipatoryOccupational Health/Health Promotion Program: Facilitators and Barriers Observed in Three NursingHomes. J. Gerontol. Nurs. 2016, 42, 34–42. [CrossRef]
25. Henning, R.; Warren, N.; Robertson, M.; Faghri, P.; Cherniack, M.; Team, C.-N.R. Workplace health protectionand promotion through participatory ergonomics: An integrated approach. Public Health Rep. 2009, 124(Suppl. 1), 26–35. [CrossRef]
26. Antonovsky, A. Unraveling the Mystery of Health: How People Manage Stress and Stay Well; Jossey-Bass:San Francisco, CA, USA, 1987.
27. Bauer, G.; Jenny, G. Development, Implementation and Dissemination of Occupational HealthManagement (OHM): Putting Salutogenesis into Practice; Houdmont, J., McIntyre, S., Eds.; Springer:Dordrecht, The Netherlands, 2007.
28. Kahonen, K.; Naatanen, P.; Tolvanen, A.; Salmela-Aro, K. Development of sense of coherence during twogroup interventions. Scand. J. Psychol. 2012, 53, 523–527. [CrossRef] [PubMed]
29. Laing, A.C.; Frazer, M.B.; Cole, D.C.; Kerr, M.S.; Wells, R.P.; Norman, R.W. Study of the effectiveness of aparticipatory ergonomics intervention in reducing worker pain severity through physical exposure pathways.Ergonomics 2005, 48, 150–170. [CrossRef] [PubMed]
30. Haro, E.; Kleiner, B.M. Macroergonomics as an organizing process for systems safety. Appl. Ergon. 2008, 39,450–458. [CrossRef]
31. Jagosh, J.; Macaulay, A.C.; Pluye, P.; Salsberg, J.; Bush, P.L.; Henderson, J.; Sirett, E.; Wong, G.; Cargo, M.;Herbert, C.P.; et al. Uncovering the benefits of participatory research: Implications of a realist review forhealth research and practice. Milbank Q. 2012, 90, 311–346. [CrossRef]
32. Zhang, Y.; Flum, M.; West, C.; Punnett, L. Assessing Organizational Readiness for a Participatory OccupationalHealth/Health Promotion Intervention in Skilled Nursing Facilities. Health Promot. Pract. 2015, 16, 724–732.[CrossRef]
33. Zhang, Y.; Punnett, L.; Gore, R. Relationships among employees’ working conditions, mental health, andintention to leave in nursing homes. J. Appl. Gerontol. 2014, 33, 6–23. [CrossRef]
34. Zhang, Y.; Punnett, L.; McEnany, G.P.; Gore, R. Contributing influences of work environment on sleepquantity and quality of nursing assistants in long-term care facilities: a cross-sectional study. Geriatr Nurs.2016, 37, 13–18. [CrossRef] [PubMed]
35. Karasek, R.; Brisson, C.; Kawakami, N.; Houtman, I.; Bongers, P.; Amick, B. The Job Content Questionnaire(JCQ): An instrument for internationally comparative assessments of psychosocial job characteristics. J. Occup.Health Psychol. 1998, 3, 322–355. [CrossRef]
36. Griffin, M.A.; Neal, A. Perceptions of safety at work: A framework for linking safety climate to safetyperformance, knowledge, and motivation. J. Occup. Health Psychol. 2000, 5, 347–358. [CrossRef]
37. Gold, J.E.; Punnett, L.; Gore, R.J. Predictors of low back pain in nursing home workers after implementationof a safe resident handling programme. Occup. Environ. Med. 2017, 74, 389–395. [CrossRef] [PubMed]
38. Baum, F.; MacDougall, C.; Smith, D. Participatory action research. J. Epidemiol. Community Health 2006, 60,854–857. [CrossRef] [PubMed]
39. Punnett, L.; Warren, N.; Henning, R.; Nobrega, S.; Cherniack, M. Participatory ergonomics as a model forintegrated programs to prevent chronic disease. J. Occup. Environ. Med. 2013, 55, S19–S24. [CrossRef]
263
IJERPH 2019, 16, 1494
40. Tsutsumi, A.; Nagami, M.; Yoshikawa, T.; Kogi, K.; Kawakami, N. Participatory intervention for workplaceimprovements on mental health and job performance among blue-collar workers: A cluster randomizedcontrolled trial. J. Occup. Environ. Med. 2009, 51, 554–563. [CrossRef]
41. Weiner, B.J.; Lewis, M.A.; Linnan, L.A. Using organization theory to understand the determinants of effectiveimplementation of worksite health promotion programs. Health Educ. Res. 2009, 24, 292–305. [CrossRef]
42. Curry, L.A.; Krumholz, H.M.; O’Cathain, A.; Plano Clark, V.L.; Cherlin, E.; Bradley, E.H. Mixed methods inbiomedical and health services research. Circ. Cardiovasc. Qual. Outcomes. 2013, 6, 119–123. [CrossRef]
43. Schelvis, R.M.; Oude Hengel, K.M.; Burdorf, A.; Blatter, B.M.; Strijk, J.E.; van der Beek, A.J. Evaluation ofoccupational health interventions using a randomized controlled trial: Challenges and alternative researchdesigns. Scand. J. Work Environ. Health 2015, 41, 491–503. [CrossRef] [PubMed]
44. Chaulk, C.P.; Kazandjian, V.A. Moving beyond randomized controlled trials. Am. J. Public Health. 2004, 94,1476. [CrossRef] [PubMed]
45. Griffiths, A. Organizational interventions: Facing the limits of the natural science paradigm. Scand. J. WorkEnviron. Health. 1999, 25, 589–596. [CrossRef] [PubMed]
46. Simmons, R.K.; Ogilvie, D.; Griffin, S.J.; Sargeant, L.A. Applied public health research—Falling through thecracks? BMC Public Health 2009, 9, 362. [CrossRef] [PubMed]
© 2019 by the authors. Licensee MDPI, Basel, Switzerland. This article is an open accessarticle distributed under the terms and conditions of the Creative Commons Attribution(CC BY) license (http://creativecommons.org/licenses/by/4.0/).
264
International Journal of
Environmental Research
and Public Health
Article
Generalizability of Total Worker Health® OnlineTraining for Young Workers
Ashamsa Aryal 1,*, Megan Parish 2,3 and Diane S. Rohlman 1,2
1 Department of Occupational and Environmental Health, University of Iowa, Iowa City, IA 52242, USA;[email protected]
2 Oregon Institute of Occupational Health Sciences, Oregon Health & Science University, Portland, OR 97239,USA; [email protected]
3 Confluence Health, Wenatchee, WA 98801, USA* Correspondence: [email protected]
Received: 18 January 2019; Accepted: 12 February 2019; Published: 16 February 2019
Abstract: Young workers (under 25-years-old) are at risk of workplace injuries due to inexperience,high-risk health behaviors, and a lack of knowledge about workplace hazards. Training based onTotal Worker Health® (TWH) principles can improve their knowledge of and ability to identifyhazards associated with work organization and environment. In this study, we assessed changesto knowledge and behavior following an online safety and health training between two groups bycollecting information on the demographic characteristics, knowledge, and self-reported behaviorsof workplace health and safety at three different points in time. The participants’ age ranged from15 to 24 years. Age adjusted results exhibited a significant increase in knowledge immediately aftercompleting the training, although knowledge decreased in both groups in the follow-up. AmazonMarketplace Mechanical Turk (MTurk) participants demonstrated a greater increase in knowledge,with a significantly higher score compared to the baseline, indicating retention of knowledge threemonths after completing the training. The majority of participants in both groups reported thatthey liked the Promoting U through Safety and Health (PUSH) training for improving health andsafety and that the training should be provided before starting a job. Participants also said thatthe training was interactive, informative and humorous. The participants reported that the PUSHtraining prepared them to identify and control hazards in their workplace and to communicate wellwith the supervisors and coworkers about their rights. Training programs based on TWH improvesthe safety, health and well-being of young workers.
Keywords: young workers; training; Total Worker Health®; MTurk; health; safety; likeability;behavior change
1. Introduction
In 2016, there were approximately 19.3 million workers in the United States under the age of 24,representing 13% of the total workforce [1]. For 2016, incidence rates for non-fatal injuries and illnesseswere 101.9 per 10,000 Full Time Employment (FTE) compared to 100.4 for all ages [2]. Similarly, in 2014,the rates of work-related injuries treated in emergency departments for workers, aged 15–19 and 20–24were 2.18 times and 1.76 times greater than the rate for workers 25 years of age and older [3]. Accordingto the Census of Fatal Occupational Injuries, the average rate of fatal injuries among workers lessthan 18 years was 47 deaths per year from 1994 to 2013 [4]. Inexperience, lack of knowledge aboutworkplace hazards, and a reluctance to speak up have been associated with the increase in injury ratesin young workers [5–7]. Young workers do not mention safety as their main priority at work and areoften not aware of their legal rights and the tasks prohibited by labor laws [8]. They are eager to please
IJERPH 2019, 16, 577; doi:10.3390/ijerph16040577 www.mdpi.com/journal/ijerph265
IJERPH 2019, 16, 577
their supervisors and may be reluctant to report injuries leading to underreporting [7,9,10], whichmight lead to an underestimation of the injury rates.
The Occupational Safety and Health Administration (OSHA) requires training to be a part ofevery employer’s safety and health program to protect workers from injury and illness (OSHA, 2015).Training programs have been found to improve knowledge and awareness of workplace safety [8,11].However, most young workers report not receiving training on worker safety and health [12]. Thosethat receive training state that most trainings are brief and inadequate [13] and may not includeinformation addressing both health and safety topics [14].
Recognizing these issues among young workers, the National Institute for Occupational Safety andHealth (NIOSH) developed the Youth@Work: Talking Safety classroom-based curriculum to addressthe needs of young workers [15]. Promoting U through Safety and Health (PUSH), a Total WorkerHealth® (TWH) training, expands the content of the Youth@Work curriculum to include informationaddressing health, safety, and communication in an online format. PUSH was developed through theOregon Healthy Workforce Center, a NIOSH Total Worker Health® Center of Excellence [12,14,16].Total Worker Health® is a strategy that integrates health promotion with injury prevention by lookingat work as a social determinant of health. TWH focuses on job-related factors such as wages, hours ofwork, workload and stress levels, interactions with coworkers and supervisors, access to paid leave,and health promoting workplaces to have an impact on the wellbeing of workers [17]. Interventionsaddressing TWH improve workplace health effectively and more rapidly than wellness programssolely focused on health promotion [18–20].
Previously evaluated among parks and recreation workers, PUSH was found to be effective inincreasing the safety and health knowledge among young workers [12]. The current study assessedthe generalizability of the program among an expanded group of young workers. The main goal ofthe study was to assess the effectiveness of the PUSH training to increase knowledge about hazardidentification, control selection, and communication between two groups of young workers using apretest-posttest design. A second goal was to assess the likeability of the online training and to examinethe impact on behavior to prepare workers to address hazards in the workplace (i.e. preparedness).
2. Materials and Methods
2.1. Participants
The study was conducted in the United States in 2016. Two groups of young workers wererecruited for the study: young workers employed at a city park and recreation program (Park and Rec)in the Pacific Northwest and young workers who were members of Amazon Marketplace MechanicalTurk (MTurk) who were located throughout the US. In order to be eligible for the study, the participantsin both groups had to be less than 25 years of age and living in the United States. At baseline,57 Parks and Rec workers agreed to participate after receiving a letter with details on the studyduring orientation. A second group of young workers were recruited online via Amazon MarketplaceMechanical Turk (MTurk): an open online marketplace for work that requires human intelligence [21].Around 1000 MTurk workers answered a series of five questions as part of an eligibility screener.One hundred sixty-seven young workers between 18 and 24 years of age who met the eligibility criteriawere recruited at baseline.
Park and Rec participants received $25 for completing the initial survey and training, and another$25 for completing the follow-up survey in the form of an Amazon gift card sent via email. MTurkworkers received $0.02 to complete the initial screener, $20.00 to complete the training, and $4.00 tocomplete the follow-up survey through the MTurk platform. MTurk participants were paid less basedon the time and difficulty of the task and because of the culture of the platform, where requestors(i.e., researchers) were discouraged from inflating payments to promote responses. The Oregon Health& Science University institutional review board approved the study materials and procedures.
266
IJERPH 2019, 16, 577
2.2. Survey Instruments
Questionnaires were used to collect information at three time points: immediately priorto completing the training (Baseline), immediately after completing the training (Post-training),and 3-months after the training (Follow-up). Participants completed the questionnaire and thetraining online after they received a link to the materials either through their email or throughthe MTurk platform.
At baseline, participants provided demographic information along with information on workhistory and previous safety trainings. Health and safety knowledge was assessed immediately beforeand after the training by twenty-one multiple choice questions that were categorized into topics:hazard identification (e.g., “Sarah works at a bakery where her responsibilities are to take orders fromcustomers, make sandwiches, and tidy up. Sometimes the morning rush is so overwhelming that shegets very distracted. What type of hazard is a distraction?”), control selection (e.g., “What is the leasteffective way of controlling a hazard?”), communication including workers’ rights, health behaviors,and safety questions, (e.g., “Regarding workplace violence, it is your responsibility to . . . ”).
At the three-month follow-up, participants answered survey questionnaires about their currentjob, whether they liked the training and if they changed their behavior as a result of completing thetraining. Along with this, participants answered twenty-one knowledge questions and completeditems addressing their general health and other health behaviors. Open-ended questions were usedto assess the participants’ reaction to the training. Likeability and acceptability were assessed usingthe question "Did you like the PUSH training? Why or Why not?" and the impact of the training onbehavior change was assessed through the question “Did you see or experience any behaviors overthe last three months that you felt prepared to handle because of the PUSH training program? If so,please explain.”
2.3. PUSH Training
The PUSH training is comprised of topics from the NIOSH Youth@Work: Talking Safetycurriculum and two evidence-based curricula on health promotion [22,23], with additional topicsaddressing protection from workplace hazards, promotion of health and well-being, and workplacecommunication [12,16]. It was delivered through an online training format that had been used to teachskills using behavioral education principles among workers in different industries [14,24–26]. Thisformat has also been effective in disseminating information on occupational health and safety fordiverse worker groups [27–29].
Content experts in the field of occupational health and safety, and health promotion developedthe original PUSH training. The videos and content used in the training were pilot tested with youngworkers on the MTurk platform as a part of the development process. Questionnaire items (e.g.,demographics, work history, and likeability/acceptability) had been used previously by researchers inother studies with young workers [12,16]. The team used validated measures to assess general health,health behaviors, and job content [12,16].
PUSH is a self-paced online training that uses videos and real-life examples to teach youngworkers about safety, communication, and health. Participants were directed to a series of contentscreens with videos by an icon-based navigation system. Multiple choice questions were followed bybrief videos that needed to be correctly answered to progress through the training [12]. Additionaldetails in regard to the study are available at a separate study by the same co-author [12].
2.4. Statistical Analysis
Data was analyzed using SAS 9.4 (SAS Institute, Cary, NC, USA). t-Tests and chi-square tests wereused to examine differences in the demographic characteristics between the two groups at baseline.A mixed linear model with time-group interaction was used to evaluate the change in knowledgescore at baseline, post-training and at follow-up. Responses to the twenty-one knowledge questions
267
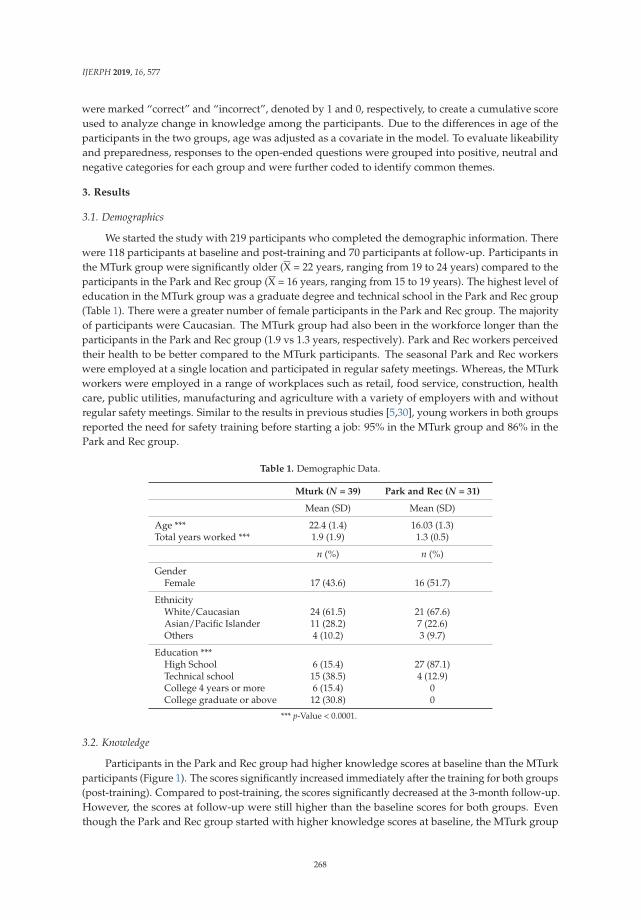
IJERPH 2019, 16, 577
were marked “correct” and “incorrect”, denoted by 1 and 0, respectively, to create a cumulative scoreused to analyze change in knowledge among the participants. Due to the differences in age of theparticipants in the two groups, age was adjusted as a covariate in the model. To evaluate likeabilityand preparedness, responses to the open-ended questions were grouped into positive, neutral andnegative categories for each group and were further coded to identify common themes.
3. Results
3.1. Demographics
We started the study with 219 participants who completed the demographic information. Therewere 118 participants at baseline and post-training and 70 participants at follow-up. Participants inthe MTurk group were significantly older (X = 22 years, ranging from 19 to 24 years) compared to theparticipants in the Park and Rec group (X = 16 years, ranging from 15 to 19 years). The highest level ofeducation in the MTurk group was a graduate degree and technical school in the Park and Rec group(Table 1). There were a greater number of female participants in the Park and Rec group. The majorityof participants were Caucasian. The MTurk group had also been in the workforce longer than theparticipants in the Park and Rec group (1.9 vs 1.3 years, respectively). Park and Rec workers perceivedtheir health to be better compared to the MTurk participants. The seasonal Park and Rec workerswere employed at a single location and participated in regular safety meetings. Whereas, the MTurkworkers were employed in a range of workplaces such as retail, food service, construction, healthcare, public utilities, manufacturing and agriculture with a variety of employers with and withoutregular safety meetings. Similar to the results in previous studies [5,30], young workers in both groupsreported the need for safety training before starting a job: 95% in the MTurk group and 86% in thePark and Rec group.
Table 1. Demographic Data.
Mturk (N = 39) Park and Rec (N = 31)
Mean (SD) Mean (SD)
Age *** 22.4 (1.4) 16.03 (1.3)Total years worked *** 1.9 (1.9) 1.3 (0.5)
n (%) n (%)
GenderFemale 17 (43.6) 16 (51.7)
EthnicityWhite/Caucasian 24 (61.5) 21 (67.6)Asian/Pacific Islander 11 (28.2) 7 (22.6)Others 4 (10.2) 3 (9.7)
Education ***High School 6 (15.4) 27 (87.1)Technical school 15 (38.5) 4 (12.9)College 4 years or more 6 (15.4) 0College graduate or above 12 (30.8) 0
*** p-Value < 0.0001.
3.2. Knowledge
Participants in the Park and Rec group had higher knowledge scores at baseline than the MTurkparticipants (Figure 1). The scores significantly increased immediately after the training for both groups(post-training). Compared to post-training, the scores significantly decreased at the 3-month follow-up.However, the scores at follow-up were still higher than the baseline scores for both groups. Eventhough the Park and Rec group started with higher knowledge scores at baseline, the MTurk group
268
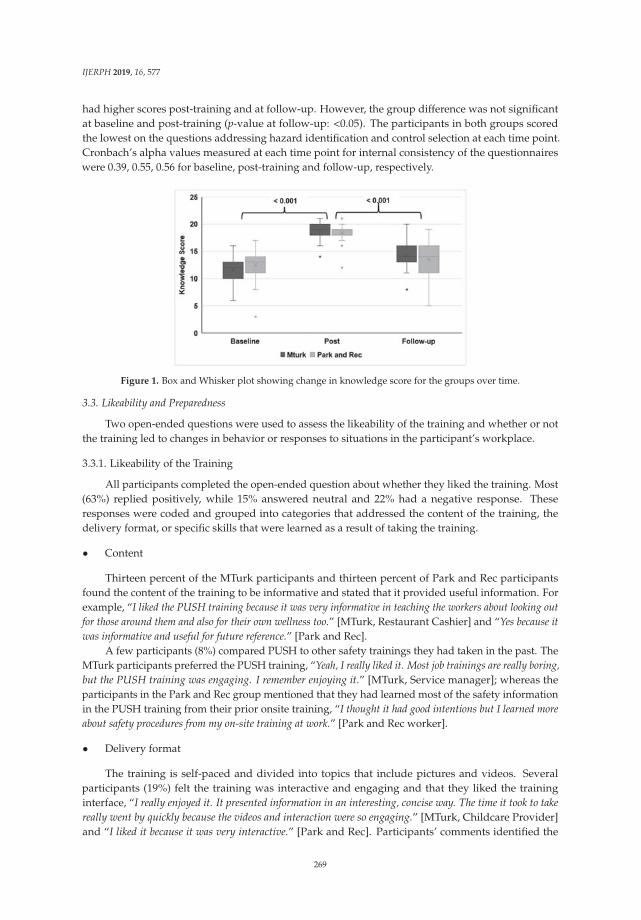
IJERPH 2019, 16, 577
had higher scores post-training and at follow-up. However, the group difference was not significantat baseline and post-training (p-value at follow-up: <0.05). The participants in both groups scoredthe lowest on the questions addressing hazard identification and control selection at each time point.Cronbach’s alpha values measured at each time point for internal consistency of the questionnaireswere 0.39, 0.55, 0.56 for baseline, post-training and follow-up, respectively.
Figure 1. Box and Whisker plot showing change in knowledge score for the groups over time.
3.3. Likeability and Preparedness
Two open-ended questions were used to assess the likeability of the training and whether or notthe training led to changes in behavior or responses to situations in the participant’s workplace.
3.3.1. Likeability of the Training
All participants completed the open-ended question about whether they liked the training. Most(63%) replied positively, while 15% answered neutral and 22% had a negative response. Theseresponses were coded and grouped into categories that addressed the content of the training, thedelivery format, or specific skills that were learned as a result of taking the training.
• Content
Thirteen percent of the MTurk participants and thirteen percent of Park and Rec participantsfound the content of the training to be informative and stated that it provided useful information. Forexample, “I liked the PUSH training because it was very informative in teaching the workers about looking outfor those around them and also for their own wellness too.” [MTurk, Restaurant Cashier] and “Yes because itwas informative and useful for future reference.” [Park and Rec].
A few participants (8%) compared PUSH to other safety trainings they had taken in the past. TheMTurk participants preferred the PUSH training, “Yeah, I really liked it. Most job trainings are really boring,but the PUSH training was engaging. I remember enjoying it.” [MTurk, Service manager]; whereas theparticipants in the Park and Rec group mentioned that they had learned most of the safety informationin the PUSH training from their prior onsite training, “I thought it had good intentions but I learned moreabout safety procedures from my on-site training at work.” [Park and Rec worker].
• Delivery format
The training is self-paced and divided into topics that include pictures and videos. Severalparticipants (19%) felt the training was interactive and engaging and that they liked the traininginterface, “I really enjoyed it. It presented information in an interesting, concise way. The time it took to takereally went by quickly because the videos and interaction were so engaging.” [MTurk, Childcare Provider]and “I liked it because it was very interactive.” [Park and Rec]. Participants’ comments identified the
269
IJERPH 2019, 16, 577
engaging/interactive nature (36%), the humor in the training (29%), and reported that it was easy tounderstand (21%), “I did. I really enjoyed the way that it was formatted and felt as though it was helpful andfunny without being corny or boring.” [MTurk, Admissions counselor] and “I enjoy the PUSH programbecause it’s both friendly and easy to understand.” [MTurk, Office assistant].
• Specific skills
Several of the participants (17%) mentioned that they liked the training because it increased theirknowledge and provided specific skills for their job. For example, “ . . . . . . . . . . . . .. I think it was useful,especially the parts about legal rights.” [Park and Rec].
• Negative and Mixed Findings
In contrast to the MTurk group, some participants in the Park and Rec group felt that the trainingwas repetitive and boring and they had learned this information in previous trainings, “I didn’t like itbecause it seemed repetitive to the safety training I underwent in order to get my job with PP&R.” [Park andRec] and “It was fine, long but I understand why it was long” [Park and Rec]. Other participants indicatedmixed impressions of the training. They felt that although it was not useful to them, it could be usefulto others, “It was fine. I didn’t learn a whole lot, but I can imagine it being useful for others.” [Park and Rec]
3.3.2. Preparedness
Although the majority of participants did not indicate any change in behavior when asked howthey felt prepared to handle real life issues after completing the PUSH training, about 30% did providean example. These responses were coded into categories that described an increase in awareness ofsafety and health hazards or identified specific changes in behavior. Most of these responses (67%)came from participants in the MTurk group.
• Increased awareness
Twenty percent of the participants mentioned that the PUSH training increased their awareness ofthe hazards in their workplace and were able to apply information from the training in certainsituations, “Yes, I am more aware of the dangers that I may face in the working area.” [MTurk]; “Iexperienced/noticed things that had been put in place to help keep us safe.” [Park and Rec], and “Therewere times where I reflected on the push training to help me in certain situations.” [Park and Rec].
• Behavior changes
Participants in the MTurk group provided more examples of behavior change than participants inthe Park and Rec group. Many described a specific change in their behavior as a result of completingthe training. For example, thinking about potential hazards prior to starting a task, “I am able tothink through tasks and situations more effectively before starting them. Anticipating potential danger is veryimportant in my workplace.” [MTurk] and “I made sure to create a safer workplace for myself. I start bycleaning my work space more often by removing pins and empty plastic bags that may cause me to slip andinjury myself.” [MTurk]. Other participants indicated reporting or “speaking up” about workplacehazards, “I noticed chemicals were not being stored correctly and I made sure to tell my boss about the issue andcorrect the problem.” [MTurk, Customer service representative], “I thought it was easier to talk to people Imanage about safety and how to take care of themselves on the job.” [MTurk], and “I have asked for help in afew situations where I thought I may have gotten injured from carrying something I wasn’t meant to carry bymyself such as large tables.” [MTurk].
Several described specific instances of where they changed their behavior, “I was able to handlehostile patients over the phone better to the PUSH training.” [MTurk], “There was a fire near our office thatforced us to put an evacuation plan into action that was inspired by me after participating in the PUSH program.”[MTurk, Office assistant], “I felt I knew how to better assert myself towards healthful choices.” [MTurk],
270
IJERPH 2019, 16, 577
“Within the past 3 months, I realized that I was more cautious with my actions especially when I was workingwith other people.” [MTurk], and “I used all my protective equipment when cleaning up the pool.” [Parkand Rec].
4. Discussion
Approaches focusing on education and training have shown improvement in workplacesafety [8,11]. As a result of completing the PUSH training, knowledge increased significantly frombaseline to post-training for both groups. Although knowledge decreased at follow-up, it still remainedelevated compared to baseline. The training was received positively by an overwhelming majority ofparticipants in both groups, with most of the participants reporting the training to be interactive andinformative and compared it with other training programs:
“Yes, because it provided me with lots of insightful information that I did not learn on my job. I was able toknow how to quickly respond to emergencies on the job after using the training program.” [MTurk, Cashier].
Several participants in the Park and Rec group mentioned that the PUSH training was repetitive.This is likely due to the fact that participants in the Park and Rec group receive mandatory safetytraining before starting their job and have regular safety meetings throughout the season. Thesemeetings address many of the topics presented in the PUSH training and could be the reason for thesenegative responses. On the other hand, MTurk participants were from diverse workplaces includingrestaurants and retail stores. Few of these participants reported receiving safety training. The majorityof the MTurk participants liked the training and felt the training prepared them for workplace hazards.
The questions evaluating participants’ reaction to the training included multiple choice on aLikert scale with items as well as open-ended questions. All the participants entered a response tothe question on likeability, and many gave specific reasons why they liked/did not like the training.The majority of participants answered the questions about preparedness and several (21%) providedspecific examples. These responses stated that the training prepared them to handle workplacehazards by increasing awareness and led to specific changes in their behavior. One participant in thePark and Rec group indicated, “I felt empowered to take action in my workplace environment when I sawsomething that violated my workplace rights or somebody else’s.” [Park and Rec]. Raising awareness aboutworking rights and building confidence in young workers to “speak up” about hazards is extremelyimportant in promoting health and safety. It is not uncommon for participants to leave open-endedquestions unanswered [31]. However, everyone in the study at follow-up provided their response tothe open-ended question on how the PUSH training prepared them for behavior change with majorityproviding specific examples.
The goal of the current study was to assess the generalizability of the online training amongdifferent groups of young workers. The current study included young workers in a range of occupations,including cashiers, accountants, service managers, counselors, and lifeguards. The changes inknowledge in the current study replicated previous findings reported in parks and recreationworkers [12]. This study provided additional feedback about the training including a generallypositive response about the format of the training and the need for training for young workers.In addition, many participants provided examples in the open-ended questions describing situationswhere they felt empowered to speak up about safety hazards or specific changes to their behavior theymade in their workplace.
One of the study’s strengths is that it is the first study to include two groups of young workersthat were diverse in terms of their work experience. Young workers hired as summer employees at acity parks and recreation center were recruited along with a diverse group of workers selected via anannouncement placed on Amazon Mechanical Turk. However, participants in both groups reportedthe need for training on health and safety. They liked the training and reported that the PUSH trainingprepared them to handle health and safety hazards at the workplace. The prospective nature of thestudy provides information on retention of information among young workers. Although knowledgescores at the three-month follow-up showed a decline from the immediate post-test, the scores were
271
IJERPH 2019, 16, 577
still greater than baseline for both groups with non-seasonal workers getting better scores compared tothe seasonal workers. The decline in scores can indicate a need for frequent reminders or trainings onsafety and health. Another strength of the PUSH training is the online format and interactive content.Young workers are familiar and comfortable with technology [11], which makes the online format ofthe training an appropriate dissemination technique for younger adults [16].
Studies have reported the need for training workers on the identification and control of workplacehazards [5,11,30]. A survey of Latino youths under the age of 21 working in construction found thatthe majority of participants reported that the training they received did not include information oncontrolling workplace hazards [13]. The results from the current study also emphasize the need toinclude topics on hazard identification and control selection as part of training for young workers,as evidenced by a higher number of hazard identification and control selection questions missed ateach time point by participants in both groups.
One limitation of the study is that several participants were lost to follow up. Only participantswho completed all three surveys were included in the analysis. However, the participants who werelost to follow-up had similar knowledge scores compared to the participants in the study at baselineand post-training. Another potential limitation of the study might be its generalizability outside ofthe US. Hence, there is a need for additional research to identify if the training can be utilized and tounderstand how young workers outside the US will receive it.
5. Conclusions
PUSH is an online training program utilizing a Total Worker Health® approach to addressoccupational safety and health for younger workers [12]. These results suggest the usefulness ofonline-training to improve the safety, health and well-being of young workers, which prepares them tobetter prevent workplace hazards. Due to its inclusion of comprehensive topics on health and safetyand its acceptance by young workers in diverse work environments, the PUSH training could beexpanded to young workers in other industries to increase their awareness on workplace rights andresponsibility, health communication in order to promote health and safety, and improve well-being.
Author Contributions: Conceptualization, D.S.R. and M.P.; data curation, A.A.; formal analysis, A.A.; fundingacquisition, D.S.R.; investigation, D.S.R. and M.P.; methodology, D.S.R. and M.P.; project administration, D.S.R. andM.P.; resources, D.S.R. and M.P.; software, A.A.; supervision, D.S.R. validation, A.A., D.S.R. and M.P.; visualization,A.A.; writing—original draft, A.A.; writing—review & editing, A.A., D.S.R. and M.P.
Funding: The project was funded by the Oregon Healthy Workforce Center: [NIOSH, grant numberU19OH010154] and the Healthier Workforce Center of the Midwest [NIOSH, grant number U19OH008868].
Acknowledgments: We thank our colleagues at Portland Park and Recreation center for their strong support.We greatly appreciate the constructive feedbacks and suggestions of our colleagues at the Healthier WorkforceCenter of the Midwest at the University of Iowa, especially Kevin M. Kelly, Megan R. TePoel.
Conflicts of Interest: Rohlman has a significant financial interest in Northwest Education Training andAssessment, LLC, a company that may have a commercial interest in the results of this research and technology.This potential conflict of interest was reviewed, and a management plan approved by the OHSU and the Universityof Iowa Conflict of Interest in Research Committees was implemented.
References
1. National Institute of Occupationa Health and Safety (NIOSH). Analysis of the Current Population Survey.Morgantown, WV: U.S. Department of Health and Human Services, Centers for Disease Control and Prevention;National Institute for Occupational Safety and Health: Washington, DC, USA, 2017.
2. Bureau of Labor Statistics (BLS). 2016 Survey of Occupational Injuries and Illnesses Charts Package; BLS:Washington, DC, USA, 2018.
3. National Institute for Occupational Health and Safety (NIOSH). The Work-Related Injury Statistics QuerySystem (Work-RISQS); NIOSH: Washington, DC, USA, 2017.
4. NIOSH. 2017 Young Worker Injury Deaths: A Historical Summary of Surveillance and Investigative Findings. U.S.Department of Health and Human Services, Centers for Disease Control and Prevention; Perritt, K.R., Hendricks, K.J.,Goldcamp, E.M., Morgantown, W.V., Eds.; NIOSH: Washington, DC, USA, 2017.
272
IJERPH 2019, 16, 577
5. Holizki, T.; McDonald, R.; Foster, V.; Guzmicky, M. Causes of work-related injuries among young workers inBritish Columbia. Am. J. Ind. Med. 2008, 51, 357–363. [CrossRef] [PubMed]
6. Mujuru, P.; Mutambudzi, M. Injuries and seasonal risks among young workers in West Virginia—A 10-yearretrospective descriptive analysis. AAOHN J. 2007, 55, 381–387. [CrossRef] [PubMed]
7. Bowling, J.; Runyan, C.; Miara, C.; Davis, L.; Rubenstein, H.; Delp, L.; Arroyo, M.G. Teenage workers’occupational safety: Results of a four school study. In Proceedings of the Fourth World Conference on InjuryPrevention and Control, Amsterdam, The Netherlands, 17–20 May 1998.
8. Lavack, A.M.; Magnuson, S.L.; Deshpande, S.; Basil, D.Z.; Basil, M.D.; Mintz, J.J.H. Enhancing occupationalhealth and safety in young workers: The role of social marketing. Int. J. Nonprofit Volunt. Sector Mark. 2008,13, 193–204. [CrossRef]
9. Bush, D.; Baker, R. Young Workers at Risk: Health and Safety Education and the Schools; Labor OccupationalHealth Program, University of California: Berkeley, CA, USA, 1994.
10. Castillo, D.N. Occupational Safety and Health in Young People: Young Workers: Varieties of Experience; Barling, J.,Kelloway, E.K., Eds.; American Psychological Association: Washington, DC, USA, 1999.
11. Loughlin, C.; Barling, J. Young workers’ work values, attitudes, and behaviours. J. Occup. Org. Psychol. 2001,74, 543–558. [CrossRef]
12. Rohlman, D.S.; Parish, M.; Elliot, D.L.; Hanson, G.; Perrin, N. Addressing Younger Workers’ Needs: The PromotingU through Safety and Health (PUSH) Trial Outcomes. in Healthcare; Multidisciplinary Digital Publishing Institute:Basel, Switzerland, 2016.
13. O’Connor, T.; Loomis, D.; Runyan, C.; dal Santo, J.A.; Schulman, M. Adequacy of health and safety trainingamong young Latino construction workers. J. Occup. Environ. Med. 2005, 47, 272–277. [CrossRef] [PubMed]
14. Anger, W.K.; Rohlman, D.S.; Kirkpatrick, J.; Reed, R.R.; Lundeen, C.A.; Eckerman, D.A. cTRAIN:A computer-aided training system developed in SuperCard for teaching skills using behavioral educationprinciples. Behav. Res. Methods 2001, 33, 277–281. [CrossRef]
15. National Institute for Occupational Health and Safety (NIOSH). Teaching Young Workers about Job Safety andHealth; NIOSH: Washington, DC, USA, 2017.
16. Rohlman, D.S.; Parish, M.; Elliot, D.L.; Montgomery, D.; Hanson, G. Characterizing the needs of a youngworking population: making the case for total worker health in an emerging workforce. J. Occup. Environ.Med. 2013, 55, S69–S72. [CrossRef] [PubMed]
17. National Institute for Occupational Health and Safety (NIOSH). Fundamentals of Total Worker HealthApproaches: Essential Elements for Advancing Worker Safety, Health, and Well-Being. On Behalf of the NIOSHOffice for Total Worker Health. Cincinnati, OH: U.S. Department of Health and Human Services, Centers for DiseaseControl and Prevention; Lee, M.P., Hudson, H., Richards, R., Chang, C.C., Chosewood, L.C., Schill, A.L., Eds.;National Institute for Occupational Safety and Health DHHS (NIOSH): Washington, DC, USA, 2016.
18. Anger, W.K.; Elliot, D.L.; Bodner, T.; Olson, R.; Rohlman, D.S.; Truxillo, D.M.; Kuehl, K.S.; Hammer, L.B.;Montgomery, D. Effectiveness of Total Worker Health Interventions. J. Occup. Health Psychol. 2015, 20, 226.[CrossRef] [PubMed]
19. Feltner, C. Total Worker Health®; Agency for Healthcare Research and Quality: Rockville, MD, USA, 2016.20. Carr, L.J.; Leonhard, C.; Tucker, S.; Fethke, N.; Benzo, R.; Gerr, F. Total worker health intervention increases
activity of sedentary workers. Am. J. Prev. Med. 2016, 50, 9–17. [CrossRef] [PubMed]21. Buhrmester, M.; Kwang, T.; Gosling, S.D. Amazon’s mechanical turk: A new source of inexpensive,
yet high-quality, data? Perspect. Psychol. Sci. 2011, 6, 3–5. [CrossRef] [PubMed]22. Elliot, D.L.; Goldberg, L.; Moe, E.; Defancesco, C.; Durham, M.; Hix-Small, H. Preventing substance use
and disordered eating: initial outcomes of the ATHENA (athletes targeting healthy exercise and nutritionalternatives) program. Arch. Pediatr. Adolesc. Med. 2004, 158, 1043–1049. [CrossRef] [PubMed]
23. Goldberg, L.; MacKinnon, D.P.; Elliot, D.L.; Moe, E.L.; Clarke, G.; Cheong, J. The adolescents training andlearning to avoid steroids program: Preventing drug use and promoting health behaviors. Arch. Pediatr.Adolesc. Med. 2000, 154, 332–338. [CrossRef] [PubMed]
24. Anger, W.K.; Tamulinas, A.; Uribe, A.; Ayala, C. Computer-based training for immigrant Latinos with limitedformal education. Hisp. J. Behav. Sci. 2004, 26, 373–389. [CrossRef]
25. Eckerman, D.A.; Abrahamson, K.; Ammerman, T.; Fercho, H.; Rohlman, D.S.; Anger, W.K. Computer-basedtraining for food services workers at a hospital. J. Saf. Res. 2004, 35, 317–327. [CrossRef]
273
IJERPH 2019, 16, 577
26. Eckerman, D.A.; Lundeen, C.A.; Steele, A.; Fercho, H.L.; Ammerman, T.A.; Anger, W.K. Interactive trainingversus reading to teach respiratory protection. J. Occup. Health Psychol. 2002, 7, 313. [CrossRef]
27. Anger, W.K.; Patterson, L.; Fuchs, M.; Will, L.L.; Rohlman, D.S. Learning and recall of worker protectionstandard (WPS) training in vineyard workers. J. Agromed. 2009, 14, 336–344. [CrossRef] [PubMed]
28. Glass, N.; Bloom, T.; Perrin, N.; Anger, W.K. A computer-based training intervention for work supervisors torespond to intimate partner violence. Saf. Health Work 2010, 1, 167–174. [CrossRef] [PubMed]
29. Olson, R.; Anger, W.K.; Elliot, D.L.; Wipfli, B.; Gray, M. A new health promotion model for lone workers:Results of the safety & health involvement for truckers (SHIFT) pilot study. J. Occup. Environ. Med. 2009, 51,1233–1246. [PubMed]
30. Loughlin, C.; Frone, M.R. Young Workers’ Occupational Safety. The Psychology of Workplace Safety; AmericanPsychological Association: Washington, DC, USA, 2004.
31. Reja, U.; Manfreda, K.L.; Hlebec, V.; Vehovar, V. Open-ended vs. close-ended questions in web questionnaires.Dev. Appl. Stat. 2003, 19, 159–177.
© 2019 by the authors. Licensee MDPI, Basel, Switzerland. This article is an open accessarticle distributed under the terms and conditions of the Creative Commons Attribution(CC BY) license (http://creativecommons.org/licenses/by/4.0/).
274
International Journal of
Environmental Research
and Public Health
Article
Moral or Dirty Leadership: A Qualitative Study onHow Juniors Are Managed in Dutch Consultancies
Onno Bouwmeester 1,* and Tessa Elisabeth Kok 2
1 School of Business and Economics, Vrije Universiteit Amsterdam, 1081 HV Amsterdam, The Netherlands2 PwC Amsterdam, 1066 JR Amsterdam, The Netherlands; [email protected]* Correspondence: [email protected]; Tel.: +31-020-598-6079
Received: 4 October 2018; Accepted: 7 November 2018; Published: 9 November 2018
Abstract: Professional service firms in Western Europe have a reputation for putting huge pressureson their junior employees, resulting in very long work hours, and as a consequence health risks.This study explores moral leadership as a possible response to the stigma of such dirty leadership.We conducted semi-structured interviews with 12 consultant managers and with each one of theirjuniors, and found that managers put several pressures on their juniors; these pressures bring highlevels of stress, lowered wellbeing and burnout. Society considers such a pressuring leadership stylemorally dirty. To counteract the experience of being seen as morally dirty, we found that consultantmanagers were normalizing such criticisms as commonly assumed in dirty work literature. However,they also employed several moral leadership tactics to counteract the negative consequences criticizedin society. However, in addition to the well-known individual-level tactics, consultant managers andtheir juniors also reported moral leadership support at the organizational level, like institutionalizedperformance talks after every project, trainings, specific criteria for hiring juniors, and policies torecognize and compliment high performance. Still, we cannot conclude these moral leadershipapproaches are moral by definition. They can be used in an instrumental way as well, to furtherpush performance.
Keywords: work organization; dirty work; moral leadership; taint normalization; management consulting
1. Introduction
“Consulting overall is a stressful lifestyle. Travel does suck, and it doesn’t get any better. You’reat the demand of your manager. . . . at all times, and deadlines are seemingly impossible to meet”.(www.wallstreetoasis.com, entry 2014)
When Hughes introduced the concept of dirty work, he claimed that “dirty work of some kind isfound in all occupations” [1] (p. 319). High-status professions are no exception. For instance, recently,bankers’ dirty image has been studied, due to their risky management style, lack of customer careand extreme bonus culture, leading to a financial crisis and public scandals [2,3]. Accountants are inthe news as well for big accounting errors and they self-report shame for dirty tasks like providing“ritualized information” and producing “ignored documents”, which they consider “dirty work” [4](p. 235). Popular criticisms also target consultants for their lack of expertise and overly high fees,lack of independence, and a focus on rationalization over human values [5,6]. Mostly consultants’clients are identified as victims of such morally dirty practices [7–9]. Such public criticisms underminethe reputation of consultants and contribute to the occupation’s dirty image [10,11]. Despite theprofession’s high status in general, society disapproves certain dirty aspects of the work, like “layingoff” people in client organizations [12] (p. 599).
A different moral problem criticized in society is that managers in professional service industrieslike banking [13] and law firms [14,15] put quite strong pressures on their employees. The pressures go
IJERPH 2018, 15, 2506; doi:10.3390/ijerph15112506 www.mdpi.com/journal/ijerph275
IJERPH 2018, 15, 2506
far beyond standards of social desirability, even to the extent of violating labour laws. The consultingindustry, for instance, is known for burnout, mental problems, stress, and disturbed work–life balancedue to demanding clients and managers [16–21]. As a consequence, manager criticisms aboundin consultant jokes, cartoons and on Internet fora (see for instance managementconsulted.com orwww.wallstreetoasis.com). Members and former members of the occupation point at the moraldirtiness of such pressuring leadership, and of the manager job.
The constructs of dirty work and occupational stigma have initially been developed in sociologyby Goffman and Hughes. Society stigmatizes in particular low-status occupations like hangman orjanitors, similar to groups like drunks or ex-convicts [22,23]. Ashforth et al. [24] have added a socialpsychological perspective. They have explored how dirty workers and their managers respond tothe pressure of feeling stigmatized, and found in their empirical studies that dirty workers respondby normalizing the taint experience in order to protect their self-esteem, and to reduce the stresscaused by the feeling of being stigmatized. They also found that managers were helping employeeswith normalizing the experience of stigma. Luyendijk [25] finds such a phenomenon of creating a“protective bubble” to be quite prominent in the banking industry.
However, whereas insiders are assumed to reduce feelings of stress caused by a critical publicopinion [26], outsiders produce such stress for a reason. In case of moral taint, they want to influencethe immoral behaviour. Bankers are stigmatized for their extremely high bonuses or irresponsibleprofit seeking. Moral stigma targets the profession’s responsibility and assumes agency. That means abanker can, and should do things differently according to public opinion. Additionally, when greedybankers start normalizing what they do, public opinion stigmatizes them even more, to make cleartheir behaviour is still not acceptable. This is illustrated by the Ralph Hamers case in the Netherlands.In March 2018, ING Bank proposed a salary increase of 50% for its CEO, but the bank had to reversethe decision due to public disapproval. Newspapers had headers like: “One million extra? We do notaccept.” (NRC, 14 March 2018). It was considered very inappropriate behaviour, thus adding to themoral stigma the bank carried already for its role during the financial crisis, and ING Bank lost manyclients that month.
Whereas normalization seems helpful when work is dirty due to physical hardship and toxicelements as experienced by miners and firefighters, normalization seems less effective for morallytainted managers due to their assumed agency and responsibility. As a consequence, managers mightfeel inclined to cope with moral taint differently than only by normalization. While normalizationmight serve individuals in the short run by reducing their own experience of stress, society could seenormalization as a variant of moral disengagement [27], thus adding fuel to the fire, and reinforcingthe stigma of morally dirty leadership.
To explore the puzzle around the appropriateness of normalization as response to moral taint,we drew on moral leadership literature, which has studied the dynamics between moral leadershipand reputation. Scholars like Rhode [28], Schminke et al. [29] and Zhu et al. [30] have exploredhow moral leadership can prevent a bad reputation. However, despite the fact that dirty work andmoral leadership literature both study responses to moral taint, these responses have not been related(cf. [24,26,28,30]). As the effects of normalization can be counterproductive in situations of taintedleadership, we expected to find moral leadership responses in such cases as alternative responseto normalization. However, it assumes that managers have sufficient agency to be able to make adifference in their institutional context, and that they intentionally try to prevent the creation of moralstigma. Following up on these assumptions, we explored how consultant managers cope with themorally dirty aspects of their overly demanding leadership style by studying both their normalizationand moral leadership responses. To answer our question, we performed interviews with 12 consultantmanagers and with each one of their juniors about their common leadership experiences.
The study makes two contributions. First, we found that consultant managers illustrate severalmoral leadership tactics in their work, in addition to normalization. When talking about the existingsocial constructions of morally dirty leadership, they stress their moral leadership behaviour. This adds
276
IJERPH 2018, 15, 2506
a new coping repertoire to the current dirty work literature (cf. [12,24,26,31–34]). Our research designdoes not allow conclusions about how effective this new coping repertoire might be in reducingmoral stigma, or the stress caused by such stigma. Still, moral leadership is theoretically a moreadequate response than normalizing as it does not imply moral disengagement, while normalizationoften does. As moral taint assumes agency, and responsibility for violating accepted moral standards,moral leadership is the response actually expected by society. When consultant managers meetthis expectation better, it could reduce their feelings of stress together with the contempt in society.However, the agency of managers, and even more juniors, is limited, so both do still benefit fromself-protection by normalization, and we found such responses as well.
Second, we have identified organization-level support for the moral leadership attempts ofconsultant managers. Currently, moral leadership literature heavily focuses on what a manager cando as an individual [28,30], but this ignores the limited agency of consultant managers. They need torespond to deadlines, client demands, top management expectations and other institutional constraints.The organization can offer support to counterbalance such constraints. Both junior consultants andtheir managers mention high-frequency performance reviews to monitor juniors, standard trainingand coaching sessions for juniors and policies to better select candidates for the job. The latterpolicies aim at what Ashforth et al. [35] call congruence work. We also found acknowledgement andcompensation policies, such as ad-hoc time compensation, increased time off after periods of intensework, and flowers or other reward symbols, to say “thank you” after extraordinary performances.The institutionalized character of these support measures make them quite visible, which respondsto the stressful image of consulting work and its pressuring management. The support measuresimply visible acknowledgement that the work context challenges consultant leadership more thandirect managers can handle on their own with individualized arrangements [18]. A similar multi-levelmanagement approach to improving employee wellbeing and to reducing stress has been developedin Australian universities [36].
1.1. Morally Tainted Work
Occupations are regarded as “dirty” in society when they defy accepted societal norms and valuesand therefore become stigmatized [26] (p. 414). The dirtiness can be physical, leading in extreme casesto disgust and repugnance, but it can also be social and moral [1], leading to a less physical form ofsocial disapproval, but still loss of dignity. The dirtiness becomes more a metaphor then. In that sense,we disapprove the work of morally tainted occupations like used-car salespeople, tabloid reporters,exotic dancers, sex-shop workers or correctional officers (see [24,26,31–34]). It also does not implyeveryone avoids these services, as some might even like them. High-status professions can be morallytainted as well: for instance, lawyers [14,15], healthcare professionals doing abortion work [37] andafter the 2008 financial crisis, we can add bankers to the list [2,3].
Some scholars argue that moral stigma gives the “dirtiest” taint [31] (p. 100), [33] (p. 32). That isbecause physically or socially tainted work is usually protected by a necessity shield: garbage needsto be collected although it is dirty [38], we really need AIDS workers even though many couldfeel uncomfortable in their work context [39], and we also need firefighters although the work isdangerous [33]. In contrast, society sees more evil than necessity in morally dirty work. Morallystigmatized occupations can therefore experience high levels of entitativity, inducing a division of“them” versus “us” [40], (p. 626), which poses a strong “identity threat” [31], (p. 86).
In most dirty work studies, society is assumed to stigmatize a profession as with one voice.However, specific interest groups may be most active in socially constructing a stigma. For instance,these who like to smoke and are still healthy will most likely not actively co-construct the tobaccoindustry as morally tainted, but the anti-tobacco lobby will certainly do. Next to different interests, timehas its effects. For instance, public opinion turns more and more to the acceptance of abortion work inspite of the downsides, thus softening the stigma, whereas the stigma around bankers shows oppositedynamics. While dirtiness of an occupation is reflected in the public eye, we still need to ask who really
277
IJERPH 2018, 15, 2506
cares. For instance, the paying client of consultants does not seem to be very concerned about theirmore dubious virtues, as consultant services continue to be in demand. In contrast, client employeesdo identify with the popular criticism that consultants lack expertise [5]. Therefore, compared tothe Western societies of the fifties and sixties where Hughes [1,23] and Goffman [22] published theirseminal work, in our more diverse societies, some more nuance seems required in identifying whichgroups construct work as dirty and how widespread a stigma becomes.
1.2. Normalizing Morally Tainted Work
Feeling stigmatized usually leads to stress, and thus loss of “coping resources” [41] (p. 572).Hobfoll found that people can respond to such stress by trying “to retain, protect, and build” [42](p. 516) their coping resources such as a positive sense of themselves, self-esteem, and socioeconomicstatus. Ashforth et al. [24] have found several tactics that workers and their managers utilize to protecttheir self-esteem, by normalizing a dirty work experience. They characterize the tactics as occupationalideologies, social buffers, confronting clients or public, and defensive tactics. In later work, Ashforthand Kreiner [31] assume some variation in the applicability of these tactics in relation to physically,socially and morally tainted work. Not all tactics appear equally useful to normalize moral taint.
Occupational ideologies help reframe, recalibrate or refocus the meaning attached to a dirtyprofession [26]. Reframing heightens the positive side(s) of an occupation. Recalibration revaluatesthe standards used to assess the “dirtiness” of the work by emphasizing that standards have changed.Refocusing shifts attention from tainted aspects of a profession to non-tainted ones. Occupationalideologies apply very well to moral taint, as Vaast and Levina [3] (p. 84) found in their study on retailbankers, Tyler [34] (p. 1490) identified in her study on sex shop workers and Tracy and Scott [33] (p. 26)revealed in their study on correctional officers.
Social buffers help to gain validation from people who affirm the social worth of the taintedprofession. However, for a morally stigmatized group, it might be hard to gain social support frompeople outside the group; therefore, the tendency will be to turn to in-group members. Ashforthand Kreiner [31] (p. 92) expect this to happen most often in cases of moral taint, but the tactic is notreported in the study by Vaast and Levina [3], maybe due to the high status of bankers. Tyler [34](p. 1491) does find the tactic in her study on sex shop workers.
Confronting critical clients or the general public occurs when dirty workers actively indicatesociety’s perceptions of the occupation are wrong, by referring to opposite facts. Other methods tomitigate taint include “confrontational humour” and “counter-stereotypical behaviour” [24] (p. 162).However, Ashforth and Kreiner [31] do not mention confrontation tactics as effective in relation tomoral taint, and also Vaast and Levina [3] explicitly wrote they do not find them. Thus, confrontingoutsiders seems less effective for normalizing moral taint, but the reason still remains an open question.
Finally, defence is a normalization tactic that appears very suitable in case of moral taint.Ashforth et al. [24] distinguish seven methods. The first is avoidance or the refusal to mention orobserve dirty aspects of stigmatized work. The second is gallows humour, which is used to relievethe stress caused by the taint itself. The third is accepting and involves lowering one’s expectations.The fourth is social comparison in which the tainted profession is compared to jobs or previous times thatare or were even worse. The fifth, condemning condemners, is a reversal of the criticism towards thosewho are judging the dirty workers. The sixth is blaming and/or distancing from clients, who are criticizedfor being the cause of the taint. The last, distancing from role, occurs when stigmatized workers separatetheir personal identity from their work identity. Ashforth and Kreiner [31] (pp. 93–100) supposethat condemning condemners and organization-level defences are most effective in case of moraltaint. In contrast, Vaast and Levina [3] (p. 84) find that retail bankers heavily utilize the tactic ofsocial comparison, and they find some new defensive tactics as well: passing the blame on to othergroups (most often found tactic), circumstantiating (there are many reasons that can explain whathappened), diverting conversations, and conceding negative changes in the occupation (thus claiming the
278
IJERPH 2018, 15, 2506
essentials remain untainted). The list of tactics suitable for normalizing moral taint might be evenlonger, as research in this field is still nascent.
It is specific for moral dirtiness that society assumes responsibility and agency for harmingaccepted values and principles. Moreover, the more agency a worker or manager has, the dirtier moraltaint becomes. For instance, Roca [43] (p. 139) argues, “the chief executive officer (CEO) of a tobaccocompany, who gains riches by endangering others’ health, might be perceived even more negativelythan a blue-collar worker employed by the same company.” This aspect of agency in triggering theconstruction of moral taint is currently underexplored, as the focus has been more on how thosewho feel the stigma—the victims—can protect themselves against the stigmatizing outsiders [24].Additionally, in the case of banking, agency and occupational stigma are clearly linked and the sameapplies to used-car salespeople consciously concealing flaws of the cars they sell. We expect to findthis agency also for over-demanding managers in stressful service industries such as consulting or lawfirms [13–17,20,44]. When moral taint is socially constructed, it is a response to intentional behaviours:bankers who cause the financial crisis, and continue to demand their bonuses, or managers in lawand consultancy firms who earn more money by consciously pressuring their employees beyond theirlimits. We wonder why literature on dirty work has not explored this agency, and the possibilitiessuggested by moral leadership theory to do things differently, and maybe even to prevent or moderatethe taint.
1.3. Can Moral Leadership Moderate a Dirty Leadership Reputation?
While normalization focuses on how stress due to perceptions of dirty work can be reduced, notmuch attention has been given to acting on moral stigma as a social construction (cf. [3,24,33,34]).However, in some work, this seems quite well possible, and if it concerns moral taint, it is evendemanded by society: the bonus culture in the banking industry is no necessity, and in consulting andlaw firms, management has sufficient agency to decrease the pressures they impose on their workers.There is not the kind of necessity as with physically tainted jobs like firefighting or cleaning [31].Further, even in these jobs, we have acted on the dirtiness with technology, which has made severalblue-collar jobs less dirty over time. For instance, technological innovations improving protective suitshave reduced health risks for firefighters, or for those cleaning up asbestos. As health risks reduce, thereasons for socially constructing dirtiness lose impact as well.
Still, do middle managers also have these possibilities in case of dirty leadership, whenperformance standards are high, and clients and top management are very demanding? Howarddiscusses some options, starting from the assumption that leadership is a “process of communication,verbally and non-verbally, which involves coaching, motivating/inspiring, directing/guiding andsupporting/counselling others” [45] (p. 385). Following up on similar studies as for instance byStone et al. who argue that “the most effective leaders pay most attention to employees” [46] (p. 356),moral leadership aims at giving such attention [30].
The first option discussed in moral leadership literature is setting a moral example [29,30,47].Aronson [48] (p. 245), for instance, argues that if leaders set “moral examples”, it fosters high levelsof true motivation and morality overall, as employees look for an example they can follow. Appliedto a high-performance setting, a lower-level manager could show his employees how to say no to ahigher-level manager when managing own work pressures. However, in itself, a pressuring middlemanager does not easily qualify for being a moral example. A second option often discussed is givingsupport, compassion and actively caring about others [29,30,49–51]. Treating employees with dignityand humanity will likely have positive effects on their performance [28]. Especially when managementputs high pressures on employees, an open eye for their wellbeing and a supportive attitude might helpnot to overburden them. A third option of moral leadership is increasing your approachability [29,49].That is considered to be crucial for establishing an “open environment” [50] (p. 164). When pressuresare high, approachability in an open environment invites employees to speak up when they feel theyreach their limits. Approachable, forgiving management leads to more employee wellbeing, more
279
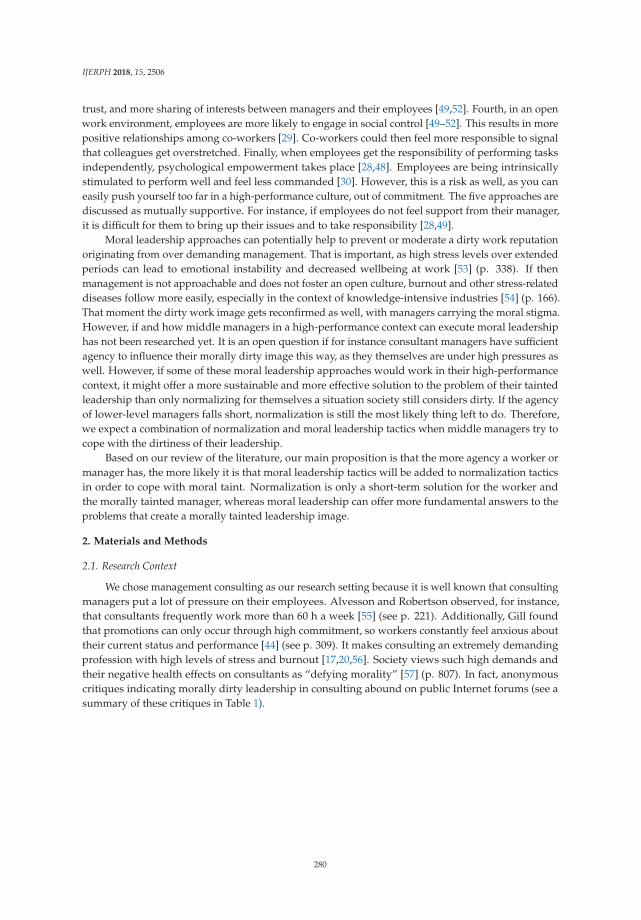
IJERPH 2018, 15, 2506
trust, and more sharing of interests between managers and their employees [49,52]. Fourth, in an openwork environment, employees are more likely to engage in social control [49–52]. This results in morepositive relationships among co-workers [29]. Co-workers could then feel more responsible to signalthat colleagues get overstretched. Finally, when employees get the responsibility of performing tasksindependently, psychological empowerment takes place [28,48]. Employees are being intrinsicallystimulated to perform well and feel less commanded [30]. However, this is a risk as well, as you caneasily push yourself too far in a high-performance culture, out of commitment. The five approaches arediscussed as mutually supportive. For instance, if employees do not feel support from their manager,it is difficult for them to bring up their issues and to take responsibility [28,49].
Moral leadership approaches can potentially help to prevent or moderate a dirty work reputationoriginating from over demanding management. That is important, as high stress levels over extendedperiods can lead to emotional instability and decreased wellbeing at work [53] (p. 338). If thenmanagement is not approachable and does not foster an open culture, burnout and other stress-relateddiseases follow more easily, especially in the context of knowledge-intensive industries [54] (p. 166).That moment the dirty work image gets reconfirmed as well, with managers carrying the moral stigma.However, if and how middle managers in a high-performance context can execute moral leadershiphas not been researched yet. It is an open question if for instance consultant managers have sufficientagency to influence their morally dirty image this way, as they themselves are under high pressures aswell. However, if some of these moral leadership approaches would work in their high-performancecontext, it might offer a more sustainable and more effective solution to the problem of their taintedleadership than only normalizing for themselves a situation society still considers dirty. If the agencyof lower-level managers falls short, normalization is still the most likely thing left to do. Therefore,we expect a combination of normalization and moral leadership tactics when middle managers try tocope with the dirtiness of their leadership.
Based on our review of the literature, our main proposition is that the more agency a worker ormanager has, the more likely it is that moral leadership tactics will be added to normalization tacticsin order to cope with moral taint. Normalization is only a short-term solution for the worker andthe morally tainted manager, whereas moral leadership can offer more fundamental answers to theproblems that create a morally tainted leadership image.
2. Materials and Methods
2.1. Research Context
We chose management consulting as our research setting because it is well known that consultingmanagers put a lot of pressure on their employees. Alvesson and Robertson observed, for instance,that consultants frequently work more than 60 h a week [55] (see p. 221). Additionally, Gill foundthat promotions can only occur through high commitment, so workers constantly feel anxious abouttheir current status and performance [44] (see p. 309). It makes consulting an extremely demandingprofession with high levels of stress and burnout [17,20,56]. Society views such high demands andtheir negative health effects on consultants as “defying morality” [57] (p. 807). In fact, anonymouscritiques indicating morally dirty leadership in consulting abound on public Internet forums (see asummary of these critiques in Table 1).
280
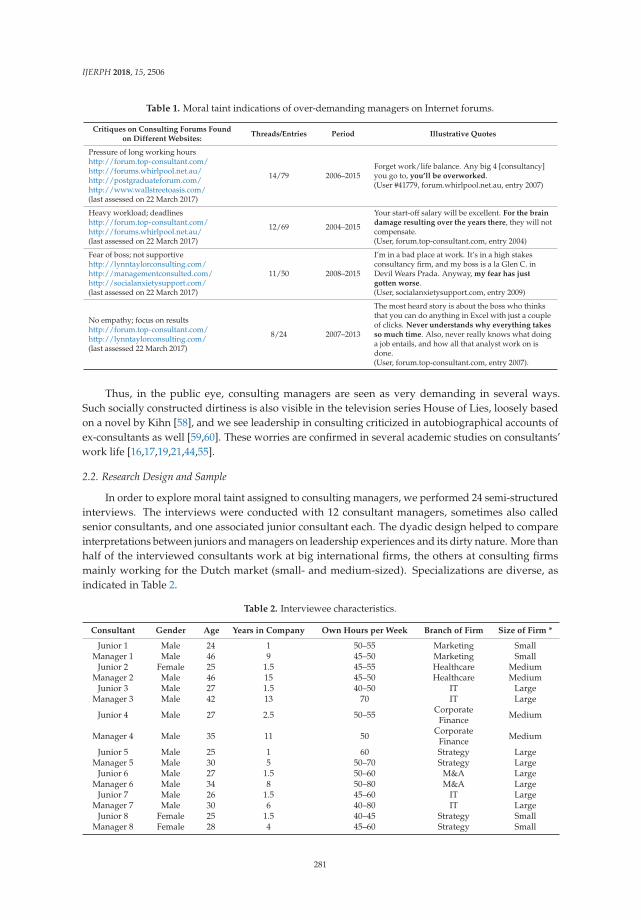
IJERPH 2018, 15, 2506
Table 1. Moral taint indications of over-demanding managers on Internet forums.
Critiques on Consulting Forums Foundon Different Websites:
Threads/Entries Period Illustrative Quotes
Pressure of long working hourshttp://forum.top-consultant.com/http://forums.whirlpool.net.au/http://postgraduateforum.com/http://www.wallstreetoasis.com/(last assessed on 22 March 2017)
14/79 2006–2015Forget work/life balance. Any big 4 [consultancy]you go to, you’ll be overworked.(User #41779, forum.whirlpool.net.au, entry 2007)
Heavy workload; deadlineshttp://forum.top-consultant.com/http://forums.whirlpool.net.au/(last assessed on 22 March 2017)
12/69 2004–2015
Your start-off salary will be excellent. For the braindamage resulting over the years there, they will notcompensate.(User, forum.top-consultant.com, entry 2004)
Fear of boss; not supportivehttp://lynntaylorconsulting.com/http://managementconsulted.com/http://socialanxietysupport.com/(last assessed on 22 March 2017)
11/50 2008–2015
I’m in a bad place at work. It’s in a high stakesconsultancy firm, and my boss is a la Glen C. inDevil Wears Prada. Anyway, my fear has justgotten worse.(User, socialanxietysupport.com, entry 2009)
No empathy; focus on resultshttp://forum.top-consultant.com/http://lynntaylorconsulting.com/(last assessed 22 March 2017)
8/24 2007–2013
The most heard story is about the boss who thinksthat you can do anything in Excel with just a coupleof clicks. Never understands why everything takesso much time. Also, never really knows what doinga job entails, and how all that analyst work on isdone.(User, forum.top-consultant.com, entry 2007).
Thus, in the public eye, consulting managers are seen as very demanding in several ways.Such socially constructed dirtiness is also visible in the television series House of Lies, loosely basedon a novel by Kihn [58], and we see leadership in consulting criticized in autobiographical accounts ofex-consultants as well [59,60]. These worries are confirmed in several academic studies on consultants’work life [16,17,19,21,44,55].
2.2. Research Design and Sample
In order to explore moral taint assigned to consulting managers, we performed 24 semi-structuredinterviews. The interviews were conducted with 12 consultant managers, sometimes also calledsenior consultants, and one associated junior consultant each. The dyadic design helped to compareinterpretations between juniors and managers on leadership experiences and its dirty nature. More thanhalf of the interviewed consultants work at big international firms, the others at consulting firmsmainly working for the Dutch market (small- and medium-sized). Specializations are diverse, asindicated in Table 2.
Table 2. Interviewee characteristics.
Consultant Gender Age Years in Company Own Hours per Week Branch of Firm Size of Firm *
Junior 1 Male 24 1 50–55 Marketing SmallManager 1 Male 46 9 45–50 Marketing Small
Junior 2 Female 25 1.5 45–55 Healthcare MediumManager 2 Male 46 15 45–50 Healthcare Medium
Junior 3 Male 27 1.5 40–50 IT LargeManager 3 Male 42 13 70 IT Large
Junior 4 Male 27 2.5 50–55 CorporateFinance Medium
Manager 4 Male 35 11 50 CorporateFinance Medium
Junior 5 Male 25 1 60 Strategy LargeManager 5 Male 30 5 50–70 Strategy Large
Junior 6 Male 27 1.5 50–60 M&A LargeManager 6 Male 34 8 50–80 M&A Large
Junior 7 Male 26 1.5 45–60 IT LargeManager 7 Male 30 6 40–80 IT Large
Junior 8 Female 25 1.5 40–45 Strategy SmallManager 8 Female 28 4 45–60 Strategy Small
281
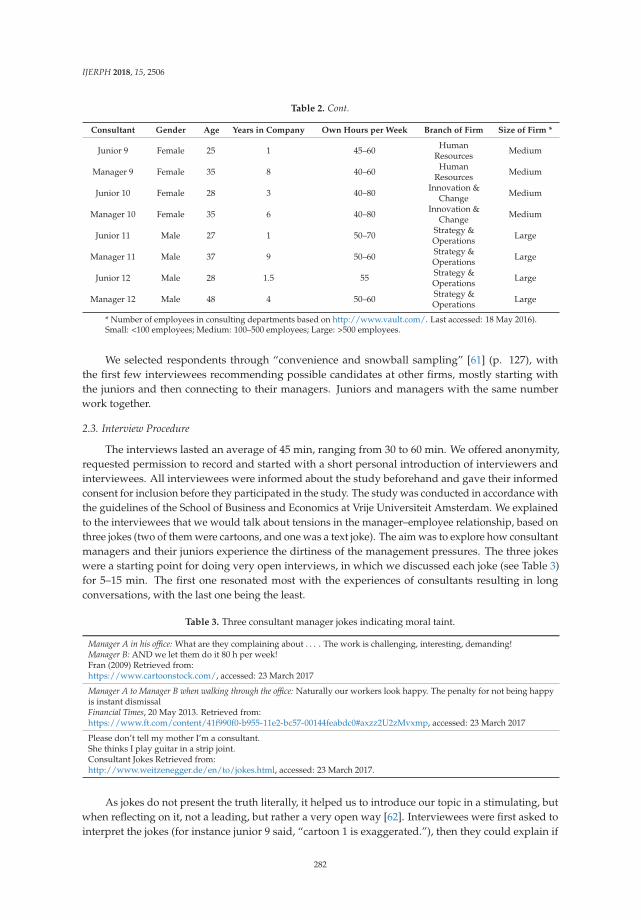
IJERPH 2018, 15, 2506
Table 2. Cont.
Consultant Gender Age Years in Company Own Hours per Week Branch of Firm Size of Firm *
Junior 9 Female 25 1 45–60 HumanResources Medium
Manager 9 Female 35 8 40–60 HumanResources Medium
Junior 10 Female 28 3 40–80 Innovation &Change Medium
Manager 10 Female 35 6 40–80 Innovation &Change Medium
Junior 11 Male 27 1 50–70 Strategy &Operations Large
Manager 11 Male 37 9 50–60 Strategy &Operations Large
Junior 12 Male 28 1.5 55 Strategy &Operations Large
Manager 12 Male 48 4 50–60 Strategy &Operations Large
* Number of employees in consulting departments based on http://www.vault.com/. Last accessed: 18 May 2016).Small: <100 employees; Medium: 100–500 employees; Large: >500 employees.
We selected respondents through “convenience and snowball sampling” [61] (p. 127), withthe first few interviewees recommending possible candidates at other firms, mostly starting withthe juniors and then connecting to their managers. Juniors and managers with the same numberwork together.
2.3. Interview Procedure
The interviews lasted an average of 45 min, ranging from 30 to 60 min. We offered anonymity,requested permission to record and started with a short personal introduction of interviewers andinterviewees. All interviewees were informed about the study beforehand and gave their informedconsent for inclusion before they participated in the study. The study was conducted in accordance withthe guidelines of the School of Business and Economics at Vrije Universiteit Amsterdam. We explainedto the interviewees that we would talk about tensions in the manager–employee relationship, based onthree jokes (two of them were cartoons, and one was a text joke). The aim was to explore how consultantmanagers and their juniors experience the dirtiness of the management pressures. The three jokeswere a starting point for doing very open interviews, in which we discussed each joke (see Table 3)for 5–15 min. The first one resonated most with the experiences of consultants resulting in longconversations, with the last one being the least.
Table 3. Three consultant manager jokes indicating moral taint.
Manager A in his office: What are they complaining about . . . . The work is challenging, interesting, demanding!Manager B: AND we let them do it 80 h per week!Fran (2009) Retrieved from:https://www.cartoonstock.com/, accessed: 23 March 2017
Manager A to Manager B when walking through the office: Naturally our workers look happy. The penalty for not being happyis instant dismissalFinancial Times, 20 May 2013. Retrieved from:https://www.ft.com/content/41f990f0-b955-11e2-bc57-00144feabdc0#axzz2U2zMvxmp, accessed: 23 March 2017
Please don’t tell my mother I’m a consultant.She thinks I play guitar in a strip joint.Consultant Jokes Retrieved from:http://www.weitzenegger.de/en/to/jokes.html, accessed: 23 March 2017.
As jokes do not present the truth literally, it helped us to introduce our topic in a stimulating, butwhen reflecting on it, not a leading, but rather a very open way [62]. Interviewees were first asked tointerpret the jokes (for instance junior 9 said, “cartoon 1 is exaggerated.”), then they could explain if
282
IJERPH 2018, 15, 2506
or how the jokes related to their work contexts (“this (80 h a week) rarely happens here”), and whatfurther associations they had. Most respondents recognized aspects of the dirty management styleillustrated in cartoon 1. Related to cartoon 2, the first response of junior 1 was: “What do they mean bythis? That you always need to be happy at work? Or that you should pretend you are happy? Withthat I agree, as you don’t want to show your boss you don’t feel happy.” Many respondents recognizedaspects of cartoon 2 due to their own personality or an “up or out” culture in their consultancy. For thesame reasons of personality and company culture, others felt less connection to this cartoon. The thirdjoke was hardly representing how respondents felt about what they have to do, and they did notrecognize this dirty image of the job, like manager 2, who said, “I would put banker here instead ofconsultant.” All consultants stated they were proud enough to tell what they do, and did not recognizethe suggested shame for being a consultant. However, some did refer to other “sick stereotypes” theyencountered, like junior 9 who went on holiday, introduced herself as a consultant, getting the questionin return, and said, “where is your lease car and credit card?” The quoted interpretations illustrate thatrespondents made sense of all three jokes in their own way, by referring to their own experiences.
After this free interpretation, the interviewer facilitated a broad discussion including probingquestions concerning over-demanding managers, observed critical evaluations of the behaviour ofconsultant managers, the experienced effects of their leadership style, and how managers and juniorswhere coping with the situation of pressuring leadership and its morally tainted nature. None of suchcoping was suggested in the jokes, with only the pressures and the reputation proposed. Startinga conversation with a respondent by asking for interpreting three jokes is new, but doing openexplorative interviews aligns with prior research on dirty work (cf. [3,24,33,34]). It is a good wayto explore experiences with work pressures, leadership and dirtiness, and it fits our nascent field ofresearch as outlined by Edmondson and McManus [63] (p. 1170).
2.4. Data Analysis
To analyse the interviews, we worked mostly abductive. We applied elements of a groundedtheory approach in our coding [64] but also used existing dirty work and moral leadership tacticsto interpret the data. We kept an eye out for any codes that did not fit the existing theoretical labels.To do so, the transcribed interviews were coded with the qualitative data analysis tool Atlas.ti (ATLAS.tiScientific Software Development GmbH, Berlin, Germany). This resulted in 814 relevant codes withdata-driven summarizing labels mostly connected to one quote only, and incidentally to two. Bothauthors coded iteratively and pointed upon which they disagreed with were discussed and thenaligned. An overview of all codes can be found below in Table 4. In the results section we presentcodes related to dirty leadership pressures and related effects in Table 5, codes related to normalizationtactics in Table 6 and codes related to moral leadership tactics in Table 7.
The leadership pressures and their effects on juniors were coded as morally dirty based on twoethical perspectives: deontology (pressures) and consequentialism (effects). Criticized stressors, suchas long working hours and high work pressure, were coded as morally dirty from a deontologicalpoint of view. For example, demanding more hours than allowed by law does not conform to duty [65].Codes identifying criticized negative effects, such as burnout, decreased wellbeing, or high turnoverrates caused by health problems, were coded as immoral from a consequentialist perspective [66].Normalization and moral leadership tactics were labelled with existing concepts from the discussedliterature, except for the new ones that emerged from the data. Our findings suggest that moral taintexperienced by consultant managers is not only mitigated by taint normalization, but also by knownand lesser known moral leadership tactics. A process model summarizing the main codes and subcodes (in the boxes) and their relationships (arrows) is presented at the start of the results section(see Figure 1).
283
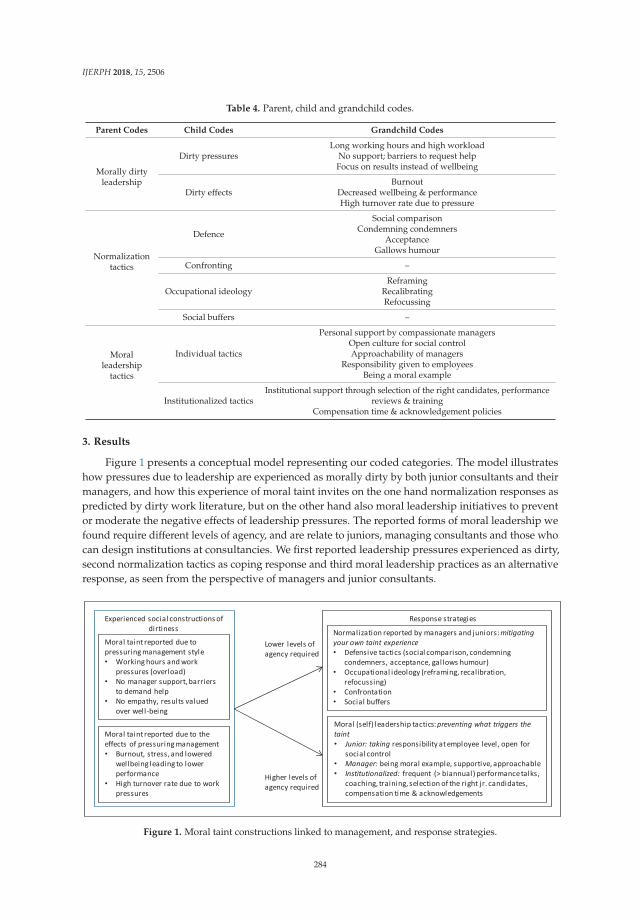
IJERPH 2018, 15, 2506
Table 4. Parent, child and grandchild codes.
Parent Codes Child Codes Grandchild Codes
Morally dirtyleadership
Dirty pressuresLong working hours and high workload
No support; barriers to request helpFocus on results instead of wellbeing
Dirty effectsBurnout
Decreased wellbeing & performanceHigh turnover rate due to pressure
Normalizationtactics
Defence
Social comparisonCondemning condemners
AcceptanceGallows humour
Confronting –
Occupational ideologyReframing
RecalibratingRefocussing
Social buffers –
Moralleadership
tactics
Individual tactics
Personal support by compassionate managersOpen culture for social controlApproachability of managers
Responsibility given to employeesBeing a moral example
Institutionalized tacticsInstitutional support through selection of the right candidates, performance
reviews & trainingCompensation time & acknowledgement policies
3. Results
Figure 1 presents a conceptual model representing our coded categories. The model illustrateshow pressures due to leadership are experienced as morally dirty by both junior consultants and theirmanagers, and how this experience of moral taint invites on the one hand normalization responses aspredicted by dirty work literature, but on the other hand also moral leadership initiatives to preventor moderate the negative effects of leadership pressures. The reported forms of moral leadership wefound require different levels of agency, and are relate to juniors, managing consultants and those whocan design institutions at consultancies. We first reported leadership pressures experienced as dirty,second normalization tactics as coping response and third moral leadership practices as an alternativeresponse, as seen from the perspective of managers and junior consultants.
Figure 1. Moral taint constructions linked to management, and response strategies.
284
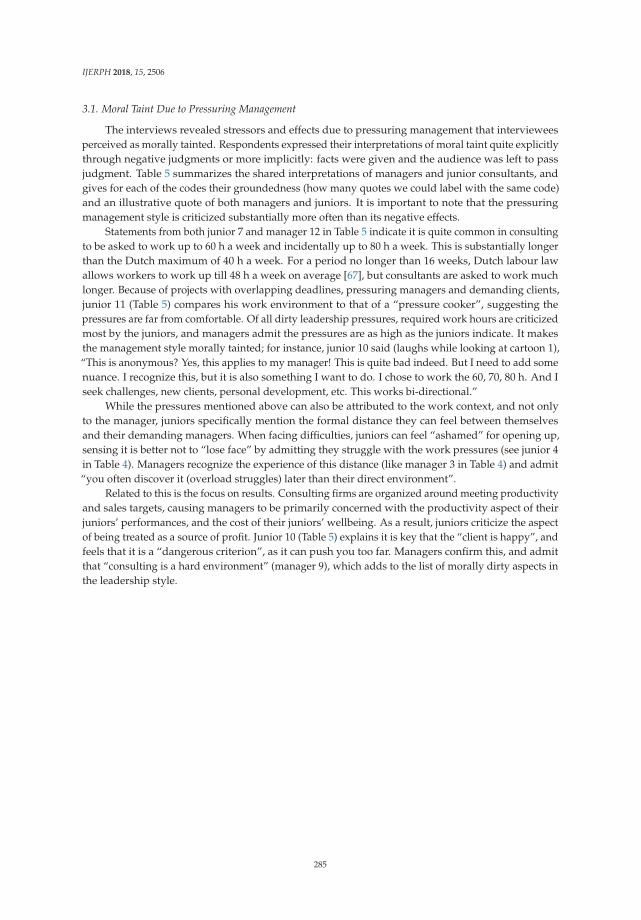
IJERPH 2018, 15, 2506
3.1. Moral Taint Due to Pressuring Management
The interviews revealed stressors and effects due to pressuring management that intervieweesperceived as morally tainted. Respondents expressed their interpretations of moral taint quite explicitlythrough negative judgments or more implicitly: facts were given and the audience was left to passjudgment. Table 5 summarizes the shared interpretations of managers and junior consultants, andgives for each of the codes their groundedness (how many quotes we could label with the same code)and an illustrative quote of both managers and juniors. It is important to note that the pressuringmanagement style is criticized substantially more often than its negative effects.
Statements from both junior 7 and manager 12 in Table 5 indicate it is quite common in consultingto be asked to work up to 60 h a week and incidentally up to 80 h a week. This is substantially longerthan the Dutch maximum of 40 h a week. For a period no longer than 16 weeks, Dutch labour lawallows workers to work up till 48 h a week on average [67], but consultants are asked to work muchlonger. Because of projects with overlapping deadlines, pressuring managers and demanding clients,junior 11 (Table 5) compares his work environment to that of a “pressure cooker”, suggesting thepressures are far from comfortable. Of all dirty leadership pressures, required work hours are criticizedmost by the juniors, and managers admit the pressures are as high as the juniors indicate. It makesthe management style morally tainted; for instance, junior 10 said (laughs while looking at cartoon 1),“This is anonymous? Yes, this applies to my manager! This is quite bad indeed. But I need to add somenuance. I recognize this, but it is also something I want to do. I chose to work the 60, 70, 80 h. And Iseek challenges, new clients, personal development, etc. This works bi-directional.”
While the pressures mentioned above can also be attributed to the work context, and not onlyto the manager, juniors specifically mention the formal distance they can feel between themselvesand their demanding managers. When facing difficulties, juniors can feel “ashamed” for opening up,sensing it is better not to “lose face” by admitting they struggle with the work pressures (see junior 4in Table 4). Managers recognize the experience of this distance (like manager 3 in Table 4) and admit“you often discover it (overload struggles) later than their direct environment”.
Related to this is the focus on results. Consulting firms are organized around meeting productivityand sales targets, causing managers to be primarily concerned with the productivity aspect of theirjuniors’ performances, and the cost of their juniors’ wellbeing. As a result, juniors criticize the aspectof being treated as a source of profit. Junior 10 (Table 5) explains it is key that the “client is happy”, andfeels that it is a “dangerous criterion”, as it can push you too far. Managers confirm this, and admitthat “consulting is a hard environment” (manager 9), which adds to the list of morally dirty aspects inthe leadership style.
285
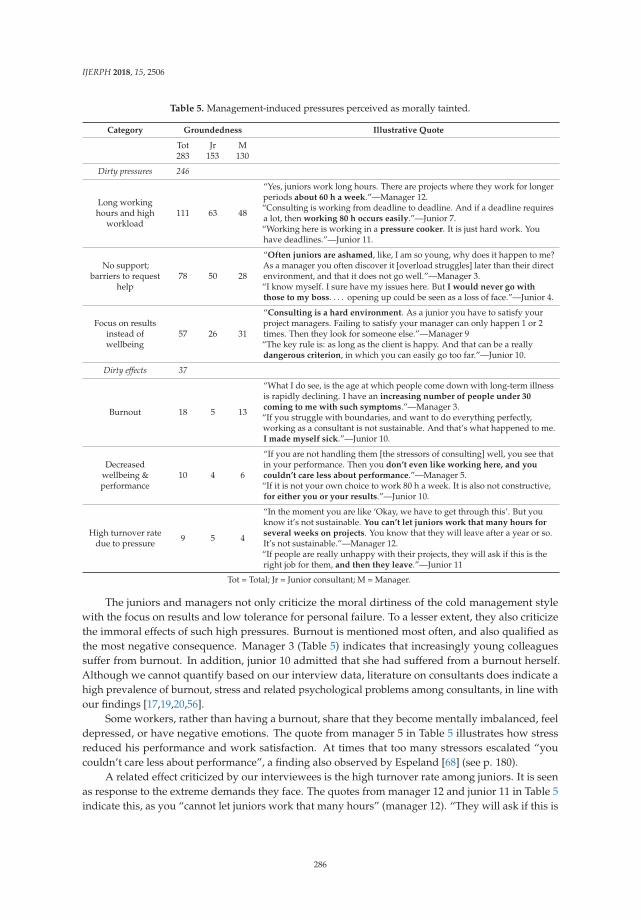
IJERPH 2018, 15, 2506
Table 5. Management-induced pressures perceived as morally tainted.
Category Groundedness Illustrative Quote
Tot283
Jr153
M130
Dirty pressures 246
Long workinghours and high
workload111 63 48
“Yes, juniors work long hours. There are projects where they work for longerperiods about 60 h a week.”—Manager 12.“Consulting is working from deadline to deadline. And if a deadline requiresa lot, then working 80 h occurs easily.”—Junior 7.“Working here is working in a pressure cooker. It is just hard work. Youhave deadlines.”—Junior 11.
No support;barriers to request
help78 50 28
“Often juniors are ashamed, like, I am so young, why does it happen to me?As a manager you often discover it [overload struggles] later than their directenvironment, and that it does not go well.”—Manager 3.“I know myself. I sure have my issues here. But I would never go withthose to my boss. . . . opening up could be seen as a loss of face.”—Junior 4.
Focus on resultsinstead ofwellbeing
57 26 31
“Consulting is a hard environment. As a junior you have to satisfy yourproject managers. Failing to satisfy your manager can only happen 1 or 2times. Then they look for someone else.”—Manager 9“The key rule is: as long as the client is happy. And that can be a reallydangerous criterion, in which you can easily go too far.”—Junior 10.
Dirty effects 37
Burnout 18 5 13
“What I do see, is the age at which people come down with long-term illnessis rapidly declining. I have an increasing number of people under 30coming to me with such symptoms.”—Manager 3.“If you struggle with boundaries, and want to do everything perfectly,working as a consultant is not sustainable. And that’s what happened to me.I made myself sick.”—Junior 10.
Decreasedwellbeing &performance
10 4 6
“If you are not handling them [the stressors of consulting] well, you see thatin your performance. Then you don’t even like working here, and youcouldn’t care less about performance.”—Manager 5.“If it is not your own choice to work 80 h a week. It is also not constructive,for either you or your results.”—Junior 10.
High turnover ratedue to pressure 9 5 4
“In the moment you are like ‘Okay, we have to get through this’. But youknow it’s not sustainable. You can’t let juniors work that many hours forseveral weeks on projects. You know that they will leave after a year or so.It’s not sustainable.”—Manager 12.“If people are really unhappy with their projects, they will ask if this is theright job for them, and then they leave.”—Junior 11
Tot = Total; Jr = Junior consultant; M = Manager.
The juniors and managers not only criticize the moral dirtiness of the cold management stylewith the focus on results and low tolerance for personal failure. To a lesser extent, they also criticizethe immoral effects of such high pressures. Burnout is mentioned most often, and also qualified asthe most negative consequence. Manager 3 (Table 5) indicates that increasingly young colleaguessuffer from burnout. In addition, junior 10 admitted that she had suffered from a burnout herself.Although we cannot quantify based on our interview data, literature on consultants does indicate ahigh prevalence of burnout, stress and related psychological problems among consultants, in line withour findings [17,19,20,56].
Some workers, rather than having a burnout, share that they become mentally imbalanced, feeldepressed, or have negative emotions. The quote from manager 5 in Table 5 illustrates how stressreduced his performance and work satisfaction. At times that too many stressors escalated “youcouldn’t care less about performance”, a finding also observed by Espeland [68] (see p. 180).
A related effect criticized by our interviewees is the high turnover rate among juniors. It is seenas response to the extreme demands they face. The quotes from manager 12 and junior 11 in Table 5indicate this, as you “cannot let juniors work that many hours” (manager 12). “They will ask if this is
286
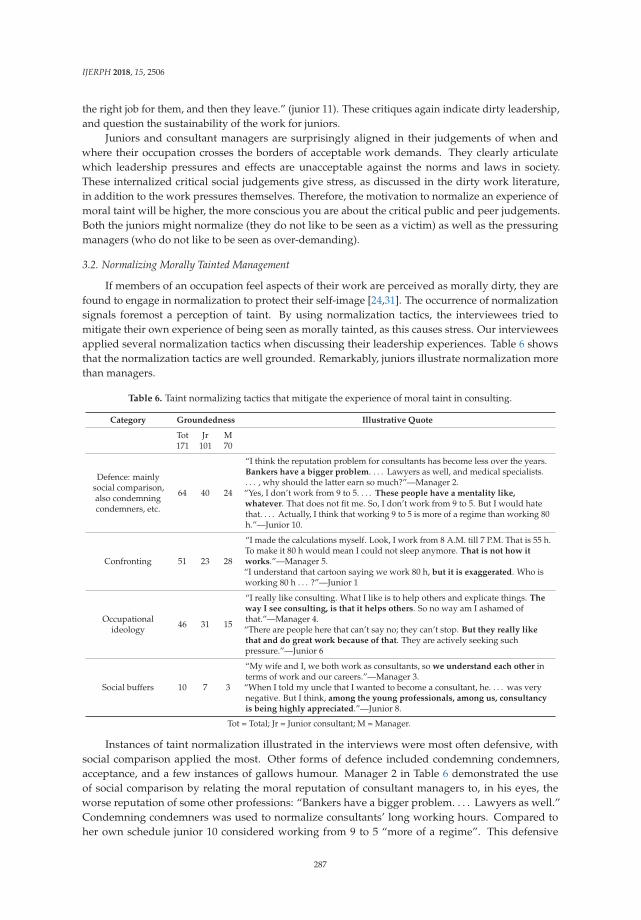
IJERPH 2018, 15, 2506
the right job for them, and then they leave.” (junior 11). These critiques again indicate dirty leadership,and question the sustainability of the work for juniors.
Juniors and consultant managers are surprisingly aligned in their judgements of when andwhere their occupation crosses the borders of acceptable work demands. They clearly articulatewhich leadership pressures and effects are unacceptable against the norms and laws in society.These internalized critical social judgements give stress, as discussed in the dirty work literature,in addition to the work pressures themselves. Therefore, the motivation to normalize an experience ofmoral taint will be higher, the more conscious you are about the critical public and peer judgements.Both the juniors might normalize (they do not like to be seen as a victim) as well as the pressuringmanagers (who do not like to be seen as over-demanding).
3.2. Normalizing Morally Tainted Management
If members of an occupation feel aspects of their work are perceived as morally dirty, they arefound to engage in normalization to protect their self-image [24,31]. The occurrence of normalizationsignals foremost a perception of taint. By using normalization tactics, the interviewees tried tomitigate their own experience of being seen as morally tainted, as this causes stress. Our intervieweesapplied several normalization tactics when discussing their leadership experiences. Table 6 showsthat the normalization tactics are well grounded. Remarkably, juniors illustrate normalization morethan managers.
Table 6. Taint normalizing tactics that mitigate the experience of moral taint in consulting.
Category Groundedness Illustrative Quote
Tot171
Jr101
M70
Defence: mainlysocial comparison,also condemningcondemners, etc.
64 40 24
“I think the reputation problem for consultants has become less over the years.Bankers have a bigger problem. . . . Lawyers as well, and medical specialists.. . . , why should the latter earn so much?”—Manager 2.“Yes, I don’t work from 9 to 5. . . . These people have a mentality like,whatever. That does not fit me. So, I don’t work from 9 to 5. But I would hatethat. . . . Actually, I think that working 9 to 5 is more of a regime than working 80h.”—Junior 10.
Confronting 51 23 28
“I made the calculations myself. Look, I work from 8 A.M. till 7 P.M. That is 55 h.To make it 80 h would mean I could not sleep anymore. That is not how itworks.”—Manager 5.“I understand that cartoon saying we work 80 h, but it is exaggerated. Who isworking 80 h . . . ?”—Junior 1
Occupationalideology 46 31 15
“I really like consulting. What I like is to help others and explicate things. Theway I see consulting, is that it helps others. So no way am I ashamed ofthat.”—Manager 4.“There are people here that can’t say no; they can’t stop. But they really likethat and do great work because of that. They are actively seeking suchpressure.”—Junior 6
Social buffers 10 7 3
“My wife and I, we both work as consultants, so we understand each other interms of work and our careers.”—Manager 3.“When I told my uncle that I wanted to become a consultant, he. . . . was verynegative. But I think, among the young professionals, among us, consultancyis being highly appreciated.”—Junior 8.
Tot = Total; Jr = Junior consultant; M = Manager.
Instances of taint normalization illustrated in the interviews were most often defensive, withsocial comparison applied the most. Other forms of defence included condemning condemners,acceptance, and a few instances of gallows humour. Manager 2 in Table 6 demonstrated the useof social comparison by relating the moral reputation of consultant managers to, in his eyes, theworse reputation of some other professions: “Bankers have a bigger problem. . . . Lawyers as well.”Condemning condemners was used to normalize consultants’ long working hours. Compared toher own schedule junior 10 considered working from 9 to 5 “more of a regime”. This defensive
287
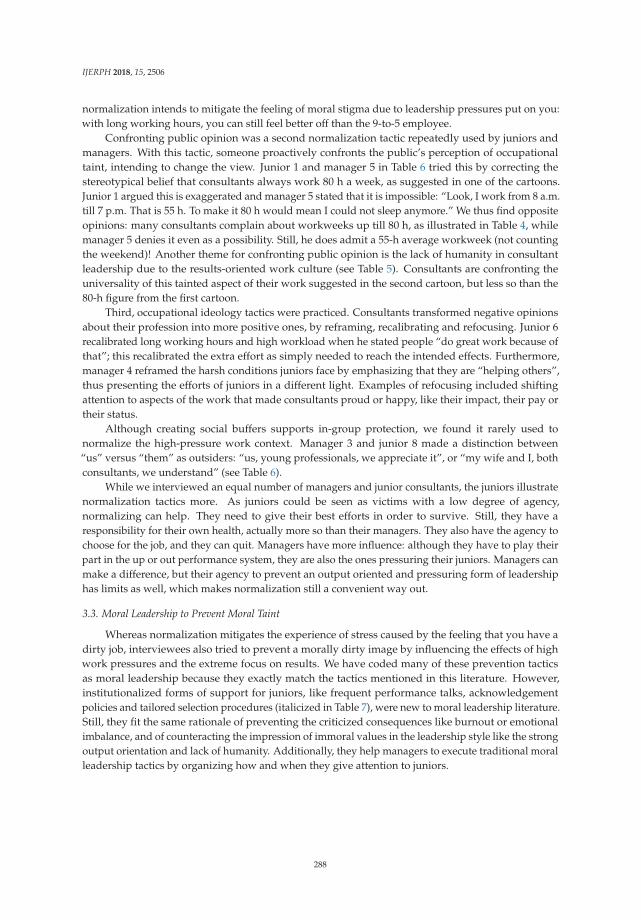
IJERPH 2018, 15, 2506
normalization intends to mitigate the feeling of moral stigma due to leadership pressures put on you:with long working hours, you can still feel better off than the 9-to-5 employee.
Confronting public opinion was a second normalization tactic repeatedly used by juniors andmanagers. With this tactic, someone proactively confronts the public’s perception of occupationaltaint, intending to change the view. Junior 1 and manager 5 in Table 6 tried this by correcting thestereotypical belief that consultants always work 80 h a week, as suggested in one of the cartoons.Junior 1 argued this is exaggerated and manager 5 stated that it is impossible: “Look, I work from 8 a.m.till 7 p.m. That is 55 h. To make it 80 h would mean I could not sleep anymore.” We thus find oppositeopinions: many consultants complain about workweeks up till 80 h, as illustrated in Table 4, whilemanager 5 denies it even as a possibility. Still, he does admit a 55-h average workweek (not countingthe weekend)! Another theme for confronting public opinion is the lack of humanity in consultantleadership due to the results-oriented work culture (see Table 5). Consultants are confronting theuniversality of this tainted aspect of their work suggested in the second cartoon, but less so than the80-h figure from the first cartoon.
Third, occupational ideology tactics were practiced. Consultants transformed negative opinionsabout their profession into more positive ones, by reframing, recalibrating and refocusing. Junior 6recalibrated long working hours and high workload when he stated people “do great work because ofthat”; this recalibrated the extra effort as simply needed to reach the intended effects. Furthermore,manager 4 reframed the harsh conditions juniors face by emphasizing that they are “helping others”,thus presenting the efforts of juniors in a different light. Examples of refocusing included shiftingattention to aspects of the work that made consultants proud or happy, like their impact, their pay ortheir status.
Although creating social buffers supports in-group protection, we found it rarely used tonormalize the high-pressure work context. Manager 3 and junior 8 made a distinction between“us” versus “them” as outsiders: “us, young professionals, we appreciate it”, or “my wife and I, bothconsultants, we understand” (see Table 6).
While we interviewed an equal number of managers and junior consultants, the juniors illustratenormalization tactics more. As juniors could be seen as victims with a low degree of agency,normalizing can help. They need to give their best efforts in order to survive. Still, they have aresponsibility for their own health, actually more so than their managers. They also have the agency tochoose for the job, and they can quit. Managers have more influence: although they have to play theirpart in the up or out performance system, they are also the ones pressuring their juniors. Managers canmake a difference, but their agency to prevent an output oriented and pressuring form of leadershiphas limits as well, which makes normalization still a convenient way out.
3.3. Moral Leadership to Prevent Moral Taint
Whereas normalization mitigates the experience of stress caused by the feeling that you have adirty job, interviewees also tried to prevent a morally dirty image by influencing the effects of highwork pressures and the extreme focus on results. We have coded many of these prevention tacticsas moral leadership because they exactly match the tactics mentioned in this literature. However,institutionalized forms of support for juniors, like frequent performance talks, acknowledgementpolicies and tailored selection procedures (italicized in Table 7), were new to moral leadership literature.Still, they fit the same rationale of preventing the criticized consequences like burnout or emotionalimbalance, and of counteracting the impression of immoral values in the leadership style like the strongoutput orientation and lack of humanity. Additionally, they help managers to execute traditional moralleadership tactics by organizing how and when they give attention to juniors.
288
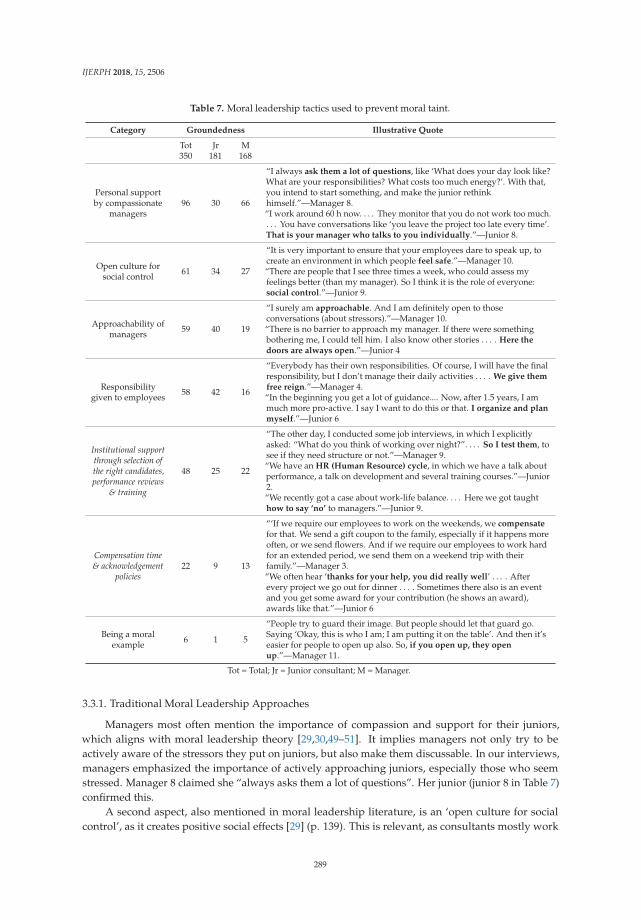
IJERPH 2018, 15, 2506
Table 7. Moral leadership tactics used to prevent moral taint.
Category Groundedness Illustrative Quote
Tot350
Jr181
M168
Personal supportby compassionate
managers96 30 66
“I always ask them a lot of questions, like ‘What does your day look like?What are your responsibilities? What costs too much energy?’. With that,you intend to start something, and make the junior rethinkhimself.”—Manager 8.“I work around 60 h now. . . . They monitor that you do not work too much.. . . You have conversations like ‘you leave the project too late every time’.That is your manager who talks to you individually.”—Junior 8.
Open culture forsocial control 61 34 27
“It is very important to ensure that your employees dare to speak up, tocreate an environment in which people feel safe.”—Manager 10.“There are people that I see three times a week, who could assess myfeelings better (than my manager). So I think it is the role of everyone:social control.”—Junior 9.
Approachability ofmanagers 59 40 19
“I surely am approachable. And I am definitely open to thoseconversations (about stressors).”—Manager 10.“There is no barrier to approach my manager. If there were somethingbothering me, I could tell him. I also know other stories . . . . Here thedoors are always open.”—Junior 4
Responsibilitygiven to employees 58 42 16
“Everybody has their own responsibilities. Of course, I will have the finalresponsibility, but I don’t manage their daily activities . . . . We give themfree reign.”—Manager 4.“In the beginning you get a lot of guidance.... Now, after 1.5 years, I ammuch more pro-active. I say I want to do this or that. I organize and planmyself.”—Junior 6
Institutional supportthrough selection ofthe right candidates,performance reviews
& training
48 25 22
“The other day, I conducted some job interviews, in which I explicitlyasked: “What do you think of working over night?”. . . . So I test them, tosee if they need structure or not.”—Manager 9.“We have an HR (Human Resource) cycle, in which we have a talk aboutperformance, a talk on development and several training courses.”—Junior2.“We recently got a case about work-life balance. . . . Here we got taughthow to say ‘no’ to managers.”—Junior 9.
Compensation time& acknowledgement
policies22 9 13
“‘If we require our employees to work on the weekends, we compensatefor that. We send a gift coupon to the family, especially if it happens moreoften, or we send flowers. And if we require our employees to work hardfor an extended period, we send them on a weekend trip with theirfamily.”—Manager 3.“We often hear ‘thanks for your help, you did really well’ . . . . Afterevery project we go out for dinner . . . . Sometimes there also is an eventand you get some award for your contribution (he shows an award),awards like that.”—Junior 6
Being a moralexample 6 1 5
“People try to guard their image. But people should let that guard go.Saying ‘Okay, this is who I am; I am putting it on the table’. And then it’seasier for people to open up also. So, if you open up, they openup.”—Manager 11.
Tot = Total; Jr = Junior consultant; M = Manager.
3.3.1. Traditional Moral Leadership Approaches
Managers most often mention the importance of compassion and support for their juniors,which aligns with moral leadership theory [29,30,49–51]. It implies managers not only try to beactively aware of the stressors they put on juniors, but also make them discussable. In our interviews,managers emphasized the importance of actively approaching juniors, especially those who seemstressed. Manager 8 claimed she “always asks them a lot of questions”. Her junior (junior 8 in Table 7)confirmed this.
A second aspect, also mentioned in moral leadership literature, is an ‘open culture for socialcontrol’, as it creates positive social effects [29] (p. 139). This is relevant, as consultants mostly work
289
IJERPH 2018, 15, 2506
together in project teams [69] (p. 559). Our interviewees illustrated how managers help to establishan open culture, in which peers are encouraged to express their feelings to each other. Manager 10(Table 7) stated how important it is to create an environment in which everybody can ‘speak up’. Herjunior (10) confirmed the open culture and the social control: “I experience the social control. It meansthere is sufficient attention for the persons themselves, and how they really feel, instead of only aresult focus, this extreme focus.” Junior 9 (see Table 7) has a similar experience of social control, andmentions that colleagues take care of each other.
Third, managers try to be approachable and to react with understanding and forgiveness if juniorsapproach them. Manager 10 stated that if a junior dared to approach her, she would definitely listenand then try to manage the problem. Manager 4 illustrated a similar attitude: “You try to find outwhat is the matter, and then seek for a solution together. That cartoon suggesting to dismiss themimmediately is not our approach, and I would not support it.” His junior confirmed the approachable“the doors are always open” and the forgiving approach of his manager (junior 4, Table 7), but heknows other stories as well, where you “first need to book your appointment”.
The impact of acting as a moral example is sufficiently discussed in the literature, as documentedin our theory section. However, the tactic was hardly mentioned by our interviewees, indicating it is adifficult one in the context of consulting. Manager 11 (Table 7, bottom row) acknowledged that juniorsfind it difficult to open up about stressors, and yet he expressed that if he became open about himself,“it is easier for people to open up also”. Only one junior (junior 9) referred to exemplary behaviour ofone manager who did not respond to an email she had sent on a Sunday. That manager explainedlater that the weekend should be weekend. However, this does not seem to be standard practice inthis occupation.
3.3.2. Juniors’ Role in Making Moral Leadership Work
The fourth moral leadership tactic we found (based on groundedness) was giving responsibilityto the employee, a practice most often expressed by juniors. By making the juniors more responsiblefor how they perform their tasks, their feelings of helplessness and lack of control can decrease [30].Manager 4 (Table 7) stated that he tries to foster autonomy of juniors by not getting involved in theirdaily tasks. Giving autonomy to plan his or her own schedule and projects reduces the negative impactof workload and deadline stress. Juniors are supported to develop this autonomy, as mentioned byjunior 6, and such autonomy is indeed expected. Manager 6 explains: “If they have a problem, theyshould call me. Sometimes at the end of a call, they just thank me for the talk. It can help to bettermake sense of a difficult situation. But they have to approach me, as we discussed before. And thatdoes not always happen.”
3.3.3. Institutional Approaches to Moral Leadership
Respondents also referred to institutionalized practices, such as the monitoring of juniors throughmonthly or quarterly performance reviews next to the annual talk. Junior 2 mentions that herconsultancy organizes different types of formal evaluations every year (see Table 7), and elsewhere inthe interview she refers to evaluations “after every project”. It gives juniors a platform to speak up,and this way it is institutionalized that they receive sufficient attention from their managers. Trainingsare institutionalized as well, as illustrated in the quotes from juniors 2 and 9 in Table 7. Examples arework–life balance workshops and personal development courses that better prepare juniors to handlethe work stress.
Additionally, consultancies make use of an extensive selection process, aimed at hiring thesejuniors who are sturdy enough to handle the stress of being a consultant, as explained by manager 9 inTable 7. Some people like a challenging work environment and are able to handle the lack of structurefor many years. However, the work is too demanding for many others, so consultancies are awareof the importance to pick the right people, in order to protect their reputation as an employer and tomanage the consequences of the severe work pressures up front.
290
IJERPH 2018, 15, 2506
A second group of institutionalized practices to counter the moral taint of pressuring managementincludes compensation and acknowledgment. Overwork or high pressure is not compensated byadditional pay, because it is seen as part of the job. However, managers often give juniors visiblerecognition after a stressful period. For instance, juniors are given dinners, social events, flowers,a couple of days off and even vacations. The quote from manager 3 (Table 7) illustrated thispractice. The manager acknowledges the stress, and marks it as out-of-the-ordinary. In additionto acknowledging the stress, he compensates his juniors with time to recover, ultimately also hoping toprevent severe consequences. His junior confirmed his work is quite intense now, heading towardsthe end of several projects, “but you also know you can slow down after the deadlines. That is quiteaccepted” (junior 3). Junior 6 illustrated another practice explained by manager 3: “we often hear:‘thanks for your help, you did really well’.”
The combination of traditional, more personal, and consultancy-specific institutionalized practicesto support juniors demonstrates that the direct managers are not the only ones who take responsibilityfor supporting juniors. The organization as a whole has taken action to prevent escalation ofstress. These institutionalized practices aim at making the consequences of the stressors less severeand the management more humane, at the same time reducing perceptions of moral taint in theeyes of the juniors and their managers. Such multi-level moral leadership is potentially a moreeffective approach to coping with perceptions of morally tainted leadership than taint normalization.Normalization only targets at the stress due to perceptions of taint, which is symptom management.Moral leadership targets the specific causes behind these perceptions. Additionally, given the factthat the pressuring leadership style is far more criticized than its effects (see Table 5), the multi-levelapproach seems promising.
4. Discussion
In summary, we found that moral leadership approaches were discussed quite a lot whencompared to normalization responses. Twice as many quotes (350 vs. 171) illustrated moral leadershiptactics in response to the dirty leadership images. When reflecting on moral leadership approaches,juniors and managers emphasized different options. Managers mentioned their active compassion andsupport of juniors twice as often as juniors, whereas juniors mentioned the approachability of theirmanagers more often as important to them. Still, juniors and managers referred to the same kind oftactics. This, together with the ample groundedness of the codes, indicates good saturation.
Table 5 shows that the leadership style of managers is more often constructed as dirty (246 quotes)than the resulting effects (37 quotes). However, the number of quotes is not very conclusive regardingthis dirtiness as something “essential”. The mentioned effects like burnout are really problematicand not mentioning it might even be an avoidance or denial strategy. Still, there is a lot of talkabout the dirtiness of the leadership style and this is a big issue in the construction of consultants’dirty leadership.
Moral leadership aims at neutralizing such dirtiness. For instance, the impressions of anoutput-oriented and pressuring leadership style resulting in long working hours and high workloadsis countered by traditional moral leadership tactics. They counter the stigma that managersdo not provide support and have no empathy, as these traditional tactics are targeting exactlythese aspects of dirtiness in the leadership style. Institutionalized moral leadership tactics, likeregular performance talks, training, selective hiring and various compensation tactics, are alsodiscussed a lot, which indicates their social visibility, with the construction of a better leadershipimpression. These institutionalized approaches seem specific for our high-performance setting, andmight be relevant to other high-pressure contexts as well, such as investment banks or law firms.The applicability of the individual moral leadership tactics must be much wider, as these tactics havebeen found in many other work contexts already [29,30,49,50].
The findings of our study contribute to the literature on moral taint and moral leadership.First, we found that moral problems that cause a dirty leadership image can be targeted with moral
291
IJERPH 2018, 15, 2506
leadership approaches [29,30,49]. Consulting managers engage in many forms of moral leadership tocounterbalance what juniors and managers socially construct as a dirty leadership style. Especially thepressuring leadership style, like focusing on output only and lack of personal attention, is experiencedas dirty in the image of consultant management. Traditional moral leadership tactics target such dirtyaspects in the leadership style directly. Thus, they socially construct alternative and more ambiguousleadership image: pressuring yes, but also committed. As deeds can speak louder than words, thisapproach seems quite relevant for influencing a dirty leadership image. Except for confrontingpublic opinion, normalizing mainly has a focus on individual stress reduction due to a dirty image.Our findings add a new repertoire of tactics to the literature on moral taint (cf. [3,24,26,35]). As aconsequence, normalization tactics are just one way to respond to the experience of moral taint.
On a more critical note, we found that some of the propositions in Ashforth and Kreiner [31]did not hold very well in the context of consulting. For instance, proposition 4 that morally taintedprofessions are assumed to mostly engage in group-level defensive tactics, and proposition 10 that suchprofessions create social buffers to normalize taint were not very prominent in our context. We found,similar to findings by Vaast and Levina [3], that the tactic of social buffering is not utilized much,whereas defensive tactics are most frequently applied. Considering defensive tactics Ashforth andKreiner [31] assume in their proposition 11 that condemning condemners is the most common oneto normalize moral taint, however, in our study, social comparison is the most reported normalizingtactic, a result that aligns by and large with the findings of Vaast and Levina [3] situated in the bankingindustry. Unlike the propositions in Ashforth and Kreiner [31], we found many instances of confrontingpublic opinions about the dirtiness of consultant leadership. Probably, effectively normalizing moraltaint largely depends on context, as both banking and consulting belong to the professional servicesector. As professional service industries are a growing field of employment in today’s societies, futureresearch should address these high-performance sectors more specifically when studying morallytainted leadership and the potentially tainted health consequences for employees, like burnout. It isimportant to study such consequences, and possible gender, role or seniority differences based ona quantitative research design, to better tease out to what extent normalization attempts cover upsuch consequences.
Second, we contribute to moral leadership literature by finding that consultant managers not onlyapply traditional moral leadership approaches like being approachable, compassionate supportiveand encouraging. Consultancies also support managers with institutionalized measures that aim atmoral leadership, and that are new in this literature (cf. [29,30,49,50]). As the agency of managersis constrained by institutional pressures, we see that the organization also creates counter pressureswith several specific HR practices. As these HR practices are quite visible, they help to clean up thedirty leadership image, again with deeds more than words. Therefore, we invite moral leadershipliterature to better include the organizational and institutional levels in its theorizing. By havingfrequent performance reviews planned, trainings available, and several non-monetary compensationpolicies in place, consultant managers mentioned how they are supported in taking responsibilityfor the wellbeing of juniors. These institutionalized measures might be specific to high-performanceoccupations with demanding top management, clients and projects, where it is very tempting to satisfyclient needs first and think about your juniors second [11]. Therefore, similar institutional supportmight be relevant to other high-pressure professional service contexts, such as investment banking,law firms and marketing agencies, or even at the more competitive top universities.
Our research has also some practical implications beyond the fields of moral leadership theoryand dirty work literature. We consider it a promising and innovative combination to facilitate moralleadership of middle managers with supportive HR practices. Such tailored institutions mighthelp protecting employee health and reduce psychosocial risks at work, especially in settings ofknowledge-intensive work. These are high-performance work contexts where employees are oftenambitious and willing to give their best, but where burnout risks lure around the corner, especiallywhen employees do not feel they are seen and cared for, or rewarded for taking initiative and for acting
292
IJERPH 2018, 15, 2506
responsible towards their organization, often at the cost of their own mental resources. Our researchshows that HR institutions can be further developed to support middle management in taking care oftheir employees, inspired by moral leadership ideas. If organizations create such institutions to giveattention, to show compassion and to take responsibility for workers that give their best, it could helpto move away from the more bureaucratic, rule-based and one-size-fits-all HR institutions we are sofamiliar with today.
5. Conclusions
The identified moral leadership approaches on both the levels of individual manager and theorganization add to our understanding of how organizations can influence their image of moraldirtiness associated with pressuring, output-oriented management. Similar multi-level approaches tosupport employees have been identified in Australian universities [36], and they seem promising inempowering middle management to become moral leaders. However, based on our research findings,we cannot answer yet to what extent individual and organizational moral leadership approachesin consulting make life of juniors really better (see [16,17,19,44]). It is possible that they are merelyused instrumentally, to push performance of juniors just a little bit further, without irreversibleconsequences for leadership reputation and employee health and wellbeing. What we can conclude isthat the morally dirty reputation of consultancies is not only articulated regarding the consultant–clientrelationships [7–10]. Moral leadership issues between consultants and their managers are also publiclyaddressed, and more prominently indeed than their moral leadership approaches.
Author Contributions: Conceptualization, O.B. and T.E.K.; analysis, O.B. and T.E.K.; investigation, T.E.K.;methodology, O.B.; writing of the original draft, O.B. and T.E.K.; writing of review and editing, O.B.
Funding: This research received no external funding.
Conflicts of Interest: The authors declare no conflict of interest.
References
1. Hughes, E.C. Work and the self. In Social Psychology at the Crossroads; Rohrer, J.H., Sherif, M., Eds.; Harperand Bros: New York, NY, USA, 1951; pp. 313–323.
2. Stanley, L.; MacKenzie Davey, K.; Symon, G. Exploring media construction of investment banking as dirtywork. Qual. Res. Organ. Manag. Int. J. 2014, 9, 270–287. [CrossRef]
3. Vaast, E.; Levina, N. Speaking as one, but not speaking up: Dealing with new moral taint in an occupationalonline community. Inf. Organ. 2015, 25, 73–98. [CrossRef]
4. Morales, J.; Lambert, C. Dirty work and the construction of identity. An ethnographic study of managementaccounting practices. Account. Organ. Soc. 2013, 38, 228–244. [CrossRef]
5. Bouwmeester, O.; Stiekema, J. The paradoxical image of consultant expertise: A rhetorical deconstruction.Manag. Decis. 2015, 53, 2433–2456. [CrossRef]
6. Sturdy, A. Popular critiques of consultancy and a politics of management learning? Manag. Learn. 2009, 40,457–463. [CrossRef]
7. Allen, J.; Davis, D. Assessing some determinant effects of ethical consulting behavior: The case of personaland professional values. J. Bus. Ethics 1993, 12, 449–458. [CrossRef]
8. Poulfelt, F. Ethics for management consultants. Bus. Ethics Eur. Rev. 1997, 6, 65–70. [CrossRef]9. Redekop, B.W.; Heath, B.L. A brief examination of the nature, contexts, and causes of unethical consultant
behaviors. J. Pract. Consult. 2007, 1, 40–50.10. Krehmeyer, D.; Freeman, R.E. Consulting and ethics. In The Oxford Handbook of Management Consulting;
Clark, T., Kipping, M., Eds.; Oxford University Press: Oxford, UK, 2012; pp. 487–498.11. O’Mahoney, J. Advisory anxieties: Ethical individualisation in the UK consulting industry. J. Bus. Ethics
2011, 104, 101–113. [CrossRef]12. Baran, B.E.; Rogelberg, S.; Carello Lopina, E.; Allen, J.A.; Spitzmüller, C.; Bergman, M. Shouldering a silent
burden: The toll of dirty tasks. Hum. Relat. 2012, 65, 597–626. [CrossRef]
293
IJERPH 2018, 15, 2506
13. Michel, A. Transcending socialization: A nine-year ethnography of the body’s role in organizational controland knowledge workers’ transformation. Admin. Sci. Q. 2011, 56, 325–368. [CrossRef]
14. Fortney, S.S. I don’t have time to be ethical: Addressing the effects of billable hour pressure. Idaho Law Rev.2003, 39, 305–319.
15. Schiltz, P.J. On being a happy, healthy, and ethical member of an unhappy, unhealthy, and unethicalprofession. Vanderbilt Law Rev. 1999, 52, 871–951.
16. Meriläinen, S.; Tienari, J.; Thomas, R.; Davies, A. Management consultant talk: A cross-cultural comparisonof normalizing discourse and resistance. Organization 2004, 11, 539–564. [CrossRef]
17. Mühlhaus, J.; Bouwmeester, O. The paradoxical effect of self-categorization on work stress in a high-statusoccupation: Insights from management consulting. Hum. Relat. 2016, 69, 1823–1852. [CrossRef]
18. Noury, L.; Gand, S.; Sardas, J.-C. Tackling the work-life balance challenge in professional service firms:The impact of projects, organizing, and service characteristics. J. Prof. Organ. 2017, 4, 149–178. [CrossRef]
19. O’Mahoney, J. Disrupting identity: Trust and angst in management consulting. In Searching for the h in HumanResource Management: Theory, Practice and Workplace Contexts; Bolton, S.C., Houlihan, M., Eds.; PalgraveMacmillan: Bastingstoke, UK, 2007; pp. 281–302.
20. Vahl, R. Hard werken en gezond leven. Gezond Ondernemen 2013, 6, 6–11.21. Stein, F. Work, Sleep, Repeat: The Abstract Labour of German Management Consultants; Bloomsbury Academic:
London, UK, 2017.22. Goffman, E. Stigma: Notes on the Management of Spoiled Identity; Penquin: London, UK, 1963.23. Hughes, E.C. Men and Their Work; Free Press: Glencoe, UK, 1958.24. Ashforth, B.E.; Kreiner, G.E.; Clark, M.A.; Fugate, M. Normalizing dirty work: Managerial tactics for
countering occupational taint. Acad. Manag. J. 2007, 50, 149–174. [CrossRef]25. Luyendijk, J. Swimming with Sharks: My Journey into the World of the Bankers; Guardian Faber Publishing:
London, UK, 2015.26. Ashforth, B.E.; Kreiner, G.E. “How can you do it?”: Dirty work and the challenge of constructing a positive
identity. Acad. Manag. Rev. 1999, 24, 413–434.27. Bandura, A.; Barbaranelli, C.; Caprara, G.V.; Pastorelli, C. Mechanisms of moral disengagement in the
exercise of moral agency. J. Personal. Soc. Psychol. 1996, 71, 364–374. [CrossRef]28. Rhode, D. Where is the leadership in moral leadership? In Moral Leadership: The Theory and Practice of Power,
Judgment and Policy; John Wiley & Sons: San Fransisco, CA, USA, 2006; pp. 1–53.29. Schminke, M.; Ambrose, M.L.; Neubaum, D.O. The effect of leader moral development on ethical climate
and employee attitudes. Organ. Behav. Hum. Decis. Process. 2005, 97, 135–151. [CrossRef]30. Zhu, W.; May, D.R.; Avolio, B.J. The impact of ethical leadership behavior on employee outcomes: The roles
of psychological empowerment and authenticity. J. Leadersh. Organ. Stud. 2004, 11, 16–26.31. Ashforth, B.E.; Kreiner, G.E. Dirty work and dirtier work: Differences in countering physical, social, and
moral stigma. Manag. Organ. Rev. 2014, 10, 81–108. [CrossRef]32. Bergman, M.E.; Chalkley, K.M. “Ex” marks a spot: The stickiness of dirty work and other removed stigmas.
J. Occup. Health Psychol. 2007, 12, 251–265. [CrossRef] [PubMed]33. Tracy, S.J.; Scott, C. Sexuality, masculinity, and taint management among firefighters and correctional officers
getting down and dirty with “America’s heroes” and the “scum of law enforcement”. Manag. Commun. Q.2006, 20, 6–38. [CrossRef]
34. Tyler, M. Tainted love: From dirty work to abject labour in Soho’s sex shops. Hum. Relat. 2011, 64, 1477–1500.[CrossRef]
35. Ashforth, B.E.; Kreiner, G.E.; Clark, M.A.; Fugate, M. Congruence work in stigmatized occupations:A managerial lens on employee fit with dirty work. J. Organ. Behav. 2017, 38, 1260–1279. [CrossRef]
36. Pignata, S.; Winefield, A.H.; Boyd, C.M.; Provis, C. A qualitative study of hr/ohs stress interventions inAustralian universities. Int. J. Environ. Res. Public Health 2018, 15, 103. [CrossRef] [PubMed]
37. O’Donnell, J.; Weitz, T.A.; Freedman, L.R. Resistance and vulnerability to stigmatization in abortion work.Soc. Sci. Med. 2011, 73, 1357–1364. [CrossRef] [PubMed]
38. Hamilton, P.; Redman, T.; McMurray, R. ‘Lower than a snake’s belly’: Discursive constructions of dignityand heroism in low-status garbage work. J. Bus. Ethics 2017, 1–13. [CrossRef]
39. Grandy, G.; Mavin, S. Sinners and Saints: Morally Stigmatized Work. In Stigmas, Work and Organizations;Thomson, S.B., Grandy, G., Eds.; Palgrave MacMillan: New York, NY, USA, 2018; pp. 101–121.
294
IJERPH 2018, 15, 2506
40. Kreiner, G.E.; Ashforth, B.E.; Sluss, D.M. Identity dynamics in occupational dirty work: Integrating socialidentity and system justification perspectives. Organ. Sci. 2006, 17, 619–636. [CrossRef]
41. Folkman, S.; Lazarus, R.S.; Dunkel-Schetter, C.; DeLongis, A.; Gruen, R.J. Dynamics of a stressful encounter:Cognitive appraisal, coping, and encounter outcomes. J. Personal. Soc. Psychol. 1986, 50, 992–1003. [CrossRef]
42. Hobfoll, S.E. Conservation of resources: A new attempt at conceptualizing stress. Am. Psychol. 1989, 44,513–524. [CrossRef] [PubMed]
43. Roca, E. The exercise of moral imagination in stigmatized work groups. J. Bus. Ethics 2010, 96, 135–147.[CrossRef]
44. Gill, M.J. Elite identity and status anxiety: An interpretative phenomenological analysis of managementconsultants. Organization 2013, 22, 306–325. [CrossRef]
45. Howard, W.C. Leadership: Four styles. Education 2005, 126, 384–391.46. Stone, A.G.; Russell, R.F.; Patterson, K. Transformational versus servant leadership: A difference in leader
focus. Leadersh. Organ. Dev. J. 2004, 25, 349–361. [CrossRef]47. Mendonca, M. Preparing for ethical leadership in organizations. Can. J. Admin. Sci./Revue Canadienne des
Sciences de l’Administration 2001, 18, 266–276. [CrossRef]48. Aronson, E. Integrating leadership styles and ethical perspectives. Can. J. Admin. Sci./Revue Canadienne des
Sciences de l’Administration 2001, 18, 244–256. [CrossRef]49. Gini, A. Moral leadership and business ethics. In Ethics, the Heart of Leadership; Ciulla, J.B., Ed.; Praeger
Publishers: London, UK, 2004; pp. 25–81.50. Rushton, C.H. Defining and addressing moral distress: Tools for critical care nursing leaders. AACN Adv.
Crit. Care 2006, 17, 161–168. [CrossRef] [PubMed]51. Brown, M.E.; Treviño, L.K.; Harrison, D.A. Ethical leadership: A social learning perspective for construct
development and testing. Organ. Behav. Hum. Decis. Process. 2005, 97, 117–134. [CrossRef]52. Covey, S.R. The 8th Habit: From Eflectiveness to Greatness; Free Press: New York, NY, USA, 2004.53. Kazi, A.; Haslam, C. Stress management standards: A warning indicator for employee health. Occup. Med.
2013, 63, 335–340. [CrossRef] [PubMed]54. Kärreman, D.; Alvesson, M. Cages in tandem: Management control, social identity, and identification in a
knowledge-intensive firm. Organization 2004, 11, 149–175. [CrossRef]55. Alvesson, M.; Robertson, M. The best and the brightest: The construction, significance and effects of elite
identities in consulting firms. Organization 2006, 13, 195–224. [CrossRef]56. Morrell, K.; Simonetto, M. Managing retention at deloitte consulting. Consult. Manag. 1999, 10, 55.57. Skagert, K.; Dellve, L.; Eklöf, M.; Pousette, A.; Ahlborg, G. Leaders’ strategies for dealing with own and
their subordinates’ stress in public human service organisations. Appl. Ergon. 2008, 39, 803–811. [CrossRef][PubMed]
58. Kihn, M. House of Lies: How Management Consultants Steel Your Watch and Then Tell You the Time; Business Plus:New York, NY, USA, 2012.
59. Ashford, M. Con Tricks: The Shadowy World of Management Consultancy and How to Make It Work for You; Simon& Schuster: London, UK, 1998.
60. Pinault, L. Consulting Demons: Inside the Unscrupulous World of Global Corporate Consulting; Wiley: Chichester,UK, 2000.
61. Creswell, J.W. Qualitative Inquiry & Research Design; Sage: Thousands Oaks, CA, USA, 2007.62. Alvesson, M. Beyond neopositivists, romantics, and localists: A reflexive approach to interviews in
organizational research. Acad. Manag. Rev. 2003, 28, 13–33. [CrossRef]63. Edmondson, A.C.; McManus, S.E. Methodological fit in management field research. Acad. Manag. Rev. 2007,
32, 1246–1264. [CrossRef]64. Gioia, D.A.; Corley, K.G.; Hamilton, A.L. Seeking qualitative rigor in inductive research notes on the Gioia
methodology. Organ. Res. Methods 2013, 16, 15–31. [CrossRef]65. Larry, A.; Moore, M. Deontological ethics. In The Stanford Encyclopedia of Philosophy; Zalta, E.N., Ed.;
Metaphysics Research Lab, Stanford University: Stanford, CA, USA, 2016.66. Sinnott-Armstrong, W. Consequentialism. In The Stanford Encyclopedia of Philosophy; Zalta, E.N., Ed.;
Metaphysics Research Lab, Stanford University: Stanford, CA, USA, 2015.67. Rijksoverheid. Werktijden. Available online: https://www.rijksoverheid.nl/onderwerpen/werktijden/
vraag-en-antwoord/wat-is-er-wettelijk-geregeld-voor-mijn-werktijden (accessed on 13 June 2017).
295

IJERPH 2018, 15, 2506
68. Espeland, K.E. Overcoming burnout: How to revitalize your career. J. Contin. Educ. Nurs. 2006, 37, 178–184.[CrossRef] [PubMed]
69. Robertson, M.; Swan, J. Modes of organizing in an expert consultancy: A case study of knowledge, powerand egos. Organization 1998, 5, 543–564. [CrossRef]
© 2018 by the authors. Licensee MDPI, Basel, Switzerland. This article is an open accessarticle distributed under the terms and conditions of the Creative Commons Attribution(CC BY) license (http://creativecommons.org/licenses/by/4.0/).
296
International Journal of
Environmental Research
and Public Health
Article
Four Wellbeing Patterns and their Antecedents inMillennials at Work
Tariku Ayana Abdi 1 , José M. Peiró 2 , Yarid Ayala 3,* and Salvatore Zappalà 4,5
1 Department of Psychology, University of Campania, 8100 Caserta, Italy; [email protected] IVIE & IDOCAL, University of Valencia, 46010 Valencia, Spain; [email protected] Department of Economics and Management, Pontificia Universidad Javeriana, 110111 Bogotá, Colombia4 Department of Psychology, University of Bologna, 40126 Bologna, Italy, [email protected] Department of Human Resource Management and Psychology, Financial University under the Government
of the Russian Federation, 125993 Moscow, Russia* Correspondence: [email protected]; Tel.: +57-350-347-9920
Received: 15 November 2018; Accepted: 18 December 2018; Published: 22 December 2018
Abstract: Literature suggests that job satisfaction and health are related to each other in asynergic way. However, this might not always be the case, and they may present misalignedrelationships. Considering job satisfaction and mental health as indicators of wellbeing at work, weaim to identify four patterns (i.e., satisfied-healthy, unsatisfied-unhealthy, satisfied-unhealthy, andunsatisfied-healthy) and some of their antecedents. In a sample of 783 young Spanish employees,a two-step cluster analysis procedure showed that the unsatisfied-unhealthy pattern was the mostfrequent (33%), followed by unsatisfied-healthy (26.6%), satisfied-unhealthy (24.8%) and, finally,the satisfied-healthy pattern (14.3%). Moreover, as hypothesized, discriminant analysis suggeststhat higher levels of job importance and lower levels of role ambiguity mainly differentiate thesatisfied-healthy pattern, whereas overqualification and role overload differentiate, respectively, theunsatisfied-healthy and satisfied-unhealthy patterns. Contrary to our expectations, role conflict alsocharacterizes the satisfied-unhealthy pattern. We discuss the practical and theoretical implications ofthese findings.
Keywords: health; job satisfaction; wellbeing; wellbeing misalignment; Millennials
1. Introduction
Employee wellbeing is a multidimensional construct covering various facets and experiences, andit has no single definition [1–3]. However, probably the most influential narrative on wellbeing andhealth in the workplace is the seminal review by Danna and Griffin [4]. After a thorough synthesisof the literature, these authors propose a theoretical framework to organize and direct future theory,research, and practice focused on wellbeing and health in the workplace. In their model, wellbeing isproposed as the broader, encompassing construct that includes two main elements of the organizationalresearch arena. First, the model suggests including both generalized job-related experiences (e.g., jobsatisfaction) and more facet-specific dimensions (satisfaction with co-workers). Second, the model alsosuggests including general health as a sub-component of wellbeing, including mental (e.g., anxiety)or physical indicators (e.g., blood pressure). Based on this model, we study wellbeing at work byfocusing on job satisfaction and mental health as main indicators of employees’ wellbeing.
Ceteris paribus, researchers often assume that job satisfaction and mental health are associatedwith each other in a harmonious way, and this assumption is solidly based on previous meta-analyticalevidence. For instance, a meta-analysis of 22 studies of over 4000 workers in Hong Kong [5] andanother meta-analysis of 485 studies of over 250,000 individuals [6] show that employees with highjob satisfaction also show high levels of mental health. Thus, there is strong evidence that these two
IJERPH 2019, 16, 25; doi:10.3390/ijerph16010025 www.mdpi.com/journal/ijerph297
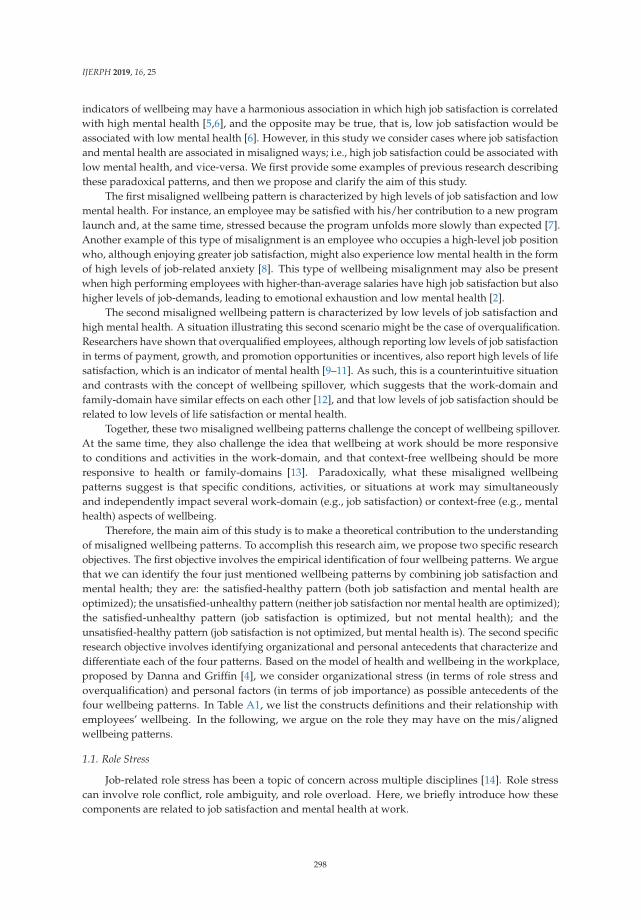
IJERPH 2019, 16, 25
indicators of wellbeing may have a harmonious association in which high job satisfaction is correlatedwith high mental health [5,6], and the opposite may be true, that is, low job satisfaction would beassociated with low mental health [6]. However, in this study we consider cases where job satisfactionand mental health are associated in misaligned ways; i.e., high job satisfaction could be associated withlow mental health, and vice-versa. We first provide some examples of previous research describingthese paradoxical patterns, and then we propose and clarify the aim of this study.
The first misaligned wellbeing pattern is characterized by high levels of job satisfaction and lowmental health. For instance, an employee may be satisfied with his/her contribution to a new programlaunch and, at the same time, stressed because the program unfolds more slowly than expected [7].Another example of this type of misalignment is an employee who occupies a high-level job positionwho, although enjoying greater job satisfaction, might also experience low mental health in the formof high levels of job-related anxiety [8]. This type of wellbeing misalignment may also be presentwhen high performing employees with higher-than-average salaries have high job satisfaction but alsohigher levels of job-demands, leading to emotional exhaustion and low mental health [2].
The second misaligned wellbeing pattern is characterized by low levels of job satisfaction andhigh mental health. A situation illustrating this second scenario might be the case of overqualification.Researchers have shown that overqualified employees, although reporting low levels of job satisfactionin terms of payment, growth, and promotion opportunities or incentives, also report high levels of lifesatisfaction, which is an indicator of mental health [9–11]. As such, this is a counterintuitive situationand contrasts with the concept of wellbeing spillover, which suggests that the work-domain andfamily-domain have similar effects on each other [12], and that low levels of job satisfaction should berelated to low levels of life satisfaction or mental health.
Together, these two misaligned wellbeing patterns challenge the concept of wellbeing spillover.At the same time, they also challenge the idea that wellbeing at work should be more responsiveto conditions and activities in the work-domain, and that context-free wellbeing should be moreresponsive to health or family-domains [13]. Paradoxically, what these misaligned wellbeingpatterns suggest is that specific conditions, activities, or situations at work may simultaneouslyand independently impact several work-domain (e.g., job satisfaction) or context-free (e.g., mentalhealth) aspects of wellbeing.
Therefore, the main aim of this study is to make a theoretical contribution to the understandingof misaligned wellbeing patterns. To accomplish this research aim, we propose two specific researchobjectives. The first objective involves the empirical identification of four wellbeing patterns. We arguethat we can identify the four just mentioned wellbeing patterns by combining job satisfaction andmental health; they are: the satisfied-healthy pattern (both job satisfaction and mental health areoptimized); the unsatisfied-unhealthy pattern (neither job satisfaction nor mental health are optimized);the satisfied-unhealthy pattern (job satisfaction is optimized, but not mental health); and theunsatisfied-healthy pattern (job satisfaction is not optimized, but mental health is). The second specificresearch objective involves identifying organizational and personal antecedents that characterize anddifferentiate each of the four patterns. Based on the model of health and wellbeing in the workplace,proposed by Danna and Griffin [4], we consider organizational stress (in terms of role stress andoverqualification) and personal factors (in terms of job importance) as possible antecedents of thefour wellbeing patterns. In Table A1, we list the constructs definitions and their relationship withemployees’ wellbeing. In the following, we argue on the role they may have on the mis/alignedwellbeing patterns.
1.1. Role Stress
Job-related role stress has been a topic of concern across multiple disciplines [14]. Role stresscan involve role conflict, role ambiguity, and role overload. Here, we briefly introduce how thesecomponents are related to job satisfaction and mental health at work.
298
IJERPH 2019, 16, 25
Role conflict occurs when an employee receives contradictory or incompatible requests fromdifferent parties, or when an employee needs to produce results in different contradictory aspects.Role ambiguity occurs when employees may not have clear information about tasks required by theirroles, which makes them feel uncertain about what actions to take. In today’s workplace context, roleconflict and role ambiguity are salient characteristics in organizational settings. For instance, in complexorganizational environments (e.g., digitalization, job redesign, multicultural works), employees areconstantly required to fulfill multiple expectations and organizational roles that are ambiguous and/orcontradict each other [15–17]. Meta-analytic evidence shows that conflicting and ambiguous rolescorrelate with low job satisfaction and low health [18], corroborating the role theory, which statesthat role conflict and role ambiguity will lead to job dissatisfaction and anxiety [19]. However, thestrength of the effects of role ambiguity and role conflict on job satisfaction and mental health, althoughsignificant, may not be same. Miles [20] indicated that role ambiguity has stronger effects than roleconflict on job satisfaction and mental health. Consistent with this finding, we argue that the strongereffect of role ambiguity, compared to role conflict, on the unsatisfied-unhealthy pattern is still pendingconfirmation. However, we do know that both role ambiguity and role conflict are significantly andnegatively related to job satisfaction and mental health.
Role overload occurs when employees have too much work to do within a limited time or withlimited resources, which increases the demands they must deal with. Role expansion theory states thatmultiple roles are beneficial for the individual because the positive effects of strong engagement in bothpaid work and family life outweigh the possible stressful effects on wellbeing [21]. Thus, engagingin various roles (role overload), although depleting mental health, might have positive outcomes foremployee job satisfaction in terms of earning extra income, privilege, and status security [21,22], whichwould be related to the satisfied-unhealthy wellbeing pattern. However, further research is neededto empirically confirm whether role overload is positively related to job satisfaction, but negativelyrelated to mental health wellbeing.
1.1.1. Job Importance
Some scholars have shown that job importance, as an antecedent of employee wellbeing patterns,is associated with high job satisfaction and life satisfaction [23]. Being satisfied with life may alsobe related to positive mental health [10], which may predict the satisfied-healthy wellbeing pattern.More specifically, studies have shown that jobs that provide employees with job facets that areimportant to them can enhance their job satisfaction and decrease stress [24]. Therefore, we arguethat jobs that provide employees with intrinsic, extrinsic, and social job importance facets enhancejob satisfaction and mental health. Accordingly, based on role theory and empirical evidence on jobimportance, we hypothesize that:
H1: Role conflict, role ambiguity, and job importance will mainly differentiate between the unsatisfied-unhealthyand the satisfied-healthy patterns.
H2: High role overload will characterize employees with the satisfied-unhealthy wellbeing pattern.
1.1.2. Overqualification
Nowadays, overqualification is ubiquitous across European job markets, especially in Italy andSpain, and even more so among younger employees [25–27]. Beyond its ubiquity, overqualificationraises concerns due to its negative effects on job satisfaction. For instance, studies conducted on youngSpanish and Italian employees show that overqualified employees have lower job satisfaction [9,26,28].
Some scholars explain the negative effect of overqualification on job satisfaction based on equitytheory. According to equity theory, employees compare the resources they put into work (such as levelof education, skills, knowledge, experience) to what they receive in return (e.g., payment, recognition,or responsibility), in order to determine their sense of fairness [9]. When they perceive that their inputis greater than what they receive, they develop a sense of unfairness, and as a result, they experience
299
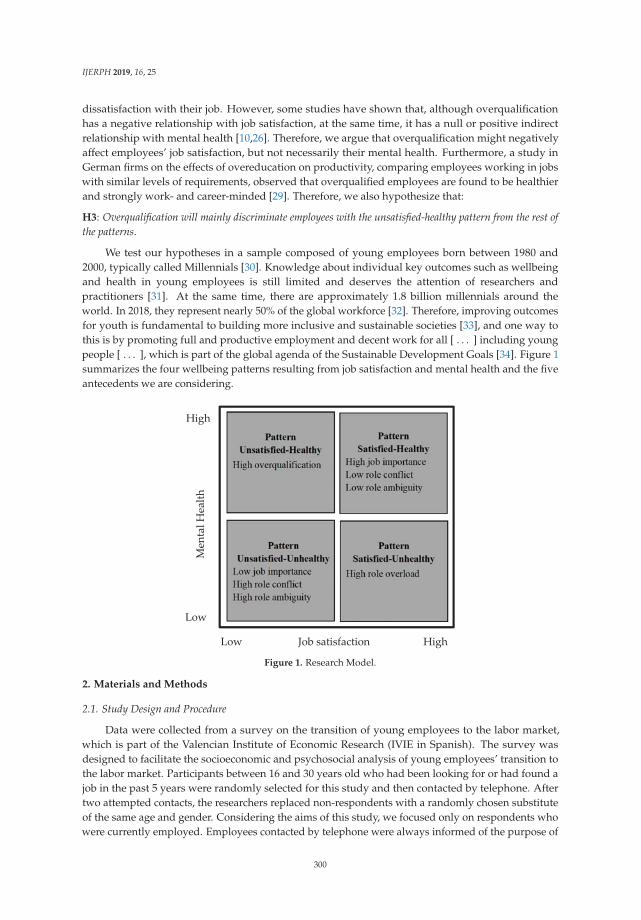
IJERPH 2019, 16, 25
dissatisfaction with their job. However, some studies have shown that, although overqualificationhas a negative relationship with job satisfaction, at the same time, it has a null or positive indirectrelationship with mental health [10,26]. Therefore, we argue that overqualification might negativelyaffect employees’ job satisfaction, but not necessarily their mental health. Furthermore, a study inGerman firms on the effects of overeducation on productivity, comparing employees working in jobswith similar levels of requirements, observed that overqualified employees are found to be healthierand strongly work- and career-minded [29]. Therefore, we also hypothesize that:
H3: Overqualification will mainly discriminate employees with the unsatisfied-healthy pattern from the rest ofthe patterns.
We test our hypotheses in a sample composed of young employees born between 1980 and2000, typically called Millennials [30]. Knowledge about individual key outcomes such as wellbeingand health in young employees is still limited and deserves the attention of researchers andpractitioners [31]. At the same time, there are approximately 1.8 billion millennials around theworld. In 2018, they represent nearly 50% of the global workforce [32]. Therefore, improving outcomesfor youth is fundamental to building more inclusive and sustainable societies [33], and one way tothis is by promoting full and productive employment and decent work for all [ . . . ] including youngpeople [ . . . ], which is part of the global agenda of the Sustainable Development Goals [34]. Figure 1summarizes the four wellbeing patterns resulting from job satisfaction and mental health and the fiveantecedents we are considering.
High
Men
tal H
ealth
High
Low
Job satisfaction Low
Figure 1. Research Model.
2. Materials and Methods
2.1. Study Design and Procedure
Data were collected from a survey on the transition of young employees to the labor market,which is part of the Valencian Institute of Economic Research (IVIE in Spanish). The survey wasdesigned to facilitate the socioeconomic and psychosocial analysis of young employees’ transition tothe labor market. Participants between 16 and 30 years old who had been looking for or had found ajob in the past 5 years were randomly selected for this study and then contacted by telephone. Aftertwo attempted contacts, the researchers replaced non-respondents with a randomly chosen substituteof the same age and gender. Considering the aims of this study, we focused only on respondents whowere currently employed. Employees contacted by telephone were always informed of the purpose of
300
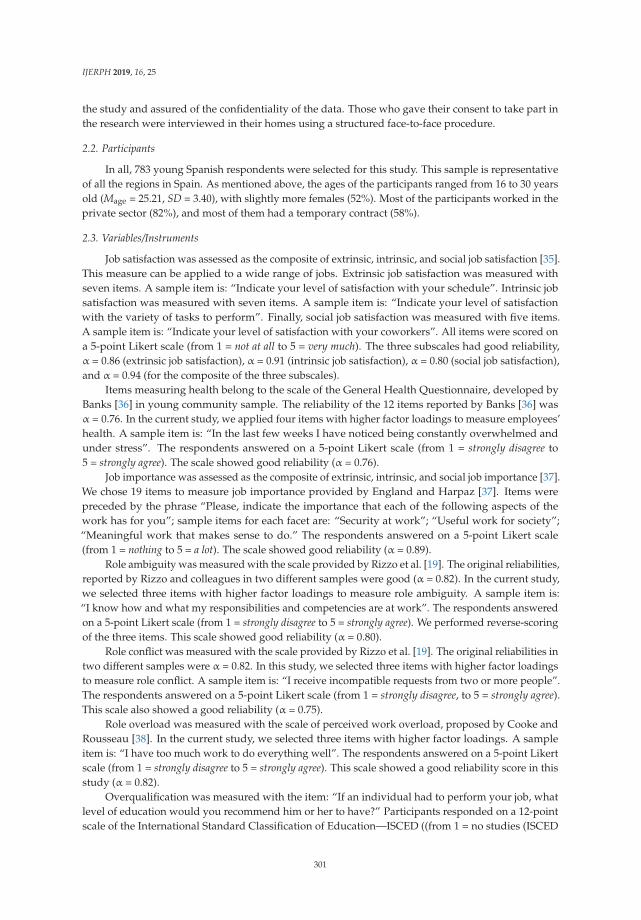
IJERPH 2019, 16, 25
the study and assured of the confidentiality of the data. Those who gave their consent to take part inthe research were interviewed in their homes using a structured face-to-face procedure.
2.2. Participants
In all, 783 young Spanish respondents were selected for this study. This sample is representativeof all the regions in Spain. As mentioned above, the ages of the participants ranged from 16 to 30 yearsold (Mage = 25.21, SD = 3.40), with slightly more females (52%). Most of the participants worked in theprivate sector (82%), and most of them had a temporary contract (58%).
2.3. Variables/Instruments
Job satisfaction was assessed as the composite of extrinsic, intrinsic, and social job satisfaction [35].This measure can be applied to a wide range of jobs. Extrinsic job satisfaction was measured withseven items. A sample item is: “Indicate your level of satisfaction with your schedule”. Intrinsic jobsatisfaction was measured with seven items. A sample item is: “Indicate your level of satisfactionwith the variety of tasks to perform”. Finally, social job satisfaction was measured with five items.A sample item is: “Indicate your level of satisfaction with your coworkers”. All items were scored ona 5-point Likert scale (from 1 = not at all to 5 = very much). The three subscales had good reliability,α = 0.86 (extrinsic job satisfaction), α = 0.91 (intrinsic job satisfaction), α = 0.80 (social job satisfaction),and α = 0.94 (for the composite of the three subscales).
Items measuring health belong to the scale of the General Health Questionnaire, developed byBanks [36] in young community sample. The reliability of the 12 items reported by Banks [36] wasα = 0.76. In the current study, we applied four items with higher factor loadings to measure employees’health. A sample item is: “In the last few weeks I have noticed being constantly overwhelmed andunder stress”. The respondents answered on a 5-point Likert scale (from 1 = strongly disagree to5 = strongly agree). The scale showed good reliability (α = 0.76).
Job importance was assessed as the composite of extrinsic, intrinsic, and social job importance [37].We chose 19 items to measure job importance provided by England and Harpaz [37]. Items werepreceded by the phrase “Please, indicate the importance that each of the following aspects of thework has for you”; sample items for each facet are: “Security at work”; “Useful work for society”;“Meaningful work that makes sense to do.” The respondents answered on a 5-point Likert scale(from 1 = nothing to 5 = a lot). The scale showed good reliability (α = 0.89).
Role ambiguity was measured with the scale provided by Rizzo et al. [19]. The original reliabilities,reported by Rizzo and colleagues in two different samples were good (α = 0.82). In the current study,we selected three items with higher factor loadings to measure role ambiguity. A sample item is:“I know how and what my responsibilities and competencies are at work”. The respondents answeredon a 5-point Likert scale (from 1 = strongly disagree to 5 = strongly agree). We performed reverse-scoringof the three items. This scale showed good reliability (α = 0.80).
Role conflict was measured with the scale provided by Rizzo et al. [19]. The original reliabilities intwo different samples were α = 0.82. In this study, we selected three items with higher factor loadingsto measure role conflict. A sample item is: “I receive incompatible requests from two or more people”.The respondents answered on a 5-point Likert scale (from 1 = strongly disagree, to 5 = strongly agree).This scale also showed a good reliability (α = 0.75).
Role overload was measured with the scale of perceived work overload, proposed by Cooke andRousseau [38]. In the current study, we selected three items with higher factor loadings. A sampleitem is: “I have too much work to do everything well”. The respondents answered on a 5-point Likertscale (from 1 = strongly disagree to 5 = strongly agree). This scale showed a good reliability score in thisstudy (α = 0.82).
Overqualification was measured with the item: “If an individual had to perform your job, whatlevel of education would you recommend him or her to have?” Participants responded on a 12-pointscale of the International Standard Classification of Education—ISCED ((from 1 = no studies (ISCED
301
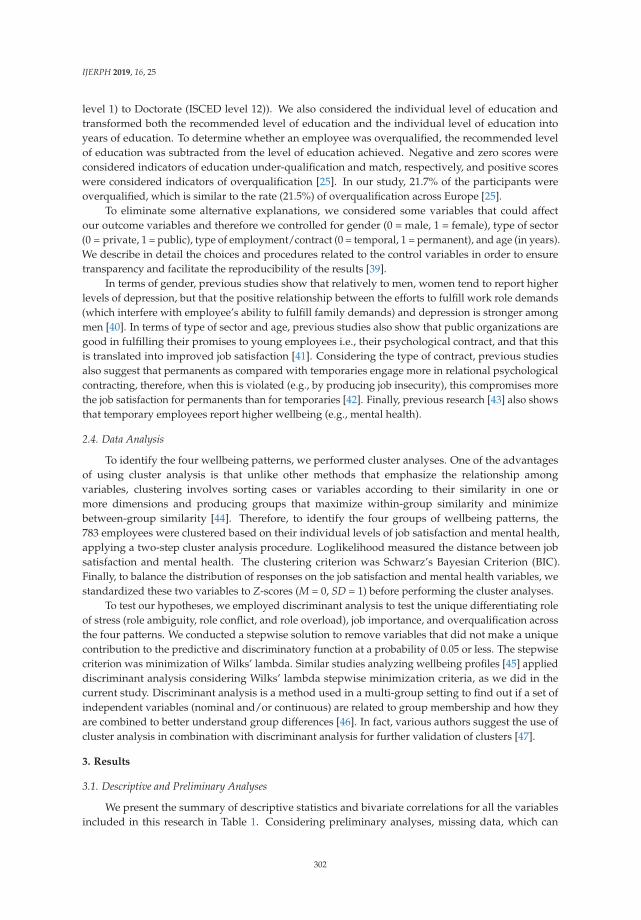
IJERPH 2019, 16, 25
level 1) to Doctorate (ISCED level 12)). We also considered the individual level of education andtransformed both the recommended level of education and the individual level of education intoyears of education. To determine whether an employee was overqualified, the recommended levelof education was subtracted from the level of education achieved. Negative and zero scores wereconsidered indicators of education under-qualification and match, respectively, and positive scoreswere considered indicators of overqualification [25]. In our study, 21.7% of the participants wereoverqualified, which is similar to the rate (21.5%) of overqualification across Europe [25].
To eliminate some alternative explanations, we considered some variables that could affectour outcome variables and therefore we controlled for gender (0 = male, 1 = female), type of sector(0 = private, 1 = public), type of employment/contract (0 = temporal, 1 = permanent), and age (in years).We describe in detail the choices and procedures related to the control variables in order to ensuretransparency and facilitate the reproducibility of the results [39].
In terms of gender, previous studies show that relatively to men, women tend to report higherlevels of depression, but that the positive relationship between the efforts to fulfill work role demands(which interfere with employee’s ability to fulfill family demands) and depression is stronger amongmen [40]. In terms of type of sector and age, previous studies also show that public organizations aregood in fulfilling their promises to young employees i.e., their psychological contract, and that thisis translated into improved job satisfaction [41]. Considering the type of contract, previous studiesalso suggest that permanents as compared with temporaries engage more in relational psychologicalcontracting, therefore, when this is violated (e.g., by producing job insecurity), this compromises morethe job satisfaction for permanents than for temporaries [42]. Finally, previous research [43] also showsthat temporary employees report higher wellbeing (e.g., mental health).
2.4. Data Analysis
To identify the four wellbeing patterns, we performed cluster analyses. One of the advantagesof using cluster analysis is that unlike other methods that emphasize the relationship amongvariables, clustering involves sorting cases or variables according to their similarity in one ormore dimensions and producing groups that maximize within-group similarity and minimizebetween-group similarity [44]. Therefore, to identify the four groups of wellbeing patterns, the783 employees were clustered based on their individual levels of job satisfaction and mental health,applying a two-step cluster analysis procedure. Loglikelihood measured the distance between jobsatisfaction and mental health. The clustering criterion was Schwarz’s Bayesian Criterion (BIC).Finally, to balance the distribution of responses on the job satisfaction and mental health variables, westandardized these two variables to Z-scores (M = 0, SD = 1) before performing the cluster analyses.
To test our hypotheses, we employed discriminant analysis to test the unique differentiating roleof stress (role ambiguity, role conflict, and role overload), job importance, and overqualification acrossthe four patterns. We conducted a stepwise solution to remove variables that did not make a uniquecontribution to the predictive and discriminatory function at a probability of 0.05 or less. The stepwisecriterion was minimization of Wilks’ lambda. Similar studies analyzing wellbeing profiles [45] applieddiscriminant analysis considering Wilks’ lambda stepwise minimization criteria, as we did in thecurrent study. Discriminant analysis is a method used in a multi-group setting to find out if a set ofindependent variables (nominal and/or continuous) are related to group membership and how theyare combined to better understand group differences [46]. In fact, various authors suggest the use ofcluster analysis in combination with discriminant analysis for further validation of clusters [47].
3. Results
3.1. Descriptive and Preliminary Analyses
We present the summary of descriptive statistics and bivariate correlations for all the variablesincluded in this research in Table 1. Considering preliminary analyses, missing data, which can
302
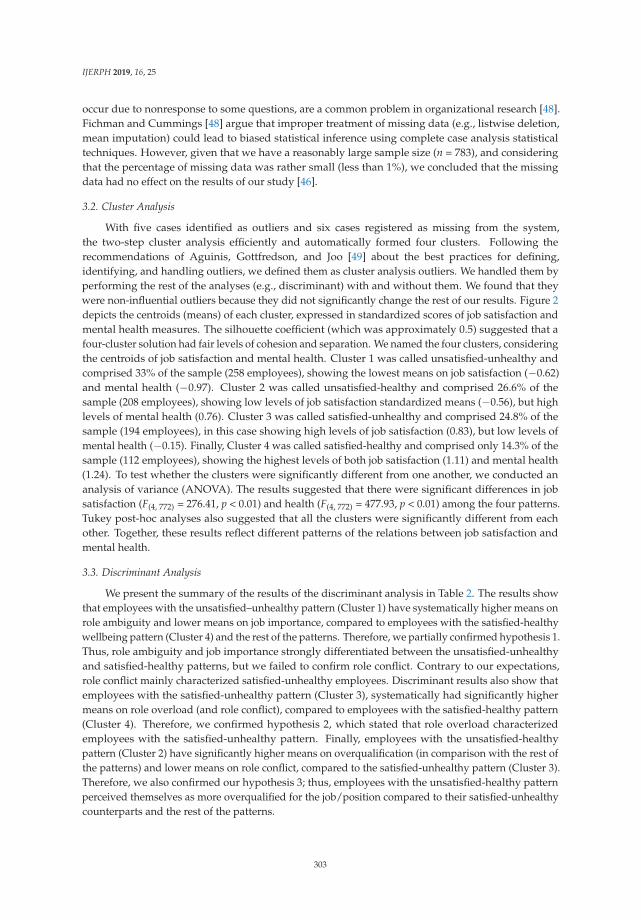
IJERPH 2019, 16, 25
occur due to nonresponse to some questions, are a common problem in organizational research [48].Fichman and Cummings [48] argue that improper treatment of missing data (e.g., listwise deletion,mean imputation) could lead to biased statistical inference using complete case analysis statisticaltechniques. However, given that we have a reasonably large sample size (n = 783), and consideringthat the percentage of missing data was rather small (less than 1%), we concluded that the missingdata had no effect on the results of our study [46].
3.2. Cluster Analysis
With five cases identified as outliers and six cases registered as missing from the system,the two-step cluster analysis efficiently and automatically formed four clusters. Following therecommendations of Aguinis, Gottfredson, and Joo [49] about the best practices for defining,identifying, and handling outliers, we defined them as cluster analysis outliers. We handled them byperforming the rest of the analyses (e.g., discriminant) with and without them. We found that theywere non-influential outliers because they did not significantly change the rest of our results. Figure 2depicts the centroids (means) of each cluster, expressed in standardized scores of job satisfaction andmental health measures. The silhouette coefficient (which was approximately 0.5) suggested that afour-cluster solution had fair levels of cohesion and separation. We named the four clusters, consideringthe centroids of job satisfaction and mental health. Cluster 1 was called unsatisfied-unhealthy andcomprised 33% of the sample (258 employees), showing the lowest means on job satisfaction (−0.62)and mental health (−0.97). Cluster 2 was called unsatisfied-healthy and comprised 26.6% of thesample (208 employees), showing low levels of job satisfaction standardized means (−0.56), but highlevels of mental health (0.76). Cluster 3 was called satisfied-unhealthy and comprised 24.8% of thesample (194 employees), in this case showing high levels of job satisfaction (0.83), but low levels ofmental health (−0.15). Finally, Cluster 4 was called satisfied-healthy and comprised only 14.3% of thesample (112 employees), showing the highest levels of both job satisfaction (1.11) and mental health(1.24). To test whether the clusters were significantly different from one another, we conducted ananalysis of variance (ANOVA). The results suggested that there were significant differences in jobsatisfaction (F(4, 772) = 276.41, p < 0.01) and health (F(4, 772) = 477.93, p < 0.01) among the four patterns.Tukey post-hoc analyses also suggested that all the clusters were significantly different from eachother. Together, these results reflect different patterns of the relations between job satisfaction andmental health.
3.3. Discriminant Analysis
We present the summary of the results of the discriminant analysis in Table 2. The results showthat employees with the unsatisfied–unhealthy pattern (Cluster 1) have systematically higher means onrole ambiguity and lower means on job importance, compared to employees with the satisfied-healthywellbeing pattern (Cluster 4) and the rest of the patterns. Therefore, we partially confirmed hypothesis 1.Thus, role ambiguity and job importance strongly differentiated between the unsatisfied-unhealthyand satisfied-healthy patterns, but we failed to confirm role conflict. Contrary to our expectations,role conflict mainly characterized satisfied-unhealthy employees. Discriminant results also show thatemployees with the satisfied-unhealthy pattern (Cluster 3), systematically had significantly highermeans on role overload (and role conflict), compared to employees with the satisfied-healthy pattern(Cluster 4). Therefore, we confirmed hypothesis 2, which stated that role overload characterizedemployees with the satisfied-unhealthy pattern. Finally, employees with the unsatisfied-healthypattern (Cluster 2) have significantly higher means on overqualification (in comparison with the rest ofthe patterns) and lower means on role conflict, compared to the satisfied-unhealthy pattern (Cluster 3).Therefore, we also confirmed our hypothesis 3; thus, employees with the unsatisfied-healthy patternperceived themselves as more overqualified for the job/position compared to their satisfied-unhealthycounterparts and the rest of the patterns.
303
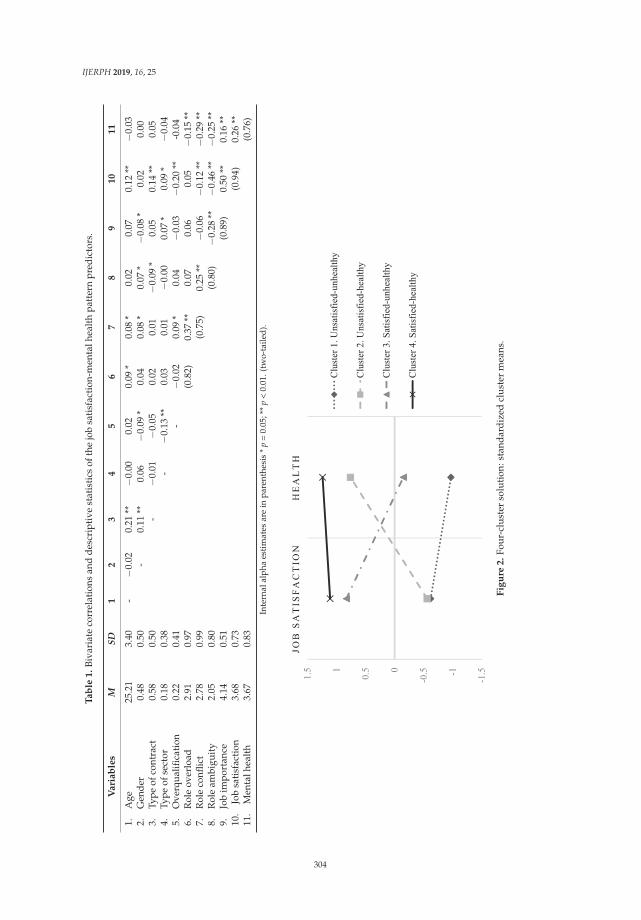
IJERPH 2019, 16, 25
Ta
ble
1.
Biva
riat
eco
rrel
atio
nsan
dde
scri
ptiv
est
atis
tics
ofth
ejo
bsa
tisf
acti
on-m
enta
lhea
lth
patt
ern
pred
icto
rs.
Va
ria
ble
sM
SD1
23
45
67
89
10
11
1.A
ge25
.21
3.40
-−0
.02
0.21
**−0
.00
0.02
0.09
*0.
08*
0.02
0.07
0.12
**−0
.03
2.G
ende
r0.
480.
50-
0.11
**0.
06−0
.09
*0.
040.
08*
0.07
*−0
.08
*0.
020.
003.
Type
ofco
ntra
ct0.
580.
50-
−0.0
1−0
.05
0.02
0.01
−0.0
9*
0.05
0.14
**0.
054.
Type
ofse
ctor
0.18
0.38
-−0
.13
**0.
030.
01−0
.00
0.07
*0.
09*
−0.0
45.
Ove
rqua
lifica
tion
0.22
0.41
-−0
.02
0.09
*0.
04−0
.03
−0.2
0**
-0.0
46.
Rol
eov
erlo
ad2.
910.
97(0
.82)
0.37
**0.
070.
060.
05−0
.15
**7.
Rol
eco
nflic
t2.
780.
99(0
.75)
0.25
**−0
.06
−0.1
2**
−0.2
9**
8.R
ole
ambi
guit
y2.
050.
80(0
.80)
−0.2
8**
−0.4
6**
−0.2
5**
9.Jo
bim
port
ance
4.14
0.51
(0.8
9)0.
50**
0.16
**10
.Jo
bsa
tisf
acti
on3.
680.
73(0
.94)
0.26
**11
.M
enta
lhea
lth
3.67
0.83
(0.7
6)
Inte
rnal
alph
aes
tim
ates
are
inpa
rent
hesi
s*
p=
0.05
;**
p<
0.01
.(tw
o-ta
iled)
.
Fig
ure
2.
Four
-clu
ster
solu
tion
:sta
ndar
dize
dcl
uste
rm
eans
.
304
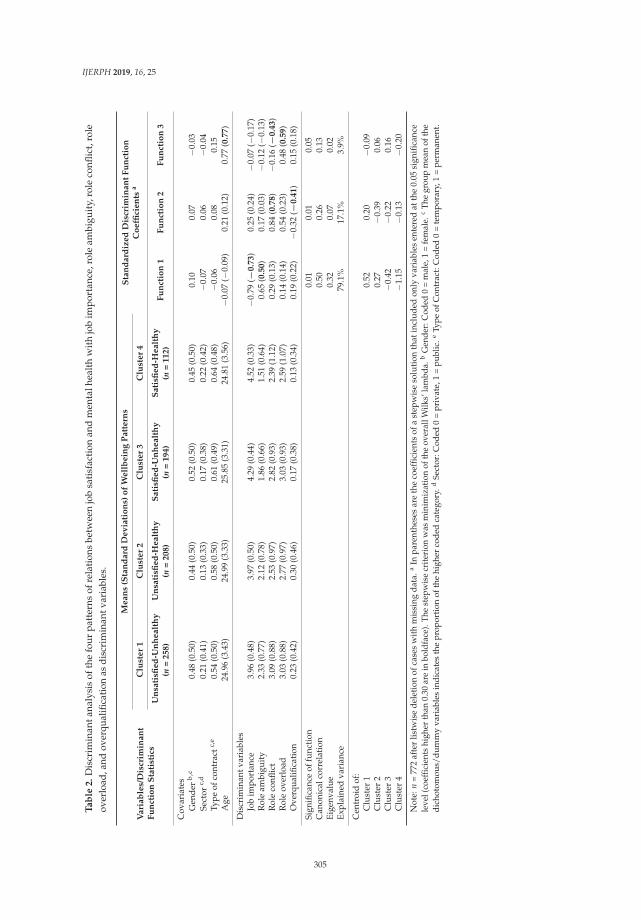
IJERPH 2019, 16, 25
Ta
ble
2.
Dis
crim
inan
tana
lysi
sof
the
four
patt
erns
ofre
lati
ons
betw
een
job
sati
sfac
tion
and
men
talh
ealt
hw
ith
job
impo
rtan
ce,r
ole
ambi
guit
y,ro
leco
nflic
t,ro
leov
erlo
ad,a
ndov
erqu
alifi
cati
onas
disc
rim
inan
tvar
iabl
es.
Vari
ab
les/
Dis
crim
inan
tF
un
ctio
nS
tati
stic
s
Mean
s(S
tan
dard
Dev
iati
on
s)o
fW
ell
bein
gP
att
ern
sS
tan
dard
ized
Dis
crim
inan
tF
un
ctio
nC
oeffi
cien
tsa
Clu
ster
1C
lust
er
2C
lust
er
3C
lust
er
4
Un
sati
sfied
-Un
healt
hy
(n=
258)
Un
sati
sfied
-Healt
hy
(n=
208)
Sati
sfied
-Un
healt
hy
(n=
194)
Sati
sfied
-Healt
hy
(n=
112)
Fu
nct
ion
1F
un
ctio
n2
Fu
nct
ion
3
Cov
aria
tes
Gen
der
b,c
0.48
(0.5
0)0.
44(0
.50)
0.52
(0.5
0)0.
45(0
.50)
0.10
0.07
−0.0
3Se
ctor
c,d
0.21
(0.4
1)0.
13(0
.33)
0.17
(0.3
8)0.
22(0
.42)
−0.0
70.
06−0
.04
Type
ofco
ntra
ctc,
e0.
54(0
.50)
0.58
(0.5
0)0.
61(0
.49)
0.64
(0.4
8)−0
.06
0.08
0.15
Age
24.9
6(3
.43)
24.9
9(3
.33)
25.8
5(3
.31)
24.8
1(3
.56)
−0.0
7(−
0.09
)0.
21(0
.12)
0.77
(0.7
7)
Dis
crim
inan
tvar
iabl
esJo
bim
port
ance
3.96
(0.4
8)3.
97(0
.50)
4.29
(0.4
4)4.
52(0
.33)
−0.7
9(−
0.7
3)
0.25
(0.2
4)−0
.07
(−0.
17)
Rol
eam
bigu
ity
2.33
(0.7
7)2.
12(0
.78)
1.86
(0.6
6)1.
51(0
.64)
0.65
(0.5
0)
0.17
(0.0
3)−0
.12
(−0.
13)
Rol
eco
nflic
t3.
09(0
.88)
2.53
(0.9
7)2.
82(0
.93)
2.39
(1.1
2)0.
29(0
.13)
0.84
(0.7
8)
−0.1
6(−
0.4
3)
Rol
eov
erlo
ad3.
03(0
.88)
2.77
(0.9
7)3.
03(0
.93)
2.59
(1.0
7)0.
14(0
.14)
0.54
(0.2
3)0.
48(0
.59)
Ove
rqua
lifica
tion
0.23
(0.4
2)0.
30(0
.46)
0.17
(0.3
8)0.
13(0
.34)
0.19
(0.2
2)−0
.32
(−0.4
1)
0.15
(0.1
8)
Sign
ifica
nce
offu
ncti
on0.
010.
010.
05C
anon
ical
corr
elat
ion
0.50
0.26
0.13
Eige
nval
ue0.
320.
070.
02Ex
plai
ned
vari
ance
79.1
%17
.1%
3.9%
Cen
troi
dof
:C
lust
er1
0.52
0.20
−0.0
9C
lust
er2
0.27
−0.3
90.
06C
lust
er3
−0.4
2−0
.22
0.16
Clu
ster
4−1
.15
−0.1
3−0
.20
Not
e:n
=77
2af
ter
listw
ise
del
etio
nof
case
sw
ith
mis
sing
dat
a.a
Inpa
rent
hese
sar
eth
eco
effic
ient
sof
ast
epw
ise
solu
tion
that
incl
uded
only
vari
able
sen
tere
dat
the
0.05
sign
ifica
nce
leve
l(co
effic
ient
shi
gher
than
0.30
are
inbo
ldfa
ce).
The
step
wis
ecr
iteri
onw
asm
inim
izat
ion
ofth
eov
eral
lWilk
s’la
mbd
a.b
Gen
der:
Cod
ed0
=m
ale,
1=
fem
ale.
cTh
egr
oup
mea
nof
the
dich
otom
ous/
dum
my
vari
able
sin
dica
tes
the
prop
ortio
nof
the
high
erco
ded
cate
gory
.dSe
ctor
:Cod
ed0
=pr
ivat
e,1
=pu
blic
.eTy
peof
Con
trac
t:C
oded
0=
tem
pora
ry,1
=pe
rman
ent.
305
IJERPH 2019, 16, 25
Together, the results of the discriminant analyses suggest that job importance, role ambiguity, roleconflict, role overload, and overqualification help to differentiate among the four patterns of relationsbetween job satisfaction and mental health. When comparing these variables, job importance and roleambiguity were better at differentiating employees with the unsatisfied-unhealthy pattern from thosewith the satisfied-healthy pattern. Overqualification and role conflict were better at differentiatingbetween employees with the unsatisfied-healthy and satisfied-unhealthy patterns.
4. Discussion
The main aim of this study was to contribute to the theoretical understanding of misalignedwellbeing patterns by considering the profiles emerging from the combination of different levels of jobsatisfaction and mental health. To accomplish this aim, we pursued two research objectives. The firstwas to identify four patterns of employee wellbeing based on a configurational variable that combinesjob satisfaction and mental health. Second, we examined some antecedents that can discriminate eachof the four patterns. The antecedents we considered were role stress (role ambiguity, role conflict, androle overload), job importance, and overqualification.
Results showed that hypothesis 1 was partially confirmed. We confirmed that role ambiguity andjob importance strongly differentiate between the unsatisfied-unhealthy and satisfied-healthy patternsand the rest of the patterns. On the one hand, our findings are aligned with previous studies on roleambiguity showing that the strength of relationships between role ambiguity, and job dissatisfactionand tension/anxiety are generally stronger than those for role conflict [20], whereas other studieshave also shown that role ambiguity has adverse effects on employee job satisfaction and mentalhealth [18,19,50]. On the other hand, with this hypothesis, we also confirmed that employees whoperceive various facets of job importance, such as intrinsic (e.g., learning opportunity), extrinsic (e.g.,job security), and social (e.g., societal contribution) facets, have optimal job satisfaction and mentalhealth, compared to employees who have high role ambiguity. This result is consistent with previousstudies [24].
Contrary to our expectation that role conflict would differentiate employees with theunsatisfied-unhealthy pattern from those with the satisfied-healthy pattern, our results instead showedthat role conflict, along with role overload, characterized employees with the satisfied-unhealthypattern. This result partly supports our hypothesis 2, confirming that role overload characterizesthe satisfied-unhealthy pattern. Thus, role conflict and role overload had negative consequences onmental health, but less on job satisfaction. These results corroborate role expansion theory, whichasserts that employees who engage in multiple roles at the same time receive incentives, status security,and position increments, which in turn have a positive effect on job satisfaction [21,22]. Furthermore,this study also confirms that focusing only on negative consequences of role stress is just one side ofthe issue, as asserted by McGowan et al. [50]. As the Job-Demand Control model indicates, highlydemanding jobs can provide high decision latitude, control, and autonomy for employees, which,in turn, may decrease the negative effects of job demands on job satisfaction, although they can stillproduce negative effects on health [50].
Finally, we confirmed our hypothesis 3. Our argument was that overqualification wouldcharacterize employees with the unsatisfied-healthy wellbeing pattern. Results show that employeeswith higher levels of overqualification were characterized by job dissatisfaction and, at the sametime, showed optimal levels of mental health. They may perceive that the salary, incentives, andother resources they receive from their work are not fair, given their qualifications. This argumentsubstantiates equity theory. According to equity theory, employees compare the resources they putinto the work (such as level of education, skills, knowledge, experience, etc.) to what they receivein return (such as payment, recognition, responsibility, etc.) in order to determine their sense offairness [9]. If they perceive unfairness in what they receive, they may be dissatisfied with their job.Previous studies also have shown that overqualified employees have low job satisfaction [9,26] buthigher satisfaction with their life and better mental health [6,10].
306
IJERPH 2019, 16, 25
We also accomplished our first specific research objective, which was to identify these fourwellbeing patterns involving job satisfaction and mental health. Surprisingly, the most populatedcluster was the unsatisfied-unhealthy pattern, and more than half of our sample had a misalignedpattern i.e., either satisfied-unhealthy or unsatisfied-healthy. Traditionally, job satisfaction and mentalhealth are believed to be harmoniously and positively correlated, with high (or low) job satisfactionpositively correlated with high (or low) mental health. However, this might not always be the case.In this research, we focused on a new research paradigm by studying the combinations of differentlevels of job satisfaction and mental health. By combining different levels of job satisfaction and health,we identified four important wellbeing patterns and their antecedents. We especially focused onthe anomalous or misaligned wellbeing patterns (satisfied-unhealthy or unsatisfied-healthy) as newtypologies. Therefore, we believe that our research findings may motivate scholars to investigate thewellbeing patterns by using the current model as a framework. Furthermore, future studies could alsocombine the effects of role ambiguity, role conflict, role overload, job importance, and overqualificationto move towards more generalizable empirical findings and theory development.
The results that job satisfaction and mental health together form four wellbeing patterns, indicatethe need for theoretical precision; it is in fact important to integrate this complexity into the harmoniousrelationship between job satisfaction and mental health in order to study a broader taxonomy ofrelations and the conditions in which these patterns are elicited. For instance, our study questions themodel of health and wellbeing in the workplace by Danna and Griffin [4], suggesting that it should beintegrated with the four patterns of wellbeing and mental health described here. At the same time,our study questions whether wellbeing spillover always happens. Wellbeing spillover proposes thatwork and family domains of wellbeing have similar effects on one another [12]; therefore, we wouldexpect low levels of job satisfaction to be related to low levels of mental health. Although our studysuggests that this may be the case for the satisfied-healthy and unsatisfied-unhealthy patterns, and theirantecedents in terms of role ambiguity and role importance, our results also suggest that this spillovermay not always take place because spillover may not be present in the misaligned patterns. The resultson their antecedents also suggest that work-related conditions and activities may affect work-domain(e.g., job satisfaction) and context-free (mental health) wellbeing at the same time, which challenges theidea that context-free wellbeing should be more responsive to health or family-domains [13]. We havealready described why role conflict, role overload, and overqualification are separately related to themisaligned patterns, but we identified an alternative interaction explanation. For instance, in theintroduction of this paper we argued that young employees who are overqualified may not haveworse mental health because they may have jobs that do not stress them and that are viewed asstepping-stones to help them achieve higher goals (such as finishing college), all of which lead to theunsatisfied-healthy pattern. Aligned with this idea is that these employees also showed lower levels ofjob importance, thus confirming previous studies that showed that overqualified employees are morecynical about the meaningfulness of their job [51] and such reduce task importance, or significance,depends on how many other overqualified peers work in the same context [52]. We believe that lowlevels of importance to one’s job may be, for young overqualified employees, a way to reduce thecognitive dissonance between their qualification and skill’s usage and this may help in maintaininghigher level of mental health. Therefore, future research should study the boundary conditions of therelationship between the antecedents here described (role conflict, role overload, and overqualification)and the misaligned wellbeing patterns.
Future studies might also investigate other potentially relevant antecedents, or moderators, ofthe mis/alignment between job satisfaction and mental health. In particular, following Danna andGriffin [4] and Nielsen et al. [53], it might be interesting to examine the sector of employment, inparticular if it involves hazardous and stressful work settings (requiring for instance, night shifts ortraveling), job resources as job autonomy, and also HR practices and social support. Literature hasin fact showed that such factors may increase or decrease job satisfaction and wellbeing [4,53], but it
307
IJERPH 2019, 16, 25
should be examined if they differentially affect job satisfaction and mental health, also in relation tothe family status of the employees (single, married, with children) and family history of mental health.
Finally, another major point concerns the sample being studied. The sample is composed ofso-called millennials, thus, a very specific subgroup. These employees might differ in their generalhealth (both mental and physical), wellbeing, satisfaction, etc., from other employees. As a group,millennials are in between twenties and late thirties, thus they do have a better physical health thanolder generations. Nevertheless, their lower tolerance to frustrations and their need to deal and facethe economic crisis (initiated on 2008), which results in fewer career opportunities, may have as aneffect a poorer level of mental health, especially in minor symptoms such as anxiety, life dissatisfaction,etc. Another specific situation of the millennials is that they face the transition from school to work ina situation that is in many cases not favorable. The support from their families, the resignation to haveprecarious/flexible jobs, to get incomes for subsistence or searching for jobs abroad, are some of thedifferent ways of coping with the complex and difficult situation that millennials are facing during theactual economic crisis period.
5. Limitations and Practical Implications
One of the potential limitations of the current study is related to the sample, which is limitedto young Spanish employees. To make better generalizations about the four wellbeing patterns, it isnecessary to document their occurrence in other contexts. However, the sample was representative of allthe regions of Spain, and the independent variables (role stress, job importance, and overqualification)that we tested in this research might be applicable to millennials in other contexts, which could makethe generalization of these research findings more robust. Therefore, this limitation may be at leastpartially neutralized because the procedures and variables we used are applicable to millennials inother contexts. In addition, to test the external validity of the study, it would be useful to replicate itwith millennials in other countries.
Another limitation is related to the measurement of job satisfaction and mental health. In jobsatisfaction measurement, cognitive/subjective biases may affect employees’ evaluations of theirsatisfaction. Similarly, we assessed mental health by using the General Health Questionnaires (GHQ)in terms of a specific time period: ‘during the past few weeks . . . ’. However, events occurring “weeksago” may be poorly recalled, and, therefore, induce some possible inaccuracy in mental processing [3].However, the measurements of both job satisfaction and mental health are based on well validated andaccepted instruments, and so we expect cognitive/personal biases and inaccuracy in mental processingto have little or no impact on the validity of the current research findings.
One of the main aims of organizational psychology is to improve employees’ wellbeing. In thisregard, our taxonomical approach provides relevant empirical evidence, facilitating the achievementof this endeavor. First, by combining job satisfaction and mental health, this study maps synergisticbut also misaligned wellbeing patterns. Second, our study also provides valuable information of somepersonal and organizational variables related to them. In this way, our study informs organizationalpsychologists of when they may be improving at the same time job satisfaction and mental health, butalso when this might not happen, creating misaligned wellbeing patterns instead. Thus, an importantimplication of our study is the provision of a useful wellbeing-pattern taxonomy from where to studyand improve employees’ wellbeing.
We also identify implications for other stakeholders. For instance, our results show that itwould be worthwhile for organizations to find mechanisms to track and ensure the fulfillment oftheir commitments to millennials. Our results show, in fact, that only a small portion of employeesare in the optimal job satisfaction and mental health category, whereas larger portions are in theunsatisfied-unhealthy and misaligned patterns. At the same time, organizations should carefullyconsider HR policies, such as staffing, to establish mechanisms to avoid phenomena such as roleambiguity, role conflict, role overload, and overqualification. These organizational and personalphenomena have been shown to have toxic effects on both job satisfaction and mental health.
308
IJERPH 2019, 16, 25
Third, the results show that job importance is an important mechanism for a sustainableyoung workforce. In our study, young employees who reported having high job importance werecharacterized by being satisfied and healthy. Therefore, we argue that managers and employersshould increase job importance by providing incentives related to job satisfaction and mental health.Often the jobs available for youngsters are “poor” overqualified and in some cases precarious. Thus, itis important that the companies enhance the meaning of work for youngsters offering jobs that arevaluable and meaningful. This is the type of “incentives” that may make work more meaningful foryouth and less toxic, dissatisfying and unhealthy.
6. Conclusions
At the beginning of this paper, we noted that the relationship between job satisfaction andmental health is mainly considered harmonious, and that there is scarce research about theanomalous/misaligned patterns between these two variables. The main aim of this study was toextend the relationship between job satisfaction and mental health by identifying four patterns:satisfied-healthy, satisfied-unhealthy, unsatisfied-healthy, and unsatisfied-unhealthy. This taxonomyseems to provide a valid, interesting, and useful way to study employees’ wellbeing by consideringtheir job satisfaction and mental health. It is our hope that addressing this more extended patternof relationships between the two variables will lead to a possible resolution of the satisfied-healthyconundrum. Thus, the unsatisfied-healthy or satisfied-unhealthy profiles should be the targets offuture research. Moreover, this research has contributed to identifying some organizational andpersonal antecedents that influence and differentiate the four patterns. Future research will need tostudy how stable or dynamic these patterns are over time, and what their consequences are in thelong run. This knowledge will help us to create more effective interventions so that organizations canassist millennials in moving toward a more positive and optimal job satisfaction level and assess itscontribution to health and vice-versa.
Author Contributions: T.A.A. performed formal analyses, visualization, and writing–original draft; Y.A. wasresponsible for the study conception, design, data curation, and writing–review & editing; J.M.P and S.Z.contributed to the conceptualization, project administration, supervision, and writing–review & editing.
Funding: The present study has been prepared with the support of the project PSI2015-64862-R(MINECO/FEDER). It was also supported by the PROGRAM PROMETEO/2016/138 of the GV. The thirdauthor has received a pre-doctoral scholarship, CVU 326153, from the National Council on Science and Technologyof Mexico (CONACYT).
Acknowledgments: The authors also thank the IVIE for the authorization to use the database from the SpanishObservatory of Youth Labor Market Entry and Employment.
Conflicts of Interest: The authors declare no conflicts of interest.
309
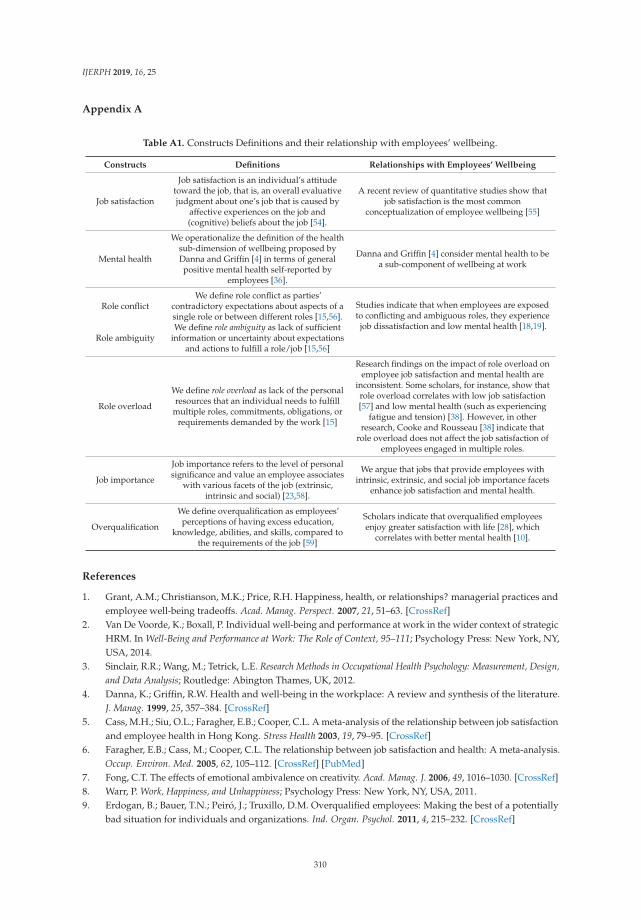
IJERPH 2019, 16, 25
Appendix A
Table A1. Constructs Definitions and their relationship with employees’ wellbeing.
Constructs Definitions Relationships with Employees’ Wellbeing
Job satisfaction
Job satisfaction is an individual’s attitudetoward the job, that is, an overall evaluativejudgment about one’s job that is caused by
affective experiences on the job and(cognitive) beliefs about the job [54].
A recent review of quantitative studies show thatjob satisfaction is the most common
conceptualization of employee wellbeing [55]
Mental health
We operationalize the definition of the healthsub-dimension of wellbeing proposed byDanna and Griffin [4] in terms of generalpositive mental health self-reported by
employees [36].
Danna and Griffin [4] consider mental health to bea sub-component of wellbeing at work
Role conflictWe define role conflict as parties’
contradictory expectations about aspects of asingle role or between different roles [15,56].
Studies indicate that when employees are exposedto conflicting and ambiguous roles, they experience
job dissatisfaction and low mental health [18,19].Role ambiguity
We define role ambiguity as lack of sufficientinformation or uncertainty about expectations
and actions to fulfill a role/job [15,56]
Role overload
We define role overload as lack of the personalresources that an individual needs to fulfill
multiple roles, commitments, obligations, orrequirements demanded by the work [15]
Research findings on the impact of role overload onemployee job satisfaction and mental health are
inconsistent. Some scholars, for instance, show thatrole overload correlates with low job satisfaction[57] and low mental health (such as experiencing
fatigue and tension) [38]. However, in otherresearch, Cooke and Rousseau [38] indicate that
role overload does not affect the job satisfaction ofemployees engaged in multiple roles.
Job importance
Job importance refers to the level of personalsignificance and value an employee associates
with various facets of the job (extrinsic,intrinsic and social) [23,58].
We argue that jobs that provide employees withintrinsic, extrinsic, and social job importance facets
enhance job satisfaction and mental health.
Overqualification
We define overqualification as employees’perceptions of having excess education,
knowledge, abilities, and skills, compared tothe requirements of the job [59]
Scholars indicate that overqualified employeesenjoy greater satisfaction with life [28], which
correlates with better mental health [10].
References
1. Grant, A.M.; Christianson, M.K.; Price, R.H. Happiness, health, or relationships? managerial practices andemployee well-being tradeoffs. Acad. Manag. Perspect. 2007, 21, 51–63. [CrossRef]
2. Van De Voorde, K.; Boxall, P. Individual well-being and performance at work in the wider context of strategicHRM. In Well-Being and Performance at Work: The Role of Context, 95–111; Psychology Press: New York, NY,USA, 2014.
3. Sinclair, R.R.; Wang, M.; Tetrick, L.E. Research Methods in Occupational Health Psychology: Measurement, Design,and Data Analysis; Routledge: Abington Thames, UK, 2012.
4. Danna, K.; Griffin, R.W. Health and well-being in the workplace: A review and synthesis of the literature.J. Manag. 1999, 25, 357–384. [CrossRef]
5. Cass, M.H.; Siu, O.L.; Faragher, E.B.; Cooper, C.L. A meta-analysis of the relationship between job satisfactionand employee health in Hong Kong. Stress Health 2003, 19, 79–95. [CrossRef]
6. Faragher, E.B.; Cass, M.; Cooper, C.L. The relationship between job satisfaction and health: A meta-analysis.Occup. Environ. Med. 2005, 62, 105–112. [CrossRef] [PubMed]
7. Fong, C.T. The effects of emotional ambivalence on creativity. Acad. Manag. J. 2006, 49, 1016–1030. [CrossRef]8. Warr, P. Work, Happiness, and Unhappiness; Psychology Press: New York, NY, USA, 2011.9. Erdogan, B.; Bauer, T.N.; Peiró, J.; Truxillo, D.M. Overqualified employees: Making the best of a potentially
bad situation for individuals and organizations. Ind. Organ. Psychol. 2011, 4, 215–232. [CrossRef]
310
IJERPH 2019, 16, 25
10. Headey, B.; Kelley, J.; Wearing, A. Dimensions of mental health: Life satisfaction, positive affect, anxiety anddepression. Soc. Indic. Res. 1993, 29, 63–82. [CrossRef]
11. Johnson, G.J.; Johnson, W.R. Perceived overqualification and dimensions of job satisfaction: A longitudinalanalysis. J. Psychol. 2000, 134, 537–555. [CrossRef]
12. Ilies, R.; Schwind, K.M.; Heller, D. Employee well-being: A multilevel model linking work and nonworkdomains. Eur. J. Work. Organ. Psychol. 2007, 16, 326–341. [CrossRef]
13. Warr, P. How to think about and measure psychological well-being. In Research Methods in OccupationalHealth Psychology; Wang, M., Sinclair, R.R., Tetrick, L.E., Eds.; Psychology Press/Routledge: New York, NY,USA, 2013; Volume 1, pp. 76–91.
14. Babin, B.J.; Boles, J.S. The effects of perceived co-worker involvement and supervisor support on serviceprovider role stress, performance and job satisfaction. J. Retail. 1996, 72, 57–75. [CrossRef]
15. Peterson, M.F.; Smith, P.B.; Akande, A.; Ayestaran, S.; Bochner, S.; Callan, V.; Francois, P. Role conflict,ambiguity, and overload: A 21-nation study. Acad. Manag. J. 1995, 38, 429–452.
16. Ashforth, B.E.; Rogers, K.M.; Pratt, M.G.; Pradies, C. Ambivalence in organizations: A multilevel approach.Organ. Sci. 2014, 25, 1453–1478. [CrossRef]
17. Keller, R.T. Role conflict and ambiguity: Correlates with job satisfaction and values. Pers. Psychol. 1975, 28,57–64. [CrossRef]
18. Jackson, S.E.; Schuler, R.S. A meta-analysis and conceptual critique of research on role ambiguity and roleconflict in work settings. Organ. Behav. Hum. Decis. Process. 1985, 36, 16–78. [CrossRef]
19. Rizzo, J.R.; House, R.J.; Lirtzman, S.I. Role conflict and ambiguity in complex organizations. Adm. Sci. Q.1970, 15, 150–163. [CrossRef]
20. Miles, R.H. A comparison of the relative impacts of role perceptions of ambiguity and conflict by role.Acad. Manag. J. 1976, 19, 25–35.
21. Nordenmark, M. Multiple social roles and well-being: A longitudinal test of the role stress theory and therole expansion theory. Acta Sociol. 2004, 47, 115–126. [CrossRef]
22. Sieber, S.D. Toward a theory of role accumulation. Am. Sociol. Rev. 1974, 39, 567–578. [CrossRef]23. Iris, B.; Barrett, G.V. Some relations between job and life satisfaction and job importance. J. Appl. Psychol.
1972, 56, 301–304. [CrossRef]24. Thompson, C.A.; Prottas, D.J. Relationships among organizational family support, job autonomy, perceived
control, and employee well-being. J. Occup. Health Psychol. 2006, 11, 100–118. [CrossRef]25. Agut, S.; Peiró, J.M.; Grau, R. The effect of overeducation on job content innovation and career-enhancing
strategies among young Spanish employees. J. Career Dev. 2009, 36, 159–182. [CrossRef]26. Di Pietro, G.; Urwin, P. Education and skills mismatch in the Italian graduate labour market. Appl. Econ.
2006, 38, 79–93. [CrossRef]27. Pouliakas, K. Safeguarding Education Investments: Mitigating Overqualification in the EU; Cedefop: Thessaloniki,
Greece, 2015.28. Peiró, J.M.; Agut, S.; Grau, R. The relationship between overeducation and job satisfaction among young
Spanish workers: The role of salary, contract of employment, and work experience. J. Appl. Soc. Psychol.2010, 40, 666–689. [CrossRef]
29. Büchel, F. The effects of overeducation on productivity in Germany—The firms’ viewpoint. Econ. Educ. Rev.2002, 21, 263–275. [CrossRef]
30. De Hauw, S.; De Vos, A. Millennials’ career perspective and psychological contract expectations: Does therecession lead to lowered expectations? J. Bus. Psychol. 2010, 2, 293–302. [CrossRef]
31. Akkermans, J.; Brenninkmeijer, V.; Blonk, R.W.B.; Koppes, L.L.J. Fresh and healthy? Well-being, health andperformance of young employees with intermediate education. Career Dev. Int. 2009, 14, 671–699. [CrossRef]
32. International Labour Organization. Global Employment Trends for Youth 2013: A Generation at Risk; InternationalLabour Organization: Geneva, Switzerland, 2013.
33. International Labour Organization (ILO). World Employment and Social Outlook: Trends 2015; InternationalLabour Office: Geneva, Switzerland, 2015.
34. Transforming Our World: The 2030 Agenda for Sustainable Development. A/RES/70/1, 70Cong. 2015.Available online: http://research.un.org/en/docs/ga/quick/regular/70 (accessed on 24 October 2018).
35. Warr, P.; Cook, J.; Wall, T. Scales for the measurement of some work attitudes and aspects of psychologicalwell-being. J. Occup. Organ. Psychol. 1979, 52, 129–148. [CrossRef]
311
IJERPH 2019, 16, 25
36. Banks, M.H. Validation of the general health questionnaire in a young community sample. Psychol. Med.1983, 13, 349–353. [CrossRef]
37. England, G.W.; Harpaz, I. Some methodological and analytic considerations in cross-national comparativeresearch. J. Int. Bus. Stud. 1983, 14, 49–59. [CrossRef]
38. Cooke, R.A.; Rousseau, D.M. Stress and strain from family roles and work-role expectations. J. Appl. Psychol.1984, 69, 252–260. [CrossRef]
39. Bernerth, J.B.; Aguinis, H. A critical review and best-practice recommendations for control variable usage.Pers. Psychol. 2016, 69, 229–283. [CrossRef]
40. Frone, M.R.; Russell, M.; Barnes, G.M. Work–family conflict, gender, and health-related outcomes: A study ofemployed parents in two community samples. J. Occup. Health Psychol. 1996, 1, 57–69. [CrossRef] [PubMed]
41. Ayala, Y.; Silla, J.M.P.; Tordera, N.; Lorente, L.; Yeves, J. Job Satisfaction and Innovative Performance inYoung Spanish Employees: Testing New Patterns in the Happy-Productive Worker Thesis—A DiscriminantStudy. J. Happiness Stud. 2017, 18, 1377–1401. [CrossRef]
42. Cuyper, N.; Witte, H. The impact of job insecurity and contract type on attitudes, well-being and behaviouralreports: A psychological contract perspective. J. Occup. Organ. Psychol. 2006, 79, 395–409. [CrossRef]
43. Dawson, C.; Veliziotis, M.; Hopkins, B. Temporary employment, job satisfaction and subjective well-being.Econ. Ind. Democr. 2017, 38, 69–98. [CrossRef]
44. Henry, D.B.; Tolan, P.H.; Gorman-Smith, D. Cluster analysis in family psychology research. J. Fam. Psychol.2005, 19, 121–132. [CrossRef] [PubMed]
45. Keyes, C.L.; Shmotkin, D.; Ryff, C.D. Optimizing well-being: The empirical encounter of two traditions.J. Pers. Soc. Psychol. 2002, 82, 1007–1022. [CrossRef] [PubMed]
46. Raykov, T.; Marcoulides, G.A. An Introduction to Applied Multivariate Analysis; Routledge: Abington Thames,UK, 2012.
47. McIntyre, R.M.; Blashfield, R.K. A nearest-centroid technique for evaluating the minimum-varianceclustering procedure. Multivar. Behav. Res. 1980, 15, 225–238. [CrossRef]
48. Fichman, M.; Cummings, J.N. Multiple imputation for missing data: Making the most of what you know.Organ. Res. Methods 2003, 6, 282–308. [CrossRef]
49. Aguinis, H.; Gottfredson, R.K.; Joo, H. Best-Practice Recommendations for Defining, Identifying, andHandling Outliers. Organ. Res. Methods 2013, 16, 270–301. [CrossRef]
50. McGowan, J.; Gardner, D.; Fletcher, R. Positive and negative affective outcomes of occupational stress. N. Z.J. Psychol. 2006, 35, 92–98.
51. Luksyte, A.; Spitzmueller, C.; Maynard, D.C. Why do overqualified incumbents deviate? Examining multiplemediators. J. Occup. Health Psychol. 2011, 16, 279–296. [CrossRef] [PubMed]
52. Hu, J.; Erdogan, B.; Bauer, T.N.; Jiang, K.; Liu, S.; Li, Y. There are lots of big fish in this pond: The role ofpeer overqualification on task significance, perceived fit, and performance for overqualified employees.J. Appl. Psychol. 2015, 100, 1228–1238. [CrossRef] [PubMed]
53. Nielsen, K.; Nielsen, M.B.; Ogbonnaya, C.; Känsälä, M.; Saari, E.; Isaksson, K. Workplace resources toimprove both employee well-being and performance: A systematic review and meta-analysis. Work. Stress2017, 31, 101–120. [CrossRef]
54. Ziegler, R.; Hagen, B.; Diehl, M. Relationship between job satisfaction and job performance: Job ambivalenceas a moderator. J. Appl. Soc. Psychol. 2012, 42, 2019–2040. [CrossRef]
55. Peiró, J.M. Employees’ hedonic and eudemonic well-being and their performance. Do results matter forprofessional practice? In Proceedings of the 29th International Conference of Applied Psychology (ICAP),Montreal, Canada, 26–30 June 2018.
56. Behrman, D.N.; Perreault, W.D., Jr. A role stress model of the performance and satisfaction of industrialsalespersons. J. Mark. 1984, 48, 9–21. [CrossRef]
57. Beehr, T.A.; Walsh, J.T.; Taber, T.D. Relationships of stress to individually and organizationally valued states:Higher order needs as a moderator. J. Appl. Psychol. 1976, 61, 41–47. [CrossRef]
312

IJERPH 2019, 16, 25
58. McFarlin, D.B.; Rice, R.W. The role of facet importance as a moderator in job satisfaction processes.J. Organ. Behav. 1992, 13, 41–54. [CrossRef]
59. Maynard, D.C.; Joseph, T.A.; Maynard, A.M. Underemployment, job attitudes, and turnover intentions.J. Organ. Behav. 2006, 27, 509–536. [CrossRef]
© 2018 by the authors. Licensee MDPI, Basel, Switzerland. This article is an open accessarticle distributed under the terms and conditions of the Creative Commons Attribution(CC BY) license (http://creativecommons.org/licenses/by/4.0/).
313
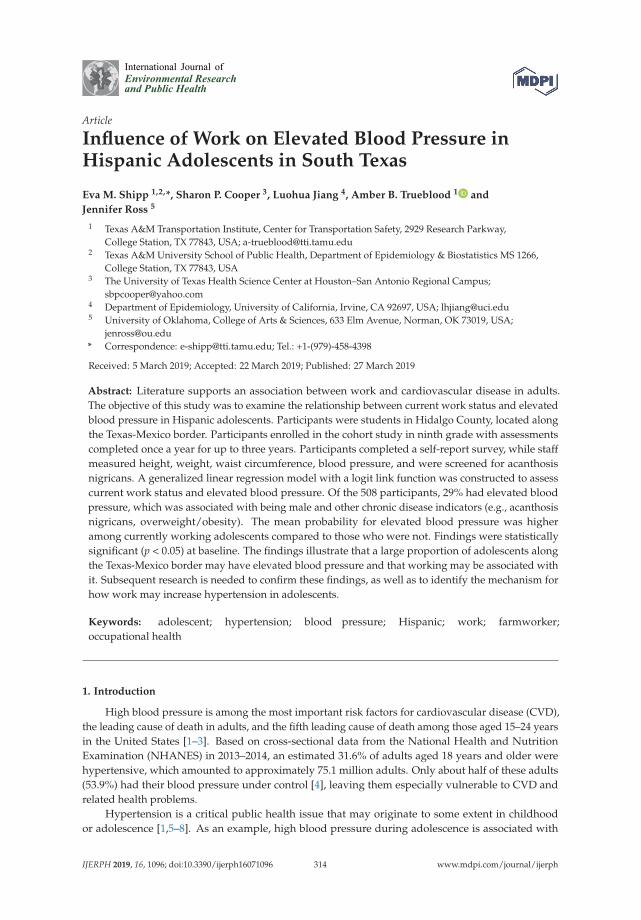
International Journal of
Environmental Research
and Public Health
Article
Influence of Work on Elevated Blood Pressure inHispanic Adolescents in South Texas
Eva M. Shipp 1,2,*, Sharon P. Cooper 3, Luohua Jiang 4, Amber B. Trueblood 1 and
Jennifer Ross 5
1 Texas A&M Transportation Institute, Center for Transportation Safety, 2929 Research Parkway,College Station, TX 77843, USA; [email protected]
2 Texas A&M University School of Public Health, Department of Epidemiology & Biostatistics MS 1266,College Station, TX 77843, USA
3 The University of Texas Health Science Center at Houston–San Antonio Regional Campus;[email protected]
4 Department of Epidemiology, University of California, Irvine, CA 92697, USA; [email protected] University of Oklahoma, College of Arts & Sciences, 633 Elm Avenue, Norman, OK 73019, USA;
[email protected]* Correspondence: [email protected]; Tel.: +1-(979)-458-4398
Received: 5 March 2019; Accepted: 22 March 2019; Published: 27 March 2019
Abstract: Literature supports an association between work and cardiovascular disease in adults.The objective of this study was to examine the relationship between current work status and elevatedblood pressure in Hispanic adolescents. Participants were students in Hidalgo County, located alongthe Texas-Mexico border. Participants enrolled in the cohort study in ninth grade with assessmentscompleted once a year for up to three years. Participants completed a self-report survey, while staffmeasured height, weight, waist circumference, blood pressure, and were screened for acanthosisnigricans. A generalized linear regression model with a logit link function was constructed to assesscurrent work status and elevated blood pressure. Of the 508 participants, 29% had elevated bloodpressure, which was associated with being male and other chronic disease indicators (e.g., acanthosisnigricans, overweight/obesity). The mean probability for elevated blood pressure was higheramong currently working adolescents compared to those who were not. Findings were statisticallysignificant (p < 0.05) at baseline. The findings illustrate that a large proportion of adolescents alongthe Texas-Mexico border may have elevated blood pressure and that working may be associated withit. Subsequent research is needed to confirm these findings, as well as to identify the mechanism forhow work may increase hypertension in adolescents.
Keywords: adolescent; hypertension; blood pressure; Hispanic; work; farmworker;occupational health
1. Introduction
High blood pressure is among the most important risk factors for cardiovascular disease (CVD),the leading cause of death in adults, and the fifth leading cause of death among those aged 15–24 yearsin the United States [1–3]. Based on cross-sectional data from the National Health and NutritionExamination (NHANES) in 2013–2014, an estimated 31.6% of adults aged 18 years and older werehypertensive, which amounted to approximately 75.1 million adults. Only about half of these adults(53.9%) had their blood pressure under control [4], leaving them especially vulnerable to CVD andrelated health problems.
Hypertension is a critical public health issue that may originate to some extent in childhoodor adolescence [1,5–8]. As an example, high blood pressure during adolescence is associated with
IJERPH 2019, 16, 1096; doi:10.3390/ijerph16071096 www.mdpi.com/journal/ijerph314
IJERPH 2019, 16, 1096
persistent cardiovascular alterations that can continue into adulthood [1,7,8]. In addition, nationalsurvey data illustrate that approximately one in ten adolescents screen positive for elevated bloodpressure across the United States. Based on NHANES data from 2011–2012, elevated blood pressure,defined as high or borderline, was reported for 11% of those aged 8–17 years [9]. The prevalence washigher among males (15.4%) versus females (6.8%), Hispanics (11.5%) and non-Hispanic blacks (15.3%)versus non-Hispanic whites (9.4%), and those 13 to 17 years of age (15.0%) versus those 8–12 yearsof age (6.5%) [9]. In 2017, the American Academy of Pediatrics put forth revised clinical practiceguidelines as an update to the 2004 “Fourth Report on the Diagnosis, Evaluation, and Treatmentof High Blood Pressure in Children and Adolescent” [10]. Although the new guidelines are not asubstantial departure from the prior report, applying the criteria to NHANES and other data suggeststhat more children would be classified as having elevated blood pressure and that shorter children aged13 years and younger, and children over 13 years of age of any height may have a greater likelihoodof being diagnosed as hypertensive [11,12]. Sharma and colleagues analyzed NHANES data from1999–2014 and found that the prevalence of elevated blood pressure among children aged 5–18 yearswas 11.8% under the previous guidelines versus 14.2% under the revised guidelines [12].
Along with age, race and ethnicity, it is well known that socioeconomic status, lifestyle factors,nutrition, exercise, and body composition (e.g., excess body fat) play important roles in the occurrenceand prevention of hypertension in adults [13–15]. A growing number of studies provide evidence thatadolescents with elevated blood pressure also may be more likely to consume higher levels of sodium,lower levels of potassium, and more dietary fat; be less physically active; have poorer sleep quality;and be from lower socioeconomic levels [9,16–23]. However, the relationships between potential riskfactors and the magnitude of their association with elevated blood pressure have not been establishedconclusively in younger populations.
Work-related factors are also consistently associated with hypertension in adults. Specific issuesassociated with increased blood pressure include job insecurity, long work hours, low wages, and jobswith poor work organization, as defined by jobs with high demands with low control or jobs thatrequire considerable effort with low reward [24–28]. The exact mechanisms governing how theseissues increase blood pressure is not entirely known. In adult workers, work stress may result inrepeated activation of the autonomic nervous system, which can contribute to high blood pressureand heart disease based on studies with adult workers [29]. In addition, the time spent workingmay simply decrease the amount of time available for physical activity or other healthy behaviors(e.g., healthy diet). This may be especially true for adolescents who already contend with notabletime demands, including attending school, participating in after school activities including teamsports with considerable practice requirements, and helping with family chores and other obligations.Finally, work stress also may increase unhealthy coping behaviors such as excessive food consumption,consuming foods higher in sugar and saturated fat, or consuming alcohol. For example, a study foundthat fast food restaurant use among adolescents was associated with student employment, televisionusage, perceived barriers to healthy eating, and availability of unhealthy foods [30]. In addition,studies on working adolescents illustrate that long work hours contribute to the early onset of alcoholuse [31–34].
The National Institute for Occupational Safety and Health (NIOSH) has recognized for over adecade that a variety of work-related exposures and issues influence overall health and well-being.From this perspective, whether and how work-related factors including stress, workload, and workhours influence health conditions (such as chronic disease) is as important as ensuring a safe workplacein a more traditional sense (e.g., minimizing physical hazards to address acute injuries). In 2011, NIOSHput forth the Total Worker Health Program to continue elevating this issue, spur further research,and promote workplace wellness programs [35]. In line with this holistic approach to worker health,the objective of the present study was to begin examining the relationship between current work statusand elevated blood pressure in adolescents.
315
IJERPH 2019, 16, 1096
2. Materials and Methods
2.1. Study Design
Data for the present study, a secondary analysis, were collected during a prospective cohort studythat was designed to estimate the occurrence of chronic disease indicators among students enrolled ina Migrant Education Program (MEP) and a comparison group of non-MEP students [36]. Studentsqualified for MEP if he or she migrated or had at least one parent who migrated within the prior threeyears to work in agriculture or fishing as a principal means of employment. “Migrated” was definedas moving temporarily to a different school district or administrative area within the United States [36].All students enrolled in ninth grade and in MEP in two public high schools in Hidalgo County,Texas (located along the Texas-Mexico border) were recruited to participate and an equal number ofstudents in the ninth grade who were not enrolled in MEP were randomly sampled as a comparisongroup. Enrollment occurred in 2007 and 2008 with participants followed for up to an additional threeyears (2008–2010). At the baseline and follow-up assessments, participants completed a survey ondemographics, health behaviors, and work characteristics. A minimum clinical examination was alsocompleted, which included measured height, weight, and waist circumference, a noninvasive visualscreening for acanthosis nigricans (AN) on the neck, and blood pressure. Prior to partaking in thestudy, both parental and participant written consent was obtained. Data collection took place eachyear from January to March to accommodate the migration schedule of MEP students. Data collectiontook place in a private area in each school during approximately one class period. All interviewerswere bilingual, certified in ethical standards for research with human subjects, and retrained in studymethods each year to promote adherence to data collection protocols throughout the duration of thestudy. Additional methodological details are provided by Cooper and colleagues (2016) [36].
This study was approved by the Institutional Review Boards at The University of Texas HealthScience Center at Houston (HSC-SPH-07-0284) and Texas A&M University (2010–0878). Writteninformed consent from parents and written child assent was obtained prior to any data collection.
2.2. Sample
A total of 628 students (n = 297 MEP; n = 331 non-MEP) were asked to complete a baselineassessment during the first and second year of recruitment. Of those, 508 enrolled (257 MEP and251 non-MEP) and participated in the baseline assessment for a response proportion of 80.9%. For thefollow-up assessments, participants with a baseline assessment who were still enrolled in schoolwere eligible to participate. Of those, greater than 90% participated in the follow-up assessmentseach year. The available sample size for each study year were as follows: baseline (n = 257 MEP,n = 251 non-MEP), follow-up year 1 (n = 209 MEP, n = 220 non-MEP), follow-up year 2 (n = 165 MEP,n = 181 non-MEP), and follow-up year 3, which only included participants who enrolled during thefirst recruitment year (n = 65 MEP, n = 65 non-MEP). This study focused on the baseline and follow-upyears 1 and 2 only.
2.3. Variable Definitions
Variable definitions and data collection protocols included the following. Staff measured bloodpressure using an automated device, the Omron HEM-907XL (Omron Healthcare, Lake Forest, IL,USA). This ensured measurement consistency across participants and across survey years. Staff appliedthe cuff to students’ right arm with measurements taken on a single occasion. After five minutesof quiet rest, the automated device took three successive measurements, while the participant satin a chair with back support, feet flat on the floor, and arm supported with the antecubital fossa atheart level [36]. Staff recorded the first measurement, but it was not included in analysis, since thesemeasurements can be falsely elevated [36]. Consequently, all analyses included only the average ofthe second and third measurements [36]. The definition of elevated blood pressure was at or abovethe 90th percentile for age, height, and sex or ≥120/80 mm Hg [36]. Staff recorded height to the
316
IJERPH 2019, 16, 1096
nearest 0.1 cm using a Shorr Board stadiometer (Shorr Productions, Olney, MD). Staff measured weightusing a portable Tanita BWB-800S digital scale that was certified to be accurate to 400 pounds eachyear by a professional scale service and maintenance company (Tanita Corporation, Arlington, IL,USA). Overweight or obese categories were based on a body mass index (BMI) at or above the 85thpercentile for age and sex, which follows the BMI-for-age- weight status categories provided by theCenters for Disease Control and Prevention (CDC) [37]. BMI was calculated as weight in kilogramsdivided by the height in meters squared. Waist circumference was measured to the nearest 0.1 cmusing a plastic tape measure that was stretch resistant. A waist circumference at or above the 75thpercentile for age, sex, and ethnicity was defined as abdominal obesity [36]. AN is a dark discolorationand/or thickening of the skin the back of the neck that is used as an indicator of high insulin levelsor resistance. Staff used a similar approach to assess AN as those implemented in a Texas state-wideschool- screening program [36,38,39]. The basis of work status was a self-reported annual work historyof job type, dates of employment, and number of hours worked with survey items modelled after priorstudies with working youth [40,41]. The recall period began from January 1st of the year prior to datacollection with data collection occurring between January through March each year. The definitionof current work status was working for pay or not for pay. The current work status definition wasa student who reported a having a job during the same week when they participated in the survey.The basis of items pertaining to health behaviors was the Youth Risk Behavior Surveillance SystemYRBSS [42].
2.4. Data Management and Analysis
Data were managed using a Microsoft SQL relational database (Microsoft, Redmond, WA, USA).All data were double entered into the database to minimize data entry errors, as well as computeredited for out-of-range and contradictory values. SAS 9.4 was used for all data analysis (SAS InstituteInc., Cary, NC, USA). Descriptive statistics included means and proportions at baseline and years offollow-up. Appropriate statistical tests including chi-square tests, t-tests, and Fisher’s exact tests wereused to compare the distribution of variables across the two schools and by elevated blood pressurestatus. Generalized linear mixed models with a logit link function and binomial distribution wereused to estimate the probability of high or high normal blood pressure at each time period by currentwork status after adjusting for potential confounders, including age, gender, AN, BMI, number of daysphysically active in the past 7 days, and school enrolled. Random intercepts at the individual levelwere also included in these models to account for potential correlation of repeated measures from thesame student. Statistical significance was set a priori at a level of alpha <0.05.
3. Results
3.1. Participants
Table 1 presents baseline characteristics of participants stratified by school. Overall at baseline,half of participants were male with a mean age of 15.0 years. The place of birth for the majority ofparticipants was the United States (92%). As previously reported in Cooper et al. (2016), a majorityof participants self-identified as Hispanic, Latino, or Mexican-American (97%) and used English tocomplete the survey (79%) (data not shown) [36]. A larger proportion (62%) were enrolled in School 2than School 1. At baseline, the distribution of demographic and other variables was similar in Schools1 and 2 with two exceptions. School 2 had a larger percentage of participants who worked in theprevious year compared to School 1, 54% and 67%, respectively (p = 0.01). However, the prevalenceof being currently employed was not statistically different at baseline. School 2 also had a largerpercentage of participants who had elevated blood pressure compared to School 1, 33% and 23%,respectively (p = 0.01).
317
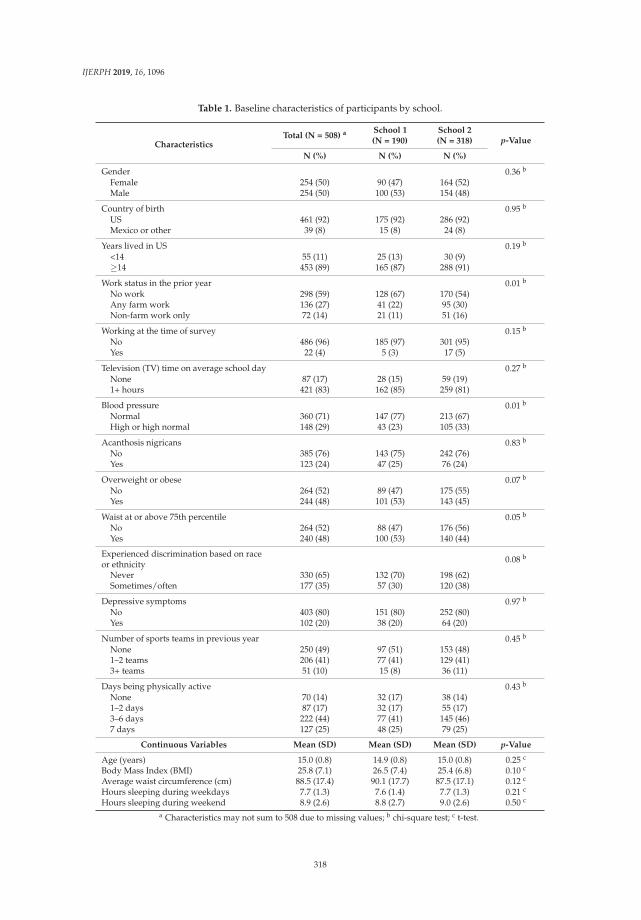
IJERPH 2019, 16, 1096
Table 1. Baseline characteristics of participants by school.
CharacteristicsTotal (N = 508) a School 1
(N = 190)School 2(N = 318) p-Value
N (%) N (%) N (%)
Gender 0.36 b
Female 254 (50) 90 (47) 164 (52)Male 254 (50) 100 (53) 154 (48)
Country of birth 0.95 b
US 461 (92) 175 (92) 286 (92)Mexico or other 39 (8) 15 (8) 24 (8)
Years lived in US 0.19 b
<14 55 (11) 25 (13) 30 (9)≥14 453 (89) 165 (87) 288 (91)
Work status in the prior year 0.01 b
No work 298 (59) 128 (67) 170 (54)Any farm work 136 (27) 41 (22) 95 (30)Non-farm work only 72 (14) 21 (11) 51 (16)
Working at the time of survey 0.15 b
No 486 (96) 185 (97) 301 (95)Yes 22 (4) 5 (3) 17 (5)
Television (TV) time on average school day 0.27 b
None 87 (17) 28 (15) 59 (19)1+ hours 421 (83) 162 (85) 259 (81)
Blood pressure 0.01 b
Normal 360 (71) 147 (77) 213 (67)High or high normal 148 (29) 43 (23) 105 (33)
Acanthosis nigricans 0.83 b
No 385 (76) 143 (75) 242 (76)Yes 123 (24) 47 (25) 76 (24)
Overweight or obese 0.07 b
No 264 (52) 89 (47) 175 (55)Yes 244 (48) 101 (53) 143 (45)
Waist at or above 75th percentile 0.05 b
No 264 (52) 88 (47) 176 (56)Yes 240 (48) 100 (53) 140 (44)
Experienced discrimination based on raceor ethnicity 0.08 b
Never 330 (65) 132 (70) 198 (62)Sometimes/often 177 (35) 57 (30) 120 (38)
Depressive symptoms 0.97 b
No 403 (80) 151 (80) 252 (80)Yes 102 (20) 38 (20) 64 (20)
Number of sports teams in previous year 0.45 b
None 250 (49) 97 (51) 153 (48)1–2 teams 206 (41) 77 (41) 129 (41)3+ teams 51 (10) 15 (8) 36 (11)
Days being physically active 0.43 b
None 70 (14) 32 (17) 38 (14)1–2 days 87 (17) 32 (17) 55 (17)3–6 days 222 (44) 77 (41) 145 (46)7 days 127 (25) 48 (25) 79 (25)
Continuous Variables Mean (SD) Mean (SD) Mean (SD) p-Value
Age (years) 15.0 (0.8) 14.9 (0.8) 15.0 (0.8) 0.25 c
Body Mass Index (BMI) 25.8 (7.1) 26.5 (7.4) 25.4 (6.8) 0.10 c
Average waist circumference (cm) 88.5 (17.4) 90.1 (17.7) 87.5 (17.1) 0.12 c
Hours sleeping during weekdays 7.7 (1.3) 7.6 (1.4) 7.7 (1.3) 0.21 c
Hours sleeping during weekend 8.9 (2.6) 8.8 (2.7) 9.0 (2.6) 0.50 c
a Characteristics may not sum to 508 due to missing values; b chi-square test; c t-test.
318
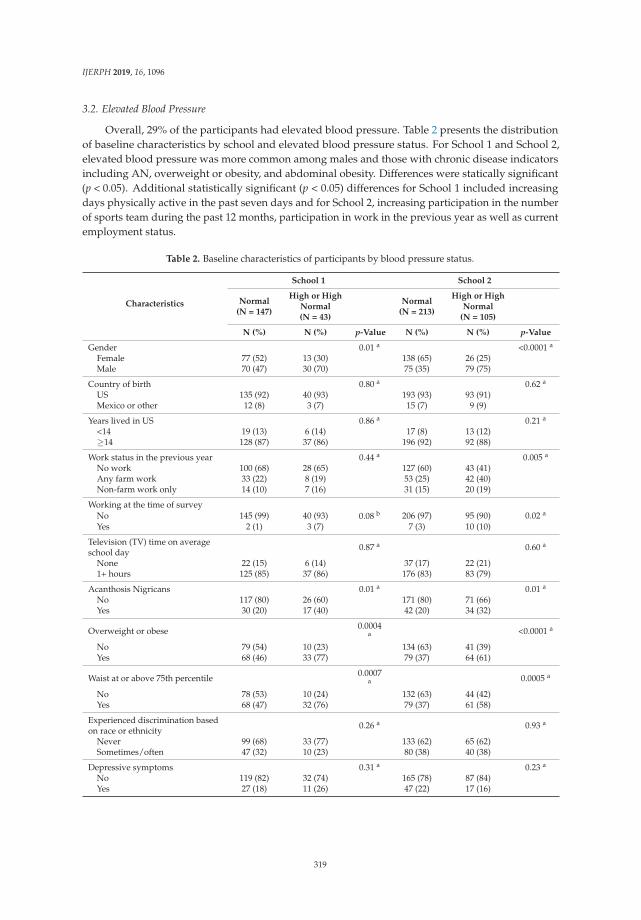
IJERPH 2019, 16, 1096
3.2. Elevated Blood Pressure
Overall, 29% of the participants had elevated blood pressure. Table 2 presents the distributionof baseline characteristics by school and elevated blood pressure status. For School 1 and School 2,elevated blood pressure was more common among males and those with chronic disease indicatorsincluding AN, overweight or obesity, and abdominal obesity. Differences were statically significant(p < 0.05). Additional statistically significant (p < 0.05) differences for School 1 included increasingdays physically active in the past seven days and for School 2, increasing participation in the numberof sports team during the past 12 months, participation in work in the previous year as well as currentemployment status.
Table 2. Baseline characteristics of participants by blood pressure status.
Characteristics
School 1 School 2
Normal(N = 147)
High or HighNormal(N = 43)
Normal(N = 213)
High or HighNormal
(N = 105)
N (%) N (%) p-Value N (%) N (%) p-Value
Gender 0.01 a <0.0001 a
Female 77 (52) 13 (30) 138 (65) 26 (25)Male 70 (47) 30 (70) 75 (35) 79 (75)
Country of birth 0.80 a 0.62 a
US 135 (92) 40 (93) 193 (93) 93 (91)Mexico or other 12 (8) 3 (7) 15 (7) 9 (9)
Years lived in US 0.86 a 0.21 a
<14 19 (13) 6 (14) 17 (8) 13 (12)≥14 128 (87) 37 (86) 196 (92) 92 (88)
Work status in the previous year 0.44 a 0.005 a
No work 100 (68) 28 (65) 127 (60) 43 (41)Any farm work 33 (22) 8 (19) 53 (25) 42 (40)Non-farm work only 14 (10) 7 (16) 31 (15) 20 (19)
Working at the time of surveyNo 145 (99) 40 (93) 0.08 b 206 (97) 95 (90) 0.02 a
Yes 2 (1) 3 (7) 7 (3) 10 (10)
Television (TV) time on averageschool day 0.87 a 0.60 a
None 22 (15) 6 (14) 37 (17) 22 (21)1+ hours 125 (85) 37 (86) 176 (83) 83 (79)
Acanthosis Nigricans 0.01 a 0.01 a
No 117 (80) 26 (60) 171 (80) 71 (66)Yes 30 (20) 17 (40) 42 (20) 34 (32)
Overweight or obese 0.0004a <0.0001 a
No 79 (54) 10 (23) 134 (63) 41 (39)Yes 68 (46) 33 (77) 79 (37) 64 (61)
Waist at or above 75th percentile 0.0007a 0.0005 a
No 78 (53) 10 (24) 132 (63) 44 (42)Yes 68 (47) 32 (76) 79 (37) 61 (58)
Experienced discrimination basedon race or ethnicity 0.26 a 0.93 a
Never 99 (68) 33 (77) 133 (62) 65 (62)Sometimes/often 47 (32) 10 (23) 80 (38) 40 (38)
Depressive symptoms 0.31 a 0.23 a
No 119 (82) 32 (74) 165 (78) 87 (84)Yes 27 (18) 11 (26) 47 (22) 17 (16)
319
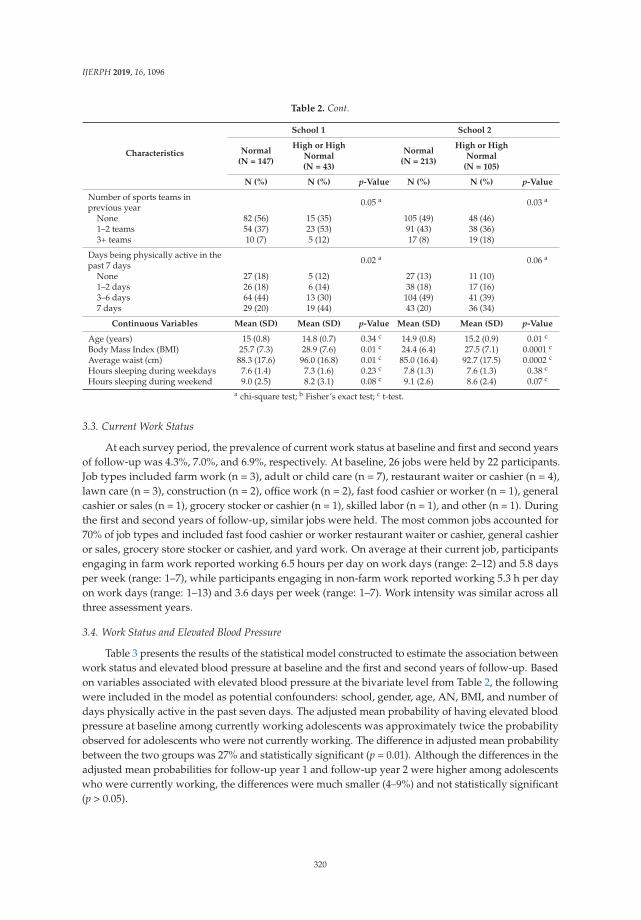
IJERPH 2019, 16, 1096
Table 2. Cont.
Characteristics
School 1 School 2
Normal(N = 147)
High or HighNormal(N = 43)
Normal(N = 213)
High or HighNormal
(N = 105)
N (%) N (%) p-Value N (%) N (%) p-Value
Number of sports teams inprevious year 0.05 a 0.03 a
None 82 (56) 15 (35) 105 (49) 48 (46)1–2 teams 54 (37) 23 (53) 91 (43) 38 (36)3+ teams 10 (7) 5 (12) 17 (8) 19 (18)
Days being physically active in thepast 7 days 0.02 a 0.06 a
None 27 (18) 5 (12) 27 (13) 11 (10)1–2 days 26 (18) 6 (14) 38 (18) 17 (16)3–6 days 64 (44) 13 (30) 104 (49) 41 (39)7 days 29 (20) 19 (44) 43 (20) 36 (34)
Continuous Variables Mean (SD) Mean (SD) p-Value Mean (SD) Mean (SD) p-Value
Age (years) 15 (0.8) 14.8 (0.7) 0.34 c 14.9 (0.8) 15.2 (0.9) 0.01 c
Body Mass Index (BMI) 25.7 (7.3) 28.9 (7.6) 0.01 c 24.4 (6.4) 27.5 (7.1) 0.0001 c
Average waist (cm) 88.3 (17.6) 96.0 (16.8) 0.01 c 85.0 (16.4) 92.7 (17.5) 0.0002 c
Hours sleeping during weekdays 7.6 (1.4) 7.3 (1.6) 0.23 c 7.8 (1.3) 7.6 (1.3) 0.38 c
Hours sleeping during weekend 9.0 (2.5) 8.2 (3.1) 0.08 c 9.1 (2.6) 8.6 (2.4) 0.07 c
a chi-square test; b Fisher’s exact test; c t-test.
3.3. Current Work Status
At each survey period, the prevalence of current work status at baseline and first and second yearsof follow-up was 4.3%, 7.0%, and 6.9%, respectively. At baseline, 26 jobs were held by 22 participants.Job types included farm work (n = 3), adult or child care (n = 7), restaurant waiter or cashier (n = 4),lawn care (n = 3), construction (n = 2), office work (n = 2), fast food cashier or worker (n = 1), generalcashier or sales (n = 1), grocery stocker or cashier (n = 1), skilled labor (n = 1), and other (n = 1). Duringthe first and second years of follow-up, similar jobs were held. The most common jobs accounted for70% of job types and included fast food cashier or worker restaurant waiter or cashier, general cashieror sales, grocery store stocker or cashier, and yard work. On average at their current job, participantsengaging in farm work reported working 6.5 hours per day on work days (range: 2–12) and 5.8 daysper week (range: 1–7), while participants engaging in non-farm work reported working 5.3 h per dayon work days (range: 1–13) and 3.6 days per week (range: 1–7). Work intensity was similar across allthree assessment years.
3.4. Work Status and Elevated Blood Pressure
Table 3 presents the results of the statistical model constructed to estimate the association betweenwork status and elevated blood pressure at baseline and the first and second years of follow-up. Basedon variables associated with elevated blood pressure at the bivariate level from Table 2, the followingwere included in the model as potential confounders: school, gender, age, AN, BMI, and number ofdays physically active in the past seven days. The adjusted mean probability of having elevated bloodpressure at baseline among currently working adolescents was approximately twice the probabilityobserved for adolescents who were not currently working. The difference in adjusted mean probabilitybetween the two groups was 27% and statistically significant (p = 0.01). Although the differences in theadjusted mean probabilities for follow-up year 1 and follow-up year 2 were higher among adolescentswho were currently working, the differences were much smaller (4–9%) and not statistically significant(p > 0.05).
320
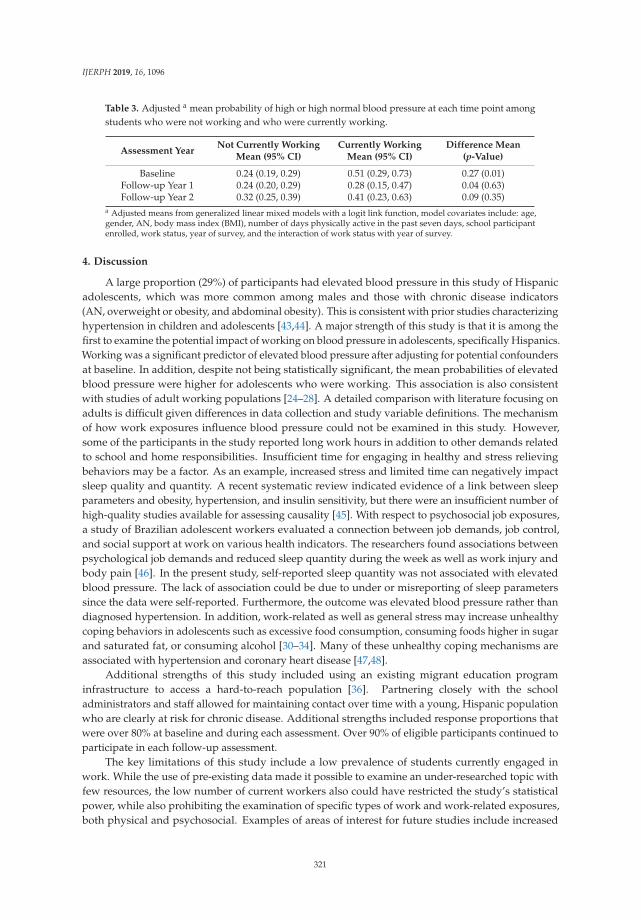
IJERPH 2019, 16, 1096
Table 3. Adjusted a mean probability of high or high normal blood pressure at each time point amongstudents who were not working and who were currently working.
Assessment YearNot Currently Working
Mean (95% CI)Currently Working
Mean (95% CI)Difference Mean
(p-Value)
Baseline 0.24 (0.19, 0.29) 0.51 (0.29, 0.73) 0.27 (0.01)Follow-up Year 1 0.24 (0.20, 0.29) 0.28 (0.15, 0.47) 0.04 (0.63)Follow-up Year 2 0.32 (0.25, 0.39) 0.41 (0.23, 0.63) 0.09 (0.35)
a Adjusted means from generalized linear mixed models with a logit link function, model covariates include: age,gender, AN, body mass index (BMI), number of days physically active in the past seven days, school participantenrolled, work status, year of survey, and the interaction of work status with year of survey.
4. Discussion
A large proportion (29%) of participants had elevated blood pressure in this study of Hispanicadolescents, which was more common among males and those with chronic disease indicators(AN, overweight or obesity, and abdominal obesity). This is consistent with prior studies characterizinghypertension in children and adolescents [43,44]. A major strength of this study is that it is among thefirst to examine the potential impact of working on blood pressure in adolescents, specifically Hispanics.Working was a significant predictor of elevated blood pressure after adjusting for potential confoundersat baseline. In addition, despite not being statistically significant, the mean probabilities of elevatedblood pressure were higher for adolescents who were working. This association is also consistentwith studies of adult working populations [24–28]. A detailed comparison with literature focusing onadults is difficult given differences in data collection and study variable definitions. The mechanismof how work exposures influence blood pressure could not be examined in this study. However,some of the participants in the study reported long work hours in addition to other demands relatedto school and home responsibilities. Insufficient time for engaging in healthy and stress relievingbehaviors may be a factor. As an example, increased stress and limited time can negatively impactsleep quality and quantity. A recent systematic review indicated evidence of a link between sleepparameters and obesity, hypertension, and insulin sensitivity, but there were an insufficient number ofhigh-quality studies available for assessing causality [45]. With respect to psychosocial job exposures,a study of Brazilian adolescent workers evaluated a connection between job demands, job control,and social support at work on various health indicators. The researchers found associations betweenpsychological job demands and reduced sleep quantity during the week as well as work injury andbody pain [46]. In the present study, self-reported sleep quantity was not associated with elevatedblood pressure. The lack of association could be due to under or misreporting of sleep parameterssince the data were self-reported. Furthermore, the outcome was elevated blood pressure rather thandiagnosed hypertension. In addition, work-related as well as general stress may increase unhealthycoping behaviors in adolescents such as excessive food consumption, consuming foods higher in sugarand saturated fat, or consuming alcohol [30–34]. Many of these unhealthy coping mechanisms areassociated with hypertension and coronary heart disease [47,48].
Additional strengths of this study included using an existing migrant education programinfrastructure to access a hard-to-reach population [36]. Partnering closely with the schooladministrators and staff allowed for maintaining contact over time with a young, Hispanic populationwho are clearly at risk for chronic disease. Additional strengths included response proportions thatwere over 80% at baseline and during each assessment. Over 90% of eligible participants continued toparticipate in each follow-up assessment.
The key limitations of this study include a low prevalence of students currently engaged inwork. While the use of pre-existing data made it possible to examine an under-researched topic withfew resources, the low number of current workers also could have restricted the study’s statisticalpower, while also prohibiting the examination of specific types of work and work-related exposures,both physical and psychosocial. Examples of areas of interest for future studies include increased
321
IJERPH 2019, 16, 1096
time demands and long work hours combined with other non-work demands on time, psychosocialjob stress, and physical job exposures. Future research is needed that addresses other populationsbeyond Hispanics and that which is designed and powered specifically to examine specific workexposures within the context of nutritional and other risk factors. Another important limitation is ahigh rate of attrition due to school drop-out, relocating to another school district, and early graduation.Approximately 25% of those in the baseline assessment were no longer eligible to participant in thesecond follow-up assessment. A subsequent pilot study examined the impact of this loss to follow-up.Blood pressure levels were higher in those who dropped out; however levels were not significantlydifferent when compared to those who remained in the study [36]. This loss to follow-up may havecontributed to only a minimal average difference in elevated blood pressure levels comparing thosecurrently working with those who were not in the follow-up assessments. Beyond the potentialimpact of loss to follow-up, the reason for the lack of an association across all years is not clear.It also could be that participants learned better skills for coping with stress and time demands asthey aged. The variables collected for this study along with the sample size were not sufficient forexamining these relationships further. The study design also did not allow diagnosis of high bloodpressure in any single year. Guidelines recommend observing elevations in blood pressure on threeseparate occasions prior to making a diagnosis [10]. Finally, this study did not include an in-depthdietary assessment, which is a limitation given the known associations between diet and elevatedblood pressure. This would be of particular concern if the working students ate a poorer diet thannon-working students.
5. Conclusions
As CVD remains the leading cause of death in adults and the fifth leading cause of death forthose aged 15–24 years old, there is a critical need for additional research and interventions to addressCVD risk factors, such as high blood pressure [1–3]. In addition, as literature supports that CVDmay originate during childhood or adolescence, it is vital to address these risk factors at this criticalperiod [1,5–8]. In this study, working may have increased the risk of high blood pressure in adolescents,specifically those who are in their early high school years. Future studies based on a larger sampleof workers are needed to confirm the present study’s findings and estimate the association betweenspecific work-related exposures and elevated blood pressure, while accounting for nutritional andother potential risk factors. Future research could also identify the specific mechanism of how workstatus may increase hypertension in adolescents. The findings from this study provide a motivationfor subsequent research in the areas of working youth and high blood pressure.
Author Contributions: E.M.S. assisted in design of the original study and served as the project manager.She oversaw data collection and data management for the study and assisted in the data analysis and interpretationof findings. She was responsible for overall manuscript development. S.P.C. was the principal investigator for thestudy. She was responsible for its design and overall conduct. She assisted in the interpretation of study findingsand edited the manuscript. L.J. developed the analysis plan and was responsible for executing the data analysis.A.B.T. assisted in the literature review and overall manuscript development. J.R. assisted in the literature review,development of the manuscript, and final manuscript review.
Funding: This paper was supported by CDC/NIOSH under Cooperative Agreement No. U50 OH07541 to theSouthwest Center for Agricultural Health, Injury Prevention, and Education at the University of Texas HealthScience Center at Tyler. Its contents are solely the responsibility of the authors and do not necessarily representthe official views of CDC/NIOSH.
Acknowledgments: We would like to especially thank Yolanda Morado from Texas A&M AgriLife Extension forsupporting this project and her dedication toward improving the health of families along the Texas-Mexico border.We would like to thank the students who participated and the school administrators, teachers and staff who madethis study possible, specifically Linda Taormina.
Conflicts of Interest: None of the authors have a financial or non-financial competing interest with respect to thestudy and information presented in this manuscript.
322
IJERPH 2019, 16, 1096
References
1. Bloetzer, C.; Bovet, P.; Joan-Carles Suris Simeoni, U.; Paradis, G.; Chiolero, A. Screening for cardiovasculardisease risk factors beginning in childhood. Public Health Rev. 2015, 36. [CrossRef]
2. Leading Causes of Death. Available online: https://www.cdc.gov/nchs/fastats/leading-causes-of-death.htm(accessed on 25 March 2019).
3. National Center for Health Statistics. Health, United States, 2016: With Chartbook on Long-Term Trends in Health;National Center for Health Statistics: Hyattsville, MD, USA, 2016.
4. Zhang, Y.; Moran, A.E. Trends in the prevalence, awareness, treatment, and control of hypertension amongyoung adults in the United States, 1999 to 2014. Hypertension 2017, 70, 736–742. [CrossRef]
5. Berenson, G.S.; Srinivasan, S.R.; Bao, W.; Newman, W.P.; Tracy, R.E.; Wattigney, W.A. Association betweenmultiple cardiovascular risk factors and atherosclerosis in children and young adults. N. Engl. J. Med. 1998,338, 1650–1656. [CrossRef]
6. Berenson, G.S.; Wattigney, W.A.; Tracy, R.E.; Newman, W.P.; Srinivasan, S.R.; Webber, L.S.; Dalferes, E.R.;Strong, J.P. Atherosclerosis of the aorta and coronary arteries and cardiovascular risk factors in personsaged 6 to 30 years and studied at necropsy (The Bogalusa Heart Study). Am. J. Cardiol. 1992, 70, 851–858.[CrossRef]
7. Chen, X.; Wang, Y. Tracking of blood pressure from childhood to adulthood: A systematic review andmeta-regression analysis. Circulation 2008, 117, 3171–3180. [CrossRef]
8. Lai, C.C.; Sun, D.; Cen, R.; Wang, J.; Li, S.; Fernandez-Alonso, C.; Chen, W.; Srinivasan, S.R.; Berenson, G.S.Impact of long-term burden of excessive adiposity and elevated blood pressure from childhood on adulthoodleft ventricular remodeling patterns: The Bogalusa Heart Study. J. Am. Coll. Cardiol. 2014, 64, 1580–1587.[CrossRef]
9. Kit, B.K.; Kuklina, E.; Carroll, M.D.; Ostchega, Y.; Freedman, D.S.; Ogden, C.L. Prevalence of and trends indyslipidemia and blood pressure among US children and adolescents, 1999–2012. JAMA Pediatr. 2015, 169,272–279. [CrossRef]
10. National High Blood Pressure Education Program Working Group. The fourth report on the diagnosis,evaluation, and treatment of high blood pressure in children and adolescents. Pediatrics 2004, 114, 555–576.[CrossRef]
11. Bell, C.S.; Samuel, J.P.; Samuels, J.A. Prevalence of hypertension in children: Applying the new AmericanAcademy of Pediatrics Clinical Practice Guideline. Hypertension 2019, 73, 148–152. [CrossRef]
12. Sharma, A.K.; Metzger, D.L.; Rodd, C.J. Prevalence and severity of high blood pressure among childrenbased on the 2017 American Academy of Pediatrics Guidelines. JAMA Pediatr. 2018, 172, 557–565. [CrossRef]
13. Leng, B.; Jin, Y.; Li, G.; Chen, L.; Jin, N. Socioeconomic status and hypertension: A meta-analysis. J. Hypertens.2015, 33, 221–229. [CrossRef]
14. Stringhini, S.; Carmeli, C.; Jokela, M.; Avendaño, M.; McCrory, C.; d’Errico, A.; Bochud, M.; Barros, H.;Costa, G.; Chadeau-Hyam, M.; et al. Socioeconomic status, non-communicable disease risk factors, andwalking speed in older adults: Multi-cohort population based study. BMJ 2018, 360, k1046. [CrossRef]
15. Robles-Romero, J.M.; Fernández-Ozcorta, E.J.; Gavala-González, J.; Romero-Martín, M.; Gómez-Salgado, J.;Ruiz-Frutos, C. Anthropometric measures as predictive indicators of metabolic risk in a population of “Holyweek costaleros”. Int. J. Environ. Res. Public Health 2019, 16, 207. [CrossRef]
16. Setayeshgar, S.; Ekwaru, J.P.; Maximova, K.; Majumdar, S.R.; Storey, K.E.; McGavock, J.; Veugelers, P.J.Dietary intake and prospective changes in cardiometabolic risk factors in children and youth. Appl. Physiol.Nutr. Metab. 2017, 42, 39–45. [CrossRef]
17. Lazarou, C.; Panagiotakos, D.B.; Matalas, A.L. Lifestyle factors are determinants of children’s blood pressurelevels: The CYKIDS study. J. Hum. Hypertens. 2009, 23, 456–463. [CrossRef]
18. Simons-Morton, D.G.; Obarzanek, E. Diet and blood pressure in children and adolescents. Pediatr. Nephrol.1997, 11, 244–249. [CrossRef]
19. De Moraes, A.C.; Carvalho, H.B.; Siani, A.; Barba, G.; Veidebaum, T.; Tornaritis, M.; Molnar, D.; Ahrens, W.;Wirsik, N.; De Henauw, S.; et al. Incidence of high blood pressure in children—Effects of physical activityand sedentary behaviors: The IDEFICS study: High blood pressure, lifestyle and children. Int. J. Cardiol.2015, 180, 165–170. [CrossRef]
323
IJERPH 2019, 16, 1096
20. He, F.J.; MacGregor, G.A. Importance of salt in determining blood pressure in children: Meta-analysis ofcontrolled trials. Hypertension 2006, 48, 861–869. [CrossRef]
21. McGrath, J.J.; Matthews, K.A.; Brady, S.S. Individual versus neighborhood socioeconomic status and raceas predictors of adolescent ambulatory blood pressure and heart rate. Soc. Sci. Med. 2006, 63, 1442–1453.[CrossRef]
22. Javaheri, S.; Storfer-Isser, A.; Rosen, C.L.; Redline, S. Sleep quality and elevated blood pressure in adolescents.Circulation 2008, 118, 1034. [CrossRef]
23. Chmielewski, J.; Carmody, J.B. Dietary sodium, dietary potassium, and systolic blood pressure in USadolescents. J. Clin. Hypertens. 2017, 19, 904–909. [CrossRef]
24. Cuffee, Y.; Ogedegbe, C.; Williams, N.J.; Ogedegbe, G.; Schoenthaler, A. Psychosocial risk factors forhypertension: An update of the literature. Curr. Hypertens. Rep. 2014, 16, 483. [CrossRef]
25. Guimont, C.; Brisson, C.; Dagenais, G.R.; Milot, A.; Vezina, M.; Masse, B.; Moisan, J.; Laflamme, N.;Blanchette, C. Effects of job strain on blood pressure: A prospective study of male and female white-collarworkers. Am. J. Public Health 2006, 96, 1436–1443. [CrossRef]
26. Trudel, X.; Brisson, C.; Milot, A.; Masse, B.; Vezina, M. Adverse psychosocial work factors, blood pressureand hypertension incidence: Repeated exposure in a 5-year prospective cohort study. J. Epidemiol.Community Health 2016, 70, 402–408. [CrossRef]
27. Trudel, X.; Brisson, C.; Milot, A.; Masse, B.; Vezina, M. Effort-reward imbalance at work and 5-year changesin blood pressure: The mediating effect of changes in body mass index among 1400 white-collar workers.Int. Arch. Occup. Environ. Health 2016, 89, 1229–1238. [CrossRef]
28. Mucci, N.; Giorgi, G.; De Pasquale Ceratti, S.; Fiz-Perez, J.; Mucci, F.; Arcangeli, G. Anxiety, Stress-RelatedFactors, and Blood Pressure in Young Adults. Front. Psychol. 2016, 7, 1682. [CrossRef]
29. Chandola, T.; Britton, A.; Brunner, E.; Hemingway, H.; Malik, M.; Kumari, M.; Badrick, E.; Kivimaki, M.;Marmot, M. Work stress and coronary heart disease: What are the mechanisms? Eur. Heart J. 2008, 29,640–648. [CrossRef]
30. French, S.A.; Story, M.; Neumark-Sztainer, D.; Fulkerson, J.A.; Hannan, P. Fast food restaurant use amongadolescents: Associations with nutrient intake, food choices and behavioral and psychosocial variables.Int. J. Obes. 2001, 25, 1823–1833. [CrossRef]
31. Liu, X.C.; Keyes, K.M.; Li, G. Work stress and alcohol consumption among adolescents: Moderation byfamily and peer influences. BMC Public Health 2014, 14, 1303. [CrossRef]
32. Steinberg, L.; Fegley, S.; Dornbusch, S.M. Negative impact of part-time work on adolescent adjustment:Evidence from a longitudinal study. Dev. Psychol. 1993, 29, 171–180. [CrossRef]
33. Brody, G.H.; Flor, D.L.; Hollett-Wright, N.; McCoy, J.K. Children’s development of alcohol use norms:Contributions of parent and sibling norms, children’s temperaments, and parent-child discussions.J. Fam. Psychol. 1998, 12, 209–219. [CrossRef]
34. Safron, D.J.; Schulenberg, J.E.; Bachman, J.G. Part-time work and hurried adolescence: The links amongwork intensity, social activities, health behaviors, and substance use. J. Health Soc. Behav. 2001, 42, 425–449.[CrossRef]
35. National Institute for Occupational Safety and Health. Research Compendium: The NIOSH Total WorkerHealth®Program Seminal Research Papers; DHHS (NIOSH) Publication No. 2012-146; NIOSH: Washington,DC, USA, 2012.
36. Cooper, S.P.; Shipp, E.M.; Del Junco, D.J.; Cooper, C.J.; Bautista, L.E.; Levin, J. Cardiovascular Disease RiskFactors in Hispanic Adolescents in South Texas. South Med. J. 2016, 109, 130–136. [CrossRef] [PubMed]
37. Healthy Weight: About Child & Teen BMI. Available online: https://www.cdc.gov/healthyweight/assessing/bmi/childrens_bmi/about_childrens_bmi.html (accessed on 25 March 2019).
38. King-Tryce, K.; Garza, L.; Ozias, J.M. Acanthosis nigricans and insulin resistance. Dis. Prev. News 2002, 62,1–4.
39. Office UoT-PABH. The Texas Risk Assessment for Type 2 Diabetes in Children Program: A Report to the Governor and82nd Legislature of the State of Texas; The University of Texas-Pan American Border Health Office: Edinburg,TX, USA, 2011.
40. Cooper, S.P.; Burau, K.E.; Frankowski, R.; Shipp, E.M.; Del Junco, D.J.; Whitworth, R.E.; Sweeney, A.M.;Macnaughton, N.; Weller, N.F.; Hanis, C.L. A cohort study of injuries in migrant farm worker families inSouth Texas. Ann. Epidemiol. 2006, 16, 313–320. [CrossRef] [PubMed]
324
IJERPH 2019, 16, 1096
41. Shipp, E.M.; Cooper, S.P.; del Junco, D.J.; Cooper, C.J.; Whitworth, R.E. Acute occupational injury amongadolescent farmworkers from South Texas. Injury Prev. 2013, 19, 264–270. [CrossRef] [PubMed]
42. Youth Risk Behavior Surveillance System (YRBSS). Available online: https://www.cdc.gov/healthyyouth/data/yrbs/index.htm (accessed on 25 March 2019).
43. Din-Dzietham, R.; Liu, Y.; Bielo, M.V.; Shamsa, F. High blood pressure trends in children and adolescents innational surveys, 1963 to 2002. Circulation 2007, 116, 1488–1496. [CrossRef]
44. Urrutia-Rojas, X.; Egbuchunam, C.U.; Bae, S.; Menchaca, J.; Bayona, M.; Rivers, P.A.; Singh, K.P. High bloodpressure in school children: Prevalence and risk factors. BMC Pediatr. 2006, 6, 32. [CrossRef]
45. Fobian, A.D.; Elliott, L.; Louie, T. A Systematic Review of Sleep, Hypertension, and Cardiovascular Risk inChildren and Adolescents. Curr. Hypertens. Rep. 2018, 20, 42. [CrossRef]
46. Fischer, F.M.; Oliveira, D.C.; Nagai, R.; Teixeira, L.R.; Lombardi Júnior, M.; Latorre, M.D.; Cooper, S.P. Jobcontrol, job demands, social support at work and health among adolescent workers. Revista de Saúde Pública2005, 39, 245–253. [CrossRef]
47. DiNicolantonio, J.J.; Lucan, S.C.; O’Keefe, J.H. The Evidence for Saturated Fat and for Sugar Related toCoronary Heart Disease. Prog. Cardiovasc. Dis. 2016, 58, 464–472. [CrossRef] [PubMed]
48. Know Your Risk Factors for High Blood Pressure. Available online: http://www.heart.org/HEARTORG/Conditions/HighBloodPressure/UnderstandSymptomsRisks/Know-Your-Risk-Factors-for-High-Blood-Pressure_UCM_002052_Article.jsp#.Wk0zvVVKthE (accessed on 25 March 2019).
© 2019 by the authors. Licensee MDPI, Basel, Switzerland. This article is an open accessarticle distributed under the terms and conditions of the Creative Commons Attribution(CC BY) license (http://creativecommons.org/licenses/by/4.0/).
325
International Journal of
Environmental Research
and Public Health
Article
The Happy-Productive Worker Model and Beyond:Patterns of Wellbeing and Performance at Work
José M. Peiró 1,* , Malgorzata W. Kozusznik 2, Isabel Rodríguez-Molina 3 and Núria Tordera 3
1 IDOCAL (Institut d’Investigació en Psicologia del RRHH, del Desenvolupament Organitzacional i de laQualitat de Vida Laboral), Universitat de València & IVIE, Avda. Blasco Ibáñez 21, 46010 Valencia, Spain
2 Research Group for Work, Organizational and Personnel Psychology (WOPP), Katholieke UniversiteitLeuven, Dekenstraat 2, 3000 Leuven, Belgium; [email protected]
3 IDOCAL (Institut d’Investigació en Psicologia del RRHH, del Desenvolupament Organitzacional i de laQualitat de Vida Laboral), Universitat de València, Avda. Blasco Ibáñez 21, 46010 Valencia, Spain;[email protected] (I.R.-M.); [email protected] (N.T.)
* Correspondence: [email protected]; Tel.: +34-963-864-689
Received: 27 December 2018; Accepted: 3 February 2019; Published: 6 February 2019
Abstract: According to the happy-productive worker thesis (HPWT), “happy” workers performbetter than “less happy” ones. This study aimed to explore the different patterns of relationshipsbetween performance and wellbeing, synergistic (i.e., unhappy-unproductive and happy-productive)and antagonistic (i.e., happy-unproductive and unhappy-productive), taking into accountdifferent operationalizations of wellbeing (i.e., hedonic vs. eudaimonic) and performance(i.e., self-rated vs. supervisors’ ratings). It also explored different demographic variablesas antecedents of these patterns. We applied two-step cluster analysis to the data of 1647employees. The results indicate four different patterns—happy-productive, unhappy-unproductive,happy-unproductive, and unhappy-productive—when performance is self-assessed, and three whenit is assessed by supervisors. On average, over half of the respondents are unhappy-productive orhappy-unproductive. We used multidimensional logistic regression to explain cluster membershipbased on demographic covariates. This study addresses the limitations of the HPWT by includingboth the hedonic and eudaimonic aspects of wellbeing and considering different dimensions andsources of evaluation. The “antagonistic” patterns identify employees with profiles not explicitlyconsidered by the HPWT.
Keywords: occupational wellbeing; performance; happy-productive worker
1. Introduction
Wellbeing at work can be conceptualized from two distinct perspectives based on differentphilosophical traditions: the hedonic view of pleasure and experience of positive affect [1] andthe eudaimonic view of wellbeing as personal growth and a sense of meaning [2]. Therefore,wellbeing can be understood as having both pleasurable (or hedonic) and meaningful (or eudaimonic)components [3–6]. However, the majority of the research has studied wellbeing from the hedonicperspective, conceptualizing wellbeing as judgments and evaluations of satisfaction with some of life’sfacets (e.g., job satisfaction).
According to the happy-productive worker thesis, “happy” workers should have betterperformance than “less happy” ones [7,8], and the quality of task performance can be influenced bythe coexisting affective states [9]. This thesis has produced a series of studies [10,11] and meta-analyticresearch, often providing ambiguous and inconclusive results [8,12].
On the one hand, some research shows that wellbeing can predict performance. For example,studies show that when people are more satisfied with their jobs, they show higher performance [13,14].
IJERPH 2019, 16, 479; doi:10.3390/ijerph16030479 www.mdpi.com/journal/ijerph326
IJERPH 2019, 16, 479
In addition, higher positive affect has been shown to predict performance quality [15]. Furthermore,when people are more satisfied with their jobs, they show higher productivity [16] over time.People who feel better than usual at work have been found to make more effort on their tasks [17,18]and achieve a higher level of task performance [19]. In this direction, feeling active and enthusiastic inthe morning has been shown to increase levels of creativity during the day [20]. Finally, positive affecthas been shown to predict performance quality [21]. All these results support the HPWT, which positsthat workers with higher levels of wellbeing also tend to show better performance at work, comparedto workers with lower levels of wellbeing.
On the other hand, empirical studies and meta-analyses have found the relationships betweenperformance and job satisfaction to be spurious [22] or weak [23]. Some scholars view the connectionsbetween happiness and job performance as questionable [7], suggesting an apparently low andnon-significant satisfaction–performance relationship [24]. This can be reflected by the fact that moststudies that consider job satisfaction and job performance treat them as separate variables that are notdirectly related to each other [24]. For example, Greenberger, Strasser, Cummings, and Dunham [25]studied the causal relationship between personal control and job satisfaction, and between personalcontrol and job performance, but they did not assume or investigate the relationship between jobsatisfaction and job performance [24]. There is a need to address this ambiguity in the research, andfor this reason we consider it necessary to revisit and expand the happy-productive worker thesis.
Some Limitations of the Happy-Productive Worker Thesis
The ambiguity in the studies on the HPWT can be explained in part by the limitations of thesestudies [26]. First, they focus on hedonic constructs of wellbeing at the expense of eudaimonicwellbeing. In fact, most of the research has studied wellbeing from the hedonic perspective,understanding it as global evaluations of satisfaction (e.g., job satisfaction). More recently, valuablestudies have revisited the thesis of the happy and productive worker, studying the possibility ofexpanding it conceptually to include affect [7] or alternative relationships between satisfactionand performance [8] by evaluating affective wellbeing, both as a state and a trait [19]. However,this thesis has not been extended to consider key wellbeing constructs, such as its eudaimonicdimension, which involves purpose and personal growth. Wellbeing has also been conceptualizedas an eudaimonic experience of meaning at work and purpose in life [27]. This conceptualization ofsubjective wellbeing can be reflected in the recent progress in its measures [28], which distinguishbetween activities that people consider ‘pleasurable’ as opposed to the ‘worthwhileness’ or meaning atwork associated with these activities [2,29,30]. Although few studies have investigated the relationshipbetween eudaimonic wellbeing and performance [31], some research suggests that this relationshipexists. For example, Niessen et al. [32] demonstrated that, on days when employees had increasedperceived meaning at work, they reported being more focused on tasks and behaving in a moreexploratory way, compared to days when they evaluated their work as less meaningful to them.
A second limitation is that, in the study of the relationship between happiness and productivity,little attention is paid to a precise operationalization of productivity, and even its operationalizationas job performance is far from systemic and comprehensive in terms of its dimensions or facets(e.g., in-role performance, extra-role performance, creative performance). Job performance can beunderstood as “a function of a person’s behavior and the extent to which that behavior helps anorganization to reach its goals” [33] (p. 187). However, there is considerable debate about whatwork performance is. Koopmans and colleagues [34], in their systematic review, observe that,according to different studies on work performance, it can be conceptualized using the followingbroad dimensions: task performance, contextual performance, and counter-productive behavior.Task or in-role performance is intrinsically related to the activities included in the job description.Contextual performance refers to behaviors that are not directly related to the activities included in thejob description. Organizational citizenship overlaps with the definitions of contextual performanceand refers to helping others at work in the social and psychological context, thus promoting task
327
IJERPH 2019, 16, 479
performance [35]. Counterproductive work behaviors include behaviors such as absenteeism, theft,and substance abuse. Furthermore, creativity [36] and innovation [37] have been pointed out asanother important aspect of job performance. Several authors suggest conceptualizing job performanceusing a broader theoretical framework, in order to mitigate error sources and find relationshipsbetween performance and job satisfaction [38]. In the present study, we incorporate different aspectsof performance (in-role, organizational citizenship, and creative performance) in a global measure.Performance evaluations may come from different sources (e.g., self-assessed, supervisor, peers,customers, etc.). It is necessary to complement the employees’ self-rated performance assessment withthe supervisors’ evaluation of their performance in order to avoid employee leniency or self-deceptionin self-ratings, which has been shown to be particularly prominent in overall or general performanceassessments [39]. By including supervisors’ evaluations of their employees’ performance levels, wemake sure that we are using evaluations that have been shown to have the highest mean reliability, asfound in a meta-analysis by Conway and Huffcutt [40]. Therefore, the present study, in addition toemployees’ self-ratings of their own performance, includes information about their performance fromtheir direct supervisors.
A third limitation lies in the fact that most organizational research has studied “happiness” as anantecedent of “productivity”, and only a few studies have looked for the inverse relationship [24,31].However, there is evidence suggesting that work performance can explain wellbeing indicators.For example, evidence shows that self-rated performance predicts an increase in dedication and adecrease in emotional exhaustion over time [41]. Moreover, performance [42,43] and the experienceof making progress toward one’s goals at work [44–46] have been shown to predict positive affectivestates. Additionally, studies have shown that personal initiative is positively related to an increase inwork engagement over time [47]. Along the same lines, there is evidence that on days when employeeswere strongly focused on tasks at work, they also exhibited more vitality and learning than on dayswhen they were weakly focused on their tasks [32].
A fourth limitation is that the studies from both the happy-productive and productive-happyapproaches have assumed positive linear relationships, although other patterns of relations may exist,especially those that establish negative relationships between these two variables. These complex andalternative relations between these constructs require taking into consideration different configurationsor patterns of these relationships, instead of analyzing them sequentially. In fact, the studies carriedout within the happy productive thesis emphasize the results that confirm this thesis. These studiestend to especially explore the synergistic side of the model that produces a win-win situation foremployers and employees (happy and productive), while disregarding the antagonistic or win-loserelations (happy and unproductive or unhappy and productive). However, some studies suggest thatwe should pay more attention to these antagonistic relations, showing, for instance, that difficulty inremembering information and poor task performance can be considered negative consequences ofbeing “happy” at work [48]. Furthermore, other authors provide evidence of the benefits of negativeaffect on creative performance [49]. Based on this research, Peiró et al. [26] proposed the need to attendto not only the synergetic relations between performance and wellbeing, but also to the antagonisticones, thus extending the propositions of the HWPW. They proposed the coexistence of four patterns ofrelationships between performance and wellbeing: “happy-productive”, “unhappy-unproductive”,“happy-unproductive”, and “unhappy-productive”. In fact, Ayala et al. [50] found support for thesedifferent types of patterns when considering job satisfaction and innovative performance in youngemployees. Moreover, they found that almost 15% of a sample of Spanish young employees fellin the group of unhappy-productive (about 9%) or the group of happy-unproductive (more than5%). Acknowledging that the correlations between happiness and productivity are moderated, it isimportant to focus on the different groups of workers according to their profiles. In order “to learnmore about individuals who are outside the hypothesized pattern . . . , it is now desirable to investigateadditional measures of wellbeing and performance and identify situational and personal featuresassociated with membership in each cluster” [51] (p. 12).
328
IJERPH 2019, 16, 479
In order to overcome the limitations of the research mentioned above, in the present study,we address them by revisiting the happy-productive worker, incorporating both the hedonic andeudaimonic components of wellbeing and considering different aspects of job performance as wellas different evaluation sources. In addition, in this study, we consider wellbeing and performancesimultaneously, instead of analyzing the sequence between these two constructs. To this end, westudy patterns of wellbeing and performance that serve to integrate these two constructs, taking intoaccount different operationalizations where neither of them is an antecedent of the other, in order toidentify different patterns of employees, both synergistic (i.e., happy-productive) and antagonistic(i.e., unhappy-unproductive, happy-unproductive and unhappy-productive). In this way, we aimto further advance our knowledge in the direction pointed out by Warr and Nielsen [51] when theyproposed identifying situational and personal features associated with membership in each cluster.More specifically, we formulate the following research questions:
• Research Question 1: Do employees show different patterns of relationships betweenperformance and wellbeing, synergistic (i.e., unhappy-unproductive and happy-productive) andantagonistic (i.e., happy-unproductive and unhappy-productive), taking into account differentoperationalizations of wellbeing (i.e., hedonic vs. eudaimonic) and performance (i.e., self-rated vs.supervisor ratings)?
• Research Question 2: Will the employees remain in the same profile of wellbeing and performancein their different operationalizations?
• Research Question 3: Are there any demographic variables that may play a role as antecedents ofthe profiles in the different operationalizations of the “happy-productive” worker?
2. Materials and Methods
2.1. Sample and Procedure
The members of the research team contacted several organizations, inviting them to participate inthe project. Convenience sampling was used, focusing mainly on the services and production sector.The first contact was made with the general manager or the director of human resources. In a firstmeeting, the project, the objectives, the time required, and the procedure were explained to them.Then, if they agreed, all the workers in the organizations were invited to participate by completing thequestionnaire voluntarily and confidentially.
The sample was composed of 1647 employees (52% women, 43% men, 5% information notavailable) from the services (81%) and production/construction (19%) sectors, working in 239 workunits in different Spanish companies. With regard to age, 26% percent of participants were under35 years old, 55% were between 35 and 50, and 16% were over 50 years old. The majority of thesample had a university degree (46%) and high school or professional training (37%). The majoritywere technicians/administrative workers (46%) and highly qualified professionals (24%). In addition,62% were permanent workers, and 30% were temporary workers. The majority of the employees hadworked for more than 5 years in their current position (53%). Members of the research team informedthe participants on the purpose of the study, the guarantee of confidentiality and the willfulness oftheir participation. Participants expressed their consent to participate. The research protocol wasapproved by the Ethics Committee of the University of Valencia.
In this study, we used two types of informants to assess employee performance. First, we askedthe employees to self-evaluate their performance. These ratings were obtained for all the employees.Second, we asked employees’ direct supervisors to rate the performance of their subordinates.In this case, performance evaluated by the direct supervisor was only obtained for 915 employees.Confidentiality of the data was guaranteed.
329
IJERPH 2019, 16, 479
2.2. Measures
Hedonic wellbeing. Hedonic wellbeing was conceptualized as the employee’s job satisfaction,and it was measured by a 10-item reduced version of the Job Satisfaction Scale (IJSS) by Cooper, Routand Faragher [52], referring to intrinsic job satisfaction and extrinsic job satisfaction, and one additionalitem measuring general job satisfaction. The score for hedonic wellbeing was the global mean score forthe three types of job satisfaction. It includes items such as “Opportunity to use your skills”. The itemshave a seven-point Likert response format, ranging from 1 (quite dissatisfied) to 7 (very satisfied).Cronbach’s alpha for the global score of Hedonic Wellbeing was 0.87.
Eudaimonic wellbeing. Eudaimonic wellbeing was conceptualized as a feeling of meaning andpurpose at work, and it was measured by an 8-item reduced version of the scale constructed byRyff [53], with two subscales: purpose at work and personal growth. The score for eudaimonicwellbeing was obtained by computing the global mean score for the two dimensions of the scale.It includes items such as “For me, life has been a continuous process of learning, changing, andgrowth”. The items have a seven-point Likert response format, ranging from 1 (strongly disagree) to 7(strongly agree). Cronbach’s alpha for the global score of eudaimonic wellbeing was 0.72.
Performance—rated by the employee. Employees’ self-rated work performance wasoperationalized as in-role performance (carrying out tasks required by the job), extra-role performance(carrying out tasks that are not required in the job description, e.g., helping others), and creativeperformance (carrying out tasks that are both creative and useful at work). In-role performance wasmeasured by 3 items from a scale constructed by Williams and Anderson [54], extra-role performancewas measured by 3 items from a scale by Mackenzie and colleagues [55], and creative performancewas measured by a 3-item method constructed by Oldham and Cummings [36]. The compositescore for performance was obtained by calculating the global mean score for the in-role, extra-role,and creative performance scales. It includes items such as: “I adequately complete assigned duties”(in-role performance); “I do not hesitate to challenge the opinions of others who I feel are leading thestore/company in the wrong direction” (extra-role performance); and “How original and practicalam I in my work?” The items have a seven-point Likert response format, ranging from 1 (stronglydisagree) to 7 (strongly agree). Cronbach’s alpha for the global work performance score was 0.71.
Performance—rated by the supervisor. Employee work performance evaluated by the supervisorwas also operationalized as a general measure of performance quality. We measured these three aspectsusing three items: “What is his/her performance like?”; “What is the quality of his/her work?”; and“What was his/her level of goal achievement in the past year?” The items have a five-point Likertresponse format, ranging from 1 (very bad) to 5 (very good). Cronbach’s alpha for the global workPerformance score was 0.89.
Demographic variables included. Organization’s sector: dummy variable (0 service,1 production/construction). Gender: dummy variable (0 female, 1 male). Age: under 35 yearsold, between 35 and 50, and over 50 years old. The highest educational level achieved: no education orcompulsory education, professional training or high school, advanced university degree. Occupationalcategory: unqualified manual work, technician or administrative work, highly qualified professional,manager. Type of contract: dummy variable (0 = temporary, 1 = permanent). Seniority in the position:dummy variable (0 = less than 5 years, 1 = more than 5 years).
2.3. Statistical Analysis
The sample was divided into clusters using the two–step cluster analysis method developed byChiu and colleagues [56] in SPSS v.22 (IBM Corp., Armonk, NY, USA). The SPSS two-step clustermethod is a scalable cluster analysis algorithm designed to handle large datasets, such as thoseanalyzed in the present study. The algorithm is based on a two–stage approach: in the first stage, itundertakes a similar procedure to the k-means algorithm. In the second step, based on these results,a modified hierarchical agglomerative clustering procedure is carried out that combines the objectssequentially to form homogenous clusters [57].
330
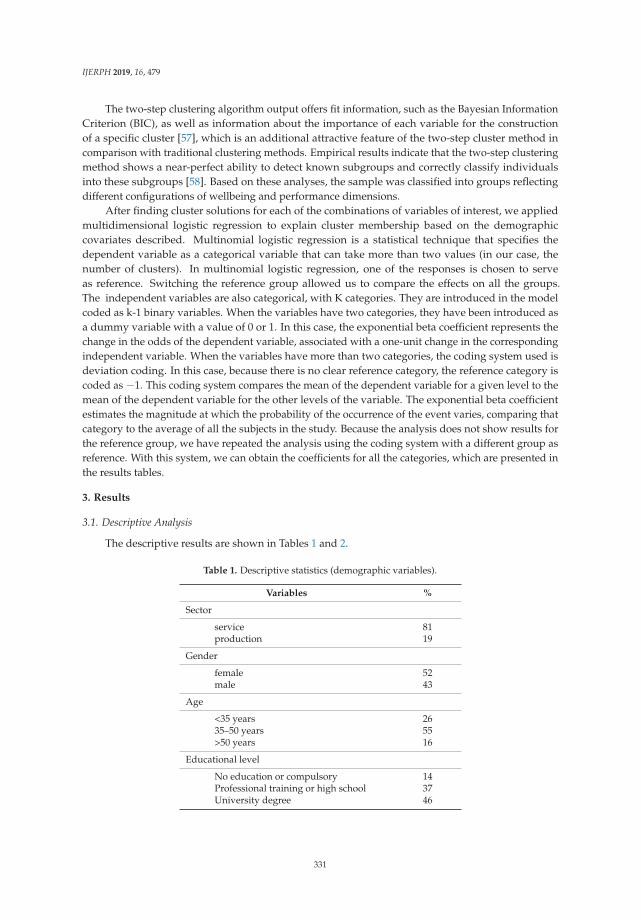
IJERPH 2019, 16, 479
The two-step clustering algorithm output offers fit information, such as the Bayesian InformationCriterion (BIC), as well as information about the importance of each variable for the constructionof a specific cluster [57], which is an additional attractive feature of the two-step cluster method incomparison with traditional clustering methods. Empirical results indicate that the two-step clusteringmethod shows a near-perfect ability to detect known subgroups and correctly classify individualsinto these subgroups [58]. Based on these analyses, the sample was classified into groups reflectingdifferent configurations of wellbeing and performance dimensions.
After finding cluster solutions for each of the combinations of variables of interest, we appliedmultidimensional logistic regression to explain cluster membership based on the demographiccovariates described. Multinomial logistic regression is a statistical technique that specifies thedependent variable as a categorical variable that can take more than two values (in our case, thenumber of clusters). In multinomial logistic regression, one of the responses is chosen to serveas reference. Switching the reference group allowed us to compare the effects on all the groups.The independent variables are also categorical, with K categories. They are introduced in the modelcoded as k-1 binary variables. When the variables have two categories, they have been introduced asa dummy variable with a value of 0 or 1. In this case, the exponential beta coefficient represents thechange in the odds of the dependent variable, associated with a one-unit change in the correspondingindependent variable. When the variables have more than two categories, the coding system used isdeviation coding. In this case, because there is no clear reference category, the reference category iscoded as −1. This coding system compares the mean of the dependent variable for a given level to themean of the dependent variable for the other levels of the variable. The exponential beta coefficientestimates the magnitude at which the probability of the occurrence of the event varies, comparing thatcategory to the average of all the subjects in the study. Because the analysis does not show results forthe reference group, we have repeated the analysis using the coding system with a different group asreference. With this system, we can obtain the coefficients for all the categories, which are presented inthe results tables.
3. Results
3.1. Descriptive Analysis
The descriptive results are shown in Tables 1 and 2.
Table 1. Descriptive statistics (demographic variables).
Variables %
Sector
service 81production 19
Gender
female 52male 43
Age
<35 years 2635–50 years 55>50 years 16
Educational level
No education or compulsory 14Professional training or high school 37University degree 46
331
IJERPH 2019, 16, 479
Table 1. Cont.
Variables %
Occupational category
Unqualified manual work 10Technician or administrative 46Highly qualified professional 24Manager
Type of contract
temporary 30permanent 62
Seniority in the position
<5 years 40>5 years 53
Table 2. Descriptive statistics.
Feature Mean Standard Deviation (SD)
Hedonic wellbeing 5.25 0.91Eudaimonic wellbeing 5.78 0.76
Performance rated by the employee 5.65 0.69Performance rated by the supervisor 4.17 0.68
3.2. Cluster Analyses: Different Operationalizations of the Wellbeing-Performance Patterns.
As mentioned above, we used cluster analysis to find different patterns of relationships betweenperformance and wellbeing, taking into account different operationalizations of wellbeing (i.e., hedonicvs. eudaimonic) and performance (i.e., self-rated vs. supervisor ratings). The results are shown below.Models 1 and 2 consider self-rated performance by the employee (hedonic wellbeing in Model 1 andeudaimonic wellbeing in Model 2). Models 3 and 4 consider performance evaluated by the supervisor(hedonic wellbeing in Model 3 and eudaimonic wellbeing in Model 4).
When performance is evaluated by the employee, there are four clusters: (1) employees who arehigh in both wellbeing and high performance; (2) employees who are medium low in wellbeing andmedium high in performance; (3) employees who are medium high in wellbeing and medium low inperformance; and (4) employees who are low in both wellbeing and performance.
When performance is evaluated by the supervisor, there are three clusters: (1) employees whoare high in both wellbeing and performance; (2) employees who are high in wellbeing and low inperformance; and (3) employees who are low both in both wellbeing and performance.
The results show that there are antagonistic patterns of wellbeing and performance (i.e.,happy-unproductive, and in some cases, unhappy-productive). In fact, the results indicate that,on average, over 50% of the respondents belong to these clusters.
3.2.1. Model 1: Hedonic Wellbeing vs. Self-Rated Performance (H-PE).
In Model 1, we consider two variables: hedonic wellbeing and self-rated composite performancerated by the employee. The auto-clustering algorithm indicated a four–cluster solution asthe best model because it minimized the BIC value (BIC = 1060.892, BIC change from theprevious cluster = −228.184). The average silhouette measure of cohesion and separation was 0.5,indicating fair to good cluster quality. The importance of both predictors was 1.00.
Four clusters emerged (see Figure 1): (1) employees high in hedonic wellbeing (M = 6.17, SD =0.35) and high in self-reported performance (M = 6.29, SD = 0.36), i.e., “hH-hPE” (n = 411; 24,95%); (2)employees medium low in hedonic wellbeing (M = 4.97, SD = 0.49) and medium high in self-reportedperformance (M = 6.10, SD = 0.31), i.e., “mlH-mhPE” (n = 383; 23,25%); (3) employees medium high in
332
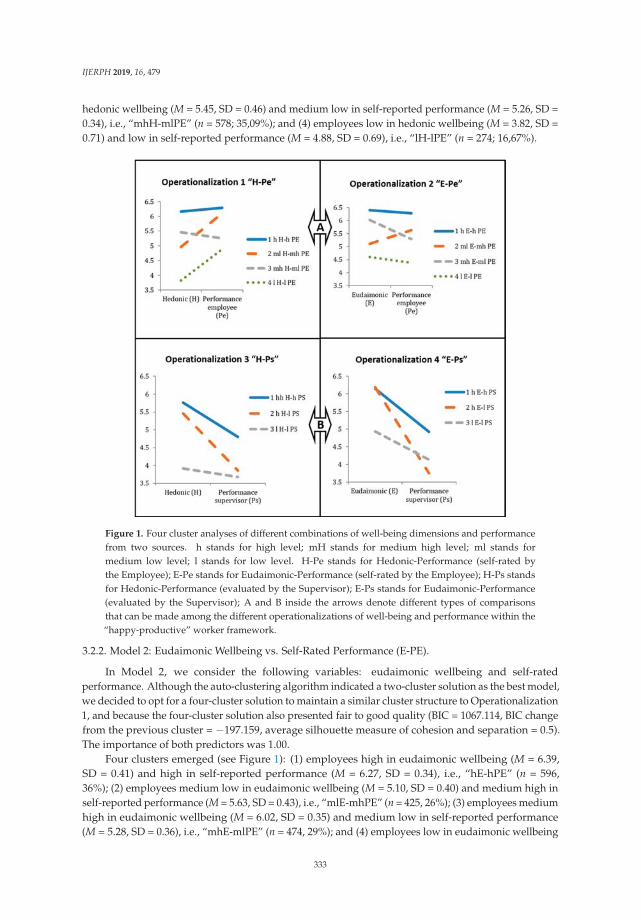
IJERPH 2019, 16, 479
hedonic wellbeing (M = 5.45, SD = 0.46) and medium low in self-reported performance (M = 5.26, SD =0.34), i.e., “mhH-mlPE” (n = 578; 35,09%); and (4) employees low in hedonic wellbeing (M = 3.82, SD =0.71) and low in self-reported performance (M = 4.88, SD = 0.69), i.e., “lH-lPE” (n = 274; 16,67%).
Figure 1. Four cluster analyses of different combinations of well-being dimensions and performancefrom two sources. h stands for high level; mH stands for medium high level; ml stands formedium low level; l stands for low level. H-Pe stands for Hedonic-Performance (self-rated bythe Employee); E-Pe stands for Eudaimonic-Performance (self-rated by the Employee); H-Ps standsfor Hedonic-Performance (evaluated by the Supervisor); E-Ps stands for Eudaimonic-Performance(evaluated by the Supervisor); A and B inside the arrows denote different types of comparisonsthat can be made among the different operationalizations of well-being and performance within the“happy-productive” worker framework.
3.2.2. Model 2: Eudaimonic Wellbeing vs. Self-Rated Performance (E-PE).
In Model 2, we consider the following variables: eudaimonic wellbeing and self-ratedperformance. Although the auto-clustering algorithm indicated a two-cluster solution as the best model,we decided to opt for a four-cluster solution to maintain a similar cluster structure to Operationalization1, and because the four-cluster solution also presented fair to good quality (BIC = 1067.114, BIC changefrom the previous cluster = −197.159, average silhouette measure of cohesion and separation = 0.5).The importance of both predictors was 1.00.
Four clusters emerged (see Figure 1): (1) employees high in eudaimonic wellbeing (M = 6.39,SD = 0.41) and high in self-reported performance (M = 6.27, SD = 0.34), i.e., “hE-hPE” (n = 596,36%); (2) employees medium low in eudaimonic wellbeing (M = 5.10, SD = 0.40) and medium high inself-reported performance (M = 5.63, SD = 0.43), i.e., “mlE-mhPE” (n = 425, 26%); (3) employees mediumhigh in eudaimonic wellbeing (M = 6.02, SD = 0.35) and medium low in self-reported performance(M = 5.28, SD = 0.36), i.e., “mhE-mlPE” (n = 474, 29%); and (4) employees low in eudaimonic wellbeing
333
IJERPH 2019, 16, 479
(M = 4.60, SD = 0.61) and low in self-reported performance (M = 4.38, SD = 0.45), i.e., “lE-lPE” (n = 152,9%).
3.2.3. Model 3: Hedonic Wellbeing vs. Performance Evaluated by the Supervisor (H-PS).
In Model 3, we consider two variables: hedonic wellbeing and performance assessed by thesupervisor. The auto-clustering algorithm indicated a three-cluster solution as the best modelbecause it minimized the BIC value (807.301, BIC change from the previous cluster = −172.428).The average silhouette measure of cohesion and separation was 0.5, indicating fair to good clusterquality. The importance of the predictors of hedonic wellbeing and performance evaluated by thesupervisor is 1.00 and 0.91, respectively.
Three clusters emerged (see Figure 1): (1) employees high in hedonic wellbeing (M = 5.76,SD = 0.57) and high performance evaluated by the supervisor (M = 4.80, SD = 0.26), i.e., “hH-hPS”(n = 334, 37%); (2) employees high in hedonic wellbeing (M = 5.46, SD = 0.56) and low in performanceevaluated by the supervisor (M = 3.86, SD = 0.36), i.e., “hH-lPS” (n = 402, 44%); and (3) employeeslow in hedonic wellbeing (M = 3.91, SD = 0.83) and low in performance evaluated by the supervisor(M = 3.67, SD = 0.86), i.e., “lH-lPS” (n = 179, 20%).
3.2.4. Model 4: Eudaimonic Wellbeing vs. Performance Evaluated by the Supervisor (E-PS).
In Model 4, we consider two variables: eudaimonic wellbeing and performance evaluated bythe supervisor. Although the auto-clustering algorithm indicated a four–cluster solution as thebest model, we decided to opt for a three-cluster solution to maintain a similar cluster structure tooperationalization 3, and because the three-cluster solution also presented fair to good quality (BIC= 786.235, BIC change from the previous cluster = −242.320, average silhouette measure of cohesionand separation = 0.5). The importance of the predictors of eudaimonic wellbeing and performanceevaluated by the supervisor was 1.00 and 0.81, respectively.
The three clusters identified are (see Figure 1): (1) employees high in eudaimonic wellbeing(M = 6.14, SD = 0.52) and high performance evaluated by the supervisor (M = 4.92, SD = 0.14), i.e.,“hE-hPS” (n = 240, 26%); (2) employees high in eudaimonic wellbeing (M = 6.19, SD = 0.45) and low inperformance evaluated by the supervisor (M = 3.75, SD = 0.56), i.e., “hE-lPS” (n = 416, 46%); and (3)employees low in eudaimonic wellbeing (M = 4.93, SD = 0.52) and low in performance evaluated bythe supervisor (M = 4.14, SD = 0.55), i.e., “lE-lPS” (n = 259, 28%).
3.3. Profiles of (un)Happy-(un)Productive Workers in Different Operationalizations of Wellbeing andPerformance
In the following section, we try to reveal on whether it is helpful to obtain different profilesof (un)happy–(un)productive workers on the basis of different operationalizations of wellbeing andperformance. If the individuals remain in the same or an equivalent category regardless of the variablesconsidered to create the groups, it would be sufficient to consider only one operationalization. In orderto analyze this, we compare Models 1 and 2 (both with four clusters) and Models 3 and 4 (both withthree clusters). Other comparisons do not make sense because the number of clusters is different.In fact, a different number of clusters depending on the performance measure (self-rated or evaluatedby the supervisor) would mean that this operationalization is important.
In order to shed light on this issue, we present the results of the analysis of how many individualsbelonging to a specific cluster in one operationalization (e.g., hH-hPE) belong to the same cluster in adifferent operationalization (e.g., hE-hPE), as well as how many participants belonging to one clusterin one operationalization (e.g., hH-hPS) belong to a different cluster in another operationalization (e.g.,hE-lPS). The clusters found with the four types of operationalizations of the variables (dimensionsof wellbeing and two sources of information about performance) can be found in the Figure 1.The results show that a large number of employees do not belong to analogous clusters in different
334
IJERPH 2019, 16, 479
operationalizations of wellbeing and performance. This result means that some employees are classifiedas both unhappy in a hedonic way and, simultaneously, happy in an eudaimonic way (and vice-versa).
3.3.1. Comparison A (Model 1–Model 2): Hedonic–Employee-Rated Performance (H-PE) vs.Eudaimonic–Employee-Rated Performance (E-PE).
If the whole sample is considered, 50.6% of the respondents belong to a homologous clusterin both the H-PE and E-PE models. This means that about half of the employees had comparablewellbeing and performance profiles in both models. They have similar profiles in terms of both kindsof wellbeing. Interestingly, the other half of the employees (49.4%) do not belong to homologousclusters, which means that they belong to a cluster that suggests that they are unhappy in a hedonicway and, simultaneously, to a cluster that suggests that they are happy in an eudaimonic way, orvice versa.
3.3.2. Comparison B (Model 3–Model 4): Hedonic–Supervisor-Rated Performance (H-PS) vs.Eudaimonic–Supervisor-Rated Performance (E-PS)
Almost two thirds of the respondents (63.9%) belong to a homologous cluster in the H-PS andE-PS models, whereas 36.1% of the respondents belong to clusters with different profiles dependingof the operationalization of wellbeing. This means that almost a third of the participants could besimultaneously happy in a hedonic way and unhappy in an eudaimonic way, or vice-versa, at a certainlevel of performance evaluated by the supervisor.
3.4. Demographic Variables as Significant Antecedents of the Wellbeing—Performance Classification.
As indicated previously, we used multidimensional logistic regression to explain clustermembership based on the demographic covariates. The odds ratios for all the models are displayedin Tables 3–6. An odds ratio greater than 1 implies that a person in a given category has greaterodds of belonging to a cluster than a person in the reference category (in the case of variables with2 categories) or than the average of all the subjects in the study (in the case of variables with morethan 2 categories). An odds ratio below 1 suggests reduced odds. We identified different demographicpredictors when different operationalizations of wellbeing (hedonic-eudaimonic) and performance(self- or supervisor-evaluated) are considered.
335
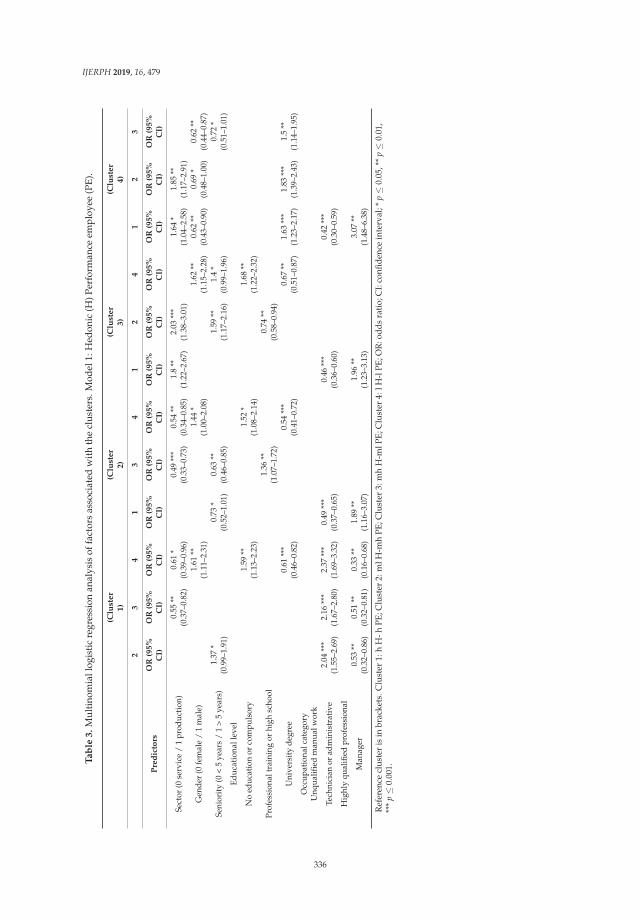
IJERPH 2019, 16, 479
Ta
ble
3.
Mul
tino
mia
llog
isti
cre
gres
sion
anal
ysis
offa
ctor
sas
soci
ated
wit
hth
ecl
uste
rs.M
odel
1:H
edon
ic(H
)Per
form
ance
empl
oyee
(PE)
.
(Clu
ste
r1
)(C
lust
er
2)
(Clu
ste
r3
)(C
lust
er
4)
23
41
34
12
41
23
Pre
dic
tors
OR
(95
%C
I)O
R(9
5%
CI)
OR
(95
%C
I)O
R(9
5%
CI)
OR
(95
%C
I)O
R(9
5%
CI)
OR
(95
%C
I)O
R(9
5%
CI)
OR
(95
%C
I)O
R(9
5%
CI)
OR
(95
%C
I)O
R(9
5%
CI)
Sect
or(0
serv
ice
/1
prod
ucti
on)
0.55
**(0
.37–
0.82
)0.
61*
(0.3
9–0.
96)
0.49
***
(0.3
3–0.
73)
0.54
**(0
.34–
0.85
)1.
8**
(1.2
2–2.
67)
2.03
***
(1.3
8–3.
01)
1.64
*(1
.04–
2.58
)1.
85**
(1.1
7–2.
91)
Gen
der
(0fe
mal
e/
1m
ale)
1.61
**(1
.11–
2.31
)1.
44*
(1.0
0–2.
08)
1.62
**(1
.15–
2.28
)0.
62**
(0.4
3–0.
90)
0.69
*(0
.48–
1.00
)0.
62**
(0.4
4–0.
87)
Seni
orit
y(0
<5
year
s/
1>
5ye
ars)
1.37
*(0
.99–
1.91
)0.
73*
(0.5
2–1.
01)
0.63
**(0
.46–
0.85
)1.
59**
(1.1
7–2.
16)
1.4
*(0
.99–
1.96
)0.
72*
(0.5
1–1.
01)
Educ
atio
nall
evel
No
educ
atio
nor
com
puls
ory
1.59
**(1
.13–
2.23
)1.
52*
(1.0
8–2.
14)
1.68
**(1
.22–
2.32
)
Prof
essi
onal
trai
ning
orhi
ghsc
hool
1.36
**(1
.07–
1.72
)0.
74**
(0.5
8–0.
94)
Uni
vers
ity
degr
ee0.
61**
*(0
.46–
0.82
)0.
54**
*(0
.41–
0.72
)0.
67**
(0.5
1–0.
87)
1.63
***
(1.2
3–2.
17)
1.83
***
(1.3
9–2.
43)
1.5
**(1
.14–
1.95
)O
ccup
atio
nalc
ateg
ory
Unq
ualifi
edm
anua
lwor
k
Tech
nici
anor
adm
inis
trat
ive
2.04
***
(1.5
5–2.
69)
2.16
***
(1.6
7–2.
80)
2.37
***
(1.6
9–3.
32)
0.49
***
(0.3
7–0.
65)
0.46
***
(0.3
6–0.
60)
0.42
***
(0.3
0–0.
59)
Hig
hly
qual
ified
prof
essi
onal
Man
ager
0.53
**(0
.32–
0.86
)0.
51**
(0.3
2–0.
81)
0.33
**(0
.16–
0.68
)1.
89**
(1.1
6–3.
07)
1.96
**(1
.23–
3.13
)3.
07**
(1.4
8–6.
38)
Ref
eren
cecl
uste
ris
inbr
acke
ts.C
lust
er1:
hH
-hPE
;Clu
ster
2:m
lH-m
hPE
;Clu
ster
3:m
hH
-mlP
E;C
lust
er4:
lH-l
PE;O
R:o
dds
rati
o;C
I:co
nfide
nce
inte
rval
;*p≤
0.05
,**
p≤
0.01
,**
*p≤
0.00
1.
336
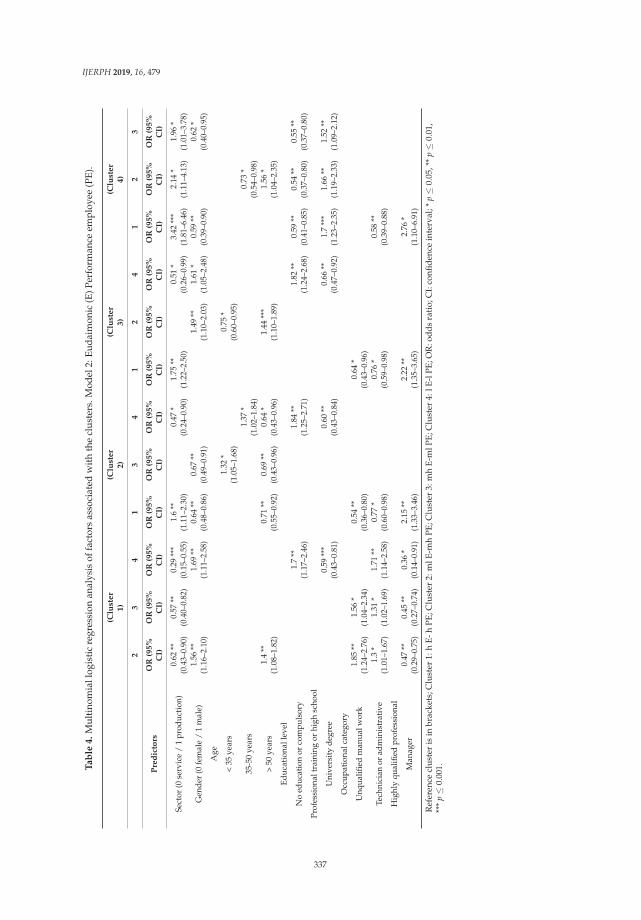
IJERPH 2019, 16, 479
Ta
ble
4.
Mul
tino
mia
llog
isti
cre
gres
sion
anal
ysis
offa
ctor
sas
soci
ated
wit
hth
ecl
uste
rs.M
odel
2:Eu
daim
onic
(E)P
erfo
rman
ceem
ploy
ee(P
E).
(Clu
ste
r1
)(C
lust
er
2)
(Clu
ste
r3
)(C
lust
er
4)
23
41
34
12
41
23
Pre
dic
tors
OR
(95
%C
I)O
R(9
5%
CI)
OR
(95
%C
I)O
R(9
5%
CI)
OR
(95
%C
I)O
R(9
5%
CI)
OR
(95
%C
I)O
R(9
5%
CI)
OR
(95
%C
I)O
R(9
5%
CI)
OR
(95
%C
I)O
R(9
5%
CI)
Sect
or(0
serv
ice
/1
prod
ucti
on)
0.62
**(0
.43–
0.90
)0.
57**
(0.4
0–0.
82)
0.29
***
(0.1
5–0.
55)
1.6
**(1
.11–
2.30
)0.
47*
(0.2
4–0.
90)
1.75
**(1
.22–
2.50
)0.
51*
(0.2
6–0.
99)
3.42
***
(1.8
1–6.
46)
2.14
*(1
.11–
4.13
)1.
96*
(1.0
1–3.
78)
Gen
der
(0fe
mal
e/
1m
ale)
1.56
**(1
.16–
2.10
)1.
69**
(1.1
1–2.
58)
0.64
**(0
.48–
0.86
)0.
67**
(0.4
9–0.
91)
1.49
**(1
.10–
2.03
)1.
61*
(1.0
5–2.
48)
0.59
**(0
.39–
0.90
)0.
62*
(0.4
0–0.
95)
Age
<35
year
s1.
32*
(1.0
5–1.
68)
0.75
*(0
.60–
0.95
)
35-5
0ye
ars
1.37
*(1
.02–
1.84
)0.
73*
(0.5
4–0.
98)
>50
year
s1.
4**
(1.0
8–1.
82)
0.71
**(0
.55–
0.92
)0.
69**
(0.4
3–0.
96)
0.64
*(0
.43–
0.96
)1.
44**
*(1
.10–
1.89
)1.
56*
(1.0
4–2.
35)
Educ
atio
nall
evel
No
educ
atio
nor
com
puls
ory
1.7
**(1
.17–
2.46
)1.
84**
(1.2
5–2.
71)
1.82
**(1
.24–
2.68
)0.
59**
(0.4
1–0.
85)
0.54
**(0
.37–
0.80
)0.
55**
(0.3
7–0.
80)
Prof
essi
onal
trai
ning
orhi
ghsc
hool
Uni
vers
ity
degr
ee0.
59**
*(0
.43–
0.81
)0.
60**
(0.4
3–0.
84)
0.66
**(0
.47–
0.92
)1.
7**
*(1
.23–
2.35
)1.
66**
(1.1
9–2.
33)
1.52
**(1
.09–
2.12
)O
ccup
atio
nalc
ateg
ory
Unq
ualifi
edm
anua
lwor
k1.
85**
(1.2
4–2.
76)
1.56
*(1
.04–
2.34
)0.
54**
(0.3
6–0.
80)
0.64
*(0
.43–
0.96
)
Tech
nici
anor
adm
inis
trat
ive
1.3
*(1
.01–
1.67
)1.
31*
(1.0
2–1.
69)
1.71
**(1
.14–
2.58
)0.
77*
(0.6
0–0.
98)
0.76
*(0
.59–
0.98
)0.
58**
(0.3
9–0.
88)
Hig
hly
qual
ified
prof
essi
onal
Man
ager
0.47
**(0
.29–
0.75
)0.
45**
(0.2
7–0.
74)
0.36
*(0
.14–
0.91
)2.
15**
(1.3
3–3.
46)
2.22
**(1
.35–
3.65
)2.
76*
(1.1
0–6.
91)
Ref
eren
cecl
ust
eris
inbr
acke
ts;C
lust
er1:
hE
-hP
E;C
lust
er2:
mlE
-mh
PE
;Clu
ster
3:m
hE
-mlP
E;C
lust
er4:
lE-l
PE
;OR
:od
ds
rati
o;C
I:co
nfid
ence
inte
rval
;*p≤
0.05
,**
p≤
0.01
,**
*p≤
0.00
1.
337
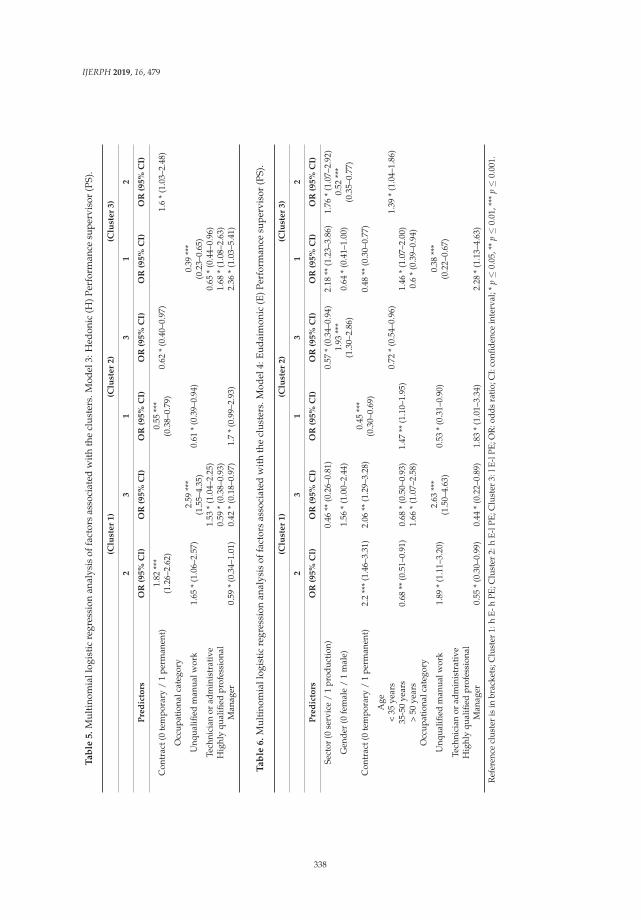
IJERPH 2019, 16, 479
Ta
ble
5.
Mul
tino
mia
llog
isti
cre
gres
sion
anal
ysis
offa
ctor
sas
soci
ated
wit
hth
ecl
uste
rs.M
odel
3:H
edon
ic(H
)Per
form
ance
supe
rvis
or(P
S).
(Clu
ster
1)
(Clu
ster
2)
(Clu
ster
3)
23
13
12
Pre
dic
tors
OR
(95%
CI)
OR
(95%
CI)
OR
(95%
CI)
OR
(95%
CI)
OR
(95%
CI)
OR
(95%
CI)
Con
trac
t(0
tem
pora
ry/
1pe
rman
ent)
1.82
***
(1.2
6–2.
62)
0.55
***
(0.3
8–0.
79)
0.62
*(0
.40–
0.97
)1.
6*
(1.0
3–2.
48)
Occ
upat
iona
lcat
egor
y
Unq
ualifi
edm
anua
lwor
k1.
65*
(1.0
6–2.
57)
2.59
***
(1.5
5–4.
35)
0.61
*(0
.39–
0.94
)0.
39**
*(0
.23–
0.65
)Te
chni
cian
orad
min
istr
ativ
e1.
53*
(1.0
4–2.
25)
0.65
*(0
.44–
0.96
)H
ighl
yqu
alifi
edpr
ofes
sion
al0.
59*
(0.3
8–0.
93)
1.68
*(1
.08–
2.63
)M
anag
er0.
59*
(0.3
4–1.
01)
0.42
*(0
.18–
0.97
)1.
7*
(0.9
9–2.
93)
2.36
*(1
.03–
5.41
)
Ta
ble
6.
Mul
tino
mia
llog
isti
cre
gres
sion
anal
ysis
offa
ctor
sas
soci
ated
wit
hth
ecl
uste
rs.M
odel
4:Eu
daim
onic
(E)P
erfo
rman
cesu
perv
isor
(PS)
.
(Clu
ster
1)
(Clu
ster
2)
(Clu
ster
3)
23
13
12
Pre
dic
tors
OR
(95%
CI)
OR
(95%
CI)
OR
(95%
CI)
OR
(95%
CI)
OR
(95%
CI)
OR
(95%
CI)
Sect
or(0
serv
ice
/1
prod
ucti
on)
0.46
**(0
.26–
0.81
)0.
57*
(0.3
4–0.
94)
2.18
**(1
.23–
3.86
)1.
76*
(1.0
7–2.
92)
Gen
der
(0fe
mal
e/
1m
ale)
1.56
*(1
.00–
2.44
)1.
93**
*(1
.30–
2.86
)0.
64*
(0.4
1–1.
00)
0.52
***
(0.3
5–0.
77)
Con
trac
t(0
tem
pora
ry/
1pe
rman
ent)
2.2
***
(1.4
6–3.
31)
2.06
**(1
.29–
3.28
)0.
45**
*(0
.30–
0.69
)0.
48**
(0.3
0–0.
77)
Age
<35
year
s0.
72*
(0.5
4–0.
96)
1.39
*(1
.04–
1.86
)35
-50
year
s0.
68**
(0.5
1–0.
91)
0.68
*(0
.50–
0.93
)1.
47**
(1.1
0–1.
95)
1.46
*(1
.07–
2.00
)>
50ye
ars
1.66
*(1
.07–
2.58
)0.
6*
(0.3
9–0.
94)
Occ
upat
iona
lcat
egor
y
Unq
ualifi
edm
anua
lwor
k1.
89*
(1.1
1–3.
20)
2.63
***
(1.5
0–4.
63)
0.53
*(0
.31–
0.90
)0.
38**
*(0
.22–
0.67
)Te
chni
cian
orad
min
istr
ativ
eH
ighl
yqu
alifi
edpr
ofes
sion
alM
anag
er0.
55*
(0.3
0–0.
99)
0.44
*(0
.22–
0.89
)1.
83*
(1.0
1–3.
34)
2.28
*(1
.13–
4.63
)
Ref
eren
cecl
uste
ris
inbr
acke
ts;C
lust
er1:
hE-
hPE
;Clu
ster
2:h
E-lP
E;C
lust
er3:
lE-l
PE;O
R:o
dds
rati
o;C
I:co
nfide
nce
inte
rval
;*p≤
0.05
,**
p≤
0.01
,***
p≤
0.00
1.
338
IJERPH 2019, 16, 479
3.4.1. Multidimensional Logistic Regression: Model 1 (H-PE)
The multinomial logistic regression analyses identified five predictors that explain clustermembership: the organization’s sector, gender, seniority in the position, educational level,and occupational category (see Table 3). The results show that the model has a good fit (−2 logLR = 679.06, X2 = 129.83, df = 24, p ≤ 0.001) (with LR being the likelihood ratio). The probability ofhaving high wellbeing and high performance is greater in the production sector and for managers.The probability of having medium low wellbeing and medium high performance is greater in theproduction sector, for people with more than 5 years of seniority, and for technicians/administrativework. The probability of having medium high wellbeing and medium low performance is greater inthe services sector, for people with less than 5 years of seniority, with professional training or highschool, and for technicians/administrative workers. Finally, the probability of having low wellbeingand low performance is greater in the services sector, for men, with no education or compulsoryeducation, and for technicians/administrative work.
Comparing Clusters 1 (high levels) and 4 (low levels), the production sector, women, people witha university degree, and managers are more likely to be in Cluster 1, whereas the services sector, men,people with no education or compulsory education, and technicians/administrative workers are morelikely to be in Cluster 4.
3.4.2. Multidimensional Logistic Regression: Model 2 (E-PE)
The multinomial logistic regression analyses identified five predictors that explain clustermembership: the organization’s sector, gender, age, educational level, and occupational category(see Table 4). The results show that the model has a good fit (−2 log LR = 777.45, X2 = 99.68,df = 27, p ≤ 0.001) The probability of having high wellbeing and high performance is greater inthe production sector, women, and managers. The probability of having medium low wellbeingand medium high performance is greater for men, people over 50 years old, and unqualifiedmanual workers or technicians/administrative workers. The probability of having medium highwellbeing and medium low performance is greater for women, and for unqualified manual workersor technicians/administrative workers. Finally, the probability of having low wellbeing and lowperformance is greater for the services sector, men, people with no education or compulsory education,and technicians/administrative workers.
Comparing Clusters 1 (high levels) and 4 (low levels), results are similar to those inOperationalization 1. The production sector, women, people with university degrees, and managersare more likely to be in Cluster 1, whereas the services sector, men, people with no education orcompulsory education, and technicians/administrative workers are more likely to be in Cluster 4.
3.4.3. Multidimensional Logistic Regression: Model 3 (H-PS)
The multinomial logistic regression analyses identified two predictors that explain clustermembership: type of contract and occupational category (see Table 5). The results show that themodel has a good fit (−2 log LR = 68.14, X2 = 38.70, df = 8, p ≤ 0.001). The probability of havinghigh wellbeing and high performance is greater for people with a temporary contract and for highlyqualified professionals or managers. The probability of having high wellbeing and low performance isgreater for people with a permanent contract and people who do unqualified manual work. Finally,the probability of having low wellbeing and low performance is greater for people with a temporarycontract and for unqualified manual workers or technicians/administrative workers.
Comparing Clusters 1 (high levels) and 3 (low levels), highly qualified professionals or managersare more likely to be in Cluster 1, whereas unqualified manual workers or technicians/administrativeworkers are more likely to be in Cluster 3.
339
IJERPH 2019, 16, 479
3.4.4. Multidimensional Logistic Regression: Model 4 (E-PS)
The multinomial logistic regression analyses identified five predictors that explain clustermembership: the organization’s sector, gender, type of contract, age, and occupational category(see Table 6). The results show that the model has a good fit (−2 log LR = 358.37, X2 = 60.39, df = 16,p ≤ 0.001). The probability of having high wellbeing and high performance is greater in the productionsector, women, people between 35-50 years old, people with a temporary contract, and managers.The probability of having high wellbeing and low performance is greater in the production sector,women, people under 35 years old, with a permanent contract, and who do unqualified manual work.Finally, the probability of having low wellbeing and low performance is greater for the services sector,men, people over 50 years old, with a permanent contract, and who do unqualified manual work.
Comparing Clusters 1 (high levels) and 3 (low levels), the production sector, women, peoplewith a temporary contract, between 35–50 years old, and managers are more likely to be in Cluster 1,whereas the services sector, men, people with a permanent contract, over 50 years old, and who dounqualified manual work are more likely to be in Cluster 3.
4. Discussion
The aim of the present study was to revisit the happy productive worker model, extendingit to consider not just the synergies between happiness and productivity, but also the antagonisticrelations between these two constructs. Moreover, we aimed to clarify the implications of differentoperationalizations of relevant theoretically-based constructs for the model. Finally, we aimed toidentify demographic antecedents for each cluster solution. In this way, this work has addressedimportant limitations of the happy-productive worker model by incorporating both the hedonic andeudaimonic components of wellbeing, considering different aspects of job performance as well as theirdifferent sources of evaluation, and focusing not just on the synergies between the two constructs(happiness and productivity), but also on the antagonistic relations, an issue that has hardly beenconsidered in the research based on the model.
The results support a different way to specify and expand the happy-productive worker model.Indeed, by analyzing the relationships between different constructs, we are not taking a positiverelationship that leads to being a “happy-productive” or “unhappy-unproductive” worker for granted.The present research has also contemplated a negative relationship between constructs that wouldappear on a daily basis and that would lead to being “happy-unproductive” or “unhappy-productive”at work. In this study, we provide an affirmative response to Research Question 1, which askswhether “employees show different patterns considering the antagonist relation beyond the traditionalsynergetic relation between performance and wellbeing (i.e., happy-productive)”. In fact, we havefound antagonist patterns of wellbeing and performance (i.e., happy-unproductive and, in somecases, unhappy-productive) that are well represented in our sample. We found these alternativepatterns by taking into account different operationalizations of wellbeing (i.e., hedonic, eudaimonic)and performance (i.e., self-rated, evaluated by the supervisor). In fact, the results indicate that, onaverage, over 50% of the respondents belong to the unhappy-productive/happy-unproductive clusters,which suggests that it is important to consider the antagonistic patterns of wellbeing and performancewhen re-defining the happy-productive worker thesis. Thus, we contribute to filling the gap identifiedby Warr and Nielsen [51], who pointed out that it is important to learn more about individualswho are outside the happy-productive pattern by considering additional measures of performanceand wellbeing.
In fact, Research Question 2 asks whether the same employees belong to the same patterns ofwellbeing and performance in their different operationalizations. The results show that a large numberof employees do not belong to analogous clusters in different operationalizations of wellbeing andperformance, which means that some employees are classified as unhappy in a hedonic way and,simultaneously, happy in an eudaimonic way (and vice-versa). This result draws our attention tothe complexity of the phenomenon of wellbeing and the importance of considering both the hedonic
340
IJERPH 2019, 16, 479
and eudaimonic dimensions in studies on wellbeing. It clearly shows that merely considering thehedonic aspect of wellbeing provides only half the picture. We believe future research should morethoroughly investigate the antecedents and outcomes for “hedonically-happy” and “eudaimonicallyunhappy” employees.
In addition, the results suggest that employees’ self-rated performance is often not reflectedin their supervisor’s evaluation of their performance. This draws our attention to the importanceof considering more than one source of evaluation of work performance in order to obtain validinformation about the employees’ task performance, extra-role performance, and creativity. It ispossible that the disparity in the evaluation of the employees’ performance level is due to the fact thatemployees might be more lenient when self-rating their general performance [38]. It is also possiblethat, when assessing their own performance, employees’ responses reflect not only their past behavior,but also their expectations of current and future behavior [58]. We think it would be interesting toinvestigate more in depth the reasons for the differences between employees’ ratings of their ownperformance and the ratings given by their direct supervisors.
Finally, the results provide an affirmative response to Research Question 3 about whether there areany demographic variables that play a role as antecedents of the clusters in different operationalizationsof the “happy-productive” worker. The existence of differences in the demographic variables betweenclusters provides yet another way to validate the clusters and the different operationalizations ofwellbeing and performance. This means that it is reasonable to expand the study of employees andtheir different outcomes at work to different patterns of wellbeing and performance, and includealternative configurations of “happy-unproductive” and “unhappy-productive” clusters.
Following the recommendations of Warr and Nielsen [51], we identified a number of situationaland personal features associated with membership in each profile when additional measures ofwellbeing and performance are considered. Our study examines whether personal features, suchas gender, age, and educational level, and situational features, such as sector, type of contract,occupational category, and seniority in the position, play a predictor role in the different profilesobtained, based on the operationalizations of wellbeing (hedonic-eudaimonic) and performance(self- or supervisor- evaluated) considered. The exploratory results provide relevant informationshowing that occupational category is the only variable with a predictor role in the four modelsstudied. Moreover, another situational variable (sector) and a personal variable (gender) significantlypredict the profiles in three of the four models studied. Interestingly, the type of contract is a significantantecedent in the two models in which the supervisors’ performance assessment is considered, whereasthe educational level is a significant antecedent in the two models where self-assessed performance isconsidered. More specifically, women, workers in the production sector, and management or highlyqualified professionals are more likely to be included in the happy-productive profile, whereas men,workers in the services sector, employees with a low education level, and technicians/administrativeworkers are more likely to be included in the unhappy-unproductive cluster.
We also identified the main features of employees included in the happy-unproductive profiles.These features differ across the four models studied. The “high hedonic/low performance (self-rated)”pattern is populated more by employees from the services sector with professional training andtechnician-administrative jobs. In the case of the “high eudaimonic/low performance (self-rated)”pattern, it is mostly composed of women and employees in unqualified or technician/administrativejobs. It is interesting to note that, when we look at the two similar profiles generated using supervisorratings of performance, the employees with a higher probability of belonging to these patterns (bothhedonic and eudaimonic) have permanent contracts and are employed in unqualified or manual jobs.Finally, it is interesting to identify the features that more often characterize employees included inthe unhappy/productive profiles. The employees included in the “low hedonic/high performance(self-rated)” profile work in the production sector, have seniority (>5 years) and professional education,and work in technician-administrative jobs. The employees included in the “low eudaimonic/highperformance (self-rated)” profile are mostly men over 50 years old working in unqualified-manual
341
IJERPH 2019, 16, 479
or technician-administrative jobs. Considering this complex picture of personal and situationalcharacteristics associated with the different profiles obtained with different types of wellbeing andperformance, we can conclude that the different models are not redundant, and different typesof wellbeing and different sources of performance need to be considered to better understand thehappy-productive worker model. Further research is needed to confirm the predictive power of thevariables studied and extend the study by including other personal and situational variables, in orderto better describe the employees in each profile.
In sum, the present study addresses a number of limitations of the happy productive workerthesis, and it sheds light on a number of issues that may clarify the previous inconsistencies ofthe model. First, this study included both the hedonic and eudaimonic aspects of wellbeing,coinciding with recent conceptualizations of wellbeing as having both pleasurable and meaningfulcomponents [3–5]. The identification of the hedonic “happy-productive” and “unhappy-unproductive”patterns coincides with studies indicating that there is a positive relationship between hedonicwellbeing and performance [13–18]. The identification of the “unhappy-productive” pattern agreeswith research that shows a negative relationship between positive affect and the dimensionsof performance [48]. Simultaneously, the identification of the eudaimonic “happy-productive”pattern supports research that suggests a synergetic relationship between eudaimonic wellbeingand performance [31]. These patterns support previous research showing that daily increases inperceived meaning at work were related to employees’ increased focus on tasks and greater exploratorybehavior [31]. Second, this study considers different dimensions and sources of evaluation ofemployees’ performance. On the one hand, we operationalize job performance as consisting of differentfacets or dimensions (i.e., in-role performance, extra-role performance, creative performance) that canhelp to capture its manifestations. On the other hand, we consider two sources of information aboutperformance: self-rated performance and performance rated by the direct supervisor. Third, the presentresearch analyzes alternative configurations that have not been considered in the happy-productiveworker thesis. It shows the importance of these alternative configurations, reflected by the number ofemployees who belong to the “happy-unproductive” and “unhappy-productive” clusters (over 50%on average), suggesting that the work reality is built on these antagonistic patterns, as well as on thesynergetic ones. Thus, antagonistic patterns should not be neglected in future research. Finally, thisstudy has identified a number of individual and situational features that significantly distinguish thedifferent profiles in each of the operationalizations of the happy-productive worker model.
Limitations
The current paper’s findings should be interpreted cautiously in light of several potentiallimitations. A limitation of the study is that most of the sample belonged to the services sector, althoughsome of the sample is from the production sector, including areas such as construction. This limitationquestions the representativeness of the results of underrepresented sectors. Services and productionsectors could certainly vary in their different types of procedures and practices, such as performanceevaluation or health and wellbeing promotion. The sample is more balanced in terms of gender, age,job category, or type of contract. In any case, this study represents a first approach to understandingthe diversity in the patterns of relationships between performance and wellbeing in organizations.A second limitation is the fact that self-rated performance and performance rated by supervisorswere not assessed with the same scale, due to the difficulties in obtaining responses from supervisorsabout all their subordinates (in fact, we had a high reduction in the sample when gathering data).This situation can raise some doubts about the reasons for the differences in performance-wellbeingpatterns when each of the measurement methods is used. Thus, these differences could be due todifferent performance measures rather than to different informants. However, both measures canbe considered global performance measures. Self-rated performance is a composite measure thatincludes the basic components of performance [34]. Performance rated by the supervisor measures
342
IJERPH 2019, 16, 479
global performance considering three global indicators: general performance, quality, and achievementof objectives.
5. Conclusions
This study shows that the relationship between wellbeing and performance is more complex thanthe HPWT proposes. Different operationalizations of these constructs need to be considered. Moreover,we found that a large percentage of respondents are grouped under the happy-unproductive or theunhappy-productive profiles. The results also indicate that employees can be unhappy in a hedonicway and, simultaneously, happy in an eudaimonic way (and vice versa). Finally, we show that thereare several significant antecedents of the patterns, in terms of demographic variables, in differentoperationalizations of wellbeing and performance.
Future studies on the antecedents and consequences of these patterns of wellbeing andperformance can be relevant for organizational practice because they might help to identify a broaderscope of employees’ profiles regarding their performance and wellbeing and the circumstances inwhich they experience synergies and antagonisms between these two important constructs.
In conclusion, the results of this study draw our attention to the fact that there can be differenttypologies of “happy-productive” workers that may take into account both hedonic and eudaimonicdimensions of wellbeing, as well as two different informants about the employees” work performance.As we can see, a large percentage of workers do not pertain to the conventional “happy-productive”or “unhappy-unproductive” patterns, but rather to the antagonistic quadrants of “unhappy butproductive” and “happy but unproductive”.
Author Contributions: Conceptualization, J.M.P, N.T., I.R.-M. and M.W.K.; data gathering and databases, N.T.and I.R.-M.; methodology, J.M..P, M.W.K. and I.R.-M.; formal analysis, M.W.K. and I.R.-M.; writing—original draftpreparation, M.W.K. and I.R.-M.; writing—review and editing, J.M.P. and N.T.; funding acquisition, J.M.P. andN.T.
Funding: The present study was funded by the MINECO/FEDER Research agencies: project PSI2012-36557funded by DGICYT and the project PSI2015-64862-R (MINECO/FEDER)
Conflicts of Interest: The authors declare no conflicts of interest.
References
1. Diener, E. Subjective well-being. The science of happiness and a proposal for a national index. Am. Psychol.2000, 55, 34–43. [CrossRef] [PubMed]
2. Ryff, C.D. Psychological well-being in adult life. Curr. Dir. Psychol. Sci. 1995, 4, 99–104. [CrossRef]3. Dolan, P. Happiness by Design; Hudson Street Press: New York, NY, USA, 2014.4. Keyes, C.L.M.; Shmotkin, D.; Ryff, C.D. Optimizing well-being: The empirical encounter of two traditions.
J. Pers. Soc. Psychol. 2002, 82, 1007–1022. [CrossRef] [PubMed]5. Linley, P.A.; Maltby, J.; Wood, A.M.; Osborne, G.; Hurling, R. Measuring happiness: The higher order factor
structure of subjective and psychological well-being measures. Pers. Individ. Differ. 2009, 47, 878–884.[CrossRef]
6. Ryan, R.M.; Deci, E.L. On happiness and human potentials: A review of research on hedonic and eudaimonicwell-being. Annu. Rev. Psychol. 2001, 52, 141–166. [CrossRef] [PubMed]
7. Cropanzano, R.; Wright, T.A. When a “happy” worker is really a “productive” worker: A review andfurther refinement of the happy-productive worker thesis. Consult. Psychol. J. Pract. Res. 2001, 53, 182–199.[CrossRef]
8. Wright, T.A.; Cropanzano, R.; Bonett, D.G. The moderating role of employee positive well being on therelation between job satisfaction and job performance. J. Occup. Health Psychol. 2007, 12, 93–104. [CrossRef][PubMed]
9. Beal, D.J.; Weiss, H.M.; Barros, E.; Macdermid, S.M. An Episodic Process Model of Affective Influences onPerformance. J. Appl. Psychol. 2005, 90, 1054–1068. [CrossRef]
10. Baptiste, N.R. Tightening the link between employee wellbeing at work and performance—A new dimensionfor HRM. Manag. Decis. 2008, 46, 284–309. [CrossRef]
343
IJERPH 2019, 16, 479
11. Schulte, P.; Vainio, H.M.D. Well-being at work—Overview and perspective. Scand. J. Work Environ. Health2010, 36, 422–429. [CrossRef] [PubMed]
12. Wright, T.; Cropanzano, R. Psychological well-being and job satisfaction as predictors of performance.J. Occup. Health Psychol. 2000, 5, 84–94. [CrossRef] [PubMed]
13. Mofoluwake, A.; Oluremi, A. Job satisfaction, organizational stress and employee performance: A study ofNAPIMS. IFE Psychol. 2013, 21, 75–82.
14. Fogaça, N.; Junior, F.A.C. Is “Happy Worker” More Productive. Manag. Stud. 2016, 4, 149–160.15. Hosie, P.; Willemyns, M.; Sevastos, P. The impact of happiness on managers’ contextual and task performance.
Asia Pac. J. Hum. Resour. 2012, 50, 268–287. [CrossRef]16. Böckerman, P.; Ilmakunnas, P. The job satisfaction-productivity nexus: A study using matched survey and
register data. Ind. Labor Relat. Rev. 2010, 65, 244–262. [CrossRef]17. Foo, M.-D.; Uy, M.A.; Baron, R.A. How do feelings influence effort? An empirical study of entrepreneurs’
affect and venture effort. J. Appl. Psychol. 2009, 94, 1086–1094. [CrossRef] [PubMed]18. Seo, M.-G.; Bartunek, J.M.; Feldman Barret, L. Conceptual Model. J. Organ. Behav. 2010, 31, 951–968.
[PubMed]19. Zelenski, J.M.; Murphy, S.A.; Jenkins, D.A. The happy-productive worker thesis revisited. J. Happiness Stud.
2008, 9, 521–537. [CrossRef]20. Binnewies, C.; Wörnlein, S.C. What makes a creative day? A diary study on the interplay between affect, job
stressors, and job control. J. Organ. Behav. 2011, 32, 589–607. [CrossRef]21. Rothbard, N.P.; Wilk, S.L. Waking up on the right or wrong side of the bed: Start-of-workday mood, work
events, employee affect, and performance. Acad. Manag. J. 2011, 54, 959–980. [CrossRef]22. Bowling, N.A. Is the job satisfaction-job performance relationship spurious? A meta-analytic examination.
J. Vocat. Behav. 2007, 71, 167–185. [CrossRef]23. Iaffaldano, M.T.; Muchinsky, P.M. Job satisfaction and job performance: A meta-analysis. Psychol. Bull. 1985,
97, 251–273. [CrossRef]24. Judge, T.A.; Thoresen, C.J.; Bono, J.E.; Patton, G.K. The job satisfaction-job performance relationship: A
qualitative and quantitative review. Psychol. Bull. 2001, 127, 376–407. [CrossRef] [PubMed]25. Greenberger, D.B.; Strasser, S.; Cummings, L.L.; Dunham, R.B. The impact of personal control on performance
and satisfaction. Organ. Behav. Hum. Decis. Process. 1989, 43, 29–51. [CrossRef]26. Peiró, J.M.; Ayala, Y.; Tordera, N.; Lorente, L.; Rodríguez, I. Sustainable wellbeing at work: A review and
reformulation. Pap. Psicólogo 2014, 35, 7–16.27. Rosso, B.D.; Dekas, K.H.; Wrzesniewski, A. On the meaning of work: A theoretical integration and review.
Res. Organ. Behav. 2010, 30, 91–127. [CrossRef]28. OECD. OECD Guidelines on Measuring Subjective Well-Being; OECD Publishing: Paris, France, 2013.29. Dolan, P.; Layard, R.; Metcalfe, R. Measuring Subjective Wellbeing for Public Policy; Office for National Statistics:
Newport, UK, 2011.30. White, M.P.; Dolan, P. Accounting for the richness of daily activities. Psychol. Sci. 2009, 20, 1000–1008.
[CrossRef]31. Sonnentag, S. Dynamics of well-being. Annu. Rev. Organ. Psychol. Organ. Behav. 2015, 2, 261–293. [CrossRef]32. Niessen, C.; Sonnentag, S.; Sach, F. Thriving at work—A diary study. J. Organ. Behav. 2012, 33, 468–487.
[CrossRef]33. Ford, M.T.; Cerasoli, C.P.; Higgins, J.A.; Decesare, A. Relationships between psychological, physical, and
behavioural health and work performance: A review and meta-analysis. Work Stress 2011, 25, 185–204.[CrossRef]
34. Koopmans, L.; Bernaards, C.M.; Hildebrandt, V.H.; Schaufeli, W.B.; de Vet, H.C.W.; van der Beek, A.J.Conceptual frameworks of individual work performance: A systematic review. J. Occup. Environ. Med. 2011,53, 856–866. [CrossRef] [PubMed]
35. LePine, J.A.; Erez, A.; Johnson, D.E. The nature and dimensionality of organizational citizenship behavior: Acritical review and meta-analysis. J. Appl. Psychol. 2002, 87, 52–65. [CrossRef] [PubMed]
36. Oldham, G.R.; Cummings, A. Employee creativity: Personal and contextual factors at work. Acad. Manag. J.1996, 39, 607–634.
37. Länsisalmi, H.; Kivimäki, M.; Elovainio, M. Is underutilization of knowledge, skills, and abilities a majorbarrier to innovation? Psychol. Rep. 2004, 94, 739–750. [CrossRef] [PubMed]
344
IJERPH 2019, 16, 479
38. Hosie, P.J.; Sevastos, P. Does the “happy-productive worker” thesis apply to managers? Int. J. WorkHealth Manag. 2009, 2, 131–160. [CrossRef]
39. Heidemeier, H.; Moser, K. Self-other agreement in job performance ratings: A meta-analytic test of a processmodel. J. Appl. Psychol. 2009, 94, 353–370. [CrossRef] [PubMed]
40. Conway, J.M.; Huffcutt, A.I. Psychometric properties of multisource performance ratings: A meta-analysisof subordinate, supervisor, peer, and self-ratings. Hum. Perform. 1997, 10, 331–360. [CrossRef]
41. Akkermans, J.; Brenninkmeijer, V.; Van den Bossche, S.N.J.; Blonk, R.W.B.; Schaufeli, W.B. Young and goingstrong? A longitudinal study on occupational health among young employees of difference educationallevels. Career Dev. Int. 2013, 18, 416–435. [CrossRef]
42. Fisher, C.D.; Noble, C.S. A within-person examination of correlates of performance and emotions whileworking. Hum. Perform. 2004, 17, 145–168. [CrossRef]
43. Seo, M.; Ilies, R. Organizational Behavior and Human Decision Processes The role of self-efficacy, goal,and affect in dynamic motivational self-regulation. Organ. Behav. Hum. Decis. Process. 2009, 109, 120–133.[CrossRef]
44. Harris, C.; Daniels, K.; Briner, R.B. A daily diary study of goals and affective well-being at work. J. Occup.Organ. Psychol. 2003, 76, 401–410. [CrossRef]
45. Hoppmann, C.A.; Klumb, P.L. Daily management of work and family goals in employed parents.J. Vocat. Behav. 2012, 81, 191–198. [CrossRef]
46. Scott, B.A.; Colquitt, J.A.; Paddock, E.L.; Judge, T.A. A daily investigation of the role of manager empathy onemployee well-being. Organ. Behav. Hum. Decis. Process. 2010, 113, 127–140. [CrossRef]
47. Hakanen, J.J.; Perhoniemi, R.; Toppinen-Tammer, S. Positive gain spirals at work: From job resources to workengagement, personal initiative and work-unit innovativeness. J. Vocat. Behav. 2008, 73, 78–91. [CrossRef]
48. Baron, R.A.; Hmieleski, K.M.; Henry, R.A. Entrepreneurs’ dispositional positive affect: The potential benefitsand potential costs of being “up”. J. Bus. Ventur. 2012, 27, 310–324. [CrossRef]
49. Bledow, R.; Rosing, K.; Frese, M. A dynamic perspective on affect and creativity. Acad. Manag. J. 2013, 56,432–450. [CrossRef]
50. Ayala, Y.; Peiró, J.M.; Tordera, N.; Lorente, L.; Yeves, J. Job satisfaction and innovative performance in youngSpanish employees: Testing new patterns in the Happy-Productive Worker Thesis. A discriminant study.J. Happiness Stud. 2017, 18, 1377–1401. [CrossRef]
51. Warr, P.; Nielsen, K. Wellbeing and work performance. In Handbook of Well-Being; Diener, E., Oishi, S., Tay, L.,Eds.; DEF Publishers: Salt Lake City, UT, USA, 2018.
52. Cooper, C.L.; Rout, U.; Faragher, B. Mental health, job satisfaction, and job stress among general practitioners.Br. Med. J. 1989, 298, 366–370. [CrossRef]
53. Ryff, C.D. Happiness is everything, or is it? explorations on the meaning of psychological well-being.J. Personal. Soc. Psychol. 1989, 57, 1069–1081. [CrossRef]
54. Williams, L.; Anderson, S. Job Satisfaction and Organizational Commitment as Predictors of organizationalcitizenship and in-role behaviors. J. Manag. 1991, 17, 601–617. [CrossRef]
55. Mackenzie, S.B.; Podsakoff, P.M.; Podsakoff, N.P. Challenge oriented organizational citizenship behaviorsand organizational effectiveness: Do challenge-oriented behaviors really have an impact on the organization’sbottom line. Pers. Psychol. 2011, 64, 559–592. [CrossRef]
56. Chiu, T.; Fang, D.; Chen, J.; Wang, Y.; Jeris, C. A robust and scalable clustering algorithm for mixed typeattributes in large database environment. In Proceedings of the 7th ACM SIGKDD International Conferencein Knowledge Discovery and Data Mining, Association for Computing Machinery, San Francisco, CA, USA,26–29 August 2001; pp. 263–268.
57. Mooi, E.; Sarstedt, M. Cluster analysis. In A Concise Guide to Market Research; Mooi, E., Sarstedt, M., Eds.;Springer: Heidelberg, Germany, 2010; pp. 237–284.
58. Kent, P.; Jensen, R.K.; Kongsted, A. A comparison of three clustering methods for finding subgroups in MRI,SMS or clinical data: SPSS TwoStep Cluster analysis, Latent Gold and SNOB. BMC Med. Res. Methodol. 2014,14, 113. [CrossRef] [PubMed]
© 2019 by the authors. Licensee MDPI, Basel, Switzerland. This article is an open accessarticle distributed under the terms and conditions of the Creative Commons Attribution(CC BY) license (http://creativecommons.org/licenses/by/4.0/).
345
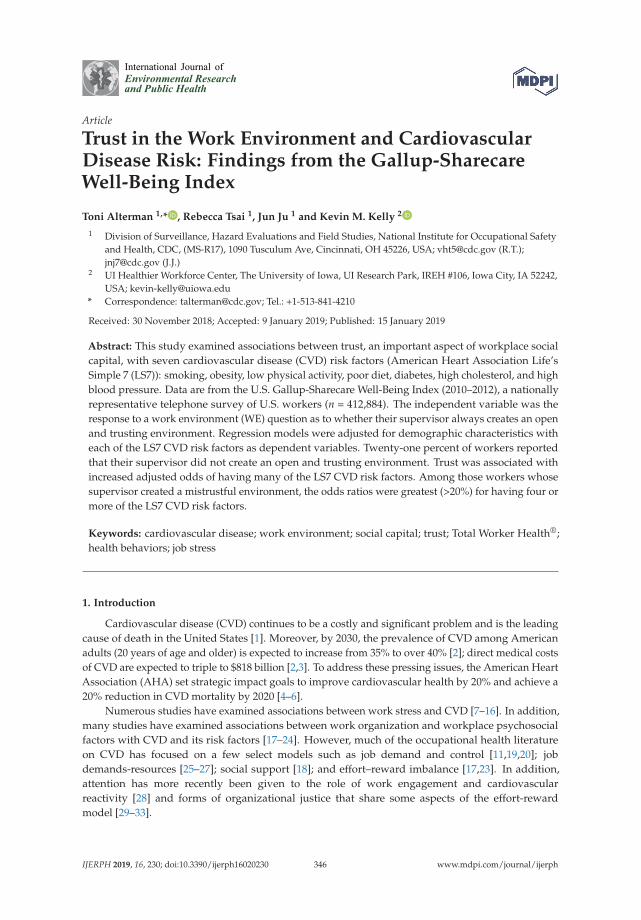
International Journal of
Environmental Research
and Public Health
Article
Trust in the Work Environment and CardiovascularDisease Risk: Findings from the Gallup-SharecareWell-Being Index
Toni Alterman 1,* , Rebecca Tsai 1, Jun Ju 1 and Kevin M. Kelly 2
1 Division of Surveillance, Hazard Evaluations and Field Studies, National Institute for Occupational Safetyand Health, CDC, (MS-R17), 1090 Tusculum Ave, Cincinnati, OH 45226, USA; [email protected] (R.T.);[email protected] (J.J.)
2 UI Healthier Workforce Center, The University of Iowa, UI Research Park, IREH #106, Iowa City, IA 52242,USA; [email protected]
* Correspondence: [email protected]; Tel.: +1-513-841-4210
Received: 30 November 2018; Accepted: 9 January 2019; Published: 15 January 2019
Abstract: This study examined associations between trust, an important aspect of workplace socialcapital, with seven cardiovascular disease (CVD) risk factors (American Heart Association Life’sSimple 7 (LS7)): smoking, obesity, low physical activity, poor diet, diabetes, high cholesterol, and highblood pressure. Data are from the U.S. Gallup-Sharecare Well-Being Index (2010–2012), a nationallyrepresentative telephone survey of U.S. workers (n = 412,884). The independent variable was theresponse to a work environment (WE) question as to whether their supervisor always creates an openand trusting environment. Regression models were adjusted for demographic characteristics witheach of the LS7 CVD risk factors as dependent variables. Twenty-one percent of workers reportedthat their supervisor did not create an open and trusting environment. Trust was associated withincreased adjusted odds of having many of the LS7 CVD risk factors. Among those workers whosesupervisor created a mistrustful environment, the odds ratios were greatest (>20%) for having four ormore of the LS7 CVD risk factors.
Keywords: cardiovascular disease; work environment; social capital; trust; Total Worker Health®;health behaviors; job stress
1. Introduction
Cardiovascular disease (CVD) continues to be a costly and significant problem and is the leadingcause of death in the United States [1]. Moreover, by 2030, the prevalence of CVD among Americanadults (20 years of age and older) is expected to increase from 35% to over 40% [2]; direct medical costsof CVD are expected to triple to $818 billion [2,3]. To address these pressing issues, the American HeartAssociation (AHA) set strategic impact goals to improve cardiovascular health by 20% and achieve a20% reduction in CVD mortality by 2020 [4–6].
Numerous studies have examined associations between work stress and CVD [7–16]. In addition,many studies have examined associations between work organization and workplace psychosocialfactors with CVD and its risk factors [17–24]. However, much of the occupational health literatureon CVD has focused on a few select models such as job demand and control [11,19,20]; jobdemands-resources [25–27]; social support [18]; and effort–reward imbalance [17,23]. In addition,attention has more recently been given to the role of work engagement and cardiovascularreactivity [28] and forms of organizational justice that share some aspects of the effort-rewardmodel [29–33].
IJERPH 2019, 16, 230; doi:10.3390/ijerph16020230 www.mdpi.com/journal/ijerph346
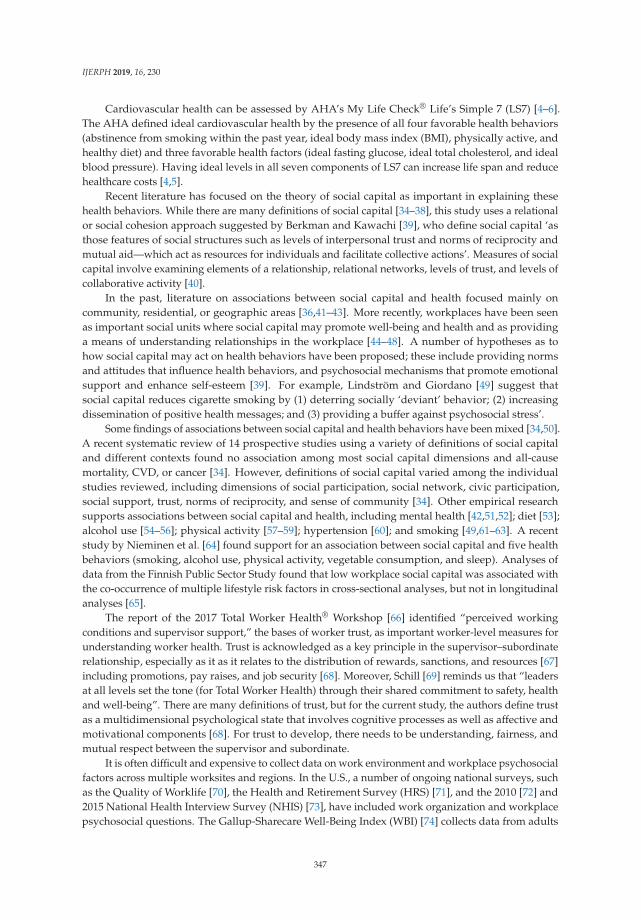
IJERPH 2019, 16, 230
Cardiovascular health can be assessed by AHA’s My Life Check® Life’s Simple 7 (LS7) [4–6].The AHA defined ideal cardiovascular health by the presence of all four favorable health behaviors(abstinence from smoking within the past year, ideal body mass index (BMI), physically active, andhealthy diet) and three favorable health factors (ideal fasting glucose, ideal total cholesterol, and idealblood pressure). Having ideal levels in all seven components of LS7 can increase life span and reducehealthcare costs [4,5].
Recent literature has focused on the theory of social capital as important in explaining thesehealth behaviors. While there are many definitions of social capital [34–38], this study uses a relationalor social cohesion approach suggested by Berkman and Kawachi [39], who define social capital ‘asthose features of social structures such as levels of interpersonal trust and norms of reciprocity andmutual aid—which act as resources for individuals and facilitate collective actions’. Measures of socialcapital involve examining elements of a relationship, relational networks, levels of trust, and levels ofcollaborative activity [40].
In the past, literature on associations between social capital and health focused mainly oncommunity, residential, or geographic areas [36,41–43]. More recently, workplaces have been seenas important social units where social capital may promote well-being and health and as providinga means of understanding relationships in the workplace [44–48]. A number of hypotheses as tohow social capital may act on health behaviors have been proposed; these include providing normsand attitudes that influence health behaviors, and psychosocial mechanisms that promote emotionalsupport and enhance self-esteem [39]. For example, Lindström and Giordano [49] suggest thatsocial capital reduces cigarette smoking by (1) deterring socially ‘deviant’ behavior; (2) increasingdissemination of positive health messages; and (3) providing a buffer against psychosocial stress’.
Some findings of associations between social capital and health behaviors have been mixed [34,50].A recent systematic review of 14 prospective studies using a variety of definitions of social capitaland different contexts found no association among most social capital dimensions and all-causemortality, CVD, or cancer [34]. However, definitions of social capital varied among the individualstudies reviewed, including dimensions of social participation, social network, civic participation,social support, trust, norms of reciprocity, and sense of community [34]. Other empirical researchsupports associations between social capital and health, including mental health [42,51,52]; diet [53];alcohol use [54–56]; physical activity [57–59]; hypertension [60]; and smoking [49,61–63]. A recentstudy by Nieminen et al. [64] found support for an association between social capital and five healthbehaviors (smoking, alcohol use, physical activity, vegetable consumption, and sleep). Analyses ofdata from the Finnish Public Sector Study found that low workplace social capital was associated withthe co-occurrence of multiple lifestyle risk factors in cross-sectional analyses, but not in longitudinalanalyses [65].
The report of the 2017 Total Worker Health® Workshop [66] identified “perceived workingconditions and supervisor support,” the bases of worker trust, as important worker-level measures forunderstanding worker health. Trust is acknowledged as a key principle in the supervisor–subordinaterelationship, especially as it as it relates to the distribution of rewards, sanctions, and resources [67]including promotions, pay raises, and job security [68]. Moreover, Schill [69] reminds us that “leadersat all levels set the tone (for Total Worker Health) through their shared commitment to safety, healthand well-being”. There are many definitions of trust, but for the current study, the authors define trustas a multidimensional psychological state that involves cognitive processes as well as affective andmotivational components [68]. For trust to develop, there needs to be understanding, fairness, andmutual respect between the supervisor and subordinate.
It is often difficult and expensive to collect data on work environment and workplace psychosocialfactors across multiple worksites and regions. In the U.S., a number of ongoing national surveys, suchas the Quality of Worklife [70], the Health and Retirement Survey (HRS) [71], and the 2010 [72] and2015 National Health Interview Survey (NHIS) [73], have included work organization and workplacepsychosocial questions. The Gallup-Sharecare Well-Being Index (WBI) [74] collects data from adults
347
IJERPH 2019, 16, 230
18 years and older living in the United States, including questions on work environment (WE). Anumber of studies have used the Gallup survey to look at health and well-being [74–78], but fewhave specifically focused on the work environment questions associated with social capital in relationto health.
The current study examines whether trust, an important aspects of social capital, is associatedwith the seven CVD risk factors identified in the AHA LS7 screening tool. Increasing social capital mayimprove health behaviors and outcomes directly, or in conjunction with workplace prevention andintervention programs. Due to the gender differences in the prevalence, progression, and underlyingmechanisms in CVD, results are presented separately for women and men [79].
2. Materials and Methods
2.1. Data Source
Data for this study are based on the Gallup-Sharecare Well-Being Index (WBI) survey conductedbetween 2010 and 2012 in the United States. Every day, the Gallup Organization conductscomputer-assisted telephone interviews (in English or Spanish) with 1000 randomly sampled U.S.adults (≥18 years of age) on political, economic, and well-being topics. Random-digit-dial (RDD) tolandlines and cell phones was used to reach wireless-only and wireless-mostly households. Althoughthe response rate is low, 9–11%, it is estimated that the Gallup sample covers more than 95% of theU.S. adult population. Gallup weights data daily to account for disproportionate selection in age,sex, geographic region, gender, education level, ethnicity, race, self-reported location, and phone usestatus [73].
2.2. Study Population
The sample consists of survey participants interviewed between 2010 and 2012 who reportedbeing currently employed by an employer for at least 30 h per week. Only workers who were employedby an employer were selected because this study focuses on supervisor behavior. In addition, full-timeworkers (i.e., those working 30 or more hours per week) were selected because results from this studywould be more relevant to those who spend a greater proportion of their time at work, than thoseworking part time.
2.3. Measures
Life’s Simple 7: The WBI included questions that address the seven cardiovascular healthcomponents of the LS7, but are not a complete match to the AHA definition. Figure 1 shows howthe authors adapted WBI questions to match AHA’s LS7 components. For blood pressure, the WBIasks if the respondent had ever been told by a physician or nurse that they had high blood pressure(yes = high blood pressure). The LS7 defines high blood pressure as >120/80 mm Hg. Similarly, theWBI asks if the respondent had ever been told by a physician or nurse that they had high cholesterol,(yes = high cholesterol). The LS7 defines high cholesterol as total cholesterol >200 mg/dL. Diabetesin the WBI is measured by the response to a question about whether the respondent had been toldby a physician or nurse that they had diabetes (yes = diabetes). The LS7 defines diabetes as a fastingplasma glucose >100 mg/dL. The study definition for at-risk BMI (based on self-reported height andweight), or obesity, was BMI ≥ 30 kg/m2; the LS7 definition for at-risk BMI is ≥25 kg/m2. For diet,the WBI asks respondents the number of days per week they consumed five or more servings offruits or vegetables. For this study, a healthy diet was defined as consuming five or more servings offruits or vegetables seven days per week; adequate consumption on less than seven days was definedas a poor diet. The LS7′s dietary assessment requires additional information such as the amount offish, sodium, whole grains, and sugary beverages consumed daily or weekly. Similarly, for physicalactivity, the WBI asks about the number of days of exercise for at least 30 min during the past week,but does not ask about the intensity of physical activity. The LS7 definition includes the amount of
348
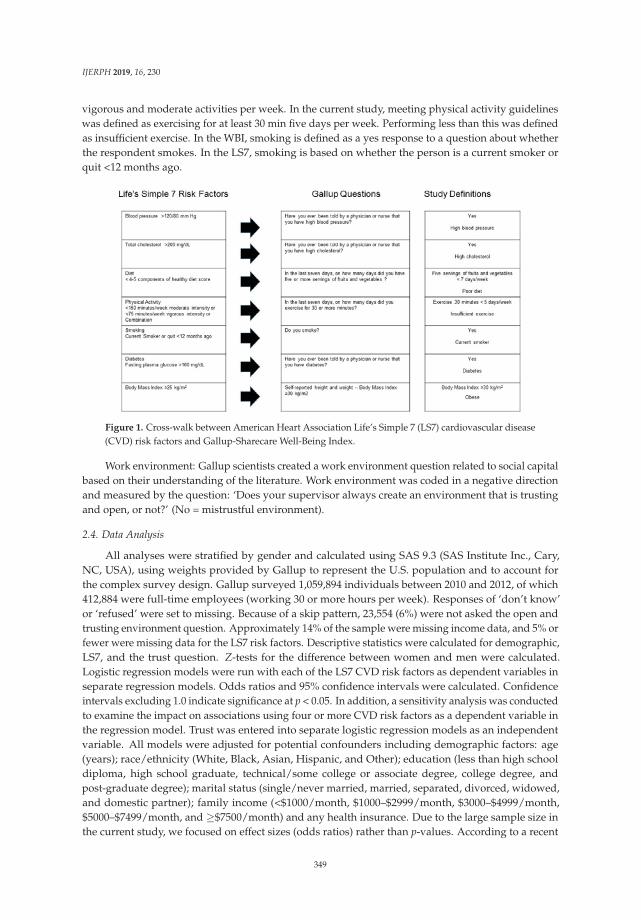
IJERPH 2019, 16, 230
vigorous and moderate activities per week. In the current study, meeting physical activity guidelineswas defined as exercising for at least 30 min five days per week. Performing less than this was definedas insufficient exercise. In the WBI, smoking is defined as a yes response to a question about whetherthe respondent smokes. In the LS7, smoking is based on whether the person is a current smoker orquit <12 months ago.
Figure 1. Cross-walk between American Heart Association Life’s Simple 7 (LS7) cardiovascular disease(CVD) risk factors and Gallup-Sharecare Well-Being Index.
Work environment: Gallup scientists created a work environment question related to social capitalbased on their understanding of the literature. Work environment was coded in a negative directionand measured by the question: ‘Does your supervisor always create an environment that is trustingand open, or not?’ (No = mistrustful environment).
2.4. Data Analysis
All analyses were stratified by gender and calculated using SAS 9.3 (SAS Institute Inc., Cary,NC, USA), using weights provided by Gallup to represent the U.S. population and to account forthe complex survey design. Gallup surveyed 1,059,894 individuals between 2010 and 2012, of which412,884 were full-time employees (working 30 or more hours per week). Responses of ‘don’t know’or ‘refused’ were set to missing. Because of a skip pattern, 23,554 (6%) were not asked the open andtrusting environment question. Approximately 14% of the sample were missing income data, and 5% orfewer were missing data for the LS7 risk factors. Descriptive statistics were calculated for demographic,LS7, and the trust question. Z-tests for the difference between women and men were calculated.Logistic regression models were run with each of the LS7 CVD risk factors as dependent variables inseparate regression models. Odds ratios and 95% confidence intervals were calculated. Confidenceintervals excluding 1.0 indicate significance at p < 0.05. In addition, a sensitivity analysis was conductedto examine the impact on associations using four or more CVD risk factors as a dependent variable inthe regression model. Trust was entered into separate logistic regression models as an independentvariable. All models were adjusted for potential confounders including demographic factors: age(years); race/ethnicity (White, Black, Asian, Hispanic, and Other); education (less than high schooldiploma, high school graduate, technical/some college or associate degree, college degree, andpost-graduate degree); marital status (single/never married, married, separated, divorced, widowed,and domestic partner); family income (<$1000/month, $1000–$2999/month, $3000–$4999/month,$5000–$7499/month, and ≥$7500/month) and any health insurance. Due to the large sample size inthe current study, we focused on effect sizes (odds ratios) rather than p-values. According to a recent
349
IJERPH 2019, 16, 230
policy statement by the American Statistical Association on p-values and statistical significance, anyeffect, no matter how tiny, can produce a small p-value if the sample size is large enough [80].
3. Results
Demographic characteristics: Forty-two percent of the sample were women. Descriptive statisticsfor workers stratified by gender and trust are presented in Table 1. For both women and men, thelargest percent of respondents (72.0% and 72.2%, respectively) were White, Non-Hispanic with a meanage of about 42. More than half of the respondents were married and had either technical training orsome college.
Mistrustful environment: Approximately 22% of women and 20.3% of men indicated that theirsupervisor did not always create an open and trusting environment (Table 1). As shown in Table 1, forboth women and men, the highest prevalence of mistrust reported was among workers ages 45–64,(women = 24.4%, men = 23.0%) followed by workers ages 30–44 (women = 22.3%, men = 20.5%).Black women (23.2%), followed by White women (22.4%) had the highest prevalence of reportingthat their supervisor does not create an open and trusting environment, compared with women ofother races/ethnicities (Asian, Hispanic, Other). White men (21.1%) followed by Black men (20.6%)reported higher prevalence of a mistrustful environment. Prevalence of a mistrustful environment washigher for women with increasing levels of education (highest for those with college or post-graduateeducation, 25.2%). Men with technical training or some college/associate degree had a slightly higherprevalence (20.9%) of a mistrustful environment. Divorced women (26.8%) and men (24.7%) had thehighest prevalence of reporting a mistrustful work environment. Prevalence by income was similar forboth women and men, with slightly higher prevalence of a mistrustful environment for those earning$3000–$4999 per month among women (23.0%) and for those earning $5000–$7499 among men (21.7%).
350
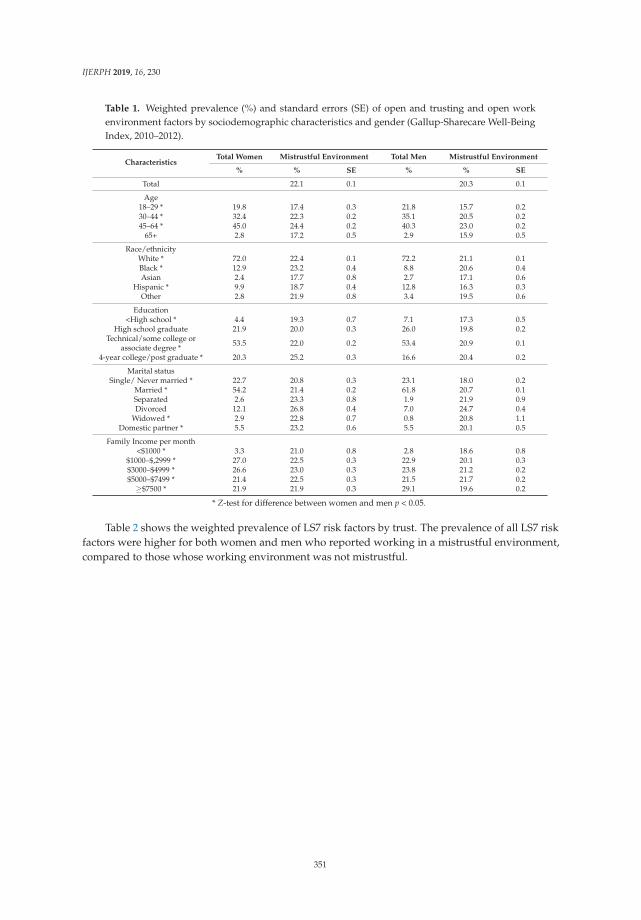
IJERPH 2019, 16, 230
Table 1. Weighted prevalence (%) and standard errors (SE) of open and trusting and open workenvironment factors by sociodemographic characteristics and gender (Gallup-Sharecare Well-BeingIndex, 2010–2012).
CharacteristicsTotal Women Mistrustful Environment Total Men Mistrustful Environment
% % SE % % SE
Total 22.1 0.1 20.3 0.1
Age18–29 * 19.8 17.4 0.3 21.8 15.7 0.230–44 * 32.4 22.3 0.2 35.1 20.5 0.245–64 * 45.0 24.4 0.2 40.3 23.0 0.2
65+ 2.8 17.2 0.5 2.9 15.9 0.5
Race/ethnicityWhite * 72.0 22.4 0.1 72.2 21.1 0.1Black * 12.9 23.2 0.4 8.8 20.6 0.4Asian 2.4 17.7 0.8 2.7 17.1 0.6
Hispanic * 9.9 18.7 0.4 12.8 16.3 0.3Other 2.8 21.9 0.8 3.4 19.5 0.6
Education<High school * 4.4 19.3 0.7 7.1 17.3 0.5
High school graduate 21.9 20.0 0.3 26.0 19.8 0.2Technical/some college or
associate degree * 53.5 22.0 0.2 53.4 20.9 0.1
4-year college/post graduate * 20.3 25.2 0.3 16.6 20.4 0.2
Marital statusSingle/ Never married * 22.7 20.8 0.3 23.1 18.0 0.2
Married * 54.2 21.4 0.2 61.8 20.7 0.1Separated 2.6 23.3 0.8 1.9 21.9 0.9Divorced 12.1 26.8 0.4 7.0 24.7 0.4
Widowed * 2.9 22.8 0.7 0.8 20.8 1.1Domestic partner * 5.5 23.2 0.6 5.5 20.1 0.5
Family Income per month<$1000 * 3.3 21.0 0.8 2.8 18.6 0.8
$1000–$,2999 * 27.0 22.5 0.3 22.9 20.1 0.3$3000–$4999 * 26.6 23.0 0.3 23.8 21.2 0.2$5000–$7499 * 21.4 22.5 0.3 21.5 21.7 0.2
≥$7500 * 21.9 21.9 0.3 29.1 19.6 0.2
* Z-test for difference between women and men p < 0.05.
Table 2 shows the weighted prevalence of LS7 risk factors by trust. The prevalence of all LS7 riskfactors were higher for both women and men who reported working in a mistrustful environment,compared to those whose working environment was not mistrustful.
351
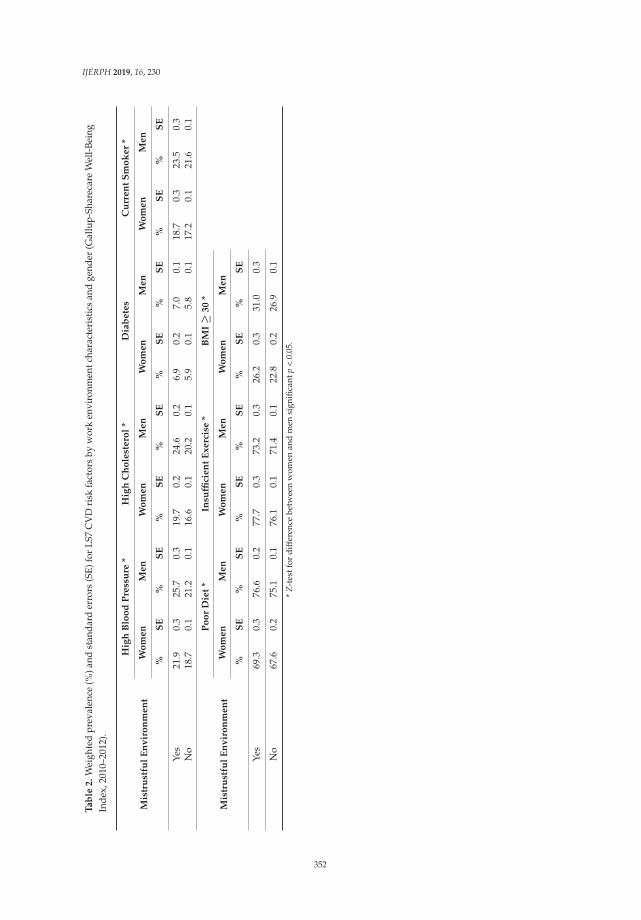
IJERPH 2019, 16, 230
Ta
ble
2.
Wei
ghte
dpr
eval
ence
(%)a
ndst
anda
rder
rors
(SE)
for
LS7
CV
Dri
skfa
ctor
sby
wor
ken
viro
nmen
tcha
ract
eris
tics
and
gend
er(G
allu
p-Sh
arec
are
Wel
l-Be
ing
Inde
x,20
10–2
012)
.
Mis
tru
stfu
lE
nv
iro
nm
en
t
Hig
hB
loo
dP
ress
ure
*H
igh
Ch
ole
ste
rol
*D
iab
ete
sC
urr
en
tS
mo
ke
r*
Wo
me
nM
en
Wo
me
nM
en
Wo
me
nM
en
Wo
me
nM
en
%S
E%
SE
%S
E%
SE
%S
E%
SE
%S
E%
SE
Yes
21.9
0.3
25.7
0.3
19.7
0.2
24.6
0.2
6.9
0.2
7.0
0.1
18.7
0.3
23.5
0.3
No
18.7
0.1
21.2
0.1
16.6
0.1
20.2
0.1
5.9
0.1
5.8
0.1
17.2
0.1
21.6
0.1
Mis
tru
stfu
lE
nv
iro
nm
en
t
Po
or
Die
t*
Insu
ffici
en
tE
xe
rcis
e*
BM
I≥
30
*
Wo
me
nM
en
Wo
me
nM
en
Wo
me
nM
en
%S
E%
SE
%S
E%
SE
%S
E%
SE
Yes
69.3
0.3
76.6
0.2
77.7
0.3
73.2
0.3
26.2
0.3
31.0
0.3
No
67.6
0.2
75.1
0.1
76.1
0.1
71.4
0.1
22.8
0.2
26.9
0.1
*Z
-tes
tfor
diff
eren
cebe
twee
nw
omen
and
men
sign
ifica
ntp
<0.
05.
352
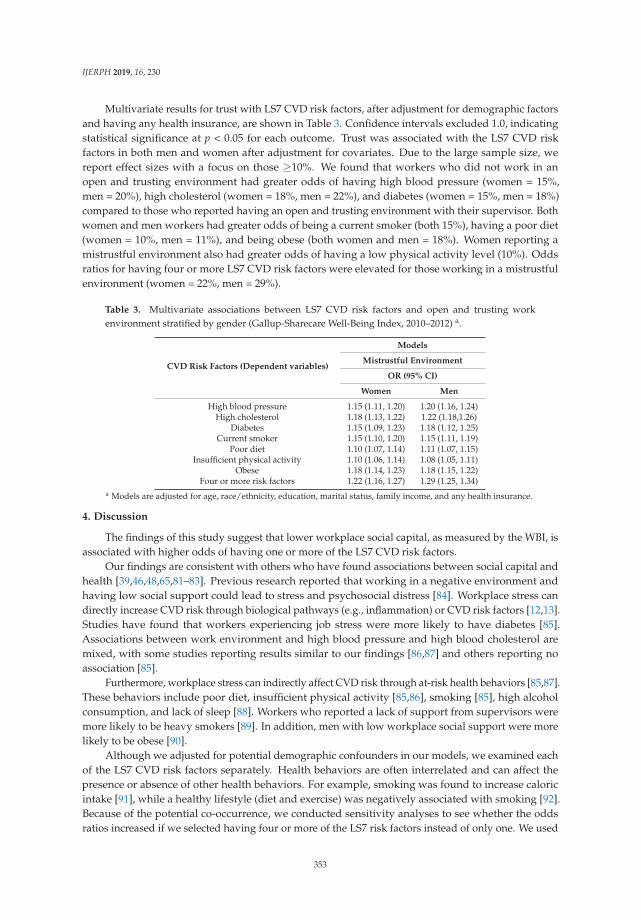
IJERPH 2019, 16, 230
Multivariate results for trust with LS7 CVD risk factors, after adjustment for demographic factorsand having any health insurance, are shown in Table 3. Confidence intervals excluded 1.0, indicatingstatistical significance at p < 0.05 for each outcome. Trust was associated with the LS7 CVD riskfactors in both men and women after adjustment for covariates. Due to the large sample size, wereport effect sizes with a focus on those ≥10%. We found that workers who did not work in anopen and trusting environment had greater odds of having high blood pressure (women = 15%,men = 20%), high cholesterol (women = 18%, men = 22%), and diabetes (women = 15%, men = 18%)compared to those who reported having an open and trusting environment with their supervisor. Bothwomen and men workers had greater odds of being a current smoker (both 15%), having a poor diet(women = 10%, men = 11%), and being obese (both women and men = 18%). Women reporting amistrustful environment also had greater odds of having a low physical activity level (10%). Oddsratios for having four or more LS7 CVD risk factors were elevated for those working in a mistrustfulenvironment (women = 22%, men = 29%).
Table 3. Multivariate associations between LS7 CVD risk factors and open and trusting workenvironment stratified by gender (Gallup-Sharecare Well-Being Index, 2010–2012) a.
CVD Risk Factors (Dependent variables)
Models
Mistrustful Environment
OR (95% CI)
Women Men
High blood pressure 1.15 (1.11, 1.20) 1.20 (1.16, 1.24)High cholesterol 1.18 (1.13, 1.22) 1.22 (1.18,1.26)
Diabetes 1.15 (1.09, 1.23) 1.18 (1.12, 1.25)Current smoker 1.15 (1.10, 1.20) 1.15 (1.11, 1.19)
Poor diet 1.10 (1.07, 1.14) 1.11 (1.07, 1.15)Insufficient physical activity 1.10 (1.06, 1.14) 1.08 (1.05, 1.11)
Obese 1.18 (1.14, 1.23) 1.18 (1.15, 1.22)Four or more risk factors 1.22 (1.16, 1.27) 1.29 (1.25, 1.34)
a Models are adjusted for age, race/ethnicity, education, marital status, family income, and any health insurance.
4. Discussion
The findings of this study suggest that lower workplace social capital, as measured by the WBI, isassociated with higher odds of having one or more of the LS7 CVD risk factors.
Our findings are consistent with others who have found associations between social capital andhealth [39,46,48,65,81–83]. Previous research reported that working in a negative environment andhaving low social support could lead to stress and psychosocial distress [84]. Workplace stress candirectly increase CVD risk through biological pathways (e.g., inflammation) or CVD risk factors [12,13].Studies have found that workers experiencing job stress were more likely to have diabetes [85].Associations between work environment and high blood pressure and high blood cholesterol aremixed, with some studies reporting results similar to our findings [86,87] and others reporting noassociation [85].
Furthermore, workplace stress can indirectly affect CVD risk through at-risk health behaviors [85,87].These behaviors include poor diet, insufficient physical activity [85,86], smoking [85], high alcoholconsumption, and lack of sleep [88]. Workers who reported a lack of support from supervisors weremore likely to be heavy smokers [89]. In addition, men with low workplace social support were morelikely to be obese [90].
Although we adjusted for potential demographic confounders in our models, we examined eachof the LS7 CVD risk factors separately. Health behaviors are often interrelated and can affect thepresence or absence of other health behaviors. For example, smoking was found to increase caloricintake [91], while a healthy lifestyle (diet and exercise) was negatively associated with smoking [92].Because of the potential co-occurrence, we conducted sensitivity analyses to see whether the oddsratios increased if we selected having four or more of the LS7 risk factors instead of only one. We used
353
IJERPH 2019, 16, 230
this as the dependent variable in our regression models. Both women (22%) and men (29%) showed anincrease in odds for having four or more LS7 risk factors if they indicated that their supervisor did notcreate an open and trusting environment.
Analyses were presented separately by gender, not only due to the differences in CVD riskbetween women and men, but also due to the importance of gender in the social capital and managerialpsychology literature [93]. Odds ratios were similar for both genders when the LS7 factors were lookedat individually, and slightly higher among men when the dependent variable was having four or moreLS7 factors.
Improvements to the work environment are needed to reduce CVD risk among workers. Socialmodification to the work environment, such as adjusting managerial style to create an open andtrusting environment, can decrease work stress. Considering managerial trust from a Total WorkerHealth® framework meets the goals of illness prevention to advance worker well-being. Efforts canalso be made to target the health behaviors themselves. There are a range of possible strategies foraddressing the LS7 risk factors in the workplace. For example, physical modification to the workenvironment, such as installing sit/stand desk stations and walking workstations, can reduce sedentarybehavior and may increase physical activity. Additionally, increased access to nutritious food in theworkplace may improve diet. Supervisors who support workplace wellness may help in reducingCVD risk factor in workers [94].
Strengths and Limitations
This study has several strengths. The WBI is a large, nationally representative survey.Skopec et al. [95] found that the survey provided reasonably similar data when compared to establishednational surveys, such as the National Health Interview Survey (NHIS) and the Behavioral RiskFactor Surveillance System (BFRSS), on several important health-related measures. However, theGallup sample was slightly older, had fewer minorities, and a higher educated sample than in othernational surveys [95]. Outcomes examined included select health behaviors and health outcomes.Findings in our study are similar to those reported by adults who worked in the past 12 monthsin the 2010 National Health Interview Survey (NHIS) conducted by the National Center for HealthStatistics. Weighted prevalence items were obesity (BMI ≥30) (Gallup = 27.7%; NHIS = 28.1%), currentsmoker (Gallup = 21.9%, NHIS = 19.7%), hypertension (Gallup = 22.3%; NHIS = 19.4%), insufficientexercise (Gallup = 76.3%; NHIS = 88.3%), and diabetes (Gallup = 6.1%; NHIS = 5.8%) [72]. Dataon high cholesterol are not available for the 2010 NHIS, but are available for 2015 (Gallup = 21.3%;NHIS = 21.5%) [72].
The work environment question included in this study allows us to examine an importantworkplace psychosocial factor that is often difficult or expensive to study. It is unclear where the workenvironment question originated. Documentation provided by Gallup indicated that it was basedupon findings from leading scientists in the areas of survey research, behavioral economics, and health.No information on the validity or reliability of the Gallup question is available.
This study also has several limitations. The survey is cross-sectional and therefore no conclusionscan be made regarding causality. Data were collected via a telephone survey that has a lowresponse rate, potentially affecting the representativeness of our findings. For each regression model,observations with missing values for included covariates were dropped. All data were self-reportedat one point in time and are subject to response biases, such as recall and social desirability. Socialdesirability bias [96] is the tendency of respondents to present themselves in a socially desirablelight, which may deviate from their true behaviors. Social desirability bias has been shown to affectthe reporting of health behaviors, including underreporting negative behaviors and over reportingpositive ones [97]. However, a recent study by Prather et al. [98] did not find confounding due tosocial desirability bias. Additionally, although we adjusted for potential confounders in our models,other non-measured confounders may have influenced our results. The WBI survey only touchedupon a small number of components of an individual’s work environment. Components of social
354
IJERPH 2019, 16, 230
capital and the work environment such as occupation, organizational structure (e.g., work schedule,work arrangements), culture, job autonomy, job resources, job security, work engagement, workplacehostility, additional characteristics of the supervisor, and others are needed for a better-informed study.Findings by Oksanen et al. [45,46] suggest that the effects of low social capital might not be similar inall work units or groups of different socioeconomic structure. However, because social capital andsocioeconomic status were measured at the individual level, we are unable to examine the effects ofsocial capital in different work contexts. Additionally, stand-alone, single-item questions may notoffer the precision needed to make an accurate assessment of supervisory style, and as Choi et al. [34]suggest, there is a lack of consensus on measurement of social capital. The measure of social capitalused in this study deals with leadership trust. Researchers have also included differing measures ofsocial capital that include employee networks and workforce norms [99].
Health behavior questions in the WBI were different from AHA’s LS7 definitions, particularly dietthat included only one of the five diet variables. The health factor metrics are markedly different in theWBI compared to the AHA’s LS7 definitions, noticeably absent are the clinical measurements of bloodpressure, blood cholesterol, fasting glucose, and medication used to treat these health factors. Lastly,the study’s large sample size increases the probability of finding statistically significant associations;therefore, we focused on effect size rather than p-values. Despite these limitations, results show thatmore than 20% of workers report that their supervisor does not always create an open and trustingenvironment. This is associated with a 20% increase in odds for having four or more CVD riskfactors, suggesting that this is an important factor when designing interventions to address workercardiovascular health. Therefore, these results show support for the usefulness of this aspect of socialcapital to understand the work environment, supervisory behavior, and their association with workercardiovascular health.
5. Conclusions
This study found that a negative work-environment characteristic representing an aspect ofworkplace social capital contributed to greater odds of having important CVD risk factors amongfull-time workers. Results suggest that supervisor behavior can play an important role in improvingworker health. Workplace intervention programs for CVD and other chronic health conditions shouldconsider addressing this aspect of workplace social capital, and supervisor competencies and behaviorin particular, with proper training as a potential means to improve worker health. Thus, our resultsreinforce the notion voiced elsewhere [69,100] that supervisor support is essential to a comprehensiveapproach to worker safety and health; issues of managerial trust are worthy of inclusion in a TotalWorker Health® framework.
Author Contributions: T.A. and R.T. contributed equally to the manuscript. T.A., R.T., J.J. and K.M.K. contributedto Writing-Review and Editing.
Funding: This research received no external funding. However, Kelly’s effort was supported by CooperativeAgreement No. U19OH008868 from the Centers for Disease Control and Prevention (CDC), National Institute forOccupational Safety and Health (NIOSH) to the Healthier Workforce Center at the University of Iowa.
Acknowledgments: The authors would like to thank Chia-Chia Chang and Casey Chosewood, NIOSH TotalWorker Health®, and Melanie Standish of the Gallup organization for their assistance in accessing andunderstanding the data. We would also like to thank Leslie McDonald and Candice Johnson, Division ofSurveillance, Hazard Evaluation and Field Studies, National Institute for Occupational Safety and Health, for theirvaluable comments regarding the American Heart Association Life’s Simple 7. Appreciation is extended to JamesGrosch, Tara Hartley, Sara Luckhaupt, and Marie Haring Sweeney for their review comments on this manuscript.
Conflicts of Interest: The authors declare that they have no conflict of interest. The findings and conclusionsin this report are those of the authors and do not necessarily represent the views of the National Institute forOccupational Safety and Health.
355
IJERPH 2019, 16, 230
References
1. Centers for Disease Control and Prevention. CDC Heart Disease Facts. 2016. Available online: https://www.cdc.gov/dhdsp/data_statistics/fact_sheets/fs_heart_disease.htm (accessed on 17 April 2018).
2. Heidenreich, P.A.; Trogdon, J.G.; Khavjou, O.A.; Butler, J.; Dracup, K.; Ezekowitz, M.D.; Finkelstein, E.A.;Hong, Y.; Johnston, S.C.; Khera, A.; et al. Forecasting the future of cardiovascular disease in the UnitedStates: A policy statement from the American Heart Association. Circulation 2011, 123, 933–944. [CrossRef][PubMed]
3. Mozaffarian, D.; Benjamin, E.J.; Go, A.S.; Arnett, D.K.; Blaha, M.J. American Heart Association Statistics, C.;Stroke Statistics, S. ‘Heart disease and stroke statistics—2015 update: A report from the American HeartAssociation. Circulation 2015, 131, e29–e322. [PubMed]
4. Benjamin, E.J.; Blaha, M.J.; Chiuve, S.E.; Cushman, M.; Das, S.R.; Deo, R.; de Ferranti, S.; Després, J.P.;Fullerton, H.J.; Howard, V.J.; et al. American Heart Association Statistics C, Stroke Statistics S: Heart diseaseand stroke statistics—2017 update: A reportfFrom the American Heart Association. Circulation 2017, 135,e146–e603. [CrossRef]
5. Lloyd-Jones, D.M.; Hong, Y.; Labarthe, D.; Mozaffarian, D.; Appel, L.J.; Van Horn, L.; Greenlund, K.;Daniels, S.; Nichol, G.; Tomaselli, G.F.; et al. Defining and setting national goals for cardiovascular healthpromotion and disease reduction: The American Heart Association’s strategic impact goal through 2020 andbeyond. Circulation 2010, 121, 586–613. [CrossRef] [PubMed]
6. Shay, C.M.; Gooding, H.S.; Murillo, R.; Foraker, R. Understanding and Improving Cardiovascular Health:An Update on the American Heart Association’s Concept of Cardiovascular Health. Prog. Cardiovasc. Dis.2015, 58, 41–49. [CrossRef] [PubMed]
7. Backé, E.M.; Seidler, A.; Latza, U.; Rossnagel, K.; Schumann, B. The role of psychosocial stress at work forthe development of cardiovascular diseases: A systematic review. Intl. Arch. Occup. Environ. Health 2012, 85,67–79. [CrossRef]
8. Belkic, K.L.; Landsbergis, P.A.; Schnall, P.L.; Baker, D. Is job strain a major source of cardiovascular diseaserisk? Scand. J. Work Environ. Health 2004, 30, 85–128. [CrossRef]
9. Choi, B.K.; Schnall, P.; Landsbergis, P.; Dobson, M.; Ko, S.; Gomez-Ortiz, V.; Juárez-Garcia, A.; Baker, D.Recommendations for individual participant data meta-analyses on work stressors and health outcomes:Comments on IPD-Work Consortium papers. Scand. J. Work Environ. Health 2015, 41, 299–311. [CrossRef]
10. Kasl, S.V. The influence of the work environment on cardiovascular health: A historical, conceptual, andmethodological perspective. J. Occup. Health Psychol. 1996, 1, 42–56. [CrossRef]
11. Kivimäki, M.; Kawachi, I. Work stress as a risk factor for cardiovascular disease. Curr. Cardiol. Rep. 2015, 17,630. [CrossRef]
12. Kivimäki, M.; Virtanen, M.; Elovainio, M.; Kouvonen, A.; Vaananen, A.; Vahtera, J. Work stress in the etiologyof coronary heart disease—A meta-analysis. Scand. J. Work Environ. Health 2006, 32, 431–442. [CrossRef][PubMed]
13. Steptoe, A.; Kivimäki, M. Stress and cardiovascular disease: An update on current knowledge. Ann. Rev.Public Health 2013, 34, 337–354. [CrossRef]
14. Szerensci, K.; van Amelsvoort, L.; Viechtbauer, W.; Mohren, D.; Prins, M.; Kant, I. The association betweenstudy characteristics and outcome in the relation between job stress and cardiovascular disease: A multilevelmeta-regression analysis. Scand. J. Work Environ. Health 2012, 38, 489–502. [CrossRef] [PubMed]
15. Theorell, T. Commentary triggered by the Individual Participant Data Meta-Analysis Consortium study ofjob strain and myocardial infarction risk. Scand. J. Work Environ. Health 2014, 40, 89–95. [CrossRef] [PubMed]
16. Toivanen, S. Social determinants of stroke as related to stress at work among working women: A literaturereview. Stroke Res. Treat. 2012, 2012, 873678. [CrossRef] [PubMed]
17. Gilbert-Ouimet, M.; Trudel, X.; Brisson, C.; Milot, A.; Vezina, M. Adverse effects of psychosocial work factorson blood pressure: Systematic review of studies on demand-control-support and effort-reward imbalancemodels. Scand. J. Work Environ. Health 2014, 40, 109–132. [CrossRef] [PubMed]
18. Johnson, J.V.; Hall, E.M. Job strain, work place social support, and cardiovascular disease: A cross-sectionalstudy of a random sample of the Swedish working population. Am. J. Public Health 1988, 78, 1336–1342.[CrossRef] [PubMed]
356
IJERPH 2019, 16, 230
19. Karasek, R. Job demands, job decision latitude, and mental strain: Implications for job redesign. Adm. Sci. Q.1979, 24, 285–308. [CrossRef]
20. Karasek, R.; Theorell, T. Healthy Work: Stress, Productivity, and the Reconstruction of Working Life; Basic Books:New York, NY, USA, 1990; ISBN 978-0465028979.
21. Nieuwenhuijsen, K.; Bruinvels, D.; Frings-Dresen, M. Psychosocial work environment and stress-relateddisorders, a systematic review. Occup. Med. 2010, 60, 277–286. [CrossRef]
22. Schaufeli, W.; Bakker, A.; Salanova, M. The measurement of work engagement with a short questionnaire. Across-national study. Educ. Psychol. Meas. 2006, 66, 701–716. [CrossRef]
23. Siegrist, J. Adverse health effects of high-effort/low-reward conditions. J. Occup. Health Psychol. 1996, 1,27–41. [CrossRef] [PubMed]
24. Virtanen, M.; Heikkila, K.; Jokela, M.; Ferrie, J.E.; Batty, G.D.; Vahtera, J.; Kivimäki, M. Long working hoursand coronary heart disease: A systematic review and meta-analysis. Am. J. Epidemiol. 2012, 176, 586–596.[CrossRef] [PubMed]
25. Bakker, A.B.; Demerouti, E. The Job Demands-Resources model: State of the art. J. Manag. Psychol. 2007, 22,309–328. [CrossRef]
26. Bakker, A.B.; Demerouti, E.; Euwema, M.C. Job resources buffer the impact of job demands on burnout.J. Occup. Health Psycholol. 2005, 10, 170–180. [CrossRef]
27. Demerouti, E.; Bakker, A.B.; Nachreiner, F.; Schaufeli, W.B. The job demands-resources model of burnout.J. Appl. Psychol. 2001, 86, 499–512. [CrossRef] [PubMed]
28. Black, J.K.; Belanos, G.M.; Whitikaer, A.C. Resilience, work engagement and stress reactivity in a middle-agedmanual worker population. Int. J. Psychophysiol. 2017, 116, 9–15. [CrossRef]
29. Colquitt, J.A.; Conlon, D.E.; Wesson, M.J.; Porter, C.O.; Ng, K.Y. Justice at the millennium: A meta-analyticreview of 25 years of organizational justice research. J. Appl. Psychol. 2001, 86, 425–445. [CrossRef]
30. De Vogli, R.; Ferrie, J.E.; Chandola, T.; Kivimäki, M.; Marmot, M.G. Unfairness and health: Evidence fromthe Whitehall II Study. J. Epidemiol. Community Health 2007, 61, 513–518. [CrossRef]
31. Elovainio, M.; Kivimäki, M.; Vahtera, J. Organizational justice: Evidence of a new psychosocial predictor ofhealth. Am. J. Public Health 2002, 92, 105–108. [CrossRef]
32. Inoue, A.; Kawakami, N.; Eguchi, H.; Miyaki, K.; Tsutsumi, A. Organizational justice and physiologicalcoronary heart disease risk factors in japanese employees: A cross-sectional study. Int. J. Behav. Med. 2015,22, 775–785. [CrossRef]
33. Kivimäki, M.; Ferrie, J.E.; Brunner, E.; Head, J.; Shipley, M.J.; Vahtera, J.; Marmot, M.G. Justice at work andreduced risk of coronary heart disease among employees: The Whitehall II Study. Arch. Intern. Med. 2005,165, 2245–2251. [CrossRef] [PubMed]
34. Choi, M.; Mesa-Frias, M.; Nuesch, E.; Hargreaves, J.; Prieto-Merino, D.; Bowling, A.; Smith, G.D.; Ebrahim, S.;Dale, C.E.; Casas, J.P. Social capital, mortality, cardiovascular events and cancer: A systematic review ofprospective studies. Int. J. Epidemiol. 2014, 43, 1895–1920. [CrossRef] [PubMed]
35. Coleman, J. Foundations of Social Theory; Harvard University Press: Cambridge, MA, USA, 1990.36. Hayami, Y. Social capital, human capital and the community mechanism: Toward a conceptual framework
for economists. J. Dev. Stud. 2009, 45, 96–123. [CrossRef]37. Murayama, H.; Fujiwara, Y.; Kawachi, I. Social capital and health: A review of prospective multilevel studies.
J. Epidemiol. 2012, 22, 179–187. [CrossRef]38. Putnam, R. Making Democracy Work: Civic Traditions in Modern Italy; Princeton University Press: Princeton,
NJ, USA, 1993; ISBN 9780691037387.39. Berkman, L.F.; Kawachi, I. Social Epidemiology; Oxford University Press: New York, NY, USA, 2000.40. Zischka, L. Valuing Social capital by the Resources People Allocate to One Another. J. Int. Dev. 2013, 25,
609–625. [CrossRef]41. Giordano, G.N.; Ohlsson, H.; Lindström, M. Social capital and health-purely a question of context?
Health Place 2011, 17, 946–953. [CrossRef]42. Pattussi, M.P.; Olinto, M.T.; Canuto, R.; da Silva Garcez, A.; Paniz, V.M.; Kawachi, I. Workplace social capital,
mental health and health behaviors among Brazilian female workers. Soc. Psychiatry Psychiat. Epidemiol.2016, 51, 1321–1330. [CrossRef] [PubMed]
43. Samuel, L.J.; Commodore-Mensah, Y.; Himmelfarb, C.R. Developing behavioral theory with the systematicintegration of community social capital concepts. Health Educ. Behav. 2014, 41, 359–375. [CrossRef] [PubMed]
357
IJERPH 2019, 16, 230
44. Kawachi, I.; Kennedy, B.P.; Glass, R. Social capital and self-rated health: A contextual analysis. Am. J.Public Health 1999, 89, 1187–1193. [CrossRef]
45. Oksanen, T.; Kawachi, I.; Kouvonen, A.; Takao, S.; Suzuki, E.; Virtanen, M.; Pentti, J.; Kivimäki, M.; Vahtera, J.Workplace determinants of social capital: Cross-sectional and longitudinal evidence from a Finnish cohortstudy. PLoS ONE 2013, 8, e65846. [CrossRef]
46. Oksanen, T.; Kouvonen, A.; Kivimäki, M.; Pentti, J.; Virtanen, M.; Linna, A.; Vahtera, J. Social capital at workas a predictor of employee health: Multilevel evidence from work units in Finland. Soc. Sci. Med. 2008, 66,637–649. [CrossRef] [PubMed]
47. Sundquist, J.; Johansson, S.E.; Yang, M.; Sundquist, K. Low linking social capital as a predictor of coronaryheart disease in Sweden: A cohort study of 2.8 million people. Soc. Sci. Med. 2006, 62, 954–963. [CrossRef][PubMed]
48. Suzuki, E.; Takao, S.; Subramanian, S.V.; Komatsu, H.; Doi, H.; Kawachi, I. Does low workplace social capitalhave detrimental effect on workers’ health? Soc. Sci. Med. 2010, 70, 1367–1372. [CrossRef]
49. Lindström, M.; Giordano, G.N. Changes in social capital and cigarette smoking behavior over time: Apopulation-based panel study of temporal relationships. Nicotine Tob. Res. 2016, 18, 2106–2114. [CrossRef][PubMed]
50. Tsuboya, T.; Tsutsumi, A.; Kawachi, I. Null association between workplace social capital and body massindex. Results from a four-wave panel survey among employees in Japan (J-HOPE study). Soc. Sci. Med.2016, 150, 1–7. [CrossRef]
51. Ehsan, A.M.; De Silva, M.J. Social capital and common mental disorder: A systematic review. J. Epidemiol.Community Health 2015, 69, 1021–1028. [CrossRef]
52. Tsuboya, T.; Tsutsumi, A.; Kawachi, I. Change in psychological distress following change in workplacesocial capital: Results from the panel surveys of the J-HOPE study. Occup. Environ. Med. 2015, 72, 188–194.[CrossRef]
53. Johnson, C.M.; Sharkey, J.R.; Dean, W.R. Eating behaviors and social capital are associated with fruit andvegetable intake among rural adults. J. Hunger. Environ. Nutr. 2010, 5, 302–315. [CrossRef]
54. Lindström, M. Social capital, the miniaturization of community and high alcohol consumption: Apopulation-based study. Alcohol Alcohol. 2005, 40, 556–562. [CrossRef]
55. Lindström, M. Social capital, political trust and purchase of illegal liquor: A population-based study insouthern Sweden. Health Policy 2008, 86, 266–275. [CrossRef]
56. Weitzman, E.R.; Chen, Y.Y. Risk modifying effect of social capital on measures of heavy alcohol consumption,alcohol abuse, harms, and secondhand effects: National survey findings. J. Epidemiol. Community Health2005, 59, 303–309. [CrossRef]
57. Ball, K.; Cleland, V.J.; Timperio, A.F.; Salmon, J.; Giles-Corti, B.; Crawford, D.A. Love thy neighbour?Associations of social capital and crime with physical activity amongst women. Soc. Sci. Med. 2010, 71,807–814. [CrossRef] [PubMed]
58. Lindström, M. Social capital, desire to increase physical activity and leisure-time physical activity: Apopulation-based study. Public Health 2011, 125, 442–447. [CrossRef]
59. Lindström, M.; Moghaddassi, M.; Merlo, J. Social capital and leisure time physical activity: A populationbased multilevel analysis in Malmo, Sweden. J. Epidemiol. Community Health 2003, 57, 23–28. [CrossRef][PubMed]
60. Oksanen, T.; Kivimäki, M.; Kawachi, I.; Subramanian, S.V.; Takao, S.; Suzuki, E.; Kouvonen, A.; Pentti, J.;Salo, P.; Virtanen, M.; et al. Workplace social capital and all-cause mortality: A prospective cohort study of28,043 public-sector employees in Finland. Am. J. Public Health 2011, 101, 1742–1748. [CrossRef] [PubMed]
61. Giordano, G.N.; Lindström, M. The impact of social capital on changes in smoking behaviour: A longitudinalcohort study. Eur. J. Public Health 2011, 21, 347–354. [CrossRef]
62. Kouvonen, A.; Oksanen, T.; Vahtera, J.; Vaananen, A.; De Vogli, R.; Elovainio, M.; Pentti, J.; Leka, S.; Cox, T.;Kivimäki, M. Work-place social capital and smoking cessation: The Finnish Public Sector Study. Addiction2008, 103, 1857–1865. [CrossRef] [PubMed]
63. Lindström, M. Social capital, political trust and daily smoking and smoking cessation: A population-basedstudy in southern Sweden. Public Health 2009, 123, 496–501. [CrossRef]
358
IJERPH 2019, 16, 230
64. Nieminen, T.; Prattala, R.; Martelin, T.; Harkanen, T.; Hyyppa, M.T.; Alanen, E.; Koskinen, S. Social capital,health behaviours and health: A population-based associational study. BMC Public Health 2013, 13, 613.[CrossRef]
65. Väänänen, A.; Kouvonen, A.; Kivimäki, M.; Oksanen, T.; Elovainio, M.; Virtanen, M.; Pentti, J.; Vahtera, J.Workplace social capital and co-occurrence of lifestyle risk factors: The Finnish Public Sector Study.Occup. Environ. Med. 2009, 66, 432–437. [CrossRef]
66. Tamers, S.L.; Goetzel, R.; Kelly, K.M.; Luckhaupt, S.E.; Nigam, J.A.; Pronk, N.P.; Rohlman, D.S.; Baron, S.;Brosseau, L.; Bushnell, P.T.; et al. Research methodologies for Total Worker Health®: Proceedings from aworkshop. J. Occup. Environ. Med. 2018, 6, 968–978. [CrossRef] [PubMed]
67. Werbel, J.; Henriques, P. Different views of trust and relational leadership: Supervisor and subordinateperspectives. J. Manag. Psychol. 2009, 24, 780–796. [CrossRef]
68. Nienaber, A.; Romeike, P.; Searle, R.; Schewe, G. A qualitative meta-analysis of trust insupervisor-subordinate relationships. J. Manag. Psychol. 2015, 30, 507–534. [CrossRef]
69. Schill, A.L. Advancing well-being through Total Worker Health®. Workplace Health Saf. 2017, 65, 158–163.[CrossRef] [PubMed]
70. Centers for Disease Control and Prevention. Quality of Worklife Questionnaire. 2013. Available online:http://www.cdc.gov/niosh/topics/stress/qwlquest.html (accessed on 17 April 2018).
71. University of Michigan. ‘Health and Retirement Study’. Available online: http://hrsonline.isr.umich.edu(accessed on 17 April 2018).
72. National Center for Health Statistics. 2010 National Health Interview Survey (NHIS) Public Use Data Release.NHIS Survey Description; 2011. Available online: ftp://ftp.cdc.gov/pub/Health_Statistics/NCHS/Dataset_Documentation/NHIS/2010/srvydesc.pdf (accessed on 13 February 2018).
73. National Center for Health Statistics. National Health Interview Survey (NHIS) Public Use Data Release.NHIS Survey Description; 2015. Available online: ftp://ftp.cdc.gov/pub/Health_Statistics/NCHS/Dataset_Documentation/NHIS/2015/srvydesc.pdf (accessed on 16 April 2018).
74. Gallup. Gallup Daily Methodology 2015. Available online: http://www.gallup.com/poll/195539/gallup-healthways-index-methodology-report-indexes.aspx (accessed on 17 April 2018).
75. Kahneman, D.; Deaton, A. High income improves evaluation of life but not emotional well-being. Proc. Natl.Acad. Sci. USA 2010, 107, 16489–16493. [CrossRef]
76. Deaton, A.; Stone, A.A. Evaluative and hedonic well-being among those with and without children at home.Proc. Natl. Acad. Sci. USA 2014, 111, 1328–1333. [CrossRef]
77. Fujishiro, K.; Heaney, C.A. Doing what I do best: The association betweem skill utilization and employeehealth with healthy behavior as a mediator. Soc. Sci. Med. 2017, 175, 235–243. [CrossRef]
78. Rentfrow, P.; Mellander, C.; Florida, R. Happy states of America: A state-level analysis of psychological,economic, and social well-being. J. Pers. Res. 2009, 43, 1073–1082. [CrossRef]
79. Sommers, B.D.; Gunja, M.Z.; Finegold, K.; Musco, T. Changes in self-reported insurance coverage, access tocare, and health under the Affordable Care Act. JAMA 2015, 314, 366–374. [CrossRef]
80. Maric-Bilkan, C.; Arnold, A.P.; Taylor, D.A.; Dwinell, M.; Howlett, S.E.; Wenger, N.; Reckelhoff, J.F.;Sandberg, K.; Churchill, G.; Levin, E.; et al. Report of the National Heart, Lung, and Blood InstituteWorking Group on Sex Differences Research in Cardiovascular Disease: Scientific Questions and Challenges.Hypertension 2016, 67, 802–807. [CrossRef]
81. Wasserstein, R.; Lazar, N. The ASA’s statement on p-values: Context, process, and purpose. Am. Stat. 2016,70, 129–133. [CrossRef]
82. Gilbert, K.L.; Quinn, S.C.; Goodman, R.M.; Butler, J.; Wallace, J. A meta-analysis of social capital and health:A case for needed research. J. Health Psychol. 2013, 18, 1385–1399. [CrossRef] [PubMed]
83. Giordano, G.N.; Lindström, M. The impact of changes in different aspects of social capital and materialconditions on self-rated health over time: A longitudinal cohort study. Soc. Sci. Med. 2010, 70, 700–710.[CrossRef]
84. Barnay, T. Health, work and working conditions: A review of the European economic literature. Eur. J.Health Econ. 2016, 17, 693–709. [CrossRef] [PubMed]
85. Nyberg, S.T.; Fransson, E.I.; Heikkila, K.; Alfredsson, L.; Casini, A.; Clays, E.; De Bacquer, D.; Dragano, N.;Erbel, R.; Ferrie, J.E.; et al. Job strain and cardiovascular disease risk factors: Meta-analysis ofindividual-participant data from 47,000 men and women. PLoS ONE 2013, 8, e67323. [CrossRef]
359
IJERPH 2019, 16, 230
86. Chandola, T.; Britton, A.; Brunner, E.; Hemingway, H.; Malik, M.; Kumari, M.; Badrick, E.; Kivimaki, M.;Marmot, M. Work stress and coronary heart disease: What are the mechanisms? Eur. Heart J. 2008, 29,640–648. [CrossRef] [PubMed]
87. Janczura, M.; Bochenek, G.; Nowobilski, R.; Dropinski, J.; Kotula-Horowitz, K.; Laskowicz, B.; Stanisz, A.;Lelakowski, J.; Domagala, T. The relationship of metabolic syndrome with stress, coronary heart disease andpulmonary function—An occupational cohort-based study. PLoS ONE 2015, 10, e0133750. [CrossRef]
88. Hammer, L.B.; Sauter, S. Total worker health and work-life stress. J. Occup. Environ. Med. 2013, 55, S25–S29.[CrossRef] [PubMed]
89. Väänänen, A.; Kouvonen, A.; Kivimäki, M.; Pentti, J.; Vahtera, J. Social support, network heterogeneity, andsmoking behavior in women: The 10-town study. Am. J. Health Promot. 2008, 22, 246–255. [CrossRef]
90. Jaaskelainen, A.; Kaila-Kangas, L.; Leino-Arjas, P.; Lindbohm, M.L.; Nevanpera, N.; Remes, J.; Järvelin, M.R.;Laitinen, J. Psychosocial factors at work and obesity among young finnish adults: A cohort study. J. Occup.Environ. Med. 2015, 57, 485–492. [CrossRef]
91. Cundiff, D.K. Diet and tobacco use: Analysis of data from the diabetic control and complications trial,a randomized study. Medscape J. Gen. Med. 2002, 4, 2.
92. Nomura, K.; Nakao, M.; Tsurugano, S.; Takeuchi, T.; Inoue, M.; Shinozaki, Y.; Yano, E. Job stress and healthybehavior among male Japanese office workers. Am. J. Ind. Med. 2010, 53, 1128–1134. [CrossRef] [PubMed]
93. Westermann, O.; Ashby, J.; Petty, J. Gender and social capital: The importance of gender differences forthe maturity and effectivenss of natural resource management groups. World Dev. 2005, 33, 1783–1799.[CrossRef]
94. Fonarow, G.C.; Calitz, C.; Arena, R.; Baase, C.; Isaac, F.W.; Lloyd-Jones, D.; Peterson, E.D.; Pronk, N.;Sanchez, E.; Terry, P.E.; et al. Workplace wellness recognition for optimizing workplace health: A presidentialadvisory from the American Heart Association. Circulation 2015, 131, e480–e497. [CrossRef] [PubMed]
95. Skopec, L.; Musco, T.; Sommers, B.D. A potential new data source for assessing the impacts of health reform:Evaluating the Gallup-Healthways Well-Being Index. Healthcare 2014, 2, 113–120. [CrossRef] [PubMed]
96. Crowne, D.P.; Marlowe, D. A new scale of social desirability independent of psychopathology.J. Consult. Psychol. 1960, 24, 349–354. [CrossRef]
97. Olynk Widmar, N.J.; Byrd, E.S.; Dominick, S.R.; Wolf, C.A.; Acharya, L. Social desirability bias in reportingof holiday season healthfulness. Prev. Med. Rep. 2016, 4, 270–276. [CrossRef]
98. Prather, A.A.; Gottlieb, L.M.; Giuse, N.B.; Koonce, T.Y.; Kusnoor, S.V.; Stead, W.W.; Adler, N.E. NationalAcademy of Medicine social and behavioral measures: Associations with self-reported health. Am. J.Prev. Med. 2017, 53, 449–456. [CrossRef]
99. Hauser, C.; Perkmann, U.; Puntscher, S.; Walde, J.; Tappeiner, G. Trust works! Sources and effects of socialcapital in the workplace. Soc. Indic. Res. 2016, 128, 589–608. [CrossRef]
100. Hämmig, O. Health and well-being at work: The key role of supervisor support. SSM Popul. Health 2017, 3,393–402. [CrossRef]
© 2019 by the authors. Licensee MDPI, Basel, Switzerland. This article is an open accessarticle distributed under the terms and conditions of the Creative Commons Attribution(CC BY) license (http://creativecommons.org/licenses/by/4.0/).
360
MDPISt. Alban-Anlage 66
4052 BaselSwitzerland
Tel. +41 61 683 77 34Fax +41 61 302 89 18
www.mdpi.com
International Journal of Environmental Research and Public Health Editorial OfficeE-mail: [email protected]
www.mdpi.com/journal/ijerph


MDPI St. Alban-Anlage 66 4052 Basel Switzerland
Tel: +41 61 683 77 34 Fax: +41 61 302 89 18
www.mdpi.com ISBN 978-3-03921-993-3
Related Documents