Portland State University Portland State University PDXScholar PDXScholar Mechanical and Materials Engineering Faculty Publications and Presentations Mechanical and Materials Engineering 5-23-2019 Using Thermal Gradient Measurements to Compare Using Thermal Gradient Measurements to Compare Bath Temperature and Agitation Effects on the Bath Temperature and Agitation Effects on the Quenching Performance of Palm Oil, Canola Oil and Quenching Performance of Palm Oil, Canola Oil and a Conventional Petroleum Oil a Conventional Petroleum Oil Bozidar Matijevic University of Zagreb Bruno F. Canale University of São Paulo Božidar Lišcic University of Zagreb George Totten Portland State University, [email protected] Follow this and additional works at: https://pdxscholar.library.pdx.edu/mengin_fac Part of the Materials Science and Engineering Commons, and the Mechanical Engineering Commons Let us know how access to this document benefits you. Citation Details Citation Details B. Matijevic, B. F. Canale, B. Liscic, and G. E. Totten, “Using Thermal Gradient Measurements to Compare Bath Temperature and Agitation Effects on the Quenching Performance of Palm Oil, Canola Oil and a Conventional Petroleum Oil,” Materials Performance and Characterization 8, no. 1 (2019): 223–248, https://doi.org/10.1520/MPC20180135. This Article is brought to you for free and open access. It has been accepted for inclusion in Mechanical and Materials Engineering Faculty Publications and Presentations by an authorized administrator of PDXScholar. Please contact us if we can make this document more accessible: [email protected].

Welcome message from author
This document is posted to help you gain knowledge. Please leave a comment to let me know what you think about it! Share it to your friends and learn new things together.
Transcript
Portland State University Portland State University
PDXScholar PDXScholar
Mechanical and Materials Engineering Faculty Publications and Presentations Mechanical and Materials Engineering
5-23-2019
Using Thermal Gradient Measurements to Compare Using Thermal Gradient Measurements to Compare
Bath Temperature and Agitation Effects on the Bath Temperature and Agitation Effects on the
Quenching Performance of Palm Oil, Canola Oil and Quenching Performance of Palm Oil, Canola Oil and
a Conventional Petroleum Oil a Conventional Petroleum Oil
Bozidar Matijevic University of Zagreb
Bruno F. Canale University of São Paulo
Božidar Lišcic University of Zagreb
George Totten Portland State University, [email protected]
Follow this and additional works at: https://pdxscholar.library.pdx.edu/mengin_fac
Part of the Materials Science and Engineering Commons, and the Mechanical Engineering Commons
Let us know how access to this document benefits you.
Citation Details Citation Details B. Matijevic, B. F. Canale, B. Liscic, and G. E. Totten, “Using Thermal Gradient Measurements to Compare Bath Temperature and Agitation Effects on the Quenching Performance of Palm Oil, Canola Oil and a Conventional Petroleum Oil,” Materials Performance and Characterization 8, no. 1 (2019): 223–248, https://doi.org/10.1520/MPC20180135.
This Article is brought to you for free and open access. It has been accepted for inclusion in Mechanical and Materials Engineering Faculty Publications and Presentations by an authorized administrator of PDXScholar. Please contact us if we can make this document more accessible: [email protected].
Bozidar Matijevic,1 Bruno F. Canale,2 Bozidar Liscic,1 and George E. Totten3
Using Thermal Gradient Measurements toCompare Bath Temperature and AgitationEffects on the Quenching Performance ofPalm Oil, Canola Oil and a ConventionalPetroleum Oil
Reference
B. Matijevic, B. F. Canale, B. Liscic, and G. E. Totten, “Using Thermal Gradient Measurements to
Compare Bath Temperature and Agitation Effects on the Quenching Performance of Palm Oil,
Canola Oil and a Conventional Petroleum Oil,” Materials Performance and Characterization 8,
no. 1 (2019): 223–248, https://doi.org/10.1520/MPC20180135
ABSTRACT
A proprietary Liscic/Petrofer cylindrical Inconel 600 probe of 50-mm diameter and 200-mm
length which was instrumented with three thermocouples on the same radius of the cross-
section at the middle of the length was used to determine the differences in quenching per-
formance of two vegetable oils, palm oil and canola oil, and they were compared to a locally
produced conventional petroleum oil quenchant. The cooling curves and heat transfer perfor-
mance of these oils were determined at different bath temperatures and agitation rates. The
work was performed at the Quenching Research Centre located at the Faculty for Mechanical
Engineering, University of Zagreb, Croatia. The results of this comparative study are reported
herein.
Keywords
quenching intensity, temperature gradient method, heat transfer coefficient, palm oil, canola oil,
petroleum oil
Introduction
Cooling characteristics of a liquid quenchant are usually determined by cooling curve
analysis using a laboratory test such as ISO 9950, Industrial Quenching Oils –
Determination of Cooling Characteristics – Nickel-Alloy Probe Test Method, or ASTM
D6200, Standard Test Method for Determination of Cooling Characteristics of Quench
Manuscript received August 15,
2018; accepted for publication
April 8, 2019; published online May
23, 2019.
1 Faculty of Mechanical Engineering
and Naval Arch., University of
Zagreb, 10000 Zagreb Ivana
Lucica 5, Zagreb, Croatia
2 Department of
Telecommmunication and
Control, University of São Paulo,
380 Av. Prof. Luciano Gualberto –
Butantã, São Paulo, SP 05508-
010, Brazil (Corresponding
author), e-mail: bruno.canale@
usp.br, https://orcid.org/
0000-0002-1377-0544
3 Department of Mechanical and
Materials Engineering, Portland
State University, 1930 SW 4th
Ave. Suite 400, Portland, OR
97201, USA, https://orcid.org/
0000-0002-7313-1437
Materials Performance and Characterization
Copyright © 2019 by ASTM International, 100 Barr Harbor Drive, PO Box C700, West Conshohocken, PA 19428-2959 223
doi:10.1520/MPC20180135 / Vol. 8 / No. 1 / 2019 / available online at www.astm.org
Oils by Cooling Curve Analysis,1 standards, which utilize a small cylindrical test probe of 12.5 mm diameter by 60-
mm length with one thermocouple (TC) at its geometrical center. These tests are invaluable for the characteri-
zation and selection of a relatively small volume (≤ 2 L) of a quenching fluid or for the regular monitoring of a
quenching bath under laboratory testing. However, the use of such small test probes is of limited value for the
measurement and recording of the real quenching intensity of a fluid when quenching actual components, which
are typically much larger, under workshop conditions. Relatively small probes such as the 12.5 mm diameter by
60-mm length probe used in ASTM D6200 are unable to provide time-temperature cooling data for the modeling
and simulation of quenching real workpieces for the following reasons:
• Because of its relatively small mass and low heat capacity, these smaller probes will cool within approx-imately 10 to 30 seconds, whereas an actual (“real”) workpiece with a 50-mm diameter requires 500 to 600seconds to cool to below 200°C at its center when quenched into unagitated quench oil.
• The heat transfer coefficient (HTC) during nucleate boiling is dependent on bar diameter.2 This depend-ence is particularly significant for diameters below 50 mm. Therefore, for the same quenching conditions,the HTC on the surface of a small-diameter cylinder is quite different from the HTC on the surface of realworkpieces, which are typically much larger.
• For other quenching parameters, such as the quenchant bath temperature, agitation rate, and flow direc-tion, arrangement of workpieces in a batch (racking) are completely different from that of a laboratory testwith a small test probe used under unagitated conditions.
To address the limitations of the use of small probes such as that specified in ASTM D6200, the Liscic/Petrofer
probe was designed to measure and record the cooling intensity of all types of liquid quenchants using different quench-
ing techniques, including immersion quenching, intensive quenching, delayed quenching, martempering, and austem-
pering to characterize quenching processes in industrial practice and for comparing their quenching intensity.3
The Liscic/Petrofer probe is a solid cylinder of 50-mmdiameter and 200-mm length. Figure 1A is the schematic
of the probe with the handle and figure 1B is a photo of the probe itself. The ratio between the length and diameter
L/D= 4:1 ensures that theheatdissipationeffect throughboth endsof theprobe isnegligible so that in the cross-section
at the half-length of the probe where the TCs are positioned, only radial heat flow exists. This is a prerequisite for
FIG. 1
(A) Sketch of the Liscic/
Petrofer probe with the
handle; (B) photo of the
Liscic/Petrofer probe.
Materials Performance and Characterization
224 MATIJEVIC ET AL. ON QUENCHING PERFORMANCE OF VEGETABLE OILS
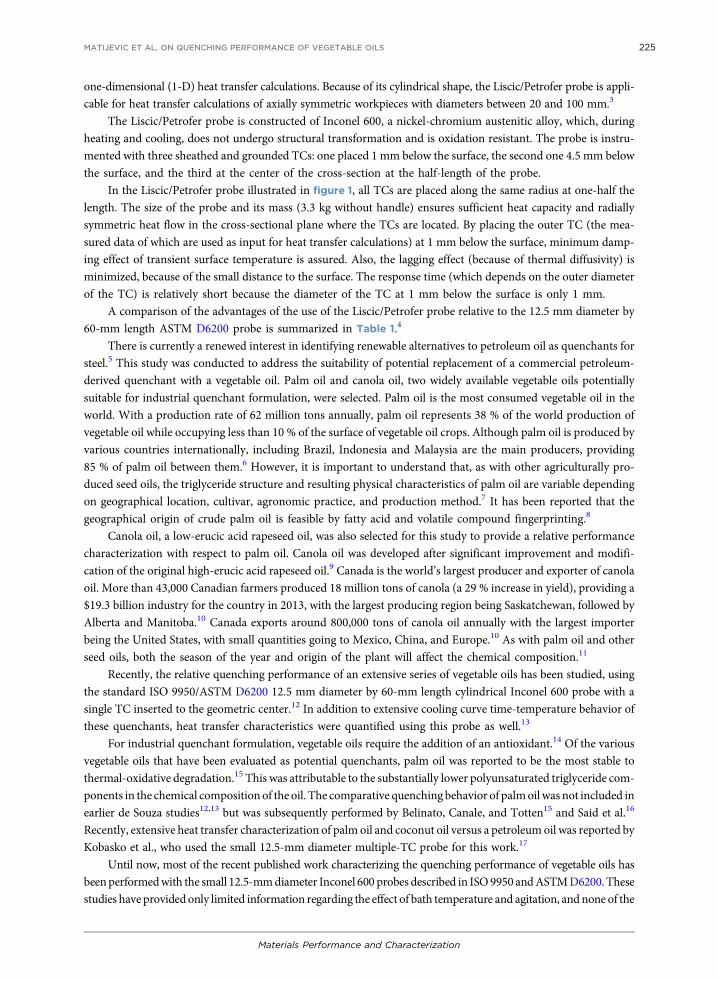
one-dimensional (1-D) heat transfer calculations. Because of its cylindrical shape, the Liscic/Petrofer probe is appli-
cable for heat transfer calculations of axially symmetric workpieces with diameters between 20 and 100 mm.3
The Liscic/Petrofer probe is constructed of Inconel 600, a nickel-chromium austenitic alloy, which, during
heating and cooling, does not undergo structural transformation and is oxidation resistant. The probe is instru-
mented with three sheathed and grounded TCs: one placed 1 mm below the surface, the second one 4.5 mm below
the surface, and the third at the center of the cross-section at the half-length of the probe.
In the Liscic/Petrofer probe illustrated in figure 1, all TCs are placed along the same radius at one-half the
length. The size of the probe and its mass (3.3 kg without handle) ensures sufficient heat capacity and radially
symmetric heat flow in the cross-sectional plane where the TCs are located. By placing the outer TC (the mea-
sured data of which are used as input for heat transfer calculations) at 1 mm below the surface, minimum damp-
ing effect of transient surface temperature is assured. Also, the lagging effect (because of thermal diffusivity) is
minimized, because of the small distance to the surface. The response time (which depends on the outer diameter
of the TC) is relatively short because the diameter of the TC at 1 mm below the surface is only 1 mm.
A comparison of the advantages of the use of the Liscic/Petrofer probe relative to the 12.5 mm diameter by
60-mm length ASTM D6200 probe is summarized in Table 1.4
There is currently a renewed interest in identifying renewable alternatives to petroleum oil as quenchants for
steel.5 This study was conducted to address the suitability of potential replacement of a commercial petroleum-
derived quenchant with a vegetable oil. Palm oil and canola oil, two widely available vegetable oils potentially
suitable for industrial quenchant formulation, were selected. Palm oil is the most consumed vegetable oil in the
world. With a production rate of 62 million tons annually, palm oil represents 38 % of the world production of
vegetable oil while occupying less than 10 % of the surface of vegetable oil crops. Although palm oil is produced by
various countries internationally, including Brazil, Indonesia and Malaysia are the main producers, providing
85 % of palm oil between them.6 However, it is important to understand that, as with other agriculturally pro-
duced seed oils, the triglyceride structure and resulting physical characteristics of palm oil are variable depending
on geographical location, cultivar, agronomic practice, and production method.7 It has been reported that the
geographical origin of crude palm oil is feasible by fatty acid and volatile compound fingerprinting.8
Canola oil, a low-erucic acid rapeseed oil, was also selected for this study to provide a relative performance
characterization with respect to palm oil. Canola oil was developed after significant improvement and modifi-
cation of the original high-erucic acid rapeseed oil.9 Canada is the world’s largest producer and exporter of canola
oil. More than 43,000 Canadian farmers produced 18 million tons of canola (a 29 % increase in yield), providing a
$19.3 billion industry for the country in 2013, with the largest producing region being Saskatchewan, followed by
Alberta and Manitoba.10 Canada exports around 800,000 tons of canola oil annually with the largest importer
being the United States, with small quantities going to Mexico, China, and Europe.10 As with palm oil and other
seed oils, both the season of the year and origin of the plant will affect the chemical composition.11
Recently, the relative quenching performance of an extensive series of vegetable oils has been studied, using
the standard ISO 9950/ASTM D6200 12.5 mm diameter by 60-mm length cylindrical Inconel 600 probe with a
single TC inserted to the geometric center.12 In addition to extensive cooling curve time-temperature behavior of
these quenchants, heat transfer characteristics were quantified using this probe as well.13
For industrial quenchant formulation, vegetable oils require the addition of an antioxidant.14 Of the various
vegetable oils that have been evaluated as potential quenchants, palm oil was reported to be the most stable to
thermal-oxidative degradation.15 This was attributable to the substantially lower polyunsaturated triglyceride com-
ponents in the chemical composition of the oil. The comparative quenching behavior of palmoilwas not included in
earlier de Souza studies12,13 but was subsequently performed by Belinato, Canale, and Totten15 and Said et al.16
Recently, extensive heat transfer characterization of palm oil and coconut oil versus a petroleum oil was reported by
Kobasko et al., who used the small 12.5-mm diameter multiple-TC probe for this work.17
Until now, most of the recent published work characterizing the quenching performance of vegetable oils has
beenperformedwith the small 12.5-mmdiameter Inconel 600 probes described in ISO9950 andASTMD6200. These
studies have provided only limited information regarding the effect of bath temperature and agitation, andnone of the
Materials Performance and Characterization
MATIJEVIC ET AL. ON QUENCHING PERFORMANCE OF VEGETABLE OILS 225
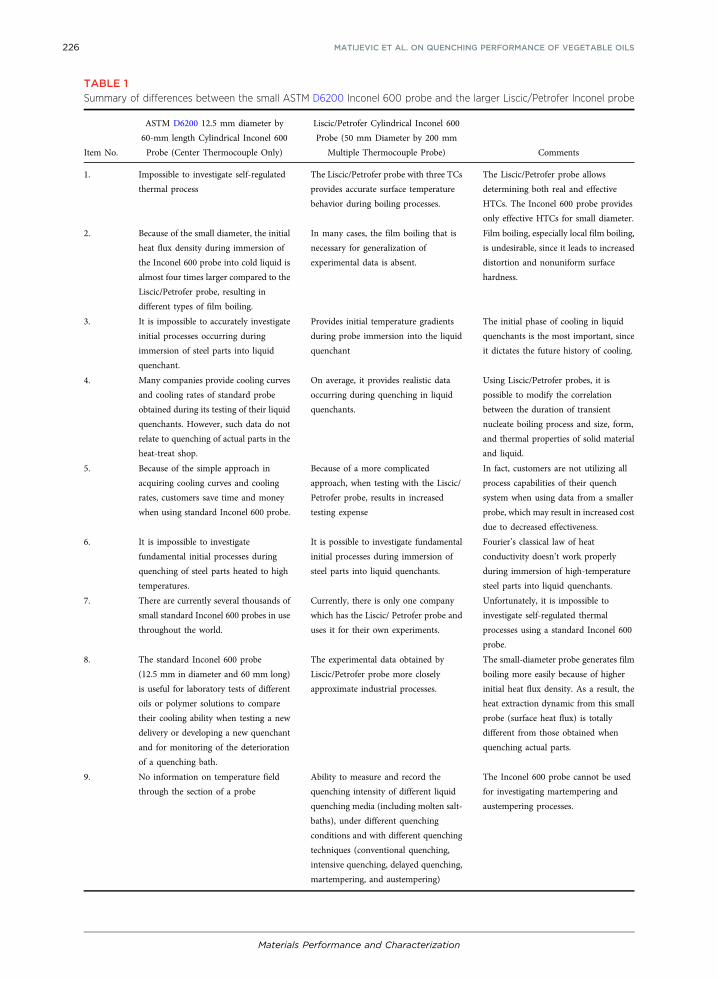
TABLE 1Summary of differences between the small ASTM D6200 Inconel 600 probe and the larger Liscic/Petrofer Inconel probe
Item No.
ASTM D6200 12.5 mm diameter by
60-mm length Cylindrical Inconel 600
Probe (Center Thermocouple Only)
Liscic/Petrofer Cylindrical Inconel 600
Probe (50 mm Diameter by 200 mm
Multiple Thermocouple Probe) Comments
1. Impossible to investigate self-regulated
thermal process
The Liscic/Petrofer probe with three TCs
provides accurate surface temperature
behavior during boiling processes.
The Liscic/Petrofer probe allows
determining both real and effective
HTCs. The Inconel 600 probe provides
only effective HTCs for small diameter.
2. Because of the small diameter, the initial
heat flux density during immersion of
the Inconel 600 probe into cold liquid is
almost four times larger compared to the
Liscic/Petrofer probe, resulting in
different types of film boiling.
In many cases, the film boiling that is
necessary for generalization of
experimental data is absent.
Film boiling, especially local film boiling,
is undesirable, since it leads to increased
distortion and nonuniform surface
hardness.
3. It is impossible to accurately investigate
initial processes occurring during
immersion of steel parts into liquid
quenchant.
Provides initial temperature gradients
during probe immersion into the liquid
quenchant
The initial phase of cooling in liquid
quenchants is the most important, since
it dictates the future history of cooling.
4. Many companies provide cooling curves
and cooling rates of standard probe
obtained during its testing of their liquid
quenchants. However, such data do not
relate to quenching of actual parts in the
heat-treat shop.
On average, it provides realistic data
occurring during quenching in liquid
quenchants.
Using Liscic/Petrofer probes, it is
possible to modify the correlation
between the duration of transient
nucleate boiling process and size, form,
and thermal properties of solid material
and liquid.
5. Because of the simple approach in
acquiring cooling curves and cooling
rates, customers save time and money
when using standard Inconel 600 probe.
Because of a more complicated
approach, when testing with the Liscic/
Petrofer probe, results in increased
testing expense
In fact, customers are not utilizing all
process capabilities of their quench
system when using data from a smaller
probe, which may result in increased cost
due to decreased effectiveness.
6. It is impossible to investigate
fundamental initial processes during
quenching of steel parts heated to high
temperatures.
It is possible to investigate fundamental
initial processes during immersion of
steel parts into liquid quenchants.
Fourier’s classical law of heat
conductivity doesn’t work properly
during immersion of high-temperature
steel parts into liquid quenchants.
7. There are currently several thousands of
small standard Inconel 600 probes in use
throughout the world.
Currently, there is only one company
which has the Liscic/ Petrofer probe and
uses it for their own experiments.
Unfortunately, it is impossible to
investigate self-regulated thermal
processes using a standard Inconel 600
probe.
8. The standard Inconel 600 probe
(12.5 mm in diameter and 60 mm long)
is useful for laboratory tests of different
oils or polymer solutions to compare
their cooling ability when testing a new
delivery or developing a new quenchant
and for monitoring of the deterioration
of a quenching bath.
The experimental data obtained by
Liscic/Petrofer probe more closely
approximate industrial processes.
The small-diameter probe generates film
boiling more easily because of higher
initial heat flux density. As a result, the
heat extraction dynamic from this small
probe (surface heat flux) is totally
different from those obtained when
quenching actual parts.
9. No information on temperature field
through the section of a probe
Ability to measure and record the
quenching intensity of different liquid
quenching media (including molten salt-
baths), under different quenching
conditions and with different quenching
techniques (conventional quenching,
intensive quenching, delayed quenching,
martempering, and austempering)
The Inconel 600 probe cannot be used
for investigating martempering and
austempering processes.
Materials Performance and Characterization
226 MATIJEVIC ET AL. ON QUENCHING PERFORMANCE OF VEGETABLE OILS
prior studies addressed bath temperature and agitation effects of vegetable oil performance on heat transfer. The
objective of this work was to examine the thermal gradients produced in larger cross-sections by canola oil, the most
common vegetable oil used for industrial oil formulation in North America, and palm oil versus a conventional com-
mercial petroleum oil quenchant using the Liscic/Petrofer probe with varying agitation and bath temperature.3 This
study is a continuation of earlier work reported for these quenchingmedia using the Liscic/Petrofer probe but without
considering the effects of agitation and bath temperature.18 The results of this continued work are reported here.
Experimental
TEST PROCEDURE
This study involves the examination of the effect of agitation on quenching performance. Therefore, the use of a
standardized agitation system would be desirable, if available. Although there are two standardized agitation sys-
tems, ASTMD6549, Standard Test Method for Determination of Cooling Characteristics of Quenchants by Cooling
Curve Analysis with Agitation (Drayton Unit),19 and ASTM D6746, Standard Test Method for Determination of
Cooling Characteristics of Quenchants by Cooling Curve Analysis with Agitation (Tensi Method),20 these systems
were developed for a much smaller 12.5 mm diameter by 60-mm length cylindrical Inconel 600 probe and because
of the relatively limited size and fluid volume are inappropriate for use in this study. As a result, a much larger
quenchant agitation system is necessary that is suitable to appropriately accommodate the 50 mm diameter and
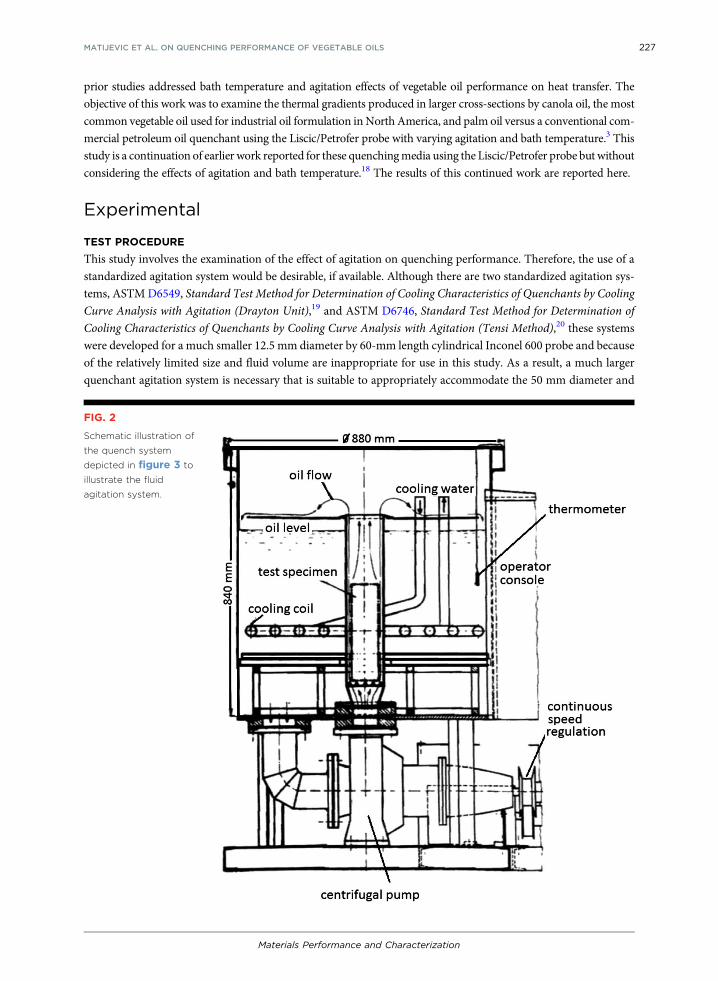
FIG. 2
Schematic illustration of
the quench system
depicted in figure 3 to
illustrate the fluid
agitation system.
Materials Performance and Characterization
MATIJEVIC ET AL. ON QUENCHING PERFORMANCE OF VEGETABLE OILS 227
200 mm Inconel 600 Liscic/Petrofer probe described previously. To provide the necessary and adequate agitation
required for the Liscic/Petrofer probe used in this study, an agitation system first described in a 1978 publication18
was used for this study and is illustrated in figure 2. Details of this agitation system will be provided subsequently.
The test procedure is as follows: the probe is heated to 850°C until the central TC reaches this value, then it is
quickly transferred to the quenching bath and immersed vertically into 300 L of quench oil in the quenching
system pictured in figure 3. It is of the utmost importance that the transfer from the furnace to the quenching
bath is always performed within the same short period of time, as well as immersing the probe with the same
speed, strictly vertically, to provide equivalent cooling conditions around the perimeter of the probe. Vertical
transfer is assured by the use of a jig for probe transfer above the quench system, as shown in figure 3.
The probe is connected to a temperature data acquisition system that contains three analog-to-digital con-
verters and amplifiers and a personal computer. The data acquisition software enables the recording of all 3 TC
signal outputs with a frequency of 0.02 s (50 measurements per second) during the entire quenching process and
simultaneously drawing the 3 resulting cooling curves in real time. The resulting cooling curves obtained are
provided in the Appendix.
MATERIALS
To the palm and canola oil (provided by INA Maziva in Zagreb, Croatia) used for this work, 0.5 % by weight of
propyl gallate (obtained from Sigma-Aldrich), an antioxidant, was added. The physical properties of both veg-
etable oils before antioxidant addition are summarized in Table 2 and those for the commercial petroleum oil
(Kalenol 32, provided by INA Maziva in Zagreb, Croatia) are shown in Table 3.
The quench rig is equipped with an agitation system that is depicted schematically in figure 2. This agitation
system provides vertical flow from the bottom to the top at flow velocities between 0 and 1.0 m/s controlled by the
pump (Egger T4-80) rotation. In this system, an agitation rate of 500 r/min is considered to be moderate and has
been measured as 0.5 m/s, and an agitation rate of 800 r/min is considered to be intensive agitation and has been
measured as 0.8 m/s.
COOLING CURVE AND HEAT TRANSFER DATA ANALYSIS
Temperature Gradient Method
The main feature, when comparing the quenching intensity among different quenching processes, is the ability to
extract heat from a heated workpiece, i.e., the dynamic of heat extraction. This implies that the real quenching
intensity in workshop practice cannot be estimated by a single number only (as is the case with Grossmann’s
H-value), and neither can it be measured and recorded by the small test specimen used for laboratory tests.
TABLE 2Summary of physical properties of palm oil and canola oils before antioxidant addition
Property Canola Oil Palm Oil Test Method
Viscosity, 40°C, mm2/s 35.14 40.39 ISO 3104
Viscosity, 100°C, mm2/s 8.7 8.53 ISO 3104
Viscosity index 198 136 ISO 2909
Density 15°C/20°C, g/mL 0.9201/0.9170 0.9151/0.9119 ASTM D4052
Open cup flash point, °C 300 326 ISO 2592
Pour point, °C −24 +6 ISO 3016
Acid number, mg KOH/g 0.10 0.18 ISO 6618
Saponification number, mg potassium hydroxide (KOH)/g 190.8 197.3 ISO 6293
Note: ISO 3104:1994 – Petroleum Products – Transparent and Opaque Liquids – Determination of Kinematic Viscosity and Calculation of DynamicViscosity; ISO 2909:2002 – Petroleum Products – Calculation of Viscosity Index from Kinematic Viscosity; ASTM D4052-18a – Standard Test Methodfor Density, Relative Density, and API Gravity of Liquids by Digital Density Meter; ISO 2592:2017 – Petroleum and Related Products –Determination ofFlash and Fire Points – Cleveland Open Cup Method; ISO 3016:1994 – Petroleum Products – Determination of Pour Point; ISO 6618:1997 – PetroleumProducts and Lubricants – Determination of Acid or Base Number – Colour-Indicator Titration Method; ISO 6293-2:1998 – Petroleum Products andLubricants – Determination of Acid or Base Number – Colour-Indicator Titration Method. KOH=potassium hydroxide.
Materials Performance and Characterization
228 MATIJEVIC ET AL. ON QUENCHING PERFORMANCE OF VEGETABLE OILS
Physically the most correct way to measure and record the heat extraction dynamic during quenching is by
the heat flux density (W/m2) on the surface of the quenched workpiece, from which the HTC is calculated. The
heat flux density (q) on the workpiece surface is inherently connected with the changing temperature gradients
inside the workpiece, since the heat flux on the surface of a body is directly proportional to the temperature
gradient at the surface multiplied by the thermal conductivity of the material of the body being cooled. See
the following:
q = λ ×∂T∂x
(1)
where q is the heat flux density (W/m2), i.e., the quantity of heat transferred through a surface unit per unit of
time; λ is the thermal conductivity of the body material (W/mK); and ∂T∂x is the temperature gradient inside the
body perpendicular to the surface (K/m).
When measuring the quenching intensity by a multi-TC probe, the change of the heat flux inside the probe at
point of time can be determined as the temperature difference (ΔT) between the points where the TCs are placed.
This method is known in literature as the temperature gradient method.
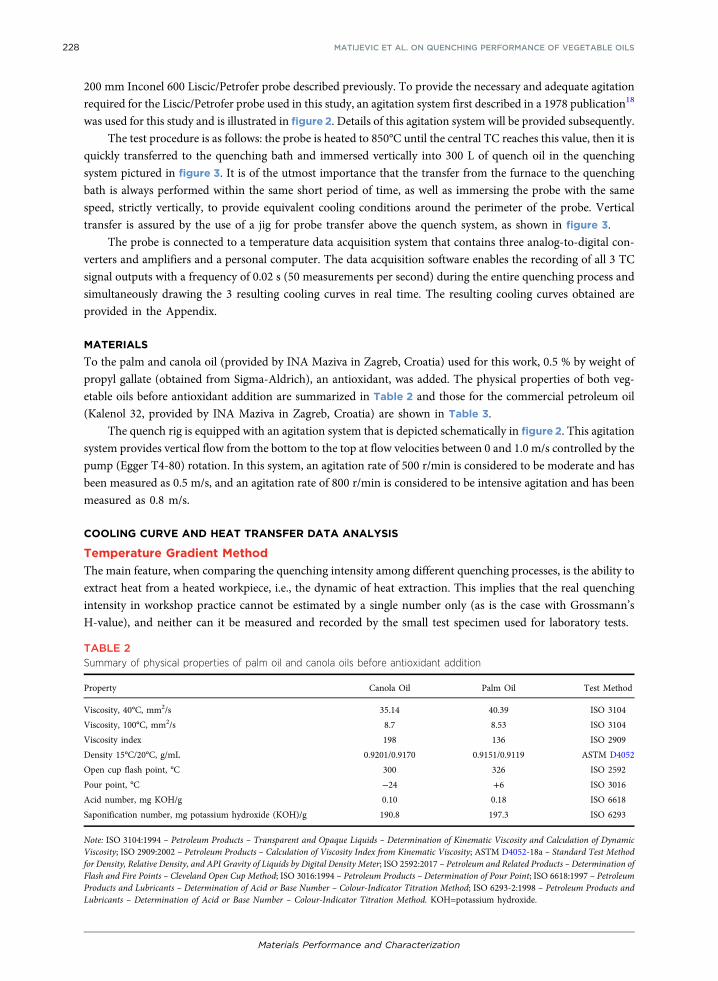
TABLE 3Properties of Kalenol 32
Property Value Test Method
Viscosity, 40°C, mm2/s 32 ISO 3104
Viscosity, 100°C, mm2/s 5.4 ISO 3104
Viscosity index 100 ISO 2909
Density 15°C, g/mL 0.863 ASTM D4052
Open cup flash point, °C 225 ISO 2592
Pour point, °C −15 ISO 3016
FIG. 3
(A,B) Photograph of the
quenching system used
for this work; (C)
illustration of the jig used
to ensure vertical
transfer into the same
location and depth of the
probe into the tank; (D)
the cooling system.
Materials Performance and Characterization
MATIJEVIC ET AL. ON QUENCHING PERFORMANCE OF VEGETABLE OILS 229
Calculation of the HTC When Using the Liscic/Petrofer Probe
Quenching processes performed in vaporizable liquids are a complex thermodynamic and fluid-dynamic prob-
lem, described in Mayinger et al.,2 encompassing different boiling phases (vapor film, nucleate boiling, and con-
vection). To describe the heat transfer from a heated metallic workpiece to the quenchant, determination of the
temperature-dependent HTC is used. To calculate the HTC, a cooling curve measured near the surface of the
probe is necessary.
In this case, the probe is considered as a long radially symmetric body of a given radius “r.” In a simplified
1-D model, the temperature distribution T(x, t) inside the cylinder, for times t> 0, depends on the radial distance
x(0, r) from the center of the cylinder and is determined by the 1-D heat conduction equation:
ρc∂T∂t
= divðλ gradTÞ (2)
All the physical properties, ρ (density), c (specific heat capacity), and λ (heat conductivity), of the probe
material are temperature dependent, so the entire problem is nonlinear. The initial condition T(x, 0) is known
(measured), and the problem is to determine the surface HTC, designated “α” in the boundary condition for x= r.
See the following:
λ∂T∂x
= αðT − TexðtÞÞ (3)
where Tex(t) is the measured external temperature of the quenchant. To determine α, an additional cooling curve
T(t) is measured at a point x= r1 near the surface (in this case 1 mm below the surface).
The inverse problem of computation α is solved by the following numerical procedure:
1. Solve the heat conduction equation (2) within the range (0, r1) with measured T(t), the Dirichlet boundarycondition.
2. If r1< r, extend the solution toward the boundary from (0, r1) to (0, r), and3. Calculate α from equation (3) with measured Tex(t) by using numerical differentiation.
Since temperatures are measured at discrete times, they must be smoothed before use. This is done by a cubic
spline least-squares approximation to obtain a sufficiently smooth global approximation over the entire time range.
Numerical solution of the heat conduction equation (2) is performed by the nonlinear implicit method with a
simple iteration per time step to adjust all physical properties to the new temperatures.
The solution extension in Step 2 is computed by local extrapolation based on a low degree polynomial least-
squares approximation. The same approximation is also used for the numerical differentiation needed to compute
α in Step 3.
How realistic and exact the determination of the HTC will be also depends on the input data from the point
at which the temperature inside the probe is measured.
Distinctive Characteristics of Cooling Curves and Calculated Heat Transfer Data
When performing tests using the Liscic/Petrofer probe, the results are presented by the following four diagrams:
(a) The recorded cooling curves;(b) The calculated HTC as a function of time;(c) The calculated HTC as a function of surface temperature; and(d) The calculated surface temperatures for canola oil, palm oil, and a conventional commercially available
petroleum oil (Kalenol 32) are calculated.
The related curves indicated by (a)–(d) are provided in the Appendix for each of the quenchants and quench-
ing conditions evaluated. In order to impartially analyze and use the experimental results, the following character-
istic criteria from those diagrams are applied:
Materials Performance and Characterization
230 MATIJEVIC ET AL. ON QUENCHING PERFORMANCE OF VEGETABLE OILS
1. ΔT10 Temperature gradient between the center and the point 1 mm below the surface at 10 s afterimmersion;
2. tα max Time from immersion to the moment when αmax occurs;3. ΔTmax Maximum temperature gradient;4. αmax Maximum value of the HTC;5. Tα max Temperature at which αmax occurs; and6. ΔT100 Temperature gradient between the center and the point 1 mm below the surface at 100 s after
immersion.
For quenchants with a clearly distinguishable film boiling phase, the transition point between the film boiling
and nucleate boiling (the second critical heat flux density qcr2) can be detected.
The most important feature of each quenching process is the dynamic of heat extraction, which is best rep-
resented by the change of temperature gradients. The earlier specified criteria include the following 3 temperature
gradients:ΔT10, ΔTmax, andΔT100. The temperature gradient at 10 s after immersion (ΔT10) shows how quickly a
quenchant reacts. The maximum temperature gradient (ΔTmax) is of the greatest importance, showing the maxi-
mum thermal stresses developed during the quenching process. The time when ΔTmax occurs is also important,
because the temperature at 1 mm below the surface depends on it. If this temperature, at the moment of ΔTmax, is
lower than the martensite start temperature (Ms) of the relevant steel, structural stresses due to martensite for-
mation may be added to maximum thermal stresses, and distortion or cracking may occur. The temperature gra-
dient ΔT100 at 100 s after immersion provides information on the duration of the quenching process.
Results and Discussion
The following discussion will be in two parts. The first part will be a quantitative review of an earlier study to
investigate quenching performance of palm oil, canola oil, and a petroleum oil quenchant (Kalenol 32) under
unagitated conditions at ambient temperature.21 These results will serve as the basis for Part 2 of this discussion,
where the relative impact of different agitation rates and bath temperatures on quenching performance will be
discussed.
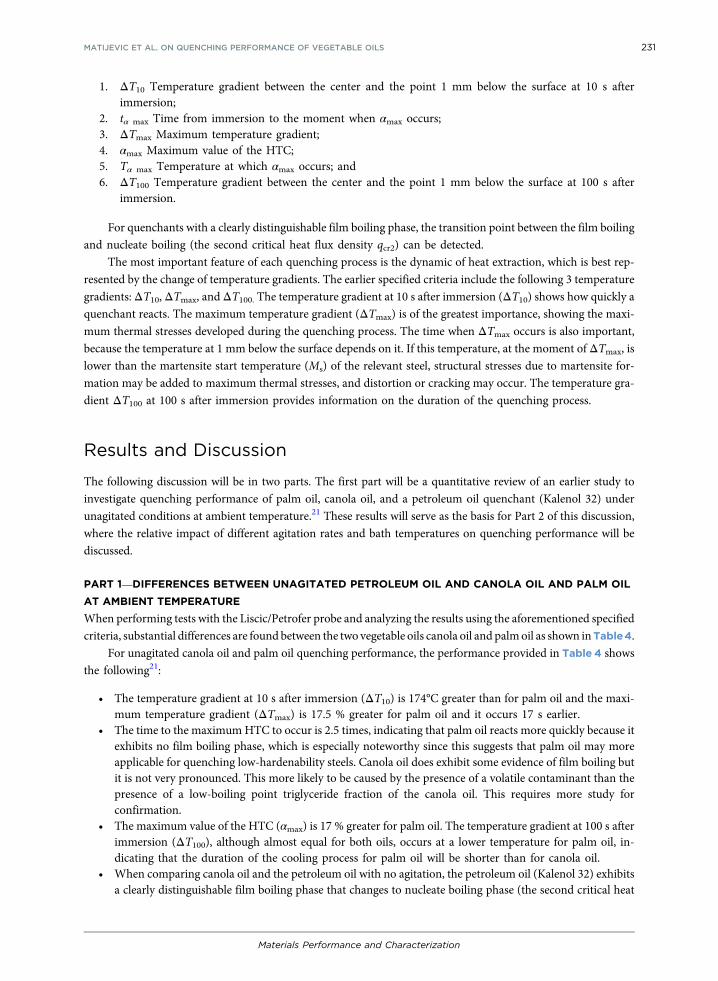
PART 1—DIFFERENCES BETWEEN UNAGITATED PETROLEUM OIL AND CANOLA OIL AND PALM OIL
AT AMBIENT TEMPERATURE
When performing tests with the Liscic/Petrofer probe and analyzing the results using the aforementioned specified
criteria, substantial differences are found between the two vegetable oils canola oil and palmoil as shown inTable4.
For unagitated canola oil and palm oil quenching performance, the performance provided in Table 4 shows
the following21:
• The temperature gradient at 10 s after immersion (ΔT10) is 174°C greater than for palm oil and the maxi-mum temperature gradient (ΔTmax) is 17.5 % greater for palm oil and it occurs 17 s earlier.
• The time to the maximumHTC to occur is 2.5 times, indicating that palm oil reacts more quickly because itexhibits no film boiling phase, which is especially noteworthy since this suggests that palm oil may moreapplicable for quenching low-hardenability steels. Canola oil does exhibit some evidence of film boiling butit is not very pronounced. This more likely to be caused by the presence of a volatile contaminant than thepresence of a low-boiling point triglyceride fraction of the canola oil. This requires more study forconfirmation.
• The maximum value of the HTC (αmax) is 17 % greater for palm oil. The temperature gradient at 100 s afterimmersion (ΔT100), although almost equal for both oils, occurs at a lower temperature for palm oil, in-dicating that the duration of the cooling process for palm oil will be shorter than for canola oil.
• When comparing canola oil and the petroleum oil with no agitation, the petroleum oil (Kalenol 32) exhibitsa clearly distinguishable film boiling phase that changes to nucleate boiling phase (the second critical heat
Materials Performance and Characterization
MATIJEVIC ET AL. ON QUENCHING PERFORMANCE OF VEGETABLE OILS 231
flux density qcr2) at 620°C, after 30 s. As noted earlier, palm oil does not exhibit film boiling, and any film
boiling that is apparent with canola oil is very weak.• The results shown in Table 4 demonstrate a totally different heat extraction dynamic for the petroleum oil
than for canola oil. The petroleum oil reacts faster initially but subsequently it exhibits slower cooling thanthat for canola oil. For canola oil, the time for the maximal HTC (tαmax) to occur is substantially shorter, asevidenced by the higher temperature at which it occurs, and its maximal value is 32 % greater than that forthe petroleum oil quenchant. The maximal temperature gradient (ΔTmax) is greater for canola oil, and thetemperature gradient at 100 s (ΔT100) is equivalent to the petroleum oil, but it occurs at slightly lowertemperatures.
• As previously noted, comparison of the cooling curves for palm oil and petroleum oil clearly show thatpalm oil does not exhibit film boiling. Furthermore, the data in Table 4 show that the HTC (tαmax) is 28 sshorter for palm oil, and the maximal temperature gradient (ΔTmax) is 32 % greater and occurs 22 s earlier.The value of the maximal HTC (αmax) is 41 % greater for palm oil, and it occurs at a higher temperature.The temperature gradient at 100 s (ΔT100) is slightly greater than for the petroleum oil and it occurs atmuch lower temperatures.
GENERAL COMMENTS REGARDING APPARENT FILM BOILING OF VEGETABLE OILS
It is very important to put the results shown for palm oil and canola oil in context, because vegetable oils (if
present as a “pure” triglyceride oil) do not boil. The highest cooking (use) temperature for a vegetable oil is limited
by the temperature at which the oil begins to smoke. Typical smoke points for common vegetable oils may vary
from 121°C to >232°C (250°F to >450°F). The exact smoke points cannot be cited because of the normal com-
positional variation, refining method, seed variety, and even the climate and weather during the plant’s growing
season. However, typical smoke points for common vegetable oils are as follows: for safflower oil, 163°C–177°C
(325°F–350°F); corn oil, 204°C–213°C (400°F–415°F); peanut oil, 216°C–221°C (420°F–430°F); cottonseed oil,
218°C–227°C (425°F–440°F); canola oil, 224°C–229°C (435°F–445°F); and sunflower and soybean oils,
227°C–232°C (440°F–450°F).22 At atmospheric pressure and temperatures greater than the smoke point,
vegetable oils degrade; they do not boil.
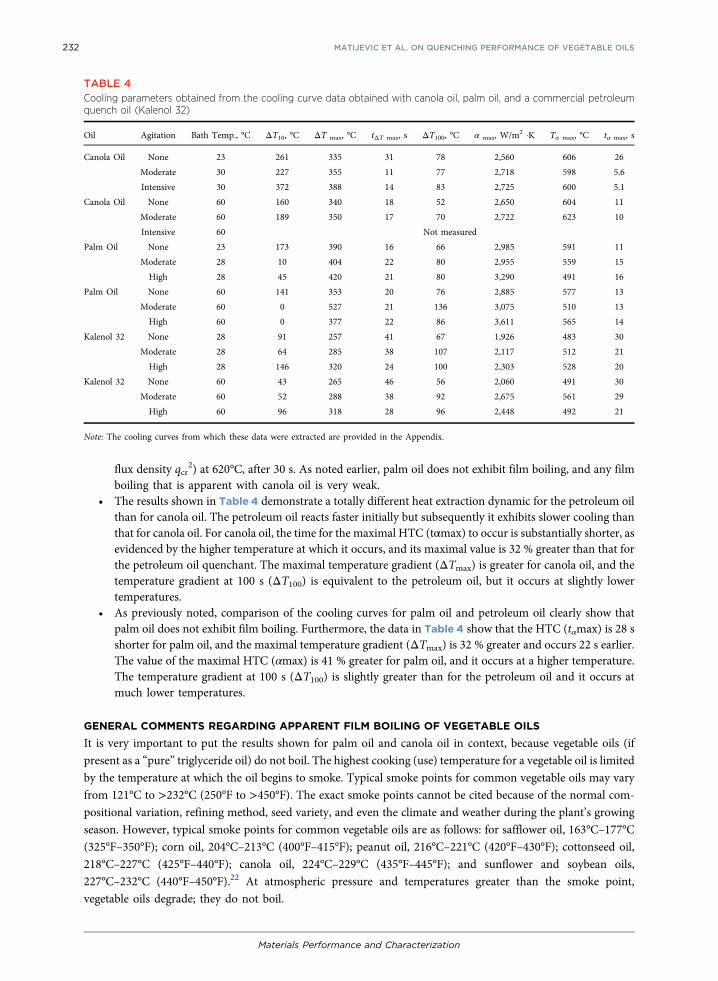
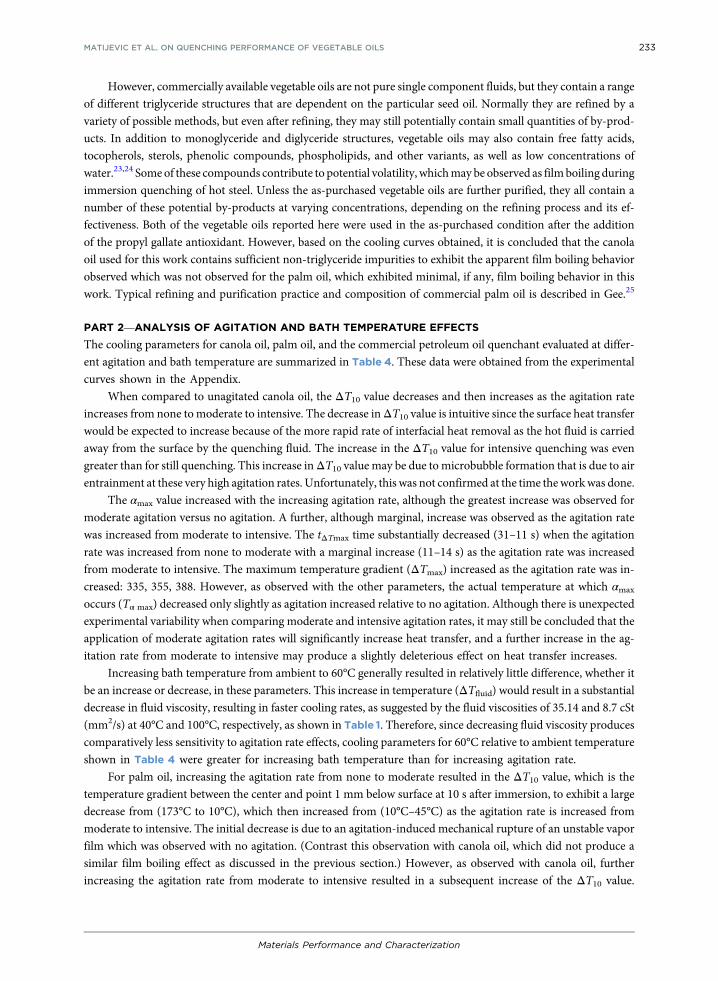
TABLE 4Cooling parameters obtained from the cooling curve data obtained with canola oil, palm oil, and a commercial petroleumquench oil (Kalenol 32)
Oil Agitation Bath Temp., °C ΔT10, °C ΔT max, °C tΔT max, s ΔT100, °C α max, W/m2 ·K Tα max, °C tα max, s
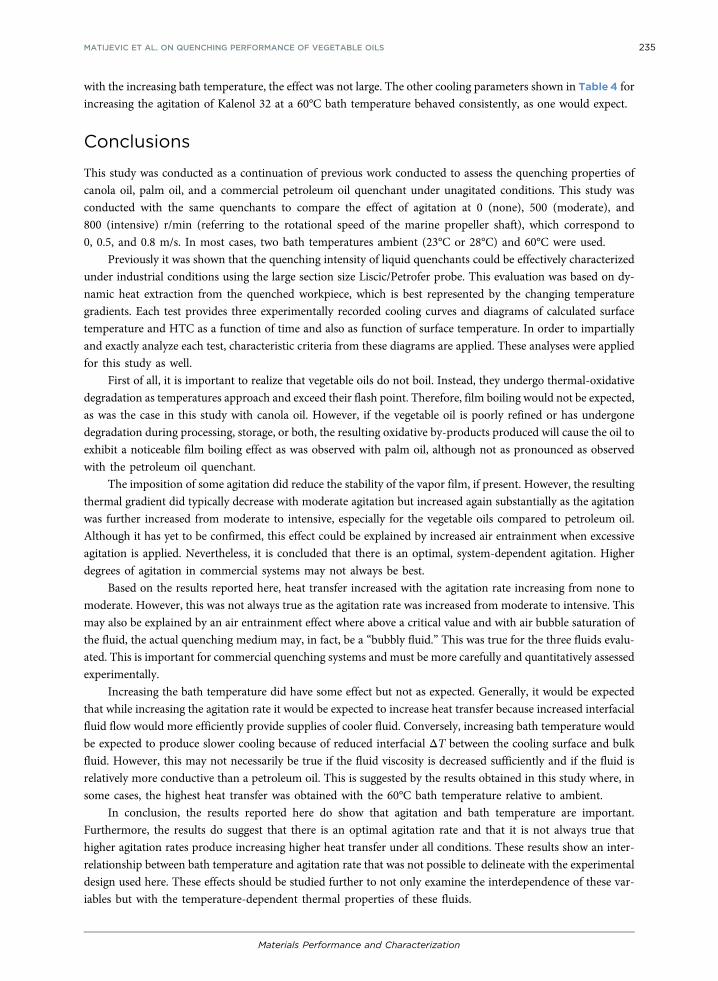
Canola Oil None 23 261 335 31 78 2,560 606 26
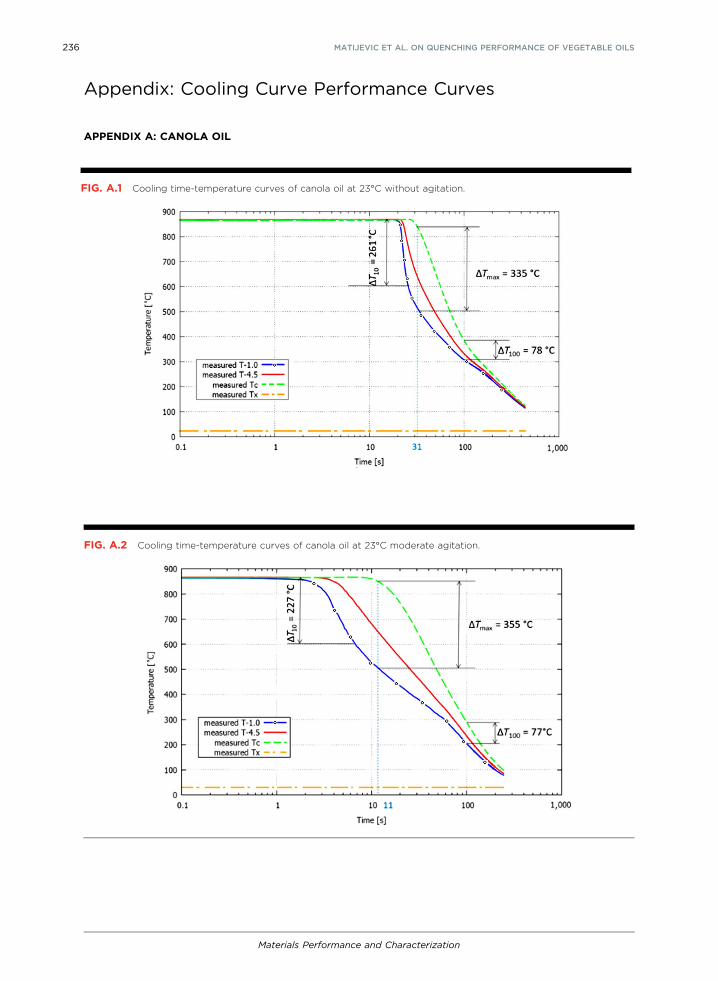
Moderate 30 227 355 11 77 2,718 598 5.6
Intensive 30 372 388 14 83 2,725 600 5.1
Canola Oil None 60 160 340 18 52 2,650 604 11
Moderate 60 189 350 17 70 2,722 623 10
Intensive 60 Not measured
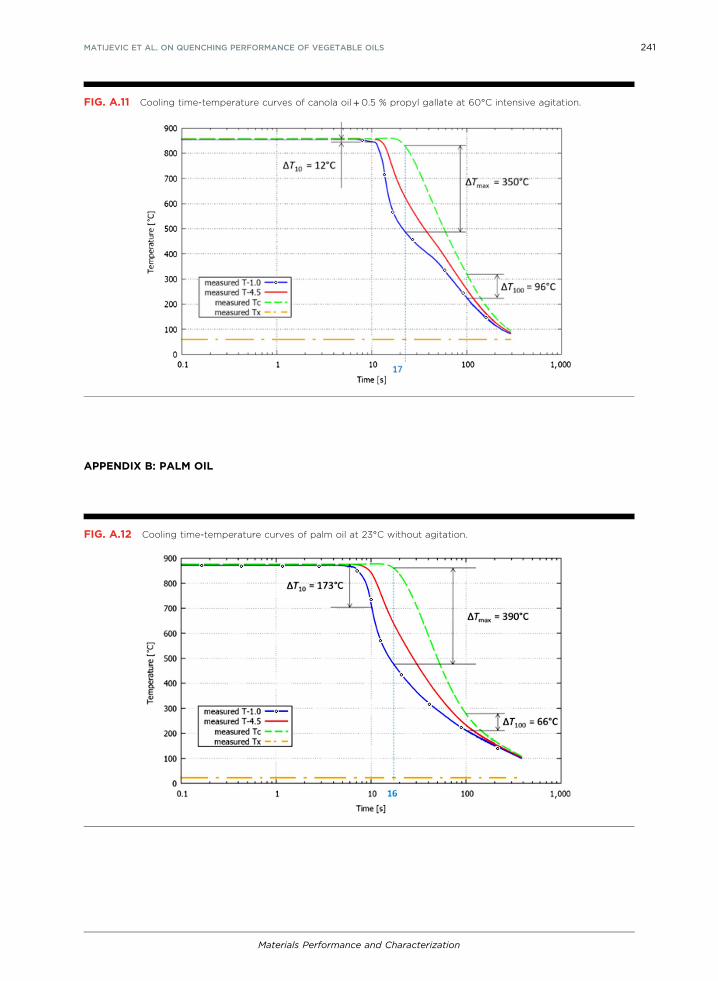
Palm Oil None 23 173 390 16 66 2,985 591 11
Moderate 28 10 404 22 80 2,955 559 15
High 28 45 420 21 80 3,290 491 16
Palm Oil None 60 141 353 20 76 2,885 577 13
Moderate 60 0 527 21 136 3,075 510 13
High 60 0 377 22 86 3,611 565 14
Kalenol 32 None 28 91 257 41 67 1,926 483 30
Moderate 28 64 285 38 107 2,117 512 21
High 28 146 320 24 100 2,303 528 20
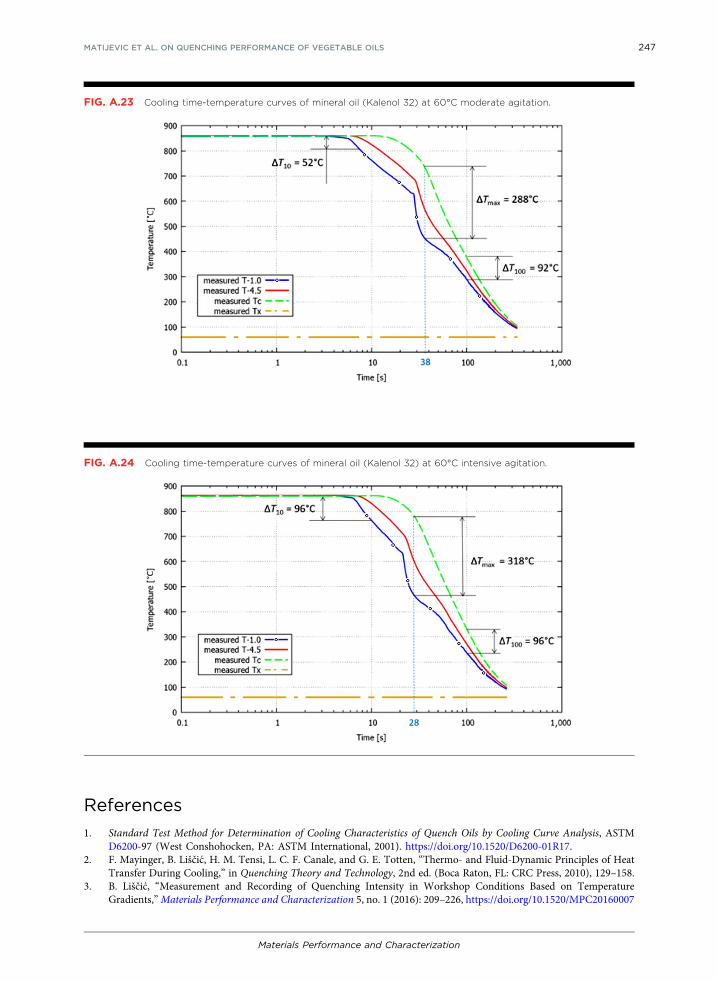
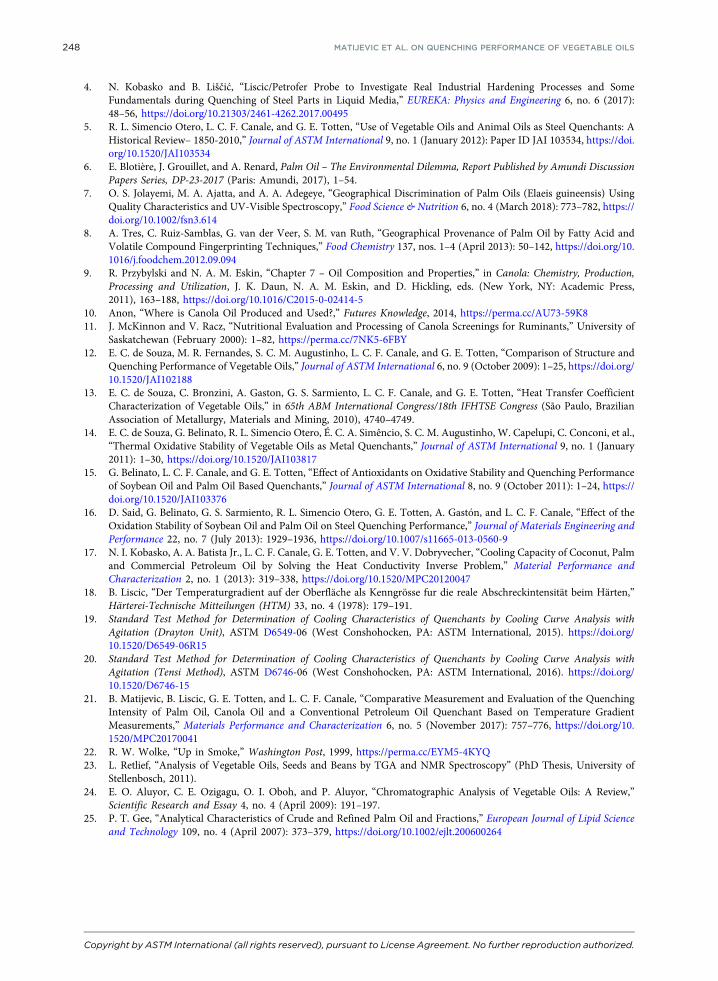
Kalenol 32 None 60 43 265 46 56 2,060 491 30
Moderate 60 52 288 38 92 2,675 561 29
High 60 96 318 28 96 2,448 492 21
Note: The cooling curves from which these data were extracted are provided in the Appendix.
Materials Performance and Characterization
232 MATIJEVIC ET AL. ON QUENCHING PERFORMANCE OF VEGETABLE OILS
However, commercially available vegetable oils are not pure single component fluids, but they contain a range
of different triglyceride structures that are dependent on the particular seed oil. Normally they are refined by a
variety of possible methods, but even after refining, they may still potentially contain small quantities of by-prod-
ucts. In addition to monoglyceride and diglyceride structures, vegetable oils may also contain free fatty acids,
tocopherols, sterols, phenolic compounds, phospholipids, and other variants, as well as low concentrations of
water.23,24 Some of these compounds contribute to potential volatility, whichmay be observed as filmboiling during
immersion quenching of hot steel. Unless the as-purchased vegetable oils are further purified, they all contain a
number of these potential by-products at varying concentrations, depending on the refining process and its ef-
fectiveness. Both of the vegetable oils reported here were used in the as-purchased condition after the addition
of the propyl gallate antioxidant. However, based on the cooling curves obtained, it is concluded that the canola
oil used for this work contains sufficient non-triglyceride impurities to exhibit the apparent film boiling behavior
observed which was not observed for the palm oil, which exhibited minimal, if any, film boiling behavior in this
work. Typical refining and purification practice and composition of commercial palm oil is described in Gee.25
PART 2—ANALYSIS OF AGITATION AND BATH TEMPERATURE EFFECTS
The cooling parameters for canola oil, palm oil, and the commercial petroleum oil quenchant evaluated at differ-
ent agitation and bath temperature are summarized in Table 4. These data were obtained from the experimental
curves shown in the Appendix.
When compared to unagitated canola oil, the ΔT10 value decreases and then increases as the agitation rate
increases from none to moderate to intensive. The decrease inΔT10 value is intuitive since the surface heat transfer
would be expected to increase because of the more rapid rate of interfacial heat removal as the hot fluid is carried
away from the surface by the quenching fluid. The increase in the ΔT10 value for intensive quenching was even
greater than for still quenching. This increase inΔT10 value may be due to microbubble formation that is due to air
entrainment at these very high agitation rates. Unfortunately, this was not confirmed at the time theworkwas done.
The αmax value increased with the increasing agitation rate, although the greatest increase was observed for
moderate agitation versus no agitation. A further, although marginal, increase was observed as the agitation rate
was increased from moderate to intensive. The tΔTmax time substantially decreased (31–11 s) when the agitation
rate was increased from none to moderate with a marginal increase (11–14 s) as the agitation rate was increased
from moderate to intensive. The maximum temperature gradient (ΔTmax) increased as the agitation rate was in-
creased: 335, 355, 388. However, as observed with the other parameters, the actual temperature at which αmax
occurs (Tα max) decreased only slightly as agitation increased relative to no agitation. Although there is unexpected
experimental variability when comparing moderate and intensive agitation rates, it may still be concluded that the
application of moderate agitation rates will significantly increase heat transfer, and a further increase in the ag-
itation rate from moderate to intensive may produce a slightly deleterious effect on heat transfer increases.
Increasing bath temperature from ambient to 60°C generally resulted in relatively little difference, whether it
be an increase or decrease, in these parameters. This increase in temperature (ΔTfluid) would result in a substantial
decrease in fluid viscosity, resulting in faster cooling rates, as suggested by the fluid viscosities of 35.14 and 8.7 cSt
(mm2/s) at 40°C and 100°C, respectively, as shown in Table 1. Therefore, since decreasing fluid viscosity produces
comparatively less sensitivity to agitation rate effects, cooling parameters for 60°C relative to ambient temperature
shown in Table 4 were greater for increasing bath temperature than for increasing agitation rate.
For palm oil, increasing the agitation rate from none to moderate resulted in the ΔT10 value, which is the
temperature gradient between the center and point 1 mm below surface at 10 s after immersion, to exhibit a large
decrease from (173°C to 10°C), which then increased from (10°C–45°C) as the agitation rate is increased from
moderate to intensive. The initial decrease is due to an agitation-induced mechanical rupture of an unstable vapor
film which was observed with no agitation. (Contrast this observation with canola oil, which did not produce a
similar film boiling effect as discussed in the previous section.) However, as observed with canola oil, further
increasing the agitation rate from moderate to intensive resulted in a subsequent increase of the ΔT10 value.
Materials Performance and Characterization
MATIJEVIC ET AL. ON QUENCHING PERFORMANCE OF VEGETABLE OILS 233
As previously suggested, this may be due to agitation-induced air entrainment of the intensively agitated fluid,
which would be expected to produce correspondingly lower cooling rates.
No significant increase in the αmax value was observed for palm oil as the agitation rate was increased from
none to moderate (2,985 versus 2,955). However, increasing the agitation rate from moderate to intensive did
produce a significant increase in the αmax value (2,955 to 3,290). While the overall increase in the αmax value was
expected, a greater impact of moderate agitation was expected as well. Thus, increasing agitation did, in fact, result
in increasing αmax; a more progressive increase would have been expected throughout the overall agitation rate
increasing process, as observed for canola oil.
The tΔT max, the time from immersion to the moment when αmax occurs, increased from (16–22 s) as the
agitation rate was increased from none to moderate and remained essentially unchanged with a further agitation
increase frommoderate to intensive (22 to 21 s). However, it is cautioned that when observing these data for palm
oil relative to canola oil and petroleum quench oil, while differences are observed, they may not be particularly
significant, suggesting that the cooling time may not be largely affected by agitation rate.
The maximum temperature gradient (ΔTmax) of palm oil decreased as the agitation rate was increased: 390,
404, 420. The temperature at which αmax occurs (Tα max) decreased with increasing agitation rate (591°C, 559°C,
491°C), which is the expected effect on cooling of increasing interfacial fluid flow.
Increasing the bath temperature of palm oil from ambient to 60°C generally resulted in a dramatic decrease
in in the ΔT10 value, with the greatest effect observed when the agitation rate is increased from none to moderate
(141°C to 0°C). This effect was even greater than observed for canola oil with increasing bath temperature.
However, as for canola oil, the effect may be explained by an even greater decrease in viscosity with increasing
temperature, as shown in Table 1, by the fluid viscosities of 40.39 and 8.53 cSt (mm2/s) at 40°C and 100°C,
respectively. However, for palm oil, a greater increase in the αmax value with increasing agitation rate at a bath
temperature of 60°C was observed (2,885, 3,075, 3,611) than obtained for canola oil (see Table 4).
The effect of bath temperature and agitation of Kalenol 32, a commercial petroleum oil quenchant, was also
evaluated for comparison to the quenching results obtained for canola oil and palm oil. The results obtained are
also summarized in Table 4.
The effect of increasing agitation at ambient bath temperature (28°C, in this case) was similar to that ob-
served for canola oil, where the ΔT10 value decreased as the agitation increased from none to moderate (91°C to
64°C) and then increased as the agitation was increased from moderate to intensive (64°C to 140°C). This effect
was attributed to a substantial increase in air entrainment at the highest agitation rate as discussed earlier for
canola oil. Without this possible air entrainment effect, the increase in agitation frommoderate to intensive would
have been expected to result in a further decrease in the ΔT10 value. As with canola oil, for this quenching system,
it is apparent that the optimal impact of agitation is obtained for moderate flow rates.
As would be expected, increasing agitation should result in increased HTCs (αmax), which were observed
with the values increasing from 1,926 to 2,117 to 2,303, respectively, as the agitation was increased from none to
moderate to intensive. This is consistent with the behavior of both palm oil and canola oil. However, the αmax
values are considerably lower than either canola oil or palm oil. This cannot be attributed to fluid viscosity, since
the Kalenol 32 values are lower than either canola oil or palm oil (32 and 5.4 cSt at 40°C and 100°C, respectively).
It is expected that these results are, in fact, related to poorer thermophysical properties of the petroleum base stock
compared to either vegetable oil. Unfortunately, these values have not been reported for all of the fluids.
The tΔTmax time decreased with increasing agitation (41, 38, 24 s). The maximum temperature gradient
(ΔTmax) increased for Kalenol 32 with increasing agitation rate (257°C, 285°C, 320°C). The temperature at which
αmax occurs (Tα max) increased with increasing agitation rate (483, 512, 528). These are effects that would be
expected with increasing interfacial flow rates and indicate that slower heat transfer is obtained with the petro-
leum-based Kalenol 32 versus a vegetable oil such as canola oil or palm oil.
At a higher bath temperature, 60°C versus 28°C, the αmax value does show a small increase with increasing
agitation fromnone tomoderate (2,060 to 2,675); however, further increase in agitation frommoderate to intensive
resulted in only a minimal change, a decrease from 2,675 to 2,448. Overall, while the αmax value increased slightly
Materials Performance and Characterization
234 MATIJEVIC ET AL. ON QUENCHING PERFORMANCE OF VEGETABLE OILS
with the increasing bath temperature, the effect was not large. The other cooling parameters shown in Table 4 for
increasing the agitation of Kalenol 32 at a 60°C bath temperature behaved consistently, as one would expect.
Conclusions
This study was conducted as a continuation of previous work conducted to assess the quenching properties of
canola oil, palm oil, and a commercial petroleum oil quenchant under unagitated conditions. This study was
conducted with the same quenchants to compare the effect of agitation at 0 (none), 500 (moderate), and
800 (intensive) r/min (referring to the rotational speed of the marine propeller shaft), which correspond to
0, 0.5, and 0.8 m/s. In most cases, two bath temperatures ambient (23°C or 28°C) and 60°C were used.
Previously it was shown that the quenching intensity of liquid quenchants could be effectively characterized
under industrial conditions using the large section size Liscic/Petrofer probe. This evaluation was based on dy-
namic heat extraction from the quenched workpiece, which is best represented by the changing temperature
gradients. Each test provides three experimentally recorded cooling curves and diagrams of calculated surface
temperature and HTC as a function of time and also as function of surface temperature. In order to impartially
and exactly analyze each test, characteristic criteria from these diagrams are applied. These analyses were applied
for this study as well.
First of all, it is important to realize that vegetable oils do not boil. Instead, they undergo thermal-oxidative
degradation as temperatures approach and exceed their flash point. Therefore, film boiling would not be expected,
as was the case in this study with canola oil. However, if the vegetable oil is poorly refined or has undergone
degradation during processing, storage, or both, the resulting oxidative by-products produced will cause the oil to
exhibit a noticeable film boiling effect as was observed with palm oil, although not as pronounced as observed
with the petroleum oil quenchant.
The imposition of some agitation did reduce the stability of the vapor film, if present. However, the resulting
thermal gradient did typically decrease with moderate agitation but increased again substantially as the agitation
was further increased from moderate to intensive, especially for the vegetable oils compared to petroleum oil.
Although it has yet to be confirmed, this effect could be explained by increased air entrainment when excessive
agitation is applied. Nevertheless, it is concluded that there is an optimal, system-dependent agitation. Higher
degrees of agitation in commercial systems may not always be best.
Based on the results reported here, heat transfer increased with the agitation rate increasing from none to
moderate. However, this was not always true as the agitation rate was increased from moderate to intensive. This
may also be explained by an air entrainment effect where above a critical value and with air bubble saturation of
the fluid, the actual quenching medium may, in fact, be a “bubbly fluid.” This was true for the three fluids evalu-
ated. This is important for commercial quenching systems and must be more carefully and quantitatively assessed
experimentally.
Increasing the bath temperature did have some effect but not as expected. Generally, it would be expected
that while increasing the agitation rate it would be expected to increase heat transfer because increased interfacial
fluid flow would more efficiently provide supplies of cooler fluid. Conversely, increasing bath temperature would
be expected to produce slower cooling because of reduced interfacial ΔT between the cooling surface and bulk
fluid. However, this may not necessarily be true if the fluid viscosity is decreased sufficiently and if the fluid is
relatively more conductive than a petroleum oil. This is suggested by the results obtained in this study where, in
some cases, the highest heat transfer was obtained with the 60°C bath temperature relative to ambient.
In conclusion, the results reported here do show that agitation and bath temperature are important.
Furthermore, the results do suggest that there is an optimal agitation rate and that it is not always true that
higher agitation rates produce increasing higher heat transfer under all conditions. These results show an inter-
relationship between bath temperature and agitation rate that was not possible to delineate with the experimental
design used here. These effects should be studied further to not only examine the interdependence of these var-
iables but with the temperature-dependent thermal properties of these fluids.
Materials Performance and Characterization
MATIJEVIC ET AL. ON QUENCHING PERFORMANCE OF VEGETABLE OILS 235
Appendix: Cooling Curve Performance Curves
APPENDIX A: CANOLA OIL
FIG. A.1 Cooling time-temperature curves of canola oil at 23°C without agitation.
FIG. A.2 Cooling time-temperature curves of canola oil at 23°C moderate agitation.
Materials Performance and Characterization
236 MATIJEVIC ET AL. ON QUENCHING PERFORMANCE OF VEGETABLE OILS
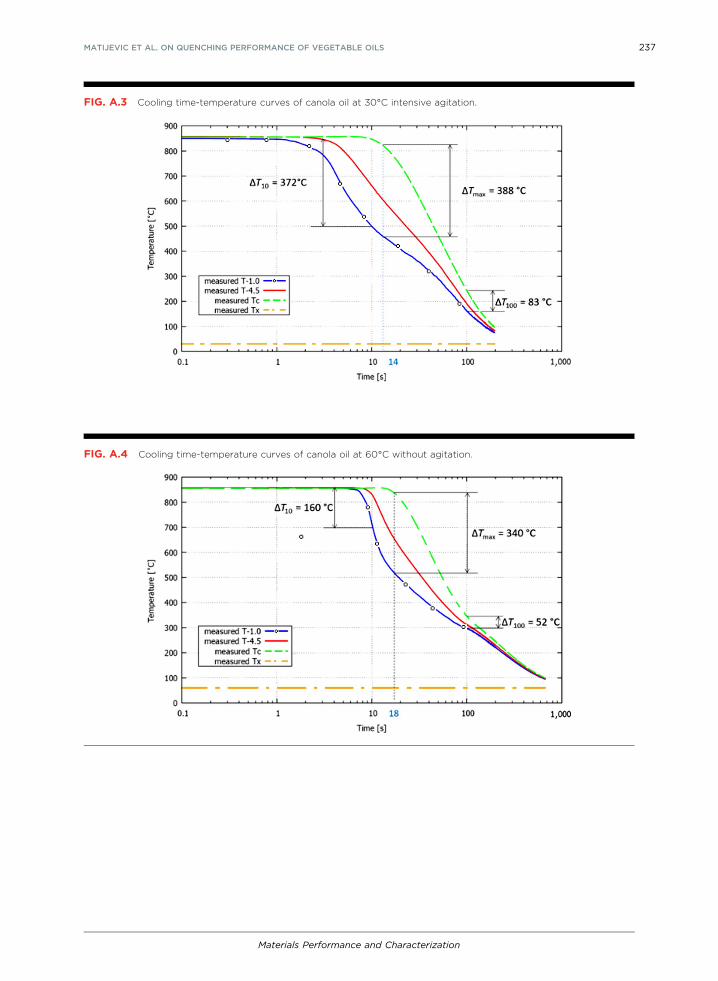
FIG. A.4 Cooling time-temperature curves of canola oil at 60°C without agitation.
FIG. A.3 Cooling time-temperature curves of canola oil at 30°C intensive agitation.
Materials Performance and Characterization
MATIJEVIC ET AL. ON QUENCHING PERFORMANCE OF VEGETABLE OILS 237

FIG. A.5 Cooling time-temperature curves of canola oil at 60°C moderate agitation.
FIG. A.6 Cooling time-temperature curves of canola oil+0.5 % propyl gallate at 30°C without agitation.
Materials Performance and Characterization
238 MATIJEVIC ET AL. ON QUENCHING PERFORMANCE OF VEGETABLE OILS
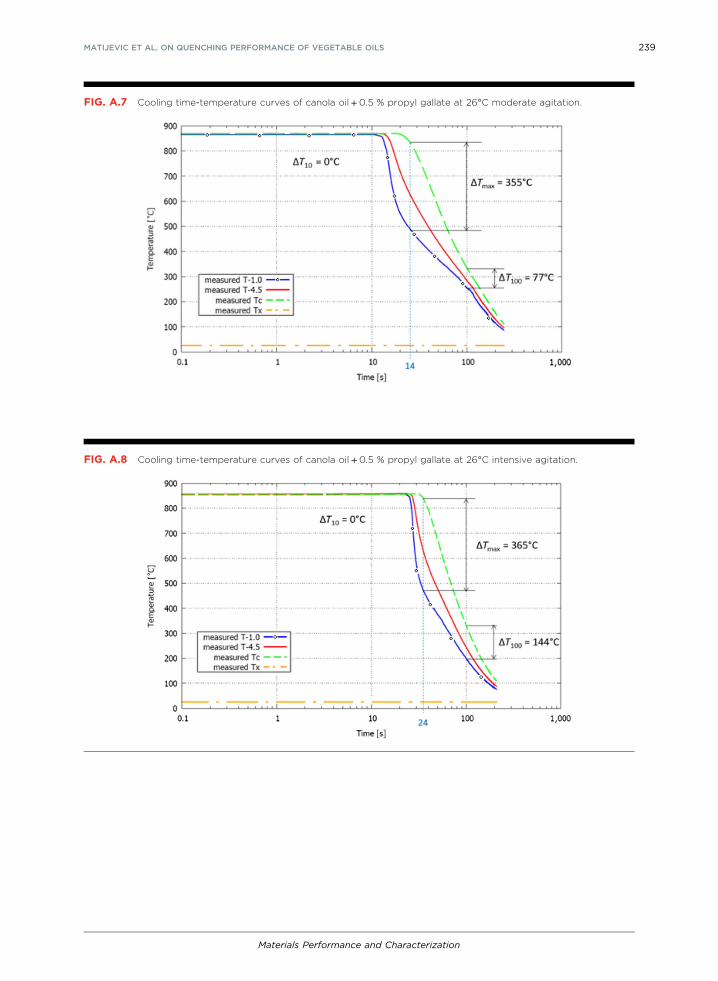
FIG. A.8 Cooling time-temperature curves of canola oil +0.5 % propyl gallate at 26°C intensive agitation.
FIG. A.7 Cooling time-temperature curves of canola oil+0.5 % propyl gallate at 26°C moderate agitation.
Materials Performance and Characterization
MATIJEVIC ET AL. ON QUENCHING PERFORMANCE OF VEGETABLE OILS 239
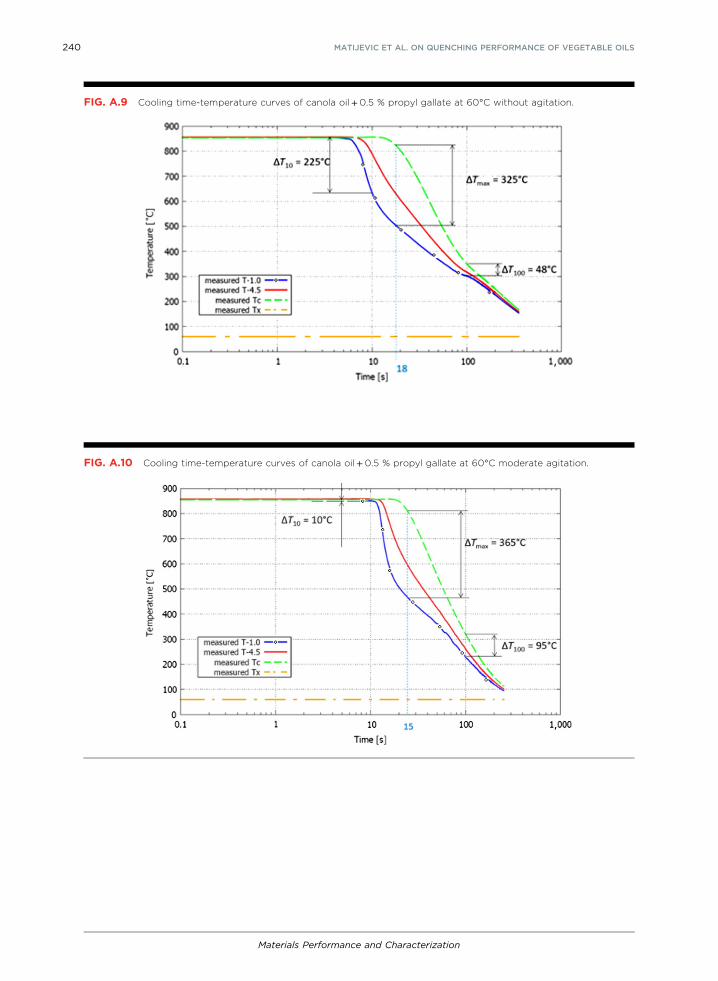
FIG. A.10 Cooling time-temperature curves of canola oil+0.5 % propyl gallate at 60°C moderate agitation.
FIG. A.9 Cooling time-temperature curves of canola oil+0.5 % propyl gallate at 60°C without agitation.
Materials Performance and Characterization
240 MATIJEVIC ET AL. ON QUENCHING PERFORMANCE OF VEGETABLE OILS
APPENDIX B: PALM OIL
FIG. A.12 Cooling time-temperature curves of palm oil at 23°C without agitation.
FIG. A.11 Cooling time-temperature curves of canola oil+0.5 % propyl gallate at 60°C intensive agitation.
Materials Performance and Characterization
MATIJEVIC ET AL. ON QUENCHING PERFORMANCE OF VEGETABLE OILS 241
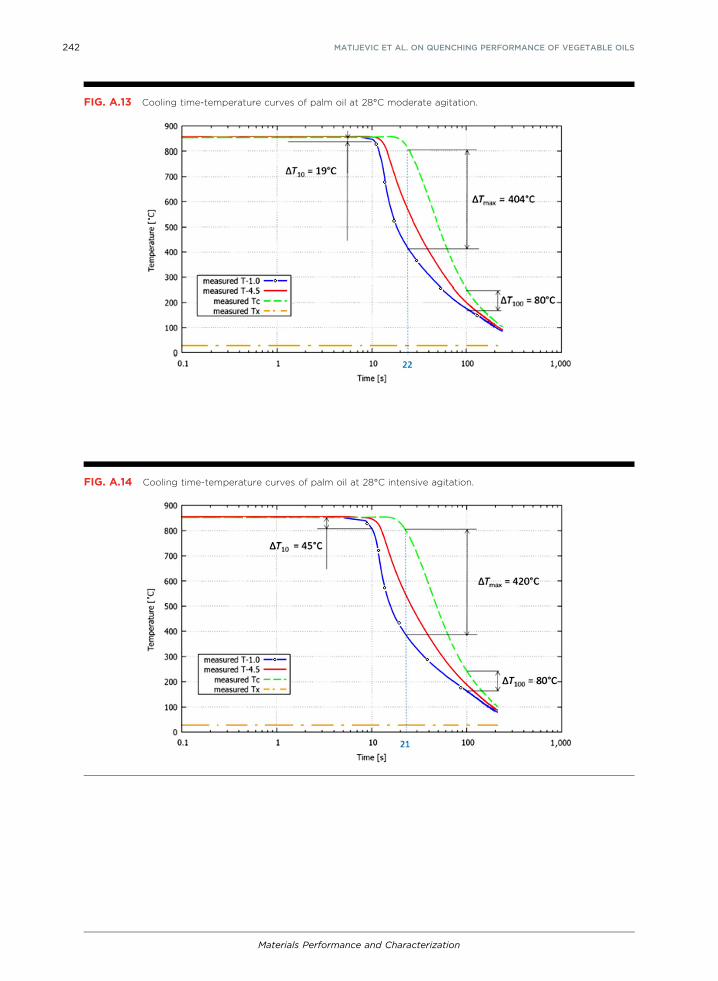
FIG. A.13 Cooling time-temperature curves of palm oil at 28°C moderate agitation.
FIG. A.14 Cooling time-temperature curves of palm oil at 28°C intensive agitation.
Materials Performance and Characterization
242 MATIJEVIC ET AL. ON QUENCHING PERFORMANCE OF VEGETABLE OILS
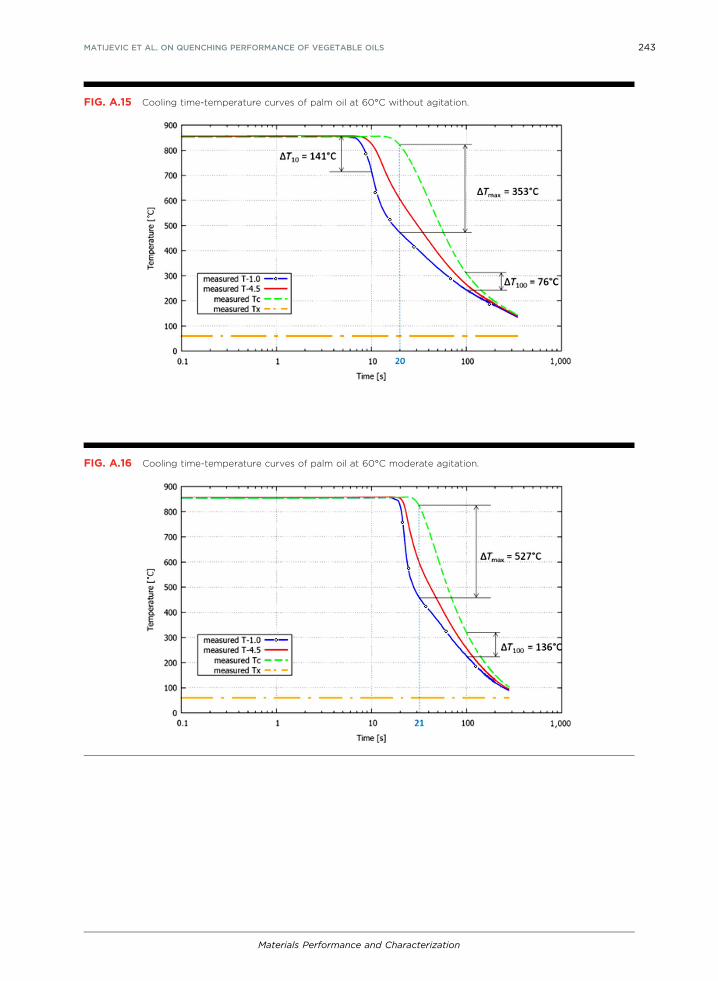
FIG. A.15 Cooling time-temperature curves of palm oil at 60°C without agitation.
FIG. A.16 Cooling time-temperature curves of palm oil at 60°C moderate agitation.
Materials Performance and Characterization
MATIJEVIC ET AL. ON QUENCHING PERFORMANCE OF VEGETABLE OILS 243
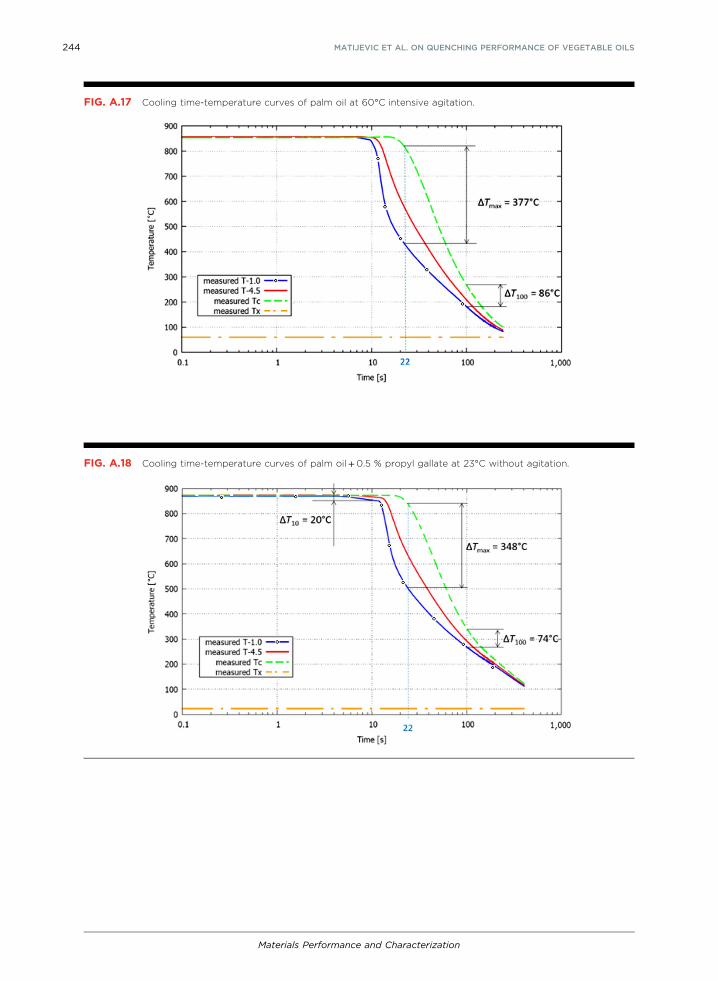
FIG. A.17 Cooling time-temperature curves of palm oil at 60°C intensive agitation.
FIG. A.18 Cooling time-temperature curves of palm oil+0.5 % propyl gallate at 23°C without agitation.
Materials Performance and Characterization
244 MATIJEVIC ET AL. ON QUENCHING PERFORMANCE OF VEGETABLE OILS
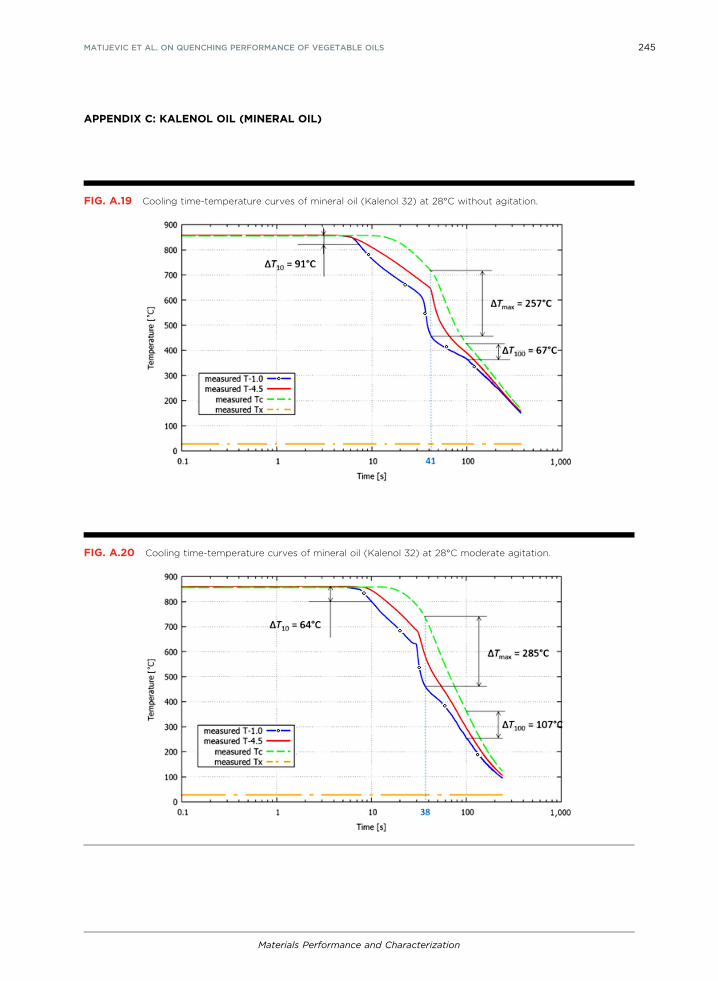
APPENDIX C: KALENOL OIL (MINERAL OIL)
FIG. A.19 Cooling time-temperature curves of mineral oil (Kalenol 32) at 28°C without agitation.
FIG. A.20 Cooling time-temperature curves of mineral oil (Kalenol 32) at 28°C moderate agitation.
Materials Performance and Characterization
MATIJEVIC ET AL. ON QUENCHING PERFORMANCE OF VEGETABLE OILS 245
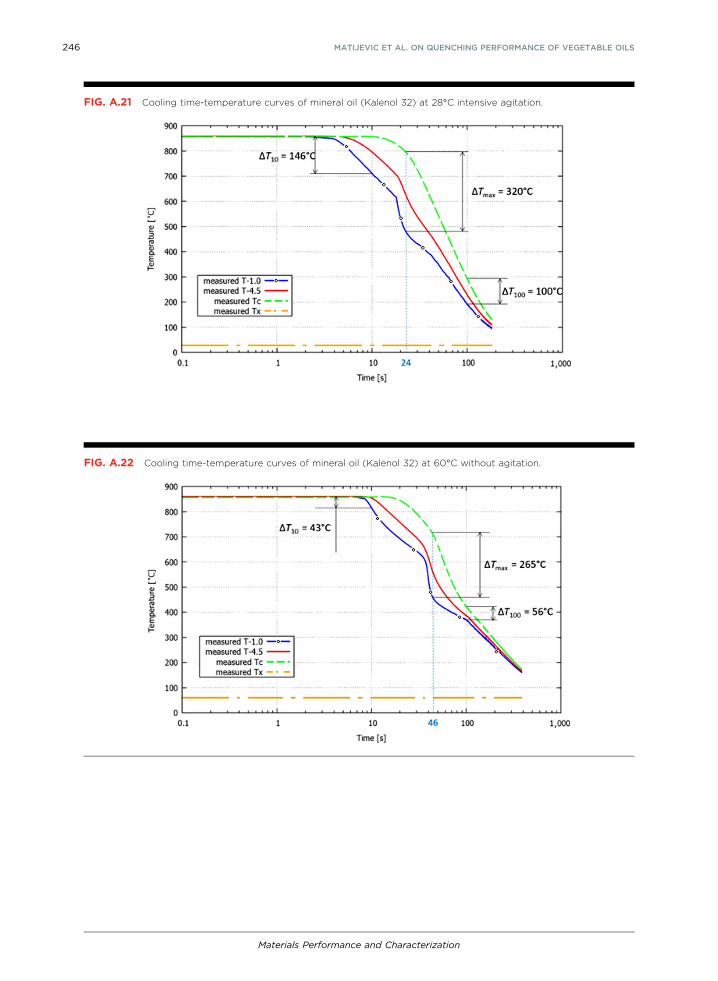
FIG. A.21 Cooling time-temperature curves of mineral oil (Kalenol 32) at 28°C intensive agitation.
FIG. A.22 Cooling time-temperature curves of mineral oil (Kalenol 32) at 60°C without agitation.
Materials Performance and Characterization
246 MATIJEVIC ET AL. ON QUENCHING PERFORMANCE OF VEGETABLE OILS
References
1. Standard Test Method for Determination of Cooling Characteristics of Quench Oils by Cooling Curve Analysis, ASTMD6200-97 (West Conshohocken, PA: ASTM International, 2001). https://doi.org/10.1520/D6200-01R17.
2. F. Mayinger, B. Liščic, H. M. Tensi, L. C. F. Canale, and G. E. Totten, “Thermo- and Fluid-Dynamic Principles of HeatTransfer During Cooling,” in Quenching Theory and Technology, 2nd ed. (Boca Raton, FL: CRC Press, 2010), 129–158.
3. B. Liščic, “Measurement and Recording of Quenching Intensity in Workshop Conditions Based on TemperatureGradients,”Materials Performance and Characterization 5, no. 1 (2016): 209–226, https://doi.org/10.1520/MPC20160007
FIG. A.23 Cooling time-temperature curves of mineral oil (Kalenol 32) at 60°C moderate agitation.
FIG. A.24 Cooling time-temperature curves of mineral oil (Kalenol 32) at 60°C intensive agitation.
Materials Performance and Characterization
MATIJEVIC ET AL. ON QUENCHING PERFORMANCE OF VEGETABLE OILS 247
4. N. Kobasko and B. Liščic, “Liscic/Petrofer Probe to Investigate Real Industrial Hardening Processes and SomeFundamentals during Quenching of Steel Parts in Liquid Media,” EUREKA: Physics and Engineering 6, no. 6 (2017):48–56, https://doi.org/10.21303/2461-4262.2017.00495
5. R. L. Simencio Otero, L. C. F. Canale, and G. E. Totten, “Use of Vegetable Oils and Animal Oils as Steel Quenchants: AHistorical Review– 1850-2010,” Journal of ASTM International 9, no. 1 (January 2012): Paper ID JAI 103534, https://doi.org/10.1520/JAI103534
6. E. Blotière, J. Grouillet, and A. Renard, Palm Oil – The Environmental Dilemma, Report Published by Amundi DiscussionPapers Series, DP-23-2017 (Paris: Amundi, 2017), 1–54.
7. O. S. Jolayemi, M. A. Ajatta, and A. A. Adegeye, “Geographical Discrimination of Palm Oils (Elaeis guineensis) UsingQuality Characteristics and UV-Visible Spectroscopy,” Food Science & Nutrition 6, no. 4 (March 2018): 773–782, https://doi.org/10.1002/fsn3.614
8. A. Tres, C. Ruiz-Samblas, G. van der Veer, S. M. van Ruth, “Geographical Provenance of Palm Oil by Fatty Acid andVolatile Compound Fingerprinting Techniques,” Food Chemistry 137, nos. 1–4 (April 2013): 50–142, https://doi.org/10.1016/j.foodchem.2012.09.094
9. R. Przybylski and N. A. M. Eskin, “Chapter 7 – Oil Composition and Properties,” in Canola: Chemistry, Production,Processing and Utilization, J. K. Daun, N. A. M. Eskin, and D. Hickling, eds. (New York, NY: Academic Press,2011), 163–188, https://doi.org/10.1016/C2015-0-02414-5
10. Anon, “Where is Canola Oil Produced and Used?,” Futures Knowledge, 2014, https://perma.cc/AU73-59K811. J. McKinnon and V. Racz, “Nutritional Evaluation and Processing of Canola Screenings for Ruminants,” University of
Saskatchewan (February 2000): 1–82, https://perma.cc/7NK5-6FBY12. E. C. de Souza, M. R. Fernandes, S. C. M. Augustinho, L. C. F. Canale, and G. E. Totten, “Comparison of Structure and
Quenching Performance of Vegetable Oils,” Journal of ASTM International 6, no. 9 (October 2009): 1–25, https://doi.org/10.1520/JAI102188
13. E. C. de Souza, C. Bronzini, A. Gaston, G. S. Sarmiento, L. C. F. Canale, and G. E. Totten, “Heat Transfer CoefficientCharacterization of Vegetable Oils,” in 65th ABM International Congress/18th IFHTSE Congress (São Paulo, BrazilianAssociation of Metallurgy, Materials and Mining, 2010), 4740–4749.
14. E. C. de Souza, G. Belinato, R. L. Simencio Otero, É. C. A. Simêncio, S. C. M. Augustinho, W. Capelupi, C. Conconi, et al.,“Thermal Oxidative Stability of Vegetable Oils as Metal Quenchants,” Journal of ASTM International 9, no. 1 (January2011): 1–30, https://doi.org/10.1520/JAI103817
15. G. Belinato, L. C. F. Canale, and G. E. Totten, “Effect of Antioxidants on Oxidative Stability and Quenching Performanceof Soybean Oil and Palm Oil Based Quenchants,” Journal of ASTM International 8, no. 9 (October 2011): 1–24, https://doi.org/10.1520/JAI103376
16. D. Said, G. Belinato, G. S. Sarmiento, R. L. Simencio Otero, G. E. Totten, A. Gaston, and L. C. F. Canale, “Effect of theOxidation Stability of Soybean Oil and Palm Oil on Steel Quenching Performance,” Journal of Materials Engineering andPerformance 22, no. 7 (July 2013): 1929–1936, https://doi.org/10.1007/s11665-013-0560-9
17. N. I. Kobasko, A. A. Batista Jr., L. C. F. Canale, G. E. Totten, and V. V. Dobryvecher, “Cooling Capacity of Coconut, Palmand Commercial Petroleum Oil by Solving the Heat Conductivity Inverse Problem,” Material Performance andCharacterization 2, no. 1 (2013): 319–338, https://doi.org/10.1520/MPC20120047
18. B. Liscic, “Der Temperaturgradient auf der Oberfläche als Kenngrösse fur die reale Abschreckintensität beim Härten,”Härterei-Technische Mitteilungen (HTM) 33, no. 4 (1978): 179–191.
19. Standard Test Method for Determination of Cooling Characteristics of Quenchants by Cooling Curve Analysis withAgitation (Drayton Unit), ASTM D6549-06 (West Conshohocken, PA: ASTM International, 2015). https://doi.org/10.1520/D6549-06R15
20. Standard Test Method for Determination of Cooling Characteristics of Quenchants by Cooling Curve Analysis withAgitation (Tensi Method), ASTM D6746-06 (West Conshohocken, PA: ASTM International, 2016). https://doi.org/10.1520/D6746-15
21. B. Matijevic, B. Liscic, G. E. Totten, and L. C. F. Canale, “Comparative Measurement and Evaluation of the QuenchingIntensity of Palm Oil, Canola Oil and a Conventional Petroleum Oil Quenchant Based on Temperature GradientMeasurements,” Materials Performance and Characterization 6, no. 5 (November 2017): 757–776, https://doi.org/10.1520/MPC20170041
22. R. W. Wolke, “Up in Smoke,” Washington Post, 1999, https://perma.cc/EYM5-4KYQ23. L. Retlief, “Analysis of Vegetable Oils, Seeds and Beans by TGA and NMR Spectroscopy” (PhD Thesis, University of
Stellenbosch, 2011).24. E. O. Aluyor, C. E. Ozigagu, O. I. Oboh, and P. Aluyor, “Chromatographic Analysis of Vegetable Oils: A Review,”
Scientific Research and Essay 4, no. 4 (April 2009): 191–197.25. P. T. Gee, “Analytical Characteristics of Crude and Refined Palm Oil and Fractions,” European Journal of Lipid Science
and Technology 109, no. 4 (April 2007): 373–379, https://doi.org/10.1002/ejlt.200600264
Copyright by ASTM International (all rights reserved), pursuant to License Agreement. No further reproduction authorized.
248 MATIJEVIC ET AL. ON QUENCHING PERFORMANCE OF VEGETABLE OILS
Related Documents