SUZANNE LINDAMOOD, SHERMAN D. HANNA, AND LAN BI Using the Survey of Consumer Finances: Some Methodological Considerations and Issues We identify and present original analyses of four methodological issues related to using Survey of Consumer Finances data sets and illustrate these issues with recent articles published in this journal. The issues are recognizing that the respondent is not necessarily the household head, reporting race and ethnicity in conformity with Survey of Consumer Finances and federal standards, using the repeated-imputation infer- ence method to combine the five implicates in each survey year’s data set, and discussing the use of weighted or unweighted data in multivar- iate analysis. We found a considerable variation in how authors dealt with these issues, which could hinder replication or comparison of research results. Authors and reviewers should consider methodologi- cal issues related to the Survey of Consumer Finances more carefully. Editor’s note: After this refereed paper was accepted for publication, Jeanne M. Hogarth was asked to solicit comments and assume the role of moderator for the discussion essays. As editor as these commentaries, her observations immediately follow the article plus those of Darryl E. Getter and Sandra J. Huston. The Survey of Consumer Finances (SCF), sponsored by the Federal Reserve Board, is a rich and convenient source of information about house- hold finances. It has been conducted every three years since 1983, employ- ing a complex sampling system that provides a sizable number of households and allows estimations of the U.S. population as a whole (Aizcorbe, Kennickell, and Moore 2003). The public data set is free, and the substantial online assistance includes working papers and well-documented codebooks. A user-developed Web site with tips for researchers is also available (Hanna 2006). However, despite the apparent ease of use, care is needed in using and reporting the data because of the sampling proce- dures, the method of imputing missing values, and the nature of some demographic variables. As with any research, those who use SCF data Suzanne Lindamood is a research attorney with the Ohio Legislative Service Commission, Columbus, OH ([email protected]). Sherman D. Hanna is a professor in the Consumer Sciences Depart- ment, The Ohio State University, Columbus, OH ([email protected]). Lan Bi is a risk management consultant in Wells Fargo Financial, Des Moines, IA ([email protected]). This publication was made possible by a generous grant from the FINRA Investor Education Foun- dation, formerly known as the NASD Investor Education Foundation. The authors thank Jessie Fan for helpful suggestions. The Journal of Consumer Affairs, Vol. 41, No. 2, 2007 ISSN 0022-0078 Copyright 2007 by The American Council on Consumer Interests WINTER 2007 VOLUME 41, NUMBER 2 195

Welcome message from author
This document is posted to help you gain knowledge. Please leave a comment to let me know what you think about it! Share it to your friends and learn new things together.
Transcript

SUZANNE LINDAMOOD, SHERMAN D. HANNA, AND LAN BI
Using the Survey of Consumer Finances: SomeMethodological Considerations and Issues
We identify and present original analyses of four methodological issuesrelated to using Survey of Consumer Finances data sets and illustratethese issues with recent articles published in this journal. The issues arerecognizing that the respondent is not necessarily the household head,reporting race and ethnicity in conformity with Survey of ConsumerFinances and federal standards, using the repeated-imputation infer-ence method to combine the five implicates in each survey year’s dataset, and discussing the use of weighted or unweighted data in multivar-iate analysis. We found a considerable variation in how authors dealtwith these issues, which could hinder replication or comparison ofresearch results. Authors and reviewers should consider methodologi-cal issues related to the Survey of Consumer Finances more carefully.Editor’s note: After this refereed paper was accepted for publication,Jeanne M. Hogarth was asked to solicit comments and assume the roleof moderator for the discussion essays. As editor as these commentaries,her observations immediately follow the article plus those of DarrylE. Getter and Sandra J. Huston.
The Survey of Consumer Finances (SCF), sponsored by the Federal
Reserve Board, is a rich and convenient source of information about house-
hold finances. It has been conducted every three years since 1983, employ-
ing a complex sampling system that provides a sizable number of
households and allows estimations of the U.S. population as a whole
(Aizcorbe, Kennickell, and Moore 2003). The public data set is free, and the
substantial online assistance includes working papers and well-documented
codebooks. A user-developed Web site with tips for researchers is also
available (Hanna 2006). However, despite the apparent ease of use, care
is needed in using and reporting the data because of the sampling proce-
dures, the method of imputing missing values, and the nature of some
demographic variables. As with any research, those who use SCF data
Suzanne Lindamood is a research attorney with the Ohio Legislative Service Commission, Columbus,
OH ([email protected]). Sherman D. Hanna is a professor in the Consumer Sciences Depart-
ment, The Ohio State University, Columbus, OH ([email protected]). Lan Bi is a risk management
consultant in Wells Fargo Financial, Des Moines, IA ([email protected]).
This publication was made possible by a generous grant from the FINRA Investor Education Foun-
dation, formerly known as the NASD Investor Education Foundation. The authors thank Jessie Fan for
helpful suggestions.
The Journal of Consumer Affairs, Vol. 41, No. 2, 2007
ISSN 0022-0078
Copyright 2007 by The American Council on Consumer Interests
WINTER 2007 VOLUME 41, NUMBER 2 195
need to make appropriate decisions, justify procedures, precisely define
variables, and provide sufficient detail so readers can understand the find-
ings and other researchers can replicate the study.
It might seem that precise reporting is not necessary when a researcher
works with a widely used national data set that provides detailed online doc-
umentation. A reader might assume that SCF researchers employ standard
variables and commonly agreed uponmethods for analysis, making it possible
to compare research across studies. However, our initial overview of 28
articles that used the SCF, published in the Journal of Consumer Affairs,Financial Counseling and Planning, Financial Services Review, and the Jour-nal of Family and Economic Issues, revealed a number of problems and incon-
sistencies in the use of variables and description of methods. Six of the articles
we reviewed appeared in the Journal of Consumer Affairs during the years
2001–2004. In this article, we focus on those articles, analyzing their treatment
of the following four issues that we identified as particularly problematic.
d Recognizing that the respondent is not necessarily the household
head.
d Reporting race and ethnicity in conformity with SCF categories and
federal standards.
d Using the data of all five implicates and the repeated-imputation infer-
ence (RII) method to combine the implicates.
d Discussing the use of weighted or unweighted data in multivariate
analysis.
Table 1 lists the articles we used in our analysis and summarizes how
each dealt with the four issues. We do not propose that any lack of pre-
cision related to these issues affected the authors’ conclusions. The gen-
eral problems we discuss, using these articles as examples, are not limited
to these articles nor to this journal but occur in many articles using the
SCF, including some we have authored. We analyzed these issues because
precision and ability to replicate and compare results are fundamental to
research, and paying attention to these issues can improve future research
using the SCF.
ANALYSIS
The Household Head vs. the Survey Respondent
In the SCF, the respondent and the household head are not neces-
sarily the same person, and either partner in a couple household could
196 THE JOURNAL OF CONSUMER AFFAIRS

TABLE1
ArticlesUsing
theSC
Fin
theJournal
ofConsumer
Affairs,20
01–2
004
Article
Respondentvs.Head
Race/Ethnicity
ImplicatesandRII
WeightingMultivariate
Analysis
Hogarth,Anguelov,
andLee
(2004)
Notdiscussed;education,race,
andageare‘‘ofhousehold’’
Threecategories:whiteandother
(combined),black,andHispanic
Discussed
implicatesand
whydid
notuse
RII
Notstated
Getter(2003)
Notdiscussed;referred
toincome,
educationofrespondent,and
race
ofhead
Twocategories:black
orHispanic
(combined)andnotnam
ed
(appears
toincludewhite
andother)
Nodiscussion
Did
notweightmultivariate
analysis
Lyons(2003)
Notdiscussed
Twocategories:black,andwhite
(appears
toincludewhite,
Hispanic,andother)
Nodiscussion
Weightedmultivariate
analysis(implied
by
footnote
totable
1)
Lee
andKwon(2002)
Did
notdiscuss
distinction;referred
toageofrespondent;ethnicity
andeducationnotspecified
Fourcategories:black,white,
Hispanic,andother
non-w
hite
minorities
UsedRIIformeanstests.
Reported
only
one
implicate
formultivariate
Notstated
ChienandDeV
aney
(2001)
Did
notdiscuss
distinction;age
andrace
ofhead;education
notspecified
Twocategories:Caucasian
and
non-Caucasian
(compositionof
categories
notdiscussed)
Usedonly
oneim
plicate
Notstated
Xiaoet
al.(2001)
Discussed
distinction;listed
dem
ographic
dataforhead
Twocategories:Caucasian
and
non-Caucasian
(compositionof
thesecategories
notdiscussed)
Nodiscussion
Weightedmultivariate
analyses
WINTER 2007 VOLUME 41, NUMBER 2 197
be the respondent. Because of the detailed nature of the financial data
the SCF gathers, interviewers are trained to establish who is the most
financially knowledgeable person in the household and to interview that
person (Lindamood and Hanna 2005, 2006). Therefore, the respondent
is the most financially knowledgeable person. The household head,
however, is an arbitrary designation. In the SCF, the male always
is designated as the head for mixed-sex couple households and the
older partner always is designated as the head for same-sex couple
households.
Correctly identifying whose demographic data is being used—the
respondent’s or the head’s—is particularly important when analyzing
variables such as race and the various attitude variables because
the SCF collects race and attitude variables only for the respondent. It
would be inappropriate, for example, to study the relationship of age
and attitude using the head’s age because attitudes are those of the
respondent. The mistake might not be limited to a small number of house-
holds. In our weighted analysis of the 2001 SCF, about 60% of the house-
holds included couples, and about 87% of those were husband-wife
couples. The wife was the respondent in 46% of the husband-wife couple
households.
None of the six articles that appeared in the Journal of ConsumerAffairs discussed the distinction between the respondent and the head
(Table 1). Four articles referred to the race of the head or the race of
the household, both of which are inaccurate under the SCF because
the race of the head is known only if the head is the respondent. If
researchers assume that a spouse/partner is of the same race as the
respondent, that assumption should be specified and only then should
the race of the respondent be used as a proxy for other members of
the household.
The article by Hogarth, Anguelov, and Lee (2004) generally was the
most careful in describing methods, but the tables and the discussion of
the variables described ‘‘household age’’ and ‘‘education of the house-
hold’’ without identifying whether the ‘‘household’’ data represented
the respondent, the head, or a composite the researchers created. The arti-
cle also referred to the race of the household, which the SCF does not
measure.
Getter (2003) did not discuss any methodological details but listed the
variables of the model he tested. The listing represented education and
employment as that of the respondent. However, the discussion and find-
ings were presented in terms of the household head. He did not discuss
198 THE JOURNAL OF CONSUMER AFFAIRS
whose race was measured, but his article replicated a study by Canner,
Gabriel, and Woolley (1991), which incorrectly listed race as that of
the head. Getter stated, ‘‘Demographic variables such as age, race, and
whether or not the respondent has a college degree are also included
in the analysis,’’ making it possible that the demographic variables
reflected the respondent.
Lyons (2003) did not discuss how demographic variables were mea-
sured or the difference between the respondent and the head. In her pre-
sentation of multivariate models, she referred to income of the head but
did not mention whose age, gender, and ethnicity was included. The dis-
cussion of the results referred to the age of the head, and two of the tables
listed age, education, and income variables as related to the head, but
other tables did not specify whether the variables were of the head or
respondent.
Lee and Kwon (2002) reported using the age of the respondent in their
table describing independent variables but did not identify whose education
or ethnicity was used. Ethnicity, by definition, had to be of the respondent.
However, given the mean value reported for age, it is likely that they used
the age of the head. Using the head’s demographic data to study the atti-
tudes expressed by the respondent is inappropriate without justification. If
both partners in couple households are of similar age, this error may not be
important. However, our analysis of the 1998 SCF (which Lee and Kwon
used) shows that 10% of married couples had an age difference of 11 years
or more, a difference that could have a biasing effect on analyses of age and
attitude.
Chien and DeVaney (2001) correctly stated that attitudes were provided
by the respondent but did not discuss the distinction between the head and
the respondent. They listed age as being of the head but did not identify
whose education was used in the analysis. They reported ethnicity as that of
the head, which is not possible because race/ethnicity data are available
only for the respondent.
Xiao et al. (2001) included only a couple of households in their analysis
of family business owners, but characterized the sample as including only
family heads. They reported that unlike previous research on business
owners, they did not use gender as an independent variable because
99% of their sample was male, correctly noting that the SCF coded
the male as the head in mixed-sex couple households and the older person
as the head in same-sex couple households. However, they did not report
that the head was not necessarily the respondent or the business owner
and did not report the proportion of respondents who were female. Their
WINTER 2007 VOLUME 41, NUMBER 2 199
discussion referred to the characteristics of the ‘‘family business owner’’;
yet, the analysis apparently was based on the age, race, and education of
the head. Using the head’s characteristics is problematic because those
characteristics were used to analyze the SCF risk tolerance variable, a vari-
able available only for the respondent. Although that variable is supposed
to reflect a couple’s risk tolerance, it is likely that it reflects the risk
tolerance of the respondent in married couple households (Hanna and
Lindamood 2005).
Race/Ethnicity of the Respondent
Race is a controversial topic (American Anthropological Association
1997), and even the title chosen to describe a group has importance.
The 2001 and 1998 SCFs did not directly use the term race or ethnicity
on the card that listed the respondent’s choices of race/ethnicity categories.
Instead, the researcher asked the respondent ‘‘which of these categories do
you feel best describe you?’’ when showing a card that directed: ‘‘Please list
your strongest identification first.’’ Even though seven identity categories
were offered to respondents, the SCF reports only four in the public data
set: white, black/African American, Hispanic/Latino, and Other. The
‘‘Other’’ category in the public dataset includes Asian, American Indian,
Alaska Native, and Native Hawaiian/Other Pacific Islander, as well as the
response ‘‘Other.’’ Earlier surveys (1989–1995) provided respondents with
a similar list of categories but asked them to identify their ‘‘race.’’ The 1983
race variable was determined only by interviewer observation. There were
some minor changes in terminology from 1983 to 2001 (Yao, Gutter, and
Hanna 2005).
The 1998–2001 surveys allowed respondents to indicate more than one
identity choice, but the public data sets include only two variables for race:
(1) the category of the respondent’s strongest identification and (2) whether
the respondent indicated additional categories of race/ethnic identification.
The categories of those additional choices are not reported in the public data
sets. Therefore, even though Federal Reserve Board publications list ‘‘non-
Hispanic white,’’ researchers using the public data sets before 2004 should not
use that description because they do not have the information to determine
whether all persons responding ‘‘white’’ were also non-Hispanic. The SCF
changed its method of asking race/ethnic questions for the 2004 survey, ask-
ing a separate Hispanic question in addition to the categories offered in the
1989 through 2001 surveys. Therefore, researchers using the 2004 SCF could
use the term non-Hispanic white by combining the results of the two variables,
200 THE JOURNAL OF CONSUMER AFFAIRS

although procedures should be carefully described because of the alternate
ways of presenting the race/ethnic data.1
Guidance in using race/ethnic variables and normative standards for
reporting race are available from several sources. The Office of Manage-
ment and Budget’s directive, The Statistical Policy Directive No. 15,Race and Ethnic Standards for Federal Statistics and AdministrativeReporting (commonly called OMB 15), provides useful guidelines andstandards that federal agencies and agencies receiving federal funds
(including universities) are to use in gathering and reporting data on race
and ethnicity (Office of Management and Budget 1997). Originally
adopted in 1977, the directive was updated in October 1997. Although
researchers who publish in this journal are not necessarily required
to follow the directive, the publication reflects decisions made after
hearings and comments from many individuals and organizations
and provides guidelines that reflect current thought on race and ethnic
classifications.
OMB 15 requires the use of specific categories when reporting race and
ethnicity data acquired with a single question format, such as the SCF race/
ethnic question for the 1989 through 2001 surveys. The SCF single ques-
tion format used during those years has categories identical to those
OMB 15 requires, except that the SCF also offered respondents the categoryOther. The SCF race/ethnicity information was collected and made avail-
able in a format that enables researchers to comply with the federal directive
just by using the SCF categories and names.
Some of the OMB 15 reporting conventions of which researchers shouldbe aware are the names that are appropriate for combined categories and the
names that are ‘‘prohibited.’’ The directive states that when categories of
race are combined, the terms ‘‘other races’’ and ‘‘all other races’’ are appro-
priate to describe the collapsed categories. The collapsed categories in the
SCF public data set are appropriately named Other. Certain names for
reporting data are not appropriate under OMB 15, however. Of note is
1. Researchers working with the 2004 SCF data set have a choice of using the variable based on the
single race/ethnic question or using that question in combination with the new separate question about
Hispanic status. The results will differ slightly depending upon the researcher’s choice. Our weighted
analysis of the 2004 SCF public data set shows that in the single question format that offered a choices
including ‘‘white’’ and ‘‘Hispanic,’’ 9.2% of the respondents chose Hispanic, but 11.2% of the respond-
ents chose Hispanic in the new separate question: Do you consider yourself to be Hispanic or Latino in
culture or origin? If that question is used with the traditional SCF race/ethnic question to create a cat-
egory ‘‘non-Hispanic white,’’ the results will differ slightly for the other categories. For instance, 73.6%
of respondents chose white in response to the traditional question, but excluding those who also
answered Hispanic produces the result that 71.8% of the respondents are non-Hispanic white.
WINTER 2007 VOLUME 41, NUMBER 2 201
the term ‘‘non-white.’’ The policy directive states, ‘‘The term �nonwhite’ isnot acceptable for use in the presentation of Federal Government data. It
shall not be used in any publication or in the text of any report’’ (Office of
Management and Budget 1997).
Some of the articles we reviewed renamed the race/ethnic categories
without clarifying or justifying the new names and used inappropriate
names. The most extreme deviation was use of the term ‘‘Caucasian.’’
Two articles published in 2001 (Table 1) used the term. The SCF does
not gather data using the term,2 and for that reason alone, its use is
not appropriate for analyses based on SCF data sets after 1986. The
American Heritage� Dictionary of the English Language (2000) under
its definition of Caucasian notes, ‘‘No longer in scientific use.’’ A report
by the American Anthropological Association (1997), commenting on the
proposed 1997 revision of OMB 15, discussed the controversies relating
to the definition of race and ethnicity and mentioned the racist origin of
the term Caucasian.
The different treatment of race/ethnic categories by authors underscores
the need for justification of groupings and names. In the six articles we
reviewed, the different race/ethnic category combinations resulted in
groupings with similar names but included different groups, so that accu-
rate comparisons cannot be made across studies (Table 1). Because of the
similar category names, readers could incorrectly assume comparability
and come to inaccurate conclusions about results.
Hogarth, Anguelov, and Lee (2004) reported only race/ethnic categories:
‘‘black,’’ ‘‘Hispanic,’’ and ‘‘white and other.’’ They formed the latter cat-
egory by combining the SCFwhite and Other categories, with the result that
Asian, American Indian, Alaska Native, Native Hawaiian, other Pacific
Islanders, and other groups were included with white. They did not offer
justification for grouping white and Other, but they did clearly report their
procedures.
Lee and Kwon (2002) reported race/ethnic category on the basis of the
four categories the SCF provided in the public data set. However, they
renamed the other category as ‘‘other non-white minorities.’’ The research-
ers introduced an element of confusion when they also used non-white to
describe a different grouping of respondents, stating ‘‘a greater percentage
of non-whites including black and Hispanic.’’ The renamed category, other
non-white minorities, is inconsistent with the OMB 15 directive to use the
2. The SCF instructs coders that if a respondent says ‘‘Caucasian,’’ the response should be coded as
‘‘white.’’ However, the respondent is not offered Caucasian as a choice.
202 THE JOURNAL OF CONSUMER AFFAIRS
term other races or all other races when grouping categories and the pro-
hibition of using the term non-white.
Getter (2003) did not describe how he measured race/ethnic variables. In
each of the two results tables, only one race/ethnic category was listed,
‘‘black or Hispanic,’’ indicating that these were combined and presumably
were compared with all others. No justification was given for combining
the two groups.
Lyons (2003) did not describe or justify how the race/ethnic variables in
her article were created. She presented a list of variables in one table of
results, which included only the category black, making it appear that black
was compared with all other categories combined. Another table, however,
compared ‘‘blacks’’ with whites, with no clarification of whether any other
categories were included with either blacks or whites. Lyons stated that the
table showed a trend for ‘‘all households,’’ so that a reader might assume
that all respondents were categorized as either black or white, making it
appear that white included ‘‘Hispanic’’ and Other.
Comparability and interpretation of research would be improved if
researchers reporting race/ethnicity data would use the categories that
are reported in the SCF data sets. A researcher who renames the categories
should justify doing so, and a researcher who collapses categories should
clearly report the components of the collapsed category along with a ratio-
nale for the action.
Multiple Implicates
Survey research inevitably results in missing data because of refusal to
answer or mistakes on the part of field staff. Researchers have a choice
between deleting cases with missing information and making a reasonable
estimate of that data by some method of imputation. Different methods of
imputingmissing data include usingmultiple regression to estimate the data
based on known characteristics of the respondent, using the mean of the
values obtained for those who responded, or randomly choosing a valid
response category to replace the missing data. The researcher’s goal should
be to make as close an estimate of the true value as possible and to keep bias
to a minimum.
Starting with the 1989 survey, the SCF has imputed missing values using
a ‘‘multiple imputation’’ method with a goal of providing data that are the
best possible estimate of the missing data. Instead of providing just one
estimate for a piece of missing data, multiple responses are provided for
each case to represent the likely range of responses for the particular
WINTER 2007 VOLUME 41, NUMBER 2 203

respondent. The multiple imputation method the SCF employs results in
each respondent having five different sets of data, which results in a total
data set with five times the actual number of households. The SCF refers to
each of the five data sets as an ‘‘implicate.’’ While it is possible to do an
analysis with just one implicate, the benefits of the multiple imputations
would be lost and the results may be biased. Researchers ideally should
use all five implicates with the ‘‘repeated-imputation inference’’ (RII)
method (Rubin 1987). The use of RII results in estimated variances that
more closely represent the true variances than would be obtained by using
just one implicate. Montalto and Sung (1996) demonstrated that signifi-
cance tests might have different results based on RII versus running anal-
yses on only one implicate.
The implicate system also serves to protect the privacy of the survey
households. As the codebook states, ‘‘Data were also blurred by other
means intentionally not specified’’ (Kennickell 2003). Our analysis of
the 2001 SCF, for example, shows that the number of white respondents
differs among the implicates, ranging from 3,579 in Implicates 1 and 5 to
3,583 in Implicate 4. Only 3,576 respondents are coded white in all five
implicates. We have no way of knowing whether race was missing for
these respondents or intentionally blurred to protect privacy. However,
the different values and different group sizes among the implicates sug-
gest that it is not appropriate to use only one implicate when analyzing
SCF data.
The RII technique may not be practical for some types of multivariate
analyses, but researchers always should note whether it is used and justify
the decision. None of the articles in this journal report using the RII method
in multivariate analyses (Table 1). Although, Hogarth, Anguelov and
Lee (2004) did not use RII, they justified not doing so and explained their
procedure:
. Stata does not provide the necessary output covariance matrices to use this tech-
nique with a multinomial logit analysis. Therefore, we must content ourselves with
analyzing the 5 implicate data sets separately. However, to make up for the inability
to use an RII technique, we apply a criterion that the parameter estimates must be
significant at the 0.05 level in at least 4 of the 5 implicate data sets in order for us to
count a variable as significant.
Lee and Kwon (2002) reported using RII for their means comparisons. In
their multivariate analysis, they only reported the results obtained for Impli-
cate 1 but stated that the results for the other four implicates were consistent
and available from the first author.
204 THE JOURNAL OF CONSUMER AFFAIRS
Getter (2003), Lyons (2003), and Xiao et al. (2001) did not discuss RII or
the implicates, so a reader cannot discern which implicates they used, what
procedure they used, or why they used that procedure. Chien and DeVaney
(2001) stated that they used only Implicate 1 without justifying why or
discussing possible problems of not using RII.
Controlled Comparisons between RII and Averaging Implicates
Is using RII important, and if it makes a difference, is that difference
great enough to justify the extra effort? To determine the possible impact
of not using RII, we performed original analyses to compare using a sim-
ple averaging technique with using RII. In our simple averaging tech-
nique, we combined all five implicates, then applied a constant weight
equal to 0.2 (the equivalent of dividing by five). To provide a controlled
comparison, we replicated the models Bi and Montalto (2004) used in
their logit analyses, in which they used the RII procedure. We took care
to assure that the only difference in our logit analyses and the Bi andMon-
talto logit analyses was whether RII or the averaging method was used to
combine the five implicates of the data set. The two methods produced
estimates of logistic regression coefficients that were equal, which we
expected based on the definition of the RII method for multivariate anal-
ysis. For the three logits we tested, with a total of 99 variables, three coef-
ficients not significant (p , .05) when using RII were statistically
significant when using the averaging method (Table 2).3 In general,
RII produced higher p values and therefore less significant results.
The differences, with some variables classified as not significant (p ,
.05) using RII but significant using the averaging method, occurred in
Logit I (Monetary) and Logit II (Comprehensive), in which the dependent
variables were based on financial data that presumably had many imputed
values. For instance, the variable ‘‘No Risk’’ in Logit I had a significance
level of .057 with RII, but with the averaging method, it had a significance
level of .008. In Logit III (Subjective), there were no differences in any
conventional significance levels (p, .05) between RII and the averaging
method for the 33 coefficients.
3. In order to have Tables 2 and 3 be more compact, we omitted the listings from Bi and Montalto
(2004) for the reference categories for sets of dummy variables. For instance, they listed ‘‘white, non-
Hispanic’’ as the reference category for the race/ethnic variables in the logits. The category for ‘‘black’’
was listed as ‘‘black, non-Hispanic.’’ Both ‘‘non-Hispanic’’ descriptions are inappropriate and should
have been white and black.
WINTER 2007 VOLUME 41, NUMBER 2 205
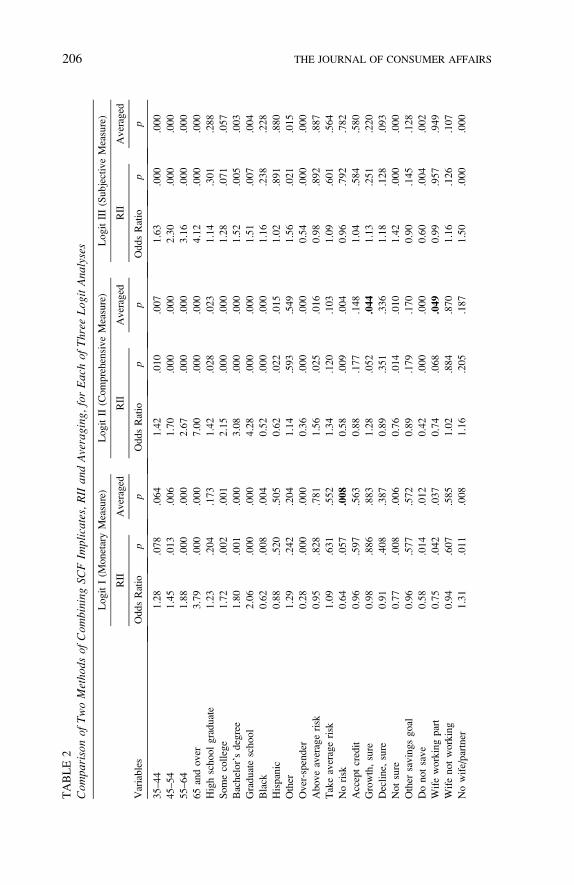
TABLE2
Com
parisonof
TwoMetho
dsof
Com
bining
SCFIm
plicates,RIIan
dAveraging
,forEachof
Three
Log
itAna
lyses
Variables
LogitI(M
onetaryMeasure)
LogitII(ComprehensiveMeasure)
LogitIII(SubjectiveMeasure)
RII
Averaged
RII
Averaged
RII
Averaged
OddsRatio
pp
OddsRatio
pp
OddsRatio
pp
35–44
1.28
.078
.064
1.42
.010
.007
1.63
.000
.000
45–54
1.45
.013
.006
1.70
.000
.000
2.30
.000
.000
55–64
1.88
.000
.000
2.67
.000
.000
3.16
.000
.000
65andover
3.79
.000
.000
7.00
.000
.000
4.12
.000
.000
Highschoolgraduate
1.23
.204
.173
1.42
.028
.023
1.14
.301
.288
Somecollege
1.72
.002
.001
2.15
.000
.000
1.28
.071
.057
Bachelor’sdegree
1.80
.001
.000
3.08
.000
.000
1.52
.005
.003
Graduateschool
2.06
.000
.000
4.28
.000
.000
1.51
.007
.004
Black
0.62
.008
.004
0.52
.000
.000
1.16
.238
.228
Hispanic
0.88
.520
.505
0.62
.022
.015
1.02
.891
.880
Other
1.29
.242
.204
1.14
.593
.549
1.56
.021
.015
Over-spender
0.28
.000
.000
0.36
.000
.000
0.54
.000
.000
Aboveaveragerisk
0.95
.828
.781
1.56
.025
.016
0.98
.892
.887
Takeaveragerisk
1.09
.631
.552
1.34
.120
.103
1.09
.601
.564
Norisk
0.64
.057
.008
0.58
.009
.004
0.96
.792
.782
Acceptcredit
0.96
.597
.563
0.88
.177
.148
1.04
.584
.580
Growth,sure
0.98
.886
.883
1.28
.052
.044
1.13
.251
.220
Decline,
sure
0.91
.408
.387
0.89
.351
.336
1.18
.128
.093
Notsure
0.77
.008
.006
0.76
.014
.010
1.42
.000
.000
Other
savingsgoal
0.96
.577
.572
0.89
.179
.170
0.90
.145
.128
Donotsave
0.58
.014
.012
0.42
.000
.000
0.60
.004
.002
Wifeworkingpart
0.75
.042
.037
0.74
.068
.049
0.99
.957
.949
Wifenotworking
0.94
.607
.585
1.02
.884
.870
1.16
.126
.107
Nowife/partner
1.31
.011
.008
1.16
.205
.187
1.50
.000
.000
206 THE JOURNAL OF CONSUMER AFFAIRS

Can
borrow
from
retirementaccount
0.98
.876
.867
1.14
.242
.201
0.72
.001
.000
Homeequity,$18,000
1.17
.301
.262
1.35
.040
.027
0.99
.921
.919
$18,001–$45,000
1.70
.000
.000
1.70
.000
.000
1.25
.103
.061
$45,001–$85,000
2.58
.000
.000
3.21
.000
.000
1.55
.001
.000
.$85,000
2.33
.000
.000
4.00
.000
.000
1.66
.000
.000
Creditcard
limit,$3,000
1.26
.163
.126
1.49
.006
.004
0.97
.837
.822
$3,001–$8,000
2.06
.000
.000
2.25
.000
.000
1.36
.013
.009
$8,001–$17,000
2.88
.000
.000
3.39
.000
.000
1.44
.005
.002
.$17,000
2.81
.000
.000
4.26
.000
.000
1.50
.001
.001
Note:Eachofthreelogisticmodelswas
analyzedusingboth
RIIandaveragingmethodofcombiningtheim
plicates.Themodelsusedin
thecomparisonswerethe
likelihoodofmeetingem
ergency
fundguidelines
(BiandMontalto2004)based
ondependentvariables:(I)Monetary,(II)Comprehensive,and(III)SubjectiveMeasures
ofAdequacy.W
eusedtheversionofthe1998SCFdatasetthatBiandMontaltoused,asresultsareslightlydifferentinthemostrecentversionofthe1998SCFdataset
posted
in2006.Allresultsarebased
onunweighteddata.TheRIIresultsarefromBiandMontalto(2004).Theaveragingmethodresultswerecalculatedbytheauthors
usingthesamemodelandvariablesas
BiandMontaltobutcombiningtheim
plicatesbyusingweight¼0.2withpooleddatafromthefiveim
plicates.Apvalueinbold
indicates
that
theaveragingmethodresultwas
significantat
the.05level,buttheRIItechniquewas
notsignificantat
the.05level.
WINTER 2007 VOLUME 41, NUMBER 2 207
Recommendations for Use of RII
Based on our analysis, it appears that for exploratory analyses for
conference presentations or for statistical methods where the RII coding
has not been defined, it would be reasonable to use either the averaging
method we tested or the four out of five implicate threshold approach
Hogarth, Anguelov and Lee (2004) discussed. Otherwise, researchers
should use RII for both descriptive and multivariate analyses, as suggested
in the SCF codebook (Kennickell 2003).
Weighting of Analyses
The SCF uses a dual sampling technique that includes a probability sam-
ple collected in specified geographic regions and a sample from the tax list
provided by the Internal Revenue Service for those same regions (Kennickell
2003). The resulting sample overrepresents higher wealth groups and there-
fore is not representative of the U.S. population as a whole. The SCF pro-
vides weights that researchers may use to obtain estimates of the U.S.
population. Referring to the need to weight data, the 2001 SCF codebook
(Kennickell 2003) stated:
Because the SCF sample is not an equal-probability design, weights play a critical
role in interpreting the survey data. The main data set contains the final nonresponse-
adjusted sampling weights. These weights are intended to compensate for unequal
probabilities of selection in the original design and for unit nonresponse (failure to
obtain an interview).
Therefore, it is necessary to weight descriptive analyses to make the results
representative of U.S. households. As an example of the skewed results
obtained from unweighted data, our calculations show that the mean net
worth of households in the 2001 SCF, based on the population weight,
was $395,837, but the unweighted mean net worth was $6,882,747. Even
the median net worth was far higher without weighting, $189,580, com-
pared with $86,100 when calculated with weighting. The issue of weight-
ing in multivariate analyses, such as regression analysis, is controversial
(Kennickell 2003). Weighting regression analyses when the weights are
endogenous is suspect for hypothesis testing (Deaton 1997, 66–73; and
noted by Yao, Hanna, and Lindamood 2004).
None of the articles we reviewed in this or other journals discussed
the issue of weighting multivariate analyses. Xiao et al. (2001) noted that
the population weight was used in all analyses so that the results could be
208 THE JOURNAL OF CONSUMER AFFAIRS
generalized to all families owning a business in the United States. Lyons
(2003) stated in her footnote to Table 1 that in ‘‘. all remaining tables,
observations are weighted .,’’ which implies that her multivariate anal-
yses in tables 3–5 were weighted. Hogarth, Anguelov, and Lee (2004)
had an excellent discussion of the need for weighting but did not explicitly
state whether they weighted their multivariate analysis. Getter (2003) noted
that the Canner, Gabriel, andWoolley (1991) analysis had used weights but
stated that the weights created for the different survey years he used could
not be used with combined data, making it appear that he did not weight the
data. Lee and Kwon discussed weighting of their means comparisons but
did not discuss whether they weighted their multivariate analysis.
Controlled Comparisons between Weighted and Unweighted
Multivariate Analyses
To compare the effects of using weighted versus unweighted data in
multivariate analyses, we performed a controlled comparison by using
weighted data to analyze the same three logit regression models that Bi
and Montalto (2004) had analyzed with unweighted data. For our weighted
analysis, we applied the SCF population weight scaled so that the total
apparent sample size for each implicate equaled the actual sample size.
Both our weighted analyses and the Bi and Montalto unweighted analyses
used the RII method of combining the five implicates. The results of using
weighted compared with unweighted data generally were similar (Table 3),
with most of the magnitudes of effects (as shown by the odds ratios) being
similar between unweighted and weighted analyses. However, out of 99
coefficients in the three logits, nine were significant at the .05 level in
the weighted analyses but not significant in the unweighted analyses, and
one was significant at the .05 level in the unweighted analysis but not in
the weighted analysis. Given that the preferred approach is to use unweighted
data, it is notable that in Logit I (Monetary), the variable ‘‘Wife Working
Part-Time’’ is significant at the .042 level in the unweighted analysis, while
in the weighted analysis, it is significant at the .083 level.
Recommendations for Weighting Multivariate Analyses
In determining whether weighted or unweighted data should be used in
multivariate analyses, we should not presume that the unweighted estimates
are valid and the weighted estimates are invalid. In particular, if the multi-
variate analysis does not adequately control for variables that are skewed due
to the sampling rate variations, the effects of some variables of interest might
WINTER 2007 VOLUME 41, NUMBER 2 209
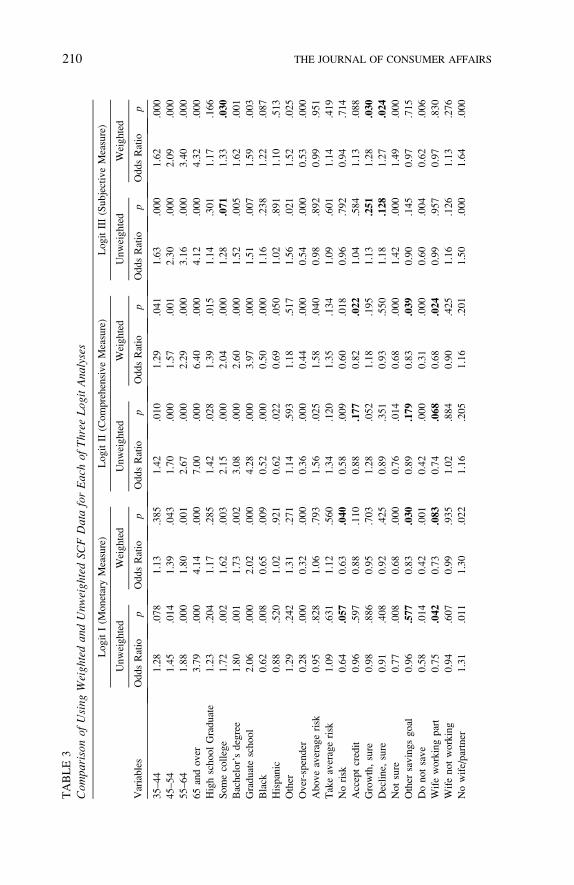
TABLE3
Com
parisonof
Using
Weigh
tedan
dUnw
eigh
tedSC
FDataforEachof
Three
Log
itAna
lyses
Variables
LogitI(M
onetaryMeasure)
LogitII(ComprehensiveMeasure)
LogitIII(SubjectiveMeasure)
Unweighted
Weighted
Unweighted
Weighted
Unweighted
Weighted
OddsRatio
pOddsRatio
pOddsRatio
pOddsRatio
pOddsRatio
pOddsRatio
p
35–44
1.28
.078
1.13
.385
1.42
.010
1.29
.041
1.63
.000
1.62
.000
45–54
1.45
.014
1.39
.043
1.70
.000
1.57
.001
2.30
.000
2.09
.000
55–64
1.88
.000
1.80
.001
2.67
.000
2.29
.000
3.16
.000
3.40
.000
65andover
3.79
.000
4.14
.000
7.00
.000
6.40
.000
4.12
.000
4.32
.000
HighschoolGraduate
1.23
.204
1.17
.285
1.42
.028
1.39
.015
1.14
.301
1.17
.166
Somecollege
1.72
.002
1.62
.003
2.15
.000
2.04
.000
1.28
.071
1.33
.030
Bachelor’sdegree
1.80
.001
1.73
.002
3.08
.000
2.60
.000
1.52
.005
1.62
.001
Graduateschool
2.06
.000
2.02
.000
4.28
.000
3.97
.000
1.51
.007
1.59
.003
Black
0.62
.008
0.65
.009
0.52
.000
0.50
.000
1.16
.238
1.22
.087
Hispanic
0.88
.520
1.02
.921
0.62
.022
0.69
.050
1.02
.891
1.10
.513
Other
1.29
.242
1.31
.271
1.14
.593
1.18
.517
1.56
.021
1.52
.025
Over-spender
0.28
.000
0.32
.000
0.36
.000
0.44
.000
0.54
.000
0.53
.000
Aboveaveragerisk
0.95
.828
1.06
.793
1.56
.025
1.58
.040
0.98
.892
0.99
.951
Takeaveragerisk
1.09
.631
1.12
.560
1.34
.120
1.35
.134
1.09
.601
1.14
.419
Norisk
0.64
.057
0.63
.040
0.58
.009
0.60
.018
0.96
.792
0.94
.714
Acceptcredit
0.96
.597
0.88
.110
0.88
.177
0.82
.022
1.04
.584
1.13
.088
Growth,sure
0.98
.886
0.95
.703
1.28
.052
1.18
.195
1.13
.251
1.28
.030
Decline,
sure
0.91
.408
0.92
.425
0.89
.351
0.93
.550
1.18
.128
1.27
.024
Notsure
0.77
.008
0.68
.000
0.76
.014
0.68
.000
1.42
.000
1.49
.000
Other
savingsgoal
0.96
.577
0.83
.030
0.89
.179
0.83
.039
0.90
.145
0.97
.715
Donotsave
0.58
.014
0.42
.001
0.42
.000
0.31
.000
0.60
.004
0.62
.006
Wifeworkingpart
0.75
.042
0.73
.083
0.74
.068
0.68
.024
0.99
.957
0.97
.830
Wifenotworking
0.94
.607
0.99
.935
1.02
.884
0.90
.425
1.16
.126
1.13
.276
Nowife/partner
1.31
.011
1.30
.022
1.16
.205
1.16
.201
1.50
.000
1.64
.000
210 THE JOURNAL OF CONSUMER AFFAIRS

Can
borrow
from
retirementaccount
0.98
.876
1.03
.769
1.14
.242
1.12
.293
0.72
.001
0.68
.000
Homeequity,$18,000
1.17
.301
1.24
.134
1.35
.040
1.41
.010
0.99
.921
1.04
.726
$18,001–$45,000
1.70
.000
1.85
.000
1.70
.000
1.91
.000
1.25
.103
1.33
.028
$45,001–$85,000
2.58
.000
3.02
.000
3.21
.000
3.78
.000
1.55
.001
1.73
.000
.$85,000
2.33
.000
2.66
.000
4.00
.000
3.75
.000
1.66
.000
2.08
.000
Creditcard
limit,
$3,000
1.26
.163
1.23
.209
1.49
.006
1.44
.008
0.97
.837
0.92
.522
$3,001–$8,000
2.06
.000
2.12
.000
2.25
.000
2.25
.000
1.36
.013
1.37
.005
$8,001–$17,000
2.88
.000
2.53
.000
3.39
.000
3.04
.000
1.44
.005
1.29
.039
.$17,000
2.81
.000
3.04
.000
4.26
.000
4.15
.000
1.50
.001
1.46
.001
Note:Eachofthreelogisticmodelswas
analyzedusingboth
weightedandunweighteddata.
Themodelsusedin
thecomparisonswerethelikelihoodofmeeting
emergency
fundguidelines
(BiandMontalto2004)based
ondependentvariables:
(I)Monetary,(II)Comprehensive,
and(III)SubjectiveMeasuresofAdequacy.
Weusedtheversionofthe1998SCFdatasetthat
BiandMontaltoused,as
resultsareslightlydifferentin
themostrecentversionofthe1998SCFdatasetposted
in2006.Allresultsarebased
ondatain
whichthefiveim
plicateswerecombined
usingRII.Theunweightedresultsarefrom
BiandMontalto(2004).Theweighted
resultswerecalculatedbytheauthorsusingtheweighttheSCFcodebookrecommendsforresultsthatreflecttheU.S.population.Apvaluein
bold
indicates
thatthe
weightedRIIresultwas
significantat
the.05level
buttheunweightedRIIresultwas
notsignificantat
the.05level,orvice
versa.
WINTER 2007 VOLUME 41, NUMBER 2 211

be distorted. Deaton (1997, 72) suggested that it would be wise to examine
both weighted and unweighted results frommultivariate analyses. If an effect
is significant in both analyses, presumably we can be more confident about
the result. As noted above, our comparisons found 10 coefficients out of 99
differed in significance levels between unweighted logits and weighted log-
its. Nine of those differences were for variables that met the .05 level of
significance in the weighted logits but not in the unweighted logits and
one was for the reverse, meeting the .05 level in the unweighted logit but
not in the weighted logit. Using the more conservative .01 significance level
would have no differences in terms of the significance threshold.
Presenting the p values, rather than indicators of significance thresholds,seems a reasonable approach in reporting results, as then the reader can
consider the relative importance of Type I or Type II errors in evaluating
the conclusions. The practice of presenting only notes of significance cat-
egories is questionable, as effects that are close to the conventional level of
.05 may switch due to weighting or lack of weighting as well as model
specification issues.
Unlike the comparison between the RII and averaging method of com-
bining implicates, the case for using weighted or unweighted data is not one
of the complete superiority of one approach over the other. In a majority of
the estimates, the significance level estimated is more conservative for
unweighted data than for weighted data, so presenting the unweighted results
in publications seems reasonable. It also seems reasonable, however, for
researchers to follow the advice of Deaton (1997) and try both unweighted
and weighted analyses. If the most important variable in an analysis is sig-
nificant using the unweighted analysis but not significant using the weighted
analysis, the researcher should reconsider the model specification.
CONCLUSIONS
Authors of research reports should accurately describe and justify
their methods with sufficient detail to enable readers to evaluate the
findings and researchers to replicate the research. Many of the articles
we reviewed using the SCF data sets, including recent articles in this
journal, did not provide a sufficient level of detail or justify important
choices made in analyses. Readers and reviewers of research using the
SCF data sets should be aware of these issues. The problems identified
are common in research using the SCF data sets in many other journals, and
there may well be similar problems with research using other data sets. Some
of the problems we identified are simply a matter of inadequate discussions
of methods. It is unlikely that the problems we identified would affect the
212 THE JOURNAL OF CONSUMER AFFAIRS
main conclusions in any of the articles. It would be desirable, however, for
authors to more carefully describe and justify their methods so that readers
have a better understanding of the results and future researchers can more
efficiently build upon published research.
REFERENCES
Aizcorbe, Ana M., Arthur B. Kennickell, and Kevin B. Moore. 2003. Recent Changes in U.S. Family
Finances: Results from the 1998 and 2001 Survey of Consumer Finances. Federal Reserve Bulletin,
89 (January): 1–32.
American Anthropological Association. 1997. Response to OMB Directive 15: Race and Ethnic Stand-
ards for Federal Statistics and Administrative Reporting. http://www.aaanet.org/gvt/ombdraft.htm.
American Heritage� Dictionary of the English Language. 2000. Boston: Houghton Mifflin. http://
www.bartleby.com/61/.
Bi, Lan and Catherine P. Montalto. 2004. Emergency Funds and Alternative Forms of Saving.
Financial Services Review, 13 (2): 93–109. http://www.rmi.gsu.edu/FSR/abstracts/Vol13/zux00204000093.
PDF.
Canner, Glenn B., Stuart A. Gabriel, and J. Michael Woolley. 1991. Race, Default Risk and Mortgage
Lending: A Study of the FHA and Conventional LoanMarkets. Southern Economic Journal, 58 (1):249–262.
Chien, Yi-Wen and Sharon A. DeVaney. 2001. The Effects of Credit Attitude and Socioeconomic Fac-
tors on Credit Card and Installment Debt. The Journal of Consumer Affairs, 35 (1): 162–179.
Deaton, Angus. 1997. The Analysis of Household Surveys: A Microeconometric Approach to Devel-
opment Policy. Baltimore, MD: Johns Hopkins University Press.
Getter, Darryl E. 2003. Contributing to the Delinquency of Borrowers. Journal of Consumer Affairs,
37 (1): 86–100.
Hanna, Sherman D. 2006. SCF Users Web Page. http://hec.osu.edu/scf/.
Hanna, Sherman D. and Suzanne Lindamood. 2005. Risk Tolerance of Married Couples. Proceedings
of the Academy of Financial Services, http://www.academyfinancial.org/.
Hogarth, JeanneM., Chris E. Anguelov, and Jinkook Lee. 2004.Why Don’t Households Have a Check-
ing Account? Journal of Consumer Affairs, 38 (1): 1–34.
Kennickell, Arthur B. 2003.Codebook for 2001 Survey of Consumer Finances. Washington, DC: Board
of Governors of the Federal Reserve System. http://www.federalreserve.gov/pubs/oss/oss2/2001/
codebk2001.txt.
Lee, Jinkook and Kyoung-Nan Kwon. 2002. Consumers’ Use of Credit Cards: Store Credit Card Usage
as an Alternative Payment and Financing Medium. The Journal of Consumer Affairs, 36 (2):
239–262.
Lindamood, Suzanne and Sherman D. Hanna. 2005. Determinants of the Wife Being the Financially
Knowledgeable Spouse. Proceedings of the Academy of Financial Services, http://www.academy-
financial.org/.
———. 2006. The More Financially Knowledgeable Person in Older Couple Households. ConsumerInterests Annual, 52: 327–342.
Lyons, Angela C. 2003. How Credit Access Has Changed Over Time for U.S. Households. Journal of
Consumer Affairs, 37 (2), 231–255.
Montalto, Catherine P. and Jaimie Sung. 1996. Multiple Imputation in the 1992 Survey of Consumer
Finances. Financial Counseling and Planning, 7: 133–146.
Office of Management and Budget. 1997. Revisions to the Standards for the Classification of Federal
Data on Race and Ethnicity. www.whitehouse.gov/omb/fedreg/print/ombdir15.html.
Rubin, Donald B. 1987. Multiple Imputation for Nonresponse in Surveys. New York: John
Wiley & Sons.
WINTER 2007 VOLUME 41, NUMBER 2 213
Xiao, Jing J., M. J. Alhabeeb, Gong-Soog Hong, and George W. Haynes. 2001. Attitude Toward
Risk and Risk-Taking Behavior of Business-Owning Families. Journal of Consumer Affairs,
35 (2): 307–325.
Yao, Rui, Michael S. Gutter, and Sherman D. Hanna. 2005. The Financial Risk Tolerance of Blacks,
Hispanics and Whites. Financial Counseling and Planning, 16 (1): 51–62.
Yao, Rui, Sherman D. Hanna, and Suzanne Lindamood. 2004. Changes in Financial Risk Tolerance,
1983-2001. Financial Services Review, 13 (4), 249–266.
Sins, Sinners, Data, and Details, Commentary by Jeanne M. Hogarth,Consumer Education & Research, Consumer & Community Affairs, Federal Reserve Board,
Washington, DC ([email protected])
Having failed at some of the issues Lindamood, Hanna, and Bi identify,
let me first confess—mea culpa. I have done those things that I ought not to
have done (such as use only one implicate of the Survey of Consumer
Finances, SCF) and I have not done those things that I ought to have done
(such as not explaining variables and methods clearly). I will try to not let
these things happen again.
Lindamood, Hanna, and Bi have written an article that invites us all to
reflect on the standards and reputation of the field of consumer research.
As I read the article, I believe they raised two main issues—how careful
we are in our data analysis (what might be in Huston’s commentary called
a sin of commission) and how careful we are in reporting our results (in
Huston’s terms, the sin of omission of relevant details). Their comments
apply not only specifically to the SCF but also more generally to all data
sets and research reporting—for anyone to skip reading this article just
because they do not use the SCF would be a serious sin of omission,
to say the least.
As researchers, our results are only as good as the data we use to build
our models. We want data that are clean and robust—data that are truly
representative of the groups we are studying—so that we can trust the
outcome of our analysis. We rely on data providers—be it government
data, academic research center data, or private survey data—to provide
us with accurate data from a representative sample and good docu-
mentation. In turn, it is our responsibility as researchers to respect the
data we use—to learn its limits and handle it appropriately, whether our
The analysis and conclusions set forth in this article represent the work of the author and do not
indicate concurrence of the Federal Reserve Board, the Federal Reserve Banks, or their staff. Mention
or display of a trademark, proprietary product, or firm in the presentation by the author does not con-
stitute an endorsement or criticism by the Federal Reserve System and does not imply approval to the
exclusion of other suitable products or firms.
214 THE JOURNAL OF CONSUMER AFFAIRS
data are from a small, local program evaluation or a large, nationally repre-
sentative survey.
There is no doubt that the SCF is a wonderfully detailed—and nuan-
ced—data set. Any first-time user needs to spend a lot of time reviewing the
codebook materials or, even better, collaborating with a more experienced
user. The breadth, depth, and detail of the data can be almost overwhelm-
ing. For researchers, this means that wemust carefully identify the variables
wewant to work with and note their definition—whowas the respondent and
on whose behalf did the respondent answer. For example, Klawitter and
Fletschner (2006) provide an interesting analysis of the individual and joint
saving and checking account holdings of married and unmarried different-
sex couples. This particular article represents a tour de force in the intricacies
of the SCF—we have respondents, spouses, and partners and we have indi-
vidually owned assets as well as jointly owned assets. Keeping all the asso-
ciations straight can be a challenge for both the researcher and the reader.
Issues of differentiating the respondent versus the primary economic unit
head and handling the five implicate data sets may be only the tip of the
SCF iceberg. Depending on the research question under study, researchers
need to know when to maintain distinctions of respondent, head, and other
family members and when aggregation is both acceptable and preferable.
Similarly, it is important to aggregate in a way that makes sense for the
research design but at the same time is true to the data. Lindamood, Hanna,
and Bi make a special plea for care in aggregating across racial categories.
The same could be said for a number of other variables in the SCF as well as
other large data sets, such as the Consumer Expenditure Survey, the Survey
of Income and Program Participation, and the Health and Retirement Study,
among others.
Selecting the right variables for our analyses, using the appropriate
analysis tools, and making use of all the available data are perhaps the
more ‘‘technological’’ aspects of our research. And technical accuracy
is a necessary component of any rigorous research. Communicating
our results, on the other hand, is the more artful aspect of our work,
and it is here that we may be falling short. Much of the critique that Lin-
damood, Hanna and Bi make really has to do with the care and clarity of
our writing.
Few would deny that ‘‘household’’ is a more reader-friendly term than
‘‘primary economic unit’’ (and perhaps a more human and humane one as
well). But we should be explicit about terms we use interchangeably—or
better yet, select one term and stick with it throughout the article to avoid
confusion. The challenge for all of us is to find the right balance between
accurately describing what we did and how we did it and not overwhelming
WINTER 2007 VOLUME 41, NUMBER 2 215
the reader with technical details that get in the way of the results (and
annoying reviewers and editors). Huston’s commentary highlights the
American Economic Review’s data availability policy as an alternative
for lengthy data and variable descriptions—yet such a policy would not
have addressed the concerns raised by Lindamood, Hanna, and Bi regard-
ing clear definitions of variables and research protocols.
There are some problems raised by Lindamood, Hanna, and Bi that are
endogenous to the type of models we build—our unit of analysis may be the
household (e.g., a household’s net worth or level of indebtedness), but
many of the control measures we want to use (age, race, and education)
are specific to an individual within the household. The solution to this
is, as pointed out by Lindamood, Hanna, and Bi, is to clearly define our
measures and use the appropriate terms in our writing.
For me, the main message of the Lindamood, Hanna, and Bi article is
that it is all about respect—respecting the data and respecting the reader. If
we as researchers keep this in mind, everything else will fall into place.
REFERENCES
Klawitter, Marieka and Diana Fletschner. 2006. Banked or Unbanked? Individual and Family Access
to Savings and Checking Accounts. Paper prepared for Closing the Wealth Gap Research Forum
sponsored by CFED, September 19, 2006. http://www.frbsf.org/community/research/assets/
BankedorUnbanked.pdf.
Commentary by Darryl E. Getter, Specialist in Financial Economics, Congressional
Research Service, Library of Congress, Washington, DC ([email protected])
In their article, Lindamood, Hanna, and Bi discuss methodological errors
they believe other researchers have made while using the Surveys of Con-
sumer Finances (SCF). Because the article ineluctably could be read as an
attack on some quality work previously published from the database, my
discussion will provide context for reviewing these works. This note would
therefore explain past SCF-based studies and give additional directions for
future analysis.
The authors disagree with how some of the researchers have defined
variables used in their analysis. For example, they recommend that all
researchers using the SCF race variables should define them according
to guidelines set by the Office of Management and Budget. Generally
speaking, researchers should have the freedom to define variables the
216 THE JOURNAL OF CONSUMER AFFAIRS
way they see fit in order to answer their particular research questions. Read-
ers may feel that more suitable variable definitions could be used to answer
a particular research question but that does not necessarily mean that a
methodological error was made. If a reader believes that a respecification
of a variable definition will alter previously published empirical results, then
the burden falls upon that reader to perform another analysis and present new
findings that incorporate the improved variable definitions. With regard to
the specific criticism of how previous authors used the race variable, those
criticisms seem rather unfair. Researchers are limited to the questions avail-
able. If the SCF did not explicitly break race into ethnicity groups or simply
did not collect race information in accordance with the federal guidelines
prior to 2004, then researchers should not be criticized for doing the best
they can with the variables available to them at the time.
Lindamood, Hanna, and Bi also criticize authors who do not distinguish
between the ‘‘respondent’’ and the ‘‘household head.’’ Again, there is no
reason to suspect that a methodological error has occurred when these terms
are used interchangeably in articles. The SCF codes the answers of the
household head separately from those of the spouse. Looking at the online
SCF codebook, the responses of the household head clearly appear above
those of the spouse or second household member. Even if the second
respondent answers questions on behalf of the household head, the SCF
staff goes through the responses and assigns them to the appropriate indi-
vidual. Assuming a competent researcher uses the correct SCF variable
codes consistent with the household head’s responses, there really is no
reason to suspect any confusion. Moreover, such a distinction between
the respondent and the household head may only matter for certain types
of research questions or if the respondent were of a race different from that
of the household head, for example, suppose a non-white respondent who
was not the head reports belonging to a minority household even though the
household head is white. That response may not be entirely inaccurate since
the household does consist of a person who belongs to an official minority
group. Nevertheless, the care with which the SCF staff codes variables sug-
gests that it is unnecessary for a researcher to go out of his or her way to talk
about this distinction. All the researcher must do is to pay close attention
and choose the correct variable code from the codebook.
The suggestion that SCF researchers should always discuss whether or
not all five implicates are being used is simply unnecessary. Most research-
ers would presume all five implicates are being used, and the only reason
to bring up this issue would be if a researcher had a good reason for notusing all five implicates. Generally, the SCF staff recommends using all
WINTER 2007 VOLUME 41, NUMBER 2 217
implicates at all times. Of course, to avoid incorrectly reporting a sample
size inflated by a factor of five, authors may prefer to divide the total num-
ber of observations by five and report a sample size closer to the truth.
Furthermore, it is not necessary for researchers to rehash the discussion
about the SCF implicates in their academic articles when they can simply
reference the Federal Reserve Bulletin articles written on this topic. In fact,it makes far more sense for readers to go directly to publications by the
Federal Reserve staff who construct the SCF to find out the specific details
about the implicates, how to use the weights, etc.
While it is true many researchers using the SCF data have varying levels
of familiarity and expertise pertaining to the correct way to use them, this
problem is universal for all data sets. Many published articles, even after
having been presented several times and surviving the intense scrutiny of
the journal review process, may still have what appears to be errors—
especially when various details have been omitted. Perhaps such details were
left out because authors considered them to be excessive and detracted from
the readability or flow of their papers. Some journal editors or referees will
ask authors to be more concise or limit their use of footnotes, which forces
them to omit certain details. As a result, it may be incorrect to assume that
highly scrutinized papers contain errors without first contacting researchers
directly to ask clarification questions. Finally, I certainly believe that
researchers should be open-minded to criticisms since one is never too
old to learn frommistakes. On the other hand, it would be extremely helpful
if critics, in addition to pointing out the shortcomings of published works,
would take advantage of the opportunity to contribute to academic discus-
sions by publishing new and improved findings.
Commentary by Sandra J. Huston, Research Associate at the Center for Financial
Responsibility, Texas Tech University, Lubbock, TX ([email protected])
Not since Montalto and Sung (1996) has such a useful tool been made
available to researchers who use the Survey of Consumer Finances (SCF)
data. Montalto and Sung (1996) provide a SAS macro that allows
researchers to combine the five data implicates using the repeated impu-
tation inference technique.1 Lindamood, Hanna, and Bi reiterate the
importance of using all available data (i.e., incorporating all five
1. A SAS program for repeated imputation inference procedures, fromMontalto and Sung (1996), is
available online at hec.osu.edu/people/shanna/imput.htm. The SAS macro is also referenced on the
Federal Reserve Board’s SCF data Web site at www.federalreserve.gov/pubs/oss/oss2/scfindex.html.
218 THE JOURNAL OF CONSUMER AFFAIRS
implicates of data) and identify three additional concerns regarding the
use of SCF data: head versus respondent, race and ethnicity specification,
and weighting. The authors highlight the improper use of the SCF data
that involve errors of both commission and omission. Do researchers fail
to incorporate proper data techniques into their research? Do researchers
fail to adequately report the data manipulation and method(s) used? Or do
researchers fail on both accounts?
An error of commission (e.g., using only one implicate of data rather
than all five implicates) should be discouraged. When there is an error
of omission (failing to report if all data were used), the reader is left to
wonder if all implicates were included and, if so, what technique was used
to combine the implicates.
As social scientists and responsible authors and reviewers, we should
insist on reducing both errors. What is the most efficient way to ensure
correct use of SCF data? Lindamood, Hanna, and Bi certainly make the
case that the four issues raised are important to researchers using the
SCF, but unfortunately they do not explicitly provide remedies within their
article. However, information, including specific SAS code for three of the
four issues raised, is available at the SCF Users Group Web site within the
Dataset Section (www.hec.ohio-state.edu/scf/). While it may be true that
many of the findings from the highlighted studies would not be drastically
altered, we should all be interested in making sure ‘‘it is done right’’ for
the sake of replication, scientific advancement, and training of future
researchers.
The importance of this article will ultimately be determined by authors
and reviewers who will themselves decide the value of doing it right or
simply doing it well enough. Following the important contribution of
Montalto and Sung (1996), Lindamood, Hanna, and Bi reaffirm that
‘‘Researchers ideally should use all five implicates with the �repeated-imputation inference’ (RII) method’’ (Rubin, 1987). More than a decade
later, it seems unreasonable to accept for publication research that does
not use all five implicates. There are studies available that provide
evidence of biased results when all available data are not used (see Lin-
damood, Hanna, and Bi for references). The Federal Reserve Board pro-
vides excellent resources to guide researchers on how to combine the data
for both descriptive and multivariate analyses (www.federalreserve.gov/
pubs/oss/oss2/faq.html). Given evidence from previous research and
the ease with which authors can use the available data correctly, it is
fair to say that this error of commission is not acceptable. And, as
highlighted in Lindamood, Hanna, and Bi, when using all five implicates,
the repeated imputation inference technique is clearly better than averaging.
WINTER 2007 VOLUME 41, NUMBER 2 219
Distinguishing between the primary economic unit head (or household
head) and the designated respondent is important when analyzing couple
households. All respondent-level variables (e.g., X14, X5901) are assigned
to the male (in mixed-sex couples) or the older person (in same-sex cou-
ples) regardless of whether that person actually provided the data. In the
SCF data, variable X8000 can be used to check if the primary economic unit
head (male or oldest person) is in fact the survey respondent.2 To properly
attribute employment, pension, and demographic characteristics to the
actual respondent, a SAS code example for education and marital status
is available at hec.osu.edu/scf/RespondentversusheadinSurveyConsumer-
Finances.htm. This code could be used and modified for all separately col-
lected respondent/spouse or partner variables included in research using the
SCF data. SAS code to assist in creating race variables using both questions
in the 2004 SCF data (X6809 and X7004) is available at hec.osu.edu/scf/
Race_ethnic%20status%20in%20the%202004%20SCF.htm.
To weight or not to weight is one of the most contentious and unresolved
questions posed by SCF researchers. The answer is a resounding yes for
descriptive statistics but, as Lindamood, Hanna, and Bi point out, not so
clear for multivariate analyses. Using unweighted data for multivariate
analyses is a conservative default position. But if researchers want to follow
the recommendation of Deaton (1997), and now Lindamood, Hanna, and
Bi, to compare results between weighted and unweighted regressions, how
does one get a weighted sample? Lindamood, Hanna, and Bi, state, ‘‘For
our weighted analysis, we applied the SCF population weight scaled so that
the total apparent sample size for each implicate equaled the actual sample
size.’’ Unfortunately, at this time there is no SAS code available at the SCF
Users Group Web site to guide researchers in this process. Perhaps the
authors will consider making this addition. Still, it is doubtful that research-
ers will find that the value of adding an additional column of weighted
regression results exceeds the cost in effort and manuscript clarity if results
from both are similar.
Errors of commission, at least with regard to these four issues, can be
circumvented using resources outlined above. What about error of omis-
sion? How should researchers let readers know they have used the data
correctly? A cursory, and most certainly incomplete, search of articles
using SCF data in a variety of journals outside the scope explored by
Lindamood, Hanna, and Bi demonstrates that reporting ranges from a
2. See hec.osu.edu/scf/switch.htm for further explanation of X8000—The Respondent ‘‘Switch’’
Variable, by Catherine P. Montalto.
220 THE JOURNAL OF CONSUMER AFFAIRS

mere mention of the data used, for example simply noting that data are
obtained from the SCF,3 to more elaborate specifications including use
of five implicates with repeated imputation inference and weighting.4 Gen-
erally, these articles do not mention specific issues related to respondent/
head or race/ethnicity.
Although none of the articles using SCF data published in AmericanEconomic Review mention any specifics regarding the four data issues
raised in Lindamood, Hanna, and Bi, AER does have a data availability
policy that requires that all data, computer programs, etc., must be included
with submission and made available for purposes of replication (www.
aeaweb.org/aer/data_availability_policy.html).
All of the issues raised by Lindamood, Hanna, and Bi, along with
many more not included in their article, are outlined in the codebook
and supporting documentation supplied by the Federal Reserve Board.
Clearly, the onus is on the researcher to be a responsible user of the
SCF data. Article reviewers can ensure research quality by asking questions
during the review process. It may be excessive to suggest that authors
devote paragraphs of each manuscript to detail these methods; however,
reference to articles such as Lindamood, Hanna, and Bi and similar citations
available through the Federal Reserve Board should be an adequate signal
to readers that proper steps are taken when using SCF data.
REFERENCES
Bernheim, B. Douglas, Katherine G. Carman, Jagadeesh Gokhale, and Laurence Kotlikoff. 2003. Are
Life Insurance Holdings Related to Financial Vulnerabilities? Economic Inquiry, 41 (4): 531–554.
Deaton, Angus. 1997. The Analysis of Household Surveys: A Microeconometric Approach to Devel-opment Policy. Baltimore, MD: Johns Hopkins University Press.
Hau, Arthur. 2000. Liquidity, Estate Liquidation, Charitable Motives, and Life Insurance Demand by
Retired Singles. Journal of Risk and Insurance, 67 (1): 123–141.
Jianakoplos, Nancy A., Vickie L. Bajtelsmit, and Alexandra Bernasek. 2003. HowMarriage Matters to
Pension Investment Decisions. Journal of Financial Service Professionals, 57 (2): 48–57.
Lee, Jinkook and Julia Marlowe. 2003. How Consumers Choose a Financial Institution: Decision-
making Criteria and Heuristics. International Journal of Bank Marketing, 21 (2): 53–71.
Min, Insik and Jong-Ho Kim. 2003. Modeling Credit Card Borrowing: A Comparison of Type I and
Type II Tobit Approaches. Southern Economic Journal, 70 (1): 128–143.
Mitchel, James O. 2003. The Adequacy of Life Insurance Coverage in U.S. Households. Journal of
Financial Service Professionals, 57 (3): 54–63.
Montalto, Catherine P. and Jaimie Sung. 1996. Multiple Imputation in the 1992 Survey of Consumer
Finances. Financial Counseling and Planning, 7: 133–146.
3. See Samwick and Skinner (2004), Straight (2002), Mulligan and Sala-i-Martin (2000), Mitchel
(2003), Bernheim et al. (2003), Poterba (2001), and Min and Kim (2003).
4. See Jianakoplos, Bajtelsmit, and Bernasek (2003), Lee and Marlowe (2003), and Hau (2000).
WINTER 2007 VOLUME 41, NUMBER 2 221

Mulligan, Casey B. and Xavier Sala-i-Martin. 2000. Extensive Margins and the Demand for Money at
Low Interest Rates. Journal of Political Economy, 108 (5): 961–991.
Poterba, James M. 2001. Demographic Structure and Asset Returns. Review of Economics and Statis-
tics, 83 (4): 565–584.
Rubin, Donald B. 1987. Multiple Imputation for Nonresponse in Surveys. New York: John Wiley &
Sons.
Samwick, Andrew A. and Jonathan Skinner. 2004. How Will 401(k) Pension Plans Affect Retirement
Income? American Economic Review, 94 (1): 329–343.
Straight, Ronald L. 2002. Wealth: Asset-Accumulation Differences by Race—SCF Data, 1995 and
1998. American Economic Review, 92 (2): 330–334.
222 THE JOURNAL OF CONSUMER AFFAIRS
Related Documents