Using Supply and Demand to Analyze Markets Copyright © 2013 Worth Publishers, All Rights Reserved Microeconomics Goolsbee/Levitt/ Syverson 1/e 3 Chapter Outline 3.1 Consumer and Producer Surplus: Who Benefits in a Market? 3.2 Price Regulations 3.3 Quantity Regulations 3.4 Taxes 3.5 Subsidies 3.6 Conclusion 3-1

Using Supply and Demand to Analyze Markets Copyright © 2013 Worth Publishers, All Rights Reserved Microeconomics Goolsbee/Levitt/ Syverson 1/e 3.
Dec 14, 2015
Welcome message from author
This document is posted to help you gain knowledge. Please leave a comment to let me know what you think about it! Share it to your friends and learn new things together.
Transcript
Using Supply and Demand to Analyze
Markets
Copyright © 2013 Worth Publishers, All Rights Reserved Microeconomics Goolsbee/Levitt/ Syverson 1/e
3Chapter Outline
3.1 Consumer and Producer Surplus: Who Benefits in a Market?
3.2 Price Regulations
3.3 Quantity Regulations
3.4 Taxes
3.5 Subsidies
3.6 Conclusion
3-1
Introduction
Copyright © 2013 Worth Publishers, All Rights Reserved Microeconomics Goolsbee/Levitt/ Syverson 1/e 3-2
3In this chapter, we use the supply and demand model to answer the following questions
•How do we measure the benefits that accrue to producers and consumers in a market?
•How do government interventions (e.g., taxes) affect markets and the benefits associated with market exchange?
3.1
Copyright © 2013 Worth Publishers, All Rights Reserved Microeconomics Goolsbee/Levitt/ Syverson 1/e 3-3
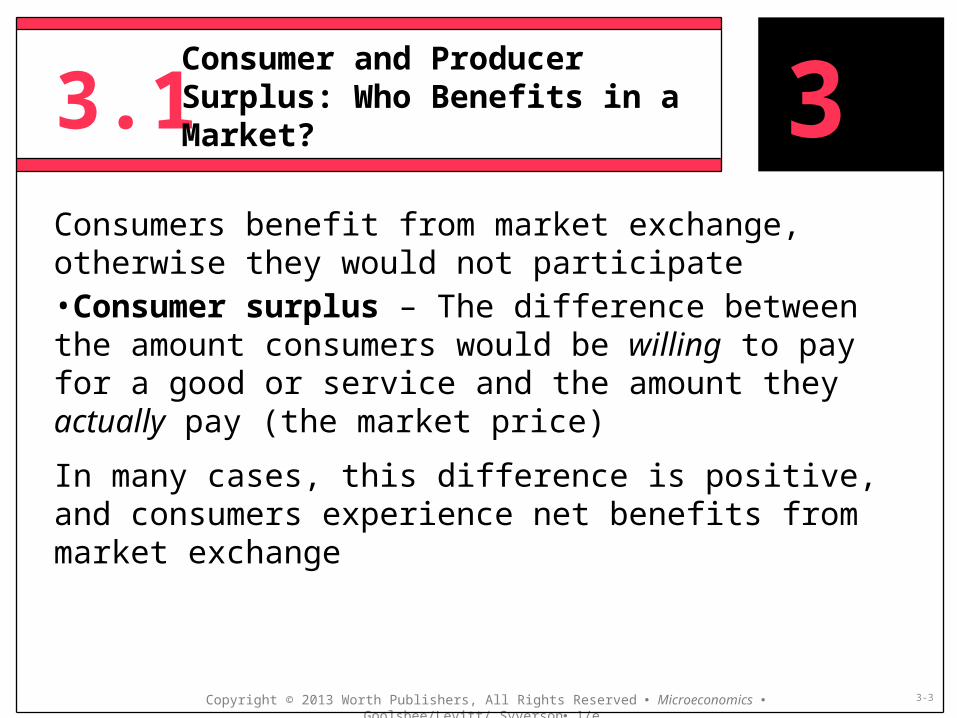
Consumers benefit from market exchange, otherwise they would not participate•Consumer surplus – The difference between the amount consumers would be willing to pay for a good or service and the amount they actually pay (the market price)
In many cases, this difference is positive, and consumers experience net benefits from market exchange
3Consumer and Producer Surplus: Who Benefits in a Market?

3.1
Copyright © 2013 Worth Publishers, All Rights Reserved Microeconomics Goolsbee/Levitt/ Syverson 1/e 3-4
3Consumer and Producer Surplus: Who Benefits in a Market?
Figure 3.1 Defining Consumer Surplus
Price ($/pound) Demandchoke price$5.50 Total consumerA surplus (CS)5 BPerson A’s 4.50consumer C4surplus = $1.50 D Market price3.50 E3 D210 Quantity of1 2 3 4 5 apples (pounds)
The consumer at point E will not buy any apples because the market price is too high

3.1
Copyright © 2013 Worth Publishers, All Rights Reserved Microeconomics Goolsbee/Levitt/ Syverson 1/e 3-5
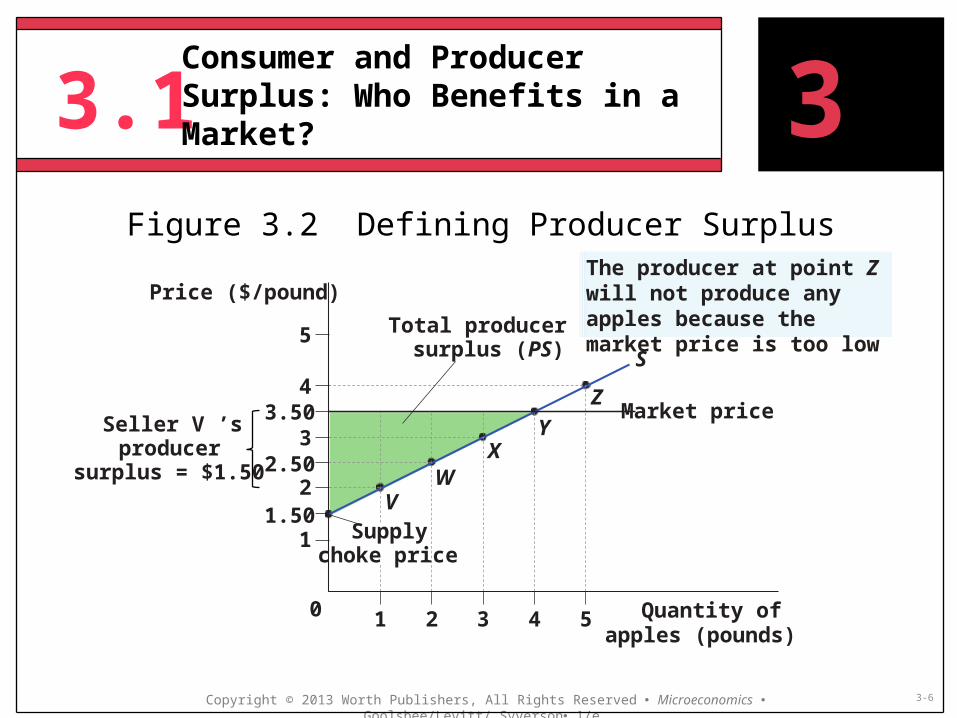
Producers benefit from market exchange, otherwise they would not participate•Producer surplus – The difference between the amount producers are willing to sell goods for and what they actually receive (the market price)
Producer surplus is not the same as profit, as we will see in later chapters
3Consumer and Producer Surplus: Who Benefits in a Market?
3.1
Copyright © 2013 Worth Publishers, All Rights Reserved Microeconomics Goolsbee/Levitt/ Syverson 1/e 3-6
3Consumer and Producer Surplus: Who Benefits in a Market?
Figure 3.2 Defining Producer Surplus
Price ($/pound) Total producer5 surplus (PS) S4 Z3.50 Market priceSeller V ’s Y3producer X2.50surplus = $1.50 W2 V1.50 Supply1 choke price0 Quantity of1 2 3 4 5 apples (pounds)
The producer at point Z will not produce any apples because the market price is too low

Copyright © 2013 Worth Publishers, All Rights Reserved Microeconomics Goolsbee/Levitt/ Syverson 1/e 3-7
figure it outThe Market for Cupcakes
The weekly supply and demand for cupcakes in a small town are given asQS = 30P – 20 , QD = 124 – 18Pwhere P is the price, in dollars, and quantity is measured in thousands of cupcakes per week
Answer the following questions:
1.Find the equilibrium price and quantity
2.Calculate consumer and producer surplus at the equilibrium

Copyright © 2013 Worth Publishers, All Rights Reserved Microeconomics Goolsbee/Levitt/ Syverson 1/e 3-8
figure it out
1. Remember: Equilibrium is characterized by QS = QD 30P – 20 = 124 – 18PCombining terms and solving for P yields48P = 144 → P* = $3And using the equation for demand, QD = 124 – 18(3) = 70 = Q* = QS 2. The easiest way to calculate consumer and producer
surplus is with a graph; to do this, we must determine two points for each curve• Equilibrium price/quantity• Choke prices (where QD /QS are equal to zero)
Why do we need only two points to plot the demand/supply curves?
The Market for Cupcakes
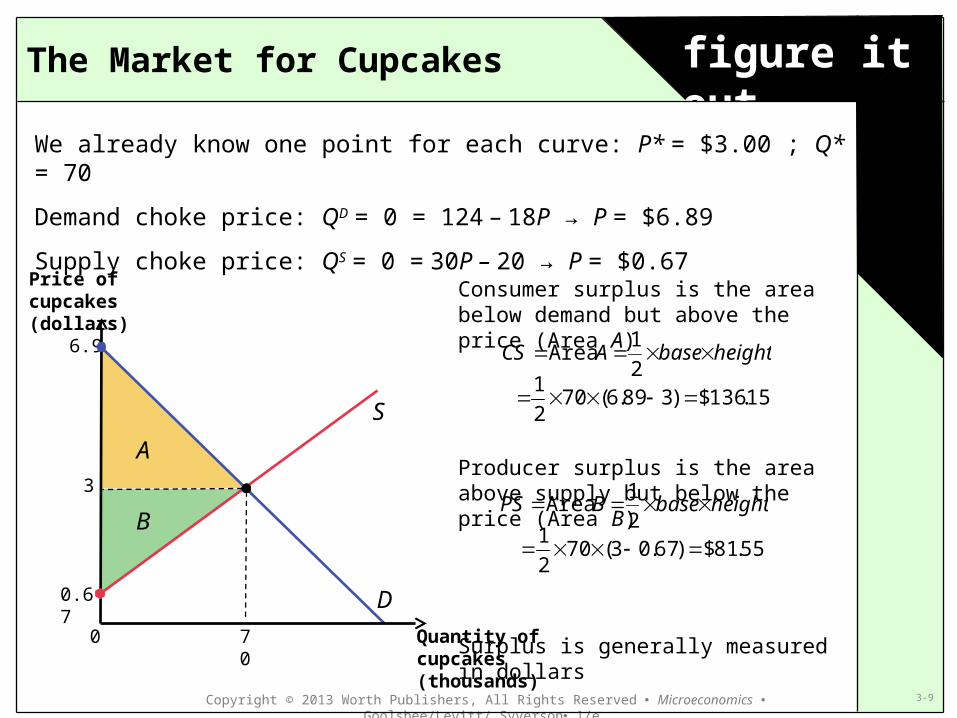
Copyright © 2013 Worth Publishers, All Rights Reserved Microeconomics Goolsbee/Levitt/ Syverson 1/e 3-9
figure it outThe Market for Cupcakes
We already know one point for each curve: P* = $3.00 ; Q* = 70Demand choke price: QD = 0 = 124 – 18P → P = $6.89Supply choke price: QS = 0 = 30P – 20 → P = $0.67
0 70 Quantity of cupcakes (thousands)
Price of cupcakes (dollars)
3
6.9
Consumer surplus is the area below demand but above the price (Area A)
Producer surplus is the area above supply but below the price (Area B)
Surplus is generally measured in dollars
0.67
heightbaseACS 2
1 Area
15.136$)389.6(702
1
heightbaseBPS 2
1 Area
55.81$)67.03(702
1
AB
D
S

3.1
Copyright © 2013 Worth Publishers, All Rights Reserved Microeconomics Goolsbee/Levitt/ Syverson 1/e 3-10
3Consumer and Producer Surplus: Who Benefits in a Market?
What happens to consumer and producer surplus when there is a shift in supply or demand?
0 Quantity of cupcakes (thousands)
Price of cupcakes (dollars)
Imagine a pie shop opens up in the same town. What will happen to the demand for cupcakes?
Demand will shift left, resulting in a new equilibrium of P2 andQ2What happens to consumer surplus? •Old consumer surplus: A + B + F•New consumer surplus: B + CWhat happens to producer surplus? •Old producer surplus: C + D + E + G•New producer surplus: DC has transferred from producers to consumersA + E + F + G has disappeared from this market
SP1
Q1D2 D1Q2
P2
A
B
C
D
E
F
G

3.1
Copyright © 2013 Worth Publishers, All Rights Reserved Microeconomics Goolsbee/Levitt/ Syverson 1/e 3-11
3Consumer and Producer Surplus: Who Benefits in a Market?
Figure 3.3 Consumer Surplus and the Elasticity of Demand

Copyright © 2013 Worth Publishers, All Rights Reserved Microeconomics Goolsbee/Levitt/ Syverson 1/e 3-12
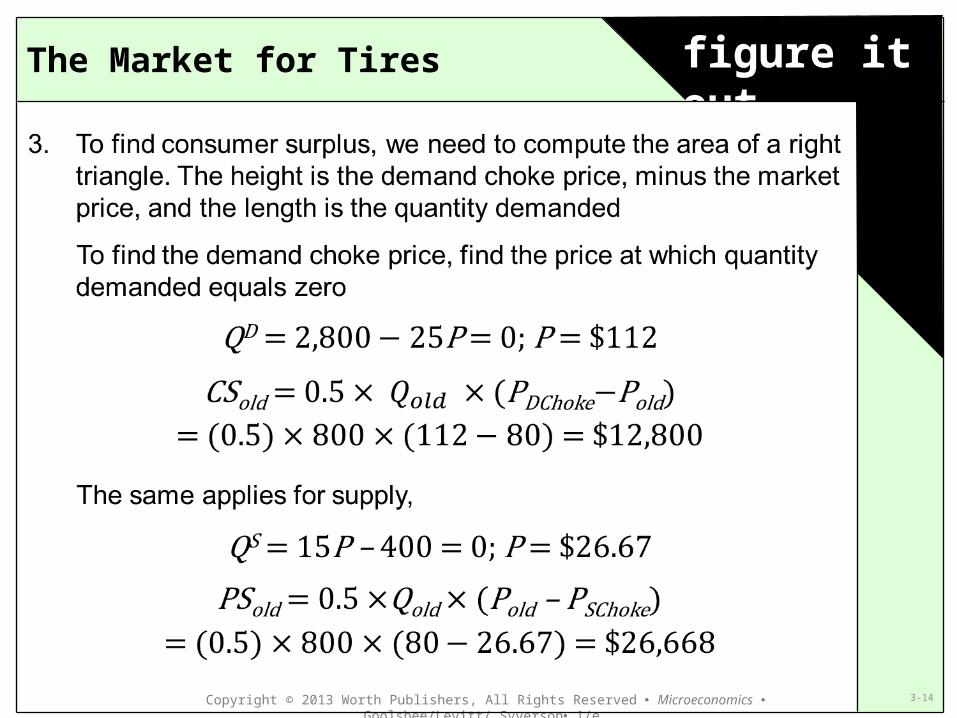
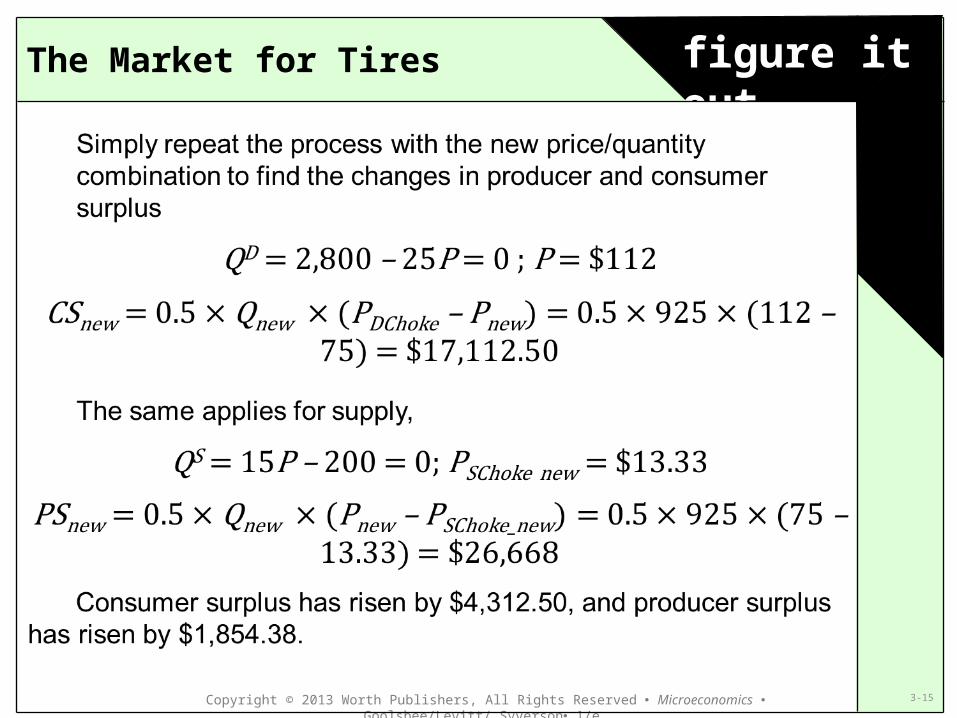
figure it outThe Market for Tires
The weekly supply and demand for tires in a small town are given as QS = 15P – 400 , QD = 2,800 – 25Pwhere P is the price, in dollars, and quantity is the number of tires sold weekly. The equilibrium price is $80 per tire, and 800 tires are sold each week
Suppose an improvement in technology makes tires cheaper to produce; specifically, suppose the quantity supplied rises by 200 at every price
Answer the following questions:
1.What is the new supply curve?
2.What are the new equilibrium price and quantity?
3.What happens to consumer and producer surplus?

Copyright © 2013 Worth Publishers, All Rights Reserved Microeconomics Goolsbee/Levitt/ Syverson 1/e 3-13
figure it outThe Market for Tires
Copyright © 2013 Worth Publishers, All Rights Reserved Microeconomics Goolsbee/Levitt/ Syverson 1/e 3-14
figure it outThe Market for Tires
Copyright © 2013 Worth Publishers, All Rights Reserved Microeconomics Goolsbee/Levitt/ Syverson 1/e 3-15
figure it outThe Market for Tires

3.1
Copyright © 2013 Worth Publishers, All Rights Reserved Microeconomics Goolsbee/Levitt/ Syverson 1/e 3-16
3Consumer and Producer Surplus: Who Benefits in a Market?
Figure 3.5 Changes in Surplus from a Supply Shift

3.2 Price Regulations
Copyright © 2013 Worth Publishers, All Rights Reserved Microeconomics Goolsbee/Levitt/ Syverson 1/e 3-17
Politicians often call for the direct regulation of prices on products and services•Price ceiling – a regulation that sets the maximum price that can be legally paid for a good or service•Price floor – a regulation that sets the minimum price that can be legally paid for a good or service (often called a price support)
What are the effects of price ceilings/floors on markets?
3

3.2 Price Regulations
Copyright © 2013 Worth Publishers, All Rights Reserved Microeconomics Goolsbee/Levitt/ Syverson 1/e 3-18
Some important terminology
Transfer – surplus that moves from producers to consumers, or vice versa, as a result of a regulation
Deadweight loss (DWL) – the reduction in total surplus that occurs as a result of a market inefficiency•Remember the cupcake example of changing demand due to a pie shop
Nonbinding price ceiling – a price set at a level above the equilibrium market price
Nonbinding price floor – a price set at a level below the equilibrium market price
3

3.2
Copyright © 2013 Worth Publishers, All Rights Reserved Microeconomics Goolsbee/Levitt/ Syverson 1/e 3-19
3Price Regulations
Figure 3.7 The Effects of a Price CeilingPrice Consumer surplus before A + B + C($/pizza) Consumer surplus after A + B + D$20 Producer surplus before D + E + FProducer surplus after FA DWL = C + E Supply14 B wC10 E yD8 xF5 Transferof PS Demandto CS0 Quantity of pizzas6 10 12 20 (thousands)/monthShortage
z

3.2 Price Regulations
Copyright © 2013 Worth Publishers, All Rights Reserved Microeconomics Goolsbee/Levitt/ Syverson 1/e 3-20
3.8 Deadweight Loss and Elasticities
3

3.2
Copyright © 2013 Worth Publishers, All Rights Reserved Microeconomics Goolsbee/Levitt/ Syverson 1/e 3-21
3Price Regulations
Figure 3.9 The Effects of a Price FloorPrice Transfer($/per ton) of CS to PS SA x y Price floor$1,000 B Consumer surplus before A + B + CC w500 Consumer surplus after AE Producer surplus before D + E + FD Producer surplus after B + D + FzF
D0 Quantity of peanuts10 20 30 (millions of tons)Surplus

3.3 Quantity Regulations
Copyright © 2013 Worth Publishers, All Rights Reserved Microeconomics Goolsbee/Levitt/ Syverson 1/e 3-22
Like price regulations, quantity regulations restrict the amount of a good or service provided to a market
Quota – a regulation that sets the quantity of a good or service provided•Often used to limit imports of certain goods; why might a government pursue an import quota?•Sometimes used to limit exports (e.g., China and rare earths)
What are the effects of quotas on markets?
3
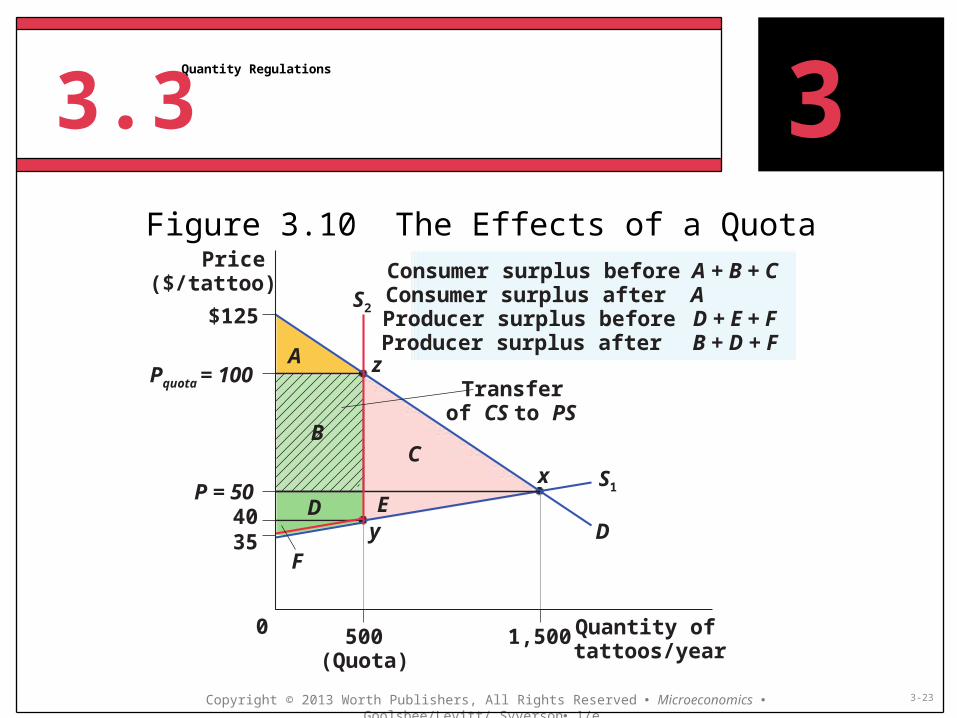
3.3
Copyright © 2013 Worth Publishers, All Rights Reserved Microeconomics Goolsbee/Levitt/ Syverson 1/e 3-23
3Quantity Regulations
Figure 3.10 The Effects of a QuotaPrice Consumer surplus before A + B + C($/tattoo) Consumer surplus after AS2$125 Producer surplus before D + E + FProducer surplus after B + D + FA zPquota = 100 Transferof CS to PSB C x S1P = 50 ED40 y D35 F0 Quantity of500 1,500 tattoos/year(Quota)

Application
Copyright © 2013 Worth Publishers, All Rights Reserved Microeconomics Goolsbee/Levitt/ Syverson 1/e 3-24
The unintended consequences of immigration quotas
In October, 2003, Congress reduced the annual number of H-1B visas from 195,000 to 65,000•Targeted highly skilled workers•Quota had never been binding prior to policy change; government began denying petitions in 2004•Requires a sponsoring U.S. company (a job offer); foreign students who pursue a U.S. education have a better chance of finding a sponsor
Visa quotas have been shown to reduce immigration...
Why would the U.S. pursue this policy? What other consequences might we
see?
Images: FreeDigitalPhotos.net
3
Citation: T. Kato and C. Sparber. 2012. “Quotas and Quality: the Effects of H-1B Visa Restrictions on the Pool of Prospective Undergraduate Students from Abroad.” Forthcoming in The Review of Economics and Statistics.

Application
Copyright © 2013 Worth Publishers, All Rights Reserved Microeconomics Goolsbee/Levitt/ Syverson 1/e 3-25
The unintended consequences of immigration quotas
Kato and Sparber (2013) examined whether this new policy might have reduced the incentive for highly qualified students to pursue an education in the U.S.•Considered SAT scores submitted by foreign students•Used five countries as a “control”; Australia, Canada, Chile, Mexico, and Singapore have special status, and their students can obtain visas similar to H-1B without a quota
Key findings•Average SAT scores of applicants from foreign countries affected by the H-1B quota dropped 10– 20 points after 2003•Drop was driven by a reduction in top-quintile scores, implying the policy reduced incentive for high-quality applicants
Images: FreeDigitalPhotos.net
3
Citation: T. Kato and C. Sparber. 2012. “Quotas and Quality: the Effects of H-1B Visa Restrictions on the Pool of Prospective Undergraduate Students from Abroad.” Forthcoming in The Review of Economics and Statistics.

Copyright © 2013 Worth Publishers, All Rights Reserved Microeconomics Goolsbee/Levitt/ Syverson 1/e 3-26
3Government provision of a public good: municipal golf courses
0 Quantity of rounds
Price of a golf round
Sometimes, governments attempt to supplement market supply for things that benefit communities
What happens to the market for golf when a local government opens a municipal course?•With only for-profit and private courses, supply is Spriv and the market equilibrium occurs at Q1 and P1•The municipal course increases the quantity of rounds available by Qgov , and supply shifts out to StotHowever, quantity supplied only increases to Qtot because private suppliers are not willing to supply as much at the new, lower market price•Private producers reduce quantity supplied to Qpriv , this effect is known as “crowding out”
Spriv
P1
DQ1
Ptot
3.3 Quantity Regulations
Stot
Qtot Q1 + Qgov Crowding out
Qpriv

3.4 Taxes
Copyright © 2013 Worth Publishers, All Rights Reserved Microeconomics Goolsbee/Levitt/ Syverson 1/e 3-27
Taxes are very prevalent in societies•Product markets (VAT; sales taxes)•Labor markets (income taxes; payroll taxes)•Capital markets (capital gains taxes)
How do taxes impact markets?•Some taxes are imposed to correct market failures (see Chapter 16)•In general, taxes distort market outcomes •How do we describe the effects of taxes?
Example: In 2003, Boston’s Mayor Tom Menino proposed a $0.50 tax on movie tickets•How should this tax (which was ultimately not adopted by the legislature) affect the market for movie tickets?
3
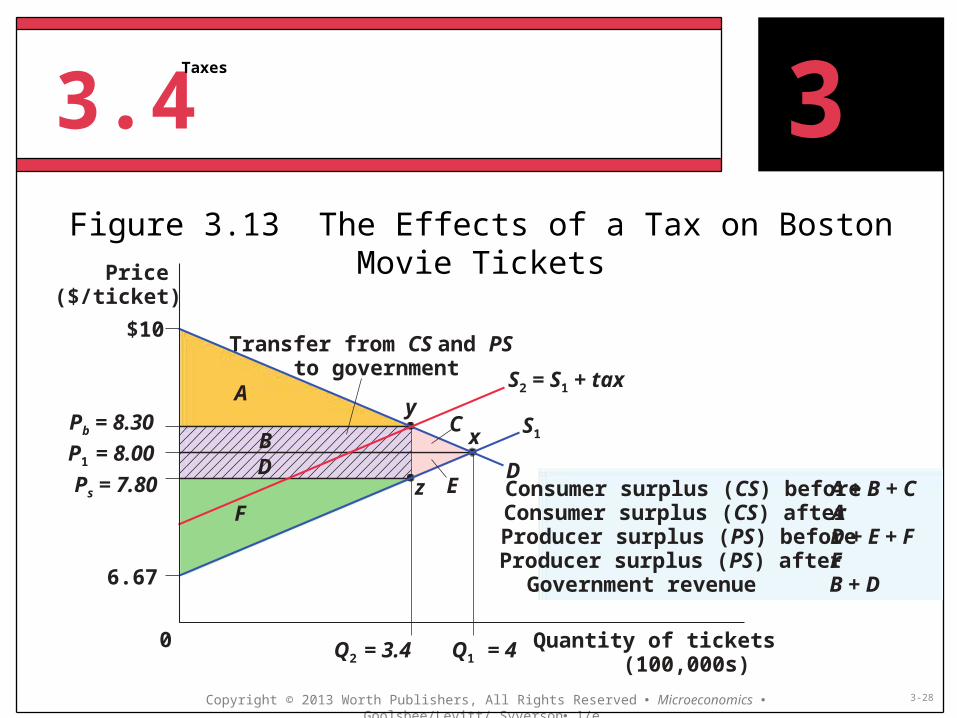
3.4
Copyright © 2013 Worth Publishers, All Rights Reserved Microeconomics Goolsbee/Levitt/ Syverson 1/e 3-28
3Taxes
Figure 3.13 The Effects of a Tax on Boston Movie TicketsPrice($/ticket)$10 Transfer from CS and PSto government S2 = S1 + taxA yPb = 8.30 C S1xBP1 = 8.00 D DPs = 7.80 Ez Consumer surplus (CS) beforeA + B + CConsumer surplus (CS) afterAF Producer surplus (PS) beforeD + E + FProducer surplus (PS) after F6.67 Government revenue B + D
0 Quantity of ticketsQ2 = 3.4 Q1 = 4 (100,000s)

3.4 Taxes
Copyright © 2013 Worth Publishers, All Rights Reserved Microeconomics Goolsbee/Levitt/ Syverson 1/e 3-29
We can also describe the effect of a tax on consumer and producer surplus with equations. Demand and supply for tickets are given by
where prices are measured in dollars and quantity in hundreds of thousands of tickets. Equilibrium occurs when QD = QS, Before the tax, tickets are $8 and 400,000 tickets are sold in Boston
Pre-tax consumer surplus
where the demand choke price is found by solving
and consumer surplus is equal to
3
1Choke2
1PPQCS D
10$2200 ChokeChoke DDD PPQ
000,400$8$10$000,4002
1CS
203 ;220 PQPQ SD
405203220 PPP

3.4 Taxes
Copyright © 2013 Worth Publishers, All Rights Reserved Microeconomics Goolsbee/Levitt/ Syverson 1/e 3-30
Pre-tax producer surplus surplus
where the supply choke price
Solving for producer surplus yields
And total surplus
What happens after the tax?
3 Choke12
1SPPQPS
67.6$2030 ChokeChoke SSS PPQ
667,266$67.6$8$000,4002
1PS
667,666$CSPS

3.4 Taxes
Copyright © 2013 Worth Publishers, All Rights Reserved Microeconomics Goolsbee/Levitt/ Syverson 1/e 3-31
350.0$ Sb PP
20350.0220203220 SSSbSD PPPPQQ
80.7$2031220 SSS PPP
30.8$50.0$ Sb PP
000,34030.82202 Q

3.4 Taxes
Copyright © 2013 Worth Publishers, All Rights Reserved Microeconomics Goolsbee/Levitt/ Syverson 1/e 3-32
New consumer surplus
and producer surplus
How much revenue has been generated by the tax?
And the associated deadweight loss associated with this distortion is
3
000,170$000,34050.0$50.0Revenue 2 Q
000,289$30.8$10$000,3402
1CS
100,192$67.6$80.7$000,3402
1PS
000,15$50.0$000,340000,4002
1
2
121
tax
sb PPQQDWL
3.4 Taxes
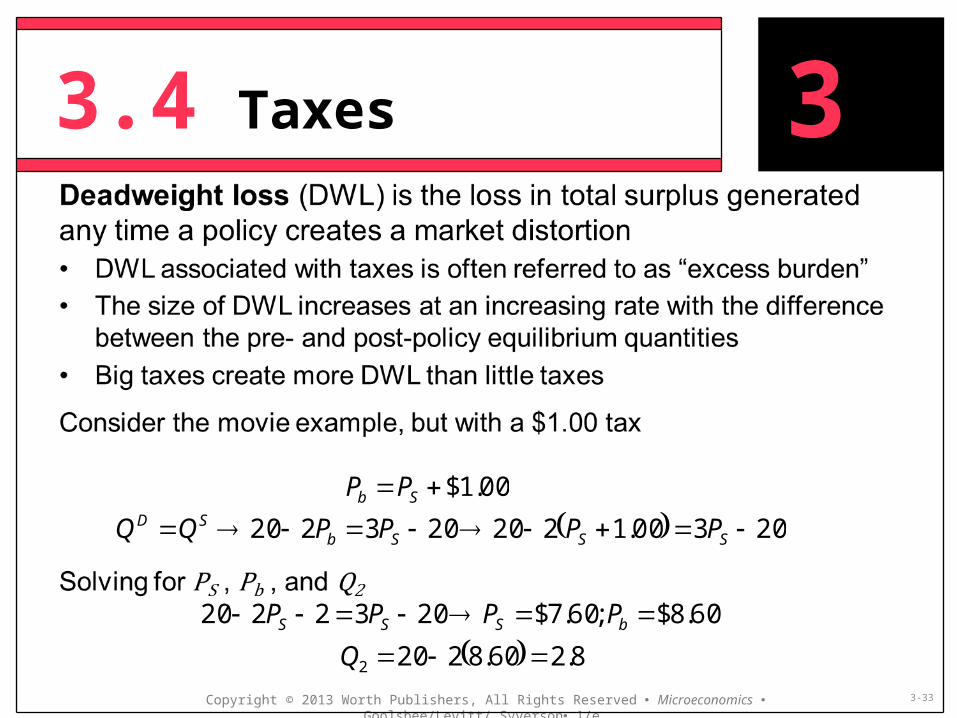
Copyright © 2013 Worth Publishers, All Rights Reserved Microeconomics Goolsbee/Levitt/ Syverson 1/e 3-33
3
00.1$ Sb PP
20300.1220203220 SSSbSD PPPPQQ
60.8$ ;60.7$2032220 bSSS PPPP
8.260.82202 Q

3.4 Taxes
Copyright © 2013 Worth Publishers, All Rights Reserved Microeconomics Goolsbee/Levitt/ Syverson 1/e 3-34
Consumer surplus
and producer surplus
How much revenue has been generated by the tax?
And the associated deadweight loss associated with this distortion is
So, while the tax rate has doubled, deadweight loss has quadrupled from $15,000 to $60,000, and tax revenues have only increased by 78.5% (from $170,000 to $280,000)
3
000,280$000,28000.1$00.1Revenue 2 Q
000,196$60.8$10$000,2802
1CS
200,130$67.6$60.7$000,2802
1PS
000,60$00.1$000,280000,4002
1
2
121
tax
sb PPQQDWL

3.4 Taxes
Copyright © 2013 Worth Publishers, All Rights Reserved Microeconomics Goolsbee/Levitt/ Syverson 1/e 3-35
3Figure 3.14 The Effect of a Larger Tax on Boston
Movie Tickets

Copyright © 2013 Worth Publishers, All Rights Reserved Microeconomics Goolsbee/Levitt/ Syverson 1/e 3-36
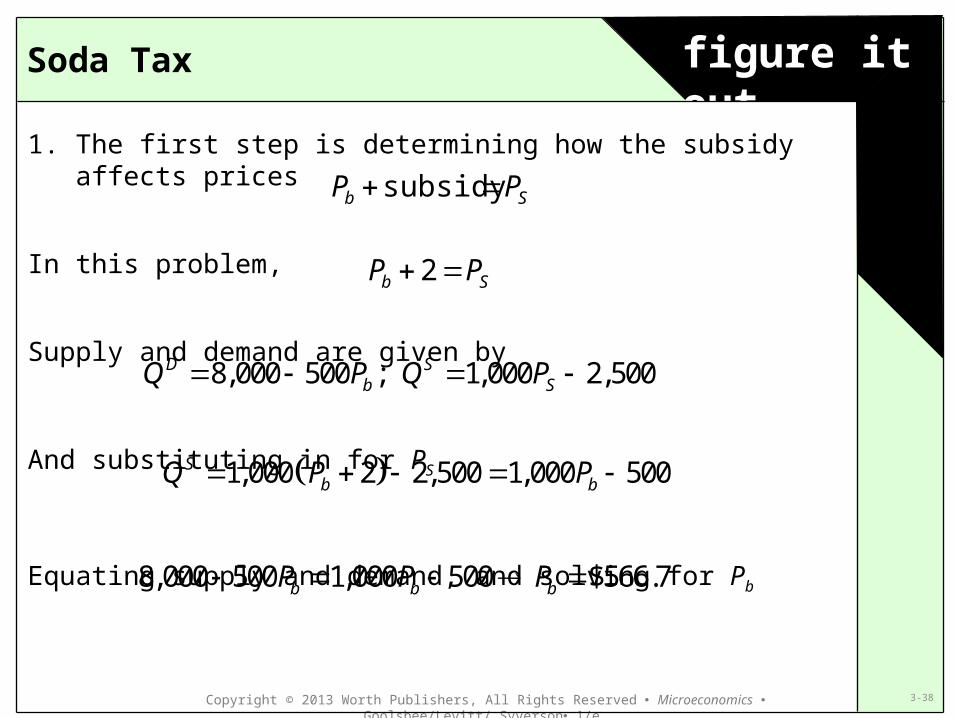
figure it outSoda Tax
The supply and demand for soda in a market is represented by QS = 50P – 60 , QD = 12 – 8Pwhere P is the price per bottle, in dollars, and Q is in millions of bottles per year
The current equilibrium price is $1.24, and 2.07 million bottles are sold per year
Answer the following questions:
1.Calculate the price elasticity of demand and the price elasticity of supply at the current equilibrium
2.Calculate the share of a tax that will be borne by consumers and the share borne by producers3.If a tax of $0.10 per bottle is created, what do buyers now pay for a bottle? What will sellers receive?

Copyright © 2013 Worth Publishers, All Rights Reserved Microeconomics Goolsbee/Levitt/ Syverson 1/e 3-37
figure it out
1. The first step is determining how the subsidy affects prices
In this problem,
Supply and demand are given by
And substituting in for PS
Equating supply and demand, and solving for Pb
Soda Tax
Sb PP subsidy
Sb PP 2
8,000 500 ; 1,000 2,500D Sb SQ P Q P
1,000 2 2,500 1,000 500Sb bQ P P
8,000 500 1,000 500 $566.7b b bP P P
Copyright © 2013 Worth Publishers, All Rights Reserved Microeconomics Goolsbee/Levitt/ Syverson 1/e 3-38
figure it out
1. The first step is determining how the subsidy affects prices
In this problem,
Supply and demand are given by
And substituting in for PS
Equating supply and demand, and solving for Pb
Soda Tax
Sb PP subsidy
Sb PP 2
8,000 500 ; 1,000 2,500D Sb SQ P Q P
1,000 2 2,500 1,000 500Sb bQ P P
8,000 500 1,000 500 $566.7b b bP P P
Application
Copyright © 2013 Worth Publishers, All Rights Reserved Microeconomics Goolsbee/Levitt/ Syverson 1/e 3-39
Images: FreeDigitalPhotos.net
3
Citation: Fisman, R. and S. Wei. 2004. “Tax Rates and Tax Evasion: Evidence from “Missing Imports” in China.” The Journal of Political Economy 112(2): 471–496.

Application
Copyright © 2013 Worth Publishers, All Rights Reserved Microeconomics Goolsbee/Levitt/ Syverson 1/e 3-40
Taxation, tax evasion, and smuggling
The authors find the evasion gap to be positively correlated with tax rates (i.e., highly taxed products are likely to be mislabeled, undervalued, or undercounted)
Evasion is almost entirely due to intentional mislabeling of products (highly taxed products are labeled as minimally taxed products)
Evasion is negatively correlated with tax rates on closely related products (e.g., chickens and turkeys)... why might this be the case? Images: FreeDigitalPhotos.net
3
Citation: Fisman, R. and S. Wei. 2004. “Tax Rates and Tax Evasion: Evidence from “Missing Imports” in China.” The Journal of Political Economy 112(2): 471–496.

3.4 Taxes
Copyright © 2013 Worth Publishers, All Rights Reserved Microeconomics Goolsbee/Levitt/ Syverson 1/e 3-41
Tax incidence is a term describing who actually bears the burden of a tax•In the supply and demand model, it does not matter who is required to pay the tax (e.g., a sales tax vs. a production tax); tax incidence will be the same in each case! •Consider again the movie theater example
3

3.4
Copyright © 2013 Worth Publishers, All Rights Reserved Microeconomics Goolsbee/Levitt/ Syverson 1/e 3-42
3Taxes
Figure 3.15 Tax Incidence
(a) (b)Price ($) Price ($)S2 Tax = Pb – Ps SS1
Pb PbP1 P1Ps Ps D1D D2Tax = Pb – Ps 0 Quantity 0 QuantityQ2 Q1 Q2 Q1
3.4 Taxes
Copyright © 2013 Worth Publishers, All Rights Reserved Microeconomics Goolsbee/Levitt/ Syverson 1/e 3-43
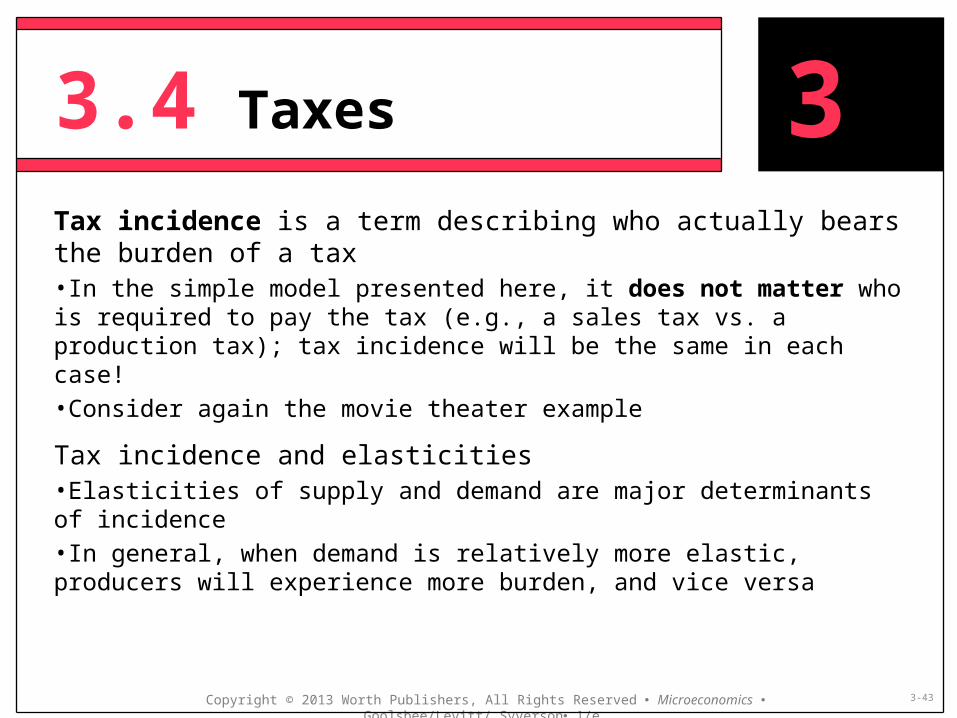
Tax incidence is a term describing who actually bears the burden of a tax•In the simple model presented here, it does not matter who is required to pay the tax (e.g., a sales tax vs. a production tax); tax incidence will be the same in each case! •Consider again the movie theater example
Tax incidence and elasticities•Elasticities of supply and demand are major determinants of incidence•In general, when demand is relatively more elastic, producers will experience more burden, and vice versa
3

Copyright © 2013 Worth Publishers, All Rights Reserved Microeconomics Goolsbee/Levitt/ Syverson 1/e 3-44
3Elastic demand with inelastic supply
0 Quantity of labor
Wage
Consider the market for labor; workers (suppliers), are unlikely to extend or cut hours very much for a large range of wages
Demand, on the other hand, may be elastic due to the presence of substitutes (outsourcing)
What happens when the government puts a tax on earned income?•The tax shifts the labor supply curve up by the amount of the tax; the new wage is Wb , with quantity L2The wage received by workers, however, is only Ws Wb –W1 < W1 – Ws ; therefore, the incidence of the tax falls primarily on suppliers of labor (workers)
S2
Wb D
L1
3.4 Taxes
S1tax
W1Ws
L2
tax

3.4 Taxes
Copyright © 2013 Worth Publishers, All Rights Reserved Microeconomics Goolsbee/Levitt/ Syverson 1/e 3-45
Tax incidence is a term describing who actually bears the burden of a tax•In the simple model presented here, it does not matter who is required to pay the tax (e.g., a sales tax vs. a production tax); tax incidence will be the same in each case! •Consider again the movie theater example
Tax incidence and elasticities•Elasticities of supply and demand are major determinants of incidence•In general, when demand is relatively more elastic, producers will experience more burden, and vice versa
A general formula(s) for incidence as a function of elasticities
3
DS
S
EE
E
consumerby born Share
DS
D
EE
E
producerby born Share

3.4 Taxes
Copyright © 2013 Worth Publishers, All Rights Reserved Microeconomics Goolsbee/Levitt/ Syverson 1/e 3-46
3Figure 3.16 Tax Incidence and Elasticities

Copyright © 2013 Worth Publishers, All Rights Reserved Microeconomics Goolsbee/Levitt/ Syverson 1/e 3-47
figure it outSoda Tax
The supply and demand for soda in a market is represented by QS = 50P – 60 , QD = 12 – 8PWhere P is the price per bottle, in dollars, and Q is in millions of bottles per year
The current equilibrium price is $1.17, and 2.62 million bottles are sold per year
Answer the following questions:
1.Calculate the price elasticity of demand and the price elasticity of supply at the current equilibrium
2.Calculate the share of a tax that will be borne by consumers and the share borne by producers3.If a tax of $0.10 per bottle is created, what do buyers now pay for a bottle? What will sellers receive?

Copyright © 2013 Worth Publishers, All Rights Reserved Microeconomics Goolsbee/Levitt/ Syverson 1/e 3-48
figure it out
1. The elasticity of demand and supply are
2. The proportion of a tax borne by buyers and sellers is:
3. If there is a tax of $0.10 per bottle, buyers pay 85.6%, or $0.0856 per bottle, and sellers pay 14.4%, or $0.0144 per bottle
Soda Tax
75.362.2
17.18
D
DD
Q
P
P
QE
33.2262.2
17.150
S
SS
Q
P
P
QE
%6.8575.333.22
33.22buyerby born Share
DS
S
EE
E
%4.1475.333.22
75.3sellerby born Share
DS
D
EE
E

Application
Copyright © 2013 Worth Publishers, All Rights Reserved Microeconomics Goolsbee/Levitt/ Syverson 1/e 3-49
Is it really the case that it does not matter how a tax is levied?
Economic theory tells us tax incidence does not depend on who is actually taxed
This assumes consumers treat a dollar of taxation in the same manner as they treat a dollar of product price
Chetty et al. (2009) show this may not always be true. Consider the differences between sales taxes and excise taxes•Sales taxes are usually assessed as a percentage of the retail price of a good or service, and is added at the point of sale; determining the total cost before purchasing requires calculation by the consumer•Excise taxes are usually included in the observed retail price (e.g., the tax on gasoline or alcohol)
Images: FreeDigitalPhotos.net
3
R. Chetty, A.Loony, and K. Kroft. 2009. “Salience and Taxation: Theory and Evidence.”American Economic Review, 99(4): 1145–1177.

Application
Copyright © 2013 Worth Publishers, All Rights Reserved Microeconomics Goolsbee/Levitt/ Syverson 1/e 3-50
Is it really the case that it does not matter how a tax is levied?
The authors examine this issue in two ways•“Field experiment” to determine how demand for household items in a supermarket changes when sales taxes are included in posted prices•Empirical study of state-level changes in excise and sales taxes on alcohol between 1970 and 2003
Both approaches reveal that consumers underreact to sales taxes relative to excise taxes (i.e., lower ED with respect to sales taxes)•What does this imply for tax incidence?•How should taxes be structured?
What does this imply for economic theory?•Theory is constantly evolving to take into account evidence from the field and laboratory•Chapter 17 highlights some recent advances in behavioral economics
3
R. Chetty, A. Loony, and K. Kroft. 2009. “Salience and Taxation: Theory and Evidence.”American Economic Review, 99(4): 1145–1177.
Images: FreeDigitalPhotos.net

3.5 Subsidies
Copyright © 2013 Worth Publishers, All Rights Reserved Microeconomics Goolsbee/Levitt/ Syverson 1/e 3-51
Subsidy – a payment by the government to a buyer or seller of a good or service•Subsidies are simply the opposite of a tax
Governments subsidize many products and production processes•Producer subsidies – ethanol production, research and development•Consumer subsidies – education, public transportation
3
Sb PP subsidy

3.5 Subsidies
Copyright © 2013 Worth Publishers, All Rights Reserved Microeconomics Goolsbee/Levitt/ Syverson 1/e 3-52
Figure 3.17 The Impact of a Producer Subsidy
3

Copyright © 2013 Worth Publishers, All Rights Reserved Microeconomics Goolsbee/Levitt/ Syverson 1/e 3-53
figure it outEducation Grants
For years the government has subsidized higher education through grants; consider the supply and demand for college credit hours at a local private liberal arts collegeQS = 1,000P – 2500 , QD = 8,000 – 500Pwhere P is the price, in hundreds of dollars, and Q is the number of credit hours per semester
The current equilibrium price is $700, and 4,500 credit hours are taken per semester; suppose the government subsidizes credit hours at a rate of $200 per hour
Answer the following questions:
1.What will happen to the price paid by students, the price received by the college, and the number of credit hours completed?
2.What is the cost of the subsidy to the government?

Copyright © 2013 Worth Publishers, All Rights Reserved Microeconomics Goolsbee/Levitt/ Syverson 1/e 3-54
figure it out
1. The first step is determining how the subsidy affects prices
In this problem,
Supply and demand are given by
And substituting in for PS
Equating supply and demand, and solving for Pb
Education Grants
Sb PP subsidy
Sb PP 2
8,000 500 ; 1,000 2,500D Sb SQ P Q P
1,000 2 2500 1,000 500Sb bQ P P
8,000 500 1,000 500 $566.7b b bP P P
Copyright © 2013 Worth Publishers, All Rights Reserved Microeconomics Goolsbee/Levitt/ Syverson 1/e 3-55
figure it out
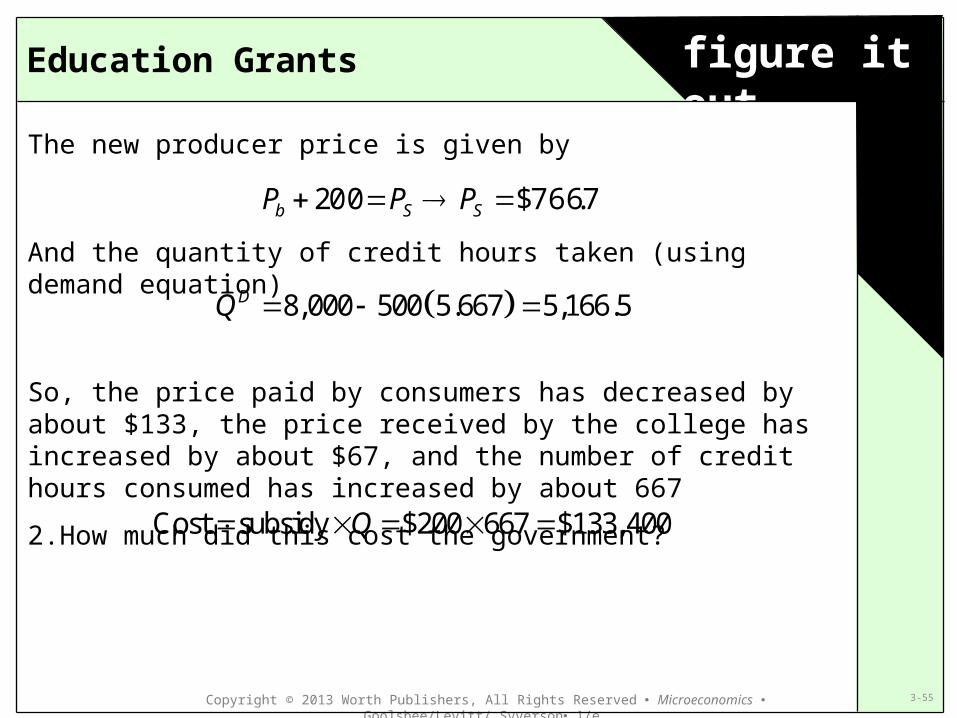
The new producer price is given by
And the quantity of credit hours taken (using demand equation)
So, the price paid by consumers has decreased by about $133, the price received by the college has increased by about $67, and the number of credit hours consumed has increased by about 667
2.How much did this cost the government?
Education Grants
7.766$002 SSb PPP
8,000 500 5.667 5,166.5DQ
Cost subsidy $200 667 $133,400Q

3.6 Conclusion
Copyright © 2013 Worth Publishers, All Rights Reserved Microeconomics Goolsbee/Levitt/ Syverson 1/e 3-56
3
Related Documents