Using Species Distribution Modeling to contextualize Lower Magdalenian social networks visible through portable art stylistic similarities in the Cantabrian region (Spain) Claudine Gravel-Miguel School of Human Evolution and Social Change, Arizona State University, P.O. Box 872402, Tempe, AZ 85287-2402, USA article info Article history: Available online xxx Keywords: Cantabrian region Lower Magdalenian Social networks Portable art objects Species Distribution Modeling GIS abstract This research argues for a refocus of the study of prehistoric social networks that involves contextualizing the inter-site links that are often interpreted as indicators of inter-site social interactions. It focuses on the social networks created during the Lower Magdalenian of the Cantabrian region (Spain), and visible through similarities of portable art representations. It uses Species Distribution Modeling and Maximum Classification Likelihood on faunal presence data to reconstruct prehistoric biomes, and contextualize the networks reconstructed through the art analysis. It demonstrates the potential of mapping the recreated networks onto the reconstructed biomes and of identifying the linked sites' foraging and minimal band territories to distinguish between local mobility movement and inter-group social alliances. The results show that, during the Lower Magdalenian, the majority of movements seen through artistic similarities probably represent the seasonal mobility of one or two hunter-gatherer groups, and that only a few inter- site links represent social networks used to exchange mates and gather information. © 2015 Elsevier Ltd and INQUA. All rights reserved. 1. Introduction 1.1. Cantabrian Lower Magdalenian The Magdalenian (c. 20e14 cal ka BP) follows the Last Glacial Maximum (LGM) and is characterized by an overall increase in temperature with high frequency and high amplitude climate variation (McCabe et al., 1998; Ahn, 2012). Through its temporal range and geographical distribution, the Magdalenian remained a coherent culture (Aura et al., 2012; Otte, 2012), as groups of hunter- gatherers aggregated into temperate refugia during the LGM (Jochim, 1987; Clark et al., 1996) only to re-colonize high-altitude and high-latitude regions during the following Interstadial (Clottes, 1989; Schwendler, 2004; Langlais et al., 2009; Miller, 2012; Straus et al., 2012). Research on the Magdalenian of France and Spain have demonstrated the existence of local and long-distance social contacts within and between these regions through the study of marine shell distribution (e.g., Taborin, 1993; Alvarez-Fern andez, 2002, 2006, 2009), raw material sourcing (e.g., Fullola et al., 2008; P etillon, 2008; Corch on Rodríguez et al., 2009), and art style similarities (e.g., Sieveking, 1978; Bahn, 1982; Buisson et al., 1996; Fritz et al., 2007; Sauvet et al., 2008; Rivero and Sauvet, 2014). Ethnography shows that modern hunter-gatherers tend to create inter-group alliances as insurance against resource failure during times of climate change and resource insecurities (Wobst, 1974, 1977; Wiessner, 1982; Kelly, 1995, 2013; Whallon, 2006). The use of this specific type of social network has been suggested for the Mesolithic (Whallon, 2006), but remains to be studied for the Magdalenian. This article presents preliminary results from a research aimed to contextualize Magdalenian social networks, and here focuses on Cantabrian Lower Magdalenian (c. 20e17.5 cal ka BP) social net- works visible through portable art similarities. The main point of this article is not to reconstruct the entire social networks of the Cantabrian Lower Magdalenian, but rather to recreate their social, geographical, and environmental contexts to better classify and interpret them. As ethnographic studies show that stylized non- utilitarian objects are often exchanged to create and maintain E-mail address: [email protected]. Contents lists available at ScienceDirect Quaternary International journal homepage: www.elsevier.com/locate/quaint http://dx.doi.org/10.1016/j.quaint.2015.08.029 1040-6182/© 2015 Elsevier Ltd and INQUA. All rights reserved. Quaternary International xxx (2015) 1e12 Please cite this article in press as: Gravel-Miguel, C., Using Species Distribution Modeling to contextualize Lower Magdalenian social networks visible through portable art stylistic similarities in the Cantabrian region (Spain), Quaternary International (2015), http://dx.doi.org/10.1016/ j.quaint.2015.08.029

Welcome message from author
This document is posted to help you gain knowledge. Please leave a comment to let me know what you think about it! Share it to your friends and learn new things together.
Transcript

Using Species Distribution Modeling to contextualize LowerMagdalenian social networks visible through portable art stylisticsimilarities in the Cantabrian region (Spain)
Claudine Gravel-MiguelSchool of Human Evolution and Social Change, Arizona State University, P.O. Box 872402, Tempe, AZ 85287-2402, USA
a r t i c l e i n f o
Article history:Available online xxx
Keywords:Cantabrian regionLower MagdalenianSocial networksPortable art objectsSpecies Distribution ModelingGIS
a b s t r a c t
This research argues for a refocus of the study of prehistoric social networks that involves contextualizingthe inter-site links that are often interpreted as indicators of inter-site social interactions. It focuses onthe social networks created during the Lower Magdalenian of the Cantabrian region (Spain), and visiblethrough similarities of portable art representations. It uses Species Distribution Modeling and MaximumClassification Likelihood on faunal presence data to reconstruct prehistoric biomes, and contextualize thenetworks reconstructed through the art analysis. It demonstrates the potential of mapping the recreatednetworks onto the reconstructed biomes and of identifying the linked sites' foraging and minimal bandterritories to distinguish between local mobility movement and inter-group social alliances. The resultsshow that, during the Lower Magdalenian, the majority of movements seen through artistic similaritiesprobably represent the seasonal mobility of one or two hunter-gatherer groups, and that only a few inter-site links represent social networks used to exchange mates and gather information.
© 2015 Elsevier Ltd and INQUA. All rights reserved.
1. Introduction
1.1. Cantabrian Lower Magdalenian
The Magdalenian (c. 20e14 cal ka BP) follows the Last GlacialMaximum (LGM) and is characterized by an overall increase intemperature with high frequency and high amplitude climatevariation (McCabe et al., 1998; Ahn, 2012). Through its temporalrange and geographical distribution, the Magdalenian remained acoherent culture (Aura et al., 2012; Otte, 2012), as groups of hunter-gatherers aggregated into temperate refugia during the LGM(Jochim, 1987; Clark et al., 1996) only to re-colonize high-altitudeand high-latitude regions during the following Interstadial (Clottes,1989; Schwendler, 2004; Langlais et al., 2009; Miller, 2012; Strauset al., 2012). Research on the Magdalenian of France and Spainhave demonstrated the existence of local and long-distance socialcontacts within and between these regions through the study of
marine shell distribution (e.g., Taborin, 1993; !Alvarez-Fern!andez,2002, 2006, 2009), raw material sourcing (e.g., Fullola et al.,2008; P!etillon, 2008; Corch!on Rodríguez et al., 2009), and artstyle similarities (e.g., Sieveking, 1978; Bahn, 1982; Buisson et al.,1996; Fritz et al., 2007; Sauvet et al., 2008; Rivero and Sauvet,2014). Ethnography shows that modern hunter-gatherers tend tocreate inter-group alliances as insurance against resource failureduring times of climate change and resource insecurities (Wobst,1974, 1977; Wiessner, 1982; Kelly, 1995, 2013; Whallon, 2006).The use of this specific type of social network has been suggestedfor the Mesolithic (Whallon, 2006), but remains to be studied forthe Magdalenian.
This article presents preliminary results from a research aimedto contextualize Magdalenian social networks, and here focuses onCantabrian Lower Magdalenian (c. 20e17.5 cal ka BP) social net-works visible through portable art similarities. The main point ofthis article is not to reconstruct the entire social networks of theCantabrian Lower Magdalenian, but rather to recreate their social,geographical, and environmental contexts to better classify andinterpret them. As ethnographic studies show that stylized non-utilitarian objects are often exchanged to create and maintain
E-mail address: [email protected].
Contents lists available at ScienceDirect
Quaternary International
journal homepage: www.elsevier .com/locate/quaint
http://dx.doi.org/10.1016/j.quaint.2015.08.0291040-6182/© 2015 Elsevier Ltd and INQUA. All rights reserved.
Quaternary International xxx (2015) 1e12
Please cite this article in press as: Gravel-Miguel, C., Using Species Distribution Modeling to contextualize Lower Magdalenian social networksvisible through portable art stylistic similarities in the Cantabrian region (Spain), Quaternary International (2015), http://dx.doi.org/10.1016/j.quaint.2015.08.029

inter-group social networks (McCarthy, 1939; Mulvaney, 1976;Wobst, 1977; Wiessner, 1983; Hayden, 1987), this study followsthe formal methods used by Buisson et al. (1996), Fortea et al.(2004), Pigeaud (2007), and Rivero and Sauvet (2014) to analyzethe formal attributes of certain portable art representations and usestylistic similarities found between representations as a proxy forthe presence of social network. Going beyond previous studies onportable art similarities, this research then demonstrates the ben-efits of contextualizing the reconstructed social networks to betterunderstand their meaning.
1.2. Species Distribution Modeling
Anthropological and ethnographic research has shown the in-fluence of climate and resource distribution on the lifestyle ofhunter-gatherers (e.g., Dyson-Hudson and Smith, 1978; Binford,1980: Kelly, 1995, 2013). As a result, an increasing number of ar-chaeologists have attempted to reconstruct past environments tounderstand behaviors in their general context (e.g., van Andel, 2002;Corch!on et al., 2008; Marean, 2010). The traditional way to recon-struct past environments, using proxies for environmental data (e.g.,pollen, fauna, speleothems) in archaeological sites (e.g., Marín, 2004;Sommer and Nadachowski, 2006; Bar-Matthews et al., 2010; Laineet al., 2010) is an efficient way to reconstruct the past. However, thistraditional method is spatially restricted by its focus on individualsites, and thus cannot efficiently predict past regional environments.The recent introduction of predictivemodels (Verhagen andWhitley,2012) provides an alternative to produce more comprehensivepaleoenvironmental reconstructions.
In the past few decades, Species Distribution Modeling (SDM,also called Ecological or Niche Modeling) have gained in popu-larity in ecological disciplines, following the increase incomputing power that allowed for increasingly accurate pre-dictions (Franklin et al., 2015). For the most part, SDM use pres-ence observations of a given species as the dependent variableand its environmental context as the independent variable topredict the probabilities of finding this species in places where ithas not been observed (Franklin, 1995; Guisan and Thuiller, 2005;Elith et al., 2006; Elith and Leathwick, 2009). Despite theirinfrequent use in archaeology, SDM are valuable tools to recon-struct spatial probability distributions of prehistoric species(Politis et al., 2011). Lately, high-resolution Global Climate Models(GCM) outputs have allowed a handful of archaeologists tocontextualize certain prehistoric behavioral patterns, by projec-ting modern specieseclimate correlations onto past climaticconditions (e.g. Banks et al., 2008, 2009, 2013; Politis et al., 2011;Hufford et al., 2012; Moriondo et al., 2013). Despite having greatpotential for the study of social networks in prehistory, thismethod has not yet been applied to this field of study. Thisresearch is thus the first to contextualize Lower Magdaleniansocial networks with the use of SDM.
2. Materials and methods
The following research is divided into two parts. The first is astudy of portable art objects' stylistic similarities to reconstruct partof the Lower Magdalenian social networks. For this study, the focusis placed on engraved pieces of bones and stones with recognizablerepresentations of cervid and equid attributed to the LowerMagdalenian of the Cantabrian region. A literature review provideda sample of 41 representations on 32 artifacts from 7 sites. Table 1provides the list of representations studied. The second part entailsusing a Species Distribution Model on Lower Magdalenian faunaldata (Table 2) to contextualize the networks reconstructed in thefirst part.
As this research encompasses several visual aspects, a basemapof the geographical region has been created by combining a UnitedStates Geological Survey GMTED2010 Digital Elevation Model(DEM) to the ETOPO1 (Amante and Eakins, 2009) bathymetric map.The basemap created was smoothed to obtain a resolution of 90 mthroughout. The position of the Lower Magdalenian shore (!116 mbelow modern) is based on Peltier and Fairbanks (2006) researchon Quaternary sea level change. Fig.1 presents the basemap and thegeographical positions of all sites considered in this study (coded bydata type).
2.1. Statistical analysis of Lower Magdalenian art representations
Drawings of the representations were used to identify thepresence/absence of specific formal attributes, the majority ofwhich were established by previous work (e.g., Buisson et al., 1996;Fortea et al., 2004; Pigeaud, 2007; Rivero Vil!a, 2010; Rivero andSauvet, 2014) (Table 3). Cervid and equid representations werestatistically analyzed individually. As the presence/absence datawere recorded nominally, the Gower dissimilarity index wascalculated for each pair of representations. When computing thedissimilarity coefficient (0 being identical and 1 completelydifferent), all features were weighted equally to avoid subjectively
Table 1List of studied representations per artifact. The letters between parentheses next tothe site names indicate the shortened code for each site. The period acronym refersto the Lower Magdalenian (LM). The numbers below the two animal taxa providethe number of representations of each taxon per artifact. Reference key: 1. AlmagroBasch,1976; 2. Barandiar!an,1973; 3. Corch!on Rodríguez,1986; 4. Corch!on Rodríguez,2005; 5. Freeman and Gonz!alez Echegaray, 1982; 6. Freeman and Gonz!alezEchegaray, 2001; 7. Gomez Fuentes and Becares Perez, 1979; 8. Gonz!alez Moralesand Straus, 2009; 9. Gonz!alez Morales et al., 2007; 10. Men!endez Fern!andez,1997; 11. Men!endez Fern!andez and García S!anchez, 1999; 12. Men!endezFern!andez and Martínez Villa, 1992; 13. Men!endez Fern!andez et al., 2000; 14.Montes Bernardez, 1978; 15. Montes Barquin and Munoz Fernandez, 2001; 16.Moure-Romanillo, 1985; 17. Utrilla, 1979.
Site Number Period Cervids Equids References
El Castillo (E.Ca) 51/37/100/2/1 LM 2 1 1,3El Castillo (E.Ca) 51/37/100/2/2 LM 1 1,3,17El Castillo (E.Ca) 51/37/100/2/3 LM 2 1,3,17El Castillo (E.Ca) 51/37/100/2/4 LM 2 1 1,3,17El Castillo (E.Ca) 51/37/100/2/5 LM 1 1,2,3,17El Castillo (E.Ca) 51/37/100/2/6 LM 1 1,3,17El Castillo (E.Ca) 51/37/100/2/8 LM 1 1,3,17El Castillo (E.Ca) 51/37/100/2/9 LM 3 1,3,17El Castillo (E.Ca) 51/37/100/2/10 LM 1 1,3,17El Castillo (E.Ca) 51/37/100/2/11 LM 1 1,3,17El Castillo (E.Ca) 51/37/100/2/12 LM 1 1,3,17El Castillo (E.Ca) 51/37/100/2/13 LM 1 1,3,17El Castillo (E.Ca) 51/37/100/2/14 LM 1 1,3,17El Castillo (E.Ca) 51/37/100/2/16 LM 1 1,17El Castillo (E.Ca) 51/37/100/2/17 LM 1 1,17El Castillo (E.Ca) 51/37/100/2/19 LM 3 1,3,17El Castillo (E.Ca) 51/37/100/2/20 LM 1 1,3,17El Castillo (E.Ca) 51/37/100/2/21 LM 1 1,17Altamira (A) A2-12037 LM 1 2,3,6Altamira (A) AL.23 LM 1 2,3,6Altamira (A) CE04003 LM 1 2,3,6,14Altamira (A) CE04004 LM 1 2,3,6,14Altamira (A) CE47180 LM 1 UnpublishedAltamira (A) DO00004 LM 1 2,4,6,14El Cierro (E.Ci) EC.LM.1 LM 1 7El Juyo (EJ) CE57950 LM 1 3,5,16El Juyo (EJ) CE57952 LM 1 3,5,16El Miron (EM) 1981 LM 1 8,9El Miron (EM) EM.3 LM 1 9El Pendo (EP) 2.065 LM 1 15El Pendo (EP) 5904 LM 1 15Guelga (G) 02861 LM 3 10,11,12,13
C. Gravel-Miguel / Quaternary International xxx (2015) 1e122
Please cite this article in press as: Gravel-Miguel, C., Using Species Distribution Modeling to contextualize Lower Magdalenian social networksvisible through portable art stylistic similarities in the Cantabrian region (Spain), Quaternary International (2015), http://dx.doi.org/10.1016/j.quaint.2015.08.029

skewing the results. The threshold used to distinguish betweensimilar and dissimilar representations was obtained through a Z-score standardization of the dissimilarity indices. All pairwiserepresentations with a Z-score >1s had a dissimilarity coefficient<0.35. This was then refined through the subjective observations ofa few pairs of representations with 0.3125 dissimilarity coefficients(see Fig. 2). As those were not deemed similar enough to suggest
clear social contact between their makers, the dissimilaritythreshold was set to 0.30. Therefore, pairs of representations withdissimilarity indices<0.30were considered statistically similar. Thesimilarity links between sites were then visualized in GIS throughthe use of least-cost paths, which consider the topography betweentwo sites and identify the route with the lowest travel cost (Rees,2004). These inter-site links are assumed to represent possible
Table 2Faunal assemblages used for the biomes reconstruction. The period acronyms refer to the Lower Magdalenian (LM) and Archaic Magdalenian (AM) References key: 1. Altuna,1981; 2. Altuna, 1986; 3. Altuna, 1995; 4. Altuna and Mariezkurrena, 1996; 5. !Alvarez-Fern!andez, 2009; 6. Cabrera Vald!es, 1984; 7. Freeman and Gonz!alez Echegaray, 1995; 8.Gonz!alez Morales and Straus, 2009; 9. Janssens and Gonzalez Echegaray, 1958; 10. Landry and Burke, 2006; 11. Men!endez Fern!andez et al., 2005; 12. Moure Romanillo, 1979;13. Freeman et al., 1988; 14. Soto and Mel!endez Hevia, 1981; 15. Straus, 1977; 16. Straus, 1992; 17. Straus and Clark, 1986.
Site Layer Period Bos Capra Capreolus Cervus Equus Rangifer Rupicapra References
Altamira 2 LM X X X X 5,13,16Cueto de la Mina D LM X X X X 3,16Cueva el Rascano 3 LM X X X X X 1,16Cueva el Rascano 4 LM X X X X 1,16Cueva el Rascano 5 AM X X X X 1,16Ekain VII LM X X X X X X 4El Castillo B (8) LM X X X X X X X 6,10El Juyo 7 LM X X X X X 7,9,15,16El Juyo 8 LM X X X X X 16El Juyo 11 LM X 7,9,15El Miron Outer Vestibule 14 LM X X 8El Miron Outer Vestibule 15 LM X X 8El Miron Outer Vestibule 16 LM X X 8El Miron Outer Vestibule 17 LM X X 8Erralla V LM X X X X X X X 4Guelga Zone A, 3c LM X X X 11Guelga Zone C, contact 2e3 LM X X X 11La Paloma 8 LM X X X X X X X 16La Riera 17 AM X X X X 2,17La Riera 18 LM X X X 16La Riera 19 LM X X X X X 2,17La Riera 20 LM X X X X 2,17Las Caldas Sala II, XI LM X X X 14Las Caldas Sala II, XII LM X X X 14Las Caldas Sala II, XIII LM X X 14Santimamine VII LM X X X X X X X 4Tito Bustillo 2 LM X X X X X 16Tito Bustillo 1a LM X X X X X X 12,16Urtiaga F LM X X X X X X X 4
Fig. 1. Geographic location of the sites used in this research. Legend: 1. Las Caldas, 2. Guelga, 3. El Cierro, 4. Tito Bustillo, 5. Cueto de la Mina and La Riera, 6. Balmori, 7. La Paloma, 8.Altamira, 9. El Castillo, 10. El Juyo, 11. El Pendo, 12. Cueva el Rascano, 13. El Miron, 14. Santimamine, 15. Urtiaga, 16. Ekain, 17. Erralla.
C. Gravel-Miguel / Quaternary International xxx (2015) 1e12 3
Please cite this article in press as: Gravel-Miguel, C., Using Species Distribution Modeling to contextualize Lower Magdalenian social networksvisible through portable art stylistic similarities in the Cantabrian region (Spain), Quaternary International (2015), http://dx.doi.org/10.1016/j.quaint.2015.08.029

inter-site social contacts leading to similarities in artistic stylethrough cultural transmission. These reconstructed social networkswere then placed in their geographical and environmental contextsusing Species Distribution Modeling.
2.2. Reconstructing the distribution of Lower Magdalenian biomes
Presence data on seven animal taxa were collected through aliterature review of archaeological assemblages dated to the LowerMagdalenian of the Cantabrian region (Table 2). The focus wasplaced on the presence of ungulates due to their importance inUpper Paleolithic hunter-gatherers' diet (Marín Arroyo, 2013). Forsites withmultiple LowerMagdalenian layers, a taxonwas assumedto have been present as long as it was found in one layer (e.g. Bos inLa Riera). Multiple faunal assemblages found in a single site wereaggregated into one palimpsest, thus producing a total of 15 as-semblages to use for the biomes reconstruction.
As Lower Magdalenian sites were preferentially located mid-slope of major river valleys (Garcia, 2013), the environmentalcharacteristics associated with the faunal assemblages foundtherein were roughly similar, and did not represent the variety of
environments found around each site. Therefore, using the exactcoordinates of the sites to reconstruct the distribution of prehistoricspecies was problematic, as it did not account for the fact that mostfauna were hunted elsewhere, and thus, that the environmental
characteristics of a particular species' habitat might have differedfrom the characteristics of the sitewhere its remains were found. Inorder to correct for this bias, it was assumed that all faunal remainscame from the catchment area surrounding the site in which theywere found, which, according to modern ethnographic studies(Binford, 1980; Kelly, 1995, 2013) and recent archaeologicalresearch (Marín Arroyo, 2009), would have covered a radius ofroughly 10 km (2 h walking time). In the GIS GRASS, r.walk wasused to create buffers representing the terrain covered by 2 h ofwalking time around each site, to represent the realistic catchmentarea that would have been accessible in different parts of theCantabrian mountainous coast. This algorithm used the defaultwalking cost values based on Naismith's rule on walking time(Aitken, 1977; Langmuir, 1984). In each of those buffers, 5 randompoints were created, each of which took the faunal values of thebuffer's central site (Fig. 3). The arbitrary number of random points
Table 3List of formal features evaluated for each art representation.
Taxon Features Possible answers
All Technique Bas relief Champ-lev!e Contour d!ecoup!e Engraving SculptureOutline Single line Multiple lines Hatching MixTraits Anatomical Angular Rounded
Bovid Hump Dots Hatching Hatched lines NoneDemarcation hump Linear Hatching AbsentEar Detailed Simple AbsentHorns 1 Simple curved 2 Double curved 1 Simple curved 2 Double curvedForelock Dots Hatching Hatched lines NoneEye Punctiform Oval/round Double Schematic AbsentLacrimal caruncle Present AbsentArch below the eye Present AbsentNostril Detailed Simple AbsentBeard Present AbsentFace muscles Present AbsentFacial coat Present AbsentLegs Unfinished Pointy AnatomicalTail Short Long AbsentBody muscles Present AbsentBody coat Present Absent
Cervid Antlers Detailed Simple AbsentEar Detailed Simple AbsentEye Punctiform Oval/round Double Schematic AbsentLacrimal caruncle Present AbsentArch below the eye Present AbsentNostril Detailed Simple AbsentLips Detailed Simple AbsentFace muscles Present AbsentFacial coat Present AbsentLegs Unfinished Pointy AnatomicalTail Simple linear Double linear Multiple linear Double pointyBody muscles Present AbsentBody coat Present Absent
Equid Mane Single linear Single hatching Single mixed Double linear Double hatching Double mixedEar Detailed Simple AbsentForelock Present AbsentEye Punctiform Oval/round Double Schematic AbsentLacrimal caruncle Present AbsentArch below the eye Present AbsentNostril Detailed Simple AbsentLips Detailed Simple AbsentFace muscles Present AbsentFacial coat Present AbsentLegs Unfinished Pointy AnatomicalTail Simple linear Double linear Multiple linear Double pointyBody muscles Present AbsentBody coat Present Absent
C. Gravel-Miguel / Quaternary International xxx (2015) 1e124
Please cite this article in press as: Gravel-Miguel, C., Using Species Distribution Modeling to contextualize Lower Magdalenian social networksvisible through portable art stylistic similarities in the Cantabrian region (Spain), Quaternary International (2015), http://dx.doi.org/10.1016/j.quaint.2015.08.029

(5) was set to avoid over-representing the regions nearest the siteswhile including potential areas where the species might have lived.This created 75 random training points, each with their presence/absence faunal data.
The SDM MaxEnt (Phillips et al., 2006) was used to evaluate theclimatic context associated to the presence data of the 75 randompoints in order to create probabilistic distribution maps. The choiceof MaxEnt was based on Elith et al. (2006) comparative study, inwhich it was ranked amongst the easiest SDM toworkwith, and themost accurate. MaxEnt evaluates a given species' geographicaldistribution (presence data) in terms of its climatic context (climatemaps), and produces a distribution map of presence probability,which identifies the spatial extent of the species' suitable condi-tions (Politis et al., 2011). As its algorithm evaluates multiple points,it reduces the impact of individual points representing specializedhunting sites (such as La Paloma, Ekain, and El Rascano) that mightskew the results (asmentioned in Altuna andMariezkurrena,1996).
The set of climatemaps used for this researchwas obtained fromWorldClim (www.worldclim.org), which provides sets of prehis-toric maps for both LGM and mid-Holocene. Due to the dates of theLower Magdalenian, the LGM data was deemed more appropriatefor this research. The chosen set included 20 bioclimatic mapsdownscaled from the CCSM4 model to 30 arc-seconds (900 m)resolution maps (Hijmans et al., 2005). Given their coarse resolu-tion, each bioclimatic map was interpolated, using lanczos-f inGRASS, to create 90 m resolution maps that would allowMaxEnt tocreate precise species distributions of the same resolution as thebasemap. Following Franklin et al. (2015) argument, a DEMwas notincluded in the model, as its effect was already accounted for in thebioclimatic maps produced by the GCM. However, a slope map ofthe region was included to evaluate its effects on the speciesdistributions.
A test run of MaxEnt was done for each of the seven taxa toevaluate the impact of each bioclimatic variable on the predictedspecies distributions. For this run, the default parameter values
were kept, and a jackknife test was performed. This test runs thealgorithm multiple times, excluding each variable in turn and thenusing each individually to calculate its effect on the predicted dis-tributions. To follow Franklin et al. (2015) recommendation that allmodels should be tested with empirical data, the distributionscreated byMaxEnt were tested against the real presence data of the15 archaeological assemblages. The results of the jackknife tests forall species (Fig. 4) suggest that all bioclimatic maps contribute tothe accuracy of the distribution, whereas the slope map decreasesit. The slope map was thus removed from the set used in the sub-sequent run. The Area Under Curve (AUC), a measure of the model'sability to discriminate between sites where the species is presentand sites where it is absent (Hanley and McNeil, 1982), wasobserved for each species. All values were satisfying (Table 4),which demonstrated the validity of using the 75 random points astraining data to reconstruct realistic and accurate speciesdistributions.
Following the test run, the model was run again for the sevenspecies; however, here, the cross-validation setting was used for10 replications; therefore, for each species, 10 different runs weredone with 10 different subsets of the 75 training points used forresults validation, thus using all points as training and testingdata. MaxEnt summarized the results of the multiple distributionsin 5 outputs: 1. Average distribution, 2. Median distribution, 3.Minimum distribution, 4. Maximum distribution, and 5. Standarddeviation of the distributions. Following Politis et al. (2011), these
Fig. 2. Example of the subjective pairwise comparisons used to identify the dissimilarity threshold. The Gower dissimilarity coefficients are found next to the lines betweenrepresentations, and show that similar styles are better reflected by coefficients below 0.30. Drawings reproduced from Men!endez Fern!andez, 1997 (C-G-3) and Corch!on Rodríguez,1986 (C-ECa-9 and C-ECa-20).
Table 4AUC values of the probability distributions created for each taxon. The AUC is ameasure of the model's ability to discriminate between sites where the species ispresent and sites where it is not (Hanley and McNeil, 1982).
Bos Capra Capreolus Cervus Equus Rangifer Rupicapra
AUC 0.975 0.973 0.980 0.971 0.972 0.974 0.964
C. Gravel-Miguel / Quaternary International xxx (2015) 1e12 5
Please cite this article in press as: Gravel-Miguel, C., Using Species Distribution Modeling to contextualize Lower Magdalenian social networksvisible through portable art stylistic similarities in the Cantabrian region (Spain), Quaternary International (2015), http://dx.doi.org/10.1016/j.quaint.2015.08.029

MaxEnt probability distributions (on a scale from 0 to 1) wereconverted into binary distributions (absence/presence) andcompared to the empirical Lower Magdalenian faunal data. The10th percentile training presence logistic threshold provided for
each taxon by the MaxEnt outputs was used to make the con-version. This test showed that the maximum probability distri-bution was the most accurate for all taxa (predicting accurately80.95% of all presence/absence data). Therefore, only the
Fig. 3. Steps followed to create the 5 random points (triangles in D) around the site of El Miron (circle). The legend in B represents the walking distance in seconds.
Fig. 4. Results of the Jackknife test for the probability distribution of Bos/Bison. The horizontal lines represent the prediction impact of each environmental variable onto the AreaUnder Curve (AUC on the x axis). The light blue line indicates howwell the test performed without the variable, and the dark blue howwell it did when using only this variable. AUCvalues over 0.75 are considered good predictors. (For interpretation of the references to colour in this figure legend, the reader is referred to the web version of this article.)
C. Gravel-Miguel / Quaternary International xxx (2015) 1e126
Please cite this article in press as: Gravel-Miguel, C., Using Species Distribution Modeling to contextualize Lower Magdalenian social networksvisible through portable art stylistic similarities in the Cantabrian region (Spain), Quaternary International (2015), http://dx.doi.org/10.1016/j.quaint.2015.08.029

maximum probability distribution maps were used for the sub-sequent step.
2.3. Maximum likelihood classification
As the goal of this part was to reconstruct general biomes ratherthan individual species' distributions, the maximum probabilitydistributionmaps of the seven taxawere statistically grouped usingthe GRASS tool i.cluster to perform an unsupervised maximumlikelihood classification with i.maxlik. This allowed smoothing outany irregularities found in the individual distribution maps thatmight have occurred because of site specialization or taphonomicalprocesses (as mentioned in de los Terreros and Castanedo, 2010).The cluster tool implemented a maximum of 30 iterations with 98%convergence and 0 cluster separation. In order to avoid creatingarbitrary clusters, this was run four times for different initial clusternumbers (2, 4, 6, and 8). The output of i.cluster shows that the runmade for 6 initial clusters was the most stable (98.37% points sta-ble). This was the cluster signature used in the final maximumlikelihood classification, which produced a distribution map ofthese clusters. A 3 km buffer along the coast was added to this mapas a separate biome to reflect the difference between inland andcoastal resources.
3. Results
3.1. Lower Magdalenian social networks reconstructed throughportable art stylistic similarity
Table 5 provides the count of similar representations of bothtaxa per pairs of sites, which is plotted against inter-site distance inFig. 5. Although this relationship does not follow a strong linearregression, there is a certain correlation between the number ofsimilar representations and geographical distance; the number ofsimilar representations is higher between closely located sites thanbetween distant ones. One could interpret this as suggesting thatthe social networks created during the Lower Magdalenian weremostly local. However, when analyzed within their social context,the inter-site links of similar representations present a morecomplex and interesting picture. Fig. 6 presents visually the resultsof the statistical analysis of portable art stylistic similarities. Thewidth of the inter-sites lines represents the number of statistically
similar representation pairs between sites, while the white andgrey areas around each site represent their 9 h (minimal band area)and 2 h (catchment area) walking buffers, respectively.
The results of the statistical analysis of engraved equids (Fig. 6a)show that most representations differ significantly inter- and intra-site. Only the similarity of pair E.EP.1-E.ECa.3 proves to be statisti-cally significant (Gower ¼ 0.18), which might be explained by thefact that those two representations are the only ones with missingheads due to breakage. However, even if we would consider theseto be similar enough to infer the presence of social contact, theirsites of discovery are within the same minimal band territory(white area), which suggests that their makers might have beenfrom the same band. Therefore, the results of the equid represen-tations' analysis cannot be used to infer the presence of socialnetworks in the Lower Magdalenian of the Cantabrian region.
Fortunately, the higher number of mostly complete cervid rep-resentations allows us to look at possible social networks. In Fig. 6b,one can see that most of the inter-site links remain in the sameminimal band area, with only a few going beyond (the links be-tween El Cierro and El Castillo, and between El Miron and El Cas-tillo, El Pendo and Altamira). Some of these short-distance links arefound between sites with overlapping catchment areas. This sug-gests that one or a fewmakers from a single minimal band probablymade the majority of the similar cervid representations. Theserepresentations might have been done over multiple generations ofthe same band and transported to the different sites occupiedduring the band's seasonal movements. This interpretation issupported by previous research done on the Magdalenian fauna ofthe Cantabrian region, suggesting that hunter-gatherers movedseasonally between mountains and coast to use each region's sea-sonal resources (Sieveking, 1978; Straus, 1986; Straus et al., 2002;Marín Arroyo, 2009, 2013).
Fig. 6b also shows the presence of a few long-distance inter-siteslinks that go beyond the approximate boundaries of each site'sminimal band territory. These links, while less numerous than theintra-territory ones, still provide information on the social organi-zation of the Lower Magdalenian in the Cantabrian region, as theyimply the presence of social contact between groups that were notdirectly related to one another. Moreover, the location of the pathlinking El Cierro and El Castillo intersects with the site of Altamira,demonstrating its “central” location, and providing another supportto Conkey (1980) claim that it could have been used as an aggre-gation site.
3.2. Contextualization of inter-site links in their reconstructedbiomes
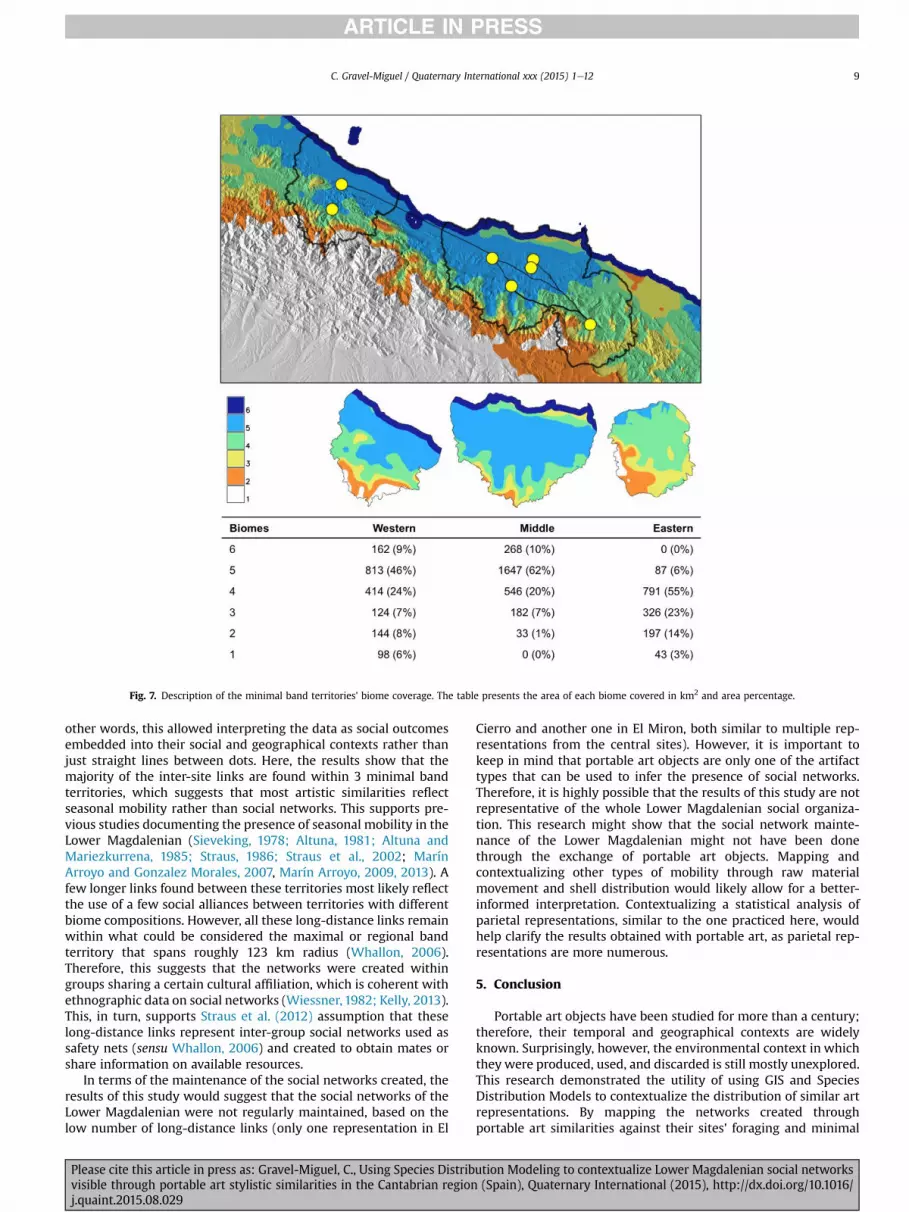
In an attempt to explain the presence of the long-distance linksand test the assumption that these reflect the creation of socialsafety nets to use in times of need, these links were positioned onthe biomes map (Fig. 7). This map presents the geographical dis-tribution of 6 regions with different species composition, andproduces an important visual support to previous research on
Fig. 5. Number of similar representations per site pairs plotted against their inter-sitedistance.
Table 5Count of similar representations per site pairs.
Altamira El Castillo El Cierro El Juyo El Miron
El Castillo 20El Cierro 0 6El Juyo 1 6 0El Miron 2 14 0 1El Pendo 1 2 0 0 0
C. Gravel-Miguel / Quaternary International xxx (2015) 1e12 7
Please cite this article in press as: Gravel-Miguel, C., Using Species Distribution Modeling to contextualize Lower Magdalenian social networksvisible through portable art stylistic similarities in the Cantabrian region (Spain), Quaternary International (2015), http://dx.doi.org/10.1016/j.quaint.2015.08.029

prehistoric fauna, which suggested the presence of different bi-omes following the flanks of the mountain range (Uzquiano, 1992;Marín, 2004; Marín Arroyo and Gonz!alez Morales, 2007).
Fig. 7 shows the main contextualization of the long-distanceinter-site links reconstructed in this research. Its embedded tabledemonstrates the area of each biome covered by each of the 3minimal band territories, which shows that all territories cover adifferent range of biomes. The statistical significance of those dif-ferences is confirmed by a X2 test (X2 <0.001) and Gower dissimi-larity coefficients computed for territory pairs (Table 6). Thissuggests that the long-distance links found between those terri-tories might in fact show the presence of social networks used assafety nets.
4. Discussion
4.1. Network contextualization
Recent archaeological studies have called for a better contex-tualization of archaeological sites and their record (e.g., Eriksen,1997; Garcia Moreno, 2008; Garcia Moreno and Fano Martinez,2011; Garcia, 2013). In an attempt to do so, this research is thefirst to contextualize the social networks that are so oftenmentioned in studies of portable art (e.g., Sieveking, 1978; Bahn,1982; Fritz, 1999; Fortea et al., 2004; Fritz et al., 2007; Sauvetet al., 2008; Rivero and Sauvet, 2014), but rarely interpreted intheir environmental context. Therefore, this article brings a newmethod to analyze and interpret these well-studied networks. Itcombines well-published and well-analyzed data on faunal as-semblages and portable art objects to provide information onwhere and why certain social networks were created in the LowerMagdalenian of the Cantabrian region.
In this research, the use of least-cost paths and walking buffershelped differentiate between the links that were most likely theresult of seasonal mobility of one or two single minimal bands(within the minimal band area), and the ones that might have beenthe result of social networks (beyond the minimal band area). In
Fig. 6. Networks derived for the two taxa represented, placed in their social context. A. Equids, and B. Cervids. The width of the inter-site least-cost path represents the number ofsimilar pairwise representations between two sites. The white area represents the 9 h walking buffer around each site (minimal band area), and the grey represents the 2 hcatchment area. Legend: 1. El Castillo, 2. El Pendo, 3. El Juyo, 4. El Cierro, 5. Guelga, 6. Altamira, 7. El Miron.
Table 6Gower dissimilarity coefficients comparing the biome content of the three minimalband territories. The number represents the coefficient of the Gower test on area(km2), while the number between parentheses is the coefficient of the test donewith the biomes' percentages of the whole area covered.
Eastern Middle
Middle 0.80 (0.92)Western 0.66 (0.74) 0.54 (0.34)
C. Gravel-Miguel / Quaternary International xxx (2015) 1e128
Please cite this article in press as: Gravel-Miguel, C., Using Species Distribution Modeling to contextualize Lower Magdalenian social networksvisible through portable art stylistic similarities in the Cantabrian region (Spain), Quaternary International (2015), http://dx.doi.org/10.1016/j.quaint.2015.08.029
other words, this allowed interpreting the data as social outcomesembedded into their social and geographical contexts rather thanjust straight lines between dots. Here, the results show that themajority of the inter-site links are found within 3 minimal bandterritories, which suggests that most artistic similarities reflectseasonal mobility rather than social networks. This supports pre-vious studies documenting the presence of seasonal mobility in theLower Magdalenian (Sieveking, 1978; Altuna, 1981; Altuna andMariezkurrena, 1985; Straus, 1986; Straus et al., 2002; MarínArroyo and Gonzalez Morales, 2007, Marín Arroyo, 2009, 2013). Afew longer links found between these territories most likely reflectthe use of a few social alliances between territories with differentbiome compositions. However, all these long-distance links remainwithin what could be considered the maximal or regional bandterritory that spans roughly 123 km radius (Whallon, 2006).Therefore, this suggests that the networks were created withingroups sharing a certain cultural affiliation, which is coherent withethnographic data on social networks (Wiessner, 1982; Kelly, 2013).This, in turn, supports Straus et al. (2012) assumption that theselong-distance links represent inter-group social networks used assafety nets (sensu Whallon, 2006) and created to obtain mates orshare information on available resources.
In terms of the maintenance of the social networks created, theresults of this study would suggest that the social networks of theLower Magdalenian were not regularly maintained, based on thelow number of long-distance links (only one representation in El
Cierro and another one in El Miron, both similar to multiple rep-resentations from the central sites). However, it is important tokeep in mind that portable art objects are only one of the artifacttypes that can be used to infer the presence of social networks.Therefore, it is highly possible that the results of this study are notrepresentative of the whole Lower Magdalenian social organiza-tion. This research might show that the social network mainte-nance of the Lower Magdalenian might not have been donethrough the exchange of portable art objects. Mapping andcontextualizing other types of mobility through raw materialmovement and shell distribution would likely allow for a better-informed interpretation. Contextualizing a statistical analysis ofparietal representations, similar to the one practiced here, wouldhelp clarify the results obtained with portable art, as parietal rep-resentations are more numerous.
5. Conclusion
Portable art objects have been studied for more than a century;therefore, their temporal and geographical contexts are widelyknown. Surprisingly, however, the environmental context in whichthey were produced, used, and discarded is still mostly unexplored.This research demonstrated the utility of using GIS and SpeciesDistribution Models to contextualize the distribution of similar artrepresentations. By mapping the networks created throughportable art similarities against their sites' foraging and minimal
Fig. 7. Description of the minimal band territories' biome coverage. The table presents the area of each biome covered in km2 and area percentage.
C. Gravel-Miguel / Quaternary International xxx (2015) 1e12 9
Please cite this article in press as: Gravel-Miguel, C., Using Species Distribution Modeling to contextualize Lower Magdalenian social networksvisible through portable art stylistic similarities in the Cantabrian region (Spain), Quaternary International (2015), http://dx.doi.org/10.1016/j.quaint.2015.08.029

band territories, this study showed that the majority of thosesimilarities probably represent the seasonal residential mobility ofonly one or two hunter-gatherer groups to obtain a variety of re-sources from different biomes.
This research argues for a refocus of the study of prehistoricsocial networks that involves a contextualization of inter-site linksto identify which most likely reflect inter-group social alliances,and focus on those when talking about social networks. Throughthis refocus, this study demonstrated that, despite the relativelyhigh number of inter-site links identified through similar artisticstyles, only a few were likely used as social safety nets during theLower Magdalenian. Therefore, this research contributes a newmethod to contextualize and better interpret the social networksreconstructed through studies of art similarities and raw materialmovement. Future work involves using this method on portable artobjects of the Middle and Upper Magdalenian of the Cantabrianregion to study the evolution of both seasonal mobility and socialnetworks over time, and in other regions to study the impact of thegeographical context on the networks' structure.
Acknowledgments
I would like to thank Dr. C. Michael Barton, Dr. Colin Wren, andmy colleagues Grant Snitker and Sean Bergin for their help on thisproject. I would also like to thank Dr. Carmen Cacho Quesada forinviting me to contribute to this issue. This research was conductedas part of my doctoral dissertation and was supported by the SocialScience and Humanities Research Council (Fellowship 752-2011-1015-A14) and a Doctoral Fellowship from the School of HumanEvolution and Social Change at Arizona State University (Tempe,USA).
References
Ahn, J., 2012. Abrupt climate change and atmospheric CO2 during the last glacialperiod. Quaternary International 279e280, 12.
Aitken, R., 1977. Wilderness Areas in Scotland (Unpublished thesis). University ofAberdeen, Aberdeen.
Almagro Basch, M., 1976. Los omoplatos decorados de la cueva de “El Castillo”.Puente Viesgo (Santander). Trabajos de Prehistoria 2, 9e99.
Altuna, J., 1981. Restos !oseos del yacimiento prehistorico del Rasca~no. In: Gonz!alezEchegaray, J., Barandiar!an, I. (Eds.), El Paleolítico superior de la Cueva delRasca~no (Santander), Ministerio de cultura, Santander, pp. 221e269.
Altuna, J., 1986. The mammalian faunas from the prehistoric site of La Riera. In:Straus, L.G., Clark, G.A. (Eds.), La Riera Cave. Stone Age Hunter-gatherer Adap-tations in Northern Spain. Arizona State University, Tempe, USA.
Altuna, J., 1995. Fauna de mamiferos y cambios ambientales durante el Tardiglacialcantabrico. In: Moure, A., Gonzalez Sainz, C. (Eds.), El Final del PaleoliticoCantabrico, Universidad de Cantabria, Santander, pp. 77e118.
Altuna, J., Mariezkurrena, K., 1985. Bases de subsistencia de los pobladores deErralla: Macromamíferos. Munibe (Antropología y Arqueología) 37, 87e117.
Altuna, J., Mariezkurrena, K., 1996. Faunes de mammif"eres des gisements Mag-dal!eniens du Pays Basque et zones limitrophes, in Pyr!en!ees Pr!ehistoriques, artset soci!et!es. In: Actes du 118e congr"es national des soci!et!es historiques et sci-entifiques, pp. 149e162.
!Alvarez-Fern!andez, E., 2002. Perforated Homalopoma sanguineum from Tito Bus-tillo (Asturias): mobility of Magdalenian groups in northern Spain. Antiquity 76,641e646.
!Alvarez-Fern!andez, E., 2006. Los Objetos de Adorno-Colgantes del Paleolítico Su-perior y del Mesolítico en la Cornisa Cant!abrica y en el Valle del Ebro: unaVisi!on Europea. Universidad de Salamanca, Salamanca. Unpublished thesis.
!Alvarez-Fern!andez, E., 2009. Magdalenian personal ornaments on the move: a re-view of the current evidence in Central Europe. Zephyrus LXIII, 45e59.
Amante, C., Eakins, B.W., 2009. ETOPO1 1 Arc-Minute Global Relief Model: Pro-cedures, Data Sources and Analysis. NOAA Technical Memorandum NESDISNGDC-24. National Geophysical Data Center, NOAA.
Aura, J.E., Tiffagom, M., Jord!a Pardo, J.F., Duarte, E., Fern!andez de la Vega, J.,Santamaria, D., de la Rasilla, M., Vadillo, M., Perez Ripoll, M., 2012. TheSolutrean-Magdalenian transition: a view from Iberia. Quaternary International272e273, 75e87.
Bahn, P.G., 1982. Inter-site and inter-regional links during the Upper Palaeolithic:the Pyrenean evidence. Oxford journal of Archaeology 1 (3), 247e268.
Banks, W.E., d'Errico, F., Peterson, A.T., Kageyama, M., Colombeau, G., 2008.Reconstructing ecological niches and geographic distributions of caribou
(Rangifer tarandus) and red deer (Cervus elaphus) during the last glacialmaximum. Quaternary Science Reviews 27, 2568e2575.
Banks, W.E., Zilh~ao, J., d'Errico, F., Kageyama, M., Sima, A., Ronchitelli, A., 2009.Investigating links between ecology and bifacial tool types in Western Europeduring the last glacial maximum. Journal of Archaeological Science 36,2853e2867.
Banks, W.E., Antunes, N., Rigaud, S., d'Errico, F., 2013. Ecological constraints on thefirst prehistoric farmers in Europe. Journal of Archaeological Science 40 (6),2746e2753.
Bar-Matthews, M., Marean, C.W., Jacobs, Z., Karkanas, P., Fischer, E.C., Herries, A.I.R.,Brown, K., Williams, H.M., Bernatchez, J., Ayalon, A., Nilssen, P.J., 2010. A highresolution and continuous isotopic speleothem record of paleoclimate andpaleoenvironment from 90 to 53 ka from Pinnacle Point on the south coast ofSouth Africa. Quaternary Science Reviews 29, 2131e2145.
Barandiar!an, I., 1973. Arte Mueble Del Paleolítico Cantabrico. Librería General,Zaragoza.
Binford, L.R., 1980. Willow smoke and dogs' tails: hunter-gatherer settlement sys-tems and archaeological site formation. American Antiquity 45 (1), 4e20.
Buisson, D., et al., 1996. Analyse formelle des contours d!ecoup!es de tetes de che-vaux: implications arch!eologiques. In: Pyr!en!ees Pr!ehistoriques. Arts et soci!et!es.Actes du 118e Congr"es national des Soci!et!es Historiques et Scientifiques, (Pau1993), pp. 327e340.
Cabrera Vald!es, V., 1984. El Yacimiento de la Cueva de “El Castillo” (Puente Viesgo,Santander). Consejo Superior de Investigaciones Científicas, Madrid.
Clark, G.A., Barton, C.M., Cohen, A., 1996. Explaining art in the Franco-Cantabrianrefugium: an information exchange model. In: Meyer, D.A., Dawson, P.C.,Hanna, D.T. (Eds.), Debating Complexity. Proceedings of the 26th AnnualChacmool Conference, the Archaeological Association of the University of Cal-gary, Calgary, Canada, pp. 241e253.
Clottes, J., 1989. Le Magdal!enien des Pyr!en!ees. In: Otte, M. (Ed.), Le Magdal!enien enEurope, “La Structuration du Magdal!enien”. Colloque de Mayence 1987. Uni-versit!e de Li"ege, Li"ege, pp. 281e357.
Conkey, M.W., 1980. The identification of prehistoric Hunter-Gatherer aggregationsites: the case of Altamira. Current anthropology 21 (5), 609e630.
Corch!on, M.S., Mateos Cachorro, A., !Alvarez-Fern!andez, E., Pe~nalver, E., Delcl"os, X.,van der Made, J., 2008. Ressources compl!ementaires et mobilit!e dans le Mag-dal!enien cantabrique. Nouvelles donn!ees sur les mammif"eres marins, lescrustac!es, les mollusques et les roches organog"enes de la Grotte de Las Caldas(Asturies, Espagne). L'Anthropologie 112, 284e327.
Corch!on Rodríguez, M.S., 1986. El Arte Paleolítico Cant!abrico: Contexto Y AnalisisInterno. Centro de investigaci!on y museo de Altamira, Monografias n.16. Min-isterio de cultura.
Corch!on Rodríguez, M.S., 2005. Europa 16500e14000 aC: Un lenguaje común. In:Arias, P., Ontanon, R. (Eds.), La Materia del Lenguaje Prehist!orico: El ArteMueble Paleolitico de Cantabria en su Contexto, Gobierno de Cantabria,Santander, pp. 105e126.
Corch!on Rodríguez, M.S., Tarri~no Vinagre, A., Martínez, J., 2009. Mobilit!e, territoireset relations culturelles au d!ebut du Magdal!enien moyen cantabrique: nouvellesperspectives. In: Djindjian, F., Kozlowski, J., Bicho, N. (Eds.), Le concept de ter-ritoires dans le Pal!eolithique sup!erieur europ!een, BAR International Series,pp. 217e230.
de los Terreros, J.Y.S., Castanedo, A.G., 2010. Estudio zooarqueol!ogico y tafon!omicodel yacimiento del Otero (Secadura, Voto, Cantabria). Espacio, tiempo y forma.Serie I, Prehistoria y arqueología 3, 21e38.
Dyson-Hudson, R., Smith, E.A., 1978. Human territoriality: an ecological reassess-ment. American anthropologist 80 (1), 21e41.
Elith, J., Leathwick, J.R., 2009. Species distribution models: ecological explanationand prediction across space and time. Annual Review of Ecology, Evolution, andSystematics 40 (1), 677.
Elith, J., Graham, C.H., Anderson, R.P., Dudík, M., Ferrier, S., Guisan, A., Hijmans, R.J.,Huettmann, F., Leathwick, J.R., Lehmann, A., Li, J., Lohmann, L.G., Loiselle, B.A.,Manion, G., Moritz, C., Nakamura, M., Nakazawa, Y., Overton, J. McC., TownsendPeterson, A., Phillips, S.J., Richardson, K., Scachetti-Pereira, R., Schapire, R.E.,Soberon, J., Williams, S., Wisz, M.S., Zimmermann, N.E., 2006. Novel methodsimprove prediction of species' distributions from occurrence data. Ecography29 (2), 129e151.
Eriksen, B.V., 1997. Settlement patterns, cave sites and locational decisions in LatePleistocene Central Europe. In: Bonsall, C., Tolan-Smith, C. (Eds.), The HumanUse of Caves. Archaeopress, Oxford, pp. 38e49.
Fortea, F.J., et al., 2004. La spirituali!e: actes du Colloque international de Li"ege(10e12 d!ecembre 2003), L'art pari!etal pal!eolithique "a l'!epreuve du style et ducarbone-14. Universit!e de Li"ege, Li"ege, pp. 163e175.
Franklin, J., 1995. Predictive vegetation mapping: geographic modelling of biospatialpatterns in relation to environmental gradients. Progress in Physical Geography19 (4), 474e499.
Franklin, J., Potts, A.J., Fisher, E.C., Cowling, R.M., Marean, C.W., 2015. Paleodis-tribution modeling in archaeology and paleoanthropology. Quaternary ScienceReviews 110, 1e14.
Freeman, L.G., Gonz!alez Echegaray, J., 1995. The Magdalenian site of El Juyo (Can-tabria, Spain): artistic documents in context. Bollettino del Centro Camuno diStudi Preistorici XXVIII, 25e42.
Freeman, L.G., Gonz!alez Echegaray, J., 2001. La Grotte D'Altamira. Maison desroches.
Freeman, L.G., Gonz!alez Echegaray, J., 1982. Magdalenian mobile art from El Juyo.Ars Praehistorica 1, 161e167.
C. Gravel-Miguel / Quaternary International xxx (2015) 1e1210
Please cite this article in press as: Gravel-Miguel, C., Using Species Distribution Modeling to contextualize Lower Magdalenian social networksvisible through portable art stylistic similarities in the Cantabrian region (Spain), Quaternary International (2015), http://dx.doi.org/10.1016/j.quaint.2015.08.029
Freeman, L.G., Gonz!alez Echegaray, J., Klein, R.G., Crowe, W.T., 1988. Dimensions ofresearch at El Juyo. An earlier Magdalenian site in Cantabrian Spain. In:Dibble, H.L., Montet-White, A. (Eds.), Upper Pleistocene Prehistory of WesternEurasia. University of Pennsylvania, Philadelphia, pp. 4e39.
Fritz, C., 1999. La Gravure Dans L'Art Mobilier Magdal!enien. Du Geste "A LaRepr!esentation. !Editions de la Maison des Sciences de l'Homme, Paris.
Fritz, C., Tosello, G., Sauvet, G., 2007. Groupes ethniques, territoires, !echanges: la“notion de fronti"ere” dans l'art magdal!enien. In: Cazals, N., Gonzalez Urquijo, J.,Terradas, X. (Eds.), Fronti"eres naturelles et fronti"eres culturelles dans lesPyr!en!ees Pr!ehistoriques (Tarascon-sur-Ari"ege 2004),, pp. 165e181.
Fullola, J.M., Mangado, X., Estrada, A., 2008. In: Gomez de Soto, J. (Ed.), Circulationdes mati"eres premi"eres lithiques et des coquillages dans le Pal!eolithiquesup!erieur du nord-est ib!erique. La notion de mobilit!e dans les soci!et!espr!ehistoriques, CTHS, Paris, pp. 57e66.
Garcia, A., 2013. GIS-based methodology for Palaeolithic site location preferencesanalysis. A case study from Late Palaeolithic Cantabria (Northern IberianPeninsula). Journal of Archaeological Science 40 (1), 217e226.
García Moreno, A., 2008. Insolaci!on y h!abitat paleolítico en el Valle del As!on(Cantabria, Espa~na). Cuaternario y geomorfología: Revista de la SociedadEspa~nola de Geomorfología y Asociaci!on Espa~nola para el Estudio del Cua-ternario 22 (3), 93e105.
Garcia Moreno, A., Fano, M.A., 2011. Los sitios paleolíticos en su paisaje: la Cueva deel Horno en el contexto de la cuenca del río As!on (Cantabria). Zephyrus 67,15e26.
Gomez Fuentes, A., Becares Perez, J., 1979. Un hueso grabado en la cueva de “ElCierro” (Ribadesella, Asturias). Separata del XV Congreso Nacional de Arqueo-logia 83e91.
Gonz!alez Morales, M.R., Straus, L.G., 2009. Extraordinary early Magdalenian findsfrom El Mir!on Cave, Cantabria (Spain). Antiquity 83, 267e281.
Gonz!alez Morales, M.R., Straus, L.G., Marín Arroyo, A.B., 2007. Los om!oplatos dec-orados magdalenienses de la Cueva del Mir!on (Ramales de la Victoria, Canta-bria) y su relaci!on con las Cueva del Castillo, Altamira y el Juyo. In: ManuelMaillo, J., Baquedano, E. (Eds.), Miscel!anea en Homenaje a Victoria Cabrera.Museo Arqueol!ogico Regional, Madrid, pp. 482e495.
Guisan, A., Thuiller, W., 2005. Predicting species distribution: offering more thansimple habitat models. Ecology letters 8 (9), 993e1009.
Hanley, J.A., McNeil, B.J., 1982. The meaning and use of the area under a receiveroperating characteristic (ROC) curve. Radiology 143 (1), 29e36.
Hayden, B., 1987. Alliances and ritual ecstasy: human responses to resource stress.Journal for the Scientific Study of Religion 26 (1), 81e91.
Hijmans, R.J., Cameron, S.E., Parra, J.L., Jones, P.G., Jarvis, A., 2005. Very high reso-lution interpolated climate surfaces for global land areas. International Journalof Climatology 25 (15), 1965e1978.
Hufford, M.B., Martínez-Meyer, E., Gaut, B.S., Eguiarte, L.E., Tenaillon, M.I., 2012.Inferences from the historical distribution of wild and domesticated maizeprovide ecological and evolutionary insight. PloS One 7 (11), e47659.
Janssens, P., Gonzalez Echegaray, J., 1958. Memoria De Las Excavaciones De La CuevaDel Juyo. Patronato de las Cuevas Prehistoricas, Santander.
Jochim, M.A., 1987. Late Pleistocene refugia in Europe. In: Soffer, O. (Ed.), ThePleistocene Old World. Regional Perspectives. Plenum Press, New York,pp. 317e332.
Kelly, R.L., 1995. The Foraging Spectrum, Diversity in Hunter-Gatherer Lifeways.Percheron Press, New York.
Kelly, R.L., 2013. The Lifeways of Hunter-gatherers: the Foraging Spectrum. Cam-bridge University Press, Cambridge.
Laine, A., Gauthier, E., Garcia, J.-P., Petit, C., Cruz, F., Richard, H., 2010. A three-thousand-year history of vegetation and human impact in Burgundy (France)reconstructed from pollen and non-pollen palynomophs analysis. ComptesRendus Biologies 333 (11e12), 850e857.
Landry, G., Burke, A., 2006. El Castillo: the Obermaier faunal collection. In: ManuelMaillo, J., Baquedano, E. (Eds.), Miscel!anea en homenaje a Victoria Cabrera, ZonaArqueol!ogica, vol. 7, pp. 104e113.
Langlais, M., P!etillon, J.-M., de Beaune-Romera, S., Cattelain, P., Chauvi"ere, F.-X.,Letourneux, C., Szmidt, C., Bellier, C., Beukens, R., David, F., 2009. Une occupa-tion de la fin du Dernier Maximum glaciaire dans les Pyr!en!ees: le Magdal!enieninf!erieur de la grotte des Scilles (Lespugues, Haute-Garonne). Bulletin de laSoci!et!e Pr!ehistorique Française 107 (1), 5e51.
Langmuir, E., 1984. Mountaincraft and Leadership. The Scottish Sports Council/MLTB, Cordee, Leicester.
Marean, C.W., 2010. Coastal South Africa and the co-evolution of the modern hu-man lineage and the coastal adaptation. In: Bicho, N., Haws, J.A., Davis, L.G.(Eds.), Trekking the Shore: Changing Coastlines and the Antiquity of CoastalSettlement. Springer, New York.
Marín, A.B., 2004. An!alisis arqueozool!ogico, tafon!omico y de distribuci!on espacialde la fauna de mamíferos de la Cueva de la Fragua (Santo~na, Cantabria). Munibe56, 19e44.
Marín Arroyo, A.B., 2009. The use of optimal foraging theory to estimate Late Glacialsite catchment areas from a central place: the case of eastern Cantabria, Spain.Journal of Anthropological Archaeology 28 (1), 27e36.
Marín Arroyo, A.B., 2013. Human response to Holocene warming on the CantabrianCoast (northern Spain): an unexpected outcome. Quaternary Science Reviews81, 1e11.
Marín Arroyo, A.B., Gonz!alez Morales, M.R., 2007. La Fragua Cave, a seasonalhunting camp in the lower As!on Valley (Cantabria, Spain) at the Pleistocene-Holocene transition. Anthropozoologica 41, 61e84.
McCabe, M., Knight, J., McCarron, S., 1998. Evidence for Heinrich event 1 in theBritish Isles. Journal of Quaternary Science 13 (6), 549e568.
McCarthy, F.D., 1939. “Trade” in Aboriginal Australia, and “Trade” relationships withTorres Strait, new Guinea and Malaya. Oceania 9 (4), 405e438.
Men!endez Fern!andez, M., 1997. Historiografía y novedades del arte mueble Paleo-lítico en la Península Ib!erica. Espacio Tiempo y Forma. Serie I. Prehistoria yArqueología 10, 129e173.
Men!endez Fern!andez, M., García S!anchez, E., 1999. XXIV Congreso Nacional deArqueología, La Cueva de la Güelga (Asturias): Arte mueble y territorialidad enel Magdaleniense cant!abrico. Instituto de Patrimonio Hist!orico, Cartagena,pp. 87e93.
Men!endez Fern!andez, M., Martínez Villa, A., 1992. Excavaciones arqueol!ogicas en lacueva de la Güelga, campa~nas de 1989e1990. Excavaciones Arqueol!ogicas enAsturias 2, 69e74.
Men!endez Fern!andez, M., García S!anchez, E., Quesada L!opez, J.M., 2000. El Paleo-lítico Superior en la cueva de La Güelga. Revista de arqueología 21 (230), 14e25.
Men!endez Fern!andez, M., García S!anchez, E., Quesada L!opez, M., 2005. Magdale-niense inferior y territorialidad en la Cueva de La Güelga (Asturias). In: Bicho, N.(Ed.), O Paleolítico: Actas do IV Congresso de Arqueologia Peninsular (Faro, 14 a19 de Setembro de 2004), Centro de Estudos de Patrim!onio, Algarve, pp. 63e75.
Miller, R., 2012. Mapping the expansion of the Northwest Magdalenian. QuaternaryInternational 272e273, 209e230.
Montes Barquin, R., Munoz Fernandez, E., 2001. Om!oplatos grabados de la cueva deEl Pendo (Escobedo de Camargo, Cantabria). Nivel Cero 9, 63e69.
Montes Bernardez, R., 1978. Los omoplatos grabados de la cueva de Altamira.Cuadernos de Prehistoria y Arqueología 5e6, 31e39.
Moriondo, M., Trombi, G., Ferrise, R., Brandani, G., Dibari, C., Ammann, C.M.,Lippi, M.M., Bindi, M., 2013. Olive trees as bio-indicators of climate evolution inthe Mediterranean Basin. Global Ecology and Biogeography 22 (7), 818e833.
Moure Romanillo, J.A., 1979. Le Magdal!enien sup!erieur de la grotte de Tito Bustillo(Asturies, Espagne). In: In de Sonneville-Bordes, D. (Ed.), La Fin des TempsGlaciaires en Europe. Chronostratigraphie et !Ecologie des Cultures duPal!eolithique Final. !Editions du Centre National de la Recherche Scientifique,Paris, pp. 737e743.
Moure-Romanillo, J.A., 1985. Nouveaut!es dans l'art mobilier figuratif duPal!eolithique cantabrique. Pr!ehistoire Ari!egeoise. Bulletin de la Soci!et!ePr!ehistorique de l'Ari"ege Tarascon-sur-Ari"ege 40, 99e130.
Mulvaney, D.J., 1976. ‘The chain of connection’: the material evidence. In:Peterson, N. (Ed.), Tribes and Boundaries in Australia. Humanities Press, AtlanticHighlands, New Jersey, pp. 72e94.
Otte, M., 2012. Appearance, expansion and dilution of the Magdalenian civilization.Quaternary International 272e273, 354e361.
Peltier, W.R., Fairbanks, R.G., 2006. Global glacial ice volume and last glacialmaximum duration from an extended Barbados sea level record. QuaternaryScience Reviews 25, 3322e3337.
P!etillon, J.-M., 2008. First evidence of a whale bone industry in the western Euro-pean Upper Paleolithic: Magdalenian artifacts from Isturitz (Pyr!en!ees-Atlan-tiques, France). Journal of Human Evolution 54 (5), 720e726.
Phillips, S.J., Anderson, R.P., Schapire, R.E., 2006. Maximum entropy modeling ofspecies geographic distributions. Ecological Modelling 190 (3e4), 231e259.
Pigeaud, R., 2007. Determining style in Palaeolithic cave art: a new method derivedfrom horse images. Antiquity 81 (312), 409e422.
Politis, G.G., Prates, L., Merino, M.L., Tognelli, M.F., 2011. Distribution parameters ofguanaco (Lama guanicoe), pampas deer (Ozotoceros bezoarticus) and marshdeer (Blastocerus dichotomus) in Central Argentina: archaeological and paleo-environmental implications. Journal of Archaeological Science 38 (7),1405e1416.
Rees, W.G., 2004. Least-cost paths in mountainous terrain. Computers & Geo-sciences 30 (3), 203e209.
Rivero, O., Sauvet, G., 2014. Defining Magdalenian cultural groups in Franco-Cantabria by the formal analysis of portable artworks. Antiquity 88, 64e80.
Rivero Vil!a, O., 2010. La movilidad de los grupos humanos en el Magdaleniense de laRegi!on Cant!abrica y los Pirineos: una visi!on a trav!es del arte. Universidad deSalamanca, Salamanca (Unpublished thesis).
Sauvet, G., Fortea, J., Fritz, C., Tosello, G., 2008. Echanges culturels entre groupeshumains pal!eolithiques entre 20.000 et 12.000 BP. Pr!ehistoire, art et soci!et!es:bulletin de la Soci!et!e Pr!ehistorique de l'Ari"ege 63, 73e92.
Schwendler, R.H., 2004. Hunter-Gatherer Social Interactions in MagdalenianWestern Europe. University of New Mexico, Albuquerque (Unpublished thesis).
Sieveking, A.G., 1978. La significacion de las distribuciones en el Arte Paleolitico.Trabajos de prehistoria 35 (1), 61e80.
Sommer, R.S., Nadachowski, A., 2006. Glacial refugia of mammals in Europe: evi-dence from fossil records. Mammal Review 36 (4), 251e265.
Soto, E., Mel!endez Hevia, G., 1981. Fauna de la cueva de Las Caldas (Oviedo). In:Corch!on Rodríguez, M.S. (Ed.), Cueva de Las Caldas. San Juan de Priorio(Oviedo). Imprenta del Ministerio de cultura, Spain.
Straus, L.G., 1977. Of Deer Slayers and Mountain Men: Paleolithic Faunal Exploita-tion in Cantabrian Spain. In: Binford, L.R. (Ed.), For Theory Building inArchaeology. Academic Press, New York, pp. 41e76.
Straus, L.G., 1986. Late Würm adaptive systems in Cantabrian Spain: the case ofEastern Asturias. Journal of Anthropological Archaeology 5, 330e368.
Straus, L.G., 1992. Iberia Before the Iberians: the Stone Age Prehistory of CantabrianSpain. University of New Mexico Press, Albuquerque.
Straus, L.G., Clark, G.A., 1986. La Riera Cave: Stone Age Hunter-gatherer Adaptationsin Northern Spain. Arizona State University, Tempe, Arizona.
C. Gravel-Miguel / Quaternary International xxx (2015) 1e12 11
Please cite this article in press as: Gravel-Miguel, C., Using Species Distribution Modeling to contextualize Lower Magdalenian social networksvisible through portable art stylistic similarities in the Cantabrian region (Spain), Quaternary International (2015), http://dx.doi.org/10.1016/j.quaint.2015.08.029
Straus, L.G., Gonz!alez Morales, M.R., Martinez, M.F., Garcia-Gelabert, M.A.P., 2002.Last glacial human settlement in eastern Cantabria (Northern Spain). Journal ofArchaeological Science 29 (12), 1403e1414.
Straus, L.G., Leesch, D., Terberger, T., 2012. The Magdalenian settlement of Europe:an introduction. Quaternary International 272e273, 1e5.
Taborin, Y., 1993. La Parure En Coquillage Au Pal!eolithique. CNRS !Editions, Paris.Utrilla, P., 1979. Acerca de la posicion estratigrafica de los cervidos y otros animales
de trazo multiple en el Paleolitico superior espanol. Caesaraugusta 49e50,65e72.
Uzquiano, P., 1992. The late glacial/postglacial transition in the Cantabrian Cordil-lera (Asturias and Cantabria, Spain) based on charcoal analysis. Palaios540e547.
van Andel, T.H., 2002. Reconstructing climate and landscape of the middle partof the last glaciation in Europe e the stage 3 project. Quaternary Research57, 2e8.
Verhagen, P., Whitley, T.G., 2012. Integrating archaeological theory and predictivemodeling: a live report from the scene. Journal of Archaeological Method andTheory 19 (1), 49e100.
Whallon, R., 2006. Social networks and information: non-“utilitarian” mobilityamong hunter-gatherers. Journal of Anthropological Archaeology 25, 259e270.
Wiessner, P., 1982. Risk, reciprocity and social influences on! Kung San economics.In: Leacock, E., Lee, R. (Eds.), Politics and History in Band Societies. CambridgeUniversity Press, Cambridge, pp. 61e84.
Wiessner, P., 1983. Style and social information in Kalahari San projectile points.American Antiquity 48 (2), 253e276.
Wobst, H.M., 1974. Boundary conditions for Paleolithic social systems: a simulationapproach. American Antiquity 39 (2), 147e178.
Wobst, H.M., 1977. Stylistic behavior and information exchange. In: Cleland, E.H.(Ed.), For the Director: Research Essays in Honor of James B. Griffin, Museum ofAnthropology. University of Michigan Ann Arbor, Ann Arbor, pp. 317e342.
C. Gravel-Miguel / Quaternary International xxx (2015) 1e1212
Please cite this article in press as: Gravel-Miguel, C., Using Species Distribution Modeling to contextualize Lower Magdalenian social networksvisible through portable art stylistic similarities in the Cantabrian region (Spain), Quaternary International (2015), http://dx.doi.org/10.1016/j.quaint.2015.08.029
Related Documents