CALIFORNIA STATE UNIVERSITY, NORTHRIDGE The Pizza Map: Using Social Media, Crowd-Sourcing, & Web-Based Mapping to Analyze Regional Pizza Preferences in the United States A thesis submitted in partial fulfillment of the requirements for the degree of Master of Arts in Geography, GIS Program By Mark F. Turgeon December 2013

Welcome message from author
This document is posted to help you gain knowledge. Please leave a comment to let me know what you think about it! Share it to your friends and learn new things together.
Transcript

CALIFORNIA STATE UNIVERSITY, NORTHRIDGE
The Pizza Map: Using Social Media, Crowd-Sourcing, & Web-Based Mapping to
Analyze Regional Pizza Preferences in the United States
A thesis submitted in partial fulfillment of the requirements
for the degree of Master of Arts in Geography,
GIS Program
By
Mark F. Turgeon
December 2013

ii
The thesis of Mark F. Turgeon is approved:
_________________________________ __________________
Dr. Regan Maas Date
__________________________________ __________________
Dr. Soheil Boroushaki Date
__________________________________ __________________
Dr. Steven Graves, Chair Date
California State University, Northridge

iii
Acknowledgements
This thesis would not be possible without the guidance and support of many
individuals. Thank you to my family, friends, classmates, CSUN Geography Faculty and
everyone else that contributed in making Geography of Pizza a reality.
First, I would like to express my deepest appreciation to my committee chair, Dr.
Steve Graves, who really understood my love and passion for pizza and encouraged me
to write this. I would also like to thank my other members, Dr. Regan Maas, and Dr.
Soheil Boroushaki for their guidance and support in learning new GIS applications and
tools such as Python scripting and Web-Based mapping design. These applications and
tools were very essential to have an online presence.
I would also like to thank Chad March, Geoffrey West, and many other GIS
classmates for their support along the way. Also, a big shout out to all the faculty and
geography students from departments across the United States, that participated and
contributed VGI data through the survey.
Above all, I would like to thank my amazing wife Sara for all of her love, support,
patience, encouragement, and pizza opinions. I am completely grateful.

iv
TABLE OF CONTENTS
Signature Page.....................................................................................................................ii
Dedication...........................................................................................................................iii
List of Tables......................................................................................................................vi
List of Figures....................................................................................................................vii
Abstract.............................................................................................................................viii
Chapter 1 - Introduction.......................................................................................................1
Chapter 2 - Background.......................................................................................................3
2.1. Origin of Pizza..................................................................................................3
2.2. Italian Immigration & Pizza in the United States.............................................3
2.3. World War II & Americanization of Pizza through Franchises.......................6
Chapter 3 - Review of Literature.......................................................................................11
3.1. Social Media & Crowd Sourcing....................................................................11
3.2. (VGI) Volunteered Geographic Data..............................................................13
Chapter 4 - Methodology...................................................................................................16
4.1. Regional Pizza-Styles.....................................................................................16
4.2. Survey Instrument & Questions......................................................................19
4.3. Geography of Pizza Website...........................................................................24
4.4. Beta Testing Survey Instrument......................................................................28
4.5. Promoting Thesis on Facebook.......................................................................28
4.6. Promoting Thesis on Twitter..........................................................................34
Chapter 5 - Results.............................................................................................................38

v
5.1. Survey Results from Social Media Promotion................................................38
5.2. Target Emailing..............................................................................................40
5.3. Organizing Total Survey Responses for Maps...............................................45
5.4. Identity & Place Map Results for Regional Pizza-Styles...............................65
Chapter 6 - Discussion.......................................................................................................75
References..........................................................................................................................78

vi
LIST OF TABLES
Tables 1, 2. Setting up properties and location values in a Google Fusion table..............20
Table 3. Regional Pizza-Styles Chart for Geography of Pizza Website............................26
Table 4. Results for the 1st Week of Promoting on Facebook & Twitter.........................40
Table 5. States that were targeted during the email promotion campaign.........................42
Table 6. Non-targeted states during the email promotion campaign.................................43
Table 7. Results for most preferred pizza-styles from targeted states...............................44
Table 8. Results of most preferred pizza-styles from non-targeted states.........................45
Table 9. Total pizza preference survey responses in the United States.............................48
Table 10. Most preferred pizza-styles in the U.S. from total survey responses................49
Table 11. Excel spreadsheet of pizza percentage maps format.........................................52
Table 12. XY to Line Tool Excel format for radial flow maps.........................................65
Tables 13-19. Radial flow maps and stats of survey responses........................................67

vii
LIST OF FIGURES
Figure 1. Most Popular Franchise Pizza in the United States............................................10
Figure 2. Pizza preference survey instrument questions in a Google Form......................22
Figure 3. Original Facebook posting about Geography of Pizza.......................................29
Figures 4-7. Facebook shares by friends for Geography of Pizza.....................................30
Figure 8. First Twitter tweet promoting Geography of Pizza............................................34
Figures 9-11. More Twitter tweets for pizza project.........................................................35
Figures 12, 13. First week of survey responses in Google Maps......................................38
Figure 14. Google map of the total U.S. pizza preference responses................................46
Figure 15. Main United States Pizza Preference Map.......................................................50
Figures 16-27. U.S. Pizza Preference Percentage Maps....................................................53
Figures 28-34. U.S. Pizza Preference Radial Flow Maps..................................................67

viii
ABSTRACT
The Pizza Map: Using Social Media, Crowd Sourcing, & Web-Based Mapping to
Analyze Regional Pizza Preferences in the United States
By
Mark F. Turgeon
Master of Arts in Geography
GIS Program
At its core this thesis explores the geography of place and identity through the
lens of pizza. Place not only dictates variations of regional pizza styles, but also pizza
taste preferences. The study aims to explore the history of pizza in the United States, its
spread in popularity, the development of regional pizza styles, and, through a survey, the
pizza preference of Americans today.
A secondary aspect of this study was the use of web-based tools, mapping, crowd-
sourced data, and social media websites to conduct research. Much of the research
conducted for this thesis involved reviewing articles of (VGI) Volunteered Geographic
Information and how effective and trustworthy this data is in today's society. This study
was conducted at a time when crowd sourced data was being utilized in a growing
number of forms, and explores the usages and limitations of crowd sourced data.

1
Chapter 1 - Introduction
I grew up in the middle of Connecticut, halfway between New York City and
Boston. These two cities were areas of major settlements for Italian immigrants and not
surprisingly the location for the first pizzerias on American soil. I originally come from
an Italian heritage and pizza is one our family's traditional foods. While living on the East
Coast, I've developed a taste preference for quality, thin crust pizza and have become
very opinionated about pizzerias across the U.S. After my I moved to California, I began
to notice that there were a number of regional American pizza styles, and that people
from different regions were just as passionate about their pizza style preference as I was
about mine.
Others have made similar observations. "The type of pizza that most people like
today is usually the one they grew up with" (Reinhart, 2003). In some communities there
are still great local independent pizzerias. In recent decades, in most parts of the country,
franchise pizzerias such as Pizza, Hut, Dominos, and Papa John's have come to dominate
the landscape. How people, especially those removed from the pizza hearth-places of
America acquire their taste preferences is an important aspect of this study. When it
comes to taste preference for pizza, place has a significant effect. Place not only dictates
variations in pizza style, but seems to establish general patterns of pizza taste preference.
A secondary goal of this thesis is the exploration of new possibilities for research
using social media, crowd sourced data and web-based mapping. It appears, at least for
topics that excite the imagination of social media users, that these new web-based tools
have proven to be effective in terms of generating discourse regarding the similarities and
differences in regional food preference and identity.

2
I decided to use pizza as a lens through which to view issues of place, identity and
new methods of research because I love pizza and believe it is a simple, accessible food
that is capable of eliciting strong opinions for a large number of volunteer survey
subjects. I am particularly interested in how place affects identity because I am an East
Coaster, living in California who is constantly curious about how geography affects
identity.

3
Chapter 2 - Background
2.1. Origin of Pizza
The word pizza is derived from the Latin word, "pinsere", which means to crush
or grind dough, preparing for use as a crust. The flatbread, which is the foundation of the
pizza, was invented by the Egyptians, who cooked the dough by using cone shaped oven,
invented by them 6,000 years ago (Buonassisi, 1982). Egyptian ingredients and flat bread
preparation techniques was embraced by the Romans and Greeks because they had
similar foods. The first traditional pizza that we know of today was probably constructed
in Naples, Italy in the early 1800’s. Don Raffaele Esposito created a signature pizza
named “alla Margherita," named for Queen Margherita. The Queen was very pleased
with this particular pizza because it was made with mozzarella, tomatoes, and fresh basil,
which comprised the colors of the Italian flag, white, red and green. This particular pie
became popular in Italy and the rest of the world and is considered the most traditional
style pizza. The formation of the “pizza margherita” remains a major influence on all
pizza makers but was not the impetus for its ultimate global popularity.
2.2. Italian Immigration & Pizza in the U.S.
The first flow of Italian immigration to the United States began as early as the
colonization of America (Lord, 1905). The first reliable accounting of the number of
Italian-born immigrants living in the United States is the 1900 census. This record shows
that Italians migrated all over the United States, but large populations settled in New
York, Boston, Philadelphia, and Chicago. This early census data of Italian immigration in
the United States showed where the Italian neighborhoods formed into clusters, which

4
were frequently called “Little Italy.” These neighborhoods remain today, and they help
preserve a number of Italian traditions including authentic recipes. Italian immigrants did
not identify themselves as “Italian” until they came to America (Benedetto, 2000). Italy
was very disjointed as a nation and people usually identified themselves regionally. Food
became a way for the Italian immigrants to connect to one another.
Indeed food has proven to be a major component of what it means to be Italian.
This identity, perhaps more than any other American immigrant group has tied their
group identity to a collective notion of cuisine. Italian immigrants in America began to
bond over their similarities, rather than their regional differences (Cinotto, 2004). Food
and drink is very important, perhaps even sacred to Italian families. The majority of the
money each Italian family brought home was spent on food for the family (Cinotto,
2004). Food is so important to Italian families because it is completely imbedded in the
culture as something used for much more than nutritional purposes; food is an expression
of love. Pizza became a way for Italian immigrants to connect to the “old country” and
also to connect with each other. In America, pizza was always a marker for identity
(Cinotto, 2004).
Human identities are shaped by the space in which people live and socialize.
Migrant identities are bound to the geographies of multiple places. In the Italian
neighborhoods of New York, food production, trade, and consumption had a significant
impact on social space (Cinotto 2004). Italy was a distant place to New York, so food for
the Italian immigrants became embedded as a sense of attachment. In “urban villages” the
identity of the community is made coherent through the widespread sharing of common
symbols in the form of food and food ways.

5
Food is intimately connected to identity and place. One objective of this research project
is to explore the way place has affected the look and taste of pizza. In this country of many
ethnicities, where many people live far from where they are born, particular foods such as pizza,
cheese, BBQ, gumbo and clam chowder assume the role of an icon for a place. People like to be
reminded of home and have a sense of community and region to provide an anchor of identity
through food (Shortridge, 1999). Today, deep-dish pizza is no longer considered an immigrant
tradition, but a Chicago icon and as central to the Windy City as Wrigley Field (BBC Travel). It
has been widely speculated that the Chicago Deep Dish partially grew out of the geography and
weather of the city -- it is cold, and windy, and the Deep Dish pizza is hearty, dense and warm. In
New York people are always on the go and in a hurry. New York-style pizza is designed and sold
in wide slices that can easily be folded and eaten while walking.
Italian immigrants from different regions of Italy coming together and living in
the same neighborhood cluster and sharing different styles of food such as pizza, pasta,
and other fine dishes, formed the foundation for the eventual spread and Americanization
of these dishes (Cinotto, et al. 2003).
Italians living in these clustered neighborhoods largely consumed food from
home. Gurney (2011) writes about the reclaiming of authentic, regional Italian cuisine.
She argues that many of Italian dishes belie the regional foods eaten in Italy – they
represent food the immigrants developed and enjoyed within their own households long
before Americans began eating them in restaurants.
Food products such as olive oil, cheese, meat, and macaroni were normally
expensive foods back in Italy. In the United States the Italian immigrants were able to
buy these goods at reasonable prices at Italian grocery stores. Food gives identity to
neighborhoods. Food is one of the most integral components of culture, and "pizza" and

6
"Italy" go hand in hand (Cinotto, et al. 2003). The Italian immigrants in East Harlem,
New York, settled one of the first authentic Italian neighborhoods in America. During the
interwar years, from 1900-1950 there was a focus on the role of food -as a cultural
feature, non-verbal form of communication, and metaphor of self among immigrants.
Food served as a “construction” of two places: one actual - the neighborhood - and the
other one remembered and imagined – the old country (Cinotto, et al. 2003). "Foods
strongly associated with an area can easily take on symbolic qualities, and their
consumption can evoke both personal nostalgia and community pride. By studying such
culinary traditions, we can improve understanding of how modern Americans strive to
create touchstones for group identity." (Shortridge, 2003).
Geography informs identity through food. The state of Maine has become a
“spatialization of food- ways and the interconnections between people, food, and places.”
An interest in Maine’s food ways has helped the state to become something of a culinary
destination (Lindenfeld and Silka, 2011). The Food Network also contributed to the
growth of tourism in Maine, featuring many popular destination spots throughout the
state serving authentic New England dishes such as lobster, New England clam chowder,
etc. The culture and identity of people are influenced by the geography of place.
2.3. World War II and the Americanization of Pizza through Franchises
Popularity of pizza soared after World War II, because tens of thousands of
Americans, who were not of Italian descent, were exposed to Italian food during the
campaign to wrest Italy from the Fascists. Many other American soldiers found
themselves visiting New York, Boston and Chicago during the war years, exposing them

7
to Italian-Americans and their cuisine. American soldiers in Italy had been exposed to
pizza and when they returned home they created a demand for pizza that was far greater
than it was before the war (Miller, 2006). The spread of pizza and Italian food seeped out
of Little Italy's and into America. In the 1930's, a guide to dining out in New York
defined pizza as “an inch thick, potato pan-cake, sprinkled with Parmesan cheese and
stewed tomatoes," and it has been vastly changed since then (Cinotto, 2004). President
Eisenhower, said he had eaten better pizza in New York than in Naples, Italy and that the
best pizza was American-made. This one quote alone from President Eisenhower, in
addition to returning troops may have sparked the interest for pizza in the United States.
While Italian immigration and the spread of pizza began in New York City, it
quickly extended into small towns throughout America (Brixius and Kupfer, 2008). A
small town named Old Forge located between Scranton and Wilkes-Barre, Pennsylvania,
became known as the “Pizza Capital of the World" (Brixius and Kupfer, 2008). Old
Forge is a village of about 10,000 people and a cluster of 10 pizzerias located on the main
street. The pizza is entirely its own style with its own unique history.
Many Italian immigrants are concentrated in the Philadelphia and Pittsburgh
areas, but a large number of immigrants scattered to small towns of Pennsylvania such as
Scranton and Old Forge to find work in the coal and steel industries (Brixius and Kupfer,
2008).
Old Forge-style pizza is different than other regional pizzas because of its
rectangular shape with a slightly thicker, pan seared crust and unique blend of cheeses.
Mama’s is a famous pizzeria in Old Forge – many locals grew up on this style of pizza.
This pizzeria has a special history, a memory that is woven together with the flavors,

8
textures, and atmosphere of the place (Brixius and Kupfer, 2008). Pizzerias, particularly
in a place such as Old Forge, are spaces meant to be shared, not only with each other, but
with our past selves as well (Brixius and Kupfer, 2008).
While the spread of pizza originated in Italian enclaves, pizza is now a fully
American food. Historic Italian neighborhoods in the United States relate to the original
immigrants and their authentic food styles and recipes. Many of these historic Italian
neighborhoods have disintegrated or became smaller as Italian-Americans followed the
flight of others to the suburbs and married outside their ethnicity, but the traditions and
food preferences still live among thousands of Italian households and Italian restaurants
scattered across the United States.
The creators of Pizza Uno in Chicago created a pizza for the American palette -
thick, doughy and with as much as a half-pound of toppings baked into a deep dish pan,
akin to what Americans would call a “cobbler” were it a fruit pie. The popularity of
Chicago style pizza spawned imitators in Chicago first, then in many other parts of the
United States. During the 1950s, numerous pizza shops began speckling the American
heartland and California. Several started franchising their name and recipes. As often as
not, these new pizza chains were operated by those without Italian heritage. Almost
always, the pizza was adapted to non-Italian (or Italian-American) palates. The
Americanization of pizza had begun. Pizza Hut was founded in Wichita, Kansas in June
15th 1958 (Singer, 2011). Dominos was founded in Ypsilanti, Michigan in June 10th
1960 (Singer, 2011). Most major pizza chains originated in middle America, far, far away
from hubs of Italian immigrants. It was this push-- the franchising and mass production

9
of pizza that popularized “American” pizza. From here, the idea of pizza spread and
seemingly took on different incarnations in each region of the country.
There are clear and distinct density hubs of fast food restaurants in various parts
of the country. This may be explained through land cost and lifestyle. In the areas of the
country where the cost of land is relatively lower, fast food pizza restaurants seem to
have grown. It can also be speculated that fast food pizza was unwelcome in cities where
there was already an abundance of authentic pizza, frequently served in “Italian
restaurants”, with a full menu of options and waitresses. Many of the biggest pizza chains
started out in Midwestern locations, and only later did they diffuse into higher cost areas
of the country (Gordon and Sterrett, 1999). (SHAKEYS – out here is an exception – LA
has high land costs and they are a pretty old chain).
The big pizza chains were all started by business people and not by individuals
who have a passion and love for making pizza. You can visit any website like Papa
John's, Pizza Hit or Little Caesars and you'll find heartwarming stories of young people
who overcame their modest circumstances to achieve great wealth by building big and
have a successful business selling pizza (Brixius, 2008).

10
Figure 1. Most Popular Franchise Pizza in the United States

11
Chapter 3 - Review of Literature
3.1 Social Media & Crowd Sourcing
Social media websites such as Twitter, Facebook, YouTube, Instagram, and Flickr
are valuable sources that store and constantly update a wealth of untapped data from real
people online. These websites are very popular and are only now being used as research
tools. I chose to use social media to gather data on pizza preferences. There is a need for
more information about regional cuisines (Shortridge, 2003). “We still lack basic
knowledge and analysis of regional cuisines. This gap exists despite renewed public
interest in all things related to food...the main problem is scarcity of appropriate place-
related data" (Shortridge, 2003). Because geographically detailed consumption
information is nearly nonexistent, one solution is to ask people about their preferences”
(Shortridge, 2003).
Various philosophical geographers have long recognized the role of media and
communication in shaping space and place using language, maps, and GIS (Sui and
Goodchild, 2011). There are new interests and topics in the GIScience field, such as
GeoWeb, Digital Earth, CyberGIS, and cloud computing. “Perhaps one productive way
for GIScience to proceed is to ride on the discipline of geography’s communication turn
and the spatial turn that is evident in media studies” (Sui and Goodchild, 2011). Today's
geographers are more interested in media and communication studies than ever, as social
media has really given maps a new platform. The Association of American Geographers
even just recently formed a Social Media and GIS specialty group (Adams, 2009).
One of the technological changes of GIS during the past 10 years is the growing
convergence of GIS and social media (Sui and Goodchild, 2011). Many people share

12
maps online and they easily go viral through social media websites. A map can
communicate an idea, argument, or concept quickly, almost instantly, and effectively.
This type of visual and almost instant communication is perfect for the internet age way
of communication.
Potential problems with social media and crowd sourced data might include false
information that is possibly not verifiable (Meier, 2011). Accurate information that
arrives too late is meaningless and useless. Crowd sourced information can provide a fast
situational awareness, especially when applied to a live map. Many people believe that
verifying crowd sourced data is either too challenging or impossible. Meir (2011)
demonstrates that concrete strategies do exist when reliable people scrape the internet to
dig for evidence that helps support the contributed crowd-sourced data is authentic.
Sometimes live crowd-sources maps do not have time to be verified. Social media
websites such as Twitter, Facebook, Flickr, Skype and YouTube all play significant roles
particularly in times of crisis. The live, crowd-sourced maps deployed in response to the
recent disasters in Haiti, Libya, and Egypt provided great contextual information on the
evolving situations in real time (Meier, 2011).
The GPS Waze app is an example of a tool that uses crowd sourced data in real
time. Users constantly contribute information to the maps, including accidents, speed,
and whether there is state trooper hiding around the next bend. Users are also constantly
asked to verify the information others have shared, so that in this way all information is
self-verified and constantly updated by the app.

13
3.2 (VGI) Volunteered Geographic Data
The potential challenges related to possible false information on the other hand
are not new issues. Survey methods have been employed by geographers for years. In the
present day, the method of survey distribution is the main differentiating factor.
Volunteered geographic information is the harnessing of tools to create, assemble, and
disseminate geographic data provided voluntarily by individuals (Goodchild, 2007). VGI
is important these days because there is already a community online who contribute data,
but more people are volunteering every day especially when emergency disasters occur
around the world such as Hurricane Sandy & Katrina, the tsunami in Japan, the Arab
Summer, and Occupy Wall Street.
Our earth’s population is six billion and growing and each and every one of us has
some form of geographic knowledge from books, TV, magazines, internet and our own
surroundings. Anyone with access to the internet can potentially be used as sensors to
contribute trustworthy geographic data on the internet that can be used in a GIS or other
geographic software’s for analysis and decisions. There are countless websites in which
contributors have shared geographic data that was used and made a difference in life
(Goodchild, 2007). Some websites include OpenStreetMap, Google Earth, WikiMapia,
P3DM Where?, and Panoramio all of which provide rich and abundant geographic data
and geo-referenced information from volunteered contributors.
Every human is able to act as an intelligent sensor, perhaps equipped with such
simple aids as a GPS, Smartphone or even the means of taking measurements of
environmental variables. The main goal Goodchild (2007) states is to ensure quality data,

14
being able to detect and remove errors, and build a level of trust and assurance from
contributors.
There remain many issues in the development of spatial data infrastructures
because of restrictions on spatial data sharing and legal issues (Goodchild, 2007). A new
option called VGI Volunteered Geographic Information might effectively supplement the
traditional efforts of mapping agencies and the power of remote sensing, filling in
obvious gap in the current processes of acquiring geographic information (Goodchild,
2007).
It is important to think about what motivates people to contribute VGI. One of the
reasons pizza preferences are an ideal subject for crowd-sourced, web-based mapping is
that people are in general opinionated about their pizza preferences and many people
relish in the opportunity to share their opinions. People on Facebook and Twitter are
always expressing their opinions about anything, especially if they see a picture of your
food that you cooked or have eaten at a restaurant. Yelp is another great website where
people can express their opinions about businesses and rate them. Many people rely on
Yelp’s opinions because they matter when you want to find the best pizza place, a
trustworthy dentist, or auto repair shop.
The question is, “What motivates people to voluntarily contribute information?”
(Coleman, et al. 2009). “Volunteered Geographic Information” or VGI is a termed coined
by (Goodchild, 2007) that defines the user generated geospatial content in various
websites and to satisfy the needs within the industries of government, and social
networking communities. Many large companies have already discovered the importance
of VGI, and that government mapping agencies have the potential to harness this new

15
media and VGI to improve their own detections and geospatial data updating processes
(Coleman, et al. 2009).
People from all over the world contribute spatial data voluntarily using Google
Maps, TeleAtlas, Navteq and TomTom. This increased usage of crowd sourced
geospatial information in today’s world makes it important to understand and identify the
quality of contributed data. There are challenges involved in describing and classifying
both the types of people who volunteer geospatial information and the nature of their
contributions (Coleman, et al. 2009). Apps like Waze, which Google bought for a billion
dollars, almost nullify the validity of the question. Crowd sourced data is self-verified by
its very nature. It’s almost an obsolete question, because it works, it exists and is a staple
of our modern world.
There have been major advances in positioning, Web mapping, cellular
communications and wiki technologies that have outpaced the original visions of
Geographic Spatial Data Infrastructures around the world (Coleman, et al. 2009).
Collaborative Web-Based Mapping efforts like Open Street Map, Tagzania,
Wayfaring.com, and the People’s Map now enable experts and amateur enthusiasts alike
to be able to create and share limited geospatial data. (Coleman, et al. 2009).

16
Chapter 4 - Methodology
4.1 Regional Pizza Styles
An early and important task was to create a typology of American pizza styles.
There were dozens of possibilities, but Singer’s American Pizza Styles and Components
(2011) proved exceptionally useful. Singer’s book consists of Wikipedia articles put
together in order to describe the many American pizza-styles. This book serves as a solid
and generally bias-free reference to help select a set list of pizza styles to use for survey
construction. I referenced information from Singer’s book, a pizza-styles chart from Jeff
Varasano's website www.varasanos.com, along with my personal experience to create a
working list of popular pizza styles in the United States. For the purposes of the survey, I
decided to narrow down the choices of the vast number of pizza styles available in the
United States. In the end, I settled on nine different and well-known pizza-styles and two
additional extremely popular styles I decided to call All-American Franchise Pizza &
Franchise-Style and Build-Your-Own Pizza. I wanted to create a manageable list with the
most popular options. There are countless styles of pizza that are very popular in a certain
town, for example, the Old Forge style in Pennsylvania, but this is a style of pizza
unknown to most people. I also decided to leave out size-based pizza styles such as the
DC Jumbo Slice, as I consider these styles to be novelties. Considering the small size and
scope of this project, I knew I had to stick with the most popular pizza styles, which I
then used to create the survey instrument questions pizza-styles chart on
www.geographyofpizza.com. The following is the final list of pizza styles I settled on for
this project:
17
All-American Pizza: The delivery staples such as Pizza Hut, Dominos, Papa John’s and
Little Caesars. These pizzas are commercial, fast-food grade and churned in large
numbers. I wondered if naming this style “All-American” might skew survey takers, and
I am curious what would happen if, in the future, I changed the name to “Fast Food
Pizza,” or “Corporate Pizza.”
California-Style: This pizza was popularized in 1980 by Ed LaDou (the “Prince of
Pizza”). This is a single serving pizza that is combined with New York and Italian thin
crust and topped with nontraditional toppings such as avocados, salmon, BBQ chicken
and fresh California produce. Wolfgang Puck and California Pizza Kitchen both further
popularized this style of pizza from a gourmet food trend to a mass consumer food
product.
Chicago-Style Deep/Stuffed: The Chicago-style “deep-dish” was invented at the original
Pizzeria Uno in Chicago in 1943. This style of pizza is cooked in a pan and is made with
a heavy thick buttery crust and then layered with large amounts of cheese, Italian sausage
or meat chunks, large vegetables, with a chunky tomato sauce on top. This is very hearty
and comforting pizza that takes a while to cook and is eaten with a knife and fork.
Chicago-Style Thin Crust: This pizza style is thin with a firm crust, a little crunchy and
a slightly doughy top. It features a liberal amount of tomato sauce with no visible
chunks. This pizza is highly spiced and herbal and is shaped and sliced with a tavern cut
with small rectangles, squares and wedges.

18
Detroit-Style: This style of pizza was developed in Detroit, Michigan and is also known
as “square pizza”, similar to Sicilian-style pizza. The crust is the noteworthy feature of
this style, because it is baked twice with a chewy, well done buttery flavor.
Franchise-Style and build-your-own: A franchise pizzeria such as Hungry Howie’s,
Donato’s, PizzaRev or Shakey’s. These pizzas are made for profit only with a business
aspect. The ingredients are usually not fresh and have high sodium content.
Neapolitan-Style: This style of pizza is a thin, single serving pie that is a little crispy and
fragrant. It is made with fresh mozzarella and basil and topped with a San Marzano
tomato sauce that is a little chunky and savory. This style of pizza is usually cooked in a
wood-fired or coal-fired oven with high heat.
New Haven-Style: This style of pizza originated in New Haven, CT and is a variation of
a Neapolitan-style but is larger and also known as “apizza.” The crust is thin, chewy, and
tender with a dark crisp and bitter flavor from a coal-fired oven. This pizza usually has an
oblong shape and is served as a whole pie on a wax paper atop of sheet pan.
New York-Style: A thin-crust, hand tossed dough with large round pizza pies. Usually
sold as a wide and foldable slice that can be eaten while walking. This pizza is typically
served with no more than two toppings and mainly served with condiments such as
oregano, garlic powder, Parmesan cheese, and dried chili pepper.
Sicilian/Grandma-Style: A Sicilian pizza features a thick crust that is chewy in the
center and has a slight crunch on the outside. The Grandma-style usually has a thinner
crust. Both of these styles of pizza use traditional ingredients and can be found with the

19
sauce layered either on top or below the cheese. These pizzas are cooked in a sheet pan
and are cut into squares slices.
St. Louis-Style: This style of pizza has a thin, cracker-like crust that uses no yeast. The
main characteristic of this pizza is the Provel cheese that was originally developed in St.
Louis in the 1950’s and is processed with a combination of cheddar, Swiss and provolone
cheeses. This pizza is cut into a “party cut,” with little squares, rectangles, and wedges,
similar to a Chicago-Style Thin Crust.
Other Pizza: This pizza can be any other style that is not from my selected list. Other
styles may include: Greek Pizza, Trenton Tomato Pies, Old Forge Pizza, Midwest Pizza,
D.C. Jumbo Slice, etc.
4.2. Survey Instrument and Questions
The purpose of the survey instrument was to gather data on American’s
pizza-style taste preferences and how their taste preferences correlate to the geographic
locations of the survey respondents. I used Google Fusion tables software to create an
online survey, which then fed into a Google Document spreadsheet that held all the data.
I titled the form The Pizza Map and then created my survey questions. Designing the
survey question was a process of trial and error. I had to think about what exactly it was I
was interested in learning from the data, and what was the best, most neutral way of
asking these questions. I ended up with nine total survey questions (see Table xx). After I
created my survey question through the Google Document, I linked a Google Fusion
table to the form. The Google Fusion table is a large spreadsheet where I can store all my

20
survey answers and also be able to collect geographic data. A vital step in the creation of
the Fusion Table was to figure out how to create a location-based column that would then
read the geographic data, such as a zip code, and sync this information onto the map.
After I set up the column and labeled it as a “location” field, it was necessary to go back
to the Google Form and set up a script and activate it. I went back to the spreadsheet of
the form and under Tools> Script editor, a project window appears on the form. The
next step was to set up the form’s properties by adding rows with “(name)” and “(value)”
placeholders.
Table 1: Setting up a Google Fusion Property Table
Since I’m collecting location data two more rows need to be added to allow the script to
correctly geo-code my data and place the coordinates into the “location” column that
were created when the fusion table was added.
Table 2: Adding Location Values to the Google Fusion Table Properties Setup

21
After my project properties were created, I saved the project and the next step was to
authorize the script. The code for the script can be found here:
http://kh-samples.googlecode.com/svn/trunk/code/appsscript.js
The code was placed into the Google script editor and to authorize the script it must be
saved and from the Select Function > onFormSubmit, click the Run button and this will
authorize the script to add an authorization token to script project properties. The final
step I had to do was add triggers to the script. These triggers run and sync the script
directly from my survey form to the fusion table.
Once the script was ready to go I performed a handful of personal tests to make
sure the survey worked and was able to collect data in the Google form and Fusion table.
The tests were a success because the data was being stored properly and the spreadsheet
synced to the Fusion table.

22
Figure 2: Pizza Preference Survey Questions Using a Google Form
Below is the actual Pizza survey questionnaire that was used to collect data on
www.geographyofpizza.com

23

24
4.3. Geography of Pizza Website
After a successful survey test, I created a website to have an online presence. I
had a few domain names in mind for the site, but was most excited about
www.geographyofpizza.com. I thought it was the perfect domain name because its
keyword enriched and relevant to my subject of pizza and geography. I looked at many
options for building a website, but ended up using Google Sites because it is free, easy to
embed Google products such Google Docs (Survey Form) and a Google fusion table with
a map.
I created my website logo to look like a pizza compass or a North arrow, with
wedge slices pointing North, South, East, and West. When you first log onto the website,
the home landing page features my selected pizza-styles description chart. I believe these
styles of pizza are the most popular in the U.S.. This pizza-styles descriptive chart (Table
xx) is very detailed and talks about all the components of each pizza-style such as their
ingredients, shape, size, how they are cooked, and authentic images of what they look
like. Also, in the pizza-styles chart, I added a column that features hyperlinks that
connect to sample pizzerias which sell particular pizza-styles. I created these sample
pizzerias in case survey takers were confused by which style to choose. Often people do
not know exactly what style of pizza they prefer, and they only know which restaurant
they frequent. I also included these links to pizzerias in hopes that the establishments
themselves would see their links on my website and be more likely to re-tweet my survey
on Twitter. On the landing page I have a quick summary write-up describing my thesis
project saying I have a dual hypothesis, and provide links to take the survey and

25
contribute VGI. Other links I have featured on this website include an About me page,
and recommended pizza related links.
I decided that anonymity was a very important part of the survey. Many people do
not like to readily share their personal information. We are all weary of websites where
we need to enter our addresses and email. I wanted a zip code to be the only identifying
factor, so that everyone would feel able to safely contribute their data. Often when I
spoke to people in person, the first question they asked was, “Do I have to put in my
email?” I know from personal experience that if I need to enter personal information, I
will most likely stay away from that particular website.

26
Table 3: Regional Pizza-Styles Descriptive Chart on Website

27

28
4.4. Beta Testing Survey Instrument
During beta testing for my survey instrument I sent my website link,
www.geographyofpizza.com, to fifty close friends, fellow students and the CSUN
Geography faculty via Facebook and email, and asked them to participate in beta testing
for the survey. The test went really well and I was excited to see the data of the pizza-
styles they preferred and where they lived. During beta testing, a few people pointed out
that a few of my questions in the survey were moderately biased, as a survey question
already had a default answer in drop down arrow selection. I agreed and immediately
fixed all survey questions that had a drop down menu in order to not display a default
answer. Initially, as part of my survey, I asked about the type of business people would
rather support, Mom and Pop, Franchise or No Preference. I noticed that every single
respondent chose Mom and Pop, which I found to be extremely unlikely. I then changed
the wording of the question to: Where do you usually buy your pizza? I felt this question
would yield a more appropriate unbiased answer. I immediately noticed the effects of the
change of wording. Many people chose establishments such as Dominos, which is a
franchise. I think this shows that people want to support Mom and Pop’s, or want to
appear that they do, but the reality of their choices is quite different. Also, this question
provides additional data indicating if the respondent shops at mom and pop
establishments or franchise pizzeria.
4.5. Facebook Promotion
Since a big part of my thesis is using the power of social media to find answers and
crowd source the data, I used Facebook and Twitter to promote

29
www.geographyofpizza.com. I find that Facebook is an effective tool when trying to
reach out to friends, family, and friends-of-friends, but the scope of Facebook can only
reach so far. Twitter is the more effective tool when trying to reach out or be accessible to
strangers.
Figure 3: Original Facebook Posting about Geography of Pizza
1/30/2013 at 1:24 pm
After this posting went out on Wednesday 1/30/2013 to my friends on Facebook,
throughout the day 12 of 443 of my friends shared my thesis project to other friends.
There were also a number of additional shares by friends of friends, creating a chain
reaction of real people contributing (VGI) Volunteered Geographic Information into the
Pizza-Style Preference Survey.

30
Figure 4: Friends Posting on Facebook about Geography of Pizza

31
Figure 5: More Friends Posting on Facebook about my Thesis

32
Figure 6: My Professor Dr. Graves Posting on Facebook

33
Figure 7: More Facebook Promotion for Geography of Pizza
People on Facebook each shared the link using their own language and generating
their own discussion. I noticed that my website, in general, makes people hungry.

34
4.6. Twitter Promotion
I joined Twitter for the express purpose of promoting my survey. I studied other
Twitter accounts to try to get a feel of what gets re-tweeted. I post lots of maps and
information about pizza-- links I think people will be interested in. Twitter is great for
reaching out to strangers.
Figure 8: First Twitter Tweet Promoting My Thesis Project
Day 1. January 30th 2013

35
Figure 9: Twitter Tweets Reaching Out to Other Geographers and Pizza Places

36
Figure 10: More Tweeting Promotion
My twitter profile is @thepizzamap. I wanted this account to have a theme of
Geography / GIS and pizza, so I searched for my favorite pizzerias on Twitter, and other
accounts related to pizza and/or geography to follow them, hoping they would return the
favor and add me to build a following. I started tweeting to famous pizzerias and asked
them to help promote my website and the pizza survey instrument. I was very pleased
that a few well known pizzerias in the U.S. shared my pizza thesis survey and began to

37
follow me on Twitter. It was very exciting to have places like Lou Malnati’s in Chicago,
Buddy’s Pizza in Detroit, Sac’s Pizza in New York, and Frank Pepe in New Haven all
following you and talking about your project.
My wife and a couple friends have also tweeted on this same day Jan 31st 2013,
just to get things moving. One of the coolest things about Twitter is you can reach out to
people directly and share with them. This is exactly what I did to talk about my project
and reach out to other Twitter handles around the U.S. and internationally. The more you
tweet the better and if someone else re-tweets your tweet it’s even better.
The second day of tweeting, I reached out to other geographers and geo-bloggers
such as Matt Rosenberg who is also a CSUN alumni and a writer for About.com. He and
other Geo-Bloggers helped me to get more data because they tweeted about my site.
Figure 11: Other Geographers and Pizza Places Tweet About Geography of Pizza

38
Chapter 5 - Results
5.1. Survey Results From Social Media Promotion
Figure 12: Day 1 Results in Google Map of Facebook Shares and Tweets
Day 1 after Facebook (12) sharing and minimal tweeting = (127 survey takers)

39
Figure 13: Day 2 Results in Google Map of Facebook and Twitter Shares
Day 2 Major Tweeters 3 (UK Twitter Follower GeoBlogs)
Below is a table representing the dates from the first original posting on Facebook
& Twitter on Wednesday 1/30/2013 through the next 3 days of survey responses. The
first day of promotion has the highest response rate of 26 VGI contributors, while
Saturday came in second with 14 responses during the first week of promoting
www.geographyofpizza.com.The lower Saturday numbers are probably due to it being a
weekend. I have found that the most effective times to post are during working hours.

40
Table 4: A Table of the Results for the First Week of Promoting on Facebook &
Geography of Pizza Promotion through Reddit & MetaFilter WebBlog
Without my knowledge, a couple people posted a link to my website on Reddit &
Metafilter, which are both high traffic weblog sites. These postings definitely helped
contribute survey responses quickly. What is really fascinating about these postings are
the comments people made about pizza. You can read and see peoples true identity and
opinions about pizza from all over the world, and learn about their favorite toppings and
styles they prefer most.
5.2. Target Emailing (2/11/2013 - 2/25/2013 15 Days)
As I watched my map grow with VGI day to day, I was able to see which states
needed additional data. The majority of data contributed was coming in daily from
California and the Tri-state area of the East coast, because these are places either where I
live and go to school or where my family and friends are currently located. After twelve

41
days of promoting the pizza survey, the data available was insufficient. I decided to
personally ask friends who were from areas of the country that had an insufficient data to
help me get survey responses. For example I had very few responses from the Plains
states, so I emailed friends from North and South Dakota and Nebraska and asked them
to help me promote my survey. People were very receptive and willing to help. This
method did increase my data load and helped me get the word out even more for the
states that needed data, but it still wasn’t enough. I then decided to email fellow
geographers located in geography departments at universities and colleges across the U.S.
to help partake in my survey.
I constructed a professional letter describing myself and my thesis plan. I
explained that the survey is completely anonymous and I asked for help in sharing my
website with other faculty and students within their Geography Department. I came a
across a website that offered many links for departments in the U.S. The website list was
very detailed because it listed each state in alphabetical order and supplied links to the
universities and colleges that have Geography Departments.
I created an Excel sheet to help keep track and store all targeted states that
needed data and I emailed several geography departments in alphabetical order by state
name. My first day of emailing was on February 11, 2013, and the states included
Alabama, Alaska, Arizona, Arkansas, Colorado, Delaware, Washington D.C., Idaho,
Iowa, Kansas, and Kentucky. My second day of emailing continued on the 13th of
February, reaching out to Georgia, Hawaii, Louisiana, and Maine. Then again on the 14th
of February, emailing Nevada, and New Hampshire Geography Departments. On
February 21st, this was my final day of emailing departments in states where I needed

42
data for my pizza map. The states included North and South Dakota, Montana, Wyoming,
and Vermont.
I found that this method of targeting geography departments was extremely
successful. I was blown away by the support I got from these strangers in various
geography departments across the country. Professors loved the idea and passed the
survey along to their students. Of all the people I contacted, I only got one negative
response. A professor in Vermont said it was unheard of to contact departments in this
manner and that I was conducting research in a highly unprofessional way. She thought it
was some kind of spam. Again, this was an isolated response. All other professors were
incredibly helpful, eager and kind. Perhaps the overarching scope of this thesis is to
propose that the old ways of doing research are over, and it is time to embrace all the
tools available to us today. Facebook and Twitter by themselves were not enough to get
me the data that I needed, but reaching out through personal, targeted emails helped to fill
the gaps in data.
The following states contributed more than 10 responses during the Target Emailing
campaign:
Table 5: States Targeted During Email Campaign

43
The first email I sent out to target Geography Departments to take my Pizza
Preference survey was on Monday, February 11th, 2013. The next day, February 12th
2013, I received 157 total survey responses and out of this number, 121 of those
responses came from targeted Geography Departments. The schools with the highest
response rates were from Kentucky, with 70 responses and Kansas, with 34 responses.
Other states whose geography departments contributed data were Colorado, with 26
responses on February 13, 2013, Louisiana, between the days of February 14th and 15th
2013 with a combined total of 34 responses, and New Hampshire, with 21 responses on
2/22/2013.
Table 6: Non-Targeted States During Email Campaign
California was a major contributor of survey responses, especially during February 13-
15th, with a combined total of 101. Other states which contributed over 25 responses
through the survey instrument, while not being targeted are Illinois, Missouri, New York,
and Texas.

44
Table 7: Results for Most Preferred Pizza-Styles from Targeted States
2/11/13 - 2/25/2013
New York-style pizza was the most preferred with 79 votes followed by Neapolitan-style,
which was ranked 2nd with 67 votes, and All-American-style ranked 3rd with 60 votes.
The following chart, created with Excel, is similar to the chart above, but these
answers were from states that were not targeted during the Geography Departments email
campaign.

45
Table 8: Results of Most Preferred Pizza-Styles from Non Targeted States
New York-style is the most preferred again with 175 votes, followed by Neapolitan-style
with 106 votes, and in third is Chicago-style Deep dish.
5.3. Organizing Total Survey Responses for Maps
As of July, 7th 2013, 1,516 people have contributed VGI worldwide through the
survey instrument stating their favorite pizza-style and where they are from. One of my
goals for this project was to create maps that told a story of which pizza-styles people
preferred most in the United States. The majority of the data collected through the survey
instrument were people from the United States. For the purposes of this thesis, I will only
analyze the data from the United States.
I decided to have a cutoff of 1,377 responses of the overall data from people
living in the United States to use to make the representative maps. The maps I chose to

46
create are a main United States pizza-preference map, pizza-style percentage maps and
radial flow identity maps based on where a person is from and where they are living now.
Figure 14: Google Map Results of 1,377 Responses Through The Pizza Preference
Survey
U.S. Pizza Preference Survey Map 7/7/2013
As you can see from the map above, there is pizza data contributed from each
mainland U.S. state. Every time a person takes my survey, that data is stored into a
Google Doc and is also reflected into this map with a red pin.

47
Below, is part of a spreadsheet table I created to help store response rates for each
pizza style on a state level. The pizza preferences with the most responses or votes wins
that state.

48
Table 9: A Total of 1,377 U.S. Responses for Pizza Style Preferences by State
Total U.S. Survey Responses

49
Table 10: The Most Preferred Pizza-Style in the U.S. from the Total Responses
New York-style pizza is the most favored pizza in the United States with 367
votes. Neapolitan-style pizza came in 2nd with 229 preferred votes, followed by Chicago
Deep/Stuffed pizza with 195 preferred votes.
While looking at the complete U.S. survey response table above, you can see that
for the state of Connecticut there are responses for six of the pizza-styles that people
prefer. However, New Haven-style pizza received the highest rate (17), therefore that
particular pizza-style preference will “win” the state of Connecticut. Another example
would be the state of Pennsylvania. People have responded from Pennsylvania indicating
a preference for seven different pizza-styles, but New York-style got the most votes (10),
so that pizza-style wins the state of Pennsylvania.. Some of the states need more data
because the response rates for the pizza-styles are tied, therefore a winning pizza-style
could not be determined for that state. Again, only 1,377 survey responses in the U.S.
were used to create these maps. I do intend to incorporate all additional data to new maps
at a future time.
Using the Excel table (Table 9) above, I created the main Pizza Preference U.S.
Map and imported it into ArcGIS 10.0 and joined together with a U.S. boundary shape
file. After the join, I exported that shape file, saved it as a zip file, which was converted
into a GeoJSON format. I linked the GeoJSON file to a JavaScript, HTML, and a CSS

50
script that were part of the leaflet API map, which I then used to create the interactive
digital map (Fig. 14) below of the main Pizza Preference U.S. map.
Figure 15: Main Pizza Preference U.S. Map
1,377 U.S. responses
The results for the Main Pizza Preference U.S. Map (1,377 responses) show that
New York-style pizza is the most preferred in the majority of the states. What is also
interesting in this map are that almost all location specific pizza-styles are the preferred
style in their representative state. For example, in Illinois, Chicago Deep is the most
preferred. In Connecticut, New Haven-style pizza is the most preferred. In Michigan,
Detroit-style is most preferred, and in Missouri, St. Louis-style is most preferred. The
only state that did not win its pizza-style is California, as New York style won the state
with a higher response rate. Also, the states that prefer All-American pizza are located in

51
the middle of the country presumably because that is where the big franchise pizza places
were founded and they maintained their stronghold.
The method of organizing my data in an Excel spreadsheet helped me to make
percentage calculations for each pizza-style by state. The calculations I performed were
taking the total number of responses for each pizza-style and dividing that number to the
overall total responses for that particular state and multiplying that by 100. In order to
create my percentage maps representing each pizza-style, I exported the Google Doc into
a separate Excel spreadsheet and started to manipulate the data. I created a column that
stored all of the states, followed by a column that had a total number of survey responses
for that particular state, and the remaining columns were the pizza-styles All-American,
California, Chicago Deep, Neapolitan, etc.

52
Table 11: Example Excel Spreadsheets to Create Pizza Preference Percentage Maps
I used the percentage numbers from (Table 11) to create maps for the eleven pizza-styles
selected for this project.

53
Figure 16: All-American Pizza U.S. Preference Percentage Results Map
A total of 124 people have chosen All-American pizza. This style of pizza is most
popular in the middle of the United States. South Dakota had a total of eighteen responses
and seven of those are for All-American pizza which is equivalent to (38.9%). Oklahoma
had a total three responses and one response was for All-American for a (33.3%). Utah
had a total of nine responses with three choosing All-American giving that state a
(33.3%). This map also reminds me of the republican red state map, because most of the
All-American pizza lovers are located in the red states.

54
Figure 17: California-Style Pizza U.S. Preference Percentage Results Map
This California percentage map is very interesting because the people that prefer
this pizza-style the most are not in California. This pizza is not very popular in other
states. The highest percentage for California-style pizza comes from the state of
Delaware with a total number of responses one out of two choosing California pizza to
give this state (50%). Arkansas had a total of three responses and one of those was for
California pizza for (33.3%). New Mexico only had a total of three responses and one of
those responses was for California pizza for (33.3%). I have no real explanation for these
results, as the common philosophy of California style is that it is based on abundance of

55
fresh produce. A total of 90 people chose this style through the survey instrument across
the U.S..
Figure 18: Chicago-Deep/Stuffed Pizza U.S. Preference Percentage Results Map
Chicago Deep / Stuffed pizza is pretty popular all across the U.S. with a total
number of 195 people preferring this style of pizza. The states with the highest
percentage rates which prefer Chicago Deep pizza are Rhode Island at (50%), with one
response out of two total. Illinois at (39%), with twenty-eight responses out of seventy-

56
two. Georgia is at (33.3%) with a five responses out of fifteen total. Oklahoma, and
Montana are (33.3%) also.
Figure 19: Chicago-Thin-Crust Pizza U.S. Preference Percentage Results Map
Chicago-thin-crust pizza has a solid popularity across the U.S. with a total of 101
preferring this style. Minnesota has the highest percentage rating at (25%), with seven
responses out of twenty-eight chose Chicago-thin-crust pizza. Illinois is at (24%), with
seventeen responses out of seventy-two choosing Chicago-thin pizza.

57
Figure 20: Detroit-Style Pizza U.S. Preference Percentage Results Map
A total of 35 people from the survey results prefer Detroit-style pizza. Michigan
has the highest percentage preference for Detroit-style pizza at (42%), with ten responses
out of twenty-four choosing Detroit pizza. Iowa came in second at (40%), with two
responses out of five for Detroit pizza. Oklahoma is at (33.3%), with one out of three
choosing this pizza. Detroit-style pizza seems only popular in the middle of the country.
Only a couple states in New England have a taste preference towards this style, perhaps
because it’s very similar to a Sicilian square pizza, which is also popular in New
England. The north and west of the country have no preference for this style of pizza at
all, probably because they’ve never been exposed to it.

58
Figure 21: Franchise-Build-Your-Own Pizza U.S. Preference Percentage Results
Map
Franchise-build-your-own pizza seems moderately popular in many states across
the U.S. with 52 total people choosing this style. The highest percentage rate for this style
of pizza was in Mississippi at (50%) with one out of two responses choosing Franchise-
BYO pizza. Other states with a high percentage rate for this pizza include North Dakota
with three out of twenty-five responses choosing this pizza for (11%). South Dakota,
Utah, Idaho, Alabama, and Oregon, all with over 11% of a preference.

59
Figure 22: Neapolitan-Style Pizza U.S. Preference Percentage Results Map
Neapolitan pizza is the second most popular style of pizza behind New York with
229 people choosing this style of pizza. The highest percentage preference rate came out
of the state of New Mexico at a high (67%). Only two responses out of three choose
Neapolitan for NM. Delaware is at (50%) with one out of two responses choosing
Neapolitan pizza.
60
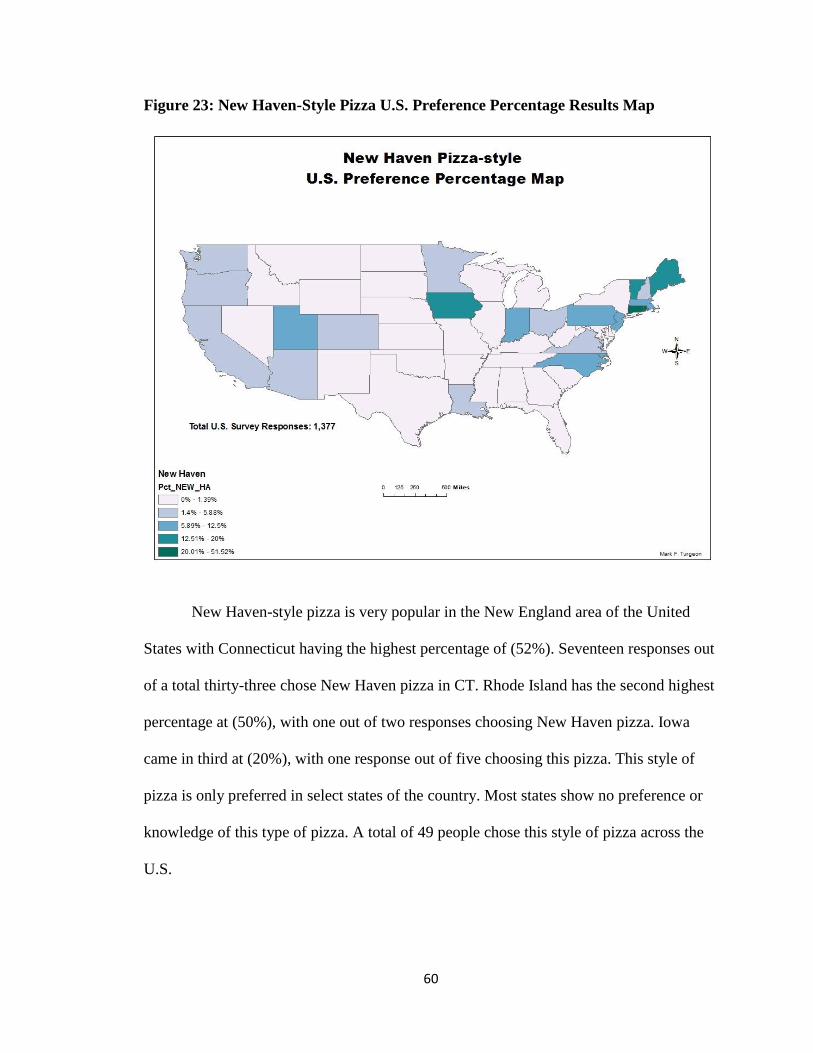
Figure 23: New Haven-Style Pizza U.S. Preference Percentage Results Map
New Haven-style pizza is very popular in the New England area of the United
States with Connecticut having the highest percentage of (52%). Seventeen responses out
of a total thirty-three chose New Haven pizza in CT. Rhode Island has the second highest
percentage at (50%), with one out of two responses choosing New Haven pizza. Iowa
came in third at (20%), with one response out of five choosing this pizza. This style of
pizza is only preferred in select states of the country. Most states show no preference or
knowledge of this type of pizza. A total of 49 people chose this style of pizza across the
U.S.

61
Figure 24: New York-Style Pizza U.S. Preference Percentage Results Map
New York-style pizza seems to be the most popular and preferred pizza across the
country with 367 people choosing this pizza style. New York has a (59.2%) preference
rate, with forty-five responses out of the total seventy-six choosing New York pizza.
West Virginia came in first with a 100% (although there were only two responses from
that state choosing NY pizza), followed by Nevada at (75%), with three responses out of
four choosing NY pizza and Arkansas at (67%), with two responses out of three. These
percentage maps are skewed, as some high percentage states had a small number of votes.

62
Figure 25: Other Pizza U.S. Preference Percentage Results Map
There were 45 people that chose the option of Other pizza. A high percentage rate
came from the state of Maine at (16.7%), with one response out of six choosing Other
pizza. Vermont came in second at (14.3%), with one response out of seven choosing
Other pizza. My guess would be that Greek pizza would be their option because that style
of pizza is very popular in the New England area.

63
Figure 26: Sicilian-Style Pizza U.S. Preference Percentage Results Map
There were 40 people that chose Sicilian / Grandma pizza across the United
States. Maine has the highest percentage for this particular style at (16.7%), with one
response out of six choosing Sicilian/Grandma pizza. Alabama came in second at
(11.1%), with one response out of nine choosing this pizza-style.

64
Figure 27: St. Louis-Style Pizza U.S. Preference Percentage Results Map
A total of 50 people chose St. Louis style pizza. The highest percentage for this
style of pizza is in Montana at (66.7%), with two responses out of three choosing St.
Louis-style pizza. Iowa came in second at (40%), with two responses out of five choosing
St. Louis pizza. Missouri had a total of seventeen responses out of forty-five choosing St.
Louis-style pizza giving the state a (38%) preference.

65
5.4. Results for Identity and Place through Pizza
One of the best ways to depict people’s identity through the lens of pizza was to
create radial flow maps with the location data collected through the survey instrument.
Radial flow maps show the movement of some phenomenon, normally goods or people,
from one place to another (Akella, 2011). One aspect of the survey involved the zip code
of where the survey taker was born and where he or she lives now. I was able to extract
these zip codes from both locations (if two zip codes were provided) and geo-code them.
I put coordinates into a format spreadsheet like the one below (Table:12), which I then
added in ArcGIS to run the XY to Line tool, used to create radial flow maps.
Table 12: XY to Line Tool Excel Format for Radial Flow Maps

66
The POINT_X and Y columns of the spreadsheet above represent where those
people are originally from and the DESTINATION_X and Y columns represent the
columns where the people currently live. The Pizza column represents their pizza-style
preference. Radial Flow maps are a great way to depict people’s identity through pizza
because they are able to show movement. In this case, each pizza-style was represented
by a particular color line featured on the map and in the legend. These particular maps do
not represent all respondents. They only represent people who were born in the region or
state and then moved to a different location. The point of these maps is to see if a
regional identity exists around pizza and does that identity remain even after moving
somewhere else. In other words, my interest in the statistics are twofold: 1) How and
where do people move, and 2) Do their food preferences remain the same? Each of the
lines on the maps are a person’s response and their preferred pizza-style. The maps have
many different color lines moving out of the particular state or region I chose to study.
One color line represents that state or region’s location-specific pizza-style and the other
color lines represent the remaining pizza-styles that are part of this study. When a
different color line flows out of the state that is being represented, this could be
interpreted as a person who changed their identity (food preference) by moving out of
that state and preferring another pizza-style in their present location.
I’ve created six radial flow maps for the states that feature the popular location-
based pizza-styles: California, Connecticut, Illinois, Michigan, Missouri, and New York.
I also created a 7th radial flow map that was based off the All-American Pizza-style
Percentage Map from the previous pages. I’ve selected a block of states that are in the
middle of the U.S. that have a have a high percentage preference for All-American pizza.

67
These states include North Dakota, South Dakota, Nebraska, Kansas, and Oklahoma. I
created this 7th radial flow map for the purpose of seeing where the people of middle
America were moving to and how (or if) their pizza preference has changed.
Figure 28: Middle America Pizza Preference Radial Flow Map
Table 13: Middle America States Radial Flow Map Stats of Survey Responses
A total of 84 respondents came out of these five states for the Middle America
Radial Flow Map and All-American pizza is the number one preferred style with 21

68
votes. New York-style had 15 respondents and Chicago-Deep with a 12. Middle America
has respondents for every pizza style except for Sicilian / Grandma style. This map is a
great example of seeing the changes within peoples food preference. In one case, I
noticed right away a light blue line that represents New Haven-style pizza leaving
Oklahoma and moving to New England. It is just fascinating to see how place can change
a person’s food preference.
Figure 29: California Pizza Preference Radial Flow Map
Table 14: California Radial Flow Map Stats of Survey Responses

69
California reported an extremely large amount of responses (209) and really
represented a wide range. Many people who were born in California and preferred
Neapolitan style remained true to that preference, even after they moved. Many people,
also, though, reported preferences for a vast array of pizza styles. All in all, perhaps
because of the vast size of the state and its lack of a pizza “identity,” those born in
California are literally all over the map.
Figure 30: Connecticut Pizza Preference Radial Flow Map
Table 15: Connecticut Radial Flow Map Stats of Survey Responses

70
In the case of CT, most people who moved, moved within the small state of
Connecticut or to nearby New England states. These people maintained their preference
for New Haven style pizza. The ones who moved further either maintained a preference
for New Haven, or tended to pick New York style or Neapolitan style. It seems that a
majority of respondents maintain their Connecticut identity by remaining loyal to New
Haven Style pizza.
Figure 31: Illinois Pizza Preference Radial Flow Map
Table 16: Illinois Radial Flow Map Stats of Survey Responses

71
The Illinois radial flow map is one of my favorites because the response rates look
like a giant star across the U.S. and the amount of people selecting Chicago Deep and
Chicago-thin pizza dominates with a percentage of 77% out of the total responses of 94.
It’s safe to say that the people of Illinois are proud of their pizza and maintain this
preference no matter how far they move. More than any other style, these styles seem to
represent “home.”
Figure 32: Michigan Pizza Preference Radial Flow Map
Table 17: Michigan Radial Flow Map Stats of Survey Responses

72
Though on a much smaller scale, Detroit-style pizza seems to remain a preference to
locals after they move to other states. Respondents either remain true to Detroit-style or
their neighbors, Chicago-style pizza. If going by these maps, it seems the Midwest breeds
people proud of their pizza roots.
Figure 33: Missouri Pizza Preference Radial Flow Map
Table 18: Missouri Radial Flow Map Stats of Survey Responses
A total of 45 people who were born in Missouri and then moved took the survey
and 19 of them still prefer St. Louis Style pizza. The 19 responses is equivalent to 42% of

73
the total count. This is a pretty impressive number and seems to match the trend of the
loyal Midwesterner. New York-style pizza is the 2nd most preferred in MO with 10
responses or 22%. Chicago-Deep came in 3rd with 9 responses or 20% of the total.
Figure 34: New York Pizza Preference Radial Flow Map
Table 19: New York Radial Flow Map Stats of Survey Responses
This New York radial flow map is another one of my favorites, because you can
clearly see the domination of responses that prefer New York-style pizza. A total of 105
people responded through the survey instrument from New York and 76 responses or

74
72% of the total count prefer New York-style pizza. Many people in this map were
originally from NY and migrated west or to Florida. In addition to being the most
preferred style country-wide, the slice of pizza also remains most preferred to those who
move away from NY.

75
Chapter 6 - Discussion
In less than half a century, Pizza has gone from a specialty food known only in
the scattered Little Italy’s in America’s biggest cities, to a beloved All-American food
staple, standing tall alongside hot dogs, hamburgers and Apple Pie. Unlike those other
All-American favorites, pizza has developed a great variety of regional variations. This
project has uncovered a number of interesting findings regarding the regional variations
in pizza style and the taste preferences for pizza across the US.
One of the major findings of this study is the somewhat surprising national
preference for New York City’s Slice style pizza. It should be noted though that this
finding may be slightly biased because of the nature of social networking, and the effect
of the author’s birthplace on the East Coast. The pizza-style preferences data may change
as more people from a wider geographic range contribute VGI through the survey
instrument in the future.
Another interesting, but perhaps not surprising result is that many respondents
appear to like pizza styles originating in or near their place of residence. New Yorkers
prefer their style, but also the other popular location-based pizza-styles, which include
Connecticut, Illinois, Michigan, and Missouri, all logically and predictably preferred their
local regional styles.
Another important finding uncovered by this study is the utility of social
networking sites as data collection tools. Facebook and Twitter definitely worked well in
terms of their capacity to solicit responses from respondents in far flung locations. The
weakness of social media as a tool for collecting survey data is that it has a tendency to
replicate existing human networks. As a result, there was a spatial bias in the responses

76
collected by the survey instrument. California and the greater New York area were
oversampled, and much of the interior of the United States were under sampled.
Additional effort was needed to help craft a more representative sample. The
Target emailing campaign that focused on individual Facebook friends by location and
various Geography Departments throughout the states with missing data, was very
effective way to gain survey responses. I especially remember how helpful the
Geography Departments in Kentucky and Kansas were, with a very high participation
response rate on February, 12th 2013 with a total of 104 responses combined.
Perhaps the most surprising finding was promoting this project on Twitter was
that I could reach out to anyone such as celebrities, famous pizza places, and popular
Geography Blogs and GIS companies. A retired professional hockey player, Darren
McCarty, of the Detroit Red Wings re-tweeted about my website and helped gain a
survey response rate in the Michigan area. A handful of popular and well respected
pizzerias in the United States tweeted about my project as well. It’s amazing how fast
word travels online and it was exciting to see my Google map grow with red pins of
responses each day from locations around the world.
MetaFilter, a very popular community weblog online posted a hyperlink to my
website that features a feed of ongoing comments of real opinions of the people’s pizza-
style preferences. It’s amazing to read through all the comments of these people, because
they are from all over the world that clearly had different beliefs and thoughts about
pizza.
Volunteered Geographic Information has enormous potential as a data resource
because it is contributed data from real people around the world. The fact that I was able

77
to create a survey instrument and collect data from people about their pizza preferences
by locations was amazing. There are so many subjects that can be touch on by VGI and I
hope to see more in the future. The Waze app is a great example that VGI really works
and we should consider using more of it to help make informative decisions.
My radial flow identity maps are very preliminary and also very flawed. You need
almost a separate, and more in-depth survey, but they do seem to show that there are
some areas of the country who strongly maintain their identity. They are also fascinating
to see right away where people move to from one point to another.
I will continue to update Geography of Pizza in the future and hope to have more
responses and more accurate maps. Geography of food and identity, in this ever mobile
world, is a key to learning about how food connects us to place and to larger concepts
like the self, and home.

78
REFERENCES
Adams, P.C. 2009. “Geographies of media and communication.” New York: Wiley-
Blackwell.
Akella, M. “Creating Radial Flow Maps with ArcGIS.” 2011.
http://blogs.esri.com/esri/arcgis/2011/09/06/creating-radial-flow-maps-with-arcgis.
Backstrom, L., Huttenlocher, D., and Kleinberg, J., 2006. Group formation in large social
networks: membership, growth, and evolution. Proceedings of the 12th ACM SIGKDD
International Conference on Knowledge Discovery and Data Mining, 15, 44-54.
Benedetto, A. Di.”Italian Immigration to the United States.” U.S. Institutions Survey
Papers (2000) pgs 1-5.
Buonassisi,V. “Pizza Boston”: Little Brown Press, 1984.
Cinotto, Simone. “Leonard Covello, the Covello Papers, and the History of Eating
Habits Among Italian Immigrants in New York.” The Journal of American History
(2004):pgs 498-505.
Cinotto, S. 2004. “Now That’s Italian!”: Representations of Italian Food In American
Popular Magazines, 1950-2000.
Cinotto, S. “The Taste of Place: Food in the Narratives of ‘America’ and ‘Italy’ by
Italian Immigrants of New York, 1920-1950,” in America and the Mediterranean, eds.
Massimo Bacigalupo and Pierangelo Castagneto (Turin: Otto, 2003), 145-154.
Coleman, J. D., Y. Georgiadou, J. Labonte. 2009. Volunteered Geographic Information:
the nature and motivation of producers.
Goodchild, F. M. 2007. “Citizens as Voluntary Sensors: Spatial Data Infrastructure in
the World of Web 2.0.”
Gordon, P.J. , J.L. Sterrett. 1999. “Geographic Preference for Fast Food,” Proceedings
of the Academy of Marketing Studies, 1-4.
Gurney, E. 2011. “From Spaghetti and Meatballs to Pizza: The Invention of Italian-
American Restaurant Staples by Immigrants, for Immigrants.
Hardy, D. 2008. Discovering behavioral patterns in collective authorship of Place- based
information.
Lindenfeld, L. and L. Silka. 2011. “Growing Maine’s Foodscape, Growing Maine’s
Future.”
Lord, Eliot, The Italian in America. Freeport: Books for Libraries Press, 1905.

79
Meier, P. P. 2011. “Verifying Crowd sourced Social Media Reports for Live Crisis
Mapping: An Introduction to Information Forensics.”
Miller, Hanna. “American Pie.” American Heritage Magazine 57, NO 2 (April-May
2006).
Reinhart, P. American Pie My Search for the Perfect Pizza. Ten Speed Press, 2003.
Shortridge, B. 2003. “A Food Geography of the Great Plains,” The Geographical
Review.
Singer, S. American Pizza Styles and Components. Webster's Digital Services, April 27,
2011.
Sui, D. & M. Goodchild. 2011. “The Convergence of GIS and social media:
challenges for GIScience”, International Journal of Geographical Information Science.
Varasano, J. Varasano's Pizzeria. http://www.varasanos.com/PizzaRecipe.htm. 2006.
Related Documents