- 1 - USING SCIENCE IN HABITAT CONSERVATION PLANS Peter Kareiva, Sandy Andelman, Daniel Doak, Bret Elderd, Martha Groom, Jonathan Hoekstra, Laura Hood, Frances James, John Lamoreux, Gretchen LeBuhn, Charles McCulloch, James Regetz, Lisa Savage, Mary Ruckelshaus, David Skelly, Henry Wilbur, Kelly Zamudio, and NCEAS HCP working group * The NCEAS HCP working group consisted of 106 students participating in a nationwide graduate-level course led by the following faculty advisors: Sandy Andelman, Dee Boersma, Daniel Doak, Harry Greene, Martha Groom, Frances James, Peter Kareiva, Ingrid Parker, James Patton, Mary Power, Mary Ruckelshaus, David Skelly, and Kelly Zamudio. National Center for Ecological Analysis and Synthesis University of California, Santa Barbara 735 State Street, Suite 300 Santa Barbara, CA 93101 American Institute of Biological Sciences 1444 Eye Street, NW, Suite 200 Washington, DC 20005 Opinions expressed by the authors of this publication are their own and do not necessarily reflect the opinions of the American Institute of Biological Sciences, the National Center for Ecological Analysis and Synthesis, nor the institutions with which the authors are affiliated. Key Words: habitat conservation plans; Endangered Species Act; habitat management; extinction; conservation planning; monitoring.

Welcome message from author
This document is posted to help you gain knowledge. Please leave a comment to let me know what you think about it! Share it to your friends and learn new things together.
Transcript
- 1 -
USING SCIENCE IN HABITAT CONSERVATIONPLANS
Peter Kareiva, Sandy Andelman, Daniel Doak, Bret Elderd, Martha Groom, Jonathan Hoekstra,Laura Hood, Frances James, John Lamoreux, Gretchen LeBuhn, Charles McCulloch, JamesRegetz, Lisa Savage, Mary Ruckelshaus, David Skelly, Henry Wilbur, Kelly Zamudio, andNCEAS HCP working group *
The NCEAS HCP working group consisted of 106 students participating in a nationwidegraduate-level course led by the following faculty advisors: Sandy Andelman, Dee Boersma,Daniel Doak, Harry Greene, Martha Groom, Frances James, Peter Kareiva, Ingrid Parker, JamesPatton, Mary Power, Mary Ruckelshaus, David Skelly, and Kelly Zamudio.
National Center for Ecological Analysis and SynthesisUniversity of California, Santa Barbara735 State Street, Suite 300Santa Barbara, CA 93101
American Institute of Biological Sciences1444 Eye Street, NW, Suite 200Washington, DC 20005
Opinions expressed by the authors of this publication are their own and do not necessarily reflectthe opinions of the American Institute of Biological Sciences, the National Center for EcologicalAnalysis and Synthesis, nor the institutions with which the authors are affiliated.
Key Words: habitat conservation plans; Endangered Species Act; habitat management;extinction; conservation planning; monitoring.
- 2 -
EXECUTIVE SUMMARY
The Endangered Species Act of 1973 (ESA) was established to save species at risk ofextinction and to protect the ecosystems upon which they depend. Toward that aim, the ESAmakes it unlawful for any person to “take” a listed species. In 1982, the ESA was amended toauthorize incidental taking of endangered species by private landowners and other non-federalentities, provided they develop habitat conservation plans (HCPs) that minimize and mitigate thetaking. Since 1982, HCPs have rapidly proliferated, leading in turn to widespread concern amongconservationists that these plans are not being prepared with adequate scientific guidance.Critics have argued that scientific principles must be better incorporated into the process ofdeveloping HCPs. In response to these criticisms, we reviewed a set of approved habitatconservation plans to evaluate the extent to which scientific data and methods were used indeveloping and justifying them. The review was conducted through a nationwide graduateseminar involving eight major research universities, 106 students, and 13 faculty advisors. Ouranalyses focused on the extent to which plans could be substantiated by science. Thus, even ifbased on the best available data (the legal requirement), a legally and politically justified plancould be deemed scientifically inadequate because, by more stringent scientific standards, thedata were insufficient to support the actions outlined in the plan.
A Systematic Effort to Collect Quantitative Data on Science in HCPs
This investigation proceeded along two lines. First, individuals gathered data on 208HCPs that had been approved by August 1997 in order to obtain basic descriptive informationabout plans. Second, the group conducted a more comprehensive analysis for a focal subset (43)of these plans. The HCPs in the focal subset range widely in geographic location, size, duration,methods, and approval dates. For this in-depth investigation, we developed two separate dataquestionnaires: one asked for information on the plans themselves, and the other focused onlisted species and their treatment within HCPs. These questionnaires included information aboutwhat scientific data were available for use in formulating the HCP, how existing data were used,and the rigor of analysis used in each stage of the HCP process. As a whole, the questions weredesigned to generate a detailed profile of each HCP and to document the use (or lack thereof) ofscientific data and tools. Plans were not judged overall; rather, questionnaires focused ondifferent stages of the planning process, including the HCP’s assessment of (1) the status of thespecies; (2) the “take” of species under the HCP; (3) the impact of the take on the species; (4) themitigation for the anticipated take; and (5) the biological monitoring associated with the HCP.All of the data sheets, plan descriptions, and other detailed results from this effort are availableon the NCEAS website: http://www.nceas.ucsb.edu/projects/hcp/
Results
From our data on 208 HCPs, we were able to outline an overall picture of HCPs acrossthe landscape. These 208 HCPs involve permits for incidental take of 73 endangered orthreatened species. Of those 208, a great majority (82%) involve a single species, although theprofile is skewed by more than 70 plans involving the golden-cheeked warbler (Dendroicachrysoparia) in Travis County, Texas. HCPs occur in 13 states; the largest concentrations are inTexas, Florida, and California. They range in size from only 0.17 ha (0.5 acre) of habitat to660,000 ha (1.6 million acres) of habitat. The duration of plans also varies widely, from sevenmonths for a plan in Travis County, Texas, to 100 years for the Murray Pacific Company’s HCP
- 3 -
in Washington. HCPs do not appear to be getting larger, smaller, longer, or shorter over time.
In our more comprehensive examination of the focal HCPs, we direct much attention towhat we call scientific adequacy. It is important to note that an HCP would be labeledscientifically inadequate if insufficient data were available to justify an action formally, eventhough legally the plan might be defensible. HCPs and many other provisions of the EndangeredSpecies Act require only that decisions be based on the best available data. Scientifically,however, to support a claim we require data that when analyzed give some statistical confidenceof an assertion, and that confidence is often lacking in applications of science to conservationbiology because of a paucity of data. For example, from a scientific perspective, the best datamight suggest a particular relationship between loss of habitat and loss of individuals, but thedata are so variable and scarce that one could never have scientific confidence in the presumedrelationship. Our aim is not to change the law but to point out just how much science is beingused, and can be used given the availability of data pertinent to HCP development. Theconclusions we draw probably apply to many other facets of federal decisions regarding specieslisted as endangered or threatened.
Status/Take/Impact
Because they involve take of endangered species, HCPs must include information aboutthe status of populations and habitats of the species, an assessment of how many individuals andhow much habitat will be taken under the plan, and what impact that take will have on thespecies overall. We found that, for most species (74%), population sizes were known to bedeclining globally before the HCP was submitted; 21% were stable, and 5% were increasing.The most important threat to species was habitat loss, although habitat degradation orfragmentation and direct human-caused mortality also represented important threats. Notably,for only 56% of the instances in which a listed species might be “taken” by an activity was thepredicted take quantitatively estimated. And only 25% (23 of 97) of species treatments includedboth a quantitative estimate of take and an adequate assessment of the impact of that take.
Mitigation
A crucial measure for the success of HCPs is the choice and implementation of measuresto avoid, minimize, and mitigate impacts on the species included in the permit. If the appropriatemeasures are chosen and implemented in a timely fashion, the impact on the species in questionmight be effectively mitigated, justifying the issuance of an incidental take permit. For thisanalysis, we chose to evaluate avoidance, minimization, and mitigation measures as overall“mitigation,” because they all involve offsetting potential impacts to species. Minimization andavoidance of the threatened species are by far the most common mitigation measures (avoidanceis proposed for 74% of species, and minimization for 83%). Our analyses identify someimportant gaps in quality of data underlying mitigation proposed in HCPs. Overall, particularmitigation measures commonly suffered from an absence of data indicating they were likely tosucceed, leading to a situation in which “unproven” mitigation measures were relied on in theHCPs. Given this uncertainty, one would expect that a mitigation measure should be evaluatedprior to the onset of take. Unfortunately, such a precautionary approach was often lacking.
Monitoring
We determined whether biological monitoring (i.e., “effectiveness monitoring” or
- 4 -
monitoring of trends in the populations that are potentially affected) was included for the HCPsin our sample. In this analysis, we looked at each plan as a sampling unit (n = 43), and we onlyconsidered information included in the plan or associated documents. For only 22 of the 43plans was there a clearly outlined monitoring program. Of those 22 well-described monitoringprograms, only 7 took the next step of indicating how the monitoring could be used to evaluatethe HCP's success. Interestingly, although most plans do not include provisions for “adaptivemanagement," when plans do include such provisions they are significantly more likely toinclude clear monitoring plans as well.
Availability and Use of Information Needed for Scientifically Based HCPs
In many cases, we found that crucial, yet basic, information on species is unavailable forthe preparers of HCPs. By crucial, we mean information necessary to make determinationsabout status of the species, the estimated take under the HCP, and the impact of that take on thespecies. For example, in only one-third of the species assessments was there enough informationto evaluate what proportion of the population would be affected by a proposed “take.” If we donot know whether one-half or one-hundredth of a species' total population is being affected by anaction, it is hard to make scientifically justified decisions.
We assessed the overall adequacy of scientific analysis at each stage of the HCP process.Although this evaluation of scientific adequacy amounted to a largely qualitative assessment, thefoundations of that assessment were well specified by series of background questions; “overalladequacy” was consistently well predicted by data obtained for these background questions. Ingeneral, the earlier stages in HCP planning are the best documented and best analyzed. Inparticular, species status is often well known and adequately analyzed, whereas the progressiveanalyses needed to assess take, impact, mitigation and monitoring are more poorly done orlacking. Our evaluations also indicate that the very large and the very small HCPs contain thepoorest analysis. In terms of plan duration, it appears that shorter-duration plans have betterestimates of the amount of take, but longer-duration plans have better analysis of the status of thespecies and the mitigation measures imposed.
Conclusions and Recommendations
Although our analysis points to several shortcomings of HCPs, we acknowledge that theHCP process is new, complex, and difficult. In general, the USFWS and NMFS are doing agood job with the data that are available. They do not have the resources to obtain the data thatare needed for many of the decisions that must be made. Without such resources, the bestscientific approach is to be more cautious in making decisions and to use the findings of thisreport to justify requests for additional resources.
Recommendations
1. We recommend that greater attention be given to explicit scientific standards for HCPs, butthat this be done in a flexible manner that recognizes that all HCPs need not adhere to the samestandards as high impact HCPs. A formalized scheme might be adopted so that small HCPsdraw on data analyses from large HCPs, assuring that applicants are not paralyzed by unrealisticdemands.
2. For the preparation of individual HCPs, we recommend that those with potentially large
- 5 -
impact (those that are large in area or cover a large portion of a species' range) include an explicitsummary of available data on covered species, including their distribution, abundance,population trend, ecological requirements, and causes of endangerment. HCPs should be morequantitative in stating their biological goals and in predicting their likely impact on species.When information important to the design of the HCP does not exist, it may still be possible toestimate the uncertainties associated with the impact, mitigation, and monitoring, and to still goforward, as long as risks are acknowledged and minimized. Flexibility can be built intomitigation plans so that managers can be responsive to the results of the monitoring during theperiod of the HCP. When highly critical information is missing, the agencies should be willingto withhold permits until that information is obtained.
3. For the HCP process in general, we recommend that information about listed species bemaintained in accessible, centralized locations, and that monitoring data be made accessible toothers. During the early stages of the design of potentially high-impact HCPs and those that arelikely to lack important information, we recommend the establishment of a scientific advisorycommittee and increased use of independent peer review (review by scientists specializing inconservation biology). This policy should prevent premature agreements with developmentinterests that ignore critical science.
- 6 -
1. INTRODUCTION
1.1. The Endangered Species Act in Relation to this Study
The Endangered Species Act of 1973 (ESA) was established to save species at risk ofextinction and to protect the ecosystems upon which they depend. Toward that aim, the ESAmakes it unlawful for any person to “take” a listed species. This prohibition encompassesactivities that directly kill or harm listed species, as well as activities that cause indirect harmthrough “significant habitat modification or degradation” (50 CFR §17.3). In 1982, the ESA wasamended to authorize incidental taking of endangered species by landowners and nonfederalentities, provided they developed habitat conservation plans (HCPs) that minimize and mitigatethe taking, and that receive approval by the U.S. Fish and Wildlife Service (USFWS) or theNational Marine Fisheries Service (NMFS). Any nonfederal entity, whether a private citizen,corporation, county, or state, can initiate an HCP. Once approved, an HCP results in anincidental take permit. The language of this amendment (Section 10a of the ESA - 16 U.S.C.§1539(a)) arose directly out of a model HCP designed to resolve a conflict between adevelopment project and the needs of endangered species in the San Bruno Mountain area nearSan Francisco. Few landowners chose to undertake HCPs until the early 1990s. The USFWSapproved only 14 HCPs from 1983 to 1992 (USFWS and NMFS, 1996), but since 1992 there hasbeen an explosion of HCPs—225 were approved by September 1997, and approximately 200 arecurrently being formulated. Indeed, HCPs have become one of the most prominent mechanismsemployed by the USFWS to address the problem of threatened and endangered species onprivate lands (Bean et al., 1991; Noss et al., 1997; Hood, 1998).
The rapid proliferation of HCPs has led to widespread concern among conservationadvocates about the scientific information in these documents. From a policy perspective, criticscharge (1) that HCPs may undermine species recovery because they can allow for impacts tospecies that are not fully offset, (2) that HCPs are developed without adequate biologicalinformation or scientific review, (3) that small-scale HCPs can lead to piecemeal habitatdestruction and fragmentation, and (4) that meaningful public participation occurs infrequently(Hosack et al., 1997; Kaiser, 1997; Kostyack, 1997; Murphy et al., 1997; National AudubonSociety, 1997; O’Connell and Johnson, 1997). Our objectives in this study were to conduct amajor review of HCPs and to evaluate in detail the scientific merit of a substantial sample ofHCPs currently in effect. We did not attempt to evaluate the biological success of HCPs or theirattempt to balance economics with biology. That exercise would have been premature given thenewness of most HCPs. Our emphasis is on scientific data and approach, whether they areadequate, and if not, what should be done. To strengthen the role of science in this process, westart with the premise that regardless of the compromises that may be made between economicsand environmental concerns, HCPs should have clear scientific objectives, be based on the bestavailable data, and employ well-tested procedures. It is important to emphasize that wescrutinized HCPs and their use of data and inference from a strictly scientific (as opposed tolegal) perspective. We sought to determine whether a presumed impact, a proposed mitigationmeasure, and so forth could be scientifically substantiated given the data available. We adoptedthis strictly scientific stance because one of the outcomes of our analysis is a series ofrecommendations for improving the quality of scientific input; arriving at theserecommendations required that we keep a clear vision of the highest possible scientific standardsfor HCP implementation. Although the focus of this report is science, it is useful to keep in mindmore legal definitions of key terms such as “take,” “compliance monitoring,” “effects andeffectiveness monitoring,” etc. In Table 1 we define key legal terms and emphasize how our
- 7 -
more biological use of language differs from some of these legal definitions.
1.2. HCP Requirements
Applicants proposing HCPs must specify the impact that will result from the incidentaltake of listed species, what the plan does to minimize and mitigate the impact, and whatalternatives were considered (Table 2). NMFS is responsible for ultimately approving orrejecting the HCP (issuing the “incidental take permit”) for marine and anadromous species, andUSFWS is responsible for the remainder of listed species. The applicant may develop an HCPindependently, but USFWS often works with the landowner in the plan’s early stages, providingguidance as to what is or is not acceptable with respect to approval requirements. Typically,impact on species is minimized by limiting the geographic extent of harmful activities or theseasons when those activities are allowed (e.g., prohibiting timber harvest during the nestingseason of an endangered bird). Mitigation often involves setting aside (through purchase orconservation easements) habitat elsewhere. USFWS or NMFS can only issue an incidental takepermit if the HCP meets five criteria (Table 2). Incidental take permits are only issued forspecies listed as threatened or endangered, although for any unlisted species that is treated in theHCP as if it were listed, the landowner is assured of receiving a permit for that species when itbecomes listed.
No set of particular actions must be specified in an HCP for it to gain approval, andoverall the process is quite flexible. There is, however, standardized guidance in the form of theHabitat Conservation Planning Handbook distributed by NMFS and USFWS (USFWS andNMFS, 1996). The handbook gives general advice on all aspects of HCPs. It also suggestsexpediting small-scale HCPs, while indicating directions in which USFWS and NMFS wish todirect future HCPs, including habitat-based, multi-species planning and large-scale, multi-landowner plans. In addition, USFWS conducts training workshops across the country foremployees who help applicants develop and implement HCPs.
1.3. The Impetus and Aims of This Study
HCPs are not purely scientific documents—they are compromises between the interestsof resource development and conservation, and political and economic concerns play a majorrole. Some HCPs represent the outcome of negotiations that take years. HCPs have economic,political, and scientific dimensions. Because HCPs represent negotiated compromises, it isessential to know what exactly is “given up” in the process of arriving at a compromise. It iseasy to identify what is given up from the viewpoint of a private landowner, because the dollarvalue of future land development or exploitation is readily calculable. It is much harder toquantify what is given up in terms of a species’ prospects for long-term survival. That is thechallenge for the scientific component of HCPs.
To examine the scientific component of HCPs, we decided to use a highly structured,detail-driven approach to collecting information on HCPs. To date, criticisms andrecommendations about HCPs have emphasized broad policy implications and have sketchedgeneral qualitative attributes of particular HCPs (Hood, 1998; Noss et al., 1998). We sought todevelop a quantitative data base that sampled a “population of HCPs," so that our analysis wouldbe relevant to HCPs in general, and not only to particular HCPs. This highly structuredquantitative analysis complements the more flexible analyses previously published and, byuncovering broad trends within a substantial data base, will set the stage for further analyses.
- 8 -
To examine the role of science in HCPs, the National Center for Ecological Analysis andSynthesis (NCEAS) and the American Institute of Biological Sciences (AIBS) initiated a one-year project to analyze HCPs. A set of graduate seminars at eight universities (Florida StateUniversity; North Carolina State University; University of California, Berkeley; University ofCalifornia, Santa Barbara; University of California, Santa Cruz; University of Virginia;University of Washington; and Yale University) were coordinated during the fall of 1997. Theseseminars comprised a total working group of 119 researchers, including 106 students and 13faculty members. The group was charged with reviewing current plans to evaluate the extent towhich scientific data and methods were used in developing and justifying the agreements. Thegroup was also charged with recommending ways to strengthen the role of science inconservation planning. The group did not attempt to evaluate what effects the plans have had onbiological systems or species. Because the vast majority of HCPs have been initiated since 1994,it is simply too early to evaluate whether the plans are working. Moreover, our goal was not avague judgment of the overall quality of each plan or of the plans as a whole. Instead, the groupfocused on the scientific data and reasoning supporting the plans, paying particular attention tothe key issues of take, impact, mitigation, and monitoring. All of the data sheets, plandescriptions, and other detailed results from this effort are available on the NCEAS website:http://www.nceas.ucsb.edu/projects/hcp/
This paper is both our synthesis of the data available at this website, and a reader’s guideto the website. The scale of the data set is large—89,908 entries were recorded for HCPs (7,246for the set of 208 plans, 75,094 for species questions pertaining to the 43 focal plans, and 7,568for plan questions pertaining to the 43 focal plans). Throughout the paper, when discussing datawe use the following key: AQ refers to questions applied to all 208 plans, SQ refers to speciesquestions applied to the 43 focal plans, and PQ refers to plan questions applied to the 43 focalplans. The actual questions can be found in Appendix I.
2. METHODS AND RATIONALE FOR DATA COLLECTIONAND ANALYSIS
2.1. Obtaining a Sample of HCPs for Descriptive Statistics
As part of our effort, we sought to characterize the largest possible sample of plans interms of their most basic attributes. Data we attempted to identify for these plans included planduration and area, basic species information included in the plans, and other factual descriptorsof the agreements. Unfortunately, there is no centralized office or collection of HCPs. Wetherefore took advantage of the joint effort of the two nonprofit organizations, the NationalWildlife Federation (NWF) and the Earth Justice Legal Defense Fund (EJLDF), to assembleHCPs in Washington, DC. As of November 1997, they had compiled 208 of the 225 HCPscompleted at that time. The questionnaire applied to this sample of HCPs is given as AppendixI-C.
2.2. Detailed Data Collection for 43 Focal Plans
The time and energy required for careful evaluation of both an HCP and the relevantbackground information precluded a detailed investigation of all plans. We therefore selected 43
- 9 -
focal plans (21% of the all plans available at the time the project began) for detailed analysis.Plans were chosen non-randomly, to span the range of geography, size, duration, methods, andapproval dates represented in the entire population of HCPs (Appendix II-B lists these 43 plans).
For the focal plans we performed three types of data collection. The first wasaccumulating evidence demonstrating the presence or absence of several types of scientificinformation. For this segment of our analysis, we chose a priori to define an “HCP package” asincluding the HCP itself, the incidental take permit (ITP), implementing agreement (IA),biological opinion, and any associated environmental review documents (EA/EIR/EIS). Thesedocuments were consulted for all focal plans for which they were available (some HCPs mightlack some of these documents). Information contained in these and any other explicitlyreferenced documents was considered to be included in the plan. Second, we gathered generaldata about the HCP setting and the species covered by the associated incidental take permit.Many of these data were found in the documents listed above, but to augment them, corroborateconclusions made in the HCP documents, and provide a comparison to existing scientificknowledge, we completed surveys of relevant literature (which included both articles publishedin journals and the so-called “gray literature,” represented by reports prepared by governmentagencies and consulting firms). In gathering this information, we considered all reports andpublications available at least one year before the date of the HCP’s approval as having beenavailable for the HCP preparers. For 32 of the focal plans, we collected species-specific data forall species covered on the incidental take permit. For the other 11, we chose a taxonomicallyrepresentative subset of the species covered. Finally, we gathered information about the localcontext and characteristics of the HCPs that included data about plan developers/preparers andthe policy or social contexts in which plans were developed. Often, this profile was developedfrom both anecdotal and formal discussions with USFWS employees, consultants who workedon the development phase, and various stakeholders.
Our goal in analyzing these focal plans was not judgment of the overall quality of eachplan, or plans as a whole, but rather a rigorous analysis of a variety of detailed questions aboutHCPs: What types of data or analysis do HCPs use well? What available information isignored? Are data unavailable that are crucial to sound planning? Of the many steps in theplanning for each species covered in an HCP, which are usually done well and which poorly?Which of the many features of a plan (size, duration, etc.) and of the plan’s preparation (whoprepared it, was there a scientific advisory committee?) are important in influencing its scientificadequacy? Answering these questions requires “dissecting” each plan—gathering information onits many factors and parts, so that statistical analysis can be used to judge what factorssignificantly influence the scientific quality of HCPs as a whole and to allow a clear assessmentof the adequacy of existing HCPs. To ensure consistency of information gathering acrossgroups, and to put the resulting data into an organized and analyzable form, we developed twoseparate data questionnaires; one asked for information on the plans themselves, whereas theother focused on species listed in the incidental take permit and the treatment in HCPs of thesespecies (see website). In total, the Plan questionnaire contained 176 questions/subquestions perplan studied, and the Species questionnaire contained 789 questions/subquestions per species perplan (these complete questionnaires are given as Appendices I-A and I-B).
The questions asked in the two questionnaires fall into three categories:
• For both plans and species, many questions seek to detail simple (although not always simpleto acquire) factual information about the HCPs, the species, and the preparation process.
- 10 -
Essentially all plan questions are of this type.
• For species, a large number of questions address the details of what scientific data andanalyses were used in formulating different steps in the planning process. Most involved aset of four parallel questions, which for a broad array of data categories asked (1) whetherinformation of this type was used in the HCP, (2) the source of the data, (3) the quality of theuse of this type of data, and (4) whether any important data of this type were missing fromthe HCP. In addition, there are questions about the importance of these types of data forapplication to the species and situation at hand. Together these questions seek to determinewhat data were used in formulating the HCP, the quality of their use, and their relativeimportance.
• Finally, both for detailed types of biological information and for larger steps in the HCPanalysis process, the species questionnaire asked for judgments of the quality of the analysis.
Because the data included in the plan and species questionnaires form the basis of ourresults, it is important to describe the approach we took in designing and then analyzing thesequeries. As a whole, the questions were designed to generate a detailed profile of each HCP, todocument the use (or lack thereof) of many different types of scientific tools and data, and tocharacterize the availability of these tools and data. The questions evolved over the first weeksof the project, as online discussion led to the creation of new questions, the deletion ormodification of existing questions, and official “consensus interpretation” of ambiguousquestions. We do not presume that these questionnaires are comprehensive, but they werecertainly sufficient to generate a large body of data on our 43 sampled HCPs, covering the fullspectrum of HCP ingredients.
Three lines of reasoning led us to the final set of questions in each questionnaire. First,we did not feel that it was either scientifically justifiable or most productive to judge theadequacy of entire plans, so we sought to confine our “quality judgments” to much smallersegments of analysis. This approach should better reveal the strengths and weaknesses of HCPsand suggest improvements in the HCP process. Second, the battery of questions is large, both tominimize the danger of missed information and to leave open the door to unexpected findings orissues. Third, because it is difficult to make scientifically defensible judgments about the qualityor adequacy of even small pieces of a plan, each question regarding adequacy follows anextensive series of questions about the details of the information and analysis that were used inthe plan, that were left out, and that would be needed to improve the analysis. Our goal was tolead ourselves (and others reviewing our results) through a clearly articulated set of steps thatwould clarify our judgments about importance and adequacy of different types of information. Itwas impossible to write out a rigid and explicit definition of “adequate” or a ranking score foreach question, because we were flexible in our scoring. For example, if an HCP involved only asmall amount of land and minimal take, we would score a rather crude assessment of “impact” asadequate simply because it was obvious there was no need to be especially careful for such anegligible activity. In other words, as professional biologists, we asked what level of scientificproof was required for different activities, depending on those activities and their context. Allscorings and evaluations were presented to the local university seminar group and thus weresubject to internal peer review by up to 20 other biologists. This review was an important part ofthe process. The graduate students involved included many with masters degrees (about one-third), some with extensive work experience in environmental consulting or as employees ofUSFWS, and some who had actually helped write HCPs. The biological, statistical, and practical
- 11 -
experience of this large cohort of graduate students compares favorably with those employees ofUSFWS who actually administer the HCP process.
In sum, our approach of using detailed questionnaires to evaluate HCPs was designed (1)to include unexpected but important information, (2) to allow the dissection of plans so that clearjudgments could be made about their merits and faults, and (3) to make transparent the reasonsfor our judgments of quality. Although inevitably imperfect, our approach allows us to developa detailed analysis of the limitations and the strengths of HCPs. In particular, it takes theanalysis of HCPs away from the realm of unsubstantiated expert opinion and into an empiricallybased arena where arguments over methods and conclusions can be articulated, debated, andrevisited.
2.3. A Framework for Judging the Biological Adequacy of HCPs
To be scientifically credible, HCPs must address a variety of issues for each speciescovered. Although in theory our data set allows us to address the scientific credibility of HCPsin their entirety, it is more informative to clarify the particular stages in habitat conservationplanning where scientific knowledge or analysis may limit the scientific foundation of HCPs.How should the integrated process of HCP planning be dissected, however? Although there isno set of hard-and-fast rules or steps to which all HCPs must conform, the USFWS/NMFS HCPhandbook mandates several issues that each HCP must address for species covered in theincidental take permit (USFWS and NMFS, 1996). Our review of HCPs, in combination withthese mandated steps, led us to divide the HCP planning and analysis process into five stages:
• Analysis of current status of the species• Analysis of take under the planned activities• Analysis of the biological impact of the anticipated take.• Analysis and planning of mitigation for the anticipated take.• Analysis and planning of monitoring activities to follow the future status of the species, the
actual take, and the effectiveness of mitigation procedures.
It is important to emphasize that failure to address any one of these stages adequatelycalls into question the adequacy of planning for a species, even if all other stages are addressedextremely well. For example, an HCP might have excellent data on the current status of aspecies, have excellent estimates of take and the impact of take on population health, and have agood monitoring plan, but if the proposed mitigation procedures are untested and there are noplans to allow for their review and modification, the plan is not scientifically credible. Similarly,a seemingly reasonable plan can be formulated that has good estimates of everything but theactual effect of the planned take on the population viability of the species. In this case, again, theentire plan is questionable, because there may be no good way to judge the real impact of theplanned activities and hence the adequacy of planned mitigation work. These examples illustrateboth that the division of plans into five stages is somewhat artificial and that each of these stepsmust somehow be addressed in an HCP for the whole plan to be a scientifically credibleblueprint for balancing potentially damaging actions with potentially beneficial ones.
2.4. Units of Analysis
For the questions we address, two units of analysis are logical: (i) the individual HCPand (ii) the treatment of an individual species within an HCP. Plans are the basic unit in which
- 12 -
HCPs are approved and implemented, and many of the steps or issues in the HCP process areinextricably part of an entire plan’s formulation, but species protection is the goal and mandateof the ESA and of the individual plans. Similarly, although plans with many species will beover-represented in a strictly species-by-species analysis, this is to some extent as it should be.We therefore use a combination of approaches; some analyses are done at the plan level andsome at the species level. When performing most significance tests for species-level analyses,we either include plan as a factor in the analysis or use a weighting factor that discounts theeffect of a species by the number of analyzed species from that plan (1/(number of species in theplan included in our analysis)). One factor we do not consider in most of our analyses is theoccurrence of the same species in multiple plans; because each plan analyzes different impacts indifferent places, it seems correct to count each plan-species combination as a separate data point.We also minimized the bias that could arise from making judgments on the basis of a largenumber of “minor species,” when a plan was actually written primarily for just one or two majorspecies. It would be unfair to call the scientific foundation of such a plan weak because it failedto deal with the minor species but did a superb job with the major species. We deal with thispossible bias in two ways: (1) by choosing as a subsample only a few species (and always onlylisted species) from plans with long lists of species to be covered by the Incidental Take Permitand (2) by rating a plan’s overall adequacy with respect to monitoring and so forth primarily onthe basis of how well it applied to the main species. For example the Washington Plum Creekplan covers four listed species (grizzly bears, gray wolves, marbled murrelets, and northernspotted owls) and 281 non-listed species (some of which were candidate species and may belisted in the future). For this plan, we examined only the four listed species, and, because thisplan was really tailored to northern spotted owls, we used the plan’s performance with respect tospotted owls as the major issue to be evaluated.
3. CHECKS ON DATA REPRESENTATION AND ACCURACYOF ANALYSIS
With 89,908 entries in our data base and analyses conducted by several differentindividuals and universities, there was obviously an opportunity for errors to creep into our data.To offset this problem, we enlisted the cooperation of the USFWS and sent them a preliminarydraft of the manuscript, the questionnaires, and all of the data. The USFWS then coordinated areview of all of these materials. Importantly, the data were sent to the USFWS regions that hadoriginally approved the HCPs of concern. After a heroic review process, the USFWS suggestedchanges for 4367 data entries. We made 4328, or 99.1%, of their requested changes. It isimportant to note the tremendous effort USFWS put into examining our data base, and also toacknowledge that USFWS in no way endorses or takes responsibility for our data or ourinterpretations of the data. We simply point out that the raw data themselves were reviewedinternally by our own research group and externally by USFWS. There still certainly remainerrors, but we doubt that the analyses we report would be substantially altered by the errors in thedata. For example, observation errors for field counts of animals are often on the order of 10-40%, a magnitude of error we are confident we were well below. All analyses, with oneexception, are performed on the corrected data, and the data on the website represent thecorrected data. The one exception is our analyses of “school bias,” in which we asked whethergroups from the participating universities answered questions differently. For that analysis, weused the “uncorrected data,” because error rate is one way in which the groups might differ.
For many of the analyses presented below, we use one of the two questions that
- 13 -
summarize the adequacy of each of the five stages of the HCP process (see above). To assesswhether they are valid measures of scientific adequacy, we regressed the graded-scale (1-6)measures of adequacy (see Appendix I-B) for each section on seven aggregate variablesindicating the knowledge about, and analysis of, various categories of biological informationabout each species (see website and Appendix I). We used both one-way regressions using justone set of biologically distinct answers to detailed questions (e.g., data on changes in numbers ordemography) and multiple regressions using combinations of variables. These multipleregressions usually had much lower sample sizes than did the simpler analyses, due to manycombinations of missing values. All analyses were performed on normalized variables. For eachof the five stages, some types of information or types of question (e.g., the presence of dataversus the type of analysis of the data) had little effect on quality rating, whereas others wereextremely good predictors. For each stage, the R2 values for the single best regression are Status,0.66; Take, 0.92; Impact, 0.59; Mitigation, 1.0; Monitoring (performed separately formonitoring of take, status, and mitigation), 0.92, 0.91, 0.92. Overall, the results from theseanalyses show that the summary rankings are well predicted by the details of data and analysisused at each step of the HCP process (see Tables 3 and 4, and Appendix III).
Because of the time and effort needed to find, read, and synthesize the full backgrounddata for each of the 43 focal HCPs, each plan was analyzed in depth by only one university.Because the participants at different universities differed in background, and because of theunique cultural differences among our groups (e.g., Yale versus U.C. Berkeley versus N.C. StateUniversity), we were concerned to test that the identity of the evaluating university did notsubstantially influence plan evaluation. Two problems could arise from such differences. Oneof these is loss of power to detect real differences and effects in the plans due to added noise.The second and more serious problem is systematic biases in the patterns we see among plans.Furthermore, as noted above, we are often interested in analyzing for species-level effects andmust therefore account for the correlation in species answers due to plan-level effects.
To check for university biases, we fit a set of mixed linear models to species-level datausing SAS PROC MIXED, which allowed us to assess the effects of institution on the adequacyratings in five major areas (Status, SQ:B43; Take, SQ:C33; Impact, SQ:D47; Mitigation,SQ:E49; and Monitoring, SQ:F80). We used these models to determine whether universitiesdiffered with respect to ratings and whether these differences affected the statistical significanceof the relationship of the five adequacy ratings to the factors Date, Duration, Multiple Species(yes/no), Taxon, and Area. In the model, university and plan were considered random factors,and Date, Duration, Multiple Species, Taxon, and Area were considered fixed factors (Date,PQ:181; Duration, PQ:178, Plan Species Number (from PQ:11, coded for three levels), TaxonSQ:A3; Area, PQ:182; Existence of Recovery Plan, SQ:A8). The results showed that only forMitigation effects was the school to school variation a sizeable portion of the residual variation(Table 5). In sum, these tests for university biases suggest that there are generally not strong orconsistent differences in the ratings of different universities—certainly nothing of a magnitudethat is likely to influence our results or conclusions.
4. A DESCRIPTIVE OVERVIEW OF HCPs
Before beginning our analysis of how science is used in HCPs, we report the generalcharacteristics and diversity of the HCPs in our sample of 208. In particular, we summarizedescriptive data about where HCPs were implemented, who developed them, why they weredeveloped, how large an area they address, how long they last, what species they address, and
- 14 -
what approaches to habitat conservation planning are used. Second, we describe these samecharacteristics for our intensively studied sample of 43 focal HCPs and compare them to thelarger set of 208 plans.
4.1. Attributes of Sample of 208 HCPs
More than 70 of the sample of 208 HCPs were coordinated and approved within theBalcones Canyonlands Conservation Planning area in Texas. Because these plans are verysimilar to one another and may bias general patterns of HCP characteristics, we report tworesults whenever appropriate: one based on data for all 208 plans and one excluding data for theBalcones Canyonlands plans.
Any nonfederal entity can develop an HCP in support of an incidental take permitapplication. Most HCPs (82%) were submitted by single private landowners (either corporationsor individuals). Just 3% of HCPs were submitted by state and local governments. Fourteenpercent were developed for lands under multiple jurisdictions (these could be public, private, orboth); an example of a multiple-jurisdiction plan is the Orange County NCCP (see website plannarratives). If the Balcones Canyonlands plans, which were developed for numerous privatelandowners, are excluded, these proportions change to 72% private, 5% public, and 22%multiple jurisdiction. The areas covered by HCPs can differ dramatically—on an “area basis,"the figures are 14% private, 18% public, and 67% multiple jurisdiction.
HCPs are developed because some action is expected to take threatened or endangeredspecies and thus to have impact, which can be either reversible or irreversible. Reversibleimpacts include those that could be expected to diminish substantially in 100 years or less;examples include the impacts of timber harvest rotations or livestock grazing. Irreversibleimpacts are those that have a permanent effect on species or their habitats, such as urbanizationor land conversion. Fourteen percent of HCPs will result in reversible impacts and 81% inirreversible impacts. Five percent will have both reversible and irreversible impacts. WhenBalcones Canyonlands plans are excluded, the proportions shift to 23% having reversibleimpacts, 69% having irreversible impacts, and 8% having both. Data collected for the 43 focalHCPs allowed a more specific characterization of land uses motivating HCPs. Within thissmaller dataset, the primary land use changes were specifically defined, e.g. agriculture, logging,urban development. For each plan, various land uses were ranked according to their importancein motivating that plan; a ranking of 1 identified the land use change that was the primarymotivation for the HCP (PQ:42-49). Although plans may be motivated by many differentchanges in land use, 56% of those we examined in depth (24 of 43) were motivated byconstruction of buildings; logging came in second at 19% (8 of 43).
We analyzed the duration and size distribution for HCPs using the larger data set of 208plans. Land areas covered are extraordinarily diverse, spanning six orders of magnitude. Thesmallest approved plan protects the Florida scrub jay (Aphelocoma coerulescens) on just 0.17 ha(0.4 acres). The largest plan to date covers over 660,000 ha (over 1.6 million acres) of forestmanaged by the state of Washington Department of Natural Resources. Nevertheless, mostHCPs are relatively small. The median size is less than 10 ha (24 acres), and 74% of HCPscover fewer than 100 ha (240 acres). If Balcones Canyonlands HCPs are excluded, the mediansize increases to about 44 ha (110 acres), and 59% of HCPs cover fewer than 100 ha (250acres).For simplicity and comparative purposes, HCPs were categorized as small (0-10 ha), medium(>10-1000 ha), or large (>1000 ha). The largest proportion of all HCPs falls in the small size
- 15 -
category (50%). When the Balcones Canyonlands plans are excluded, the largest fraction falls inthe medium category (48%). No directional trend over time in the mean size of HCPs isapparent. Regressions with and without Balcones Canyonlands plans of log(area) of HCPs onyear of approval yield slopes not significantly different from zero (P > 0.14 and P > 0.07,respectively). Some recently approved plans are larger than their predecessors, but other recentplans are smaller, suggesting only that the aerial extent of HCPs has diversified with time.
The length of time over which an HCP is to be implemented is correlated with theduration of the ITP for which the plan was developed. Plan durations are diverse, ranging fromseven months for a plan in Travis County, Texas, to 100 years for HCPs implemented by theMurray Pacific Company in Washington. Two plans developed for private properties in Texasare to be maintained in perpetuity. Excluding those two plans, the median duration of HCPs is10 years, and 60% of HCPs will be maintained for 20 or fewer years. Excluding the BalconesCanyonlands plans, the median duration of HCPs increases to 22.5 years. Over time, thedurations of approved HCPs have diversified, but they exhibit no significant directional trend.When Balcones Canyonlands plans are excluded from analysis, a regression of plan durations onapproval dates suggests that more recent plans may be longer, but the trend is not statisticallysignificant (P > 0.15).
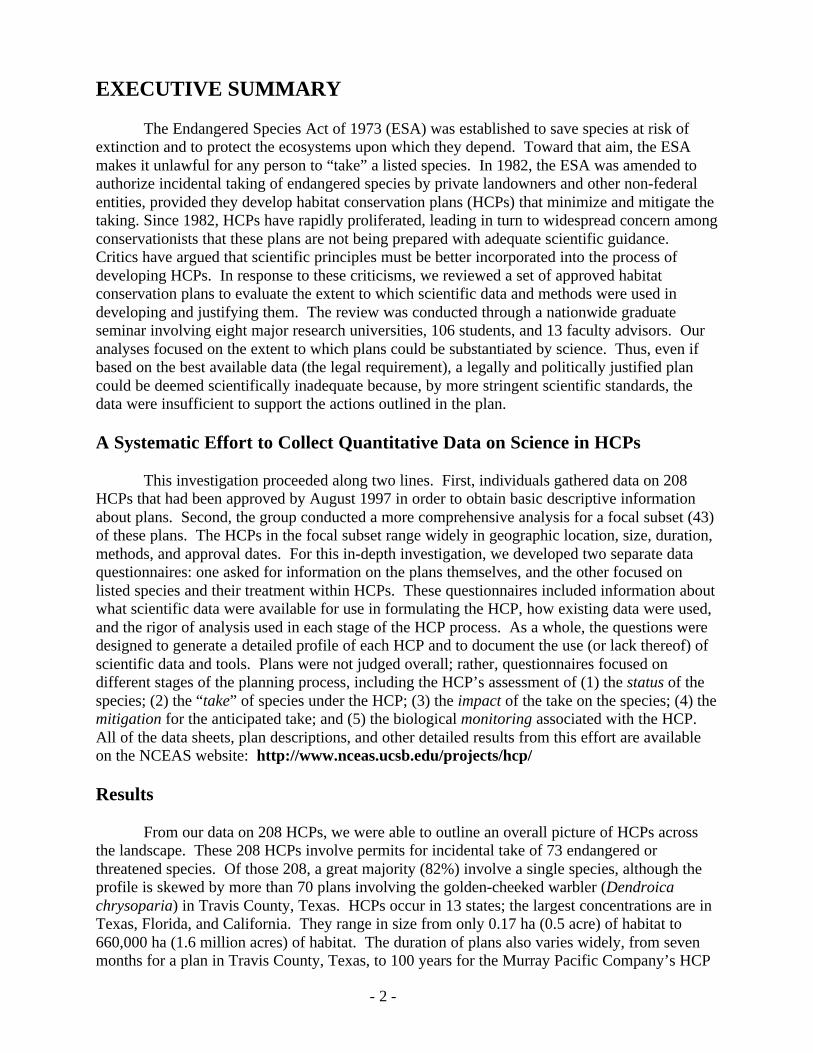
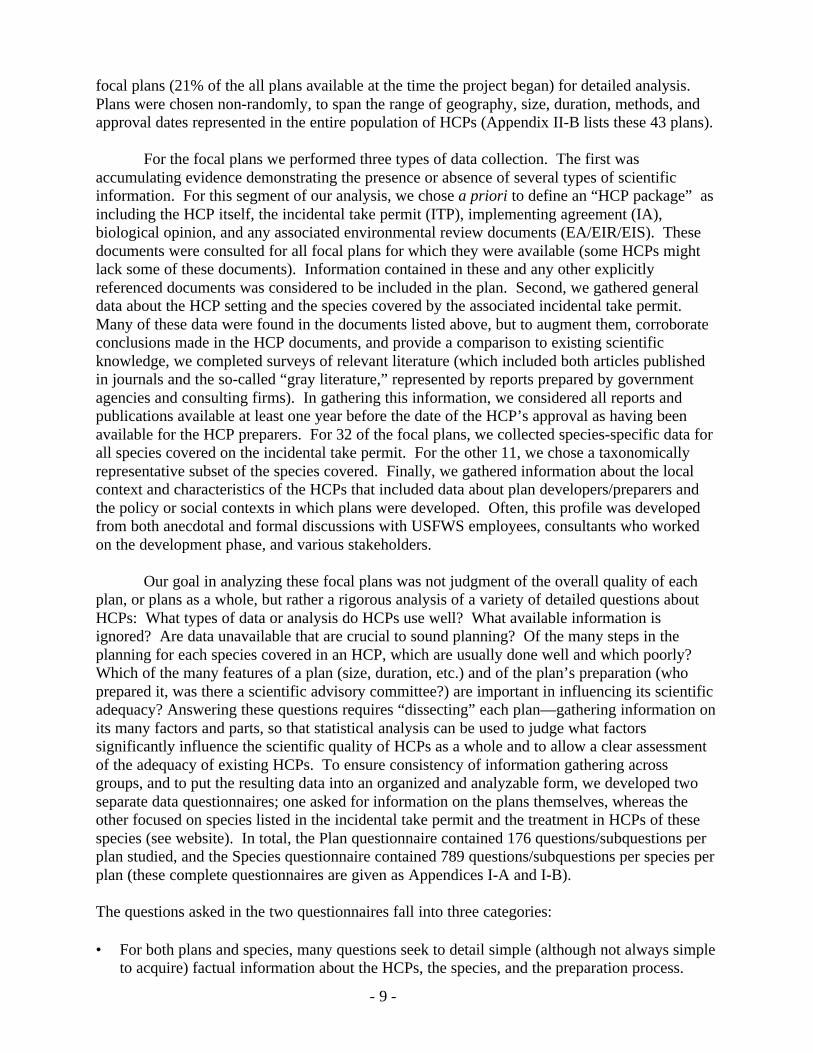
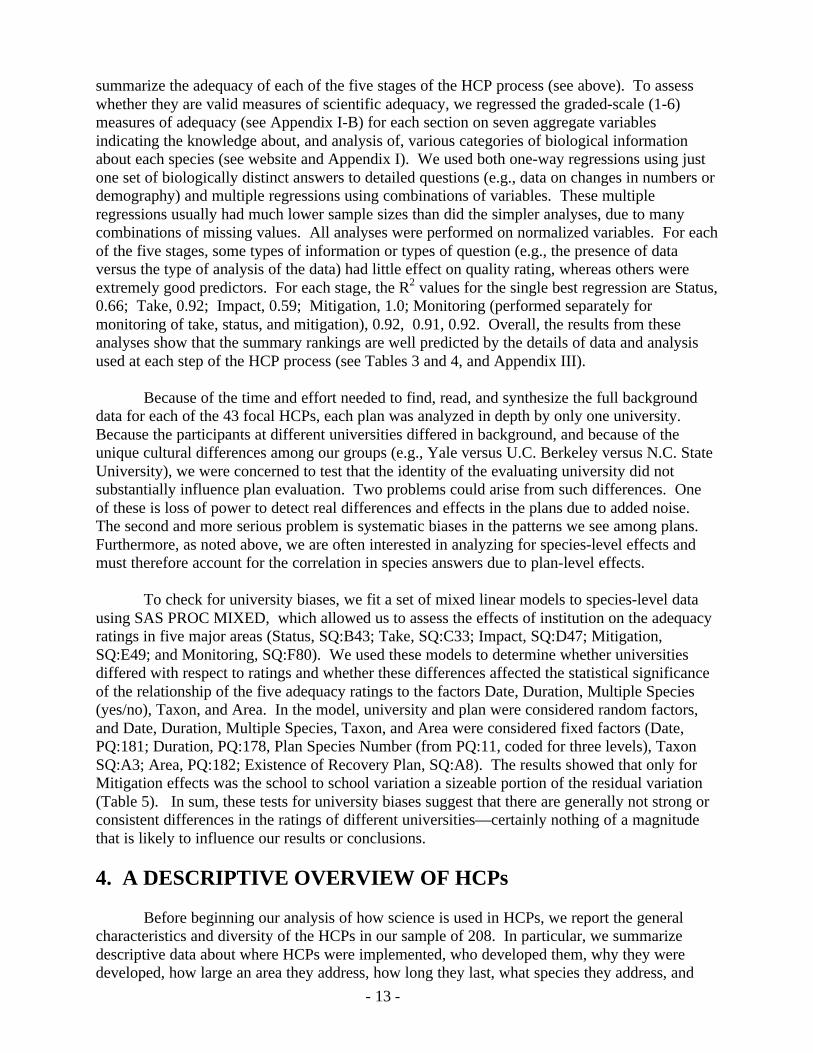
Although no HCPs show directional trends in either duration or area, these two charactersare positively correlated with one another (Figure 1). A regression of HCP duration on HCP areayielded a positive relationship in which small HCPs tend to have shorter durations and largerplans longer durations (P < 0.001). Such a relationship seems reasonable because a largerplanning area may necessitate a longer planning horizon.
The 208 HCPs examined cover 73 threatened and endangered animal species: 22 birds,13 mammals, 19 reptiles and amphibians, 18 invertebrates, and 1 fish (Table 6). Fifteen speciesof plants are also covered under HCPs, even though the ESA does not mandate such protectionon non-federal lands. The number of HCPs that cover various threatened and endangered taxaare presented in Table 6. The majority of HCPs (143) cover one or more bird species. Mammalsand covered by 32 HCPs and amphibians and reptiles by 33.
Because HCPs can address conservation of single species, multiple species, or habitats,the assessment of status, take, impact, and mitigation measures vary accordingly. For single-species plans, they are species specific. Multi-species plans are essentially scaled-up versions ofsingle-species plans. Assessments of status, take, and impact are done for each covered species;mitigation measures may address multiple species simultaneously but are still species-specific.Habitat-based plans represent a distinctly different approach. They are based on the premisethat, by protecting the ecological integrity of a natural habitat, one also protects the many specieswithin that habitat (USFWS and NMFS, 1996). Such plans de-emphasize species-specificanalyses and mitigation measures, focusing instead on more holistic protection and managementof the habitat. Most HCPs (84%) are single-species plans. Multi-species plans make up 12%and habitat-based plans only 4%. Excluding the Balcones Canyonlands plans shifts theseproportions to 74% single-species plans, 7% multi-species plans, and 19% habitat-based plans.Habitat-based plans have only been developed since 1993, so their prominence among HCPs islikely to change in the future. Certainly there is increasing interest in assessing the quality oflarge habitat-based plans because of their larger spatial scale and biological breadth.
Log of HCP area (ha)
0.1 1 10 100 1000 10000 100000 1000000
Dur
atio
n (y
rs)
0
10
20
30
40
50
60
70
80
90
100
110
Figure 1. The relation between plan duration (AQ:3) and plan area (AQ:6a). The line shown is the best fit-linear regression, with R2=0.27 and p<0.01. (N=192 HCPs)
- 17 -
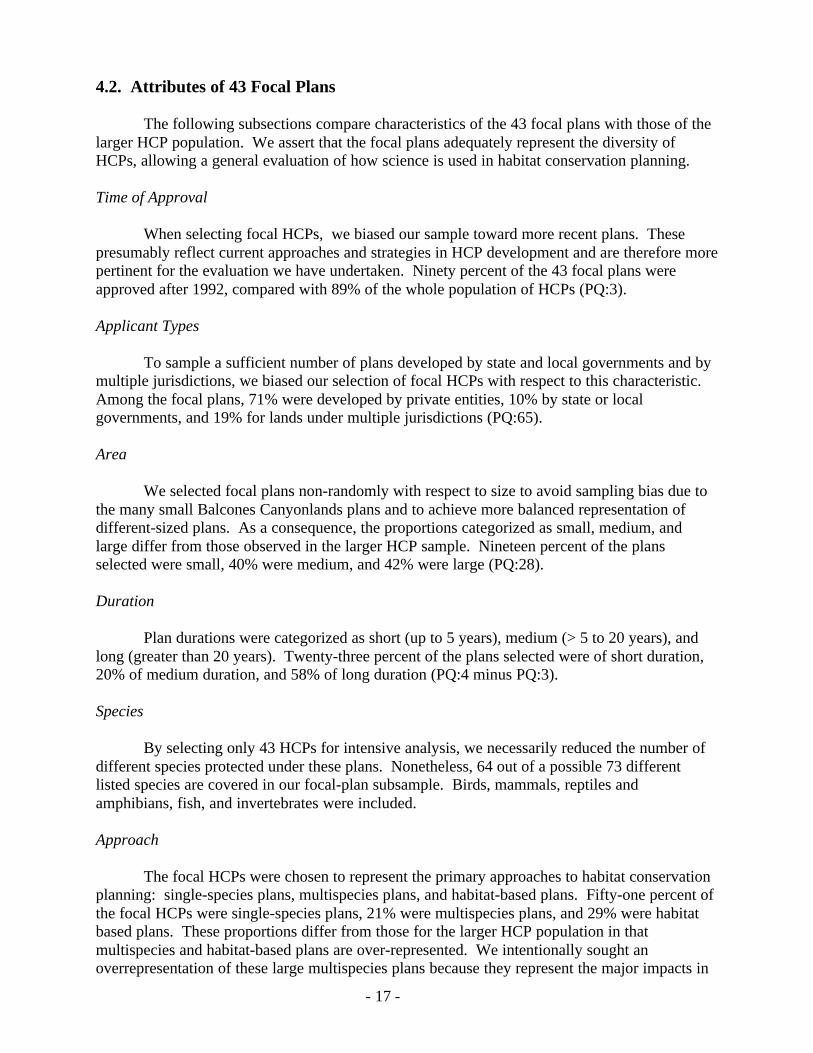
4.2. Attributes of 43 Focal Plans
The following subsections compare characteristics of the 43 focal plans with those of thelarger HCP population. We assert that the focal plans adequately represent the diversity ofHCPs, allowing a general evaluation of how science is used in habitat conservation planning.
Time of Approval
When selecting focal HCPs, we biased our sample toward more recent plans. Thesepresumably reflect current approaches and strategies in HCP development and are therefore morepertinent for the evaluation we have undertaken. Ninety percent of the 43 focal plans wereapproved after 1992, compared with 89% of the whole population of HCPs (PQ:3).
Applicant Types
To sample a sufficient number of plans developed by state and local governments and bymultiple jurisdictions, we biased our selection of focal HCPs with respect to this characteristic.Among the focal plans, 71% were developed by private entities, 10% by state or localgovernments, and 19% for lands under multiple jurisdictions (PQ:65).
Area
We selected focal plans non-randomly with respect to size to avoid sampling bias due tothe many small Balcones Canyonlands plans and to achieve more balanced representation ofdifferent-sized plans. As a consequence, the proportions categorized as small, medium, andlarge differ from those observed in the larger HCP sample. Nineteen percent of the plansselected were small, 40% were medium, and 42% were large (PQ:28).
Duration
Plan durations were categorized as short (up to 5 years), medium (> 5 to 20 years), andlong (greater than 20 years). Twenty-three percent of the plans selected were of short duration,20% of medium duration, and 58% of long duration (PQ:4 minus PQ:3).
Species
By selecting only 43 HCPs for intensive analysis, we necessarily reduced the number ofdifferent species protected under these plans. Nonetheless, 64 out of a possible 73 differentlisted species are covered in our focal-plan subsample. Birds, mammals, reptiles andamphibians, fish, and invertebrates were included.
Approach
The focal HCPs were chosen to represent the primary approaches to habitat conservationplanning: single-species plans, multispecies plans, and habitat-based plans. Fifty-one percent ofthe focal HCPs were single-species plans, 21% were multispecies plans, and 29% were habitatbased plans. These proportions differ from those for the larger HCP population in thatmultispecies and habitat-based plans are over-represented. We intentionally sought anoverrepresentation of these large multispecies plans because they represent the major impacts in
- 18 -
terms of total area and because there has been a move toward increasingly favoring these typesof plans (although small single-species plans continue to play a role) (PQ:7 and PQ:8).
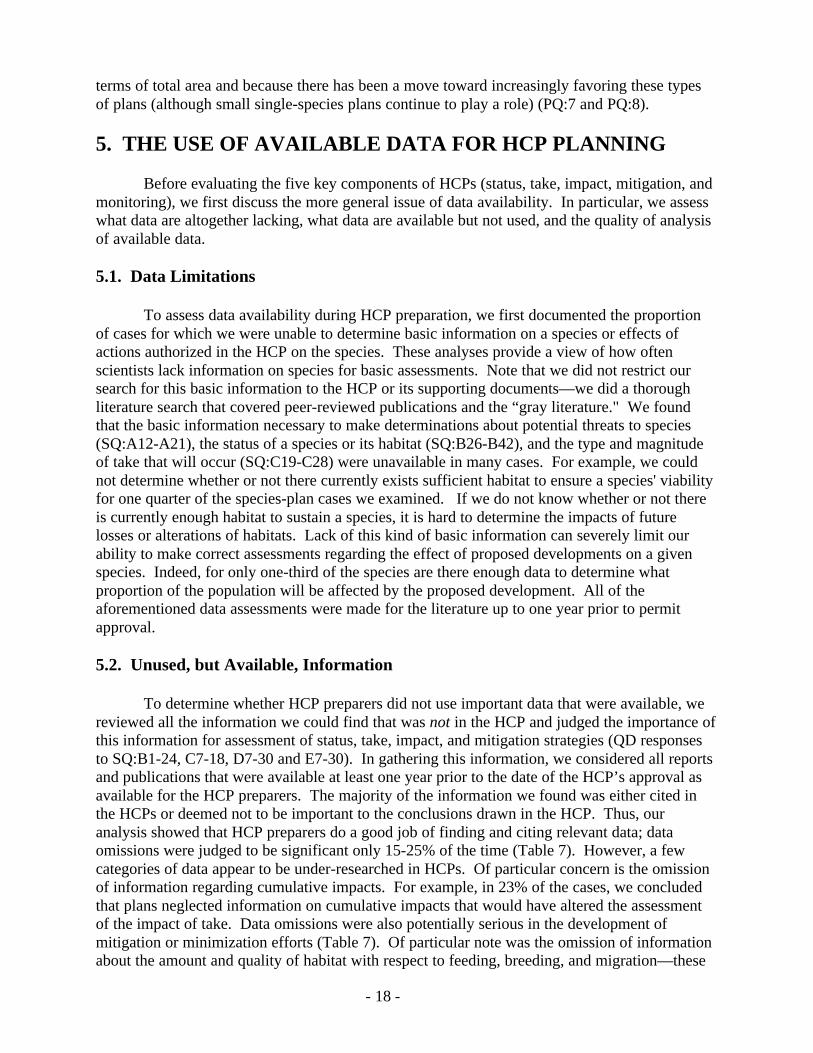
5. THE USE OF AVAILABLE DATA FOR HCP PLANNING
Before evaluating the five key components of HCPs (status, take, impact, mitigation, andmonitoring), we first discuss the more general issue of data availability. In particular, we assesswhat data are altogether lacking, what data are available but not used, and the quality of analysisof available data.
5.1. Data Limitations
To assess data availability during HCP preparation, we first documented the proportionof cases for which we were unable to determine basic information on a species or effects ofactions authorized in the HCP on the species. These analyses provide a view of how oftenscientists lack information on species for basic assessments. Note that we did not restrict oursearch for this basic information to the HCP or its supporting documents—we did a thoroughliterature search that covered peer-reviewed publications and the “gray literature." We foundthat the basic information necessary to make determinations about potential threats to species(SQ:A12-A21), the status of a species or its habitat (SQ:B26-B42), and the type and magnitudeof take that will occur (SQ:C19-C28) were unavailable in many cases. For example, we couldnot determine whether or not there currently exists sufficient habitat to ensure a species' viabilityfor one quarter of the species-plan cases we examined. If we do not know whether or not thereis currently enough habitat to sustain a species, it is hard to determine the impacts of futurelosses or alterations of habitats. Lack of this kind of basic information can severely limit ourability to make correct assessments regarding the effect of proposed developments on a givenspecies. Indeed, for only one-third of the species are there enough data to determine whatproportion of the population will be affected by the proposed development. All of theaforementioned data assessments were made for the literature up to one year prior to permitapproval.
5.2. Unused, but Available, Information
To determine whether HCP preparers did not use important data that were available, wereviewed all the information we could find that was not in the HCP and judged the importance ofthis information for assessment of status, take, impact, and mitigation strategies (QD responsesto SQ:B1-24, C7-18, D7-30 and E7-30). In gathering this information, we considered all reportsand publications that were available at least one year prior to the date of the HCP’s approval asavailable for the HCP preparers. The majority of the information we found was either cited inthe HCPs or deemed not to be important to the conclusions drawn in the HCP. Thus, ouranalysis showed that HCP preparers do a good job of finding and citing relevant data; dataomissions were judged to be significant only 15-25% of the time (Table 7). However, a fewcategories of data appear to be under-researched in HCPs. Of particular concern is the omissionof information regarding cumulative impacts. For example, in 23% of the cases, we concludedthat plans neglected information on cumulative impacts that would have altered the assessmentof the impact of take. Data omissions were also potentially serious in the development ofmitigation or minimization efforts (Table 7). Of particular note was the omission of informationabout the amount and quality of habitat with respect to feeding, breeding, and migration—these
- 19 -
are key aspects of habitat that will be central to any mitigation for habitat loss.
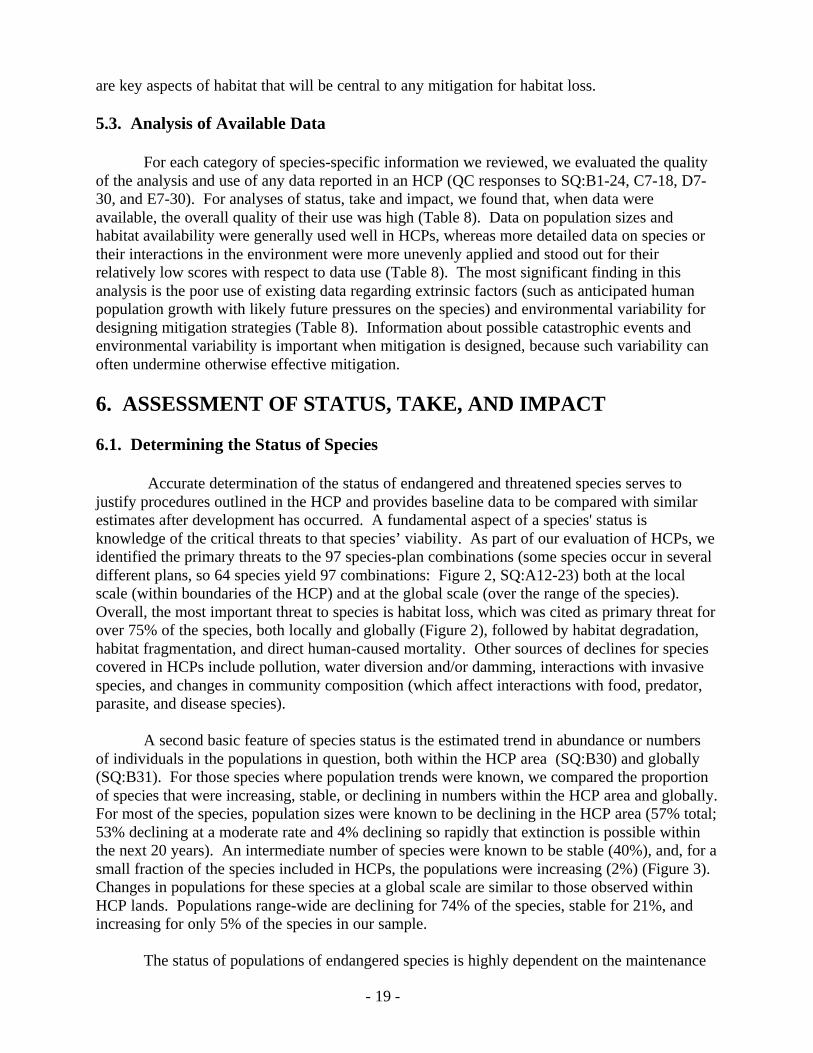
5.3. Analysis of Available Data
For each category of species-specific information we reviewed, we evaluated the qualityof the analysis and use of any data reported in an HCP (QC responses to SQ:B1-24, C7-18, D7-30, and E7-30). For analyses of status, take and impact, we found that, when data wereavailable, the overall quality of their use was high (Table 8). Data on population sizes andhabitat availability were generally used well in HCPs, whereas more detailed data on species ortheir interactions in the environment were more unevenly applied and stood out for theirrelatively low scores with respect to data use (Table 8). The most significant finding in thisanalysis is the poor use of existing data regarding extrinsic factors (such as anticipated humanpopulation growth with likely future pressures on the species) and environmental variability fordesigning mitigation strategies (Table 8). Information about possible catastrophic events andenvironmental variability is important when mitigation is designed, because such variability canoften undermine otherwise effective mitigation.
6. ASSESSMENT OF STATUS, TAKE, AND IMPACT
6.1. Determining the Status of Species
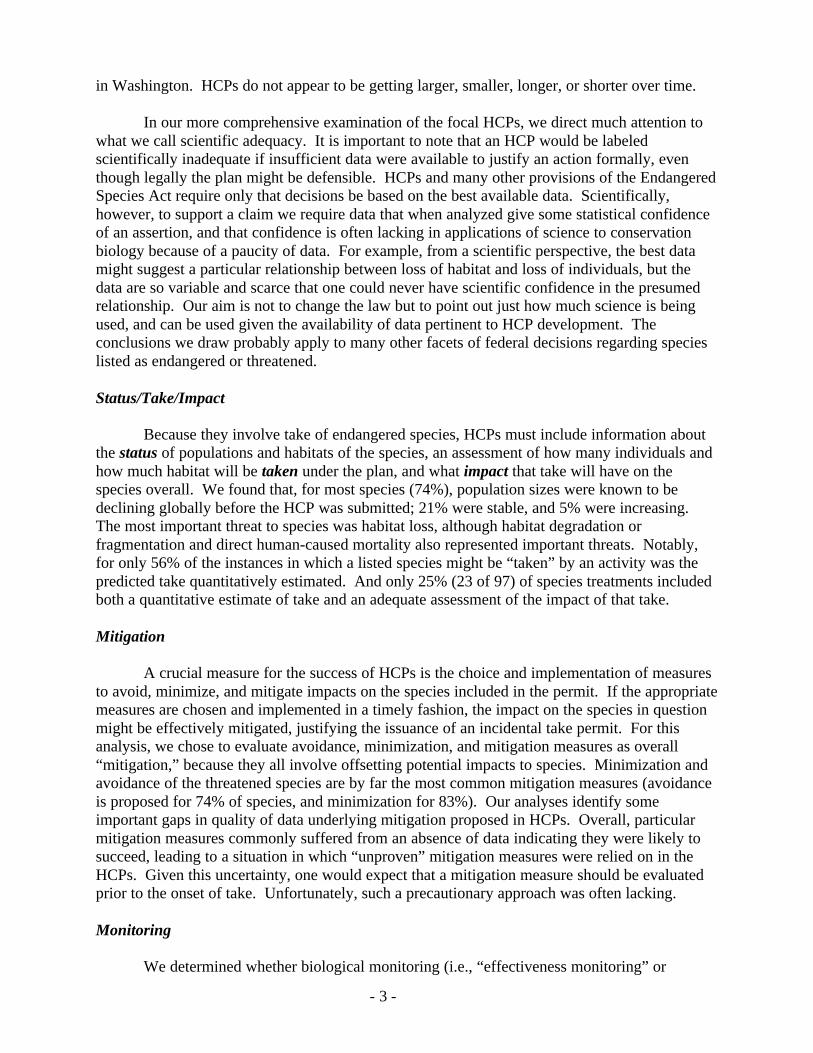
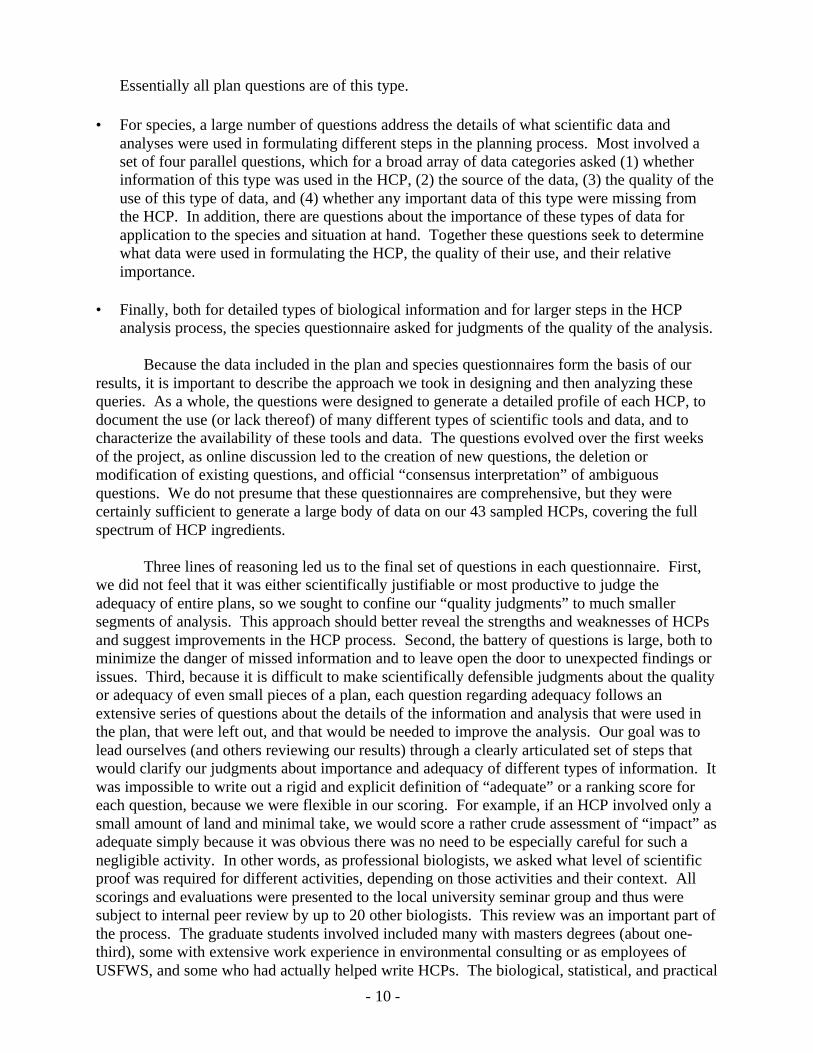
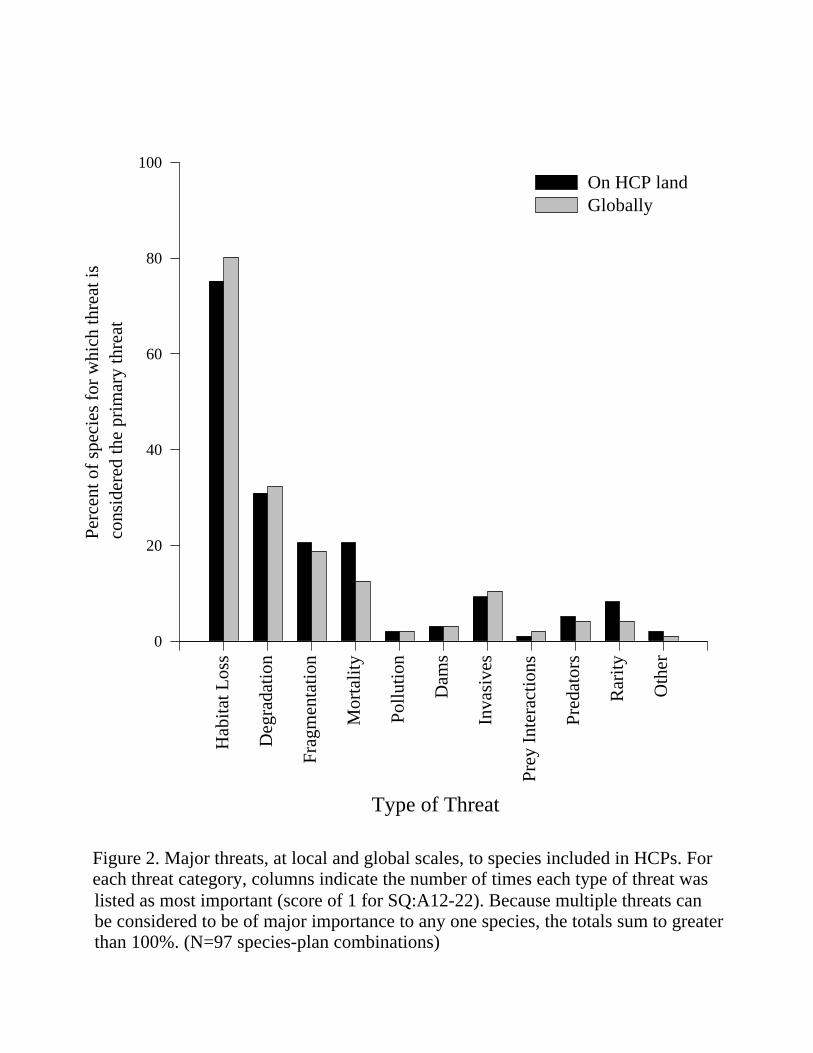
Accurate determination of the status of endangered and threatened species serves tojustify procedures outlined in the HCP and provides baseline data to be compared with similarestimates after development has occurred. A fundamental aspect of a species' status isknowledge of the critical threats to that species’ viability. As part of our evaluation of HCPs, weidentified the primary threats to the 97 species-plan combinations (some species occur in severaldifferent plans, so 64 species yield 97 combinations: Figure 2, SQ:A12-23) both at the localscale (within boundaries of the HCP) and at the global scale (over the range of the species).Overall, the most important threat to species is habitat loss, which was cited as primary threat forover 75% of the species, both locally and globally (Figure 2), followed by habitat degradation,habitat fragmentation, and direct human-caused mortality. Other sources of declines for speciescovered in HCPs include pollution, water diversion and/or damming, interactions with invasivespecies, and changes in community composition (which affect interactions with food, predator,parasite, and disease species).
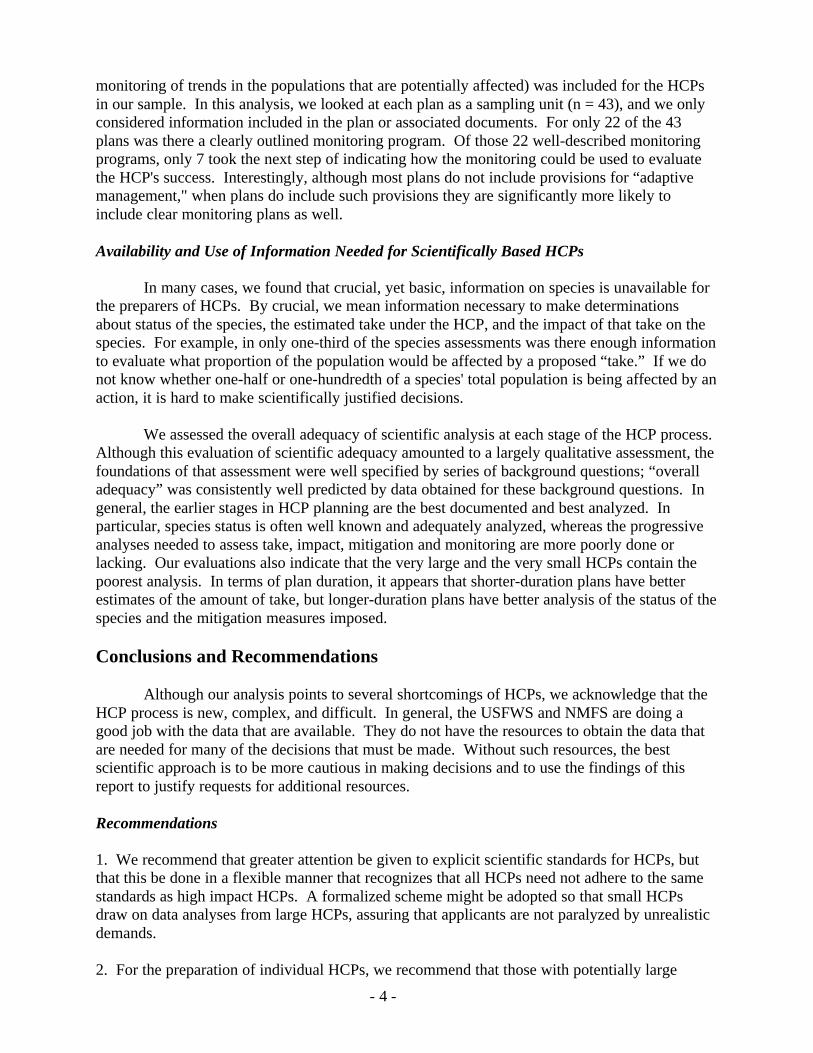
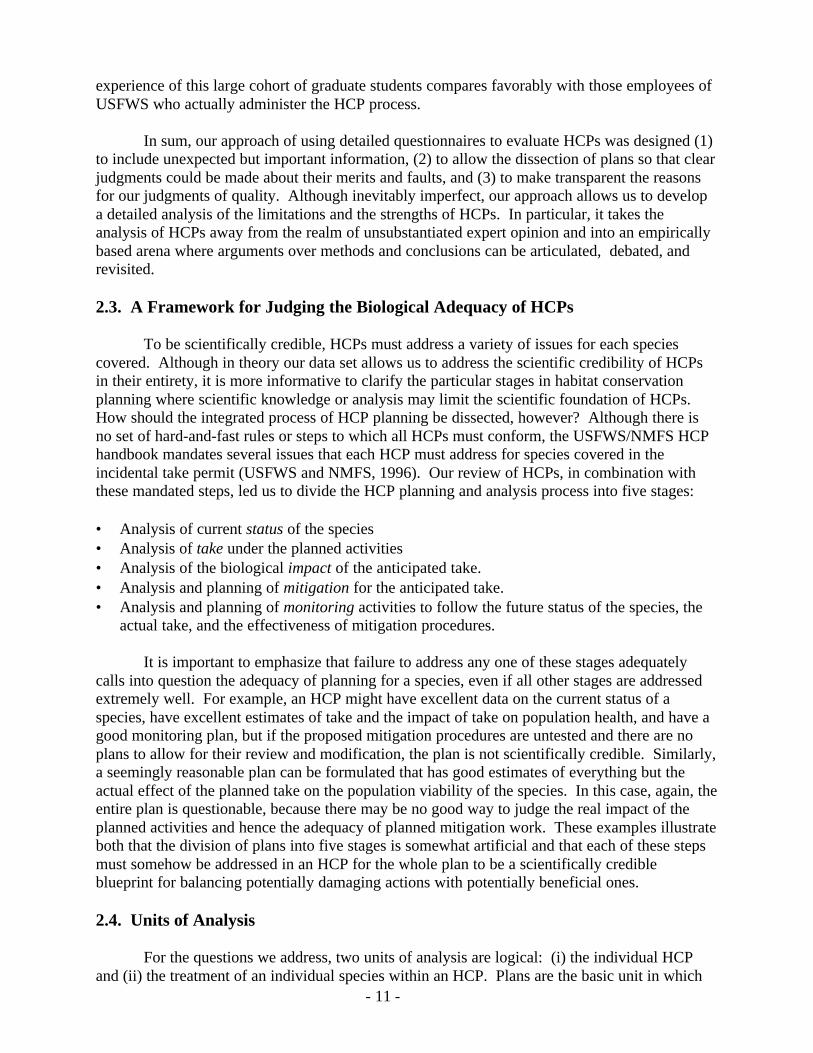
A second basic feature of species status is the estimated trend in abundance or numbersof individuals in the populations in question, both within the HCP area (SQ:B30) and globally(SQ:B31). For those species where population trends were known, we compared the proportionof species that were increasing, stable, or declining in numbers within the HCP area and globally.For most of the species, population sizes were known to be declining in the HCP area (57% total;53% declining at a moderate rate and 4% declining so rapidly that extinction is possible withinthe next 20 years). An intermediate number of species were known to be stable (40%), and, for asmall fraction of the species included in HCPs, the populations were increasing (2%) (Figure 3).Changes in populations for these species at a global scale are similar to those observed withinHCP lands. Populations range-wide are declining for 74% of the species, stable for 21%, andincreasing for only 5% of the species in our sample.
The status of populations of endangered species is highly dependent on the maintenance
Hab
itat L
oss
Deg
rada
tion
Frag
men
tatio
n
Mor
talit
y
Pollu
tion
Dam
s
Inva
sive
s
Prey
Int
erac
tions
Pred
ator
s
Rar
ity
Oth
er
Type of Threat
Perc
ent o
f sp
ecie
s fo
r w
hich
thre
at is
cons
ider
ed th
e pr
imar
y th
reat
0
20
40
60
80
100On HCP land Globally
Figure 2. Major threats, at local and global scales, to species included in HCPs. For each threat category, columns indicate the number of times each type of threat was listed as most important (score of 1 for SQ:A12-22). Because multiple threats can be considered to be of major importance to any one species, the totals sum to greater than 100%. (N=97 species-plan combinations)
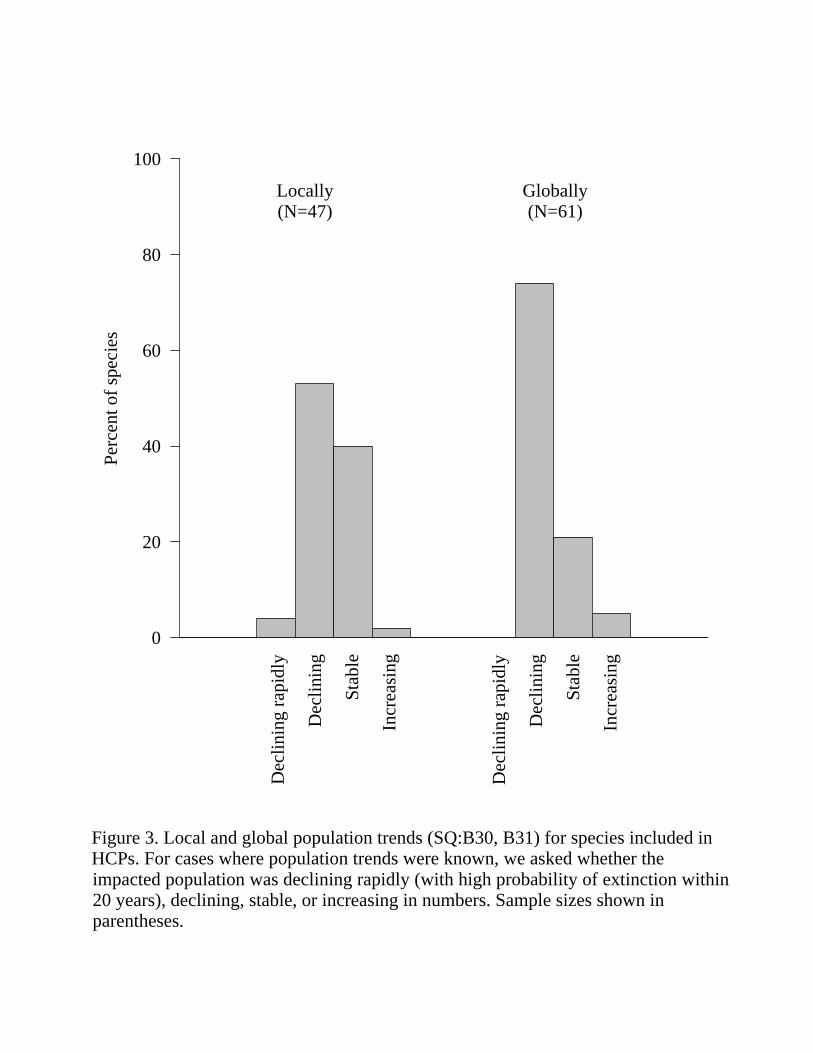
Figure 3. Local and global population trends (SQ:B30, B31) for species included in HCPs. For cases where population trends were known, we asked whether the impacted population was declining rapidly (with high probability of extinction within 20 years), declining, stable, or increasing in numbers. Sample sizes shown in parentheses.
Perc
ent o
f sp
ecie
s
0
20
40
60
80
100
Locally(N=47)
Globally(N=61)
Dec
linin
g ra
pidl
y
Dec
linin
g
Stab
le
Incr
easi
ng
Dec
linin
g ra
pidl
y
Dec
linin
g
Stab
le
Incr
easi
ng
- 22 -
of sufficient adequate habitat for the species. Trends in habitat availability (Table 9) are similarto those observed for populations: habitat availability is declining in the local HCP area for 63%and is stable for 37% of the species in the HCPs we reviewed. Habitat quantity is not increasingfor any of the species we evaluated (Table 9; SQ:B34). Globally, habitat is declining for 88% ofthe species and stable for 12% and is not increasing for any of the species in our HCP sample(SQ:B35). The decline in habitat availability at larger scales underscores the importance ofpopulations within HCP areas for overall viability of endangered species (Bean and Wilcove,1997).
Most of the habitat remaining for species contained in the HCPs is of “medium” quality(51% of habitat in HCP area and 70% of habitat globally; Table 9; SQ:B28-29). We definedmedium-quality habitat as that able to support self-sustaining populations but not able to producean excess of individuals (i.e., not able to serve as consistent “source” populations). Habitatquality within the HCP area was generally rated of poorer quality than global habitat quality forthe species in our HCP sample. In particular, 40% of the remaining habitat in HCP areas wasdeemed to be “poor” quality (i.e., not able to support isolated populations through time), whereasonly 15% of habitat was determined to be poor globally.
6.2. Nature and Characterization of Take
Activities permitted in HCPs can result directly or indirectly in death of individuals of anendangered species, commonly referred to as “take” (ESA, 1982). Take also includes any typeof harassment or harm to species and destruction or modification of a species’ habitat (USFWS,1981). Take was predicted to occur for the majority of the species-plan combinations wereviewed (73%; SQ:C25). For the remaining species either take was not predicted to occur as aresult of HCP activities or not enough information was provided in the HCP to reveal whethertake would occur. In cases where it was explicitly stated in the HCP that take would occur if thepermit were approved, the quantification of take varied tremendously among plans (SQ:C27).Predicted take, in terms of the estimated number of individuals that will be displaced or killed, ispoorly estimated for most of the species in our focal HCPs—in almost half of the cases (49%) nodata in the HCP or associated documents addressed the level of take likely to result from theproposed development.
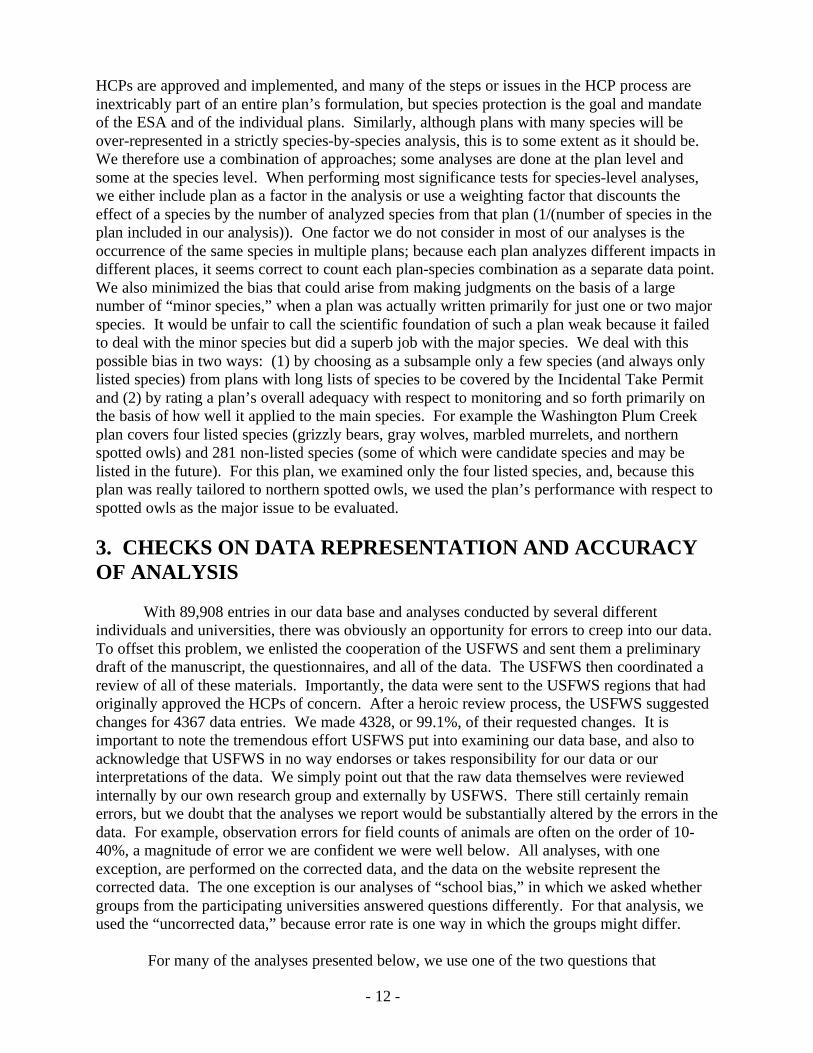
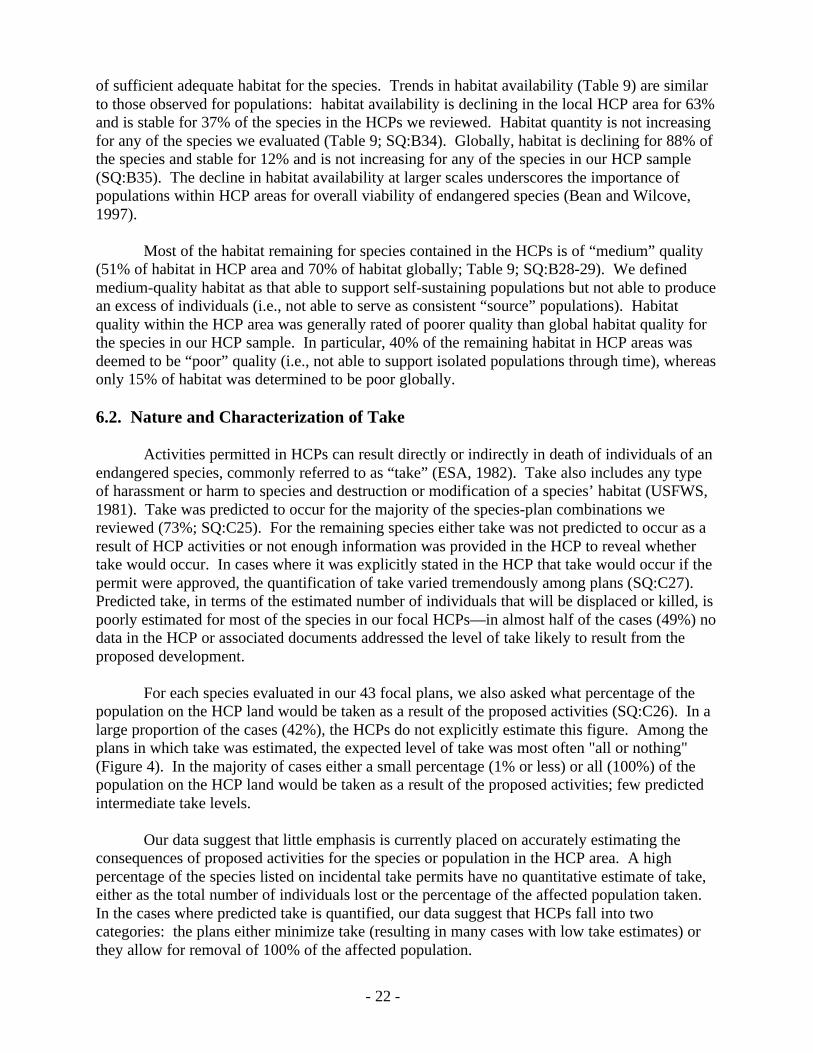
For each species evaluated in our 43 focal plans, we also asked what percentage of thepopulation on the HCP land would be taken as a result of the proposed activities (SQ:C26). In alarge proportion of the cases (42%), the HCPs do not explicitly estimate this figure. Among theplans in which take was estimated, the expected level of take was most often "all or nothing"(Figure 4). In the majority of cases either a small percentage (1% or less) or all (100%) of thepopulation on the HCP land would be taken as a result of the proposed activities; few predictedintermediate take levels.
Our data suggest that little emphasis is currently placed on accurately estimating theconsequences of proposed activities for the species or population in the HCP area. A highpercentage of the species listed on incidental take permits have no quantitative estimate of take,either as the total number of individuals lost or the percentage of the affected population taken.In the cases where predicted take is quantified, our data suggest that HCPs fall into twocategories: the plans either minimize take (resulting in many cases with low take estimates) orthey allow for removal of 100% of the affected population.
Percentage of local populationto be taken
0 20 40 60 80 100
Perc
ent o
f H
CPs
0
10
20
30
40
50
Figure 4. Percent of impacted local populations that will be taken as a result of the activities proposed in the HCP (SQ:C26). In the cases where the levels of take wereestimated in the HCPs, either very few individuals from the impacted population are expected to be taken or the entire population is taken.
- 24 -
6.3. Assessing Impacts of Development on Endangered Species
Impacts on populations in HCPs can be defined as the combined effects of take andhabitat modification on the viability of endangered species. Because of its complex nature,quantifying impact is difficult and requires not only accurate estimates of take but also anunderstanding of the population dynamics, species requirements, and demographic thresholdsthat apply in each individual case; these data are often necessary to full understanding of thebiological consequences of proposed levels activities. We reviewed the types of threats thatwere considered in HCPs (QE responses to SQ:D32-45) and compared those to the categories ofimpact we deemed important for the species given our knowledge of their biology and status(QG responses to SQ:D32-44). We ranked all categories for each individual species-plancombination on a four point scale ranging from 1 (not an important impact) through 4 (a seriousimpact that will significantly affect the population). We ranked area of habitat loss, percenthabitat lost, direct mortality, habitat fragmentation, cumulative impacts, and altered interspecificinteractions as the six most significant effects for the species in our sample (Table 10). With theexception of cumulative impacts, we generally found high concordance between our rankingsand the number of times that the same impact was considered in the HCPs we reviewed.
7. MITIGATION AND MONITORING
7.1. Mitigation in Habitat Conservation Plans
A crucial feature of HCPs is the choice of mitigation procedures aimed at minimizing thethreats to species included in the incidental take permit (see, e.g., Bingham and Noon, 1997). Infact, this minimization of impact is required by the ESA (1982) and clearly outlined in the HCPHandbook (USFWS and NMFS, 1996). If the appropriate mitigation is chosen and implementedin a timely fashion, the impact to the species in question can be minimized to the maximumextent practicable, thus justifying the issuance of an incidental take permit. However, manyscientists have criticized the mitigation plans proposed in HCPs because they have often seemedarbitrary, based more on political and economic constraints than empirical data on the species'ecology, life history, and specific requirements (Beatley, 1994; Bingham and Noon, 1997;Buchanan et al.,1997). Given the importance of mitigation for the success of HCPs, we focusedour analyses on the scientific basis of mitigation measures proposed. HCPs that include morethan one endangered species must mitigate for impact to all species included in the take permit.Therefore, because of the species- and plan-specific nature of mitigation measures, weconsidered each species within a plan as our unit for analysis.
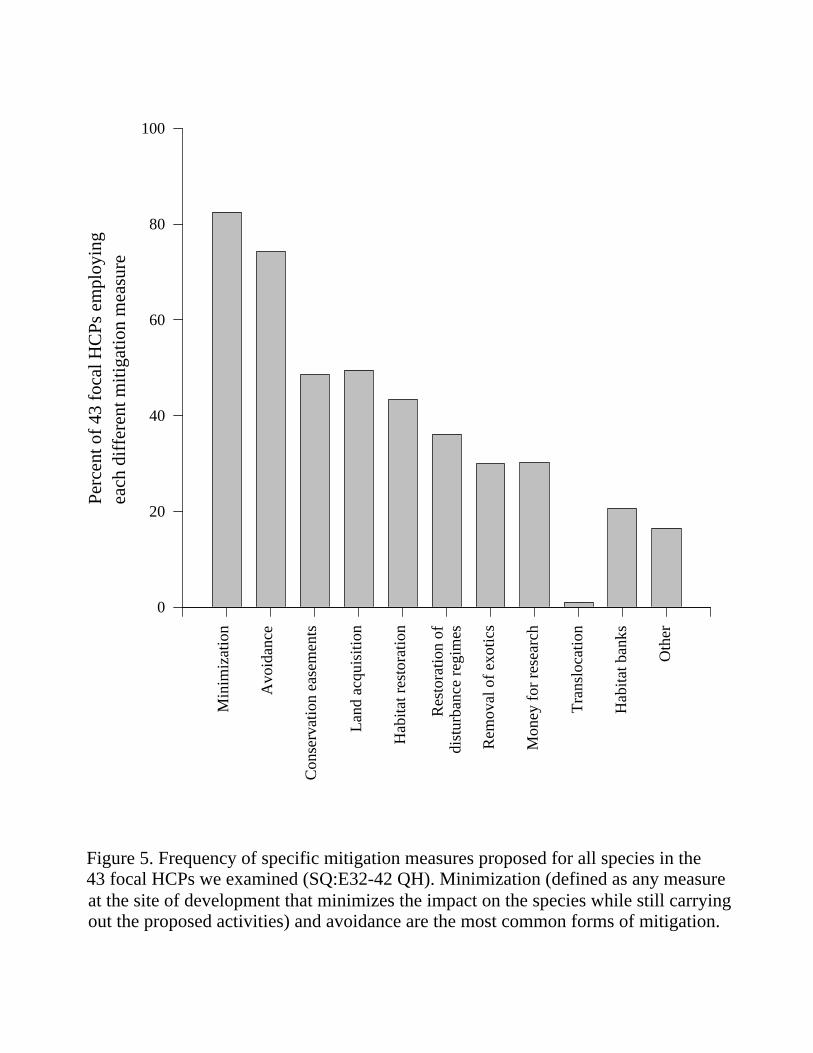
7.2. Types of Mitigation Most Commonly Used
We treated minimization of impacts (e.g., modifying construction and/or development atthe site to minimize changes to the species or its environment) and avoidance of impact (e.g.,working during the non-breeding or inactive season) as categories of mitigation. Minimizationand avoidance were by far the most common mitigation measures proposed (Figure 5; QHresponses to SQ:E32-E42). Avoidance was proposed for 74% of species for which permits wereissued, and minimization of impact at site of development was proposed for 83% of species).Most mitigation efforts for a specific endangered species involve a combination of procedures.Thus, many of the less common mitigation measures (such as land acquisition, translocation,habitat restoration, etc.) are used in combination with strategies for minimization and avoidance
Perc
ent o
f 43
foc
al H
CPs
em
ploy
ing
each
dif
fere
nt m
itiga
tion
mea
sure
0
20
40
60
80
100
Figure 5. Frequency of specific mitigation measures proposed for all species in the 43 focal HCPs we examined (SQ:E32-42 QH). Minimization (defined as any measure
Min
imiz
atio
n
Avo
idan
ce
Con
serv
atio
n ea
sem
ents
Rem
oval
of
exot
ics
Mon
ey f
or r
esea
rch
Lan
d ac
quis
ition
Hab
itat r
esto
ratio
n
Tra
nslo
catio
n
Hab
itat b
anks
Oth
er
Res
tora
tion
ofdi
stur
banc
e re
gim
es
at the site of development that minimizes the impact on the species while still carrying out the proposed activities) and avoidance are the most common forms of mitigation.
- 26 -
of impact on the threatened species. The high reliance on avoidance and minimization is notsurprising, as these are usually the easiest and least costly procedures to implement.
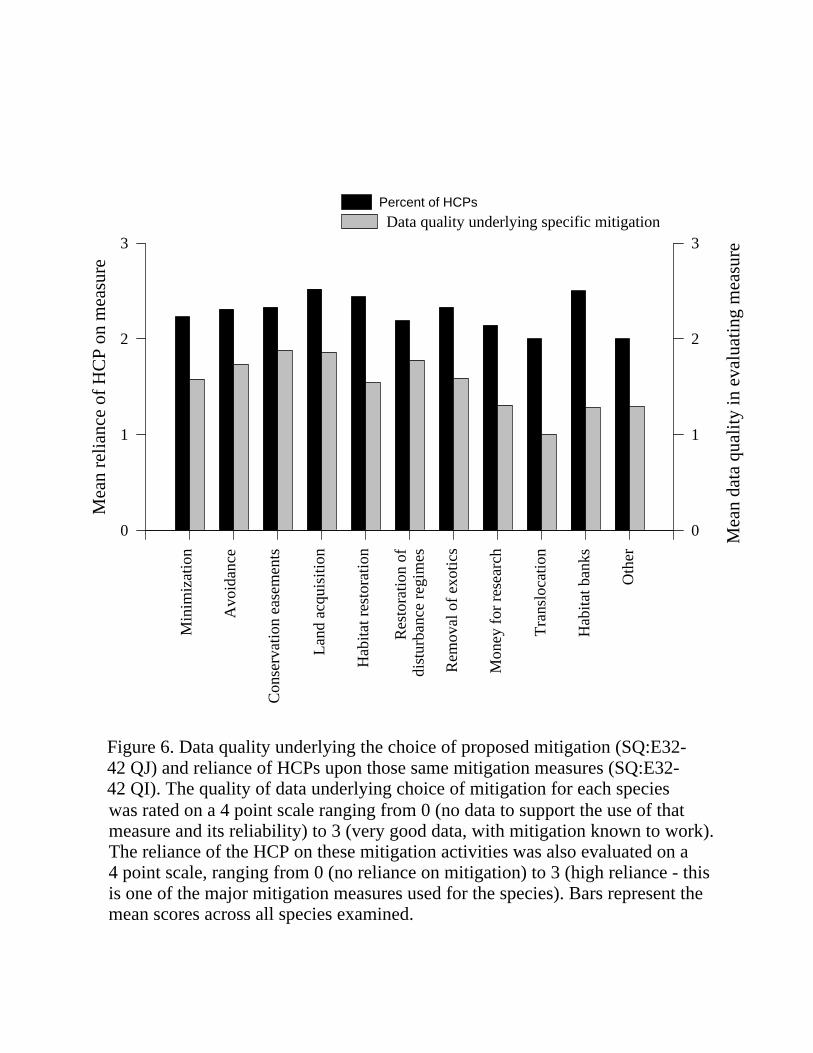
7.3. Quality of Data Used in Determining Specific Mitigation Measures
The quality of data underlying particular mitigation measures proposed for each specieswas evaluated on a 4-point scale (a continuous quality index from 0, representing "no data" usedto support the chosen mitigation procedure and its reliability, to 3, representing cases where dataamply document that the proposed mitigation procedure is likely to be effective; QJ responses toSQ:E32-E42). On average, the quality of data used to justify mitigation measures was relativelylow (Figure 6); that is, all mitigation procedures were based on data ranked as 2 or below in ourquality index (indicating that the data are, at most, moderately understood and reliable). Themitigation measures based on the highest data quality are conservation easements, landacquisition, avoidance, and minimization. Other measures such as translocation often lack datademonstrating the feasibility of the proposed actions. In general, HCPs seem to rely more onmitigation measures with higher quality scores and less on those with low scores (QI responsesto SQ:E32-E42). However, there are some exceptions; for example, when habitat banks(payment of money into an account, which is then to be used to purchase land that is supposedlyideal habitat for the species threatened by the proposed activities) are used, they tend to be amajor component of mitigation programs, yet this mitigation approach has one of the lowestscores on our data quality scale (Figure 6). Given the generally low quality of data underlyingmany mitigation plans in HCPs, their success is not assured and, if implemented as proposed,may be very close to a "guess" in terms of curbing the impacts on the species.
7.4. How Well Mitigation Plans Address Threats to Endangered Species
Judging the actual success of mitigation procedures would require long-term informationon the success of HCPs. Because very few plans have been in place for more than eight years,this is not an option. Hence we must rely on current indicators that mitigation measures arelikely to be successful. For each of the species in our sample, we estimated the likelihood ofsuccess by answering two questions. First, we asked how often mitigation measures actuallyaddressed the primary threat to the species in question. Second, we asked to what extent theproposed mitigation measures are likely to reduce the impacts of the primary threats. Whereasthe USFWS is required to adopt mitigation and minimization measures that protect a species tothe maximum extent practicable, our focus was more on whether scientific evidence waspresented to substantiate that the best possible mitigation was being adopted.
We found that, for the great majority of the species we examined, the mitigationprocedures addressed the primary threat to the species' continued existence (85%; SQ:E44).However, the overall adequacy with which proposed measures addressed the primary threatsvaried tremendously among species (Table 11; SQ:E45). Overall, we found that for only 57% ofthe species in the sample did mitigation measures proposed in the HCP address the primarythreat to the species to a degree considered "sufficient" or better. In other words, although HCPsmost often identify the primary threat to the affected species, only a little more than half of thetime do mitigation plans adequately address that threat.
7.5. Implementation of Mitigation Plans
An important determinant of the success of mitigation is the adequate implementation of
Mea
n re
lianc
e of
HC
P on
mea
sure
0
1
2
3
Mea
n da
ta q
ualit
y in
eva
luat
ing
mea
sure
0
1
2
3
Percent of HCPs
Data quality underlying specific mitigation
Figure 6. Data quality underlying the choice of proposed mitigation (SQ:E32-42 QJ) and reliance of HCPs upon those same mitigation measures (SQ:E32-42 QI). The quality of data underlying choice of mitigation for each species
Min
imiz
atio
n
Avo
idan
ce
Con
serv
atio
n ea
sem
ents
Rem
oval
of
exot
ics
Mon
ey f
or r
esea
rch
Lan
d ac
quis
ition
Hab
itat r
esto
ratio
n
Tra
nslo
catio
n
Hab
itat b
anks
Oth
er
Res
tora
tion
ofdi
stur
banc
e re
gim
es
was rated on a 4 point scale ranging from 0 (no data to support the use of that measure and its reliability) to 3 (very good data, with mitigation known to work). The reliance of the HCP on these mitigation activities was also evaluated on a4 point scale, ranging from 0 (no reliance on mitigation) to 3 (high reliance - this is one of the major mitigation measures used for the species). Bars represent the mean scores across all species examined.
- 28 -
the proposed measures. For maximum success rates of mitigation plans, it is important that theprocedures be implemented in a timely fashion and preferably before the population of anendangered species is severely affected by activities proposed in the HCP. We examined twofactors that affect the implementation of mitigation plans: funding for the measures and thetiming of mitigation efforts relative to "take" of the impacted species.
Mitigation can be one of the most expensive steps in the development and execution ofan HCP. Thus, it is important to determine the cost of the proposed measures, the source offunding for implementing mitigation, and the time period over which these funds are available.Under law, the plan for funding all expected mitigation measures should be outlined in the HCP;ideally the source of those funds should be determined a priori and not as the impact occurs inthe course of development (we refer to the latter as a "pay as you go" funding program). Wefound that HCPs nearly always met these basic expectations: 98% of the HCPs outlined a priorithe funding sources for the mitigation proposed (PQ:124), but only 77% had significant fundsset aside to pay for mitigation at the onset of the HCP (PQ:125).
Another critical aspect of mitigation is the timing of proposed measures relative toimpact. It is important that mitigation measures are started at the time of take or preferablybefore any take occurs, thus increasing the probability that unsuccessful mitigation procedurescan be detected and corrected. In contrast, if most take occurs before mitigation measures areput into effect, chances of adaptively improving on failed mitigation efforts are reduced. Wefound that take occurred before mitigation in a substantial number of cases (23% of the speciesexamined; PQ:126).
7.6. The Clarity and Effectiveness of Monitoring Programs
The first question to ask about monitoring is simply whether or not a clear monitoringprogram was outlined in the plan. We focused only on effectiveness monitoring, as opposed tocompliance monitoring (see Table 1). An answer of “no” to this question does not necessarilymean that no monitoring is going on for the pertinent species, but rather that the text of the plandoes not provide sufficient information or sufficiently explicit information to document thatindeed a scientific monitoring program was part of the plan. Of course, a “no” could also meanthat there was absolutely no monitoring whatsoever. For only 22 of the 43 plans was there aclear description of a monitoring program (PQ:60). The next obvious question concerns theeffectiveness of those 22 clear monitoring programs we identified—in other words is themonitoring program designed in such a way that it would allow the success of the HCP to beevaluated? For this question the attributes of monitoring required for “evaluation of success”depended on the particular plan and the threats being mitigated, and they could involve factorssuch as number and location of sample sites, frequency of sampling, and nature of data recorded.Again, a “no” does not imply that monitoring in the field is necessarily insufficient, only that theinformation presented in the plan and associated documents did not provide any confidence thatthe monitoring could evaluate success. Under this interpretation, only 7 out of 43 plans had clearmonitoring programs that were sufficient for evaluating success (PQ:167). Because our criteriafor answering “yes” to the questions about clear and sufficient monitoring relied on what wasactually included in the documents, the reality may not be as gloomy as the numbers abovesuggest. If the monitoring programs were consistently a part of all HCPs, then HCPs on averagewould be better, and the monitoring programs themselves would be more likely to bescientifically supported because of their role in planning. We delved deeper into the data todetermine exactly what was missing with respect to questions about particular species and
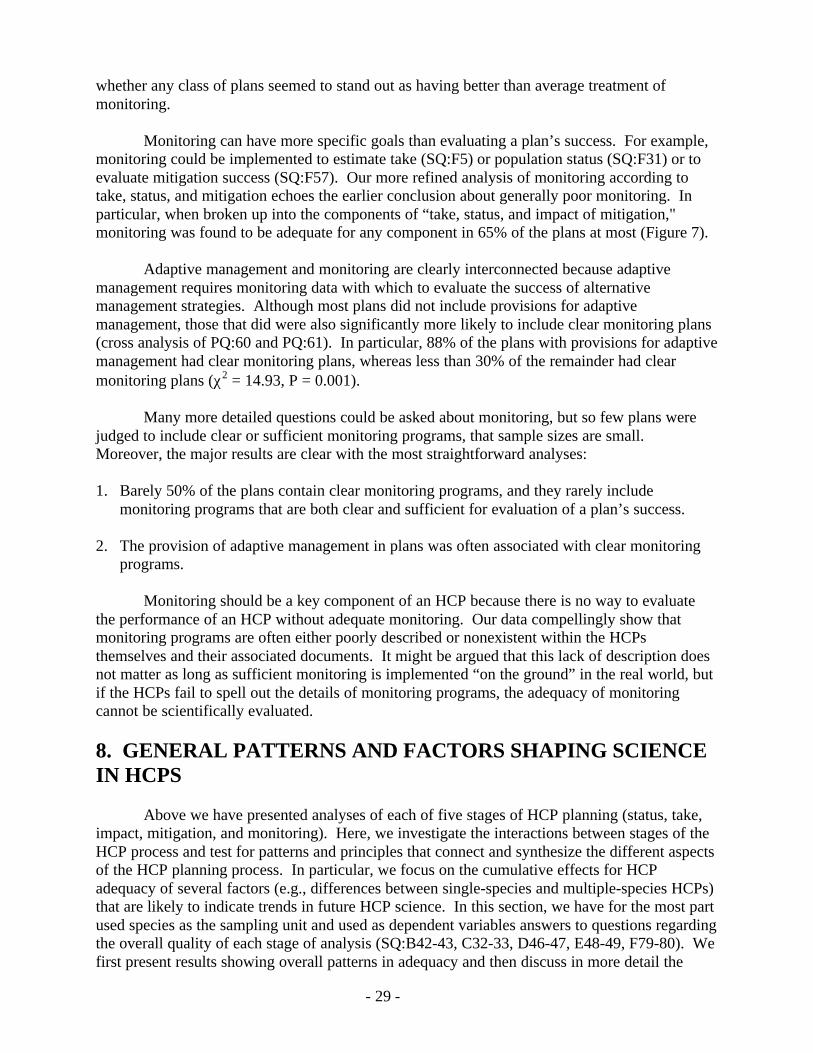
- 29 -
whether any class of plans seemed to stand out as having better than average treatment ofmonitoring.
Monitoring can have more specific goals than evaluating a plan’s success. For example,monitoring could be implemented to estimate take (SQ:F5) or population status (SQ:F31) or toevaluate mitigation success (SQ:F57). Our more refined analysis of monitoring according totake, status, and mitigation echoes the earlier conclusion about generally poor monitoring. Inparticular, when broken up into the components of “take, status, and impact of mitigation,"monitoring was found to be adequate for any component in 65% of the plans at most (Figure 7).
Adaptive management and monitoring are clearly interconnected because adaptivemanagement requires monitoring data with which to evaluate the success of alternativemanagement strategies. Although most plans did not include provisions for adaptivemanagement, those that did were also significantly more likely to include clear monitoring plans(cross analysis of PQ:60 and PQ:61). In particular, 88% of the plans with provisions for adaptivemanagement had clear monitoring plans, whereas less than 30% of the remainder had clearmonitoring plans (χ2 = 14.93, P = 0.001).
Many more detailed questions could be asked about monitoring, but so few plans werejudged to include clear or sufficient monitoring programs, that sample sizes are small.Moreover, the major results are clear with the most straightforward analyses:
1. Barely 50% of the plans contain clear monitoring programs, and they rarely includemonitoring programs that are both clear and sufficient for evaluation of a plan’s success.
2. The provision of adaptive management in plans was often associated with clear monitoring
programs.
Monitoring should be a key component of an HCP because there is no way to evaluatethe performance of an HCP without adequate monitoring. Our data compellingly show thatmonitoring programs are often either poorly described or nonexistent within the HCPsthemselves and their associated documents. It might be argued that this lack of description doesnot matter as long as sufficient monitoring is implemented “on the ground” in the real world, butif the HCPs fail to spell out the details of monitoring programs, the adequacy of monitoringcannot be scientifically evaluated.
8. GENERAL PATTERNS AND FACTORS SHAPING SCIENCEIN HCPS
Above we have presented analyses of each of five stages of HCP planning (status, take,impact, mitigation, and monitoring). Here, we investigate the interactions between stages of theHCP process and test for patterns and principles that connect and synthesize the different aspectsof the HCP planning process. In particular, we focus on the cumulative effects for HCPadequacy of several factors (e.g., differences between single-species and multiple-species HCPs)that are likely to indicate trends in future HCP science. In this section, we have for the most partused species as the sampling unit and used as dependent variables answers to questions regardingthe overall quality of each stage of analysis (SQ:B42-43, C32-33, D46-47, E48-49, F79-80). Wefirst present results showing overall patterns in adequacy and then discuss in more detail the
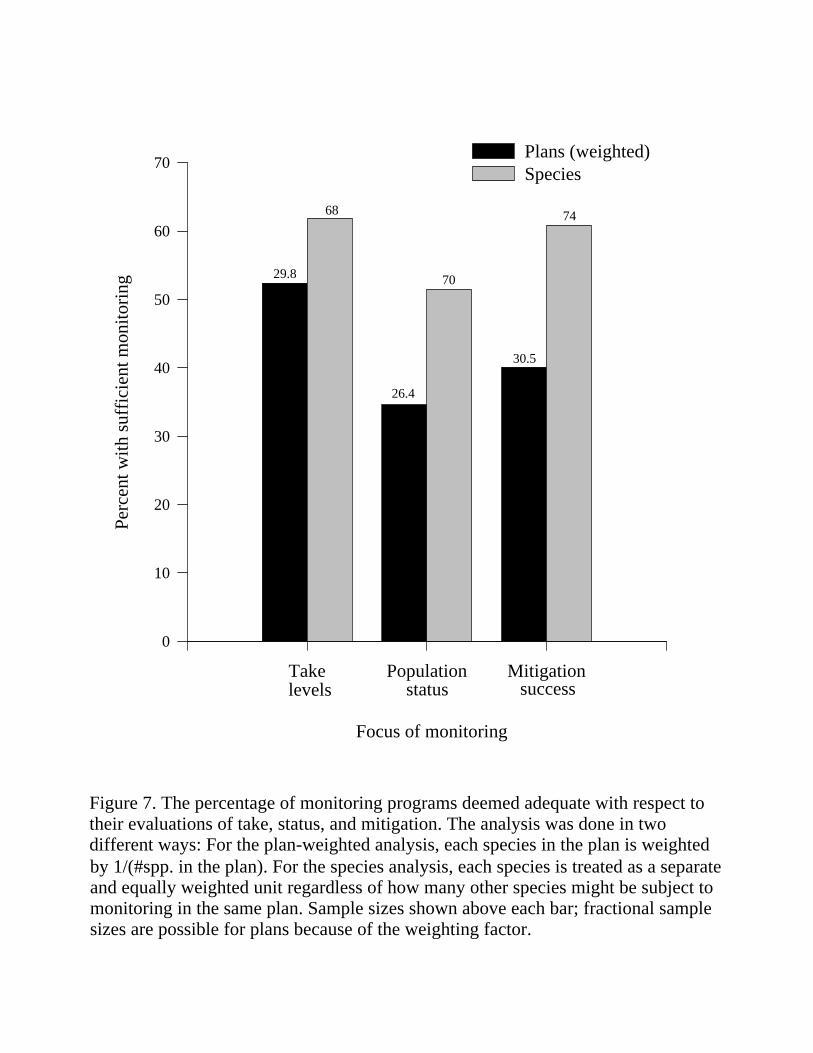
Focus of monitoring
Take Population Mitigation
Perc
ent w
ith s
uffi
cien
t mon
itori
ng
0
10
20
30
40
50
60
70Plans (weighted)Species
levels successstatus
Figure 7. The percentage of monitoring programs deemed adequate with respect to their evaluations of take, status, and mitigation. The analysis was done in two different ways: For the plan-weighted analysis, each species in the plan is weighted by 1/(#spp. in the plan). For the species analysis, each species is treated as a separate and equally weighted unit regardless of how many other species might be subject tomonitoring in the same plan. Sample sizes shown above each bar; fractional sample sizes are possible for plans because of the weighting factor.
29.8
26.4
30.5
68
70
74
- 31 -
importance of different aspects of species biology and plan characteristics for the scientific rigorof HCPs.
8.1. Multivariate Analyses of “Adequacy” Rankings and Correlations withAttributes of Plans
In general, the earlier stages in HCP planning are the best documented and best analyzed(Figure 8). In particular, species status is often well known and adequately analyzed, whereasthe progressive analyses needed to assess take and impact are more poorly done or lacking;inadequate assessment of impact is especially common. We next consider what factors mayexplain the range of adequacy seen across different HCPs and different stages of analysis.Factors that we considered in our analyses were those that seemed most likely to influence thequality of HCP analysis, plus those that may indicate whether changes in HCP formulation willhave desirable results. For example, both multispecies and large-area HCPs have beenadvocated, and thus we asked whether the area covered by an HCP or the number of speciescovered influenced the quality of biological analyses in HCPs. In particular, we tested for theeffects of the following seven variables:
• Area covered by the Incidental Take Permit (PQ:28)• Plan duration (PQ:4 minus PQ:3)• Existence of an approved recovery plan (SQ:A8)• Single-species vs. Multispecies Plan (PQ:7)• Habitat-based vs. Species-based Plan (PQ:8)• Taxon (SQ:A2)• Date of permit (PQ:A3, categorized as Early [1983-1994] or Recent [1995-1997])
To test for effects of these variables on each of the five HCP planning steps, weperformed a series of MANOVAs using standardized transformations of all variables. We firstperformed separate, one-way MANOVAs using each of the above variables, with the five ratingsof analysis quality as dependent variables (SQ:B43, C33, D47, E49, F80). Next, we performedtwo multiway MANOVAs. The first used all seven independent variables; the second includedonly the five independent variables with one or more significant or near-significant (P < 0.20)effects in the first analysis. We used this combination of one-way and multiway analyses bothbecause missing values considerably reduced the sample size of tests using all variables andbecause, without large sample sizes, multiway MANOVAs can provide only weak tests foreffects. Finally, we repeated this entire set of analyses using weightings to account for unequalnumbers of species per plan (weighting was by: 1/(number of species in plan)). Table 12presents the overall results from these tests. In addition to these overall analyses, we alsoconducted a variety of other tests and comparisons to elucidate the effects of each factor on HCPquality. Below, we separately discuss HCP adequacy in light of each of these causal factors.
8.2. Correlations Between Scientific Quality and Area or Duration of Plans
The promotion of large-scale HCPs incorporating “ecosystem management” by Secretaryof the Interior Bruce Babbitt and the USFWS is viewed by many biologists as a positive trend(Noss et al., 1997). In addition, an increasing number of large-scale HCPs are region-wideprograms dealing with single focal species. Along with promulgation of these very large-scaleHCPs, there is also an effort to expedite the development and approval of the smallest HCPs; the
Num
ber
of s
peci
es
0
10
20
30
40
Poor Excellent
57% Adequate
Take
Status
Num
ber
of s
peci
es0
10
20
30
40
Poor Excellent
67% Adequate
Num
ber
of s
peci
es
0
10
20
30
40
Poor Excellent
54% Adequate
Mitigation
0
10
20
30
40
Poor Excellent
52% Adequate
Monitoring
0
10
20
30
40
Poor Excellent
51% Adequate
Impact
Figure 8. Quality of analysis and data at the five stages of HCP analysis: status (SQ:B43), take (SQ:C33), impact (SQ:D47), mitigation (SQ:E49), and monitoring (SQ:F80).Histograms show the number of species with analysis falling into each of six quality categories ranging from poor to excellent. Above each histogram is the percentage ofspecies for which plans were scored as "adequate" as opposed to "not adequate" by a separate, binary ranking for that step of HCP analysis (SQ:B42, C32, D46, E48, F79).
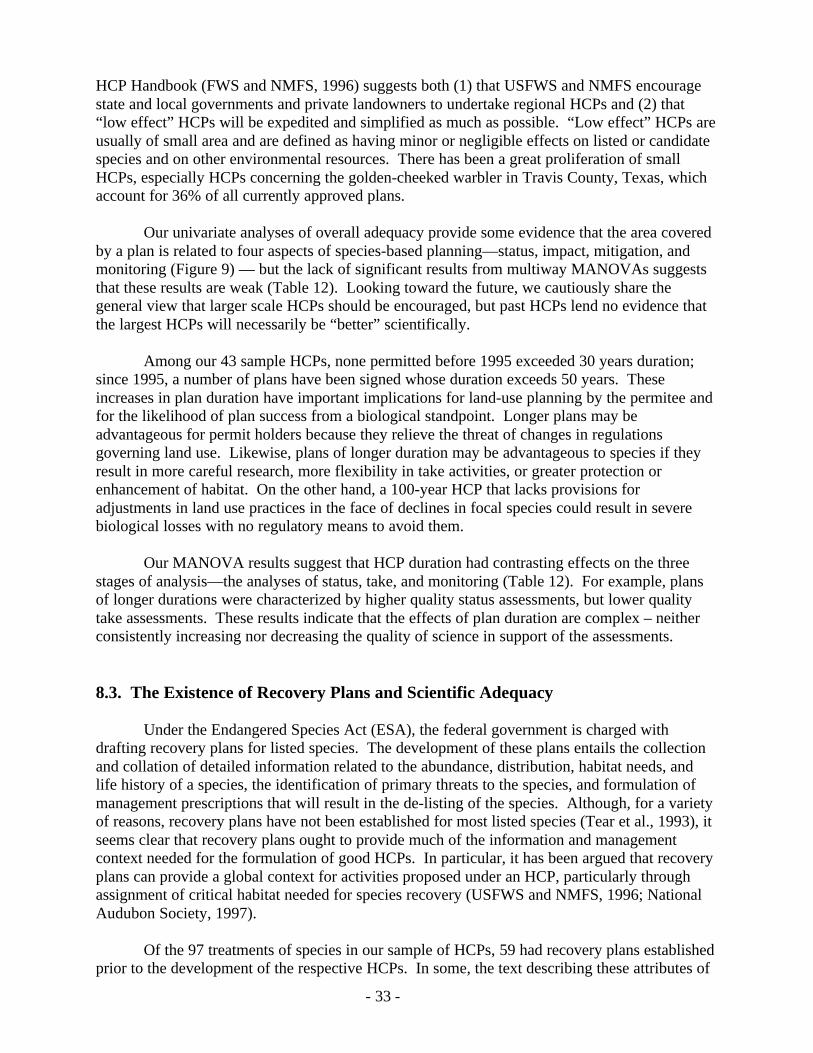
- 33 -
HCP Handbook (FWS and NMFS, 1996) suggests both (1) that USFWS and NMFS encouragestate and local governments and private landowners to undertake regional HCPs and (2) that“low effect” HCPs will be expedited and simplified as much as possible. “Low effect” HCPs areusually of small area and are defined as having minor or negligible effects on listed or candidatespecies and on other environmental resources. There has been a great proliferation of smallHCPs, especially HCPs concerning the golden-cheeked warbler in Travis County, Texas, whichaccount for 36% of all currently approved plans.
Our univariate analyses of overall adequacy provide some evidence that the area coveredby a plan is related to four aspects of species-based planning—status, impact, mitigation, andmonitoring (Figure 9) — but the lack of significant results from multiway MANOVAs suggeststhat these results are weak (Table 12). Looking toward the future, we cautiously share thegeneral view that larger scale HCPs should be encouraged, but past HCPs lend no evidence thatthe largest HCPs will necessarily be “better” scientifically.
Among our 43 sample HCPs, none permitted before 1995 exceeded 30 years duration;since 1995, a number of plans have been signed whose duration exceeds 50 years. Theseincreases in plan duration have important implications for land-use planning by the permitee andfor the likelihood of plan success from a biological standpoint. Longer plans may beadvantageous for permit holders because they relieve the threat of changes in regulationsgoverning land use. Likewise, plans of longer duration may be advantageous to species if theyresult in more careful research, more flexibility in take activities, or greater protection orenhancement of habitat. On the other hand, a 100-year HCP that lacks provisions foradjustments in land use practices in the face of declines in focal species could result in severebiological losses with no regulatory means to avoid them.
Our MANOVA results suggest that HCP duration had contrasting effects on the threestages of analysis—the analyses of status, take, and monitoring (Table 12). For example, plansof longer durations were characterized by higher quality status assessments, but lower qualitytake assessments. These results indicate that the effects of plan duration are complex – neitherconsistently increasing nor decreasing the quality of science in support of the assessments.
8.3. The Existence of Recovery Plans and Scientific Adequacy
Under the Endangered Species Act (ESA), the federal government is charged withdrafting recovery plans for listed species. The development of these plans entails the collectionand collation of detailed information related to the abundance, distribution, habitat needs, andlife history of a species, the identification of primary threats to the species, and formulation ofmanagement prescriptions that will result in the de-listing of the species. Although, for a varietyof reasons, recovery plans have not been established for most listed species (Tear et al., 1993), itseems clear that recovery plans ought to provide much of the information and managementcontext needed for the formulation of good HCPs. In particular, it has been argued that recoveryplans can provide a global context for activities proposed under an HCP, particularly throughassignment of critical habitat needed for species recovery (USFWS and NMFS, 1996; NationalAudubon Society, 1997).
Of the 97 treatments of species in our sample of HCPs, 59 had recovery plans establishedprior to the development of the respective HCPs. In some, the text describing these attributes of
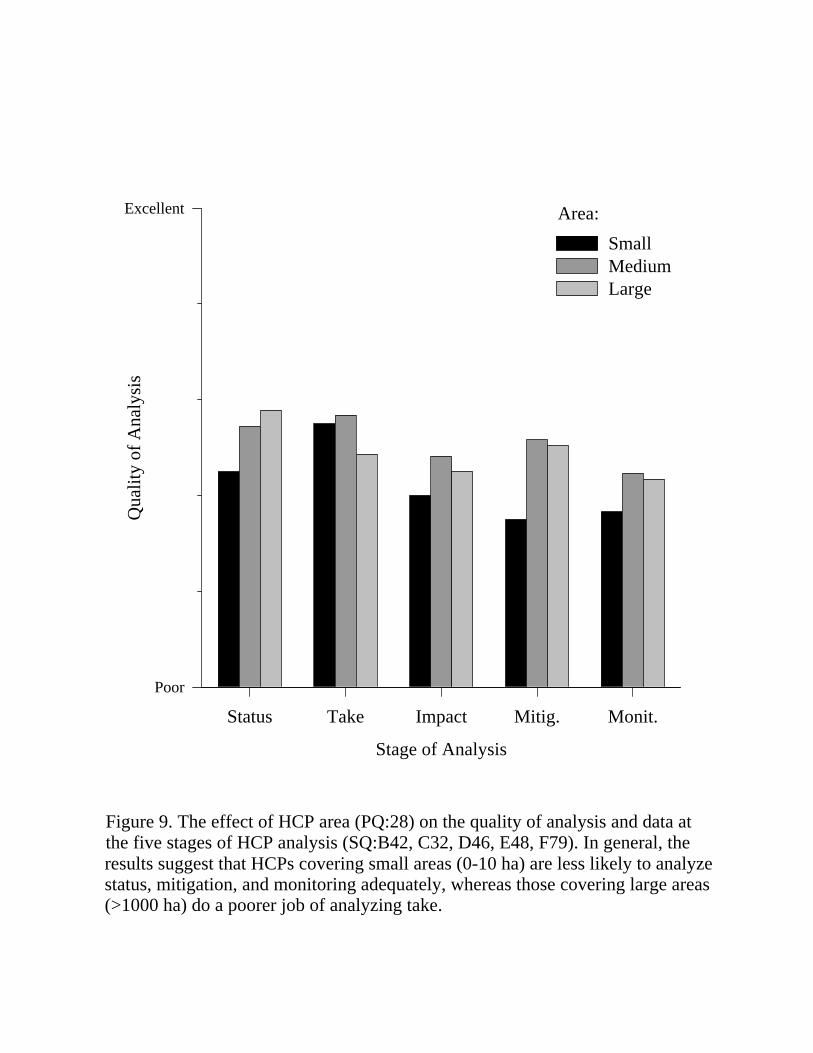
Stage of Analysis
Status Take Impact Mitig. Monit.
Qua
lity
of A
naly
sis
Poor
Excellent
SmallMediumLarge
Area:
Figure 9. The effect of HCP area (PQ:28) on the quality of analysis and data at the five stages of HCP analysis (SQ:B42, C32, D46, E48, F79). In general, theresults suggest that HCPs covering small areas (0-10 ha) are less likely to analyze status, mitigation, and monitoring adequately, whereas those covering large areas (>1000 ha) do a poorer job of analyzing take.
Stage of Analysis
Status Monitoring
Qua
lity
of A
naly
sis
Poor
Excellent
Recovery planNo recovery plan
Figure 10. The effect of the existence of a recovery plan (SQ:A8) on the quality of analysis and data at several stages of HCP analysis (SQ:B42, F79). The resultsshow that for both status and monitoring, the presence of a recovery plan isassociated with a less adequate analysis.
- 36 -
species closely match the wording within the recovery plans themselves. Specific mitigationtechniques, such as the design and placement of artificial nest boxes for red-cockadedwoodpeckers (Picoides borealis) or the translocation of Utah prairie dogs (Cynomys parvidens),were borrowed directly from recovery plans in the development of HCPs. Discussions with HCPapplicants and USFWS officials confirm this impression. Typically, when a recovery planexists, it is used extensively by applicants in developing an HCP.
However, in contrast to expectations, there was evidence that adequacy of HCPs wasnegatively linked to the existence of a recovery plan (Table 12; Figure 10). In fact, using ouryes/no delineations of adequacy, the trend was in the opposite direction for three of the five stepsof HCP analysis (Table 13); a species was more likely to have adequate information included inits HCP if it did not have a recovery plan.
We also asked whether there was a relationship between critical habitat designation for aspecies and the quality of HCP analyses for those species that did have recovery plans. As forrecovery plans, we found no evidence that adequacy of HCPs was positively linked to theexistence of a critical habitat designation (Table 13). Again, the trend was in the oppositedirection for each of five categories of information collected from HCPs. On average, a specieswas more likely to have adequate information included in its HCP if it did not have a criticalhabitat designation.
8.4. Quality of Different Types of HCPs
Treatment of multiple species in the same HCP is appealing to both landowners and thegovernment because it can provide a single planning process with which to addresssimultaneously all of the potential rare species issues for an area. Furthermore, by obtainingincidental take permits for many listed and currently unlisted species, multispecies HCPs canprovide far higher assurance to landowners that they will not encounter future impediments todevelopment plans. This assurance is an especially important incentive to landowners in areaswith high densities of proposed and candidate species (e.g., California and Florida). Increasingthe number of species (from single species plans to multispecies plans) tended to increase thequality of impact assessment, but had no impact on all other assessments (Table 12). A secondway of including many species under the mantle of HCP planning is through “habitat-based”HCPs. For example, the NCCP program in southern California (see website for a narrativedescription of this plan) takes this approach—species are grouped according to the habitatcommunities they require, and planning relies in part on the assumption that adequate protectionfor each species can be gained through protection for each habitat type. In habitat-based plans,information about habitat and fragmentation, and trends in those habitat characteristics, is usedas the primary indicator of species status. Theoretically, information about habitat quality andquantity can be related in a rigorous, scientific manner to population status for a particularspecies, and in this way, habitat characteristics can legitimately be used as a proxy for missinginformation on population status. Overall, our MANOVAs show positive effects of habitat-based planning on the scientific quality of HCPs (Table 12; Figure 11). For example, one-wayanalyses and comparisons of yes/no adequacy rating provide evidence of positive effects onstatus, take, and monitoring assessment. Taken together, these results suggest that habitat-basedplanning has not resulted in lower scientific quality in HCPs and may in fact result in better,more scientifically defensible, planning efforts.
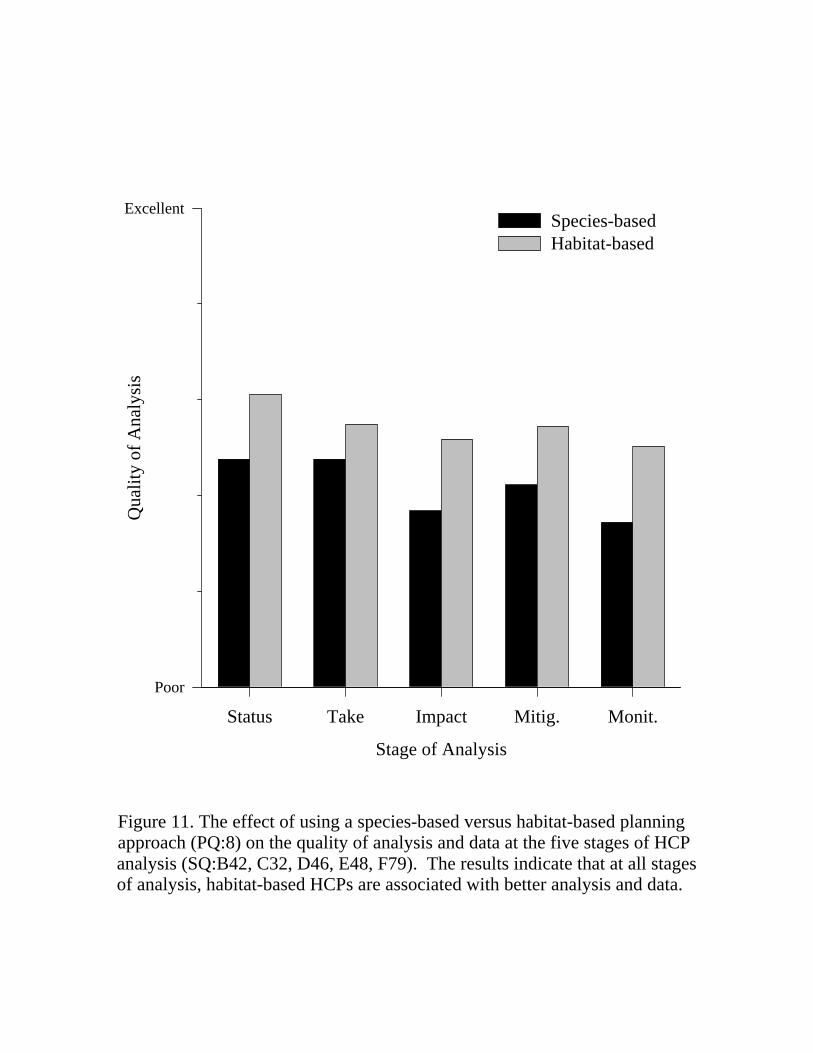
Stage of Analysis
Status Take Impact Mitig. Monit.
Qua
lity
of A
naly
sis
Poor
ExcellentSpecies-basedHabitat-based
Figure 11. The effect of using a species-based versus habitat-based planning approach (PQ:8) on the quality of analysis and data at the five stages of HCP analysis (SQ:B42, C32, D46, E48, F79). The results indicate that at all stages of analysis, habitat-based HCPs are associated with better analysis and data.
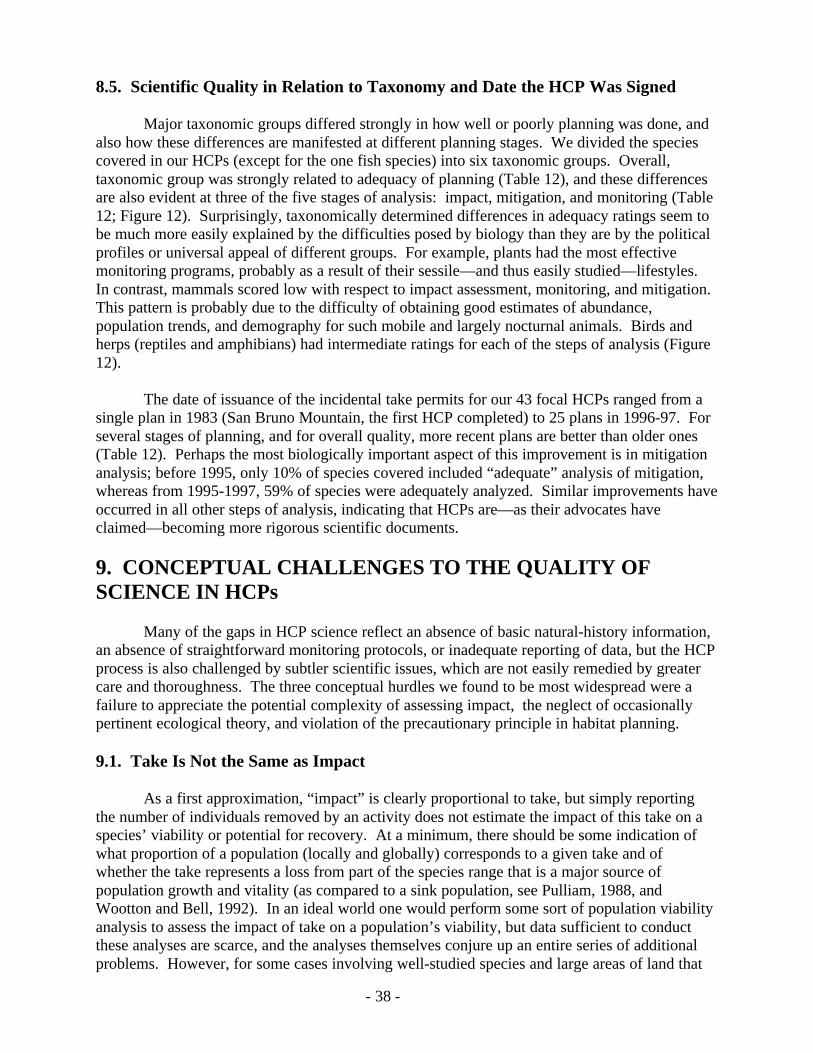
- 38 -
8.5. Scientific Quality in Relation to Taxonomy and Date the HCP Was Signed
Major taxonomic groups differed strongly in how well or poorly planning was done, andalso how these differences are manifested at different planning stages. We divided the speciescovered in our HCPs (except for the one fish species) into six taxonomic groups. Overall,taxonomic group was strongly related to adequacy of planning (Table 12), and these differencesare also evident at three of the five stages of analysis: impact, mitigation, and monitoring (Table12; Figure 12). Surprisingly, taxonomically determined differences in adequacy ratings seem tobe much more easily explained by the difficulties posed by biology than they are by the politicalprofiles or universal appeal of different groups. For example, plants had the most effectivemonitoring programs, probably as a result of their sessile—and thus easily studied—lifestyles.In contrast, mammals scored low with respect to impact assessment, monitoring, and mitigation.This pattern is probably due to the difficulty of obtaining good estimates of abundance,population trends, and demography for such mobile and largely nocturnal animals. Birds andherps (reptiles and amphibians) had intermediate ratings for each of the steps of analysis (Figure12).
The date of issuance of the incidental take permits for our 43 focal HCPs ranged from asingle plan in 1983 (San Bruno Mountain, the first HCP completed) to 25 plans in 1996-97. Forseveral stages of planning, and for overall quality, more recent plans are better than older ones(Table 12). Perhaps the most biologically important aspect of this improvement is in mitigationanalysis; before 1995, only 10% of species covered included “adequate” analysis of mitigation,whereas from 1995-1997, 59% of species were adequately analyzed. Similar improvements haveoccurred in all other steps of analysis, indicating that HCPs are—as their advocates haveclaimed—becoming more rigorous scientific documents.
9. CONCEPTUAL CHALLENGES TO THE QUALITY OFSCIENCE IN HCPs
Many of the gaps in HCP science reflect an absence of basic natural-history information,an absence of straightforward monitoring protocols, or inadequate reporting of data, but the HCPprocess is also challenged by subtler scientific issues, which are not easily remedied by greatercare and thoroughness. The three conceptual hurdles we found to be most widespread were afailure to appreciate the potential complexity of assessing impact, the neglect of occasionallypertinent ecological theory, and violation of the precautionary principle in habitat planning.
9.1. Take Is Not the Same as Impact
As a first approximation, “impact” is clearly proportional to take, but simply reportingthe number of individuals removed by an activity does not estimate the impact of this take on aspecies’ viability or potential for recovery. At a minimum, there should be some indication ofwhat proportion of a population (locally and globally) corresponds to a given take and ofwhether the take represents a loss from part of the species range that is a major source ofpopulation growth and vitality (as compared to a sink population, see Pulliam, 1988, andWootton and Bell, 1992). In an ideal world one would perform some sort of population viabilityanalysis to assess the impact of take on a population’s viability, but data sufficient to conductthese analyses are scarce, and the analyses themselves conjure up an entire series of additionalproblems. However, for some cases involving well-studied species and large areas of land that
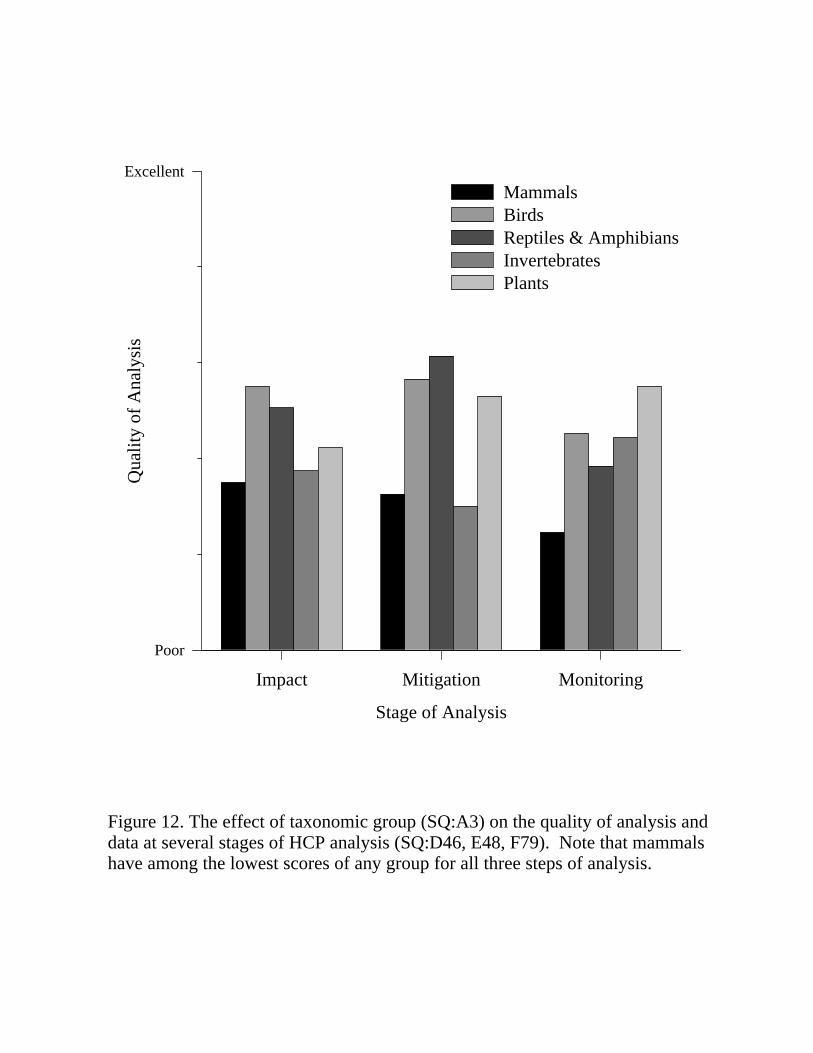
Stage of Analysis
Impact Mitigation Monitoring
Qua
lity
of A
naly
sis
Poor
ExcellentMammals Birds Reptiles & AmphibiansInvertebrates Plants
Figure 12. The effect of taxonomic group (SQ:A3) on the quality of analysis and data at several stages of HCP analysis (SQ:D46, E48, F79). Note that mammals have among the lowest scores of any group for all three steps of analysis.
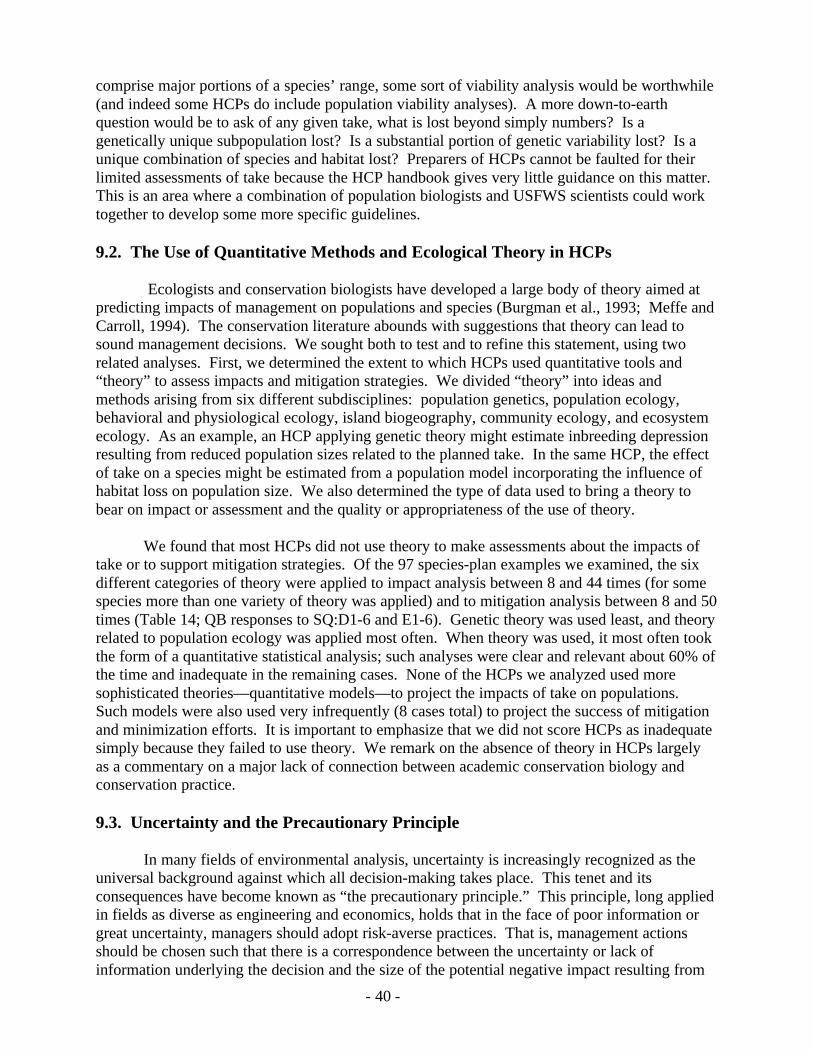
- 40 -
comprise major portions of a species’ range, some sort of viability analysis would be worthwhile(and indeed some HCPs do include population viability analyses). A more down-to-earthquestion would be to ask of any given take, what is lost beyond simply numbers? Is agenetically unique subpopulation lost? Is a substantial portion of genetic variability lost? Is aunique combination of species and habitat lost? Preparers of HCPs cannot be faulted for theirlimited assessments of take because the HCP handbook gives very little guidance on this matter.This is an area where a combination of population biologists and USFWS scientists could worktogether to develop some more specific guidelines.
9.2. The Use of Quantitative Methods and Ecological Theory in HCPs
Ecologists and conservation biologists have developed a large body of theory aimed atpredicting impacts of management on populations and species (Burgman et al., 1993; Meffe andCarroll, 1994). The conservation literature abounds with suggestions that theory can lead tosound management decisions. We sought both to test and to refine this statement, using tworelated analyses. First, we determined the extent to which HCPs used quantitative tools and“theory” to assess impacts and mitigation strategies. We divided “theory” into ideas andmethods arising from six different subdisciplines: population genetics, population ecology,behavioral and physiological ecology, island biogeography, community ecology, and ecosystemecology. As an example, an HCP applying genetic theory might estimate inbreeding depressionresulting from reduced population sizes related to the planned take. In the same HCP, the effectof take on a species might be estimated from a population model incorporating the influence ofhabitat loss on population size. We also determined the type of data used to bring a theory tobear on impact or assessment and the quality or appropriateness of the use of theory.
We found that most HCPs did not use theory to make assessments about the impacts oftake or to support mitigation strategies. Of the 97 species-plan examples we examined, the sixdifferent categories of theory were applied to impact analysis between 8 and 44 times (for somespecies more than one variety of theory was applied) and to mitigation analysis between 8 and 50times (Table 14; QB responses to SQ:D1-6 and E1-6). Genetic theory was used least, and theoryrelated to population ecology was applied most often. When theory was used, it most often tookthe form of a quantitative statistical analysis; such analyses were clear and relevant about 60% ofthe time and inadequate in the remaining cases. None of the HCPs we analyzed used moresophisticated theories—quantitative models—to project the impacts of take on populations.Such models were also used very infrequently (8 cases total) to project the success of mitigationand minimization efforts. It is important to emphasize that we did not score HCPs as inadequatesimply because they failed to use theory. We remark on the absence of theory in HCPs largelyas a commentary on a major lack of connection between academic conservation biology andconservation practice.
9.3. Uncertainty and the Precautionary Principle
In many fields of environmental analysis, uncertainty is increasingly recognized as theuniversal background against which all decision-making takes place. This tenet and itsconsequences have become known as “the precautionary principle.” This principle, long appliedin fields as diverse as engineering and economics, holds that in the face of poor information orgreat uncertainty, managers should adopt risk-averse practices. That is, management actionsshould be chosen such that there is a correspondence between the uncertainty or lack ofinformation underlying the decision and the size of the potential negative impact resulting from
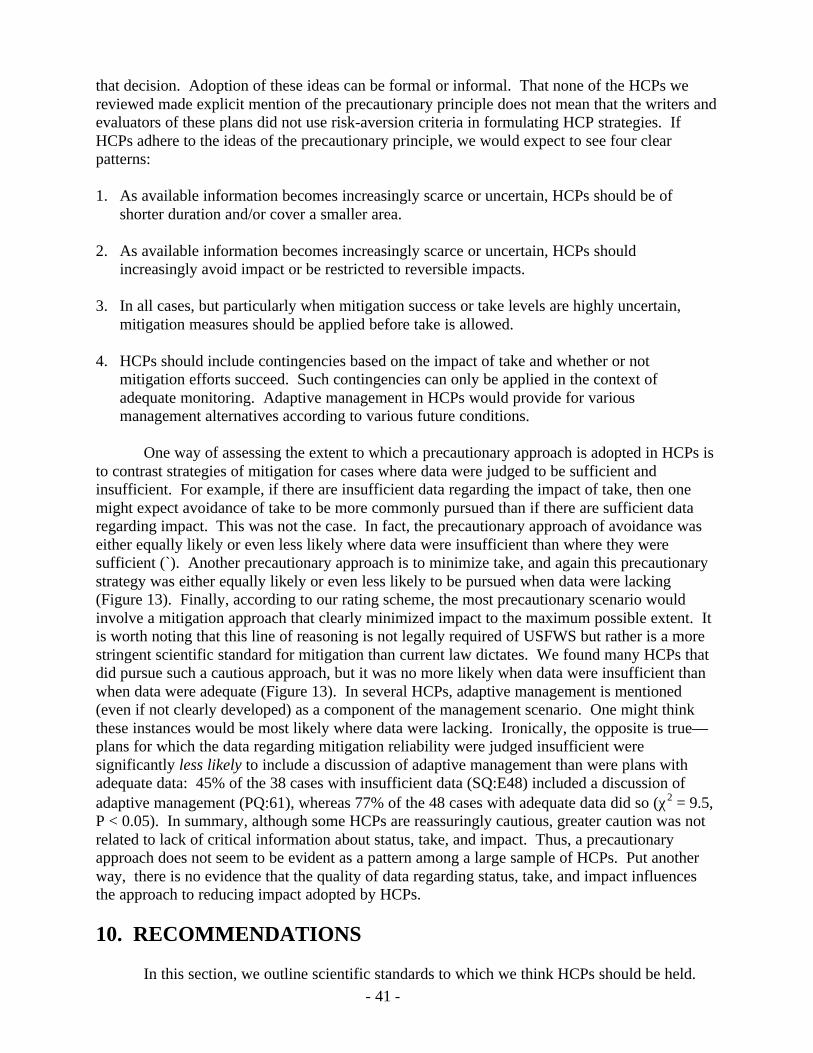
- 41 -
that decision. Adoption of these ideas can be formal or informal. That none of the HCPs wereviewed made explicit mention of the precautionary principle does not mean that the writers andevaluators of these plans did not use risk-aversion criteria in formulating HCP strategies. IfHCPs adhere to the ideas of the precautionary principle, we would expect to see four clearpatterns:
1. As available information becomes increasingly scarce or uncertain, HCPs should be ofshorter duration and/or cover a smaller area.
2. As available information becomes increasingly scarce or uncertain, HCPs shouldincreasingly avoid impact or be restricted to reversible impacts.
3. In all cases, but particularly when mitigation success or take levels are highly uncertain,mitigation measures should be applied before take is allowed.
4. HCPs should include contingencies based on the impact of take and whether or notmitigation efforts succeed. Such contingencies can only be applied in the context ofadequate monitoring. Adaptive management in HCPs would provide for variousmanagement alternatives according to various future conditions.
One way of assessing the extent to which a precautionary approach is adopted in HCPs isto contrast strategies of mitigation for cases where data were judged to be sufficient andinsufficient. For example, if there are insufficient data regarding the impact of take, then onemight expect avoidance of take to be more commonly pursued than if there are sufficient dataregarding impact. This was not the case. In fact, the precautionary approach of avoidance waseither equally likely or even less likely where data were insufficient than where they weresufficient (`). Another precautionary approach is to minimize take, and again this precautionarystrategy was either equally likely or even less likely to be pursued when data were lacking(Figure 13). Finally, according to our rating scheme, the most precautionary scenario wouldinvolve a mitigation approach that clearly minimized impact to the maximum possible extent. Itis worth noting that this line of reasoning is not legally required of USFWS but rather is a morestringent scientific standard for mitigation than current law dictates. We found many HCPs thatdid pursue such a cautious approach, but it was no more likely when data were insufficient thanwhen data were adequate (Figure 13). In several HCPs, adaptive management is mentioned(even if not clearly developed) as a component of the management scenario. One might thinkthese instances would be most likely where data were lacking. Ironically, the opposite is true—plans for which the data regarding mitigation reliability were judged insufficient weresignificantly less likely to include a discussion of adaptive management than were plans withadequate data: 45% of the 38 cases with insufficient data (SQ:E48) included a discussion ofadaptive management (PQ:61), whereas 77% of the 48 cases with adequate data did so (χ2 = 9.5,P < 0.05). In summary, although some HCPs are reassuringly cautious, greater caution was notrelated to lack of critical information about status, take, and impact. Thus, a precautionaryapproach does not seem to be evident as a pattern among a large sample of HCPs. Put anotherway, there is no evidence that the quality of data regarding status, take, and impact influencesthe approach to reducing impact adopted by HCPs.
10. RECOMMENDATIONS
In this section, we outline scientific standards to which we think HCPs should be held.
Figure 13. The percentage of cases in which avoidance (SQ:E32 QH) and minimization (SQ:E33 QH) measures were used when supporting data for status, take, and impact were either sufficient or insufficient (SQ:B42, C32, D46).
Stage of Analysis
Status Take Impact
0
25
50
75
10031 58
51
39
44 45
% o
f ca
ses
Min
imiz
atio
n us
ed%
of
case
sA
void
ance
use
d31
58
39
5144 45
Status Take Impact
0
25
50
75
100Insufficient dataSufficient data
- 43 -
Our standards identify specific attributes that HCPs should have to be considered scientificallycredible. We make these recommendations based on a thorough review and analysis of sciencein HCPs, but we also recognize that practical constraints may make it difficult to meet thesestandards. In many cases the landowner or contractor designs an HCP in the absence of criticaldata. The information required to develop an HCP is often nonexistent. Because this situationwas common in the plans we reviewed, and it is likely to recur, we also provide a set of practicalrecommendations for handling a shortage of data or desired information scientifically. Whendata are lacking, uncertainty is large and unavoidable. It then becomes imperative that thisuncertainty be explicitly acknowledged and measured in some way (even if only on a three-pointscale of high, medium, low). We conclude by offering general policy recommendations.
10.1. Standards for a Scientifically Based HCP
Ideally an HCP would be based on knowledge of the basic population biology of allspecies covered in the incidental take permit, their ecological requirements, and a quantitativeestimate of the impact of take on population viability. The plan would evaluate the cumulativeeffects of multiple plans and activities on covered species, as well as potential interactionsamong effects. Given limited resources and information available during HCP development,these standards will be difficult to achieve. Nevertheless, we need standards toward whichplanners can strive and against which HCPs can be measured.
The foundation of any HCP, and its supporting documents, must be data. Assertions suchas “take will be 54 animals” do not constitute data. Data must exist, be accessible, and beexplicitly summarized in the HCP in order to be scientifically credible. The absence of any ofthese three “ingredients” precludes a scientifically based HCP. Existence of the data is notsufficient; they must be included in the HCP and available for analysis. It is still possible forscientists to debate how best to use or interpret data, but there is no question that the data mustexist in the first place. Data standards should be formalized: all large-area HCPs (or HCPs thatcover a major portion of a federally listed species’ range) should include an inventory andsummary of available data on each covered species, including its overall distribution, abundance,population trends, ecological requirements, basic life history, and the nature of the causes ofendangerment. Smaller HCPs can simply point to other HCPs or readily available data sourcesand inventories. All sources of data should be formally documented. An explicitacknowledgment describing what data are not available should also be included to allow a moreaccurate assessment of uncertainty and risk in the planning process. In order to provide moreconcrete suggestions, we consider status, take, impact, mitigation, and monitoring separately.
Status
Adequate determination of status requires that data on distribution, population trends,habitat needs and trends, and threats be examined. The analysis should be both local (within theHCP) and global (so that whatever is going on within an HCP can be put in a biological context).Determining status requires knowledge of a substantial amount of natural history—the threats toa species cannot be identified without considerable knowledge of that species’ natural history.Similarly, population trends should be based on more than just a few years of censusinformation.
Take
- 44 -
Take can generally be assessed either by census of a population and prediction of theportion that will be lost or by establishment of relationships between habitat area (and quality)and expected number of individuals contained within that habitat, which in turn allows one topredict reductions in population due to reductions in habitat. An explicit quantitative modelshould link the activity for which the HCP is initiated to loss of individual organisms, if at allpossible.
Impact
Impact does not equal take. This simple fact must be emphasized, because it is neglectedor overlooked in a large portion of existing HCPs. Measurement of impact on population orspecies viability requires data on population processes both within and outside of the HCP(minimally the same data discussed for “status”). If an HCP comprises a large area and asubstantial portion of a species’ range, then some attempt should be made at developing a“model” (explicit, but not necessarily mathematical). This model should link take to keypopulation processes. For example, taking 40% of a global population from a source populationfor the species' whole range is very different from taking 40% of a global population from a sinkarea. Similar arguments can be made for genetic and evolutionary impacts. Careful thinkingabout impacts can alter how one goes about summarizing take. For example, the types ofindividuals taken may be as important as their numbers—the removal of young reproductiveindividuals usually has the greatest impact on population growth and recovery, so avoidance orpreferential take of this age class will profoundly influence the impact of the take. Thispossibility demonstrates that the quantification of take must be conceptually linked to insightsabout the population-level impacts of take.
Mitigation
The details of proposed mitigation measures must be explicitly described andaccompanied by data regarding their effectiveness. Documenting effectiveness requiresinformation on two levels. First specific effectiveness of the proposed measure should bedocumented. For example, if transplantation is proposed, what proportion of the transplantedindividuals survive to reproduce? Second, the more general effectiveness of the mitigationmeasures in minimizing impact must be analyzed, so the outcome of mitigation actions must belinked to population processes of the target species.
Monitoring
Without adequate and appropriate monitoring, the success of plans cannot be evaluated.The principal criterion for determining the adequacy of monitoring should be the ability of amonitoring plan to evaluate the success of mitigation measures and the consequent effect onprotected species. Monitoring frequencies, methods, and analyses should be designed to permitappropriate modification of mitigation measures in response to species status and should beexplicitly documented in the HCP. Monitoring data should be incorporated into centralized databases to facilitate access to information on the overall status of species and to facilitateassessment of cumulative impacts. Even if monitoring does not lead to rectifying mistakes in itsassociated HCP, it can furnish information from which future HCPs can be designed so thatmistakes are not repeated.
Peer Review
- 45 -
Finally, HCPs should be open to peer review (review by scientists specializing inconservation biology). Although HCPs are the property and responsibility of the applicant, theyconcern protection of public resources (endangered and threatened species). Thus, the data,analyses, and interpretations made regarding status, take, impact, mitigation, and monitoringshould be reviewed to ensure that the scientific foundations of the plans are sound. Peer reviewis already a standard for science in other regulatory arenas and should be incorporated into theHCP process. The need for peer review is not universal; small HCPs without large irreversibleimpacts require less scrutiny than large HCPs of long duration and broad ecological impacts.
10.2. Scientific Approaches to a Paucity of Data
The standards we have defined are difficult, if not impossible, to achieve because of acurrent paucity of pertinent data, but HCPs are not therefore fundamentally unscientific. Theymust simply use existing data in a scientifically credible fashion. Before we discussrecommended approaches to habitat conservation planning with data shortages, we must addresstwo more general issues about data.
First, when pertinent data are lacking, the top priority before developing an HCP shouldbe to acquire those data. How the data are collected, and by whom, is an issue that will have tobe resolved among resource agencies such as USFWS and HCP developers, but there is no surerway to garner scientific credibility than to use data. When collection of all desirable data is notpracticable, then the planning process should proceed with caution commensurate with theanticipated risks and uncertainties.
Second, when critical data are absent, an HCP should not be initiated or approved. Itwould be wrong to call the HCP process scientific, or even rational, if there were no option tohalt the process in the absence of crucial information. We need not have all the desired data toproduce an HCP—the planning process would be paralyzed because data will always bedetermined to be insufficient. Rather, the absence of crucial data for certain types of HCPs mustbe in principle a possible reason for not allowing take until the problem has been corrected. Ingeneral, the greater the impact of a plan, (e.g., plans with high impact are those with irreversibleimpacts, covering a large area or multiple species or spanning more than 20 years), the fewergaps in critical data should be tolerated.
Shortage of Data on Status
When data on status are few, we must err on the conservative side. What must beavoided is the assertion of healthy status with few supporting data.
Shortage of Data on Take
For small-area HCP’s (which we assume will involve small takes) an absence of data ontake is acceptable, but for HCP’s covering vast expanses of land, take must be quantitativelyassessed; if it is not, the HCP process should not be entered into. This is a standard principle ofrisk assessment—when the hazards are large, the requirements for safety assurances becomemore severe. When take is not the most pertinent quantity to estimate (as when something likewater quality for salmon is subtly degraded) but rather impacts are the issue, a careful assessmentof impacts can replace attention to precise take numbers.
- 46 -
Shortage of Data on Impact
A scarcity of data on impacts of take can best be handled by best- and worst-casescenarios. Even without quantitative data, biologists can usually construct a worst-case scenario.
Shortage of Data on Mitigation
If no information validates mitigation as effective, then assessment of mitigation shouldprecede any take. In addition, monitoring must be especially well designed in those cases wheremitigation is unproven.
Absence of Explicit Description of Monitoring
Careful monitoring is in some cases a solution to data shortage. For example, when theeffectiveness of mitigation is uncertain, monitoring can determine that effectiveness, but only ifit is well designed (for example, as a before-and-after study of impact and control). When dataare few, explicit measures are needed for using the information from monitoring to altermanagement procedures. That is, a precise criterion for “mitigation failure” must be specified,as well as procedures for adjusting management when that criterion is recognized. The key pointhere is that the existence of monitoring is not a solution to data shortage – a quantitative decisionprocess must link monitoring to adjustments in management.
Responding to Uncertainty
In addition to the specific recommendations given above with respect to lack of data,there are general scientific principles for dealing with a lack of information. First, theprecautionary principle argues that, in the face of poor information, risk-averse strategies shouldbe adopted. That is, when data are extremely poor, HCP’s should be limited to small areas orshort duration. Scarce information requires particular care about activities that are irreversible(building a shopping mall as opposed to logging), and monitoring becomes more crucial forassessing the well-being of threatened species. Mitigation measures should be applied beforetake is allowed, so that their effectiveness can be evaluated. Perhaps the simplest approachwould be to put in place scientific advisory panels for plans that lack information and have bothlong durations and large impact areas. This panel could advise on the development of the planand its implementation; scientists from recovery teams would be logical choices as a startingpoint.
10.3. Policy Measures for Attaining More Effective Science in the HCP Process
The goal of our analysis was to evaluate the role of science in the HCP process. In thissection we provide a set of recommendations for improving its quality and effectiveness. Werecognize that science is not the primary motivation for HCPs and that they must addressmultiple, often conflicting objectives. They have political, economic, and social objectives aswell as scientific ones. We also understand that Section 10 of the Endangered Species Act doesnot prescribe any scientific standard upon which the approval or disapproval of HCPs is to bebased. Section 7 requires only that decisions be based on the “best scientific and commercialdata available.” While acknowledging these dimensions, we have nonetheless chosen to focusour study on evaluating how science is being used in the HCP process. Our assessment leads to
- 47 -
the following recommendations:
1. We recommend that greater attention be given to explicit scientific standards for HCPs, butthat this be done in a flexible manner that recognizes that low impact HCPs need not adhereto the same standards as high impact HCPs. A formalized scheme might be adopted so thatsmall HCPs draw on data analyses from large HCPs, assuring that applicants are notparalyzed by unrealistic demands.
2. For the preparation of individual HCPs, we recommend that those with potentially largeimpact (those that are large in area or cover a large portion of a species’ range) include anexplicit summary of available data on covered species, including their distribution,abundance, population trend, ecological requirements, and causes of endangerment. HCPsshould be more quantitative in stating their biological goals and in predicting their likelyimpact on listed species. When information important to the design of the HCP does notexist, it may still be possible to estimate the uncertainties associated with impact, mitigation,and monitoring, and to still go forward, as long as risks are acknowledged and minimized.Flexibility can be built into mitigation plans so that managers can be responsive to the resultsof monitoring during the period of the HCP. When highly critical information is missing, theagencies should be willing to withhold permits until that information is obtained.
3. For the HCP process in general, we recommend that information about listed species bemaintained in accessible, centralized locations, and that monitoring data be made accessibleto others. During the early stages of the design of potentially high-impact HCPs and thosethat are likely to lack important information, we recommend the establishment of a scientificadvisory committee and increased use of independent peer review (review by scientistsspecializing in conservation biology). This policy should prevent premature agreements withdevelopment interests that ignore critical science.
To pursue these measures will require major agency initiatives or policy alterations.First, the coordination of efforts to protect and recover threatened and endangered species mustbe improved. This coordination will be essential to the accurate estimation of the cumulativeimpacts of various management efforts for threatened and endangered species. The datapertaining to these management activities (e.g., HCPs, recovery efforts on federal land, safe-harbor agreements on nonfederal land) should be organized into a single distributed data basesystem. These data must be accessible to agency and academic scientists for analysis andevaluation of the effectiveness of HCPs and recovery efforts. Better coordination andaccessibility of scientific examinations of endangered species recovery does not require anylegislative change, but it would require a funding commitment to put a centralized data base inplace. Frankly, we think that centralized and readily accessible data on endangered species coulddo for species protection what centralized and accessible data on criminals and outstandingwarrants has done for public safety protection. Surely, if we can do this for law enforcement, wecan also do it for environmental protection.
Second, both academic and agency scientists should become more involved in the HCPprocess, for example through encouragement of peer review and the establishment of advisorycommittees. Recovery plans are currently peer-reviewed, and the culture to obtain such reviewalready exists in the pertinent government agencies.
Last, we encourage USFWS and NMFS to conduct their own review of the HCP process
- 48 -
from the perspective of identifying mechanisms for making the job of their agency scientistsmore clearly defined. This process could entail revision of the HCP handbook, pushes for betterdata access, and institutional commitment to peer review. The HCP process need notcompromise the quality of its science just because it must balance science and negotiation withdevelopment interests. Clearly, it could sharpen the light cast by science if the guidelines forscientific input were improved. Reference to data, peer review, and significant adaptivemanagement are too often absent from the HCP process. To remedy these deficiencies willrequire more resources. The USFWS is currently being asked to do too much with too fewresources in this HCP process.
ACKNOWLEDGMENTS
We thank NCEAS and the American Institute of Biological Sciences (AIBS) for financialsupport of this project and the USFWS for a heroic review of our data base under intense timepressure. Michael Bean and Hilary Swain provided two rounds of comments and advice thatwere invaluable. Jim Reichman and Frank Davis allowed (and even encouraged) hordes ofstudents to overrun NCEAS and out of chaos produce these data syntheses. Most importantly,the staff at NCEAS (Marilyn Snowball, Shari Staufenberg, John Gaffney, Kristan Lenehan, andMatt Jones) faced the chaos of this project with good humor and provided enormous help at allstages (travel, logistic support, and computers).
- 49 -
REFERENCES
Bean, M. J., S. G. Fitzgerald, and M. A. O’Connell. 1991. Reconciling conflicts under theEndangered Species Act: the habitat conservation planning experience. World WildlifeFund, Washington, D.C.
Bean, M. J., and D. S. Wilcove. 1997. The private land problem. Conservation Biology 11: 1-2.
Beatley, T. 1994. Habitat conservation planning: endangered species and urban growth.University of Texas Press, Austin, Tex.
Bingham, B. B., and B. R. Noon. 1997. Mitigation of habitat "take": application to habitatconservation planning. Conservation Biology 11: 127-139.
Buchanan, J. B., R. J. Fredrickson, and D. E. Seaman. 1997. Mitigation of habitat "take" andthe core area concept. Conservation Biology 12: 238-240.
Burgman, M. A., S. Ferson, and H. R. Akcakaya. 1993. Risk assessment in conservationbiology. Chapman & Hall, London
ESA (Endangered Species Act). 1982. Pub L. 97-304, 92 Stst. 1411, Oct. 13, 1982. USA.
Hood, L. C. 1998. Frayed safety nets: conservation planning under the Endangered SpeciesAct. Defenders of Wildlife, Washington, D.C.
Hosack, D., L. Hood, and M. Senatore. 1997. Expanding the participation of academicscientists in the HCP planning process. Endangered Species Update 14 (7&8): 60-62.
Kaiser, J. 1997. When habitat is not a home. Science 276: 1636-1638.
Kostyack, J. 1997. Habitat conservation planning: time to give conservationists and concernedcitizens a seat at the table. Endangered Species Update 14 (7&8): 51-55.
Meffe, G. K., and C. R. Carroll. 1994. Principles of conservation biology. Sinauer Associates,Sunderland, Mass.
Murphy, D.D., P. Brussard, G. Meffe, B. Noon, R. Noss, J. Quinn, K. Ralls, M. Soulé, and R.Tracy. 1997. A statement on proposed private lands initiatives and reauthorization of theEndangered Species Act from the meeting of scientists at Stanford University.
National Audubon Society. 1997. Report of the National Audubon Society Task Force onHabitat Conservation Plans. National Audubon Society, Washington D.C.
Noss, R. F., M. A. O’Connell, and D. D. Murphy. 1997. The science of conservation planning:habitat conservation under the Endangered Species Act. Island Press, Washington, D.C.
O’Connell, M. A., and S. P. Johnson. 1997. Improving habitat conservation planning: theCalifornia natural community conservation model. Endangered Species Update 14
- 50 -
(1&2).
Pulliam, H. R. 1988. Sources, sinks, and population regulation. American Naturalist 132: 652-661.
Tear, T. H., J. M. Scott, P. H. Hayward, and B. Griffith. 1993. Recovery plans and theEndangered Species Act: are criticisms supported by data? Conservation Biology 9:182-195.
USFWS (United States Fish and Wildlife Service). 1981. Final rule: endangered and threatenedwildlife and plants; final redefinition of harm. Federal Register 46: 54,748.
USFWS (United States Fish and Wildlife Service) and NMFS (National Marine FisheriesService). 1996. Habitat conservation planning handbook. U.S. Department of theInterior, Washington, D.C.
Wootton, J. T., and D. A. Bell. 1992. A metapopulation model for the peregrine falcon inCalifornia: viability and management strategies. Ecological Applications 2: 307-321.
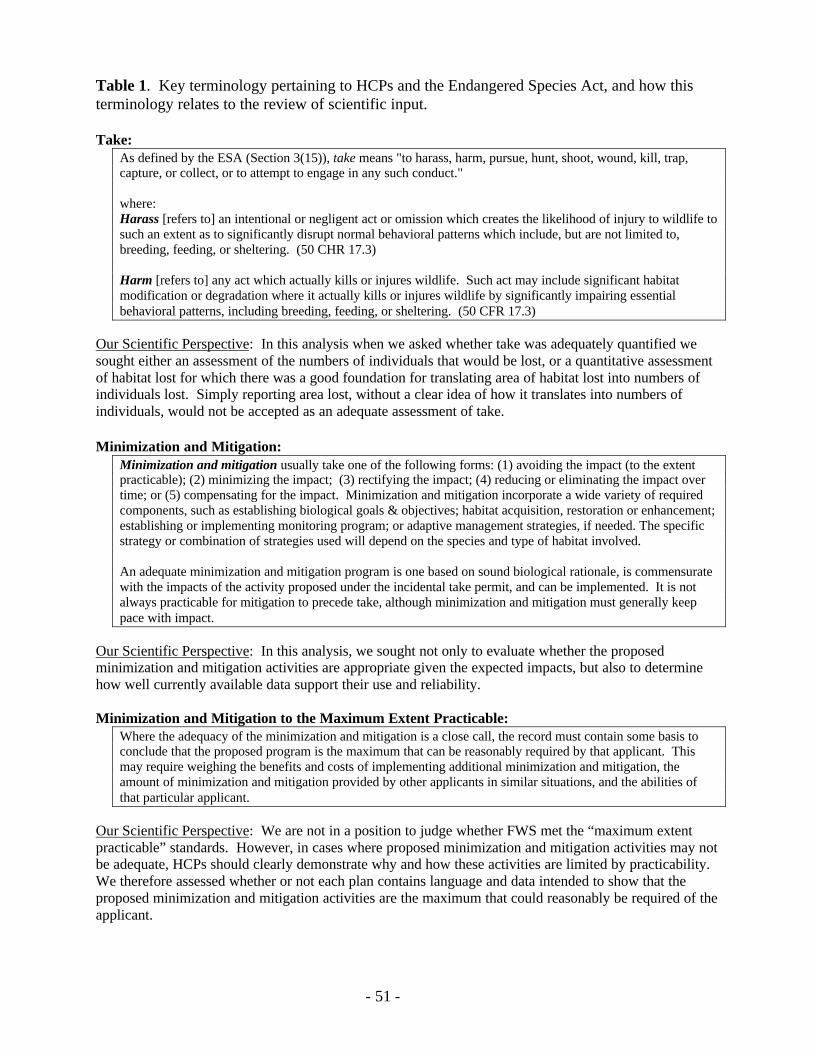
- 51 -
Table 1. Key terminology pertaining to HCPs and the Endangered Species Act, and how thisterminology relates to the review of scientific input.
Take:As defined by the ESA (Section 3(15)), take means "to harass, harm, pursue, hunt, shoot, wound, kill, trap,capture, or collect, or to attempt to engage in any such conduct."
where:Harass [refers to] an intentional or negligent act or omission which creates the likelihood of injury to wildlife tosuch an extent as to significantly disrupt normal behavioral patterns which include, but are not limited to,breeding, feeding, or sheltering. (50 CHR 17.3)
Harm [refers to] any act which actually kills or injures wildlife. Such act may include significant habitatmodification or degradation where it actually kills or injures wildlife by significantly impairing essentialbehavioral patterns, including breeding, feeding, or sheltering. (50 CFR 17.3)
Our Scientific Perspective: In this analysis when we asked whether take was adequately quantified wesought either an assessment of the numbers of individuals that would be lost, or a quantitative assessmentof habitat lost for which there was a good foundation for translating area of habitat lost into numbers ofindividuals lost. Simply reporting area lost, without a clear idea of how it translates into numbers ofindividuals, would not be accepted as an adequate assessment of take.
Minimization and Mitigation:Minimization and mitigation usually take one of the following forms: (1) avoiding the impact (to the extentpracticable); (2) minimizing the impact; (3) rectifying the impact; (4) reducing or eliminating the impact overtime; or (5) compensating for the impact. Minimization and mitigation incorporate a wide variety of requiredcomponents, such as establishing biological goals & objectives; habitat acquisition, restoration or enhancement;establishing or implementing monitoring program; or adaptive management strategies, if needed. The specificstrategy or combination of strategies used will depend on the species and type of habitat involved.
An adequate minimization and mitigation program is one based on sound biological rationale, is commensuratewith the impacts of the activity proposed under the incidental take permit, and can be implemented. It is notalways practicable for mitigation to precede take, although minimization and mitigation must generally keeppace with impact.
Our Scientific Perspective: In this analysis, we sought not only to evaluate whether the proposedminimization and mitigation activities are appropriate given the expected impacts, but also to determinehow well currently available data support their use and reliability.
Minimization and Mitigation to the Maximum Extent Practicable:Where the adequacy of the minimization and mitigation is a close call, the record must contain some basis toconclude that the proposed program is the maximum that can be reasonably required by that applicant. Thismay require weighing the benefits and costs of implementing additional minimization and mitigation, theamount of minimization and mitigation provided by other applicants in similar situations, and the abilities ofthat particular applicant.
Our Scientific Perspective: We are not in a position to judge whether FWS met the “maximum extentpracticable” standards. However, in cases where proposed minimization and mitigation activities may notbe adequate, HCPs should clearly demonstrate why and how these activities are limited by practicability.We therefore assessed whether or not each plan contains language and data intended to show that theproposed minimization and mitigation activities are the maximum that could reasonably be required of theapplicant.
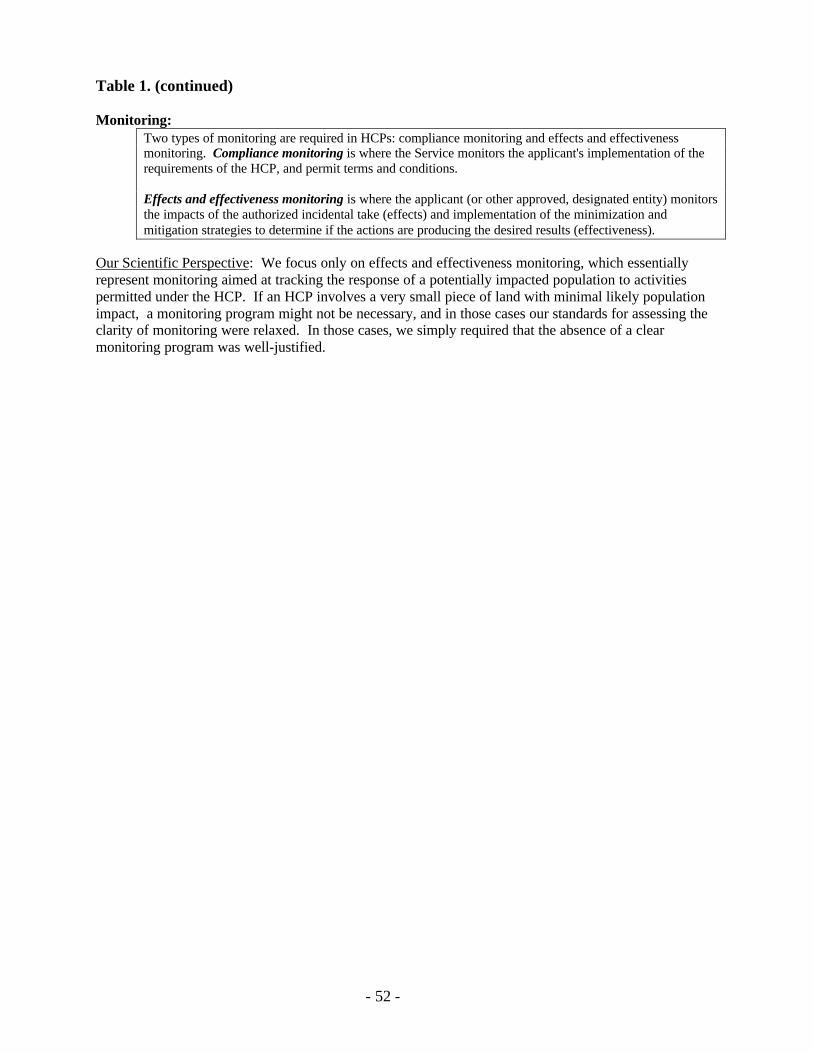
- 52 -
Table 1. (continued)
Monitoring:Two types of monitoring are required in HCPs: compliance monitoring and effects and effectivenessmonitoring. Compliance monitoring is where the Service monitors the applicant's implementation of therequirements of the HCP, and permit terms and conditions.
Effects and effectiveness monitoring is where the applicant (or other approved, designated entity) monitorsthe impacts of the authorized incidental take (effects) and implementation of the minimization andmitigation strategies to determine if the actions are producing the desired results (effectiveness).
Our Scientific Perspective: We focus only on effects and effectiveness monitoring, which essentiallyrepresent monitoring aimed at tracking the response of a potentially impacted population to activitiespermitted under the HCP. If an HCP involves a very small piece of land with minimal likely populationimpact, a monitoring program might not be necessary, and in those cases our standards for assessing theclarity of monitoring were relaxed. In those cases, we simply required that the absence of a clearmonitoring program was well-justified.
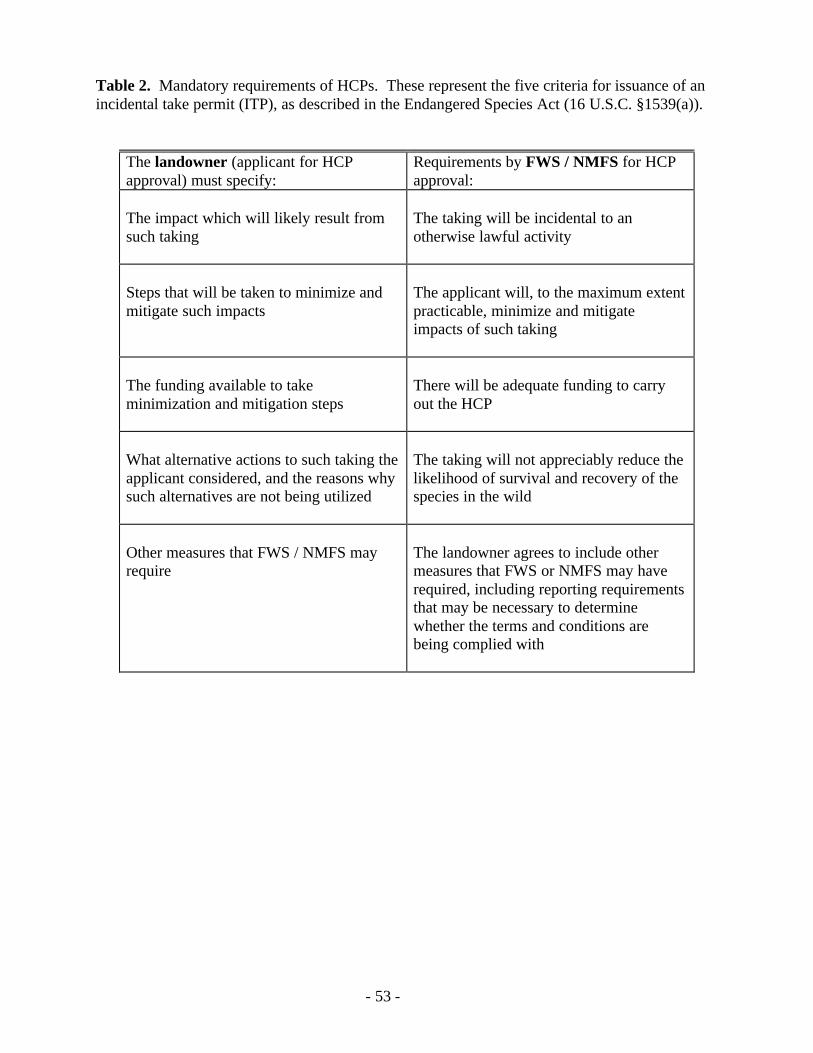
- 53 -
Table 2. Mandatory requirements of HCPs. These represent the five criteria for issuance of anincidental take permit (ITP), as described in the Endangered Species Act (16 U.S.C. §1539(a)).
The landowner (applicant for HCPapproval) must specify:
Requirements by FWS / NMFS for HCPapproval:
The impact which will likely result fromsuch taking
The taking will be incidental to anotherwise lawful activity
Steps that will be taken to minimize andmitigate such impacts
The applicant will, to the maximum extentpracticable, minimize and mitigateimpacts of such taking
The funding available to takeminimization and mitigation steps
There will be adequate funding to carryout the HCP
What alternative actions to such taking theapplicant considered, and the reasons whysuch alternatives are not being utilized
The taking will not appreciably reduce thelikelihood of survival and recovery of thespecies in the wild
Other measures that FWS / NMFS mayrequire
The landowner agrees to include othermeasures that FWS or NMFS may haverequired, including reporting requirementsthat may be necessary to determinewhether the terms and conditions arebeing complied with
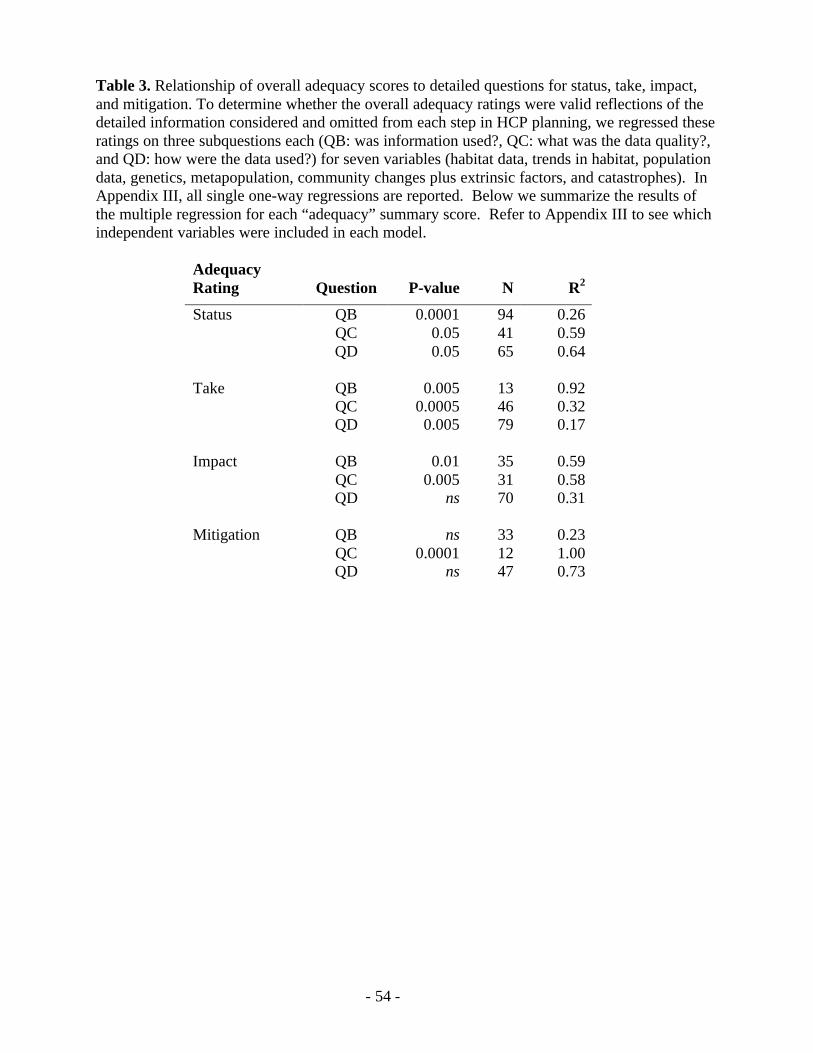
- 54 -
Table 3. Relationship of overall adequacy scores to detailed questions for status, take, impact,and mitigation. To determine whether the overall adequacy ratings were valid reflections of thedetailed information considered and omitted from each step in HCP planning, we regressed theseratings on three subquestions each (QB: was information used?, QC: what was the data quality?,and QD: how were the data used?) for seven variables (habitat data, trends in habitat, populationdata, genetics, metapopulation, community changes plus extrinsic factors, and catastrophes). InAppendix III, all single one-way regressions are reported. Below we summarize the results ofthe multiple regression for each “adequacy” summary score. Refer to Appendix III to see whichindependent variables were included in each model.
AdequacyRating Question P-value N R2
Status QB 0.0001 94 0.26QC 0.05 41 0.59QD 0.05 65 0.64
Take QB 0.005 13 0.92QC 0.0005 46 0.32QD 0.005 79 0.17
Impact QB 0.01 35 0.59QC 0.005 31 0.58QD ns 70 0.31
Mitigation QB ns 33 0.23QC 0.0001 12 1.00QD ns 47 0.73
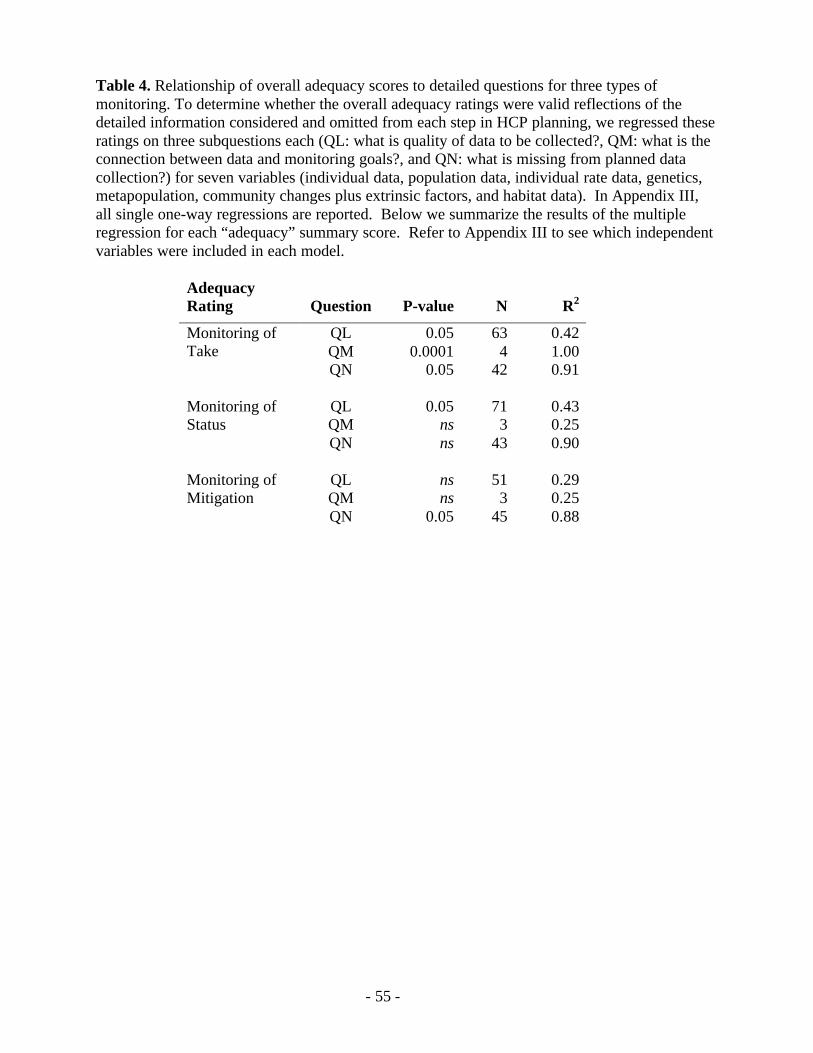
- 55 -
Table 4. Relationship of overall adequacy scores to detailed questions for three types ofmonitoring. To determine whether the overall adequacy ratings were valid reflections of thedetailed information considered and omitted from each step in HCP planning, we regressed theseratings on three subquestions each (QL: what is quality of data to be collected?, QM: what is theconnection between data and monitoring goals?, and QN: what is missing from planned datacollection?) for seven variables (individual data, population data, individual rate data, genetics,metapopulation, community changes plus extrinsic factors, and habitat data). In Appendix III,all single one-way regressions are reported. Below we summarize the results of the multipleregression for each “adequacy” summary score. Refer to Appendix III to see which independentvariables were included in each model.
AdequacyRating Question P-value N R2
QL 0.05 63 0.42QM 0.0001 4 1.00
Monitoring ofTake
QN 0.05 42 0.91
QL 0.05 71 0.43QM ns 3 0.25
Monitoring ofStatus
QN ns 43 0.90
QL ns 51 0.29QM ns 3 0.25
Monitoring ofMitigation
QN 0.05 45 0.88
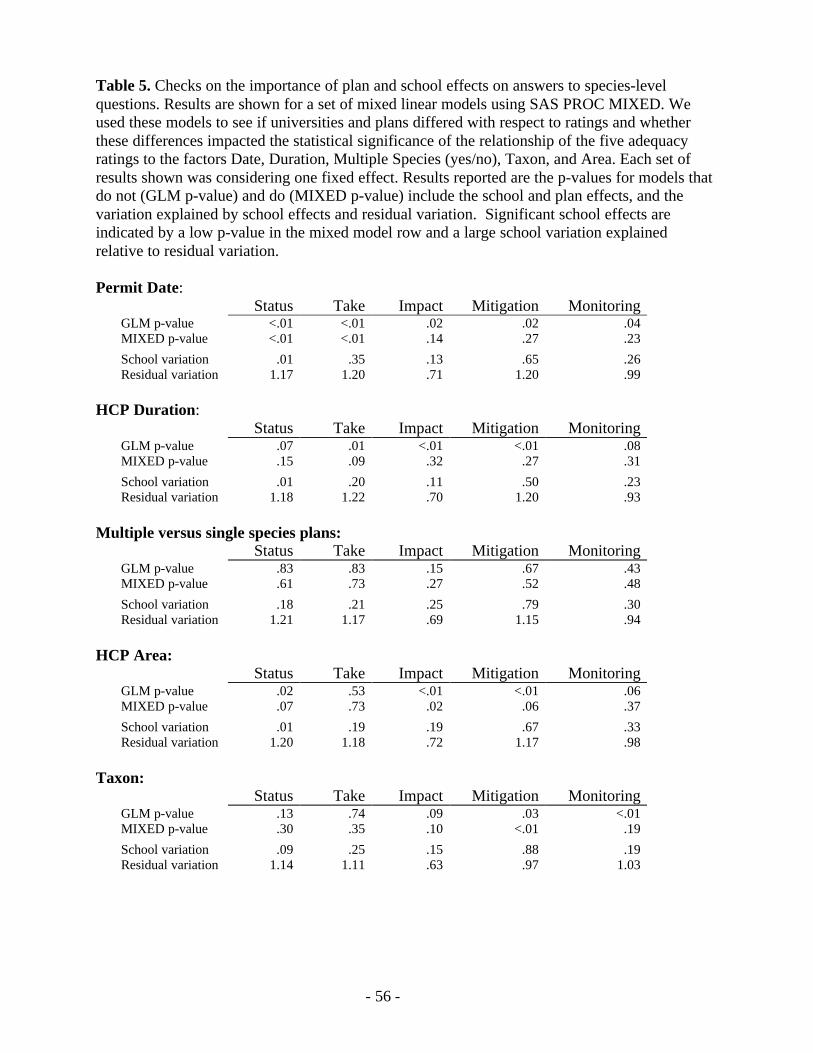
- 56 -
Table 5. Checks on the importance of plan and school effects on answers to species-levelquestions. Results are shown for a set of mixed linear models using SAS PROC MIXED. Weused these models to see if universities and plans differed with respect to ratings and whetherthese differences impacted the statistical significance of the relationship of the five adequacyratings to the factors Date, Duration, Multiple Species (yes/no), Taxon, and Area. Each set ofresults shown was considering one fixed effect. Results reported are the p-values for models thatdo not (GLM p-value) and do (MIXED p-value) include the school and plan effects, and thevariation explained by school effects and residual variation. Significant school effects areindicated by a low p-value in the mixed model row and a large school variation explainedrelative to residual variation.
Permit Date:Status Take Impact Mitigation Monitoring
GLM p-value <.01 <.01 .02 .02 .04MIXED p-value <.01 <.01 .14 .27 .23
School variation .01 .35 .13 .65 .26Residual variation 1.17 1.20 .71 1.20 .99
HCP Duration:Status Take Impact Mitigation Monitoring
GLM p-value .07 .01 <.01 <.01 .08MIXED p-value .15 .09 .32 .27 .31
School variation .01 .20 .11 .50 .23Residual variation 1.18 1.22 .70 1.20 .93
Multiple versus single species plans:Status Take Impact Mitigation Monitoring
GLM p-value .83 .83 .15 .67 .43MIXED p-value .61 .73 .27 .52 .48
School variation .18 .21 .25 .79 .30Residual variation 1.21 1.17 .69 1.15 .94
HCP Area:Status Take Impact Mitigation Monitoring
GLM p-value .02 .53 <.01 <.01 .06MIXED p-value .07 .73 .02 .06 .37
School variation .01 .19 .19 .67 .33Residual variation 1.20 1.18 .72 1.17 .98
Taxon:Status Take Impact Mitigation Monitoring
GLM p-value .13 .74 .09 .03 <.01MIXED p-value .30 .35 .10 <.01 .19
School variation .09 .25 .15 .88 .19Residual variation 1.14 1.11 .63 .97 1.03
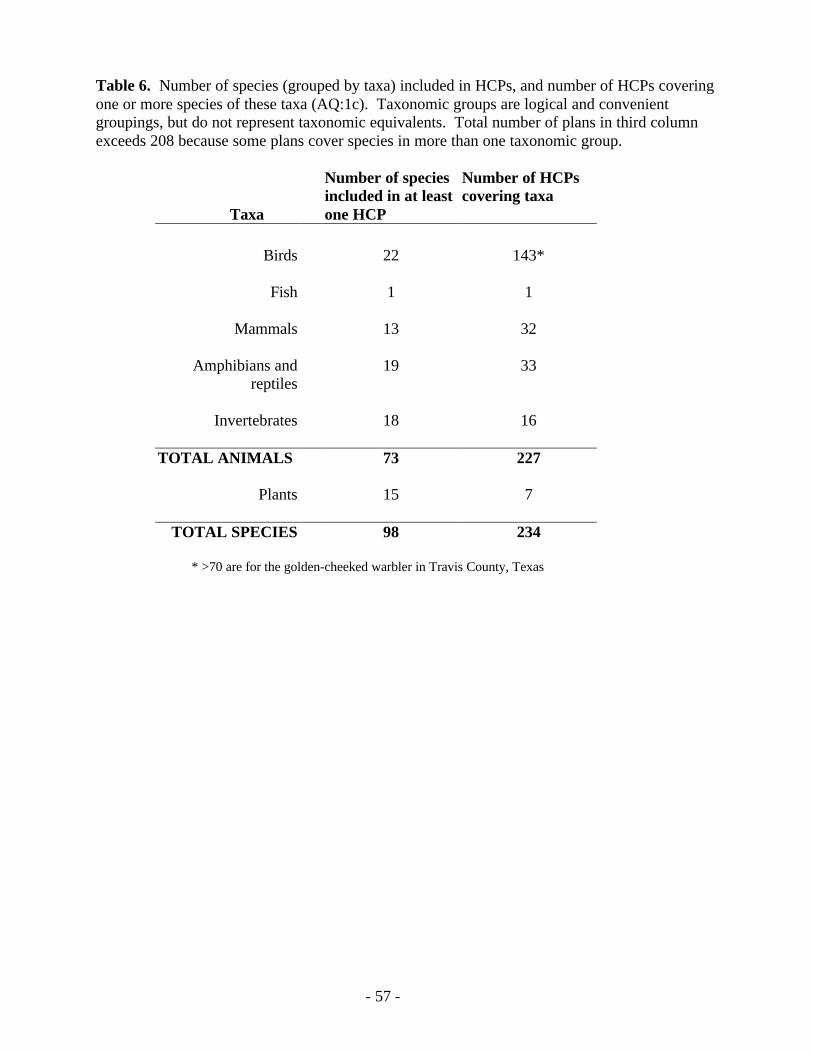
- 57 -
Table 6. Number of species (grouped by taxa) included in HCPs, and number of HCPs coveringone or more species of these taxa (AQ:1c). Taxonomic groups are logical and convenientgroupings, but do not represent taxonomic equivalents. Total number of plans in third columnexceeds 208 because some plans cover species in more than one taxonomic group.
Taxa
Number of speciesincluded in at leastone HCP
Number of HCPscovering taxa
Birds 22 143*
Fish 1 1
Mammals 13 32
Amphibians andreptiles
19 33
Invertebrates 18 16
TOTAL ANIMALS 73 227
Plants 15 7
TOTAL SPECIES 98 234
* >70 are for the golden-cheeked warbler in Travis County, Texas
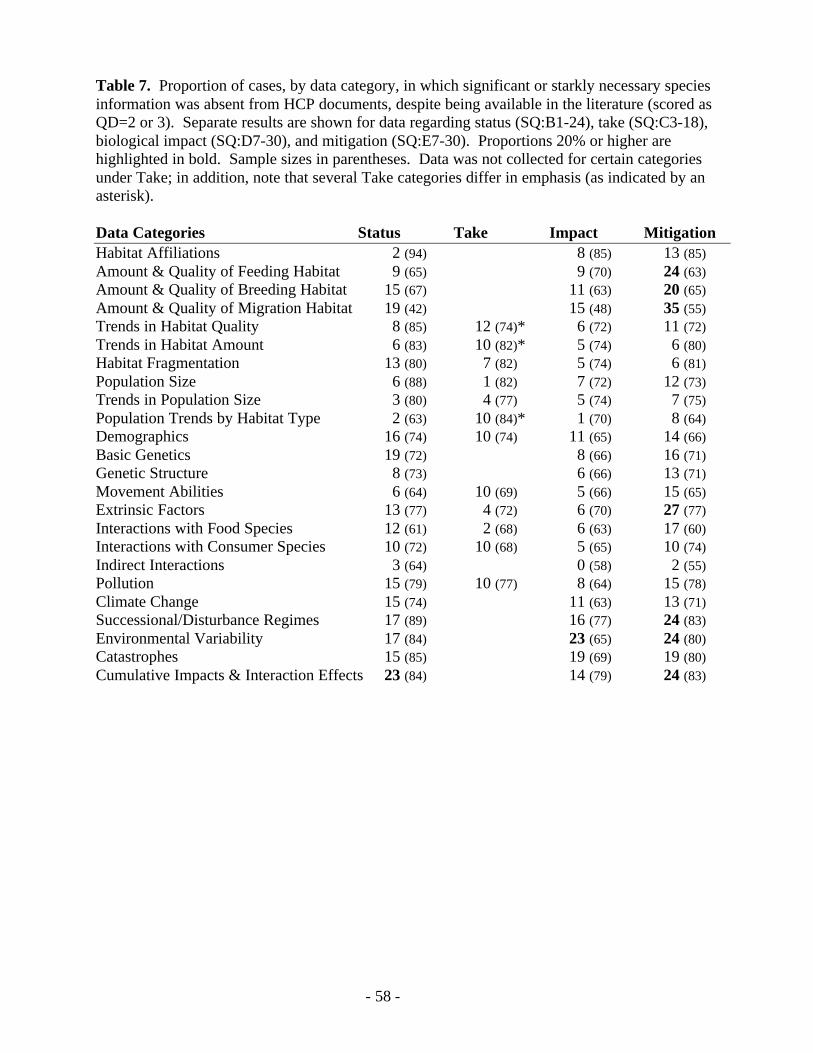
- 58 -
Table 7. Proportion of cases, by data category, in which significant or starkly necessary speciesinformation was absent from HCP documents, despite being available in the literature (scored asQD=2 or 3). Separate results are shown for data regarding status (SQ:B1-24), take (SQ:C3-18),biological impact (SQ:D7-30), and mitigation (SQ:E7-30). Proportions 20% or higher arehighlighted in bold. Sample sizes in parentheses. Data was not collected for certain categoriesunder Take; in addition, note that several Take categories differ in emphasis (as indicated by anasterisk).
Data Categories Status Take Impact MitigationHabitat Affiliations 2 (94) 8 (85) 13 (85)Amount & Quality of Feeding Habitat 9 (65) 9 (70) 24 (63)Amount & Quality of Breeding Habitat 15 (67) 11 (63) 20 (65)Amount & Quality of Migration Habitat 19 (42) 15 (48) 35 (55)Trends in Habitat Quality 8 (85) 12 (74)* 6 (72) 11 (72)Trends in Habitat Amount 6 (83) 10 (82)* 5 (74) 6 (80)Habitat Fragmentation 13 (80) 7 (82) 5 (74) 6 (81)Population Size 6 (88) 1 (82) 7 (72) 12 (73)Trends in Population Size 3 (80) 4 (77) 5 (74) 7 (75)Population Trends by Habitat Type 2 (63) 10 (84)* 1 (70) 8 (64)Demographics 16 (74) 10 (74) 11 (65) 14 (66)Basic Genetics 19 (72) 8 (66) 16 (71)Genetic Structure 8 (73) 6 (66) 13 (71)Movement Abilities 6 (64) 10 (69) 5 (66) 15 (65)Extrinsic Factors 13 (77) 4 (72) 6 (70) 27 (77)Interactions with Food Species 12 (61) 2 (68) 6 (63) 17 (60)Interactions with Consumer Species 10 (72) 10 (68) 5 (65) 10 (74)Indirect Interactions 3 (64) 0 (58) 2 (55)Pollution 15 (79) 10 (77) 8 (64) 15 (78)Climate Change 15 (74) 11 (63) 13 (71)Successional/Disturbance Regimes 17 (89) 16 (77) 24 (83)Environmental Variability 17 (84) 23 (65) 24 (80)Catastrophes 15 (85) 19 (69) 19 (80)Cumulative Impacts & Interaction Effects 23 (84) 14 (79) 24 (83)
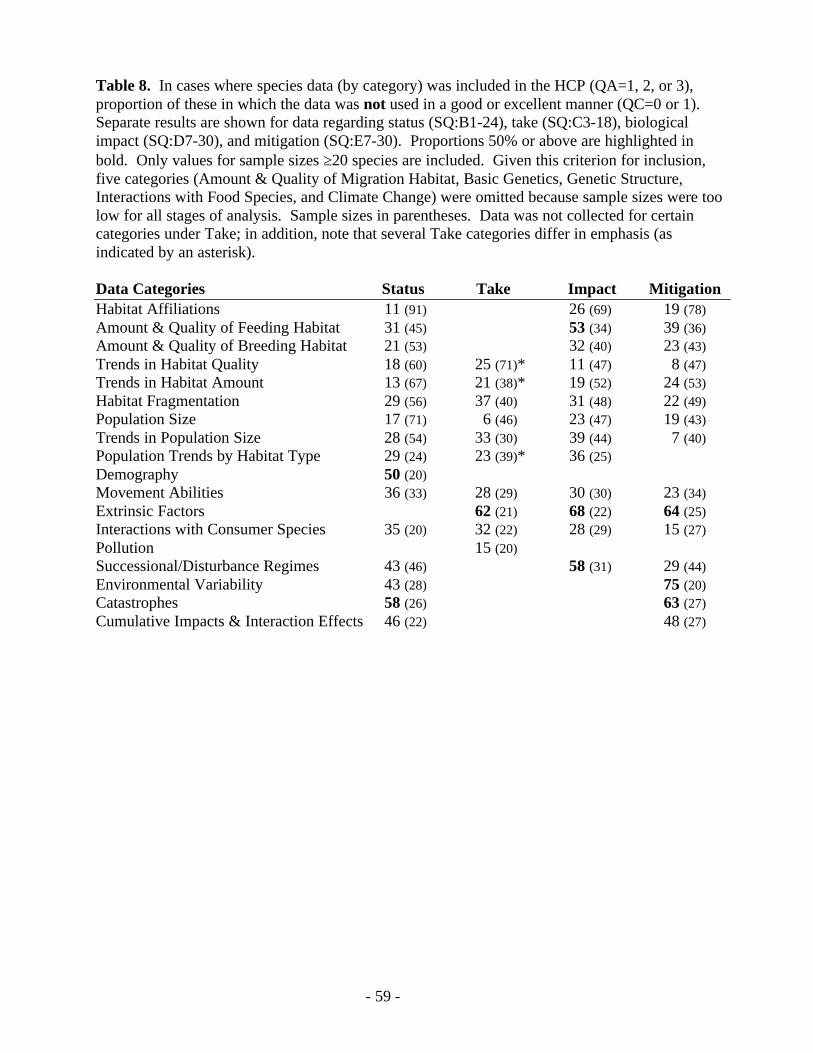
- 59 -
Table 8. In cases where species data (by category) was included in the HCP (QA=1, 2, or 3),proportion of these in which the data was not used in a good or excellent manner (QC=0 or 1).Separate results are shown for data regarding status (SQ:B1-24), take (SQ:C3-18), biologicalimpact (SQ:D7-30), and mitigation (SQ:E7-30). Proportions 50% or above are highlighted inbold. Only values for sample sizes ≥20 species are included. Given this criterion for inclusion,five categories (Amount & Quality of Migration Habitat, Basic Genetics, Genetic Structure,Interactions with Food Species, and Climate Change) were omitted because sample sizes were toolow for all stages of analysis. Sample sizes in parentheses. Data was not collected for certaincategories under Take; in addition, note that several Take categories differ in emphasis (asindicated by an asterisk).
Data Categories Status Take Impact MitigationHabitat Affiliations 11 (91) 26 (69) 19 (78)Amount & Quality of Feeding Habitat 31 (45) 53 (34) 39 (36)Amount & Quality of Breeding Habitat 21 (53) 32 (40) 23 (43)Trends in Habitat Quality 18 (60) 25 (71)* 11 (47) 8 (47)Trends in Habitat Amount 13 (67) 21 (38)* 19 (52) 24 (53)Habitat Fragmentation 29 (56) 37 (40) 31 (48) 22 (49)Population Size 17 (71) 6 (46) 23 (47) 19 (43)Trends in Population Size 28 (54) 33 (30) 39 (44) 7 (40)Population Trends by Habitat Type 29 (24) 23 (39)* 36 (25)Demography 50 (20)Movement Abilities 36 (33) 28 (29) 30 (30) 23 (34)Extrinsic Factors 62 (21) 68 (22) 64 (25)Interactions with Consumer Species 35 (20) 32 (22) 28 (29) 15 (27)Pollution 15 (20)Successional/Disturbance Regimes 43 (46) 58 (31) 29 (44)Environmental Variability 43 (28) 75 (20)Catastrophes 58 (26) 63 (27)Cumulative Impacts & Interaction Effects 46 (22) 48 (27)
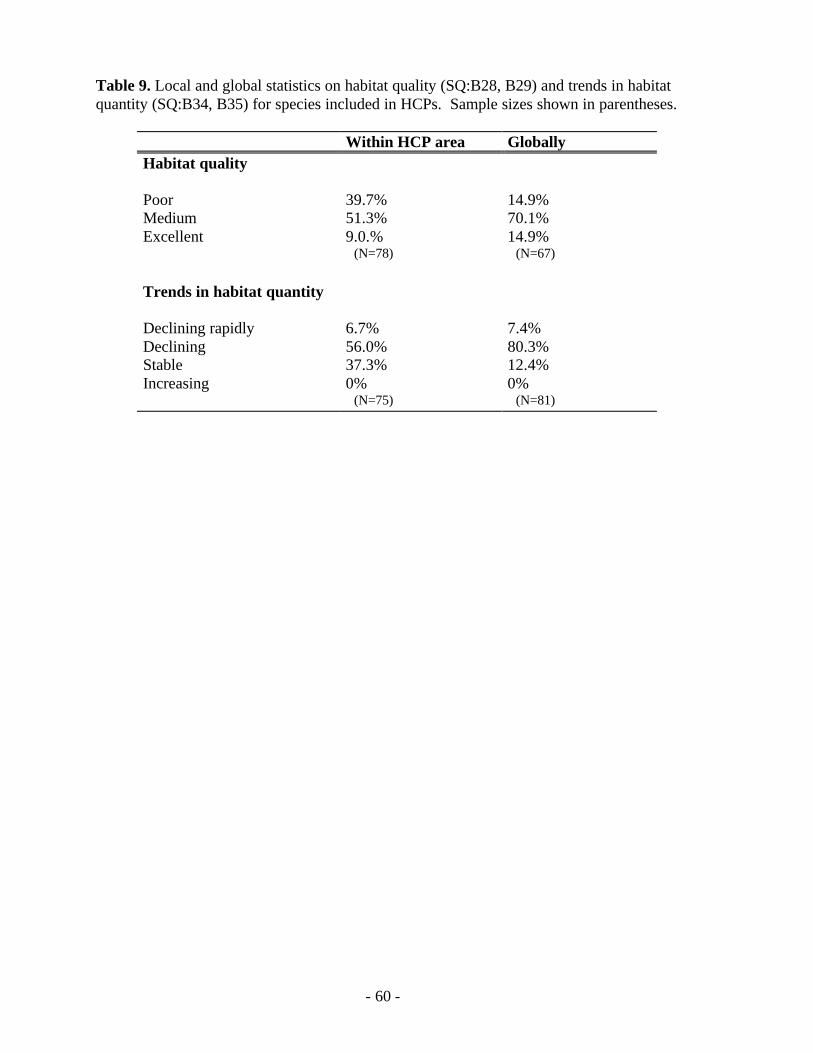
- 60 -
Table 9. Local and global statistics on habitat quality (SQ:B28, B29) and trends in habitatquantity (SQ:B34, B35) for species included in HCPs. Sample sizes shown in parentheses.
Within HCP area GloballyHabitat quality
Poor 39.7% 14.9%Medium 51.3% 70.1%Excellent 9.0.% 14.9%
(N=78) (N=67)
Trends in habitat quantity
Declining rapidly 6.7% 7.4%Declining 56.0% 80.3%Stable 37.3% 12.4%Increasing 0% 0%
(N=75) (N=81)
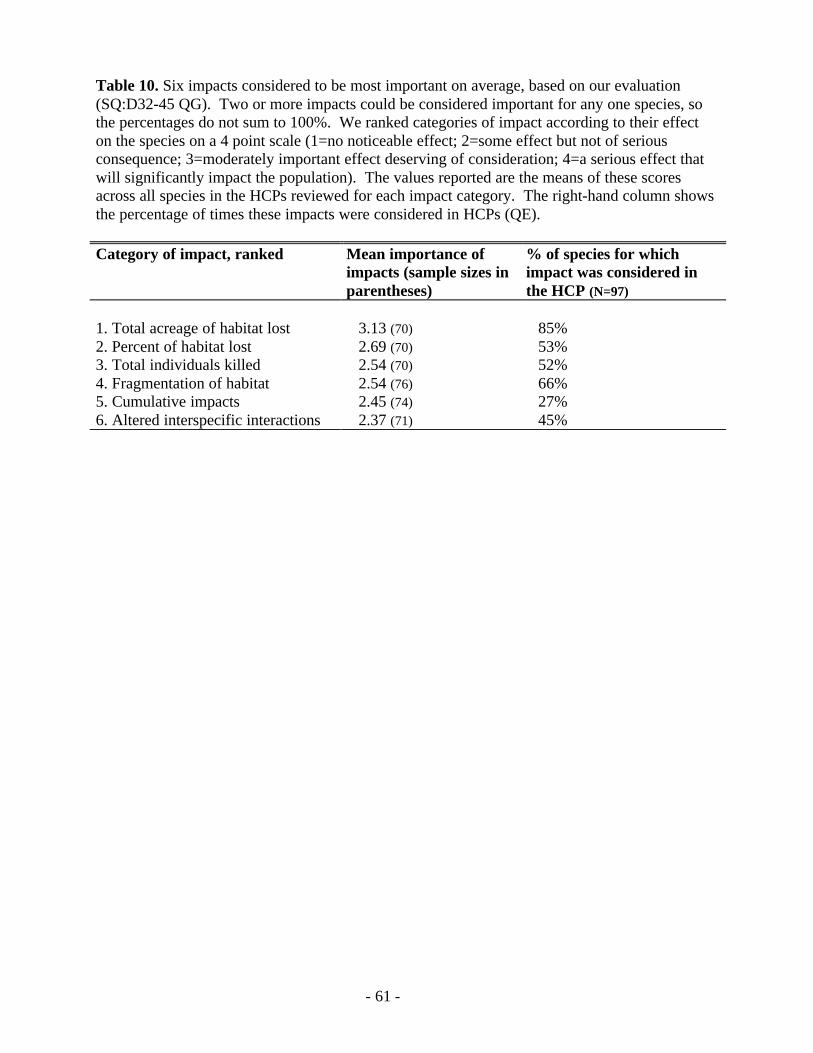
- 61 -
Table 10. Six impacts considered to be most important on average, based on our evaluation(SQ:D32-45 QG). Two or more impacts could be considered important for any one species, sothe percentages do not sum to 100%. We ranked categories of impact according to their effecton the species on a 4 point scale (1=no noticeable effect; 2=some effect but not of seriousconsequence; 3=moderately important effect deserving of consideration; 4=a serious effect thatwill significantly impact the population). The values reported are the means of these scoresacross all species in the HCPs reviewed for each impact category. The right-hand column showsthe percentage of times these impacts were considered in HCPs (QE).
Category of impact, ranked Mean importance ofimpacts (sample sizes inparentheses)
% of species for whichimpact was considered inthe HCP (N=97)
1. Total acreage of habitat lost 3.13 (70) 85%2. Percent of habitat lost 2.69 (70) 53%3. Total individuals killed 2.54 (70) 52%4. Fragmentation of habitat 2.54 (76) 66%5. Cumulative impacts 2.45 (74) 27%6. Altered interspecific interactions 2.37 (71) 45%
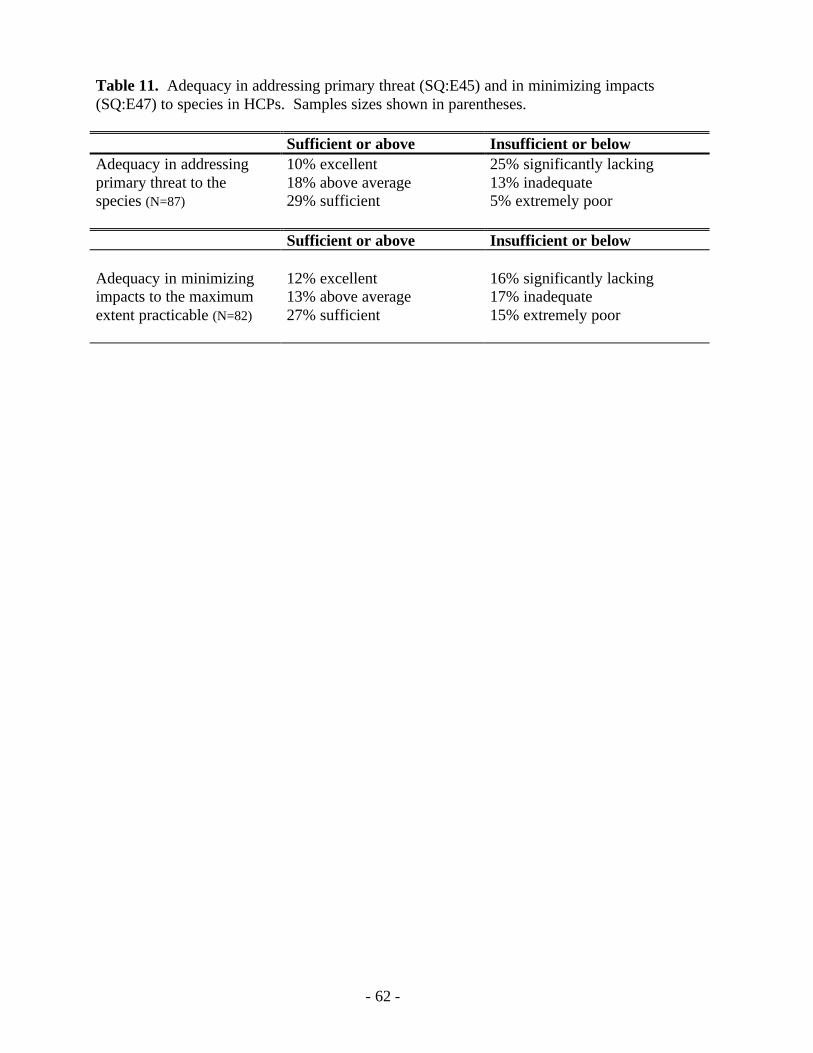
- 62 -
Table 11. Adequacy in addressing primary threat (SQ:E45) and in minimizing impacts(SQ:E47) to species in HCPs. Samples sizes shown in parentheses.
Sufficient or above Insufficient or belowAdequacy in addressing 10% excellent 25% significantly lackingprimary threat to the 18% above average 13% inadequatespecies (N=87) 29% sufficient 5% extremely poor
Sufficient or above Insufficient or below
Adequacy in minimizing 12% excellent 16% significantly lackingimpacts to the maximum 13% above average 17% inadequateextent practicable (N=82) 27% sufficient 15% extremely poor
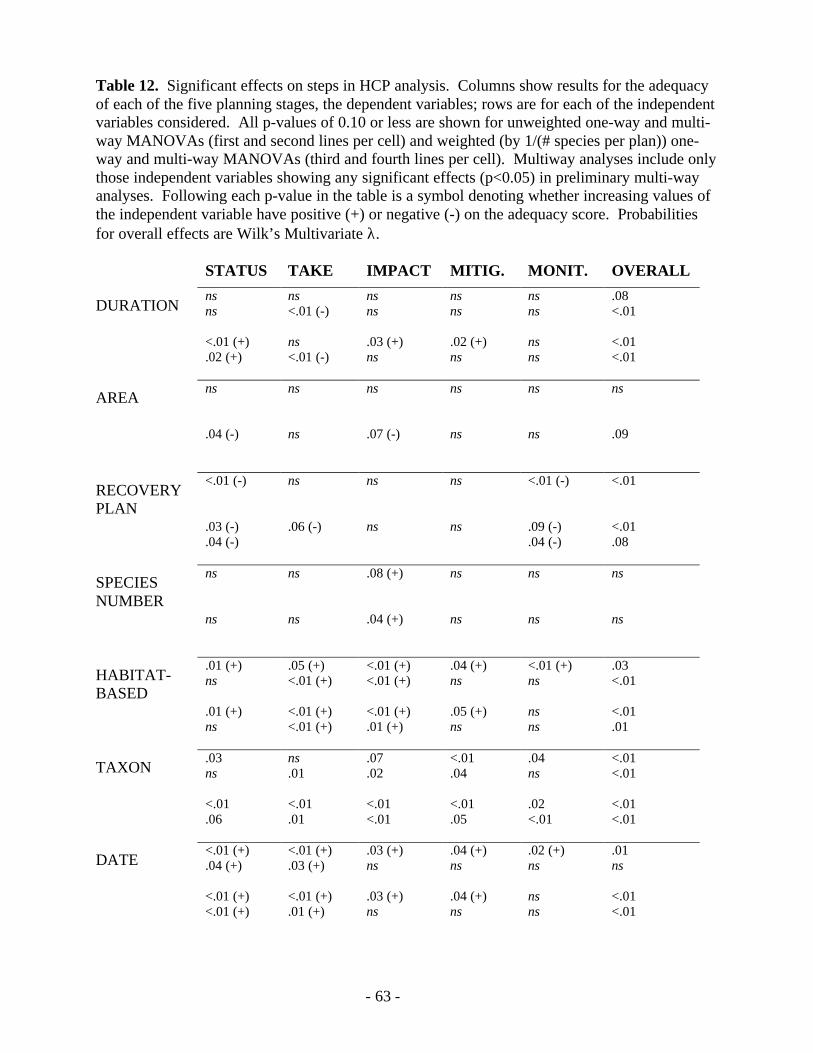
- 63 -
Table 12. Significant effects on steps in HCP analysis. Columns show results for the adequacyof each of the five planning stages, the dependent variables; rows are for each of the independentvariables considered. All p-values of 0.10 or less are shown for unweighted one-way and multi-way MANOVAs (first and second lines per cell) and weighted (by 1/(# species per plan)) one-way and multi-way MANOVAs (third and fourth lines per cell). Multiway analyses include onlythose independent variables showing any significant effects (p<0.05) in preliminary multi-wayanalyses. Following each p-value in the table is a symbol denoting whether increasing values ofthe independent variable have positive (+) or negative (-) on the adequacy score. Probabilitiesfor overall effects are Wilk’s Multivariate λ.
STATUS TAKE IMPACT MITIG. MONIT. OVERALL
DURATIONnsns
<.01 (+).02 (+)
ns<.01 (-)
ns<.01 (-)
nsns
.03 (+)ns
nsns
.02 (+)ns
nsns
nsns
.08<.01
<.01<.01
AREAns
.04 (-)
ns
ns
ns
.07 (-)
ns
ns
ns
ns
ns
.09
RECOVERYPLAN
<.01 (-)
.03 (-)
.04 (-)
ns
.06 (-)
ns
ns
ns
ns
<.01 (-)
.09 (-)
.04 (-)
<.01
<.01.08
SPECIESNUMBER
ns
ns
ns
ns
.08 (+)
.04 (+)
ns
ns
ns
ns
ns
ns
HABITAT-BASED
.01 (+)ns
.01 (+)ns
.05 (+)<.01 (+)
<.01 (+)<.01 (+)
<.01 (+)<.01 (+)
<.01 (+).01 (+)
.04 (+)ns
.05 (+)ns
<.01 (+)ns
nsns
.03<.01
<.01.01
TAXON.03ns
<.01.06
ns.01
<.01.01
.07
.02
<.01<.01
<.01.04
<.01.05
.04ns
.02<.01
<.01<.01
<.01<.01
DATE<.01 (+).04 (+)
<.01 (+)<.01 (+)
<.01 (+).03 (+)
<.01 (+).01 (+)
.03 (+)ns
.03 (+)ns
.04 (+)ns
.04 (+)ns
.02 (+)ns
nsns
.01ns
<.01<.01
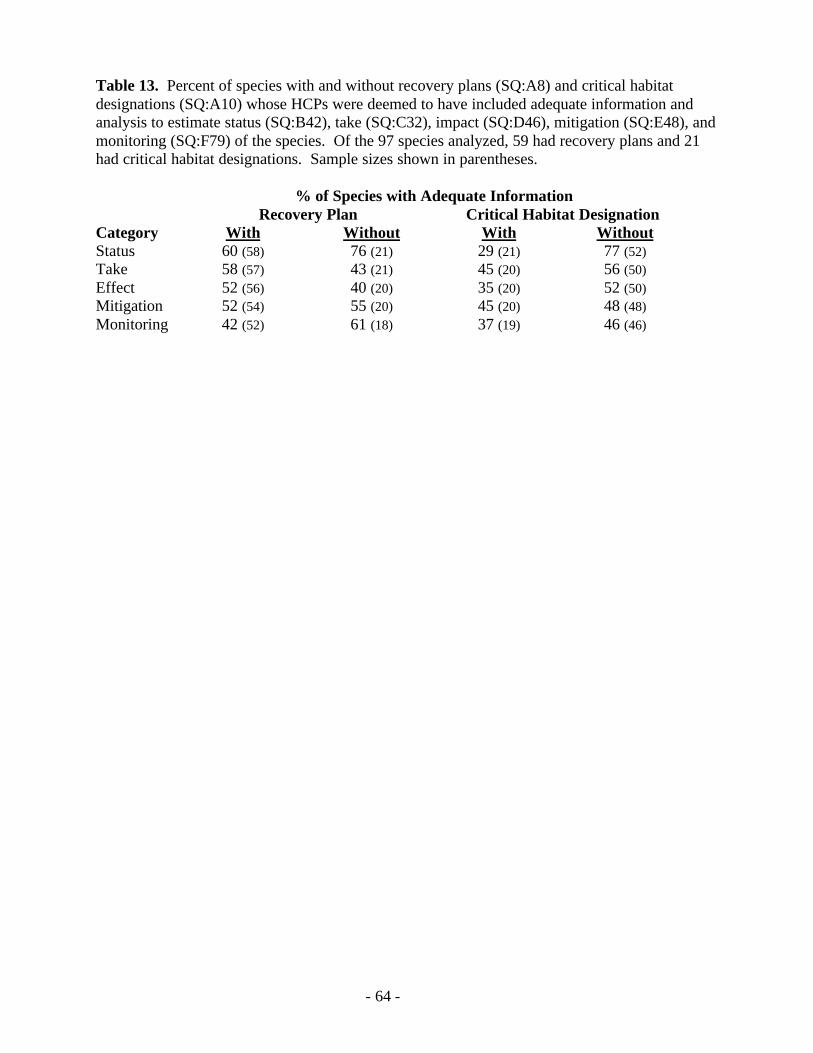
- 64 -
Table 13. Percent of species with and without recovery plans (SQ:A8) and critical habitatdesignations (SQ:A10) whose HCPs were deemed to have included adequate information andanalysis to estimate status (SQ:B42), take (SQ:C32), impact (SQ:D46), mitigation (SQ:E48), andmonitoring (SQ:F79) of the species. Of the 97 species analyzed, 59 had recovery plans and 21had critical habitat designations. Sample sizes shown in parentheses.
% of Species with Adequate InformationRecovery Plan Critical Habitat Designation
Category With Without With WithoutStatus 60 (58) 76 (21) 29 (21) 77 (52)Take 58 (57) 43 (21) 45 (20) 56 (50)Effect 52 (56) 40 (20) 35 (20) 52 (50)Mitigation 52 (54) 55 (20) 45 (20) 48 (48)Monitoring 42 (52) 61 (18) 37 (19) 46 (46)
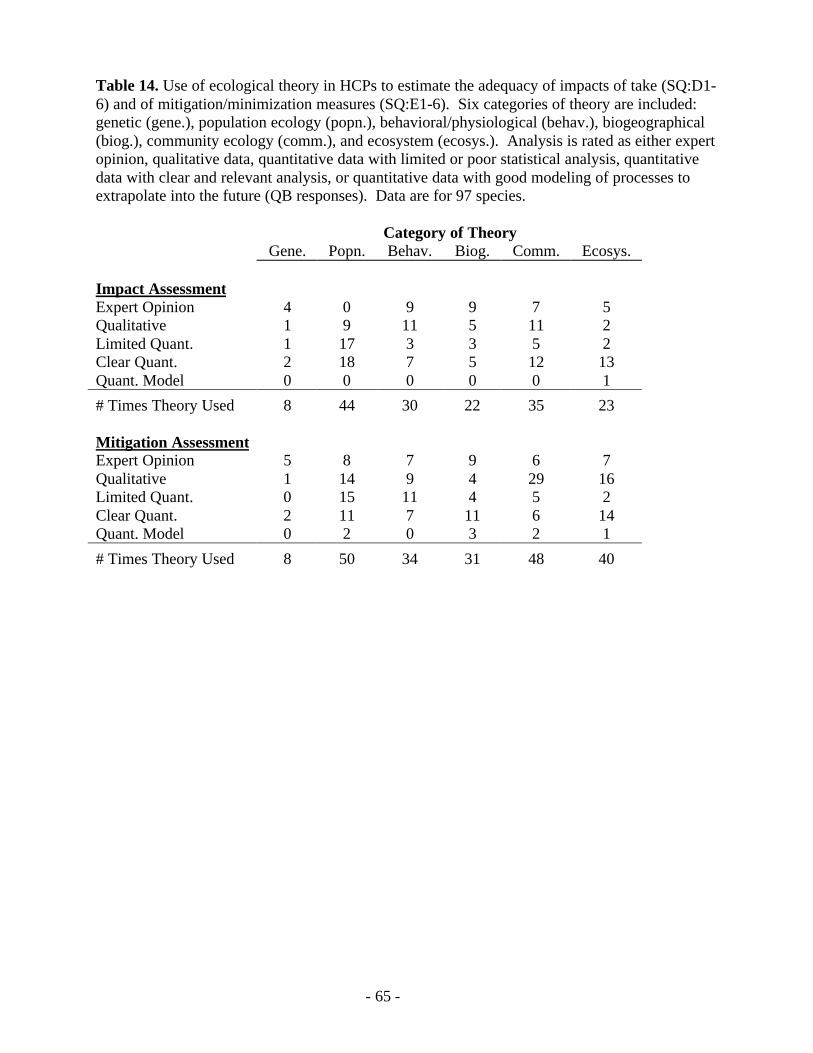
- 65 -
Table 14. Use of ecological theory in HCPs to estimate the adequacy of impacts of take (SQ:D1-6) and of mitigation/minimization measures (SQ:E1-6). Six categories of theory are included:genetic (gene.), population ecology (popn.), behavioral/physiological (behav.), biogeographical(biog.), community ecology (comm.), and ecosystem (ecosys.). Analysis is rated as either expertopinion, qualitative data, quantitative data with limited or poor statistical analysis, quantitativedata with clear and relevant analysis, or quantitative data with good modeling of processes toextrapolate into the future (QB responses). Data are for 97 species.
Category of TheoryGene. Popn. Behav. Biog. Comm. Ecosys.
Impact AssessmentExpert Opinion 4 0 9 9 7 5Qualitative 1 9 11 5 11 2Limited Quant. 1 17 3 3 5 2Clear Quant. 2 18 7 5 12 13Quant. Model 0 0 0 0 0 1
# Times Theory Used 8 44 30 22 35 23
Mitigation AssessmentExpert Opinion 5 8 7 9 6 7Qualitative 1 14 9 4 29 16Limited Quant. 0 15 11 4 5 2Clear Quant. 2 11 7 11 6 14Quant. Model 0 2 0 3 2 1
# Times Theory Used 8 50 34 31 48 40
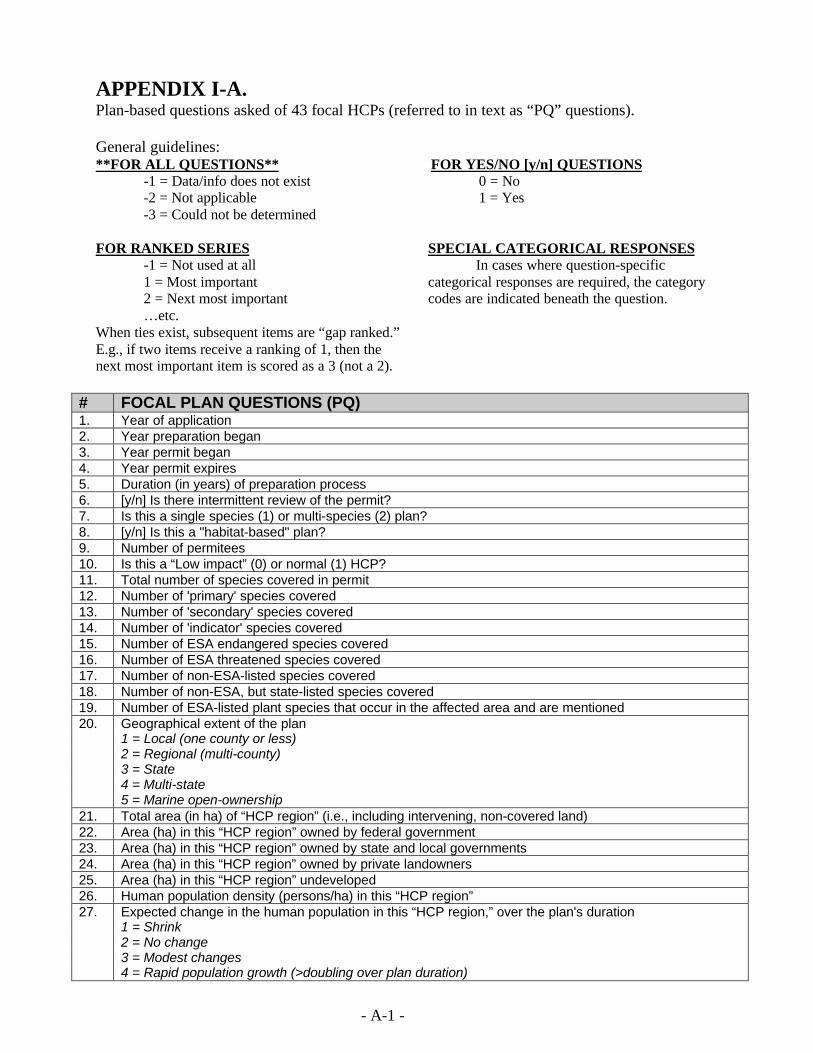
- A-1 -
APPENDIX I-A.Plan-based questions asked of 43 focal HCPs (referred to in text as “PQ” questions).
General guidelines:**FOR ALL QUESTIONS**
-1 = Data/info does not exist-2 = Not applicable-3 = Could not be determined
FOR YES/NO [y/n] QUESTIONS0 = No1 = Yes
FOR RANKED SERIES-1 = Not used at all1 = Most important2 = Next most important…etc.
When ties exist, subsequent items are “gap ranked.”E.g., if two items receive a ranking of 1, then thenext most important item is scored as a 3 (not a 2).
SPECIAL CATEGORICAL RESPONSESIn cases where question-specific
categorical responses are required, the categorycodes are indicated beneath the question.
# FOCAL PLAN QUESTIONS (PQ)1. Year of application2. Year preparation began3. Year permit began4. Year permit expires5. Duration (in years) of preparation process6. [y/n] Is there intermittent review of the permit?7. Is this a single species (1) or multi-species (2) plan?8. [y/n] Is this a "habitat-based" plan?9. Number of permitees10. Is this a “Low impact” (0) or normal (1) HCP?11. Total number of species covered in permit12. Number of 'primary' species covered13. Number of 'secondary' species covered14. Number of 'indicator' species covered15. Number of ESA endangered species covered16. Number of ESA threatened species covered17. Number of non-ESA-listed species covered18. Number of non-ESA, but state-listed species covered19. Number of ESA-listed plant species that occur in the affected area and are mentioned20. Geographical extent of the plan
1 = Local (one county or less)2 = Regional (multi-county)3 = State4 = Multi-state5 = Marine open-ownership
21. Total area (in ha) of “HCP region” (i.e., including intervening, non-covered land)22. Area (ha) in this “HCP region” owned by federal government23. Area (ha) in this “HCP region” owned by state and local governments24. Area (ha) in this “HCP region” owned by private landowners25. Area (ha) in this “HCP region” undeveloped26. Human population density (persons/ha) in this “HCP region”27. Expected change in the human population in this “HCP region,” over the plan's duration
1 = Shrink2 = No change3 = Modest changes4 = Rapid population growth (>doubling over plan duration)
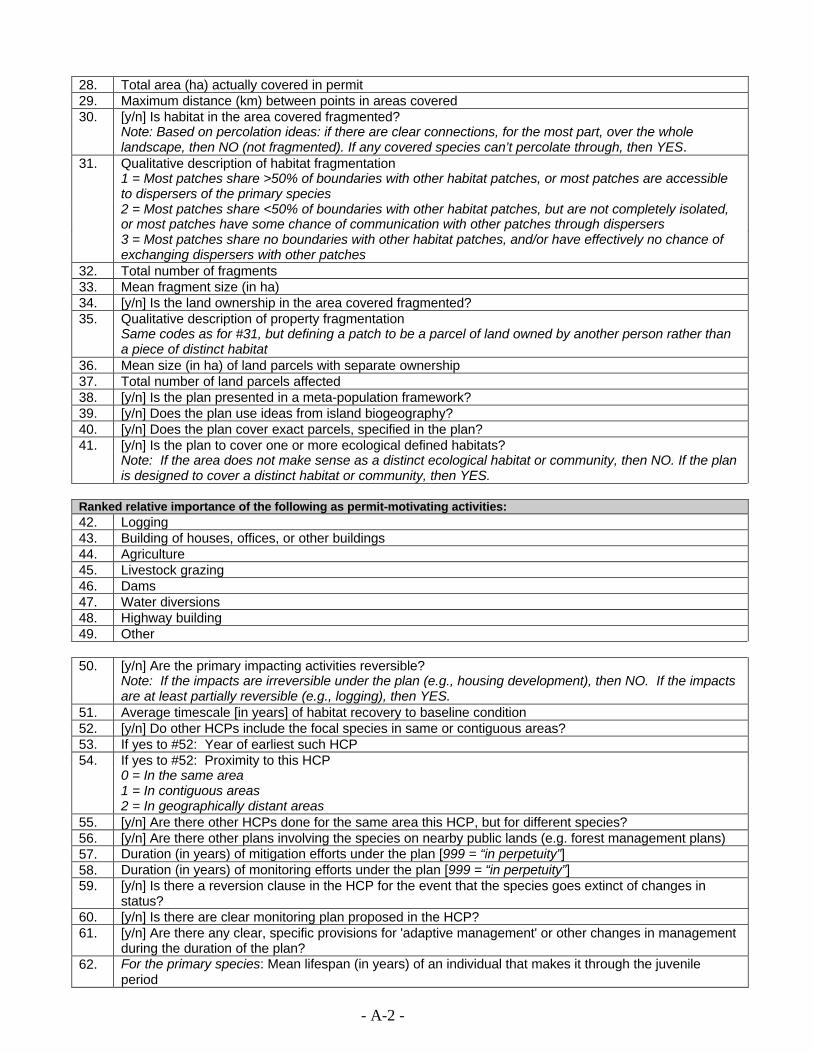
- A-2 -
28. Total area (ha) actually covered in permit29. Maximum distance (km) between points in areas covered30. [y/n] Is habitat in the area covered fragmented?
Note: Based on percolation ideas: if there are clear connections, for the most part, over the wholelandscape, then NO (not fragmented). If any covered species can’t percolate through, then YES.
31. Qualitative description of habitat fragmentation1 = Most patches share >50% of boundaries with other habitat patches, or most patches are accessibleto dispersers of the primary species2 = Most patches share <50% of boundaries with other habitat patches, but are not completely isolated,or most patches have some chance of communication with other patches through dispersers3 = Most patches share no boundaries with other habitat patches, and/or have effectively no chance ofexchanging dispersers with other patches
32. Total number of fragments33. Mean fragment size (in ha)34. [y/n] Is the land ownership in the area covered fragmented?35. Qualitative description of property fragmentation
Same codes as for #31, but defining a patch to be a parcel of land owned by another person rather thana piece of distinct habitat
36. Mean size (in ha) of land parcels with separate ownership37. Total number of land parcels affected38. [y/n] Is the plan presented in a meta-population framework?39. [y/n] Does the plan use ideas from island biogeography?40. [y/n] Does the plan cover exact parcels, specified in the plan?41. [y/n] Is the plan to cover one or more ecological defined habitats?
Note: If the area does not make sense as a distinct ecological habitat or community, then NO. If the planis designed to cover a distinct habitat or community, then YES.
Ranked relative importance of the following as permit-motivating activities:42. Logging43. Building of houses, offices, or other buildings44. Agriculture45. Livestock grazing46. Dams47. Water diversions48. Highway building49. Other
50. [y/n] Are the primary impacting activities reversible?Note: If the impacts are irreversible under the plan (e.g., housing development), then NO. If the impactsare at least partially reversible (e.g., logging), then YES.
51. Average timescale [in years] of habitat recovery to baseline condition52. [y/n] Do other HCPs include the focal species in same or contiguous areas?53. If yes to #52: Year of earliest such HCP54. If yes to #52: Proximity to this HCP
0 = In the same area1 = In contiguous areas2 = In geographically distant areas
55. [y/n] Are there other HCPs done for the same area this HCP, but for different species?56. [y/n] Are there other plans involving the species on nearby public lands (e.g. forest management plans)57. Duration (in years) of mitigation efforts under the plan [999 = “in perpetuity”]58. Duration (in years) of monitoring efforts under the plan [999 = “in perpetuity”]59. [y/n] Is there a reversion clause in the HCP for the event that the species goes extinct of changes in
status?60. [y/n] Is there are clear monitoring plan proposed in the HCP?61. [y/n] Are there any clear, specific provisions for 'adaptive management' or other changes in management
during the duration of the plan?62. For the primary species: Mean lifespan (in years) of an individual that makes it through the juvenile
period
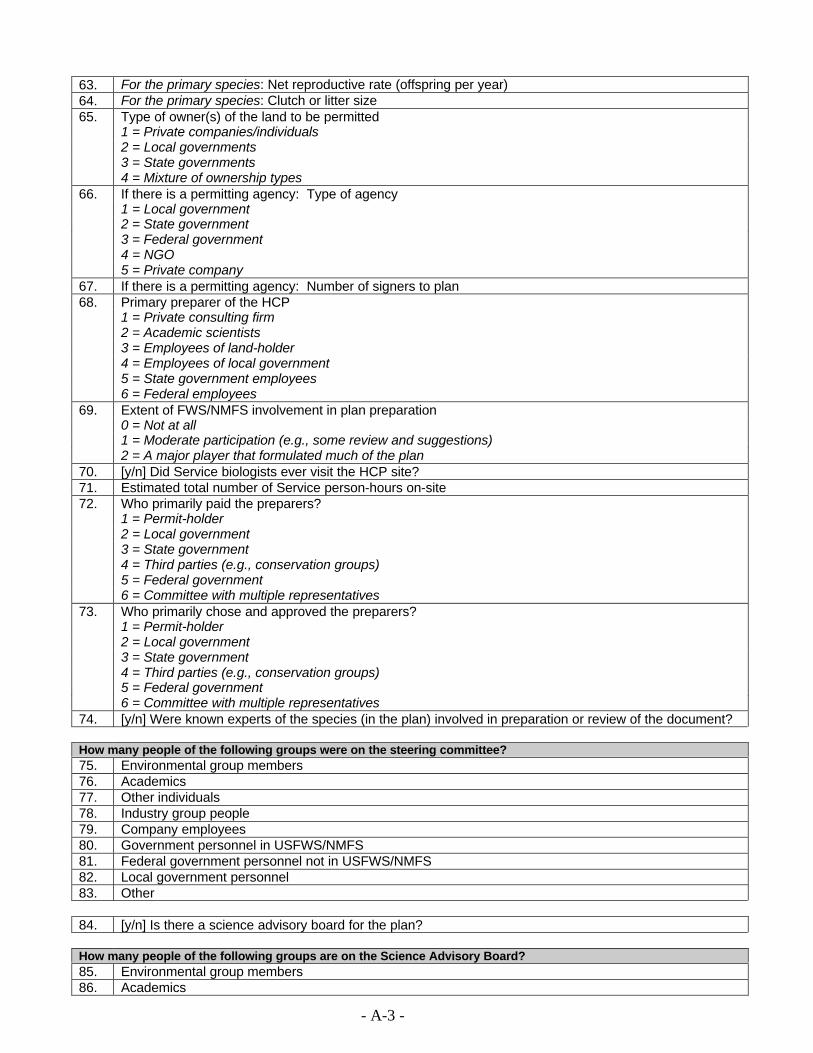
- A-3 -
63. For the primary species: Net reproductive rate (offspring per year)64. For the primary species: Clutch or litter size65. Type of owner(s) of the land to be permitted
1 = Private companies/individuals2 = Local governments3 = State governments4 = Mixture of ownership types
66. If there is a permitting agency: Type of agency1 = Local government2 = State government3 = Federal government4 = NGO5 = Private company
67. If there is a permitting agency: Number of signers to plan68. Primary preparer of the HCP
1 = Private consulting firm2 = Academic scientists3 = Employees of land-holder4 = Employees of local government5 = State government employees6 = Federal employees
69. Extent of FWS/NMFS involvement in plan preparation0 = Not at all1 = Moderate participation (e.g., some review and suggestions)2 = A major player that formulated much of the plan
70. [y/n] Did Service biologists ever visit the HCP site?71. Estimated total number of Service person-hours on-site72. Who primarily paid the preparers?
1 = Permit-holder2 = Local government3 = State government4 = Third parties (e.g., conservation groups)5 = Federal government6 = Committee with multiple representatives
73. Who primarily chose and approved the preparers?1 = Permit-holder2 = Local government3 = State government4 = Third parties (e.g., conservation groups)5 = Federal government6 = Committee with multiple representatives
74. [y/n] Were known experts of the species (in the plan) involved in preparation or review of the document?
How many people of the following groups were on the steering committee?75. Environmental group members76. Academics77. Other individuals78. Industry group people79. Company employees80. Government personnel in USFWS/NMFS81. Federal government personnel not in USFWS/NMFS82. Local government personnel83. Other
84. [y/n] Is there a science advisory board for the plan?
How many people of the following groups are on the Science Advisory Board?85. Environmental group members86. Academics
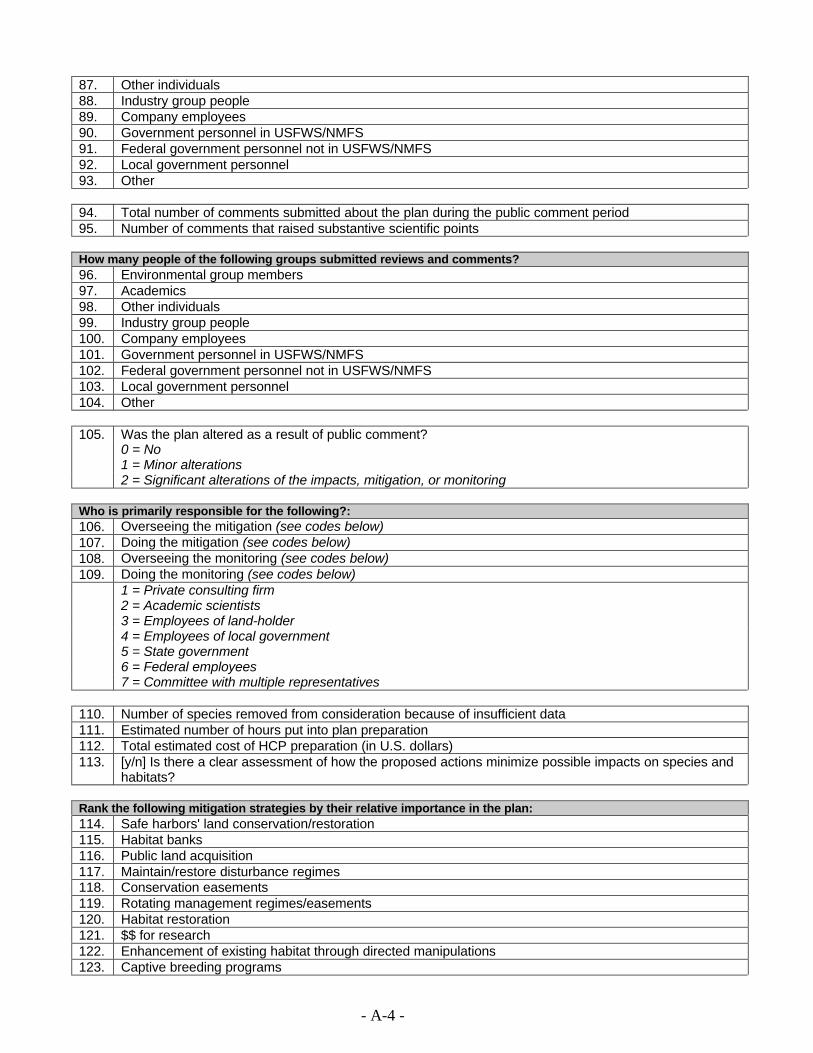
- A-4 -
87. Other individuals88. Industry group people89. Company employees90. Government personnel in USFWS/NMFS91. Federal government personnel not in USFWS/NMFS92. Local government personnel93. Other
94. Total number of comments submitted about the plan during the public comment period95. Number of comments that raised substantive scientific points
How many people of the following groups submitted reviews and comments?96. Environmental group members97. Academics98. Other individuals99. Industry group people100. Company employees101. Government personnel in USFWS/NMFS102. Federal government personnel not in USFWS/NMFS103. Local government personnel104. Other
105. Was the plan altered as a result of public comment?0 = No1 = Minor alterations2 = Significant alterations of the impacts, mitigation, or monitoring
Who is primarily responsible for the following?:106. Overseeing the mitigation (see codes below)107. Doing the mitigation (see codes below)108. Overseeing the monitoring (see codes below)109. Doing the monitoring (see codes below)
1 = Private consulting firm2 = Academic scientists3 = Employees of land-holder4 = Employees of local government5 = State government6 = Federal employees7 = Committee with multiple representatives
110. Number of species removed from consideration because of insufficient data111. Estimated number of hours put into plan preparation112. Total estimated cost of HCP preparation (in U.S. dollars)113. [y/n] Is there a clear assessment of how the proposed actions minimize possible impacts on species and
habitats?
Rank the following mitigation strategies by their relative importance in the plan:114. Safe harbors' land conservation/restoration115. Habitat banks116. Public land acquisition117. Maintain/restore disturbance regimes118. Conservation easements119. Rotating management regimes/easements120. Habitat restoration121. $$ for research122. Enhancement of existing habitat through directed manipulations123. Captive breeding programs
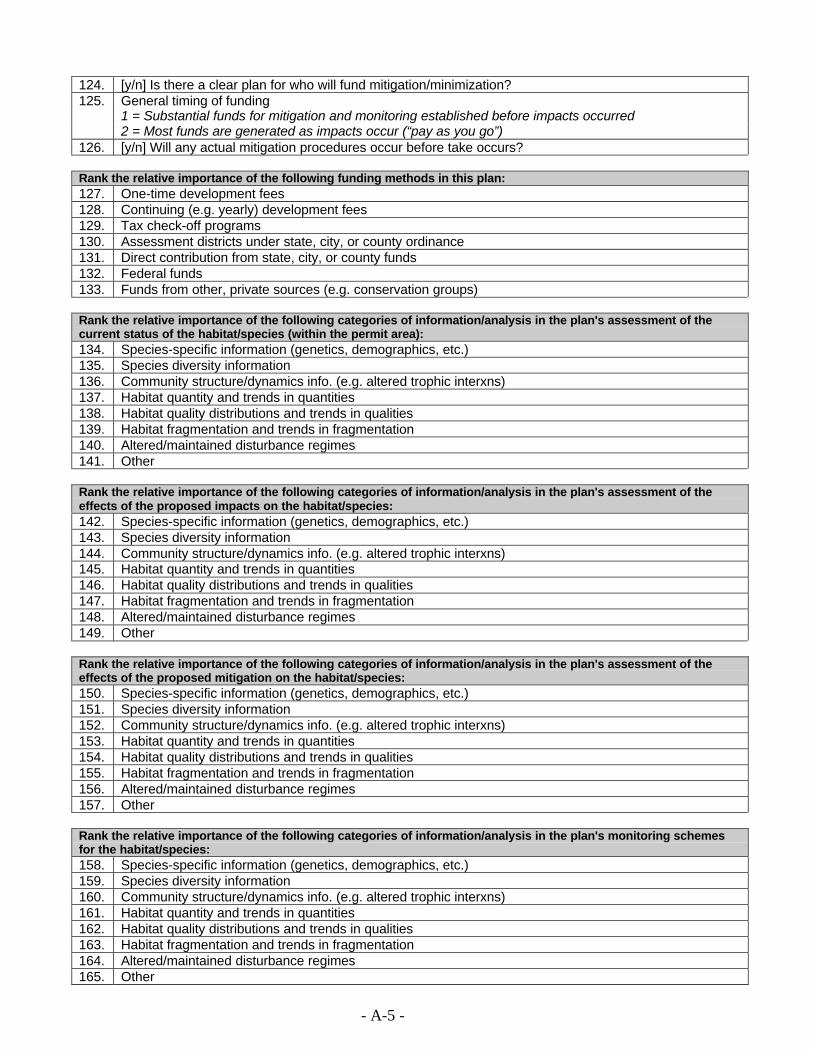
- A-5 -
124. [y/n] Is there a clear plan for who will fund mitigation/minimization?125. General timing of funding
1 = Substantial funds for mitigation and monitoring established before impacts occurred2 = Most funds are generated as impacts occur (“pay as you go”)
126. [y/n] Will any actual mitigation procedures occur before take occurs?
Rank the relative importance of the following funding methods in this plan:127. One-time development fees128. Continuing (e.g. yearly) development fees129. Tax check-off programs130. Assessment districts under state, city, or county ordinance131. Direct contribution from state, city, or county funds132. Federal funds133. Funds from other, private sources (e.g. conservation groups)
Rank the relative importance of the following categories of information/analysis in the plan's assessment of thecurrent status of the habitat/species (within the permit area):134. Species-specific information (genetics, demographics, etc.)135. Species diversity information136. Community structure/dynamics info. (e.g. altered trophic interxns)137. Habitat quantity and trends in quantities138. Habitat quality distributions and trends in qualities139. Habitat fragmentation and trends in fragmentation140. Altered/maintained disturbance regimes141. Other
Rank the relative importance of the following categories of information/analysis in the plan's assessment of theeffects of the proposed impacts on the habitat/species:142. Species-specific information (genetics, demographics, etc.)143. Species diversity information144. Community structure/dynamics info. (e.g. altered trophic interxns)145. Habitat quantity and trends in quantities146. Habitat quality distributions and trends in qualities147. Habitat fragmentation and trends in fragmentation148. Altered/maintained disturbance regimes149. Other
Rank the relative importance of the following categories of information/analysis in the plan's assessment of theeffects of the proposed mitigation on the habitat/species:150. Species-specific information (genetics, demographics, etc.)151. Species diversity information152. Community structure/dynamics info. (e.g. altered trophic interxns)153. Habitat quantity and trends in quantities154. Habitat quality distributions and trends in qualities155. Habitat fragmentation and trends in fragmentation156. Altered/maintained disturbance regimes157. Other
Rank the relative importance of the following categories of information/analysis in the plan's monitoring schemesfor the habitat/species:158. Species-specific information (genetics, demographics, etc.)159. Species diversity information160. Community structure/dynamics info. (e.g. altered trophic interxns)161. Habitat quantity and trends in quantities162. Habitat quality distributions and trends in qualities163. Habitat fragmentation and trends in fragmentation164. Altered/maintained disturbance regimes165. Other
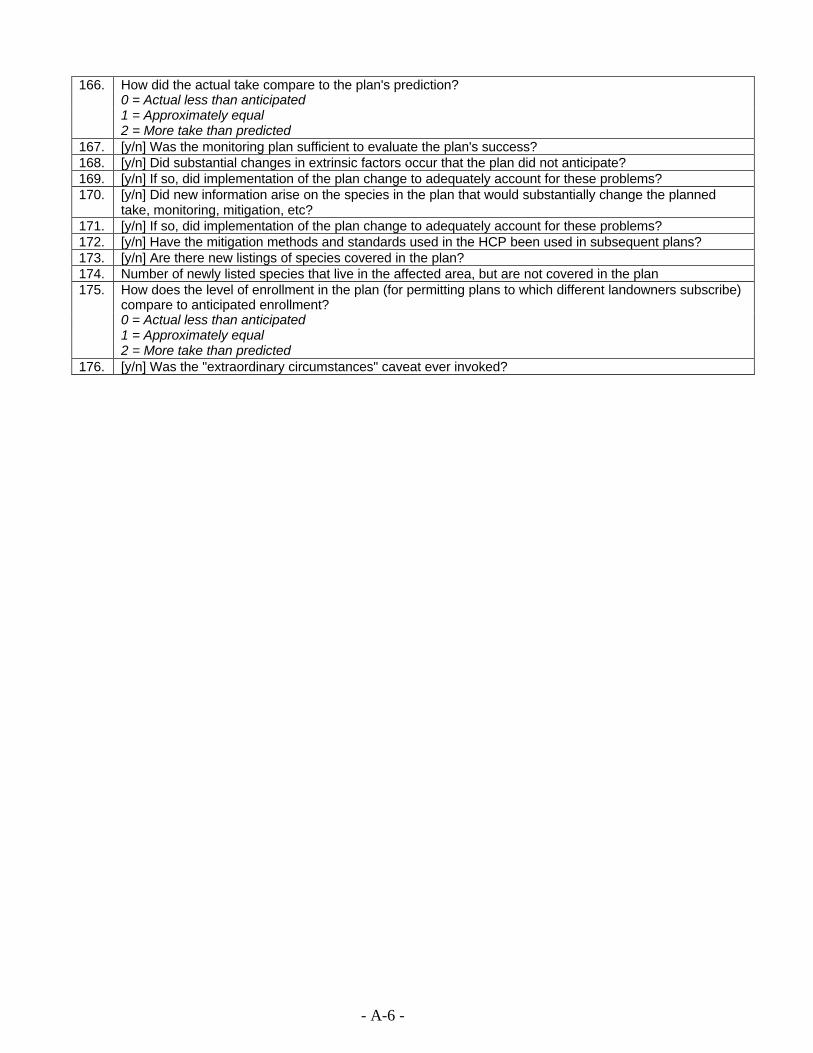
- A-6 -
166. How did the actual take compare to the plan's prediction?0 = Actual less than anticipated1 = Approximately equal2 = More take than predicted
167. [y/n] Was the monitoring plan sufficient to evaluate the plan's success?168. [y/n] Did substantial changes in extrinsic factors occur that the plan did not anticipate?169. [y/n] If so, did implementation of the plan change to adequately account for these problems?170. [y/n] Did new information arise on the species in the plan that would substantially change the planned
take, monitoring, mitigation, etc?171. [y/n] If so, did implementation of the plan change to adequately account for these problems?172. [y/n] Have the mitigation methods and standards used in the HCP been used in subsequent plans?173. [y/n] Are there new listings of species covered in the plan?174. Number of newly listed species that live in the affected area, but are not covered in the plan175. How does the level of enrollment in the plan (for permitting plans to which different landowners subscribe)
compare to anticipated enrollment?0 = Actual less than anticipated1 = Approximately equal2 = More take than predicted
176. [y/n] Was the "extraordinary circumstances" caveat ever invoked?
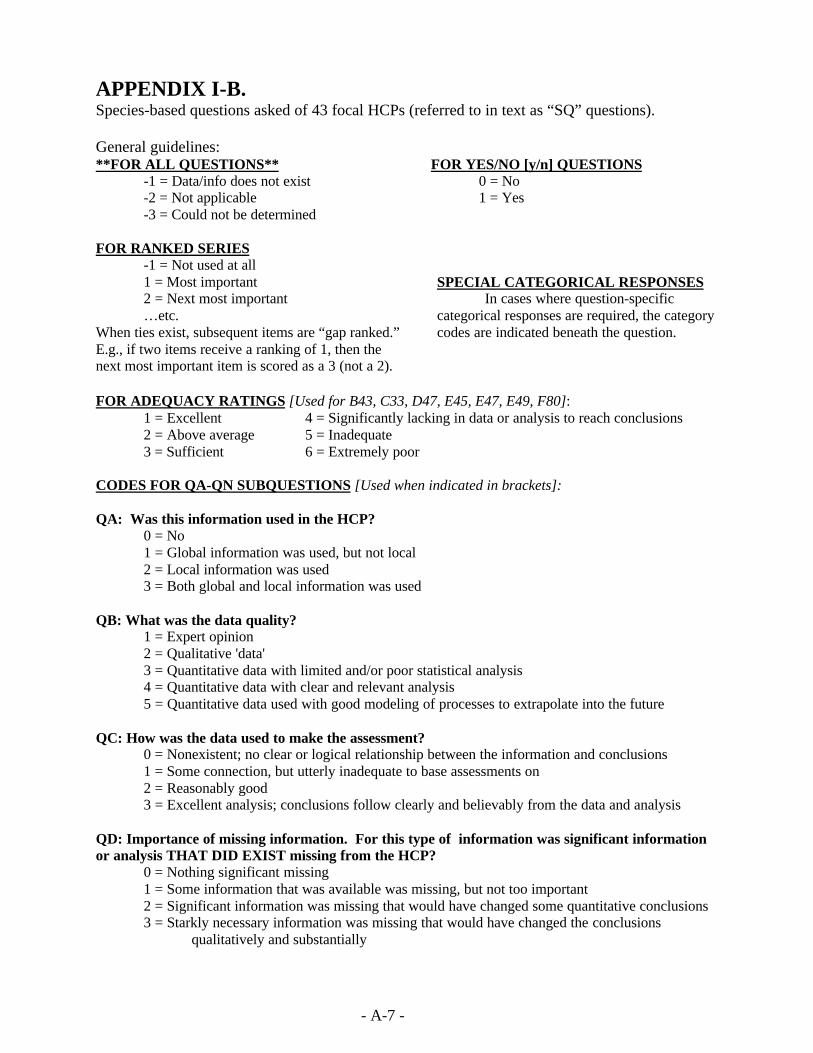
- A-7 -
APPENDIX I-B.Species-based questions asked of 43 focal HCPs (referred to in text as “SQ” questions).
General guidelines:**FOR ALL QUESTIONS**
-1 = Data/info does not exist-2 = Not applicable-3 = Could not be determined
FOR YES/NO [y/n] QUESTIONS0 = No1 = Yes
FOR RANKED SERIES-1 = Not used at all1 = Most important2 = Next most important…etc.
When ties exist, subsequent items are “gap ranked.”E.g., if two items receive a ranking of 1, then thenext most important item is scored as a 3 (not a 2).
SPECIAL CATEGORICAL RESPONSESIn cases where question-specific
categorical responses are required, the categorycodes are indicated beneath the question.
FOR ADEQUACY RATINGS [Used for B43, C33, D47, E45, E47, E49, F80]:1 = Excellent2 = Above average3 = Sufficient
4 = Significantly lacking in data or analysis to reach conclusions5 = Inadequate6 = Extremely poor
CODES FOR QA-QN SUBQUESTIONS [Used when indicated in brackets]:
QA: Was this information used in the HCP?0 = No1 = Global information was used, but not local2 = Local information was used3 = Both global and local information was used
QB: What was the data quality?1 = Expert opinion2 = Qualitative 'data'3 = Quantitative data with limited and/or poor statistical analysis4 = Quantitative data with clear and relevant analysis5 = Quantitative data used with good modeling of processes to extrapolate into the future
QC: How was the data used to make the assessment?0 = Nonexistent; no clear or logical relationship between the information and conclusions1 = Some connection, but utterly inadequate to base assessments on2 = Reasonably good3 = Excellent analysis; conclusions follow clearly and believably from the data and analysis
QD: Importance of missing information. For this type of information was significant informationor analysis THAT DID EXIST missing from the HCP?
0 = Nothing significant missing1 = Some information that was available was missing, but not too important2 = Significant information was missing that would have changed some quantitative conclusions3 = Starkly necessary information was missing that would have changed the conclusions
qualitatively and substantially
- A-8 -
QE: [y/n] Did the HCP consider this as effect?
QF: What did the HCP conclude about this effect?1 = Not a noticeable effect at all2 = Some effect, but not of any consequence3 = A moderately important effect that bears consideration4 = A serious effect that will significantly impact the population
QG: What is your assessment of this possible effect on the species/population from the plannedHCP activities?
1 = Not a noticeable effect at all2 = Some effect, but not of any consequence3 = A moderately important effect that bears consideration4 = A serious effect that will significantly impact the population
QH: [y/n] Was this measure considered in the HCP?
QI: How much reliance is there on this measure in the plan?0 = None1 = Very little2 = Some, but of secondary importance3 = The, or one of the, major mitigation measures used in the plan
QJ: For this particular mitigation measure, how good is the data to back up its use and reliability?0 = None1 = Very little, or quite unreliable2 = Moderately well-understood and reliable3 = Proven to work
QK: Is the mitigation to be done mostly on or off the HCP lands?1 = On2 = Off
QL: What is the quality of the he data to be collected?0 = Not collected1 = Expert opinion/assessments2 = Qualitative 'data'3 = Quantitative data with limited and/or poor statistical analysis proposed4 = Quantitative data with clear and relevant analysis5 = Quantitative data used with good modeling of processes to extrapolate into the future
QM: Is there a clear connection between the data to be collected and monitoring goal?0 = Nonexistent; no clear or logical relationship between the information and monitoring goals1 = Some connection, but utterly inadequate to base assessments on2 = Reasonably good3 = Excellent analysis; conclusions follow clearly and believably from the data and analysis
QN: For this species and the impacts, mitigation measures, etc. planned, how are there data of thistype that are crucial for an effective monitoring program?
0 = Nothing significant missing from planned monitoring1 = Some information is missing, but mostly the planned efforts are adequate2 = Some data that are quite important will not be monitored3 = Starkly necessary information will not be monitored
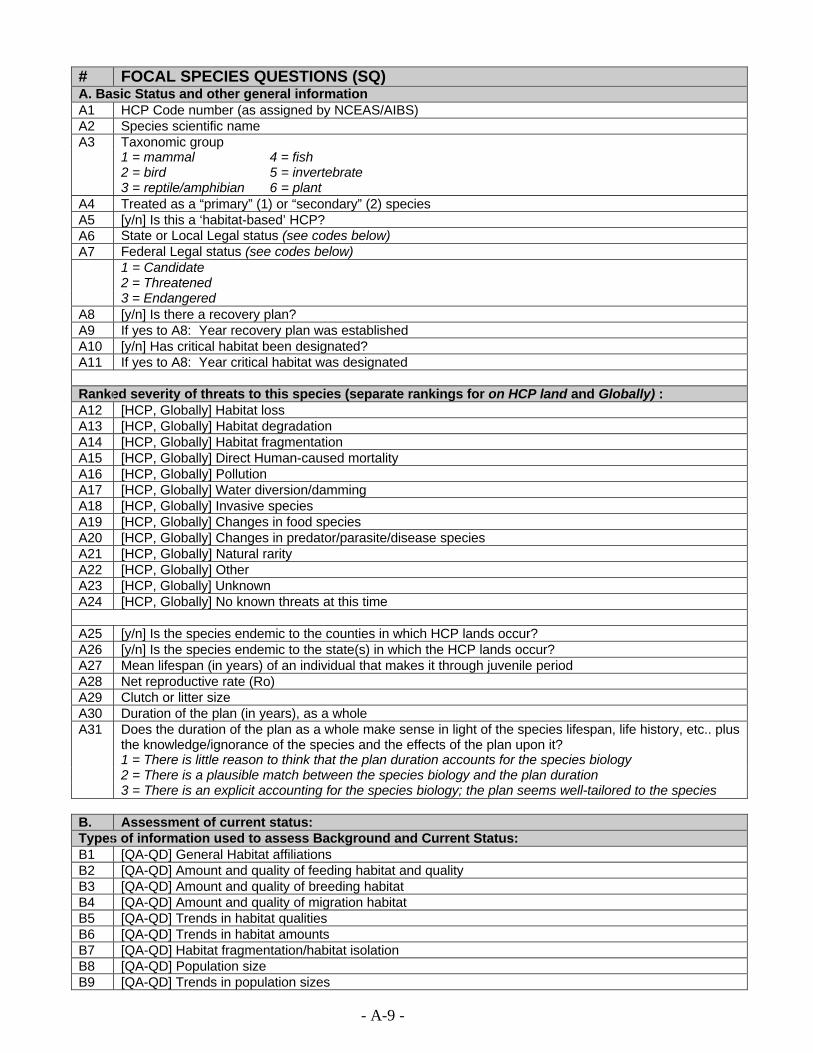
- A-9 -
# FOCAL SPECIES QUESTIONS (SQ)A. Basic Status and other general informationA1 HCP Code number (as assigned by NCEAS/AIBS)A2 Species scientific nameA3 Taxonomic group
1 = mammal2 = bird3 = reptile/amphibian
4 = fish5 = invertebrate6 = plant
A4 Treated as a “primary” (1) or “secondary” (2) speciesA5 [y/n] Is this a ‘habitat-based’ HCP?A6 State or Local Legal status (see codes below)A7 Federal Legal status (see codes below)
1 = Candidate2 = Threatened3 = Endangered
A8 [y/n] Is there a recovery plan?A9 If yes to A8: Year recovery plan was establishedA10 [y/n] Has critical habitat been designated?A11 If yes to A8: Year critical habitat was designated
Ranked severity of threats to this species (separate rankings for on HCP land and Globally) :A12 [HCP, Globally] Habitat lossA13 [HCP, Globally] Habitat degradationA14 [HCP, Globally] Habitat fragmentationA15 [HCP, Globally] Direct Human-caused mortalityA16 [HCP, Globally] PollutionA17 [HCP, Globally] Water diversion/dammingA18 [HCP, Globally] Invasive speciesA19 [HCP, Globally] Changes in food speciesA20 [HCP, Globally] Changes in predator/parasite/disease speciesA21 [HCP, Globally] Natural rarityA22 [HCP, Globally] OtherA23 [HCP, Globally] UnknownA24 [HCP, Globally] No known threats at this time
A25 [y/n] Is the species endemic to the counties in which HCP lands occur?A26 [y/n] Is the species endemic to the state(s) in which the HCP lands occur?A27 Mean lifespan (in years) of an individual that makes it through juvenile periodA28 Net reproductive rate (Ro)A29 Clutch or litter sizeA30 Duration of the plan (in years), as a wholeA31 Does the duration of the plan as a whole make sense in light of the species lifespan, life history, etc.. plus
the knowledge/ignorance of the species and the effects of the plan upon it?1 = There is little reason to think that the plan duration accounts for the species biology2 = There is a plausible match between the species biology and the plan duration3 = There is an explicit accounting for the species biology; the plan seems well-tailored to the species
B. Assessment of current status:Types of information used to assess Background and Current Status:B1 [QA-QD] General Habitat affiliationsB2 [QA-QD] Amount and quality of feeding habitat and qualityB3 [QA-QD] Amount and quality of breeding habitatB4 [QA-QD] Amount and quality of migration habitatB5 [QA-QD] Trends in habitat qualitiesB6 [QA-QD] Trends in habitat amountsB7 [QA-QD] Habitat fragmentation/habitat isolationB8 [QA-QD] Population sizeB9 [QA-QD] Trends in population sizes
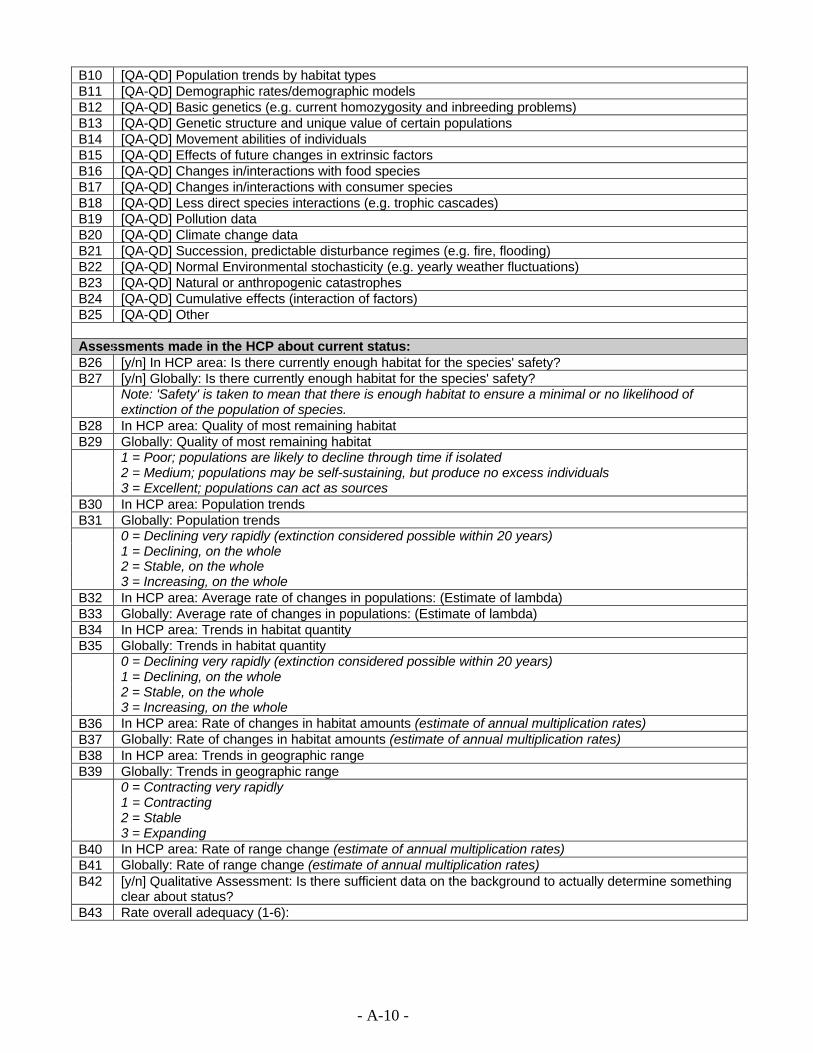
- A-10 -
B10 [QA-QD] Population trends by habitat typesB11 [QA-QD] Demographic rates/demographic modelsB12 [QA-QD] Basic genetics (e.g. current homozygosity and inbreeding problems)B13 [QA-QD] Genetic structure and unique value of certain populationsB14 [QA-QD] Movement abilities of individualsB15 [QA-QD] Effects of future changes in extrinsic factorsB16 [QA-QD] Changes in/interactions with food speciesB17 [QA-QD] Changes in/interactions with consumer speciesB18 [QA-QD] Less direct species interactions (e.g. trophic cascades)B19 [QA-QD] Pollution dataB20 [QA-QD] Climate change dataB21 [QA-QD] Succession, predictable disturbance regimes (e.g. fire, flooding)B22 [QA-QD] Normal Environmental stochasticity (e.g. yearly weather fluctuations)B23 [QA-QD] Natural or anthropogenic catastrophesB24 [QA-QD] Cumulative effects (interaction of factors)B25 [QA-QD] Other
Assessments made in the HCP about current status:B26 [y/n] In HCP area: Is there currently enough habitat for the species' safety?B27 [y/n] Globally: Is there currently enough habitat for the species' safety?
Note: 'Safety' is taken to mean that there is enough habitat to ensure a minimal or no likelihood ofextinction of the population of species.
B28 In HCP area: Quality of most remaining habitatB29 Globally: Quality of most remaining habitat
1 = Poor; populations are likely to decline through time if isolated2 = Medium; populations may be self-sustaining, but produce no excess individuals3 = Excellent; populations can act as sources
B30 In HCP area: Population trendsB31 Globally: Population trends
0 = Declining very rapidly (extinction considered possible within 20 years)1 = Declining, on the whole2 = Stable, on the whole3 = Increasing, on the whole
B32 In HCP area: Average rate of changes in populations: (Estimate of lambda)B33 Globally: Average rate of changes in populations: (Estimate of lambda)B34 In HCP area: Trends in habitat quantityB35 Globally: Trends in habitat quantity
0 = Declining very rapidly (extinction considered possible within 20 years)1 = Declining, on the whole2 = Stable, on the whole3 = Increasing, on the whole
B36 In HCP area: Rate of changes in habitat amounts (estimate of annual multiplication rates)B37 Globally: Rate of changes in habitat amounts (estimate of annual multiplication rates)B38 In HCP area: Trends in geographic rangeB39 Globally: Trends in geographic range
0 = Contracting very rapidly1 = Contracting2 = Stable3 = Expanding
B40 In HCP area: Rate of range change (estimate of annual multiplication rates)B41 Globally: Rate of range change (estimate of annual multiplication rates)B42 [y/n] Qualitative Assessment: Is there sufficient data on the background to actually determine something
clear about status?B43 Rate overall adequacy (1-6):
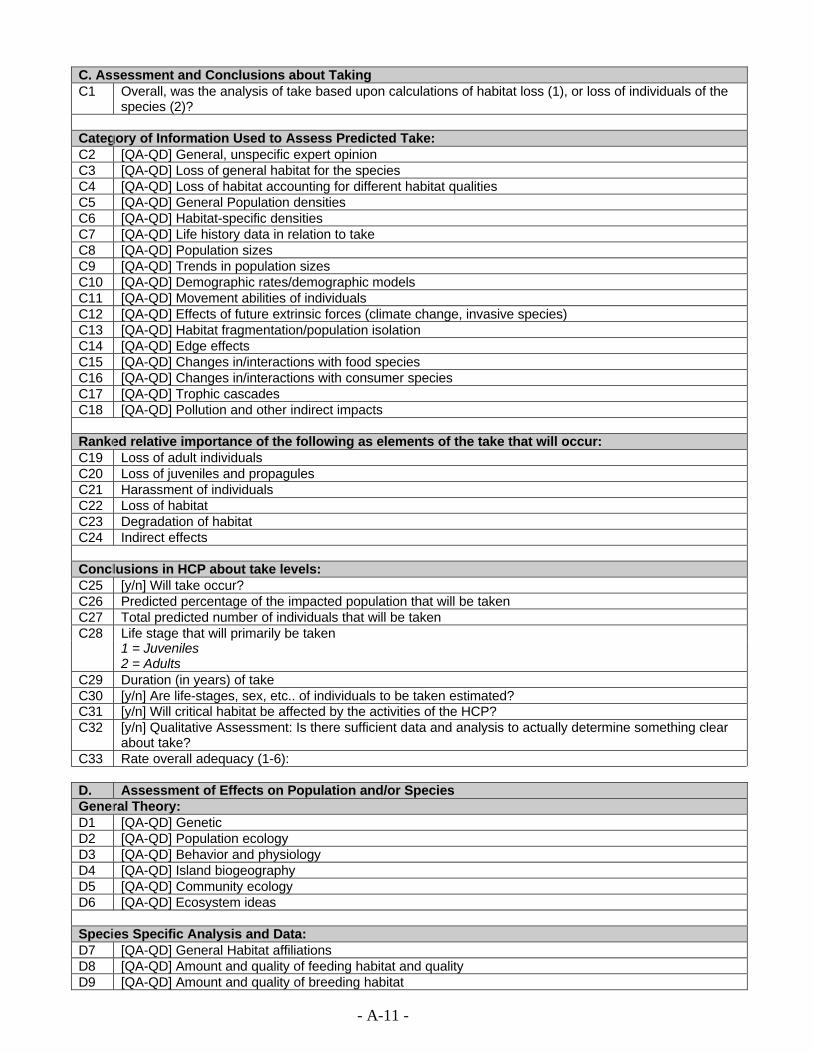
- A-11 -
C. Assessment and Conclusions about TakingC1 Overall, was the analysis of take based upon calculations of habitat loss (1), or loss of individuals of the
species (2)?
Category of Information Used to Assess Predicted Take:C2 [QA-QD] General, unspecific expert opinionC3 [QA-QD] Loss of general habitat for the speciesC4 [QA-QD] Loss of habitat accounting for different habitat qualitiesC5 [QA-QD] General Population densitiesC6 [QA-QD] Habitat-specific densitiesC7 [QA-QD] Life history data in relation to takeC8 [QA-QD] Population sizesC9 [QA-QD] Trends in population sizesC10 [QA-QD] Demographic rates/demographic modelsC11 [QA-QD] Movement abilities of individualsC12 [QA-QD] Effects of future extrinsic forces (climate change, invasive species)C13 [QA-QD] Habitat fragmentation/population isolationC14 [QA-QD] Edge effectsC15 [QA-QD] Changes in/interactions with food speciesC16 [QA-QD] Changes in/interactions with consumer speciesC17 [QA-QD] Trophic cascadesC18 [QA-QD] Pollution and other indirect impacts
Ranked relative importance of the following as elements of the take that will occur:C19 Loss of adult individualsC20 Loss of juveniles and propagulesC21 Harassment of individualsC22 Loss of habitatC23 Degradation of habitatC24 Indirect effects
Conclusions in HCP about take levels:C25 [y/n] Will take occur?C26 Predicted percentage of the impacted population that will be takenC27 Total predicted number of individuals that will be takenC28 Life stage that will primarily be taken
1 = Juveniles2 = Adults
C29 Duration (in years) of takeC30 [y/n] Are life-stages, sex, etc.. of individuals to be taken estimated?C31 [y/n] Will critical habitat be affected by the activities of the HCP?C32 [y/n] Qualitative Assessment: Is there sufficient data and analysis to actually determine something clear
about take?C33 Rate overall adequacy (1-6):
D. Assessment of Effects on Population and/or SpeciesGeneral Theory:D1 [QA-QD] GeneticD2 [QA-QD] Population ecologyD3 [QA-QD] Behavior and physiologyD4 [QA-QD] Island biogeographyD5 [QA-QD] Community ecologyD6 [QA-QD] Ecosystem ideas
Species Specific Analysis and Data:D7 [QA-QD] General Habitat affiliationsD8 [QA-QD] Amount and quality of feeding habitat and qualityD9 [QA-QD] Amount and quality of breeding habitat
- A-12 -
D10 [QA-QD] Amount and quality of migration habitatD11 [QA-QD] Trends in habitat qualitiesD12 [QA-QD] Trends in habitat amountsD13 [QA-QD] Habitat fragmentation/habitat isolationD14 [QA-QD] Population sizeD15 [QA-QD] Trends in population sizesD16 [QA-QD] Population trends by habitat typesD17 [QA-QD] Demographic rates/demographic modelsD18 [QA-QD] Basic genetics (e.g. current homozygosity and inbreeding problems)D19 [QA-QD] Genetic structure and unique value of certain populationsD20 [QA-QD] Movement abilities of individualsD21 [QA-QD] Effects of future changes in extrinsic factorsD22 [QA-QD] Changes in/interactions with food speciesD23 [QA-QD] Changes in/interactions with consumer speciesD24 [QA-QD] Less direct species interactions (e.g. trophic cascades)D25 [QA-QD] Pollution dataD26 [QA-QD] Climate change dataD27 [QA-QD] Succession, predictable disturbance regimes (e.g. fire, flooding)D28 [QA-QD] Normal Environmental Stochasticity (e.g. yearly weather fluctuations)D29 [QA-QD] Natural or anthropogenic catastrophesD30 [QA-QD] Cumulative effects (interaction of factors)D31 [QA-QD] Other
Types of Effects Considered Important in HCP:D32 [QE-QG] Total Acreage of habitat lostD33 [QE-QG] Total Individuals killedD34 [QE-QG] % habitat degradationD35 [QE-QG] % habitat lostD36 [QE-QG] % Individuals killedD37 [QE-QG] Fragmentation of habitatD38 [QE-QG] Reduced movement ratesD39 [QE-QG] Edge effectsD40 [QE-QG] Altered intra-specific interactionsD41 [QE-QG] Altered inter-specific interactions (e.g. disease & exotics)D42 [QE-QG] Genetic consequencesD43 [QE-QG] Non-point source pollutionD44 [QE-QG] Interactions of factors (i.e., cumulative impacts)D45 [QE-QG] OtherD46 [y/n] Qualitative Assessment: Is there sufficient data and analysis to actually determine something clear
about the impacts of the taking?D47 Rate overall adequacy (1-6):
E. Assessment of Mitigation/Minimization MeasuresCategory of Information Used to Assess General Theory:E1 [QA-QD] GeneticE2 [QA-QD] Population ecologyE3 [QA-QD] Behavior and physiologyE4 [QA-QD] Island biogeographyE5 [QA-QD] Community ecologyE6 [QA-QD] Ecosystem ideas
Species Specific Analysis and Data:E7 [QA-QD] General Habitat affiliations?E8 [QA-QD] Amount and quality of feeding habitat and qualityE9 [QA-QD] Amount and quality of breeding habitatE10 [QA-QD] Amount and quality of migration habitatE11 [QA-QD] Trends in habitat qualitiesE12 [QA-QD] Trends in habitat amounts.
- A-13 -
E13 [QA-QD] Habitat fragmentation/habitat isolationE14 [QA-QD] Population sizeE15 [QA-QD] Trends in population sizes.E16 [QA-QD] Population trends by habitat typesE17 [QA-QD] Demographic rates/demographic modelsE18 [QA-QD] Basic genetics (e.g. current homozygosity and inbreeding problems)E19 [QA-QD] Genetic structure and unique value of certain populationsE20 [QA-QD] Movement abilities of individualsE21 [QA-QD] Effects of future changes in extrinsic factorsE22 [QA-QD] Changes in/interactions with food speciesE23 [QA-QD] Changes in/interactions with consumer speciesE24 [QA-QD] Less direct species interactions (e.g. trophic cascades)E25 [QA-QD] Pollution dataE26 [QA-QD] Climate change dataE27 [QA-QD] Succession, predictable disturbance regimes (e.g. fire, flooding)E28 [QA-QD] Normal environmental stochasticity (e.g. yearly weather fluctuations)E29 [QA-QD] Natural or anthropogenic catastrophesE30 [QA-QD] Cumulative effectsE31 [QA-QD] Other
Types of mitigation/minimization measures considered and proposed:E32 [QH-QK] Avoidance of impacts, while still doing the proposed activityE33 [QH-QK] Minimization of impacts, while still doing the proposed activityE34 [QH-QK] Land acquisitionsE35 [QH-QK] Conservation easementsE36 [QH-QK] Habitat banks (exchange rates)E37 [QH-QK] TranslocationsE38 [QH-QK] Restoration of total habitat areasE39 [QH-QK] Maintain/restore disturbance regimesE40 [QH-QK] Remove exoticsE41 [QH-QK] Money for researchE42 [QH-QK] Other
Types of mitigation/minimization measures considered and proposed:E43 [y/n] Is mitigation part of a larger strategy?E44 [y/n] Does the mitigation plan address the primary threats to the species continued existence?E45 Rate overall adequacy in addressing primary threats (1-6)E46 [y/n] Does the plan demonstrate that the impact on the species was minimized to the maximum extent
possible, providing economic data to support this?E47 Rate overall adequacy in demonstrating impact minimization (1-6)E48 [y/n] Qualitative Assessment: Sufficient data? Determine likely success of the mitigation planned? Use of
this mitigation approach justified? Succeed with likelihood? Are the mitigation ratios supported by data?E49 Rate overall adequacy (1-6)
F. Assessment and Planning of Monitoring ProgramMonitoring of take levels:F1 Who is monitoring take?
1 = Private consulting firms2 = Academic scientists3 = Employees of land-holder4 = Employees of local government5 = State government employees6 = Federal employees7 = Committee/consortium with multiple representatives8 = NGO
F2 [y/n] Is there clear evidence that the monitoring personnel/groups will be chosen to be competent to carryout the task well?
F3 Duration (in years) of the planned monitoring [999 = “in perpetuity”]
- A-14 -
F4 Frequency (in rounds per year) of monitoring activitiesF5 [y/n] Are data to be collected sufficient to determine take levels?F6 [y/n] Is there an unambiguous plan to change the HCP strategy in response to new monitoring
information?
What data will be collected and analyzed to monitor take?F7 [QL-QN] Physiological dataF8 [QL-QN] Behavioral dataF9 [QL-QN] Presence/absence dataF10 [QL-QN] Population densitiesF11 [QL-QN] Population sizeF12 [QL-QN] Population trendsF13 [QL-QN] Survival ratesF14 [QL-QN] Reproductive ratesF15 [QL-QN] Growth ratesF16 [QL-QN] Genetic dataF17 [QL-QN] Movement ratesF18 [QL-QN] Metapopulation dynamics/source-sink, etc.F19 [QL-QN] Invasive species dataF20 [QL-QN] Effects of climate change dataF21 [QL-QN] Data on food or consumer speciesF22 [QL-QN] Inter-specific interactions (e.g. disease) affecting speciesF23 [QL-QN] Amount and trends in Habitat quantityF24 [QL-QN] Amount and trends in Habitat qualityF25 [QL-QN] Pollution and other physical factorsF26 [QL-QN] Data on life history stage duration, numbers, etc.
Monitoring for general population health: assessment of no net harm?F27 Who is monitoring the population?
1 = Private consulting firms2 = Academic scientists3 = Employees of land-holder4 = Employees of local government5 = State government employees6 = Federal employees7 = Committee/consortium with multiple representatives8 = NGO
F28 [y/n] Is there clear evidence that the monitoring personnel/groups will be chosen to be competent to carryout the task well?
F29 Duration (in years) of the planned monitoring [999 = “in perpetuity”]F30 Frequency (in rounds per year) of monitoring activitiesF31 [y/n] Are data to be collected sufficient to determine population status?F32 [y/n] Is there an unambiguous plan to change the HCP strategy in response to new monitoring
information?
What data will be collected and analyzed to monitor population status?F33 [QL-QN] Physiological dataF34 [QL-QN] Behavioral dataF35 [QL-QN] Presence/absence dataF36 [QL-QN] Population densitiesF37 [QL-QN] Population sizeF38 [QL-QN] Population trendsF39 [QL-QN] Survival ratesF40 [QL-QN] Reproductive ratesF41 [QL-QN] Growth ratesF42 [QL-QN] Genetic dataF43 [QL-QN] Movement ratesF44 [QL-QN] Metapopulation dynamics/source-sink, etc.
- A-15 -
F45 [QL-QN] Invasive species dataF46 [QL-QN] Effects of climate change dataF47 [QL-QN] Data on food or consumer speciesF48 [QL-QN] Inter-specific interactions (e.g. disease) affecting speciesF49 [QL-QN] Amount and trends in Habitat quantityF50 [QL-QN] Amount and trends in Habitat qualityF51 [QL-QN] Pollution and other physical factorsF52 [QL-QN] Data on life history stage duration, numbers, etc.
Monitoring of mitigation successF53 Who is monitoring the mitigation?
1 = Private consulting firms2 = Academic scientists3 = Employees of land-holder4 = Employees of local government5 = State government employees6 = Federal employees7 = Committee/consortium with multiple representatives8 = NGO
F54 [y/n] Is there clear evidence that the monitoring personnel/groups will be chosen to be competent to carryout the task well?
F55 Duration (in years) of the planned monitoring [999 = “in perpetuity”]F56 Frequency (in rounds per year) of monitoring activitiesF57 [y/n] Are data to be collected sufficient to determine mitigation success ecologically?F58 [y/n] Is there an unambiguous plan to change the HCP strategy in response to new monitoring
information?
What data will be collected and analyzed to monitor mitigation success?F59 [QL-QN] Physiological dataF60 [QL-QN] Behavioral dataF61 [QL-QN] Presence/absence dataF62 [QL-QN] Population densitiesF63 [QL-QN] Population sizeF64 [QL-QN] Population trendsF65 [QL-QN] Survival ratesF66 [QL-QN] Reproductive ratesF67 [QL-QN] Growth ratesF68 [QL-QN] Genetic dataF69 [QL-QN] Movement ratesF70 [QL-QN] Metapopulation dynamics/source-sink, etc.F71 [QL-QN] Invasive species dataF72 [QL-QN] Effects of climate change dataF73 [QL-QN] Data on food or consumer speciesF74 [QL-QN] Inter-specific interactions (e.g. disease) affecting speciesF75 [QL-QN] Amount and trends in Habitat quantityF76 [QL-QN] Amount and trends in Habitat qualityF77 [QL-QN] Pollution and other physical factorsF78 [QL-QN] Data on life history stage duration, numbers, etc..
F79 [y/n] Qualitative Assessment: are there sufficient data and analyses proposed to actually determinesomething clear about the usefulness and the actual use of the monitoring planned?
F80 Rate overall adequacy (1-6):
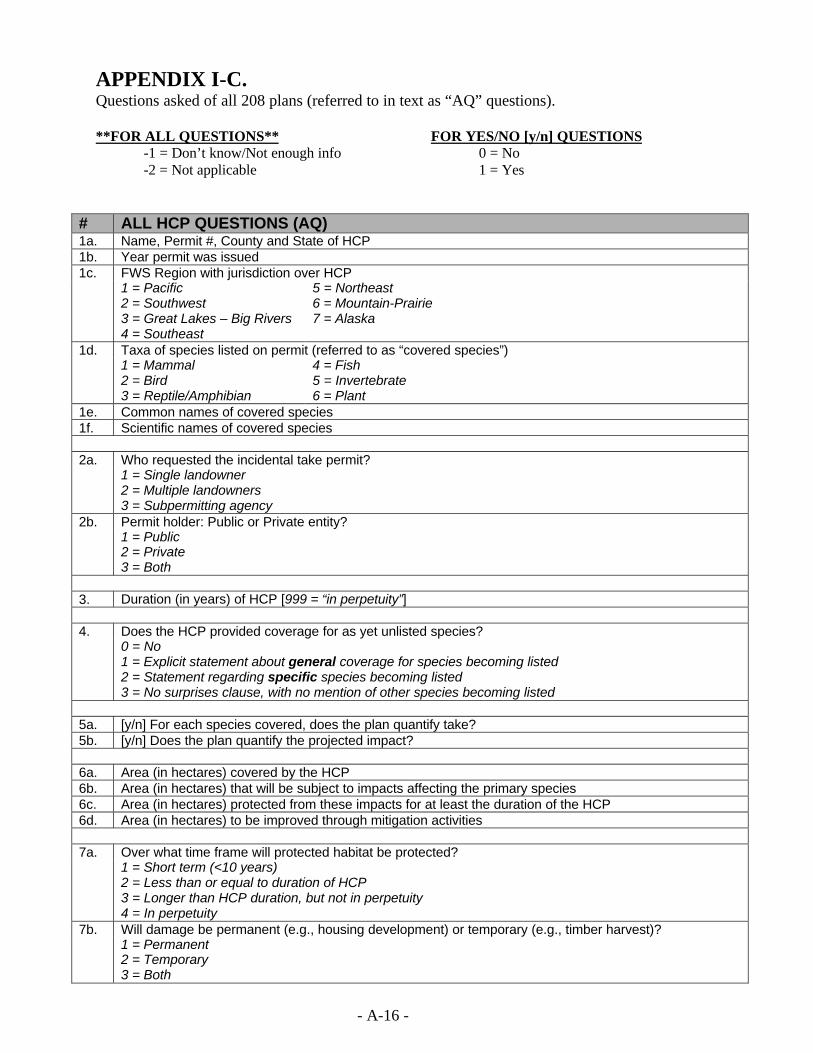
- A-16 -
APPENDIX I-C.Questions asked of all 208 plans (referred to in text as “AQ” questions).
**FOR ALL QUESTIONS**-1 = Don’t know/Not enough info-2 = Not applicable
FOR YES/NO [y/n] QUESTIONS0 = No1 = Yes
# ALL HCP QUESTIONS (AQ)1a. Name, Permit #, County and State of HCP1b. Year permit was issued1c. FWS Region with jurisdiction over HCP
1 = Pacific2 = Southwest3 = Great Lakes – Big Rivers4 = Southeast
5 = Northeast6 = Mountain-Prairie7 = Alaska
1d. Taxa of species listed on permit (referred to as “covered species”)1 = Mammal2 = Bird3 = Reptile/Amphibian
4 = Fish5 = Invertebrate6 = Plant
1e. Common names of covered species1f. Scientific names of covered species
2a. Who requested the incidental take permit?1 = Single landowner2 = Multiple landowners3 = Subpermitting agency
2b. Permit holder: Public or Private entity?1 = Public2 = Private3 = Both
3. Duration (in years) of HCP [999 = “in perpetuity”]
4. Does the HCP provided coverage for as yet unlisted species?0 = No1 = Explicit statement about general coverage for species becoming listed2 = Statement regarding specific species becoming listed3 = No surprises clause, with no mention of other species becoming listed
5a. [y/n] For each species covered, does the plan quantify take?5b. [y/n] Does the plan quantify the projected impact?
6a. Area (in hectares) covered by the HCP6b. Area (in hectares) that will be subject to impacts affecting the primary species6c. Area (in hectares) protected from these impacts for at least the duration of the HCP6d. Area (in hectares) to be improved through mitigation activities
7a. Over what time frame will protected habitat be protected?1 = Short term (<10 years)2 = Less than or equal to duration of HCP3 = Longer than HCP duration, but not in perpetuity4 = In perpetuity
7b. Will damage be permanent (e.g., housing development) or temporary (e.g., timber harvest)?1 = Permanent2 = Temporary3 = Both
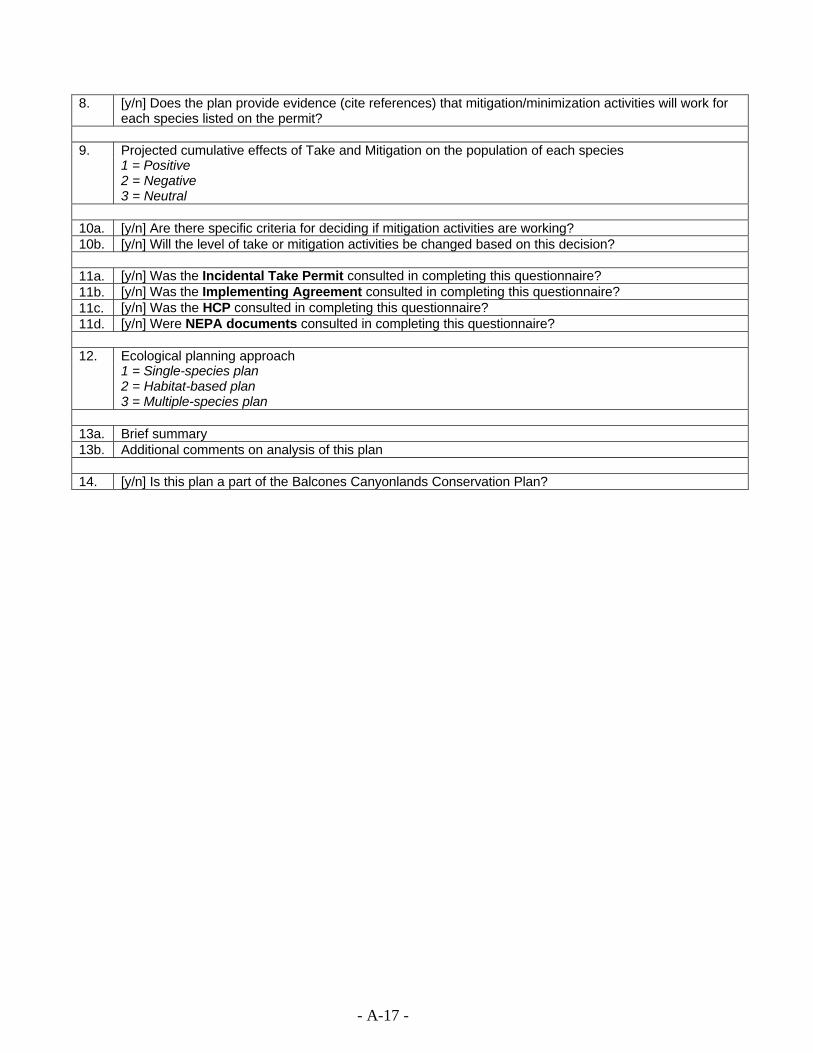
- A-17 -
8. [y/n] Does the plan provide evidence (cite references) that mitigation/minimization activities will work foreach species listed on the permit?
9. Projected cumulative effects of Take and Mitigation on the population of each species1 = Positive2 = Negative3 = Neutral
10a. [y/n] Are there specific criteria for deciding if mitigation activities are working?10b. [y/n] Will the level of take or mitigation activities be changed based on this decision?
11a. [y/n] Was the Incidental Take Permit consulted in completing this questionnaire?11b. [y/n] Was the Implementing Agreement consulted in completing this questionnaire?11c. [y/n] Was the HCP consulted in completing this questionnaire?11d. [y/n] Were NEPA documents consulted in completing this questionnaire?
12. Ecological planning approach1 = Single-species plan2 = Habitat-based plan3 = Multiple-species plan
13a. Brief summary13b. Additional comments on analysis of this plan
14. [y/n] Is this plan a part of the Balcones Canyonlands Conservation Plan?
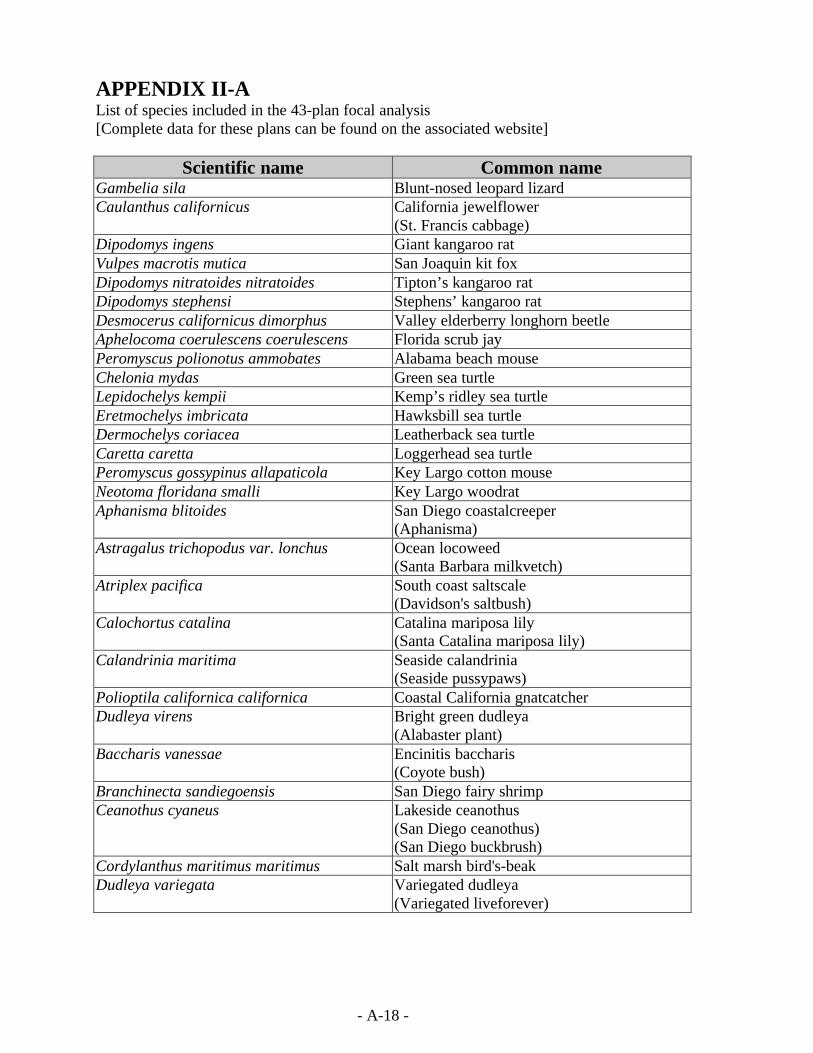
- A-18 -
APPENDIX II-AList of species included in the 43-plan focal analysis[Complete data for these plans can be found on the associated website]
Scientific name Common nameGambelia sila Blunt-nosed leopard lizardCaulanthus californicus California jewelflower
(St. Francis cabbage)Dipodomys ingens Giant kangaroo ratVulpes macrotis mutica San Joaquin kit foxDipodomys nitratoides nitratoides Tipton’s kangaroo ratDipodomys stephensi Stephens’ kangaroo ratDesmocerus californicus dimorphus Valley elderberry longhorn beetleAphelocoma coerulescens coerulescens Florida scrub jayPeromyscus polionotus ammobates Alabama beach mouseChelonia mydas Green sea turtleLepidochelys kempii Kemp’s ridley sea turtleEretmochelys imbricata Hawksbill sea turtleDermochelys coriacea Leatherback sea turtleCaretta caretta Loggerhead sea turtlePeromyscus gossypinus allapaticola Key Largo cotton mouseNeotoma floridana smalli Key Largo woodratAphanisma blitoides San Diego coastalcreeper
(Aphanisma)Astragalus trichopodus var. lonchus Ocean locoweed
(Santa Barbara milkvetch)Atriplex pacifica South coast saltscale
(Davidson's saltbush)Calochortus catalina Catalina mariposa lily
(Santa Catalina mariposa lily)Calandrinia maritima Seaside calandrinia
(Seaside pussypaws)Polioptila californica californica Coastal California gnatcatcherDudleya virens Bright green dudleya
(Alabaster plant)Baccharis vanessae Encinitis baccharis
(Coyote bush)Branchinecta sandiegoensis San Diego fairy shrimpCeanothus cyaneus Lakeside ceanothus
(San Diego ceanothus)(San Diego buckbrush)
Cordylanthus maritimus maritimus Salt marsh bird's-beakDudleya variegata Variegated dudleya
(Variegated liveforever)
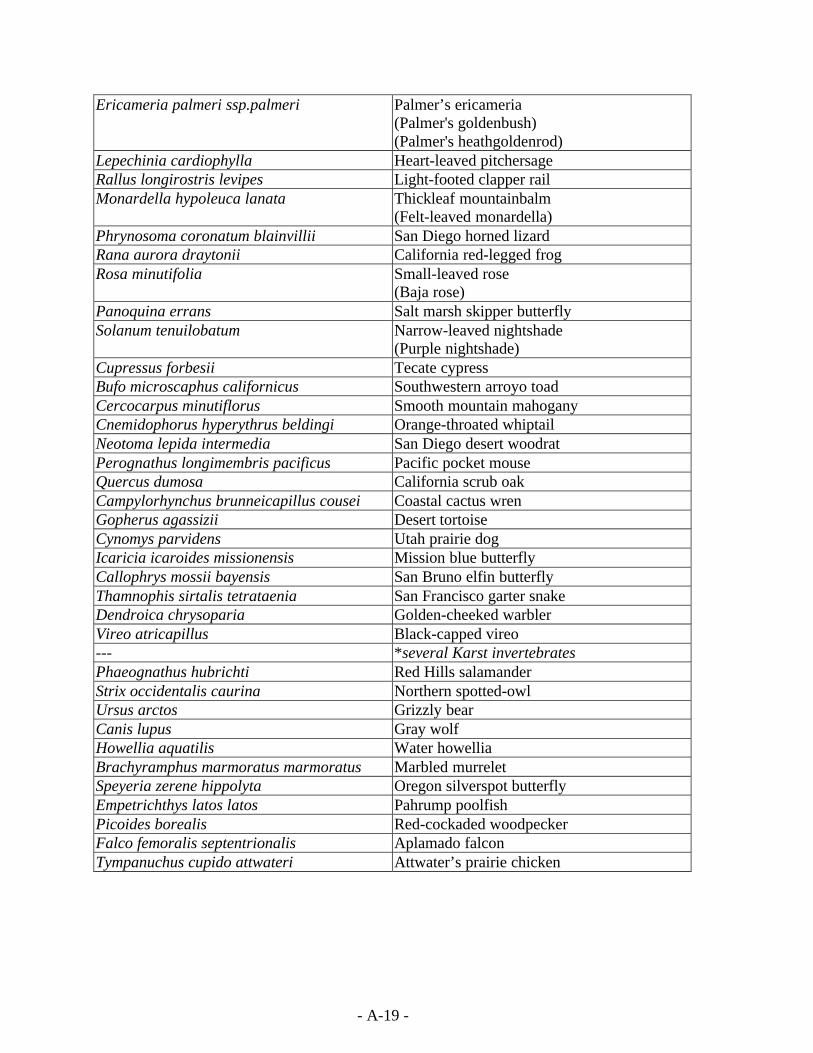
- A-19 -
Ericameria palmeri ssp.palmeri Palmer’s ericameria(Palmer's goldenbush)(Palmer's heathgoldenrod)
Lepechinia cardiophylla Heart-leaved pitchersageRallus longirostris levipes Light-footed clapper railMonardella hypoleuca lanata Thickleaf mountainbalm
(Felt-leaved monardella)Phrynosoma coronatum blainvillii San Diego horned lizardRana aurora draytonii California red-legged frogRosa minutifolia Small-leaved rose
(Baja rose)Panoquina errans Salt marsh skipper butterflySolanum tenuilobatum Narrow-leaved nightshade
(Purple nightshade)Cupressus forbesii Tecate cypressBufo microscaphus californicus Southwestern arroyo toadCercocarpus minutiflorus Smooth mountain mahoganyCnemidophorus hyperythrus beldingi Orange-throated whiptailNeotoma lepida intermedia San Diego desert woodratPerognathus longimembris pacificus Pacific pocket mouseQuercus dumosa California scrub oakCampylorhynchus brunneicapillus cousei Coastal cactus wrenGopherus agassizii Desert tortoiseCynomys parvidens Utah prairie dogIcaricia icaroides missionensis Mission blue butterflyCallophrys mossii bayensis San Bruno elfin butterflyThamnophis sirtalis tetrataenia San Francisco garter snakeDendroica chrysoparia Golden-cheeked warblerVireo atricapillus Black-capped vireo--- *several Karst invertebratesPhaeognathus hubrichti Red Hills salamanderStrix occidentalis caurina Northern spotted-owlUrsus arctos Grizzly bearCanis lupus Gray wolfHowellia aquatilis Water howelliaBrachyramphus marmoratus marmoratus Marbled murreletSpeyeria zerene hippolyta Oregon silverspot butterflyEmpetrichthys latos latos Pahrump poolfishPicoides borealis Red-cockaded woodpeckerFalco femoralis septentrionalis Aplamado falconTympanuchus cupido attwateri Attwater’s prairie chicken
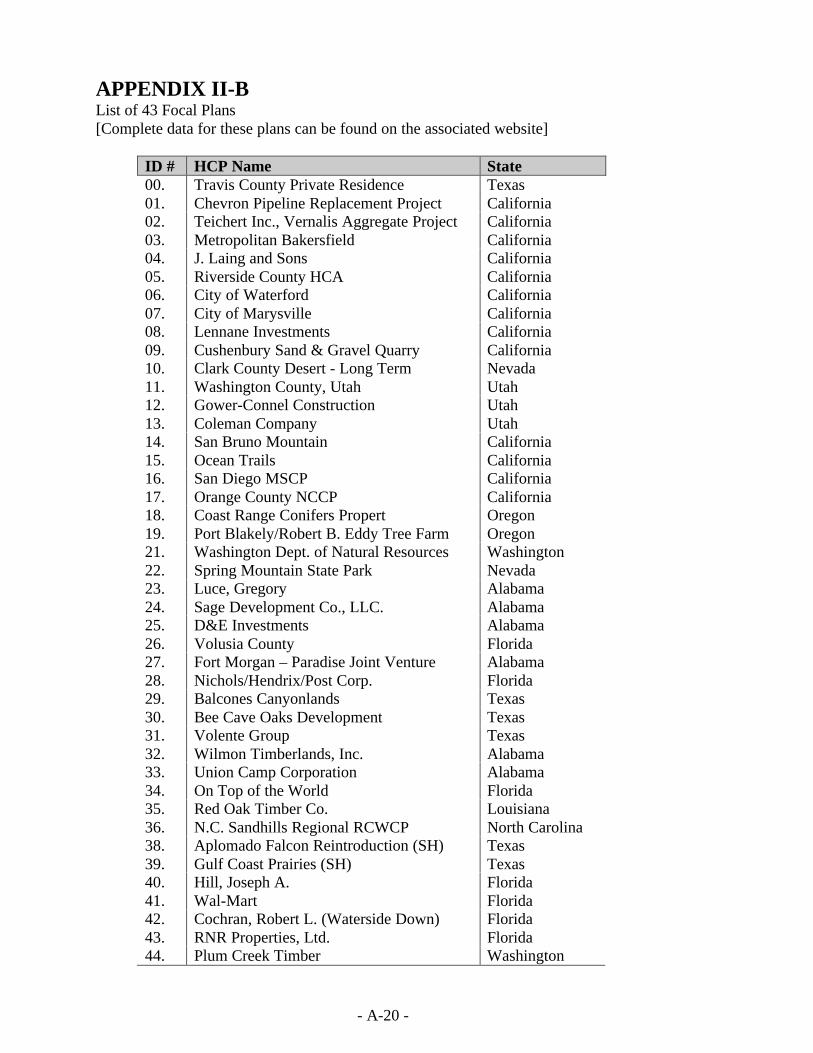
- A-20 -
APPENDIX II-BList of 43 Focal Plans[Complete data for these plans can be found on the associated website]
ID # HCP Name State00. Travis County Private Residence Texas01. Chevron Pipeline Replacement Project California02. Teichert Inc., Vernalis Aggregate Project California03. Metropolitan Bakersfield California04. J. Laing and Sons California05. Riverside County HCA California06. City of Waterford California07. City of Marysville California08. Lennane Investments California09. Cushenbury Sand & Gravel Quarry California10. Clark County Desert - Long Term Nevada11. Washington County, Utah Utah12. Gower-Connel Construction Utah13. Coleman Company Utah14. San Bruno Mountain California15. Ocean Trails California16. San Diego MSCP California17. Orange County NCCP California18. Coast Range Conifers Propert Oregon19. Port Blakely/Robert B. Eddy Tree Farm Oregon21. Washington Dept. of Natural Resources Washington22. Spring Mountain State Park Nevada23. Luce, Gregory Alabama24. Sage Development Co., LLC. Alabama25. D&E Investments Alabama26. Volusia County Florida27. Fort Morgan – Paradise Joint Venture Alabama28. Nichols/Hendrix/Post Corp. Florida29. Balcones Canyonlands Texas30. Bee Cave Oaks Development Texas31. Volente Group Texas32. Wilmon Timberlands, Inc. Alabama33. Union Camp Corporation Alabama34. On Top of the World Florida35. Red Oak Timber Co. Louisiana36. N.C. Sandhills Regional RCWCP North Carolina38. Aplomado Falcon Reintroduction (SH) Texas39. Gulf Coast Prairies (SH) Texas40. Hill, Joseph A. Florida41. Wal-Mart Florida42. Cochran, Robert L. (Waterside Down) Florida43. RNR Properties, Ltd. Florida44. Plum Creek Timber Washington
- A-21 -
APPENDIX III.Detailed results of analyses to test the validity of using overall adequacy scores.
Many of the analyses assume that the measures of ‘overall adequacy’ for each of the five steps ofHCP analysis are robust, non-arbitrary estimates of analysis quality. To test this assumption, inthe tables below we present the results of regression analysis of these overall ratings uponcomposite variables that summarize the answers to the more detailed questions about theinformation and analysis used at each step of the HCP process. We performed these analyses forthe summary questions about Status, Take, Impact, Mitigation, and three subsections ofMonitoring. All analyses were performed on normalized variables. Each table below shows theresults for one-way regressions using just one set of biologically distinct answers to detailedquestions (e.g., data on changes in numbers or demography), as well as results from multi-wayregressions using combinations of variables. Note that these multi-way analyses usually havemuch lower sample sizes, because they could not use many cases due to missing values. Overall,the results from these analyses show that the overall ranking questions are very well-predicted bythe details of data and analysis used at each step of the HCP process.
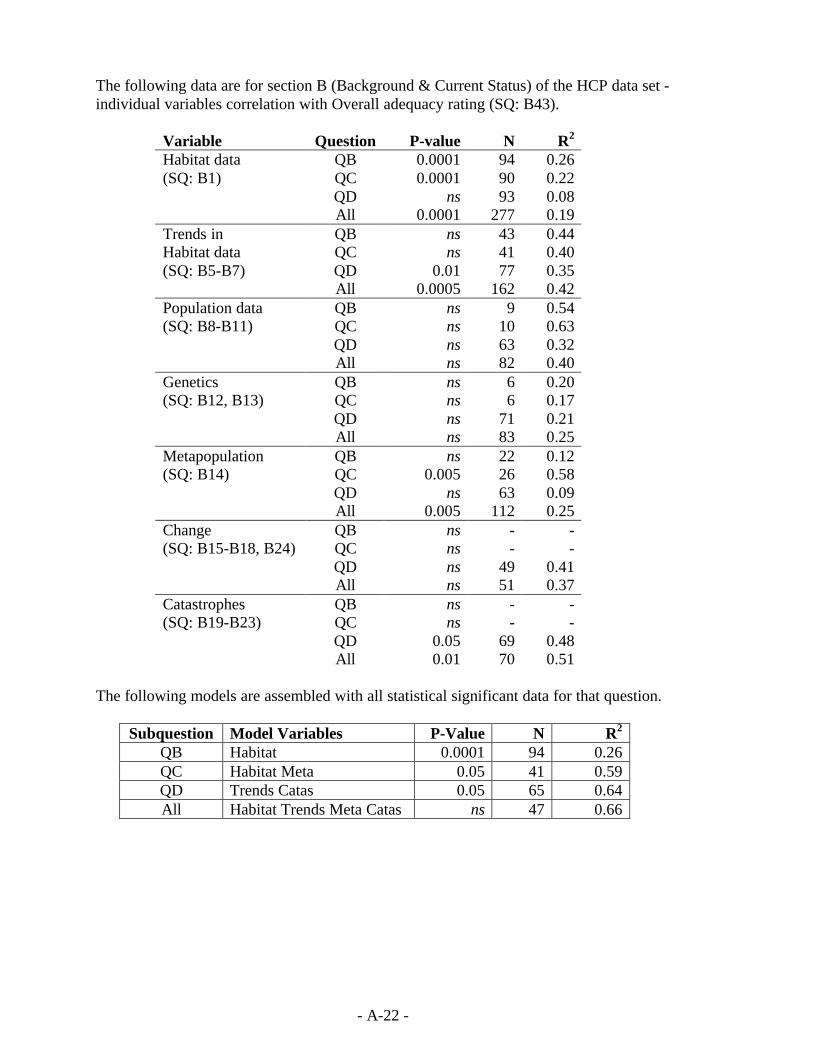
- A-22 -
The following data are for section B (Background & Current Status) of the HCP data set -individual variables correlation with Overall adequacy rating (SQ: B43).
Variable Question P-value N R2
QB 0.0001 94 0.26QC 0.0001 90 0.22QD ns 93 0.08
Habitat data(SQ: B1)
All 0.0001 277 0.19QB ns 43 0.44QC ns 41 0.40QD 0.01 77 0.35
Trends inHabitat data(SQ: B5-B7)
All 0.0005 162 0.42QB ns 9 0.54QC ns 10 0.63QD ns 63 0.32
Population data(SQ: B8-B11)
All ns 82 0.40QB ns 6 0.20QC ns 6 0.17QD ns 71 0.21
Genetics(SQ: B12, B13)
All ns 83 0.25QB ns 22 0.12QC 0.005 26 0.58QD ns 63 0.09
Metapopulation(SQ: B14)
All 0.005 112 0.25QB ns - -QC ns - -QD ns 49 0.41
Change(SQ: B15-B18, B24)
All ns 51 0.37QB ns - -QC ns - -QD 0.05 69 0.48
Catastrophes(SQ: B19-B23)
All 0.01 70 0.51
The following models are assembled with all statistical significant data for that question.
Subquestion Model Variables P-Value N R2
QB Habitat 0.0001 94 0.26QC Habitat Meta 0.05 41 0.59QD Trends Catas 0.05 65 0.64All Habitat Trends Meta Catas ns 47 0.66
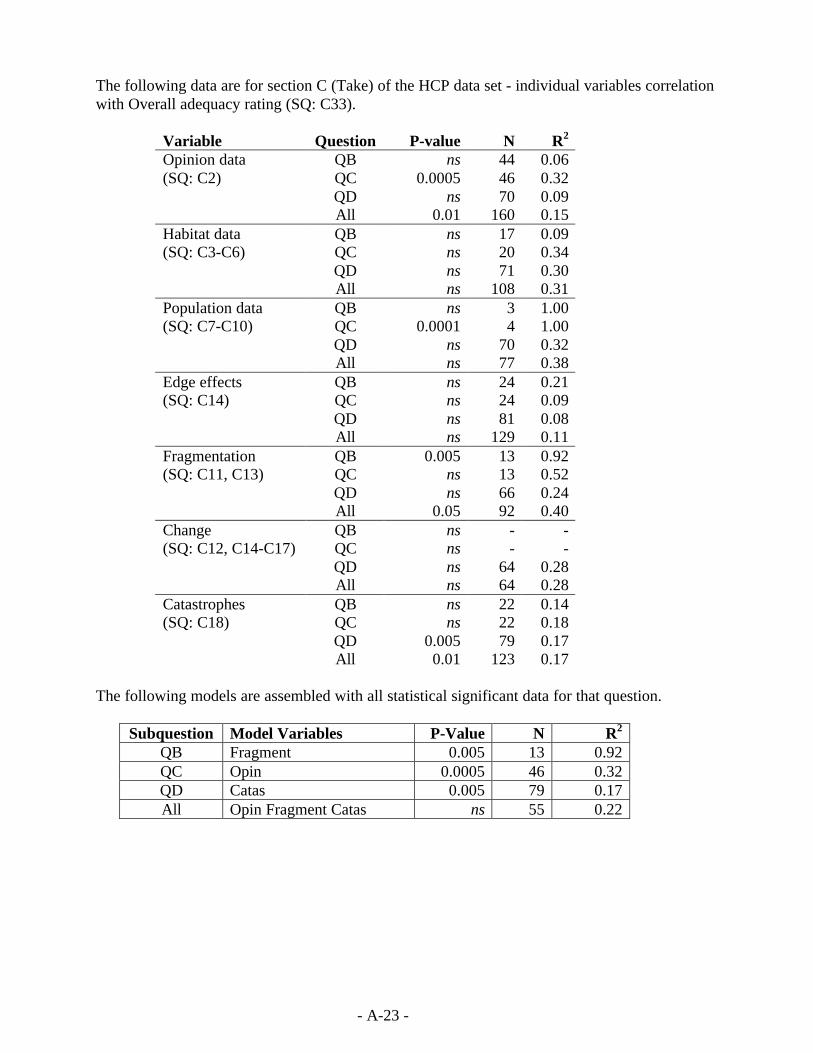
- A-23 -
The following data are for section C (Take) of the HCP data set - individual variables correlationwith Overall adequacy rating (SQ: C33).
Variable Question P-value N R2
QB ns 44 0.06QC 0.0005 46 0.32QD ns 70 0.09
Opinion data(SQ: C2)
All 0.01 160 0.15QB ns 17 0.09QC ns 20 0.34QD ns 71 0.30
Habitat data(SQ: C3-C6)
All ns 108 0.31QB ns 3 1.00QC 0.0001 4 1.00QD ns 70 0.32
Population data(SQ: C7-C10)
All ns 77 0.38QB ns 24 0.21QC ns 24 0.09QD ns 81 0.08
Edge effects(SQ: C14)
All ns 129 0.11QB 0.005 13 0.92QC ns 13 0.52QD ns 66 0.24
Fragmentation(SQ: C11, C13)
All 0.05 92 0.40QB ns - -QC ns - -QD ns 64 0.28
Change(SQ: C12, C14-C17)
All ns 64 0.28QB ns 22 0.14QC ns 22 0.18QD 0.005 79 0.17
Catastrophes(SQ: C18)
All 0.01 123 0.17
The following models are assembled with all statistical significant data for that question.
Subquestion Model Variables P-Value N R2
QB Fragment 0.005 13 0.92QC Opin 0.0005 46 0.32QD Catas 0.005 79 0.17All Opin Fragment Catas ns 55 0.22
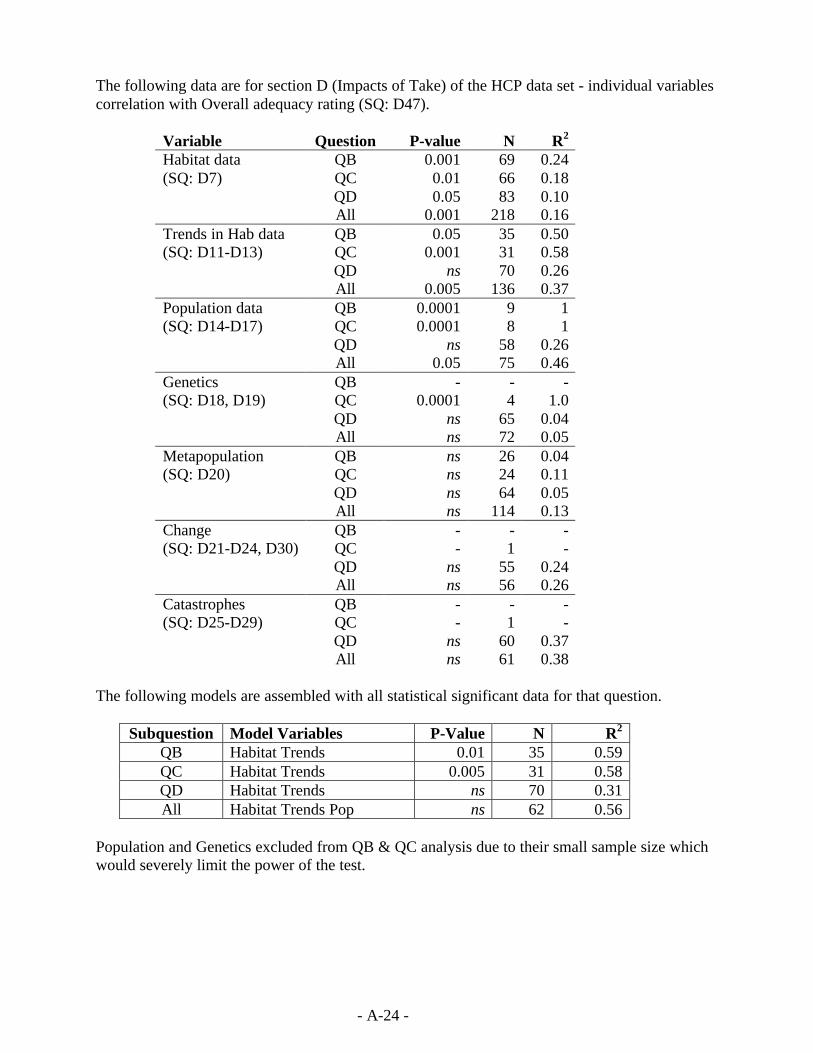
- A-24 -
The following data are for section D (Impacts of Take) of the HCP data set - individual variablescorrelation with Overall adequacy rating (SQ: D47).
Variable Question P-value N R2
QB 0.001 69 0.24QC 0.01 66 0.18QD 0.05 83 0.10
Habitat data(SQ: D7)
All 0.001 218 0.16QB 0.05 35 0.50QC 0.001 31 0.58QD ns 70 0.26
Trends in Hab data(SQ: D11-D13)
All 0.005 136 0.37QB 0.0001 9 1QC 0.0001 8 1QD ns 58 0.26
Population data(SQ: D14-D17)
All 0.05 75 0.46QB - - -QC 0.0001 4 1.0QD ns 65 0.04
Genetics(SQ: D18, D19)
All ns 72 0.05QB ns 26 0.04QC ns 24 0.11QD ns 64 0.05
Metapopulation(SQ: D20)
All ns 114 0.13QB - - -QC - 1 -QD ns 55 0.24
Change(SQ: D21-D24, D30)
All ns 56 0.26QB - - -QC - 1 -QD ns 60 0.37
Catastrophes(SQ: D25-D29)
All ns 61 0.38
The following models are assembled with all statistical significant data for that question.
Subquestion Model Variables P-Value N R2
QB Habitat Trends 0.01 35 0.59QC Habitat Trends 0.005 31 0.58QD Habitat Trends ns 70 0.31All Habitat Trends Pop ns 62 0.56
Population and Genetics excluded from QB & QC analysis due to their small sample size whichwould severely limit the power of the test.
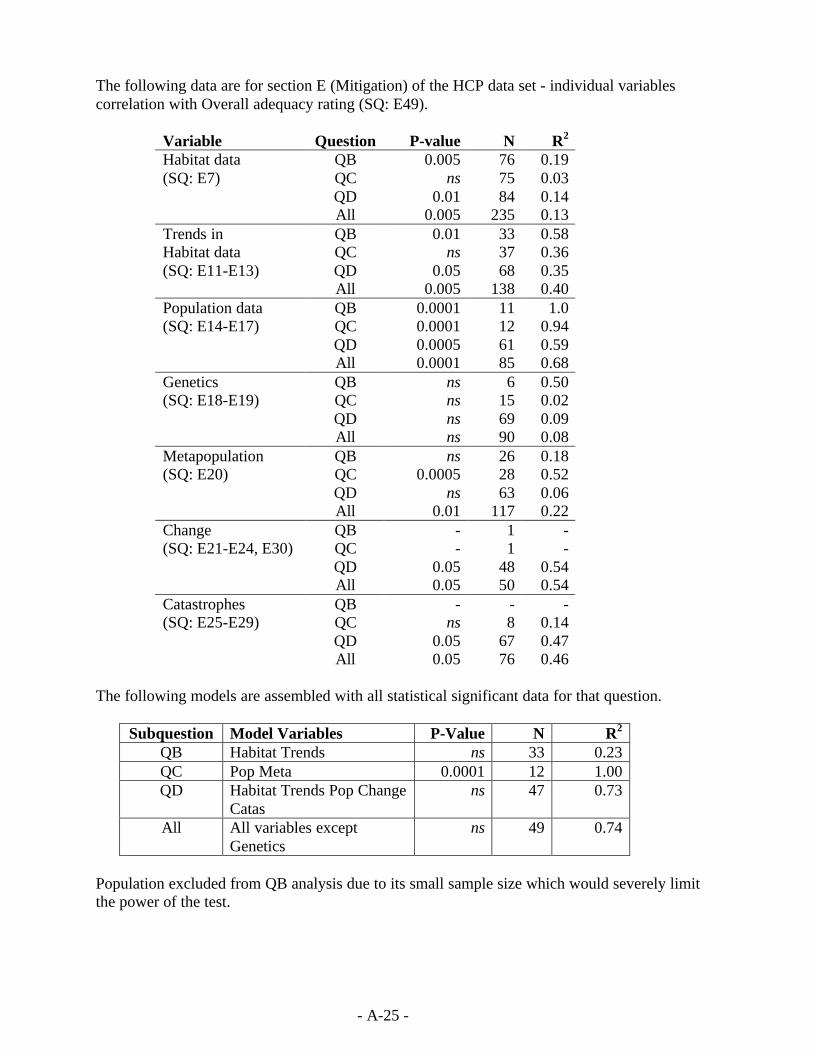
- A-25 -
The following data are for section E (Mitigation) of the HCP data set - individual variablescorrelation with Overall adequacy rating (SQ: E49).
Variable Question P-value N R2
QB 0.005 76 0.19QC ns 75 0.03QD 0.01 84 0.14
Habitat data(SQ: E7)
All 0.005 235 0.13QB 0.01 33 0.58QC ns 37 0.36QD 0.05 68 0.35
Trends inHabitat data(SQ: E11-E13)
All 0.005 138 0.40QB 0.0001 11 1.0QC 0.0001 12 0.94QD 0.0005 61 0.59
Population data(SQ: E14-E17)
All 0.0001 85 0.68QB ns 6 0.50QC ns 15 0.02QD ns 69 0.09
Genetics(SQ: E18-E19)
All ns 90 0.08QB ns 26 0.18QC 0.0005 28 0.52QD ns 63 0.06
Metapopulation(SQ: E20)
All 0.01 117 0.22QB - 1 -QC - 1 -QD 0.05 48 0.54
Change(SQ: E21-E24, E30)
All 0.05 50 0.54QB - - -QC ns 8 0.14QD 0.05 67 0.47
Catastrophes(SQ: E25-E29)
All 0.05 76 0.46
The following models are assembled with all statistical significant data for that question.
Subquestion Model Variables P-Value N R2
QB Habitat Trends ns 33 0.23QC Pop Meta 0.0001 12 1.00QD Habitat Trends Pop Change
Catasns 47 0.73
All All variables exceptGenetics
ns 49 0.74
Population excluded from QB analysis due to its small sample size which would severely limitthe power of the test.
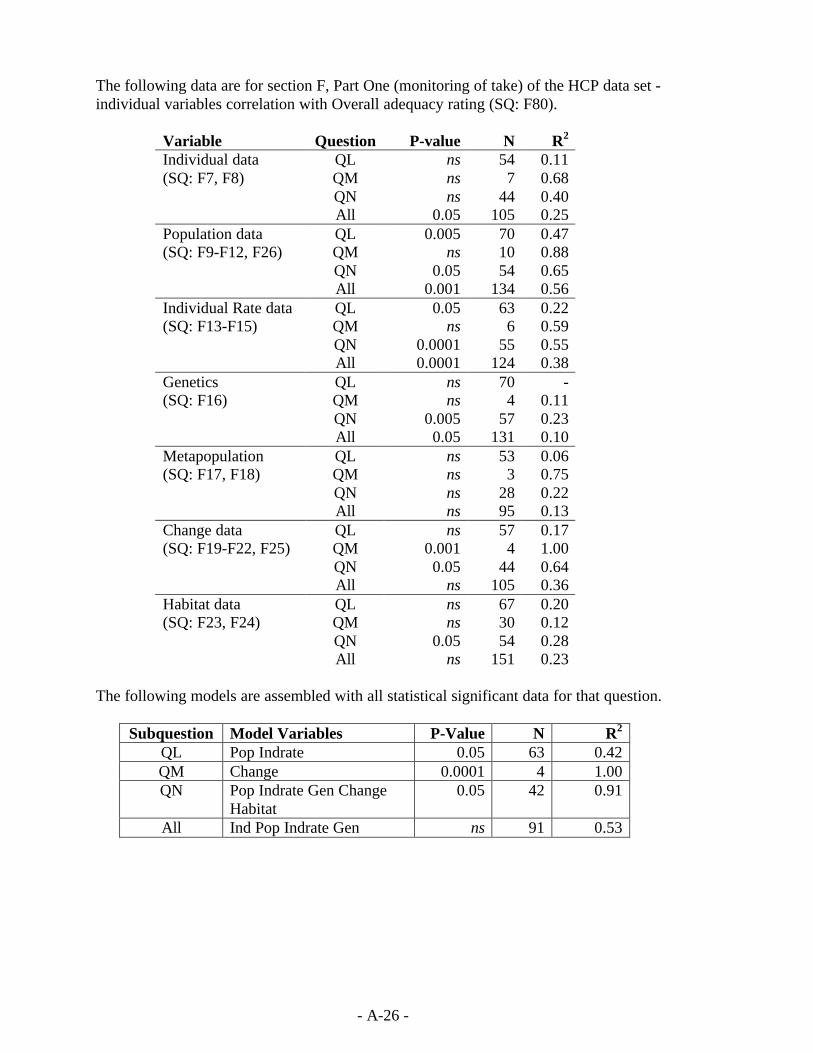
- A-26 -
The following data are for section F, Part One (monitoring of take) of the HCP data set -individual variables correlation with Overall adequacy rating (SQ: F80).
Variable Question P-value N R2
QL ns 54 0.11QM ns 7 0.68QN ns 44 0.40
Individual data(SQ: F7, F8)
All 0.05 105 0.25QL 0.005 70 0.47QM ns 10 0.88QN 0.05 54 0.65
Population data(SQ: F9-F12, F26)
All 0.001 134 0.56QL 0.05 63 0.22QM ns 6 0.59QN 0.0001 55 0.55
Individual Rate data(SQ: F13-F15)
All 0.0001 124 0.38QL ns 70 -QM ns 4 0.11QN 0.005 57 0.23
Genetics(SQ: F16)
All 0.05 131 0.10QL ns 53 0.06QM ns 3 0.75QN ns 28 0.22
Metapopulation(SQ: F17, F18)
All ns 95 0.13QL ns 57 0.17QM 0.001 4 1.00QN 0.05 44 0.64
Change data(SQ: F19-F22, F25)
All ns 105 0.36QL ns 67 0.20QM ns 30 0.12QN 0.05 54 0.28
Habitat data(SQ: F23, F24)
All ns 151 0.23
The following models are assembled with all statistical significant data for that question.
Subquestion Model Variables P-Value N R2
QL Pop Indrate 0.05 63 0.42QM Change 0.0001 4 1.00QN Pop Indrate Gen Change
Habitat0.05 42 0.91
All Ind Pop Indrate Gen ns 91 0.53
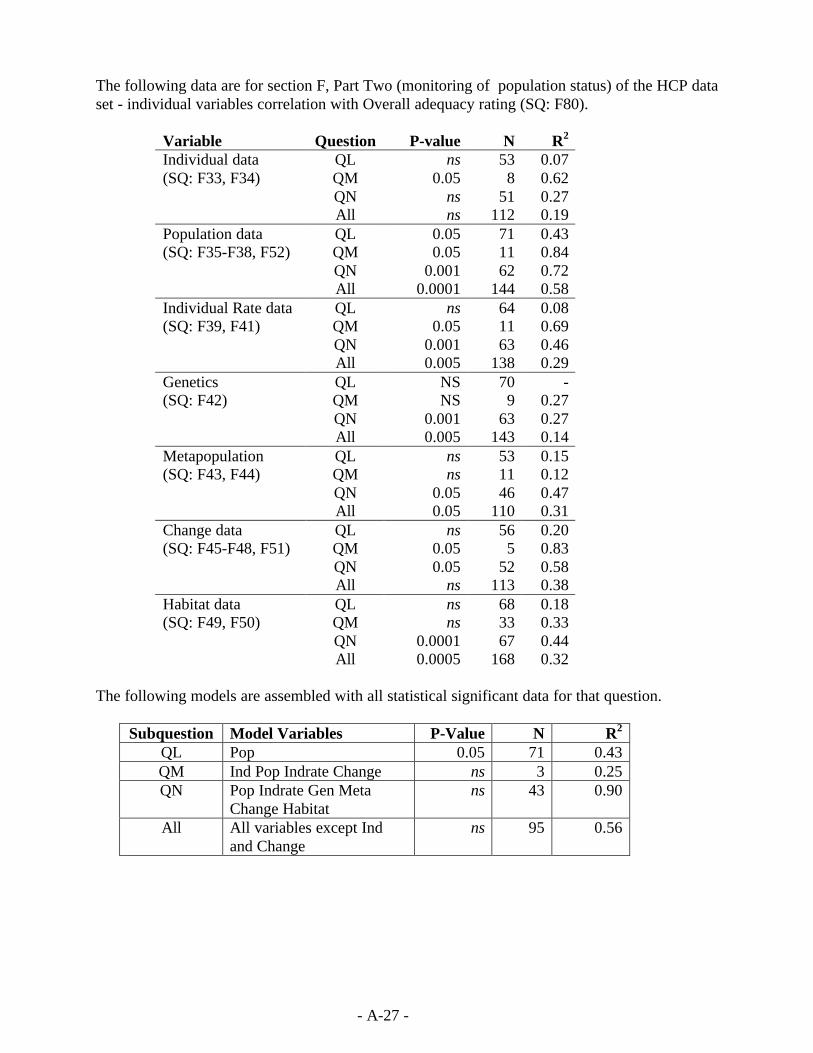
- A-27 -
The following data are for section F, Part Two (monitoring of population status) of the HCP dataset - individual variables correlation with Overall adequacy rating (SQ: F80).
Variable Question P-value N R2
QL ns 53 0.07QM 0.05 8 0.62QN ns 51 0.27
Individual data(SQ: F33, F34)
All ns 112 0.19QL 0.05 71 0.43QM 0.05 11 0.84QN 0.001 62 0.72
Population data(SQ: F35-F38, F52)
All 0.0001 144 0.58QL ns 64 0.08QM 0.05 11 0.69QN 0.001 63 0.46
Individual Rate data(SQ: F39, F41)
All 0.005 138 0.29QL NS 70 -QM NS 9 0.27QN 0.001 63 0.27
Genetics(SQ: F42)
All 0.005 143 0.14QL ns 53 0.15QM ns 11 0.12QN 0.05 46 0.47
Metapopulation(SQ: F43, F44)
All 0.05 110 0.31QL ns 56 0.20QM 0.05 5 0.83QN 0.05 52 0.58
Change data(SQ: F45-F48, F51)
All ns 113 0.38QL ns 68 0.18QM ns 33 0.33QN 0.0001 67 0.44
Habitat data(SQ: F49, F50)
All 0.0005 168 0.32
The following models are assembled with all statistical significant data for that question.
Subquestion Model Variables P-Value N R2
QL Pop 0.05 71 0.43QM Ind Pop Indrate Change ns 3 0.25QN Pop Indrate Gen Meta
Change Habitatns 43 0.90
All All variables except Indand Change
ns 95 0.56
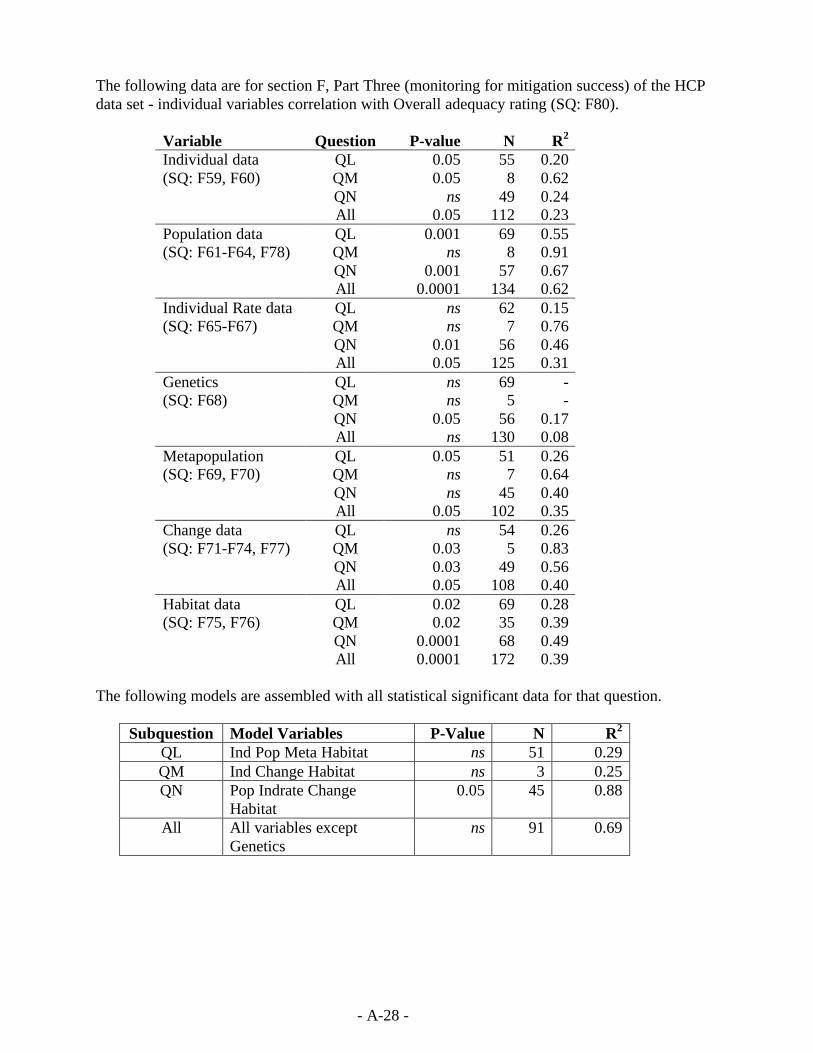
- A-28 -
The following data are for section F, Part Three (monitoring for mitigation success) of the HCPdata set - individual variables correlation with Overall adequacy rating (SQ: F80).
Variable Question P-value N R2
QL 0.05 55 0.20QM 0.05 8 0.62QN ns 49 0.24
Individual data(SQ: F59, F60)
All 0.05 112 0.23QL 0.001 69 0.55QM ns 8 0.91QN 0.001 57 0.67
Population data(SQ: F61-F64, F78)
All 0.0001 134 0.62QL ns 62 0.15QM ns 7 0.76QN 0.01 56 0.46
Individual Rate data(SQ: F65-F67)
All 0.05 125 0.31QL ns 69 -QM ns 5 -QN 0.05 56 0.17
Genetics(SQ: F68)
All ns 130 0.08QL 0.05 51 0.26QM ns 7 0.64QN ns 45 0.40
Metapopulation(SQ: F69, F70)
All 0.05 102 0.35QL ns 54 0.26QM 0.03 5 0.83QN 0.03 49 0.56
Change data(SQ: F71-F74, F77)
All 0.05 108 0.40QL 0.02 69 0.28QM 0.02 35 0.39QN 0.0001 68 0.49
Habitat data(SQ: F75, F76)
All 0.0001 172 0.39
The following models are assembled with all statistical significant data for that question.
Subquestion Model Variables P-Value N R2
QL Ind Pop Meta Habitat ns 51 0.29QM Ind Change Habitat ns 3 0.25QN Pop Indrate Change
Habitat0.05 45 0.88
All All variables exceptGenetics
ns 91 0.69
Related Documents