BioOne sees sustainable scholarly publishing as an inherently collaborative enterprise connecting authors, nonprofit publishers, academic institutions, research libraries, and research funders in the common goal of maximizing access to critical research. Using Range Condition Assessment to Optimize Wildlife Stocking in Tindress Wildlife Sanctuary, Nakuru District, Kenya Author(s): Shadrack M. Muya, Able M. Kamweya, Anne W. T. Muigai, Apollo Kariuki, and Shadrack M. Ngene Source: Rangeland Ecology & Management, 66(4):410-418. Published By: Society for Range Management DOI: http://dx.doi.org/10.2111/REM-D-12-00075.1 URL: http://www.bioone.org/doi/full/10.2111/REM-D-12-00075.1 BioOne (www.bioone.org ) is a nonprofit, online aggregation of core research in the biological, ecological, and environmental sciences. BioOne provides a sustainable online platform for over 170 journals and books published by nonprofit societies, associations, museums, institutions, and presses. Your use of this PDF, the BioOne Web site, and all posted and associated content indicates your acceptance of BioOne’s Terms of Use, available at www.bioone.org/page/terms_of_use . Usage of BioOne content is strictly limited to personal, educational, and non-commercial use. Commercial inquiries or rights and permissions requests should be directed to the individual publisher as copyright holder.

Welcome message from author
This document is posted to help you gain knowledge. Please leave a comment to let me know what you think about it! Share it to your friends and learn new things together.
Transcript
BioOne sees sustainable scholarly publishing as an inherently collaborative enterprise connecting authors, nonprofit publishers, academic institutions, researchlibraries, and research funders in the common goal of maximizing access to critical research.
Using Range Condition Assessment to Optimize Wildlife Stocking in TindressWildlife Sanctuary, Nakuru District, KenyaAuthor(s): Shadrack M. Muya, Able M. Kamweya, Anne W. T. Muigai, Apollo Kariuki, and Shadrack M.NgeneSource: Rangeland Ecology & Management, 66(4):410-418.Published By: Society for Range ManagementDOI: http://dx.doi.org/10.2111/REM-D-12-00075.1URL: http://www.bioone.org/doi/full/10.2111/REM-D-12-00075.1
BioOne (www.bioone.org) is a nonprofit, online aggregation of core research in the biological, ecological, andenvironmental sciences. BioOne provides a sustainable online platform for over 170 journals and books publishedby nonprofit societies, associations, museums, institutions, and presses.
Your use of this PDF, the BioOne Web site, and all posted and associated content indicates your acceptance ofBioOne’s Terms of Use, available at www.bioone.org/page/terms_of_use.
Usage of BioOne content is strictly limited to personal, educational, and non-commercial use. Commercial inquiriesor rights and permissions requests should be directed to the individual publisher as copyright holder.
Rangeland Ecol Manage 66:410–418 | July 2013 | DOI: 10.2111/REM-D-12-00075.1
Using Range Condition Assessment to Optimize Wildlife Stocking in Tindress WildlifeSanctuary, Nakuru District, Kenya
Shadrack M. Muya,1 Able M. Kamweya,2 Anne W. T. Muigai,3 Apollo Kariuki,4
and Shadrack M. Ngene5
Authors are 1Lecturer in Ecology and Conservation Genetics and 2Senior Lecturer in Ecology, Department of Zoology, and 3Professor of Genetics,Department of Botany, Jomo Kenyatta University of Agriculture and Technology, Nairobi, Kenya; and 4Senior Resource Planner and 5Elephant
Programme Coordinator, Department of Biodiversity Research and Monitoring, Kenya Wildlife Service, Nairobi, Kenya.
Abstract
Over 70% of Kenya’s wildlife resources occur outside protected areas, in areas where land use practices do not necessarilyconform to wildlife conservation standards. Ensuring that land use practices in these areas accommodate wildlife conservation isvital in effectively conserving wildlife in this country. Tindress Farm in Rift Valley offers a good example of a place whereeconomic activities and wildlife conservation can work harmoniously. The farm has set up a 320-ha wildlife sanctuary in thehilly parts of the property to provide a haven for wildlife displaced by human settlements in the surrounding environs. TheTindress Farm management needed to know the diversity and optimum number of wildlife species that the sanctuary couldaccommodate. This study set out to 1) outline a set of models for objectively calculating wildlife stocking levels and 2)demonstrate the practical use of these models in estimating optimum stocking levels for a specific wildlife sanctuary. Aftercomparing models using forage inventory methods models and utilization-based methods (UM), we opted to use UM modelsbecause of their focus on ecological energetics. This study established that the range condition in Tindress Wildlife Sanctuaryvaried from poor to good (29–69%) and recommended a total stocking density of 158.9 grazer units and 201.4 browser unitsshared out by the various herbivore species. These estimates remain a best-case scenario. The effects of rainfall, range condition,and condition of the animals should be monitored continuously to allow for adjustments through active adaptive management.
Key words: browsing unit, utilization-based models, wildlife utilization, wildlife carrying capacity
INTRODUCTION
Over 70% of Kenya’s wildlife resources are found outsidenational parks (Ngunjiri 1997), in areas where the coreeconomic activities are not necessarily in conformance withwildlife conservation standards. There are several threats toloss of this wildlife, especially from destruction of habitat andpoaching (Kamweya et al. 2012). Such losses would deal adevastating blow to conservation efforts in Kenya. Apparently,the wildlife-based tourism industry would collapse and Kenya’sVision 20301 would not be realized. Poaching, encroachmenton wildlife habitats by settlements, farms, charcoal burners,logging, and hunting are the major threats to wildlife survival inthese lands, since most of them lack structured security services(Jambiya et al. 2007). Competition for resources betweenhuman beings and livestock on one hand and wild animals onthe other is exacerbating the threat. Transmission of contagiousdiseases such as rinderpest between the wildlife and livestock isanother major factor that could lead to the decimation of thewildlife populations. Landowners carry the burden of hostingwild animals on their land by maintaining them on the land
with very few benefits, if any (Watson et al. 2010). This calls foractive management of wildlife populations outside formal
wildlife protected areas in order to enhance benefits and/orreduce costs incurred by landowners. Land production systemsare expensive and must be economically viable in order be
sustained. Landowners have to choose the most viableproduction systems. Returns from wildlife conservation must
outperform a myriad of other land uses for landowners toadopt wildlife conservation as a preferred land use option
(Watson et al. 2010). Appropriate habitat managementpractices are crucial in commercial use of free-ranging wildlife
populations. In these cases, the managers must understand andapply these procedures accurately (Watson et al. 2010).
The management of Tindress Farm set up a wildlife sanctuaryin the hilly parts of the farm, which they considered to be an
ideal area to undertake wildlife conservation because of itspristine state. For Kenya Wildlife Service to permit Tindress
Farm to keep wildlife in the sanctuary, the farm managers wererequired to develop a management plan with a clear outline of
activities that would take place in the sanctuary and its carryingcapacity of various wildlife species. Obtaining estimates of
stocking rates/carrying capacities of the sanctuary (and the rangeat large) is also important because of the potential adverse effects
of underutilization of the range. Overutilization can lead to bushencroachment and overgrazing, a primary cause of soil erosion
and reduced productivity. Effective management and conserva-tion of biological resources such as wildlife require that mangersknow the population sizes of the species mix they contain in
areas of their ranches or nature reserves. There is a dearth of
1http://www.vision2030.go.ke.
We appreciate the management of Tindress Farm, especially Mr Suguma and Mansukh
Patel, for funding this study.
Correspondence: Dr Shadrack Muya, Faculty of Science, Jomo Kenyatta University of
Agriculture and Technology, Nairobi, Kenya. Email: [email protected]
Manuscript received 25 June 2012; manuscript accepted 26 February 2013.
ª 2013 The Society for Range Management
410 RANGELAND ECOLOGY & MANAGEMENT 66(4) July 2013
information that can be used as a management tool and isreadily available to ranchers, farmers, or wildlife managers,particularly in most African ecosystems.
In eastern Africa, there is no standard approach in place tocalculate wildlife carrying capacity that recognizes the differentrequirements of grazers, browsers, and mixed feeders as well asvarying metabolic demands of wildlife species. In 1960s and1970s, several ecologists suggested some models for estimatingherbivore carrying capacities for in East African habitats. Forinstance, estimation of consumption has several approachesbased on its relationship with animal body weight (Pratt et al.1977; Delany and Happold 1979). However, the estimates wereinconsistent and varied widely due to variations in environ-mental factors such as climate, soils, and fire. This studyaddresses an emerging need for an objective, repeatable, andeasily applied means of calculating wildlife carrying capacity.
Previous Studies on Carrying Capacity and Stocking LevelsThe concept of carrying capacity has been used widely anddiversely in natural resource management (Scarnecchia 1990).It has its origin in livestock farming, where it was developedand defined by agriculturalists as the number of animals(grazing livestock thus grazing capacity) that an area cansupport without degradation of plants or soil resources(Dhondt 1988; Holechek et al. 1989).
The Society for Range Management (1989) defined carryingcapacity as ‘‘the maximum stocking rate possible which isconsistent with maintaining or improving vegetation or relatedresources.’’ Thus the term carrying capacity represents themaximum rate or level (Forrester 1961) that could be sustainedor supported by specified level of resources. Stocking level isdefined as the optimum number of individuals or units thatspecified vegetation or other resources could sustain or supportto achieve specific management objectives, within specifiedmanagement options (Scarnecchia 1990); thus carrying capac-ity is not an optimum number, but maximum one. If wildlifestocking level is maximized to describe wildlife carryingcapacity, then wildlife carrying capacity is defined as themaximum wildlife stocking level to achieve specific objectiveswithin specified management options (Bothma et al. 2006).
Models for Calculating Wildlife Stocking LevelsThe methods used in this study have been extensively used inSouth Africa. For example, Peel et al. (1994) evaluated theconcept of grazer and browser animal units for Africansavannah areas and tabulated the values for both domesticand wildlife species. In 1986, Smit (1996) developed a methodfor estimating useful biomass from canopy (BECVOL), anapproach that was revolutionary in estimating browsingcapacity. Dekker (1997) calculated the stocking rates for gameranches in Mopani Veld using substitution ratios.
Van Rooyen (2002b) in a symposium on game ranchplanning and management held in Onderstepoort, SouthAfrica, demonstrated the use of vegetation (veld) conditionassessment in determining optimum numbers while stocking agame ranch. Bothma et al. (2006) used diet and plant resourcesto set wildlife stocking densities in Mopane Ranch in theLimpopo province of northern South Africa. The ranch wasestablished in 2000 on land that was previously managed for
cattle ranching. Due to the change in land use from ranching towildlife conservation, there was a need to determine potentialstocking densities for purposes of planning. In Kenya, very littlehas been done on modeling of wildlife stocking levels. The onlyoutstanding contribution was by Georgiadis et al. (2003); amodel was developed for calculating the carrying capacity forzebras in the Laikipia district. In the model, the only driverconsidered was rainfall.
In this study, we reviewed the various methods used incalculating livestock stocking levels. We established that themost common models available are based on either forageinventory methods (FIMs) or utilization-based methods (UMs).The premise of FIMs is that certain minimum levels of drymatter of primary forage plant species (key plant species)should always be present to maintain the soil quality, forageplant vigor, livestock diet quality, and general wildlife habitat(Holechek 1988). The minimum dry matter levels indicate thehighest average degree of use the primary forage species cansustain without loss of productivity. In addition to the key-plant concept, FIMs also apply the key-area concept; no rangeis uniformly utilized because of the clumped pattern of resourcedistribution in nature. Even under light grazing intensities,areas around watering points, salt grounds, valley bottoms, anddriveways will often be heavily foraged upon. These preferredareas are referred to as ‘‘sacrifice areas’’ because setting stockingrates for proper use of these areas will result in underuse of thebulk of the pasture (Holechek 1988). A major objective ofspecialized grazing systems is to minimize the size of thesesacrifice areas and provide them with periodic opportunity forrecovery (Holechek 1983). The success of range managementpractices within a pasture is usually judged by the response ofthe key plant species on the key area. FIM models requireinformation on average daily forage intake by different animalspecies. This is measured as a percentage of animals’ bodyweight per day in dry matter. The data are averaged acrossperiods when forage is dormant and when it is actively growing(Holechek 1988). A stocking level can be calculated onceinformation is obtained on average standing crop of grazeableforage, total area under grazeable pasture, level of grazingintensity the pasture can sustain, and average mass of theanimals to be grazed. The downside of FIM models is that theylack information on browsers and are therefore difficult toimplement in multiobjective feeding setups occurring in wildlifeconservation systems.
The basis of UM models is ecological energetics, whereby itis possible to develop equivalence ratios of different animalspecies that can be expressed in common animal units. Theanimal units stocked over some time (the stocking level)(AUM � ha�1) are then matched to an estimated carryingcapacity (Scarnecchia 1990). This makes the UM models easierto modify and implement in African savannah ecosystems thanFIMs. It is important to note that currently no standardizedapproach is in place in eastern Africa to calculate wildlifecarrying capacity, given the different requirements of grazers,browsers, and mixed feeders as well as varying metabolicdemand between wildlife species. This paper addresses a clearand emerging need for an objective, repeatable, and easilyapplied means of calculating wildlife carrying capacity. Earlierefforts to determine carrying capacity for browsing wildlifepopulations were based on comparisons between the metabolic
66(4) July 2013 411
energy requirements for an adult steer, herein referred to as onelarge stock unit (LSU), primarily a grazer (Meissner 1982;Botha 1999) and any other species of interest. The LSU was thestandard unit for measuring stocking levels in terms of thenumber of LSUs a hectare of land can support without furtherdeterioration.
Among the many UM models available, we adopted arecently published approach in determining wildlife stockinglevels that advocates use of herbivore diet and plant resourcesavailable in a given habitat as the key factors in determiningwildlife stocking levels in African savannas (Bothma et al.2006). This study considers this approach to be more usefulthan previous methods that relied solely on carrying capacity asdefined by agriculturists, as it incorporates both grazing andbrowsing conditions of a range. These two factors determinethe grazing units (GU) and browsing units (BU) available forsharing by different bovids in a particular ranch (or that can beput in a specific ranch) in order to delineate stocking densities(Bothma et al. 2006).
Definition of Grazing Capacity. In wildlife studies, grazingcapacity reflects the potential of ecological production of thegrazeable portion of a homogeneous unit of vegetation. Itrepresents the area of land (in hectares) required to maintain asingle GU over an extended number of years withoutdeterioration of the vegetation or the soil. A male bluewildebeest (Connochaetes taurinus) with a mass of 180 kg iscommonly taken as 1 GU because C. taurinus is a largeherbivore with a diet primarily based on grazing (Bothma et al.2006). The grazing capacity for wildlife is expressed asGU � 100 ha�1.
Definition of Browsing Capacity. Similarly, browsing capacityreflects the potential of ecological production of the browseableportion of a homogeneous unit of vegetation and represents thearea of land (in hectares) required to maintain a single BU overan extended number of years without deterioration of thevegetation or soil quality. A greater kudu (Tragelaphusstrepsiceros) with a mass of 140 kg is commonly taken as 1BU in South Africa because it is an abundant large herbivorewith a diet primarily based on browsing. The browsingcapacity for wildlife is expressed as BU � 100 ha�1.
In essence, the ecological grazing and browsing capacity forherbivores is the maximum number of grazers and browsersthat a given area of land can sustain, based on the biophysicalresources of the area. Together they form the ecologicalcapacity of the habitat to support wild herbivores (Bothma2002). Proposed stocking densities are seldom as high as theecological grazing and browsing capacities. For maximumwildlife production in a sanctuary, an economic grazing orbrowsing capacity is therefore usually set at 70–80% of theecological grazing or browsing capacity (Van Rooyen 2002a,2002b) so as to have optimum economic return.
In light of the foregoing, the goal to establish wildlifestocking levels (or carrying capacity) of Tindress WildlifeSanctuary (TWS) for appropriate management and use ofwildlife was achieved by first outlining a set of models that havebeen used previously to calculate stocking level (carryingcapacity) with the view of evaluating their appropriateness foruse in savannah ecosystem and, secondly, practically demon-strating how the models in our opinion were most applicable
for a place like TWS, including data collection methods,
analysis, and interpretation in order to make sound decisions
on appropriate wildlife stocking levels for TWS.
MATERIALS AND METHODS
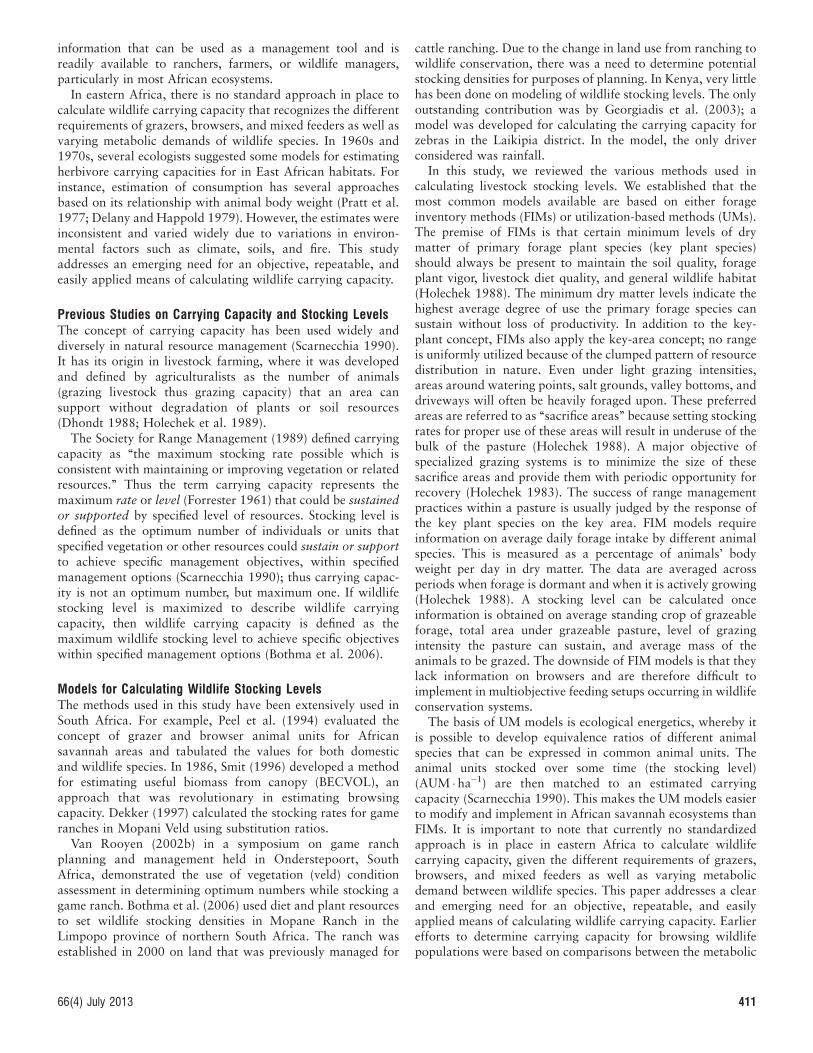
Study AreaTWS is a small conservation area measuring approximately
320 ha located on Tindress Farm about 35 km from Nakuru
town, along the Nakuru–Solai road (Fig. 1). The farm lies
between lat 04842 0S and lat 05801 0S and long 36809 0E and
long 36808 0E, on the slopes of the Solai hills fringing the
greater Subukia escarpment on the westerly direction. The
main farming activities are floriculture, coffee, and dairy
farming.
The sanctuary’s physical features include undulating gravel
hills, rocky outcrops, three seasonal streams, a spring, and
several valley bottoms. The land slopes on an east–westerly
direction and provides good soil drainage. The soils covering
the area are mainly Latosol and Planosol (KSS 1982). The
altitude rises from 1 948 m above the sea level at the valley
bottoms to 2 013 m above the sea level at the highest hilltop.
The rainy season extends from April to December, with about
85% of the mean annual rainfall occurring during these
Figure 1. A location map of Tindress Wildlife Sanctuary in relation to itslocation in Kenya.
412 Rangeland Ecology & Management
months. The 20-yr mean annual rainfall was 1 133 mm with awide fluctuation in rainfall amounts. Fire emerged as anadditional key environmental factor in this area, as it influencesabundance and quality of plant resources in space and time.The mean annual ambient temperature was 15.48C, rangingbetween 6.48C and 24.78C.
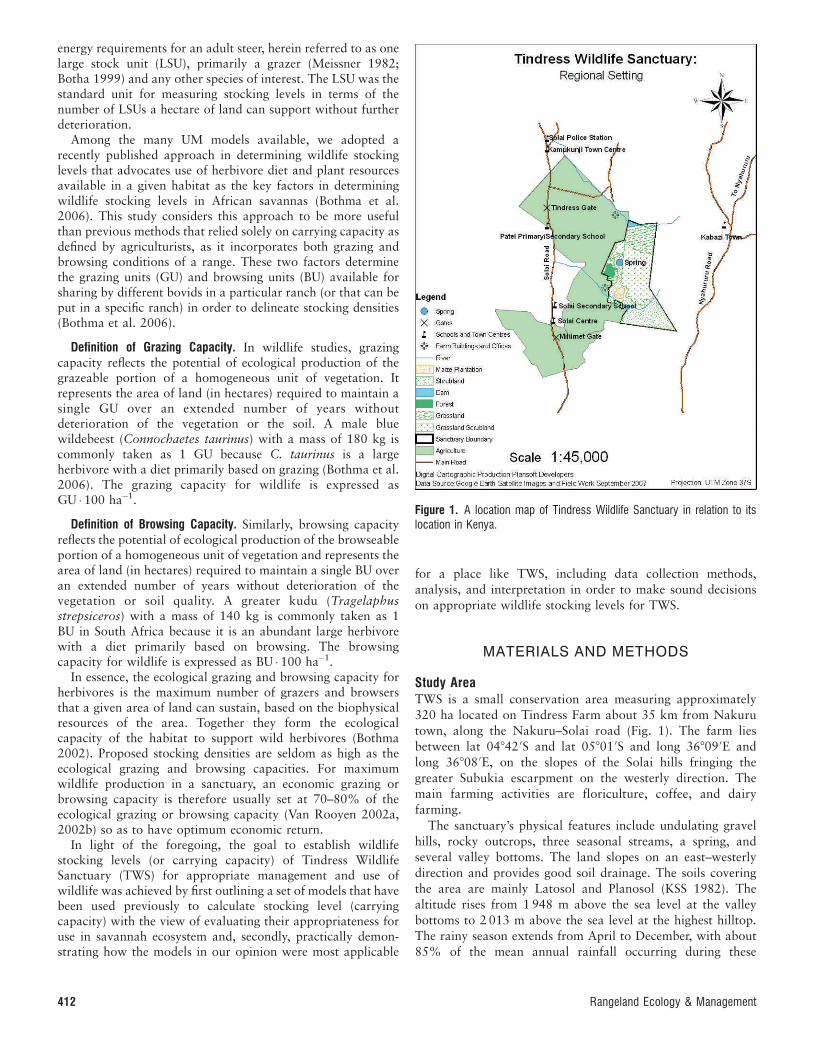
Steps for Calculating Stocking LevelDetermination of stocking level using UM models focuses onevaluating total energy available in a given habitat that is thenshared out through substitution ratios. These methods havebeen developed by several researchers, including Peel et al.(1994), Dekker (1997), Holechek (1988), and Scarnecchia(1990), and modified by Bothma et al. (2006). The procedure issystematic and involves six steps (Fig. 2). Step one involvesresource mapping to delineate the conservation area intohomogeneous vegetation units (HVU). Step two is concernedwith determination of the number of transects in each HVU.Transects should cover at least 30% of the HVU’s total area.Step three focuses on species composition inventory. This isdone within transects delineated in step two. Steps four and fiveinvolve assessment of browsing and grazing conditions,respectively. Finally, step six deals with calculation of the BUsand GUs and apportioning them to animals appropriate to eachhabitat. For this purpose, we categorized the large herbivoresinto four feeding classes (Bothma et al. 2004, 2006):
1) low-selective grazers: these animals have wide mouths and. 80% of their diet is grass,
2) high-selective grazers: these animals have narrow mouthsand . 70% of their diet is grass,
3) mixed feeders that browse and graze: these animals usefrom . 30–70% grass or browse,
4) browsers: these animals eat . y80% wild fruits andbrowse.
Vegetation Composition InventoryWe stratified the sanctuary into three homogeneous physio-graphic vegetation units on the basis of topography (hilltops,slopes, and riverine/valley bottoms), geology, soil, vegetationcharacteristics, and land types. We conducted a detailedbiophysical resource inventory in each HVU. Data on plantspecies composition were gathered using the Braun-Blanquetmethod (Kent and Coker 1995) and involved recording thecover of each species in plots of 10320 m within each of thedifferent homogeneous physiographic vegetation units. Weused vegetation phytosociological tables (MEGATAB 1996;TURBOVEG 1996) to classify the different plant communitiesinto specific phytosociological categories. We determined thesurface area occupied by each plant community for the mappedunits. The plant communities present were an indicator of thevaried wildlife management units available in the sanctuarywith each being characterized by its own biophysical diversityand ecological capacity to support wild herbivores.
Assessment of Graze ConditionWe calculated the index of the grazing range condition by usinga modified version of the veld-condition index method (Vorster1982; Danckwertz 1989b). We classified the grasses and forbsinto five ecological categories, based on their grazing value,primary production, and palatability following the works ofTainton (1999), Van Oudtshoorn (1999), and Bothma et al.(2006):
Class 1: palatable tufted or stoloniferous grass species with ahigh productivity and high grazing value;
Class 2: tufted, perennial grass species with an intermediateproductivity and moderate grazing value;
Class 3: tufted, tall, perennial grass species with a highproductivity but a low grazing value;
Class 4: generally unpalatable, annual and perennial, tuftedor stoloniferous grass species with an intermediate productivityand a low grazing value; and
Class 5: unpalatable, annual grass and forb species with alow productivity and low grazing value.
We calculated a range-condition score for each plantcommunity based on a number of 200 step-point surveys atdifferent sites within each plant community (Mentis 1981). Wedelineated a 30330 m area and systematically paced in the saidarea (each foot was placed in front of each other with the toetouching the foot heel), and at every second step we recordedthe grass or forbs nearest to the tip of the foot until a sample of200 step-points was obtained. If no herbaceous plant occurredwithin a radius of 0.5 m of the step-point, we scored this asbare soil. We classified all nongrass herbs collectively as forbs.The percentage of frequency of each grass species and forb wascalculated per plant community. We calculated the contributionof each ecological class (1–5 above) to the range-conditionscore by adding the percentage of frequencies of all theindividual species that fell within a given ecological class. Wethen multiplied the total percentage of contribution of eachecological class by a weighted constant for each class, whichreflected its grazing value, palatability, and productivity inphytomass. These weighted constants were 10 for Class 1, 7 for
Figure 2. A flow diagram of the steps to follow in calculating wildlifestocking level for a specific conservancy.
66(4) July 2013 413
Class 2, 5 for Class 3, 4 for Class 4, 1 for Class 5, and 0 forbare soil (Tainton 1999).
The sum of all the multiplied grazing values represented therange-condition score for the HVU. Theoretically, the maxi-mum range-condition score for any site was 1 000. This wasobtained when all (100%) the recorded plant species in a givenplant community were classified as belonging to Class 1, with aweighted grazing value constant out of 10. Therefore, the range-condition score would be 100310¼1 000. The range conditionwas broadly interpreted as follows: excellent when the range-condition index was . 80%, good when 60–80%, moderate topoor when 40–59%, and extremely poor when , 40%.
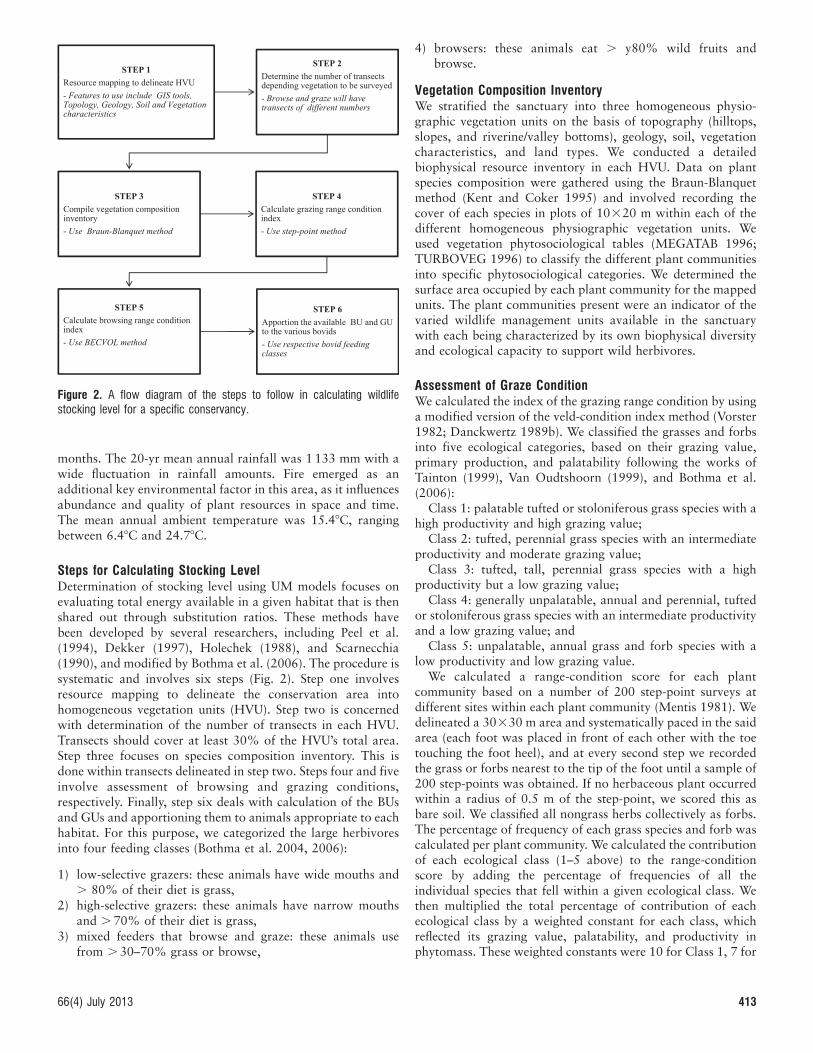
Assessment of Browse ConditionThe standing browse included all the leaves, twigs, bark,flowers, and fruit that may be eaten by browsers, provided itwas within feeding reach of a given type of browser. The heightup to which the standing browse was calculated depended onthe types of browser species. The sanctuary was too small tokeep elephants (Loxodonta africana) and too steep for giraffes(Giraffa camelopardalis). Therefore the browse height wasrestricted to 2.0 m, since browse above this height is notavailable to other large browsers. We used BECVOL techniqueof Smit (1996) to determine the standing browse in each HVU.This method was based on the relationship between the spatialvolume of a tree and its actual leaf mass. We surveyed twotransects, each 2.5m3100 m in each HVU and identified all thewoody plants and recorded their maximum canopy diameter intwo directions perpendicular to each other on a horizontalplane, height, height above the ground of the maximum canopydiameter, height and diameter of the lowest leaf material, andbase stem diameter just above the basal swelling (Fig. 3).
Data AnalysisThe base information we used was 1) the surface area (ha)covered by each HVU in the TWS, 2) the range condition indexof each HVU, 3) the percentage of canopy cover of the grasslayer for each HVU (because the ecological grazing capacity ina savannah is influenced by its degree of openness based on theknown relationship between grass production and tree density;Richter et al. 2001), 4) a fire factor for each plant community(0.8–1.0, with 0.8 indicating recent fire and 1.0 indicating norecent fire), 5) the annual rainfall (in mm), and 6) a topographyindex of accessibility (0.1–1.0, with 0.1¼inaccessible and1.0¼all of the terrain accessible to plains wildlife). Weexcluded unsuitable surface areas such as steep slopes andlarge bodies of water from the calculations for each plantcommunity.
Determination of Ecological Grazing Capacity. To determine theGU as an index of the capacity of a plant community to supportwild grazing herbivores in TWS, we used the followingequation that was based on plant ecological work byDanckwertz (1989a, 1989b); Smit (1996); Dekker (1997);and Van Rooyen (2002a, 2002b):
GU � 100 ha�1 ¼ 0:547�
cþ ðr� RÞ0:23�
afðlog10g� 1Þ�0:4h i
1½ �
where c¼range condition index; r¼mean annual rainfall (mm)over the past 2 yr at the TWS; R¼1 224 as mean annual rainfall(mm) for TWS over the past 10 or more years; a¼topographyindex of accessibility, the degree of accessibility of the habitatto plains wildlife on a scale of 0.1 to 1.0, with 1.0 as fullyaccessible; f ¼ fire factor on a scale of 0.8 to 1.0, with 0.8 asrecent fire and 1.0 as the absence of fire; andg¼ percentage ofgrass cover.
This equation (Equation 1) incorporated range condition,difference between the mean (r) recent annual rainfall for thesanctuary measured over the previous 2 yr and the long-termannual rainfall of TWS (R) represented by average rainfall inthe previous 10 or more years, a topography index of habitataccessibility, the influence of fire on plant production, and thepercentage of grass cover.
Determination of Ecological Browsing Capacity. To determinethe capacity of each HVU to support wild browsing herbivores,we calculated the amount of browse that was available to thebrowsers in each plant community. The data analysis was donewith the BECVOL computer program (Smit 1996); althoughother approaches such as that of Melville et al. (1999) couldalso be used. In this study, we calculated the leaf volume foreach woody plant at the specific height of the vegetation thatcould be consumed by the wild herbivores present andexpressed in tree equivalents (TE) per hectare (TE � ha�1).
Browsers in Africa are seldom able to actually use . 10% ofthe standing plant biomass in any area (Owen and Wiegert1967; Von Holdt 1999). In fact, feeding studies that have beendone in various regions of Africa indicate that this percentageoften was , 10%. Studies in the southern Kalahari region(Kruger 1994) and the Kwa Zulu-Natal province of South
Figure 3. Schematic diagrams for the biomass estimates from canopyvolume model inputs (Smit 1996) used in determining browse availability inTindress Wildlife Sanctuary in September 2007. Input variables included thefollowing:A, tree height; B, tree height at maximum canopy diameter; C, treeheight at minimum canopy diameter; D, maximum canopy diameter atheight B section X�X (D1þD2);and E, base canopy diameter at height Csection Y�Y (E1þE2)
414 Rangeland Ecology & Management
Africa (Emslie and Adcock 1994) and in the central Kenyan
highlands (Von Holdt 1999) have all revealed that the browsing
capacity should be calculated by using , 10% of the standing
browse. In this study, we used 2.5% of the standing browse
since the bushes were very thick. A greater kudu weighs 140 kg
and would require an estimated 30 000 browse-tree equivalents
per year for its sustenance. This was taken as equivalent to 1
BU. The ecological browsing capacity was obtained by dividing
the available tree equivalent value by 30 000 because that is the
amount of browse that was required by 1 BU � yr�1 (Botha
1999).
Apportioning Animal Units among the Large Wild HerbivoresWe calculated the total GUs and BUs and apportioned them
among the various wild large herbivores considered suitable for
the habitats occurring in TWS. Most of these herbivores were
mixed feeders. Therefore, to set stocking densities for each type
of herbivore, the percentage of grazing and browsing in its diet
was calculated and the GU and BU equivalents based on the
relevant diets evaluated. The calculated conversion factor for
each type of wildlife to convert to a GU � animal�1 and
BU � animal�1 was based on the relative metabolic (body) mass
of each type of animal (Meissner 1982; Van Rooyen 2002a,
2002b). For example, if a stocking density of 137 Burchell’s
zebras (Equus burchelli) with a diet of 93% grass was
recommended, the grazing component of these 137 zebras
would convert to 137 93%¼127.4 grazing animals of the size
of a Burchell’s zebra. The conversion factor for grazers, taking
a Burchell’s zebra as an example, was calculated as follows:
Burchell’s zebra ¼ ðmean mass of a Burchell’s zebra in kgÞ0:75
ðmean mass of 1 GU in kgÞ0:75
2½ �
For the Burchell’s zebra the GU per animal was 2600.75/
1800.75¼1.32 GU � animal�1 (Equation 2). Consequently, 127.4
animals of the size of a Burchell’s zebra were equivalent to
127.431.32 GU¼168 blue wildebeests.
The browsing component in the diet of a Burchell’s zebra
was calculated in a similar way. For example, the diet of a
Burchell’s zebra contains 7% browse. Therefore, the recom-
mended 137 Burchell’s zebras were equivalent to
13737%¼9.6 browsing animals of the size of a Burchell’s
zebra. The conversion factor for browsers, taking a Burchell’s
zebra as an example, was calculated as follows:
Burchell’s zebra ¼ ðmean mass of a Burchell’s zebra in kgÞ0:75
ðmean mass of 1 BU in kgÞ0:75
3½ �
Therefore, for the Burchell’s zebra the BU/animal was
2600.75/l400.75¼1.59 BU � animal�1 (Equation 3). Therefore,
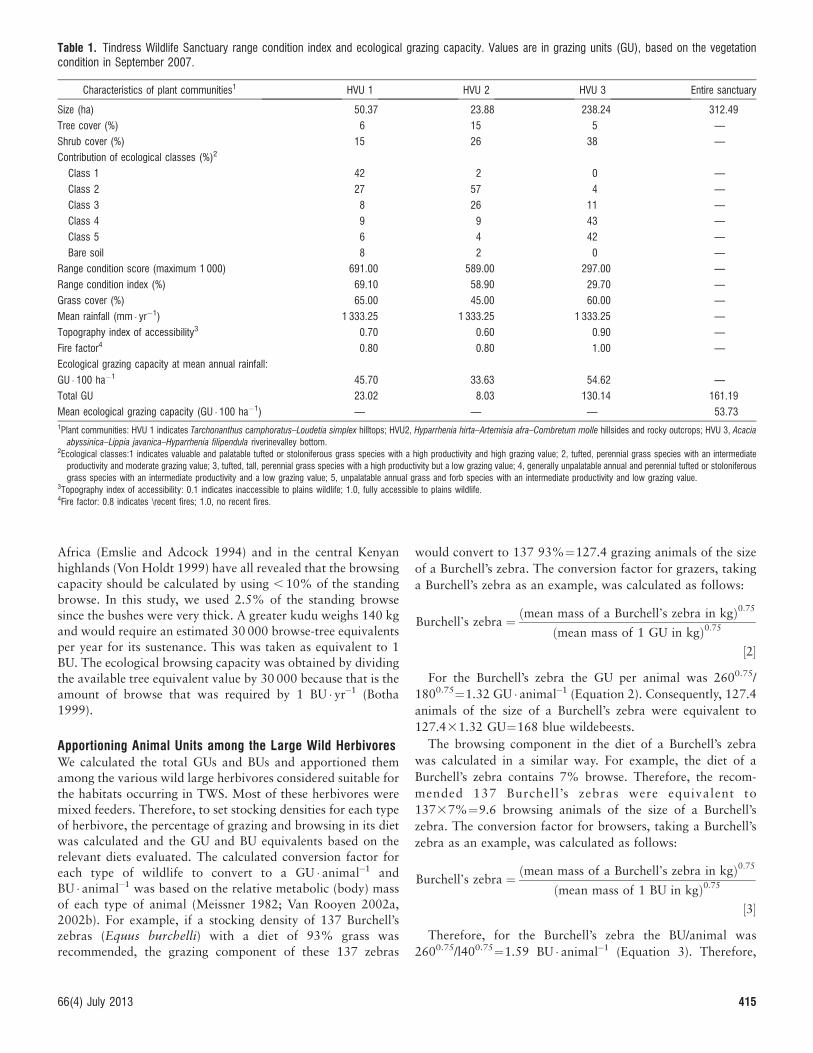
Table 1. Tindress Wildlife Sanctuary range condition index and ecological grazing capacity. Values are in grazing units (GU), based on the vegetationcondition in September 2007.
Characteristics of plant communities1 HVU 1 HVU 2 HVU 3 Entire sanctuary
Size (ha) 50.37 23.88 238.24 312.49
Tree cover (%) 6 15 5 —
Shrub cover (%) 15 26 38 —
Contribution of ecological classes (%)2
Class 1 42 2 0 —
Class 2 27 57 4 —
Class 3 8 26 11 —
Class 4 9 9 43 —
Class 5 6 4 42 —
Bare soil 8 2 0 —
Range condition score (maximum 1 000) 691.00 589.00 297.00 —
Range condition index (%) 69.10 58.90 29.70 —
Grass cover (%) 65.00 45.00 60.00 —
Mean rainfall (mm � yr�1) 1 333.25 1 333.25 1 333.25 —
Topography index of accessibility3 0.70 0.60 0.90 —
Fire factor4 0.80 0.80 1.00 —
Ecological grazing capacity at mean annual rainfall:
GU � 100 ha�1 45.70 33.63 54.62 —
Total GU 23.02 8.03 130.14 161.19
Mean ecological grazing capacity (GU � 100 ha�1) — — — 53.731Plant communities: HVU 1 indicates Tarchonanthus camphoratus–Loudetia simplex hilltops; HVU2, Hyparrhenia hirta–Artemisia afra–Combretum molle hillsides and rocky outcrops; HVU 3, Acacia
abyssinica–Lippia javanica–Hyparrhenia filipendula riverinevalley bottom.2Ecological classes:1 indicates valuable and palatable tufted or stoloniferous grass species with a high productivity and high grazing value; 2, tufted, perennial grass species with an intermediate
productivity and moderate grazing value; 3, tufted, tall, perennial grass species with a high productivity but a low grazing value; 4, generally unpalatable annual and perennial tufted or stoloniferousgrass species with an intermediate productivity and a low grazing value; 5, unpalatable annual grass and forb species with an intermediate productivity and low grazing value.
3Topography index of accessibility: 0.1 indicates inaccessible to plains wildlife; 1.0, fully accessible to plains wildlife.4Fire factor: 0.8 indicates \recent fires; 1.0, no recent fires.
66(4) July 2013 415
9.6 animals of the size of a Burchell’s zebra were equivalent to
9.631.59 BU¼15 greater kudus.
RESULTS
Resource MappingWe identified and described three HVUs (Table 1): 1)
Tarchonanthus camphoratus–Loudetia simplex hilltops (50.37
ha), 2) Hyparrhenia hirta–Artemisia afra–hillsides and rocky
outcrops (23.88 ha), and 3) Acacia abyssinica–Lippia javanica–Hyparrhenia filipendula riverine/valley bottom (238.24 ha).
The range-condition index of each of these HVUs varied from
69.1% in the hilltops to 29.7% in the riverine/valley bottoms,
indicating that the hilltops were in good range condition, while
the Riverine/Valley Bottoms were in poor condition (Table 1).
Designed Ecological Grazing CapacityFor each community the ecological grazing capacity was
calculated as GU � 100 ha�1. For example, the range condition
index of 69.1% for hilltops indicated a range in a good
condition. This community had a grass cover of 65%, had a
high degree of accessibility to the herbivores, had experienced a
recent fire event, and had a mean annual rainfall of 1 333
mm � yr�1. Its ecological grazing capacity was 45.7 GU � 100
ha�1. Consequently, the 50.37 ha covered by this plantcommunity could support 0.504345.7¼23.03 GU. The entireranch could support 169.19 GU (Table 1), giving a meanecological grazing capacity of 53.73 GU � 100 ha�1.
Designed Ecological Browsing CapacityThe standing available browse was 16 014 TE � ha�1 in thehilltops HVU, 73 112 TE � ha�1 in the hillside HVU, and104 058 TE � ha�1 in the riverine/valley bottom HVU up to aheight of 2 m. A kudu weighing 140 kg and requiring 30 000browse tree equivalent per year is equal to 1 BU � yr�1. Hencedividing the TE in each HVU by the 30 000 and multiplying theresults by the HVU’s area gave the total of 1 519 BU. Theecological browsing capacity of the Sanctuary was therefore342.09 BU � 100 ha�1.
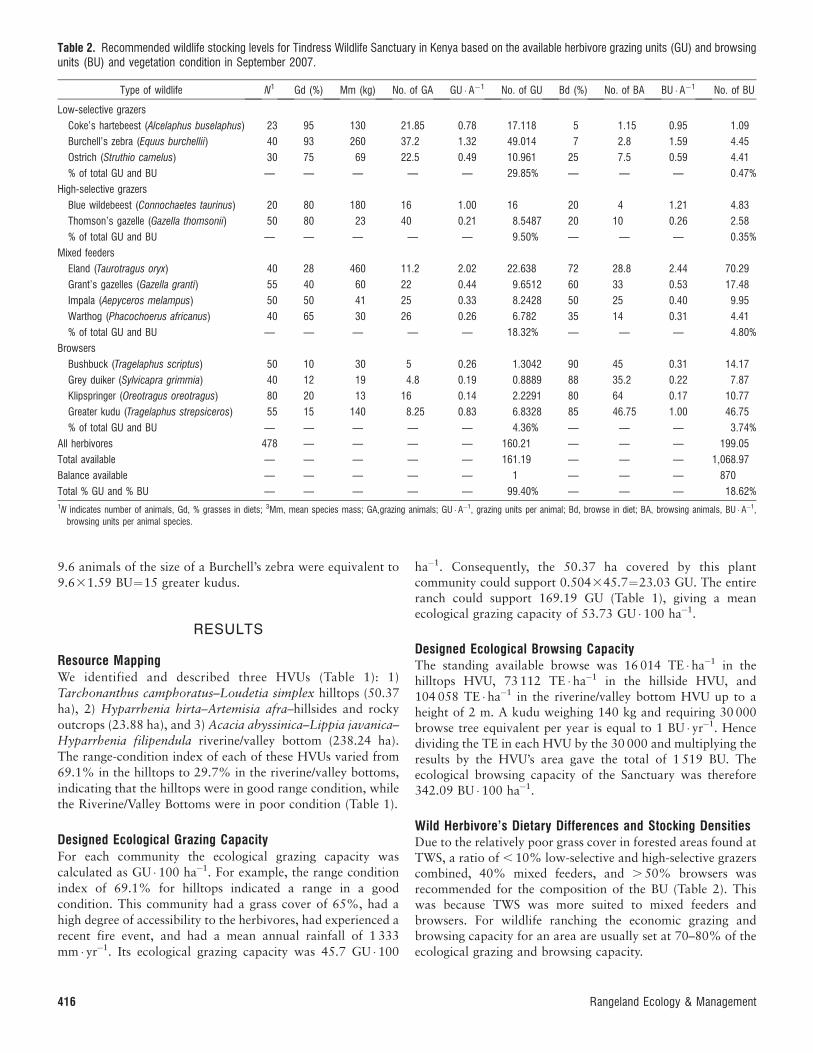
Wild Herbivore’s Dietary Differences and Stocking DensitiesDue to the relatively poor grass cover in forested areas found atTWS, a ratio of , 10% low-selective and high-selective grazerscombined, 40% mixed feeders, and . 50% browsers wasrecommended for the composition of the BU (Table 2). Thiswas because TWS was more suited to mixed feeders andbrowsers. For wildlife ranching the economic grazing andbrowsing capacity for an area are usually set at 70–80% of theecological grazing and browsing capacity.
Table 2. Recommended wildlife stocking levels for Tindress Wildlife Sanctuary in Kenya based on the available herbivore grazing units (GU) and browsingunits (BU) and vegetation condition in September 2007.
Type of wildlife N1 Gd (%) Mm (kg) No. of GA GU �A�1 No. of GU Bd (%) No. of BA BU �A�1 No. of BU
Low-selective grazers
Coke’s hartebeest (Alcelaphus buselaphus) 23 95 130 21.85 0.78 17.118 5 1.15 0.95 1.09
Burchell’s zebra (Equus burchellii) 40 93 260 37.2 1.32 49.014 7 2.8 1.59 4.45
Ostrich (Struthio camelus) 30 75 69 22.5 0.49 10.961 25 7.5 0.59 4.41
% of total GU and BU — — — — — 29.85% — — — 0.47%
High-selective grazers
Blue wildebeest (Connochaetes taurinus) 20 80 180 16 1.00 16 20 4 1.21 4.83
Thomson’s gazelle (Gazella thomsonii) 50 80 23 40 0.21 8.5487 20 10 0.26 2.58
% of total GU and BU — — — — — 9.50% — — — 0.35%
Mixed feeders
Eland (Taurotragus oryx) 40 28 460 11.2 2.02 22.638 72 28.8 2.44 70.29
Grant’s gazelles (Gazella granti) 55 40 60 22 0.44 9.6512 60 33 0.53 17.48
Impala (Aepyceros melampus) 50 50 41 25 0.33 8.2428 50 25 0.40 9.95
Warthog (Phacochoerus africanus) 40 65 30 26 0.26 6.782 35 14 0.31 4.41
% of total GU and BU — — — — — 18.32% — — — 4.80%
Browsers
Bushbuck (Tragelaphus scriptus) 50 10 30 5 0.26 1.3042 90 45 0.31 14.17
Grey duiker (Sylvicapra grimmia) 40 12 19 4.8 0.19 0.8889 88 35.2 0.22 7.87
Klipspringer (Oreotragus oreotragus) 80 20 13 16 0.14 2.2291 80 64 0.17 10.77
Greater kudu (Tragelaphus strepsiceros) 55 15 140 8.25 0.83 6.8328 85 46.75 1.00 46.75
% of total GU and BU — — — — — 4.36% — — — 3.74%
All herbivores 478 — — — — 160.21 — — — 199.05
Total available — — — — — 161.19 — — — 1,068.97
Balance available — — — — — 1 — — — 870
Total % GU and % BU — — — — — 99.40% — — — 18.62%1N indicates number of animals, Gd, % grasses in diets; 3Mm, mean species mass; GA,grazing animals; GU � A�1, grazing units per animal; Bd, browse in diet; BA, browsing animals, BU �A�1,
browsing units per animal species.
416 Rangeland Ecology & Management
DISCUSSION
The UM model used in this study has been extensively used inSouth Africa (Peel et al. 1994; Van Rooyen et al. 1994; Smit1996; Dekker 1997; Van Rooyen 2002a; Bothma et al. 2006).Similar livestock substitution ratio models were used inestimating livestock carrying capacities in Australia (John-ston and Garrad 1999), and in the United States (Holechek1988) where dry sheep equivalents were used as standardunits to estimate livestock stocking levels. Although theirapproach is more objective than the FIMs, they are limited inthat they focus only on grazing livestock of extremely lowspecies diversity. Bothma et al. (2006) expanded thisapproach by separating the grazing and browsing dietarycomponents and apportioning the various wildlife speciesbased on their foraging patterns. The stocking densitiescalculated using these approaches was more logical andobjective and the diversity in the vegetation resources wasused optimally.
The recommended stocking density of 160.21 GU and199.05 BU for the ranch is only an approximation, and thecurrent rainfall, range condition, and physical condition of theanimals must be monitored to make final adjustments throughactive adaptive management. This should be repeated everyyear. TWS is a rather small area that is completely enclosed. Astatic model to determine stocking density is more accurate inlarge, open environments where wildlife can move aroundfreely to exploit localized patches of herbage productionopportunistically. On smaller, enclosed wildlife ranches andnature reserves, this approach becomes impracticable. Conse-quently, the stocking densities must be adaptable and based onthe quantity and quality of plant food resources available in agiven place at a given time. Therefore stocking levels should beset at 70–80% of the calculated total potential (Table 2) toallow for optimal utilization of favorable conditions andavoidance of hazards such as drought mortalities duringunfavorable conditions. In such a way, a management programcould be developed for sustainable use of the renewable naturalresources. Naturally, it would require regular monitoring ofrainfall, fire, and vegetation resources.
We deliberately used only 18.6% of the available BU sinceTWS is a water catchment area for human use and its betterunderstocked to avoid erosion. The final choice of the types ofwildlife also can be varied depending on the preferences andobjectives of the TWS. Any overstocking detected in future onthe sanctuary can be rectified by harvesting wildlife selectivelywithout disturbing the ratio of the different feeding classes.Water supply is a major constraint in the hilltops HVU; TWSshould improve water supply in this area for wildlife use.
MANAGEMENT IMPLICATIONS
Currently, a key challenge to wildlife conservation in Kenya isthe rapid conversion of marginal wildlife habitat lands tohuman settlement (Akama 1998). The displaced wildlifeeventually dies, moves, or is moved to other conservationsystems. The process of designing and designating a wildlifeconservancy requires licensing from Kenya Wildlife Services.Among the prerequisites for licensing is a management plan
that clearly shows the types and number of wildlife species aspecific area is able to hold. This study has applied guidelinesused elsewhere (Holechek 1988; Peel et al. 1994; Dekker 1997;Scarnecchia 1990; Bothma et al. 2006) to a Kenyan study andcan be used to determine the species types and numbers aconservancy can stock. The vegetation composition willdetermine the types of animal species a conservancy can keep,based on their feeding strategies. The available GUs and BUsand the rainfall regimes will determine the number of animalsthat can be stocked. This procedure allows for adaptivemanagement as more knowledge about a specific conservancybecomes available with time (Bothma et al. 2004, 2006). Thisprocedure is also very useful in places were consumptivewildlife utilization is allowed. A farmer, rancher, or wildlifeconservator will even be able to project the return oninvestments the wildlife resource is likely to yield. Therefore,validating these methods and making them available to widerrange of users is very useful in the management of wildlife inKenya.
ACKNOWLEDGMENTS
We wish to acknowledge Mr Robert Nesta, Ms Fiona Nelima, and Dr
Charles Musyoki for reviewing various drafts of this paper. We sincerely
thank them all.
LITERATURE CITED
AKAMA, J. S. 1998. The evolution of wildlife conservation policies in Kenya. Journal of
Third World Studies 15:103–117.BOTHA, J. O. 1999. A resource management plan for the Lewa Wildlife Conservancy in
the Meru District of the central Kenyan highlands [dissertation]. Pretoria, SouthAfrica: Centre for Wildlife Management, University of Pretoria. 282 p.
BOTHMA, J. DU P. 2002. Game ranch management. 4th ed. Pretoria, South Africa: VanSchaik. 459 p.
BOTHMA, J. DU. P., N. VAN ROOYEN, AND M. W. VAN ROOYEN. 2004. Using diet and plantresources to set wildlife stocking densities in African savannas. The Wildlife
Society Bulletin 32:840–851.
BOTHMA, J. DU P., N. VAN ROOYEN, AND M. W. VAN ROOYEN. 2006. Using diet and plantresources to set wildlife stocking densities in African savannas. The Wildlife
Society Bulletin 32–34:840–851.
DANCKWERTZ, J. E. 1989a. Animal performance. In: J. E. Danckwertz and W. R. Teague[EDS.]. Veld management in the Eastern Cape. Pretoria, South Africa: Departmentof Agriculture and Water Supply, Government Printer. p. 47–60.
DANCKWERTZ, J. E. 1989b. Management of veld types. In: J. E. Danckwertz and W. R.Teague [EDS.]. Veld management in the Eastern Cape. Pretoria, South Africa:Department of Agriculture and Water Supply, Government Printer. p. 140–149.
DEKKER, B. 1997. Calculating stocking rates for game ranches: substitution ratios foruse in the Mopani veld. African Journal of Range and Forage Science 14:62–67.
DELANY, M. J., AND D. C. D. HAPPOLD. 1979. Ecology of African land mammals. London,UK: Longman. 704 p.
DHONDT, A. A. 1989. Carrying capacity: a confusing concept. Acta Gecologia,
Gecologica Generalis. 9:337–346.
EMSLIE, R. H., AND K. ADCOCK. 1994. Feeding ecology of black rhinoceros. In: B. L.Penzhorn and N. P. J. Kriek [EDS.]. Rhinos as game ranch animals.Onderstepoort, South Africa: The Wildlife Group, South African VeterinaryAssociation. p. 65–81.
GEORGIADIS, N., M. HACK, AND K. TURPIN. 2003. The influence of rainfall on zebrapopulation dynamics: implications for management. Journal of Applied Ecology
40:125–136.
66(4) July 2013 417
HOLECHEK, J. L. 1983. Considerations concerning grazing systems. Rangelands
5:208–211.HOLECHEK, J. L. 1988. An approach for setting the stocking rate. Rangelands 10:10–
14.HOLECHEK, J. L., R. D. PIEPER, AND C. H. HERBEL. 1989. Range management. Englewood
Cliffs, NJ, USA: Prentice-Hall, Inc. 587 p.JAMBIYA, G., S. A. H. MILLEDGE, AND N. MTANGO. 2007. ‘Night time spinach’: conservation
and livelihood implications of wild meat use in refugee situations in north-westernTanzania. Dar es Salaam, Tanzania: TRAFFIC East/Southern Africa. 60 p.
JOHNSTON, P. W., AND S. W. GARRAD. 1999. Estimating livestock carrying capacities insouth-west Queensland, Australia. In: Proceedings of the International RangelandCongress; 19–23 July 1999; Townsville, QLD, Australia. Townsville, QLD,Australia: Congress Organizing Committee. Volume 2. p. 861–863.
KAMWEYA, A. M., S. M. NGENE, AND S. M. MUYA. 2012. Occurrence and level of elephantdamage to farms adjacent to Mount Kenya forests: implications for conservation.Journal of Biology, Agriculture and Healthcare 2:41–54.
KENT, M., AND P. COKER. 1995. Vegetation description and analysis. New York, NY,USA: John Wiley and Sons. 405 p.
KRUGER, J. W. 1994. The feeding ecology and behaviour of reintroduced giraffe(Giraffa camelopardalis) in the Kalahari Gemsbok National Park [MScdissertation]. Pretoria, South Africa: University of Pretoria. 175 p.
[KSS] KENYA SOIL SURVEY. 1982. Exploratory soil map and agro-climatic zone map ofKenya, 1980: scale 1:1,000,000. In: W. G. Sombroek, H. M. H. Braun, and B. J.A. Van der Pouw [EDS.]. Kenya soil map. National Agricultural Laboratories.Nairobi, Kenya: Kenya Soil Survey. 55 p.
MEGATAB: A VISUAL EDITOR FOR SOCIOLOGICAL TABLES [computer program]. 1996.Giessen, Germany: Ulft.
MELVILLE, H. I., A. S. CAULDWELL, AND J. DU R. BOTHMA. 1999. A comparison of twotechniques for estimating tree canopy volume. South African Journal of Wildlife
Research 29:1–5.MENTIS, M. 1981. An evaluation of the wheel-point and step-point methods of veld
condition assessments. Proceedings of the Grassland Society of Southern Africa
16:89–94.NGUNJIRI, P. 1997. Environment—Kenya: making wildlife pay. Available at: http://
www.ips.fi/koulut/199751/12.htm. Accessed 13 June 2013.OWEN, D. F., AND R. G. WIEGERT. 1967. Do consumers maximise plant fitness? Oikos
27:488–492.PEEL, M. J., C. PAUW, AND D. D. SNYMAN. 1994. The concept of grazer and browser
animal units for African savannah areas. Bulletin of the Grassland Society of
Southern Africa 5:61.
PRATT, D. J., J. R. BLACKIE, AND M. D. GWYNNE. 1977. Rangeland management andecology in East Africa. London, UK: Hodder and Stoughton Publishers. 310 p.
RICHTER, C. G., F. H. A. SNYMAN, AND G. N. SMIT. 2001. The influence of tree density onthe grass layer of three semi-arid savannah types in southern Africa. African
Journal of Range and Forage Science 18:103–109.SCARNECCHIA, D. L. 1990 Concepts of carrying capacity and substitution ratios: a
systems viewpoint. Journal of Range Management 43:553–555.SMIT, G. N. 1996. BECVOL: biomass estimates from canopy volume (version 2)—
user’s guide. Bloemfontein, South Africa: University of the Free State. 33 p.
SOCIETY FOR RANGE MANAGEMENT. 1989. A glossary of terms used in range management.Denver, CO, USA: Society for Range Management. 20 p.
TAINTON, N. M. [ED.]. 1999. Veld management in South Africa. Pietermaritzburg, SouthAfrica: University of Natal Press. 472 p.
TURBOVEG: SOFTWARE PACKAGE FOR INPUT, PROCESSING AND PRESENTATION OF PHYTOSOCIOLOG-
ICAL DATA [computer program]. 1996. Lancaster, UK: University of Lancaster.
VAN OUDTSHOORN, F. 1999. Guide to grasses of southern Africa. Pretoria, South Africa:Briza. 288 p.
VAN ROOYEN, N. 2002a. Veld management in the savannas. In: J. du P. Bothma [ED.].Game ranch management. 4th edition. Pretoria, South Africa: Van Schaik. p.571–617.
VAN ROOYEN, N. 2002b. Veld condition assessment and stocking a game ranch. In:
B. L. Penzhorn [ED.]. Proceedings of a Symposium on Game Ranch Planning andManagement; 1–2 November 2002; Onderstepoort, South Africa. Onderstepoort,South Africa: The Wildlife Group, South African Veterinary Association. p. 41–51.
VAN ROOYEN, N., G. J. BREDENKAMP, O. K. THERON, J. DU P. BOTHMA, AND E. A. N. LE RICHE.1994. Vegetational gradients around artificial watering points in the KalahariGemsbok National Park. Journal of Arid Environments 26:349–361.
VON HOLDT, A. L. 1999. Ecological separation by browsers on the Lewa WildlifeConservancy, Kenya [MSc dissertation]. Pretoria, South Africa: University ofPretoria. 194 p.
VORSTER, M. 1982. The development of the ecological index method for assessingrange condition in the Karoo. Proceedings of the Grassland Society of Southern
Africa 17:84–89.WATSON, R., K. H. FITZGERALD, AND N. GITAHI. 2010. Expanding options for habitat
conservation outside protected areas in Kenya: the use of environmentaleasements. African Wildlife Foundation Technical Papers Number 2. Available at:http://www.awf.org/sites/default/files/media/Resources/Books%20and%20Papers/AWF_Env_Easement_Technical_Paper_2_March_2010.pdf. Accessed 13 June2013.
418 Rangeland Ecology & Management
Related Documents