ABSTRACT In this paper we propose a technique for detecting under utilized resources (less than 70% memory utilization) due to memory bound processes by passively monitoring network traffic produced by the resource. To our knowledge, this is the first approach of its kind. One application of this technique is dynamic resource discovery (detection of resources with under utilized memory) in a High Performance Desktop or Cluster Grid computing environment confined to a low latency Local Area Network (LAN). Our method removes the need to communicate directly with resources to determine if their memory is under utilized, thus reducing traffic on the network. This is very important in a High Performance computing environment since data or computational intensive applications may be present. The proposed method creates a delay sensitive profile generated by the analysis of monitored network traffic due to High Performance UDP based services such as file transfer applications (FOBS, Tsunami, UDT, SABUL, etc.), message passing platforms (MPICH-G2/Score, etc.), and many more. An energy value is derived from the delay sensitive profile, which represents the state (over utilized memory or under utilized memory) of the resource of interest. Then a simple threshold is applied to the energy value to identify the state of the resource. Several scenarios have been investigated to determine the feasibility of the proposed technique. Results suggest that the proposed technique can use network traffic to extract delays associated with a resources’ memory utilization and accurately determine the state of the resource. Keywords grid computing, resource discovery, wavelet transform. 1. INTRODUCTION A local cluster is a collection of independent and cheap machines used together as a supercomputer to provide a solution [18]. In practice, this is implemented by applying grid middleware to clusters of local computers to form a high performance platform for distributed applications or simply a local Cluster Grid. Similarly, a local Desktop Grid harvests the idle computing resources of local desktop PCs [19]. Both local Cluster Grids and local Desktop Grids are viable tools for complex science and engineering related applications. In such environments fast communication mechanisms are absolutely necessary, especially if data intensive applications are used [21],[22]. Also, under utilized resources must be quickly found. In general, Grid systems coordinate non-centralized resources, use standard, open, general purpose protocols (UDP, TCP, ICMP, etc.), and deliver qualities of service on a very large scale [1]. The coordination of these non- centralized resources is one of the major challenges that Grid networks face. For these reasons resource discovery is a non-trivial problem. Resource discovery can be defined as the systematic process of determining which grid resource is the best candidate to complete a job in the shortest amount of time with the most efficient use of available resources [3]. For Grids that service memory bound processes (such as permutation multiplication, matrix multiplication, sorting, etc.) [23], dynamic resource discovery has the critical job of quickly finding under utilized resources; otherwise the overall throughput of the grid is decreased due to submitting jobs to over utilized resources. In this paper we focus on resource discovery in High Performance Cluster environments confined to low latency LANs that heavily utilize UDP for different services. One such service is file transfer via FOBS, Tsunami, UDT, SABUL, etc. [21]. Another is message passing via MPICH-G2/Score [24]. Specifically, this method passively detects under utilized resources. Throughout the rest of this paper, under utilized resources will be defined as nodes with less than 70% memory utilization, and conversely, over utilized resources will be defined as nodes with 70% or more memory utilization. As a direct result of the above mentioned Using Network Traffic to Passively Detect Under Utilized Resources in High Performance Cluster Grid Computing Environments Lanier Watkins Department of Computer Science Georgia State University Atlanta, GA USA [email protected] Raheem Beyah Department of Computer Science Georgia State University Atlanta, GA USA [email protected] Cherita Corbett Sandia National Laboratories Livermore, CA USA [email protected] GridNets 2007, October 17-19, 2007, Lyon, France. Copyright 2007 ICST 978-963-9799-07-3

Welcome message from author
This document is posted to help you gain knowledge. Please leave a comment to let me know what you think about it! Share it to your friends and learn new things together.
Transcript
ABSTRACT In this paper we propose a technique for detecting under utilized resources (less than 70% memory utilization) due to memory bound processes by passively monitoring network traffic produced by the resource. To our knowledge, this is the first approach of its kind. One application of this technique is dynamic resource discovery (detection of resources with under utilized memory) in a High Performance Desktop or Cluster Grid computing environment confined to a low latency Local Area Network (LAN). Our method removes the need to communicate directly with resources to determine if their memory is under utilized, thus reducing traffic on the network. This is very important in a High Performance computing environment since data or computational intensive applications may be present. The proposed method creates a delay sensitive profile generated by the analysis of monitored network traffic due to High Performance UDP based services such as file transfer applications (FOBS, Tsunami, UDT, SABUL, etc.), message passing platforms (MPICH-G2/Score, etc.), and many more. An energy value is derived from the delay sensitive profile, which represents the state (over utilized memory or under utilized memory) of the resource of interest. Then a simple threshold is applied to the energy value to identify the state of the resource. Several scenarios have been investigated to determine the feasibility of the proposed technique. Results suggest that the proposed technique can use network traffic to extract delays associated with a resources’ memory utilization and accurately determine the state of the resource.
Keywords grid computing, resource discovery, wavelet transform.
1. INTRODUCTION A local cluster is a collection of independent and cheap
machines used together as a supercomputer to provide a solution [18]. In practice, this is implemented by applying grid middleware to clusters of local computers to form a high performance platform for distributed applications or simply a local Cluster Grid. Similarly, a local Desktop Grid harvests the idle computing resources of local desktop PCs [19]. Both local Cluster Grids and local Desktop Grids are viable tools for complex science and engineering related applications. In such environments fast communication mechanisms are absolutely necessary, especially if data intensive applications are used [21],[22]. Also, under utilized resources must be quickly found. In general, Grid systems coordinate non-centralized resources, use standard, open, general purpose protocols (UDP, TCP, ICMP, etc.), and deliver qualities of service on a very large scale [1]. The coordination of these non-centralized resources is one of the major challenges that Grid networks face. For these reasons resource discovery is a non-trivial problem. Resource discovery can be defined as the systematic process of determining which grid resource is the best candidate to complete a job in the shortest amount of time with the most efficient use of available resources [3]. For Grids that service memory bound processes (such as permutation multiplication, matrix multiplication, sorting, etc.) [23], dynamic resource discovery has the critical job of quickly finding under utilized resources; otherwise the overall throughput of the grid is decreased due to submitting jobs to over utilized resources.
In this paper we focus on resource discovery in High Performance Cluster environments confined to low latency LANs that heavily utilize UDP for different services. One such service is file transfer via FOBS, Tsunami, UDT, SABUL, etc. [21]. Another is message passing via MPICH-G2/Score [24]. Specifically, this method passively detects under utilized resources. Throughout the rest of this paper, under utilized resources will be defined as nodes with less than 70% memory utilization, and conversely, over utilized resources will be defined as nodes with 70% or more memory utilization. As a direct result of the above mentioned
Using Network Traffic to Passively Detect Under Utilized Resources in High
Performance Cluster Grid Computing Environments
Lanier Watkins Department of Computer Science
Georgia State University Atlanta, GA USA
Raheem Beyah Department of Computer Science
Georgia State University Atlanta, GA USA
Cherita Corbett Sandia National Laboratories
Livermore, CA USA [email protected]
GridNets 2007, October 17-19, 2007, Lyon, France. Copyright 2007 ICST 978-963-9799-07-3
Node 1
64 MB
Monitor Node
100 Mbps Hub
Node 4Node 2
128 MB
Node 3
192 MB
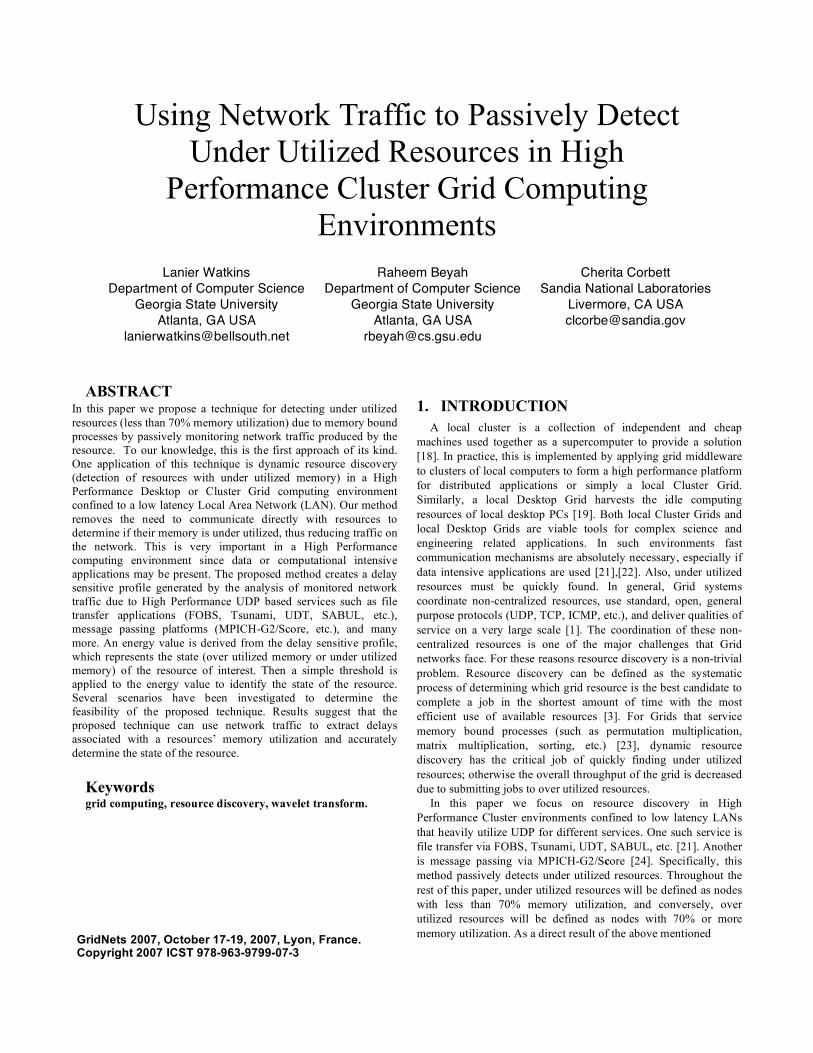
Figure 1. Experimental Setup.
definitions, memory utilization becomes a binary value, either over utilized or under utilized. The main contribution of this technique is its ability to passively distinguish between under utilized and over utilized resources due to memory bound processes by analyzing network traffic generated by the resources. The end result is a reduction of network traffic on the High Performance Cluster Grid.
Normally during resource discovery, a node can be queried directly or a dedicated information server can be queried to determine a node’s resource information [1], in these two models each node has to disseminate its resource information either directly to the requestor or to a collector node that relays the information to a requestor on behalf of each node. Section 2 discusses many proposed methods that attempt to mitigate the impacts to the Cluster Grid network as a result of intrusively determining resource information, but none propose a passive approach, which alleviates the need to probe a node.
If used alone, one of the limitations of this method is that it does not presently provide the same level of details (e.g., number of CPUs, clock speed, available disk space, etc.) about the potential resources as more intrusive resource discovery methods; however, memory utilization information is provided without the overhead of query based network traffic. Also, there is no additional software that needs to be installed on resources to support this method. One apparent use for this technique would be as an enhancement to existing intrusive resource discovery methods. The new hybrid resource discovery method would provide the same level of details about potential resources without having to continuously query resources directly for dynamic resource information (memory utilization).
The remainder of this paper is organized as follows. Section 2 discusses related work. Section 3 is used to provide background on the use of signal processing upon network traffic to solve networking problems. Section 4 explains the experimental setup and the experimental procedure. In Section 5 a closer look is taken at the inner-workings of the node to attempt to characterize the source of the delays that detects the presence of memory utilization. Section 6 presents an introduction to signal processing by using the Discrete Wavelet Transform. Section 7 presents results and discusses the feasibility of the technique. Finally, Section 8 concludes the paper.
2. RELATED WORK A survey of resource discovery algorithms is discussed in [4].
The flooding algorithm, which is similar to the method used by
network routers to advertise routes, assigns to each node a fixed set of neighboring nodes, and each node contacts its fixed set of neighbors and transmits the updates to them. The swamping algorithm is very similar to the flooding algorithm except that each node may open connections with all of their neighbors, not just a fixed set of neighboring nodes. Another algorithm, the random pointer jump algorithm should only be used if there exists a path between every pair of machines. This algorithm mandates that each node contacts a random neighbor and the chosen neighbor then sends resource information to the contacting node. Finally, the name-dropper algorithm works as follows: each node sends information to one, randomly chosen neighbor then every time a pointer jumps, a back edge is added. For example, when node A chooses node B and node B passes to A all of its neighbors, node B also obtains a pointer back to A.
In [2] the proposed resource discovery system is based on the peer-to-peer (P2P) model and provides a complex query interface. It supports rich resource descriptions and complex queries by encoding resources and queries with Resource Description Framework (RDF). To avoid flooding queries to irrelevant nodes, a semantics-based routing scheme is proposed to route queries only to related nodes.
A data dissemination strategy called distinctive awareness is introduced in [5]. In this algorithm, the nodes with distinct attributes are more significant and thus their status information gets propagated accordingly. To implement this algorithm, the concept of Grid Potential is used to encapsulate the relative processing capabilities of different machines and networks that constitute the grid and only data corresponding to nodes with the highest grid potential gets disseminated.
The name-dropper algorithm, the P2P model and the distinctive awareness algorithms are very powerful and feasible resource discovery methods; however, they rely upon direct interaction with nodes or direct communication between nodes to disseminate resource data. This calls for the following complexity, a node or a group of nodes have to be involved in an organized scheme to actively extract resource information from the node in question and pass along that data from one node to the next until this data reaches its destination using the available network bandwidth. The approach detailed in this paper introduces a different type of resource discovery algorithm that is passive in nature; thus no nodes must be probed to obtain resource information. It could be used in conjunction with other more intrusive methods to eliminate the need to continuously probe resources for dynamic resource information (memory utilization).
3. BACKGROUND Signal processing is a key element in this approach; applying
such a technique to network traffic is not a new phenomenon. Previously, this tool has been applied to network traffic to extract valuable information; specifically the Power Spectrum Density (PSD) which is derived from the Fourier Transform and has been used to identify a node’s network card, using passive methods [6]. In [8], the authors identify Denial of Service (DoS) attacks by applying signal processing, namely by observing that the spectral content of network traffic varies directly with the number of

Cloud
Node 2
Node 1
Node 3
Node n
Network Traffic Analysis
(Build Time Series)
Pre-Processing
(Wavelet Transform)
Feature Extraction
(Wavelet Energy)
Detection & Decision
Monitor Node
Figure 2. Passive Resource Characterization Algorithm (PRC). attackers involved in the scenario and exploiting the fact that the frequency range can be used to classify the DoS attacks.
The Fourier Transform and its derivatives are powerful signal processing methods and are well suited for situations where frequency domain analysis is critical; however, the Discrete Wavelet Transform (DWT) is equally as powerful, but is well suited for situations where time domain analysis is critical, which is the case in this paper. The Wavelet Transform has been used in such methods as the analysis of the long-range-dependent phenomenon in Ethernet traffic [9]; and the passive detection of network performance problems by analyzing TCP traffic [10]. None of these methods have devised a scheme to extract internal information about the actual sending node, e.g., memory utilization, etc.
4. EXPERIMENTAL SETUP AND PROCEDURE
4.1 Experimental Setup The experimental setup is composed of five nodes (Figure 1),
four Dell OptiPlex GX1 450 Mhz Pentium III nodes and one Dell OptiPlex GX200 866 Mhz Pentium III node. These nodes are connected via a 100 Mbps Ethernet hub, and they all have 100Mbps Ethernet cards. The GX200 is used strictly as a traffic monitor to capture packets that traverse the network using tcpdump. The remaining four GX1 nodes are used to emulate traffic on a grid network. Nodes 1, 2, and 3 function as source nodes and have identical architectures except for the memory size. Node 1 is configured with 64 MB, node 2 uses 128MB, and node 3 uses 192MB. Node 4 functions as a destination node throughout our experiments; all nodes are installed with Linux Red Hat 7.0.
4.2 Experimental Procedure The purpose of the experiments is to emulate UDP traffic on a
high bandwidth, high performance Cluster Grid network. The network traffic is generated by using the sock program [15] to simulate UDP network traffic at 14 Mbps constant bit rate (CBR). The timestamps captured and stored by the monitor node are used to build a time series that describes the departure times in seconds of the UDP packets from nodes 1, 2 and 3. Section 4.3 describes this algorithm in more detail.
Once the necessary traffic has been observed and the corresponding times series has been created, the next step is to use the Discrete Wavelet Transform (DWT) to create a delay sensitive profile. This delay sensitive profile is composed of the Approximated Coefficients and the Detailed Coefficients; however for this paper the Detailed Coefficients are discarded and only the Approximated Coefficients are used. An energy value is derived from the Approximated Coefficients and a simple threshold is applied to the energy value to determine the state of the resource (memory utilization).
We investigate two scenarios in Section 7.1 and 7.2: The application of the proposed technique to nodes with over utilized memory, and the application of the proposed technique to nodes with under utilized memory. The goal is to establish the method’s ability to discern between the two.
For the first scenario (Section 7.1), we subject nodes 1, 2, and 3 to approximately a 70% memory utilization load by opening multiple X-Windows applications; the memory utilization and minimum CPU utilization is verified via the Linux vmstat command. Meanwhile, the monitor node captures and stores the UDP traffic with corresponding timestamps to a file and the DWT is used to create the delay sensitive profile. This test case is repeated 45 times for each of the three source nodes. For the second scenario (Section 7.2), the same test cases described above were repeated. However, no memory utilization was imposed on the sources. The overall purpose is to show that the method produces and energy value for under utilized nodes that is discernable from the energy vale for over utilized nodes.
4. Passive Resource Characterization Algorithm (PRC)
The diagram in Figure 2 provides a high level flow of the PRC Algorithm. Only the Detection & Decision module of the PRC Algorithm differs for scenario 1 and scenario 2:
Network Traffic Analysis- The tcpdump packet sniffer application is used to capture the network packets produced by the node of interest. The time series is created using the timestamp from each packet that departs the node of interest. The algorithm works with as little as one thousand packets.
Pre-Processing- The wavelet transform separates the time series into Approximated Coefficients and Detailed Coefficients. Together, these two sets of coefficients comprise the delay sensitive profile. The Detailed Coefficients are discarded and only the Approximated Coefficients are used.
Feature Extraction- An energy value is calculated from the Approximated Coefficients. This energy value is used to represent the delay strength of the corresponding time series.
Detection and Decision- In Section 7.1, the PRC algorithm is used along with a simple threshold on the energy value to decide between under utilized and over utilized nodes. The threshold

energy value would be derived by initial calibrations on over utilized resources. In Section 7.2, the PRC algorithm is used along with a simple threshold on the energy value as well, but since all of the trials in this section are under utilized, further analysis is needed to extract useful information. This analysis reveals that the trials for the different memory sizes are somewhat separable. Nodes with more available memory have a smaller energy value than nodes with less available memory. It is also noticed that as the available memory increases it becomes increasingly harder to separate the trials by memory size.
This algorithm can be used to enhance existing intrusive resource discovery algorithms in the following manner: a Dedicated Resource Evaluator (DRE) node containing a hybrid composed of the proposed method and one of the resource discovery methods mentioned in Section 2. DRE could be placed on the mirror port of a switch connected to a local Cluster Grid. Upon the registration of each node on the Grid, static resource information (e.g. number of CPUs, CPU speed, disk space, operating system type, etc.) could be documented for the node. This static resource information need only be documented once. Prior to dynamic resource information (memory utilization) being needed DRE would passively extract resource information from existing network traffic produced by each node on the Grid using the PRC algorithm. As data is analyzed, one Resource Availability Table (RAT) would be computed and continuously updated. Only under utilized nodes would be listed. All other nodes would have been eliminated by the threshold energy value. Whenever nodes on the Grid require grid resources, DRE would be queried and the under utilized resources on the Grid would be made available to the requesting node.
5. COMPUTER ARCHITECTURE DISCUSSION
To better understand the source of the delays induced into the network traffic produced by nodes subjected to CPU utilization, the high level process of creating a packet in a Pentium based architecture is explored. This process involves many internal parts of the node working together; the CPU, the physical memory, the front side bus, the PCI bus, the network card, etc. The operating system along with the CPU creates a buffer descriptor in main memory, which contains the starting memory address and length of the packet that is to be sent. Multiple buffer descriptors are created if the packet consists of multiple discontiguous regions of memory. The operating system along with the CPU then writes to a memory-mapped register on the Network Interface Card (NIC) with information about the new buffer descriptors. This data traverses the front side bus through the Northbridge to the PCI bus. The NIC initiates one or more direct memory access (DMA) transfers to retrieve the descriptors. Then, the NIC initiates one or more DMA transfers to move the actual packet data from the main memory into its transmit buffer using the address and length information in the buffer descriptors. This data again leaves the front side bus, travels through the Northbridge to the PCI bus into the NIC. Finally, the NIC informs the operating system and CPU that the descriptor has been processed. Then the NIC sends the packet out onto the network through its medium access control (MAC) unit [14].
Table 1 was created using average data transfer time, average Table 1. Parameters taking during 45 Trials
standard deviation and data gathered from the /proc/stat and /proc/stat/meminfo files on nodes 1,2 and 3. The average transfer time was calculated by averaging the transfer time of all trials in scenario 2 (Section 7.2), the average standard deviation was calculated by averaging the standard deviation of all trials in scenario 2; and the average CPU, buffering and paged out was calculated by averaging the results of the /proc/stat or /proc/stat/meminfo files for all trials in scenario 2. For the trials in scenario 1 (Section 7.1) the values in Table 1 are increased accordingly since the effect of adding memory utilization is an increase in the parameters listed in Table 1. The data in Table 1 suggests that from the time the node was booted (trials began immediately after node booted) until the end of the last trial, the 64MB node experienced the most paging, buffering and CPU use, mainly because of the use of a larger swap file. On average, the 128MB node experienced the next highest amounts of paging, buffering and CPU use and the 192MB node experienced the least amount of paging, buffering and CPU use. The important thing to note is that these two nodes produced parameters that are close in value. Combined, the process of paging, buffering and CPU use induces very small but detectable delays inversely proportionate to the amount of available memory, and could explain the differences in data transfer times and the differences in the standard deviation of time series for the three nodes in scenario 2. Naturally, increased activity stemming from the above-mentioned processes produces increased traffic on the bus and contention for the bus; also, the use of a swap file adds additional delays. Collectively, these delays contaminate the process of creating and sending a network packet onto the network. These delays form a unique signature relative to the use of available memory by the Linux Memory Manager.
6. SIGNAL PROCESSING Similar to the Fourier Transform, which uses the sine and cosine
functions to express the original signal, the DWT expresses the original signal in terms of the chosen wavelet, and the inverse DWT reproduces the original signal exactly. There are many wavelets in existence and custom wavelets can be created by ensuring that the proposed wavelet meets the admissibility condition [11], which essentially says that the proposed wavelet is of zero mean. The Haar Wavelet is the simplest wavelet, which only calls for the convolution of the original signal with a low pass
64MB 128MB 192MB
Avg. Data Transfer Time (sec) 51.145190 51.144935 51.144924
Avg. Standard Deviation of Time
Series
14.7870508 14.7870478 14.7870429
*Avg. User CPU Utilization (%) 0.0692654 0.0676846 0.0673846 *Avg. Buffering
(K) 2505 2504 2464
*Avg. Paged out 1502 1376 1293
Swap File Large Small Small
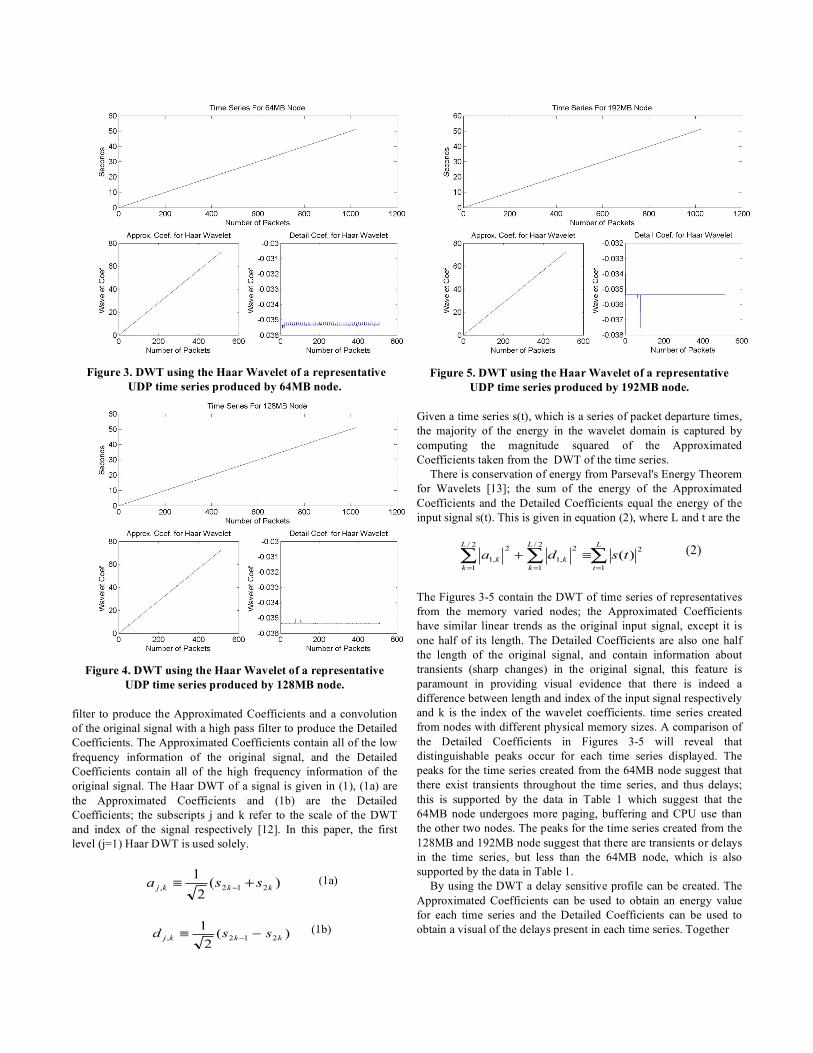
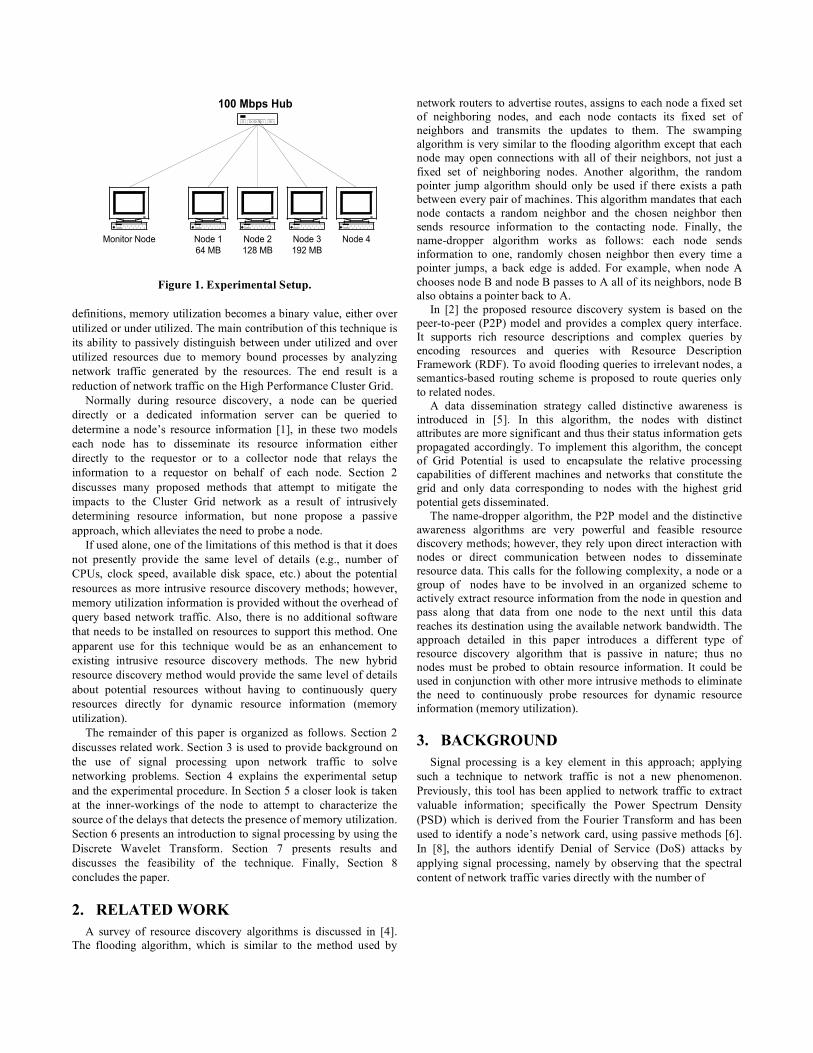
Figure 3. DWT using the Haar Wavelet of a representative UDP time series produced by 64MB node.
Figure 4. DWT using the Haar Wavelet of a representative
UDP time series produced by 128MB node. filter to produce the Approximated Coefficients and a convolution of the original signal with a high pass filter to produce the Detailed Coefficients. The Approximated Coefficients contain all of the low frequency information of the original signal, and the Detailed Coefficients contain all of the high frequency information of the original signal. The Haar DWT of a signal is given in (1), (1a) are the Approximated Coefficients and (1b) are the Detailed Coefficients; the subscripts j and k refer to the scale of the DWT and index of the signal respectively [12]. In this paper, the first level (j=1) Haar DWT is used solely.
)(2
1212, kkkj ssa +!
" (1a)
)(2
1212, kkkj ssd !"
!
(1b)
Figure 5. DWT using the Haar Wavelet of a representative
UDP time series produced by 192MB node. Given a time series s(t), which is a series of packet departure times, the majority of the energy in the wavelet domain is captured by computing the magnitude squared of the Approximated Coefficients taken from the DWT of the time series.
There is conservation of energy from Parseval's Energy Theorem for Wavelets [13]; the sum of the energy of the Approximated Coefficients and the Detailed Coefficients equal the energy of the input signal s(t). This is given in equation (2), where L and t are the
!!!===
"+
L
t
L
k
k
L
k
ktsda
1
22/
1
2
,1
2/
1
2
,1 )( (2)
The Figures 3-5 contain the DWT of time series of representatives from the memory varied nodes; the Approximated Coefficients have similar linear trends as the original input signal, except it is one half of its length. The Detailed Coefficients are also one half the length of the original signal, and contain information about transients (sharp changes) in the original signal, this feature is paramount in providing visual evidence that there is indeed a difference between length and index of the input signal respectively and k is the index of the wavelet coefficients. time series created from nodes with different physical memory sizes. A comparison of the Detailed Coefficients in Figures 3-5 will reveal that distinguishable peaks occur for each time series displayed. The peaks for the time series created from the 64MB node suggest that there exist transients throughout the time series, and thus delays; this is supported by the data in Table 1 which suggest that the 64MB node undergoes more paging, buffering and CPU use than the other two nodes. The peaks for the time series created from the 128MB and 192MB node suggest that there are transients or delays in the time series, but less than the 64MB node, which is also supported by the data in Table 1.
By using the DWT a delay sensitive profile can be created. The Approximated Coefficients can be used to obtain an energy value for each time series and the Detailed Coefficients can be used to obtain a visual of the delays present in each time series. Together
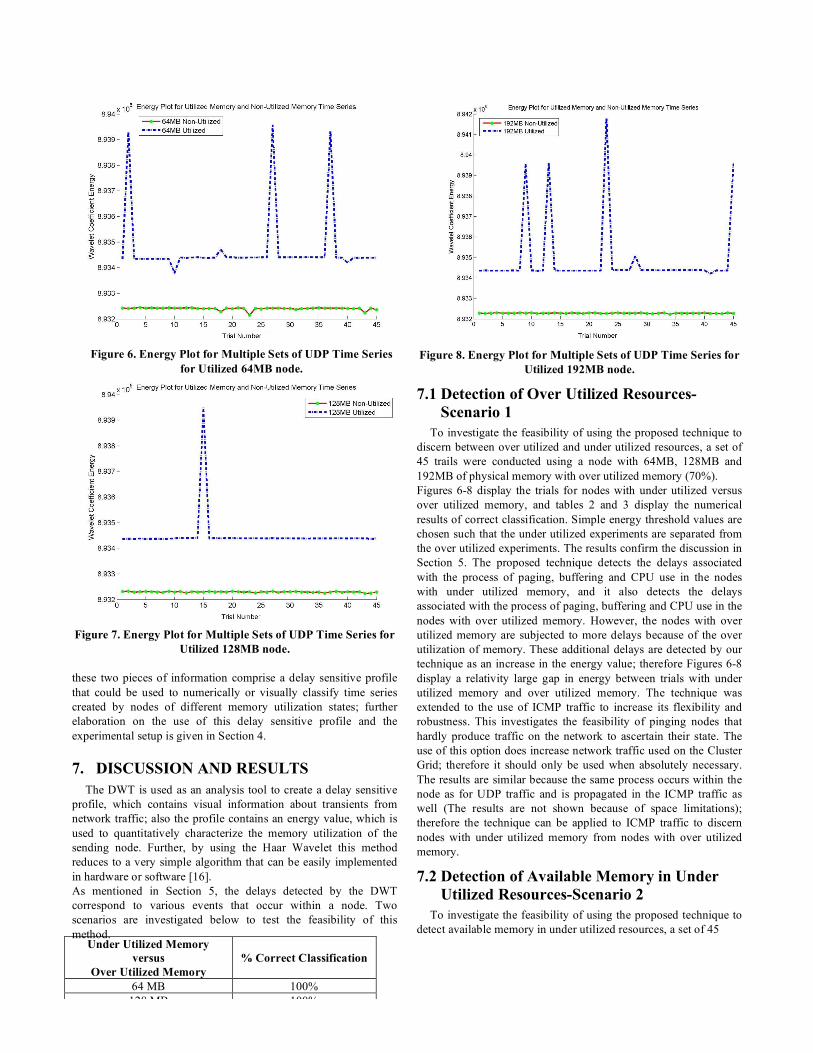
Figure 6. Energy Plot for Multiple Sets of UDP Time Series
for Utilized 64MB node.
Figure 7. Energy Plot for Multiple Sets of UDP Time Series for
Utilized 128MB node. these two pieces of information comprise a delay sensitive profile that could be used to numerically or visually classify time series created by nodes of different memory utilization states; further elaboration on the use of this delay sensitive profile and the experimental setup is given in Section 4.
7. DISCUSSION AND RESULTS The DWT is used as an analysis tool to create a delay sensitive
profile, which contains visual information about transients from network traffic; also the profile contains an energy value, which is used to quantitatively characterize the memory utilization of the sending node. Further, by using the Haar Wavelet this method reduces to a very simple algorithm that can be easily implemented in hardware or software [16]. As mentioned in Section 5, the delays detected by the DWT correspond to various events that occur within a node. Two scenarios are investigated below to test the feasibility of this method.
Figure 8. Energy Plot for Multiple Sets of UDP Time Series for
Utilized 192MB node.
7.1 Detection of Over Utilized Resources-Scenario 1
To investigate the feasibility of using the proposed technique to discern between over utilized and under utilized resources, a set of 45 trails were conducted using a node with 64MB, 128MB and 192MB of physical memory with over utilized memory (70%). Figures 6-8 display the trials for nodes with under utilized versus over utilized memory, and tables 2 and 3 display the numerical results of correct classification. Simple energy threshold values are chosen such that the under utilized experiments are separated from the over utilized experiments. The results confirm the discussion in Section 5. The proposed technique detects the delays associated with the process of paging, buffering and CPU use in the nodes with under utilized memory, and it also detects the delays associated with the process of paging, buffering and CPU use in the nodes with over utilized memory. However, the nodes with over utilized memory are subjected to more delays because of the over utilization of memory. These additional delays are detected by our technique as an increase in the energy value; therefore Figures 6-8 display a relativity large gap in energy between trials with under utilized memory and over utilized memory. The technique was extended to the use of ICMP traffic to increase its flexibility and robustness. This investigates the feasibility of pinging nodes that hardly produce traffic on the network to ascertain their state. The use of this option does increase network traffic used on the Cluster Grid; therefore it should only be used when absolutely necessary. The results are similar because the same process occurs within the node as for UDP traffic and is propagated in the ICMP traffic as well (The results are not shown because of space limitations); therefore the technique can be applied to ICMP traffic to discern nodes with under utilized memory from nodes with over utilized memory.
7.2 Detection of Available Memory in Under Utilized Resources-Scenario 2
To investigate the feasibility of using the proposed technique to detect available memory in under utilized resources, a set of 45
Under Utilized Memory versus
Over Utilized Memory % Correct Classification
64 MB 100% 128 MB 100% 192 MB 100%
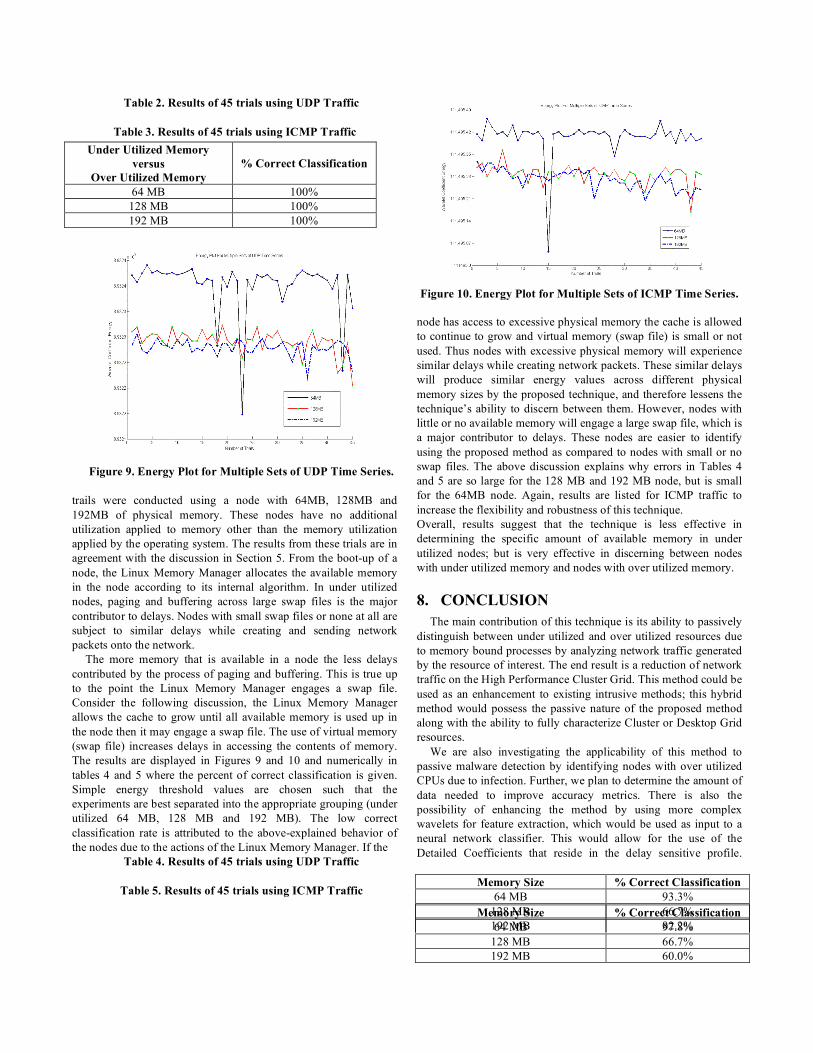
Table 2. Results of 45 trials using UDP Traffic
Table 3. Results of 45 trials using ICMP Traffic
Figure 9. Energy Plot for Multiple Sets of UDP Time Series.
trails were conducted using a node with 64MB, 128MB and 192MB of physical memory. These nodes have no additional utilization applied to memory other than the memory utilization applied by the operating system. The results from these trials are in agreement with the discussion in Section 5. From the boot-up of a node, the Linux Memory Manager allocates the available memory in the node according to its internal algorithm. In under utilized nodes, paging and buffering across large swap files is the major contributor to delays. Nodes with small swap files or none at all are subject to similar delays while creating and sending network packets onto the network.
The more memory that is available in a node the less delays contributed by the process of paging and buffering. This is true up to the point the Linux Memory Manager engages a swap file. Consider the following discussion, the Linux Memory Manager allows the cache to grow until all available memory is used up in the node then it may engage a swap file. The use of virtual memory (swap file) increases delays in accessing the contents of memory. The results are displayed in Figures 9 and 10 and numerically in tables 4 and 5 where the percent of correct classification is given. Simple energy threshold values are chosen such that the experiments are best separated into the appropriate grouping (under utilized 64 MB, 128 MB and 192 MB). The low correct classification rate is attributed to the above-explained behavior of the nodes due to the actions of the Linux Memory Manager. If the
Table 4. Results of 45 trials using UDP Traffic
Table 5. Results of 45 trials using ICMP Traffic
Figure 10. Energy Plot for Multiple Sets of ICMP Time Series.
node has access to excessive physical memory the cache is allowed to continue to grow and virtual memory (swap file) is small or not used. Thus nodes with excessive physical memory will experience similar delays while creating network packets. These similar delays will produce similar energy values across different physical memory sizes by the proposed technique, and therefore lessens the technique’s ability to discern between them. However, nodes with little or no available memory will engage a large swap file, which is a major contributor to delays. These nodes are easier to identify using the proposed method as compared to nodes with small or no swap files. The above discussion explains why errors in Tables 4 and 5 are so large for the 128 MB and 192 MB node, but is small for the 64MB node. Again, results are listed for ICMP traffic to increase the flexibility and robustness of this technique. Overall, results suggest that the technique is less effective in determining the specific amount of available memory in under utilized nodes; but is very effective in discerning between nodes with under utilized memory and nodes with over utilized memory.
8. CONCLUSION The main contribution of this technique is its ability to passively
distinguish between under utilized and over utilized resources due to memory bound processes by analyzing network traffic generated by the resource of interest. The end result is a reduction of network traffic on the High Performance Cluster Grid. This method could be used as an enhancement to existing intrusive methods; this hybrid method would possess the passive nature of the proposed method along with the ability to fully characterize Cluster or Desktop Grid resources.
We are also investigating the applicability of this method to passive malware detection by identifying nodes with over utilized CPUs due to infection. Further, we plan to determine the amount of data needed to improve accuracy metrics. There is also the possibility of enhancing the method by using more complex wavelets for feature extraction, which would be used as input to a neural network classifier. This would allow for the use of the Detailed Coefficients that reside in the delay sensitive profile.
Under Utilized Memory versus
Over Utilized Memory % Correct Classification
64 MB 100% 128 MB 100% 192 MB 100%
Memory Size % Correct Classification 64 MB 93.3%
128 MB 66.7% 192 MB 82.2%
Memory Size % Correct Classification 64 MB 97.8%
128 MB 66.7% 192 MB 60.0%

These enhancements may prove helpful while extending the technique to include TCP traffic.
Ultimately, we plan to implement this method in the Georgia State University (GSU) Grid Network so further study of the method can be performed.
9. REFERENCES [1] I. Foster. GRIDToday, “What is the Grid? A Three Point Checklist.” July 22, 2002: VOL. 1 NO. 6. [2] Juan Li and Son Vuong. “A Semantics-based Routing Scheme for Grid Resource Discovery”,Proceedings of the 1st IEEE International Conference on e-Science and Grid Computing, eScience2005 , December, 2005, Melbourne, Australia. [3] Jeff Mausolf. “Grid in Action: Monitor and discover grid services in an SOA/WebServices”, http://www128.ibm.com/developerworks/grid/library/gr-gt4mds/index.html?ca=drs, Grid Computing Initiative,06 Sep 2005. [4] Sivadon Chaisiri, Putchong Uthayopas.“Survey of Resource Discovery in Grid Environments”, https://hpcnc.cpe.ku.ac.th/Members/sivadonc/RS_GRID_SURVEY [5] Maheswaran, M. and Krauter, K.“A Parameter-Based Approach to Resource Discovery in Grid Computing System.” Proceedings of the First IEEE/ACM international Workshop on Grid Computing, December 17, 2000, R. Buyya and M. Baker, Eds. Lecture Notes In Computer Science, vol. 1971. Springer-Verlag, London, 181-190. [6] Cherita Corbett, Raheem Beyah, and John Copland. “A Passive Approach to Wireless NIC Identification.” Appeared, Proceedings of IEEE International Conference on Communication (ICC), June 2006. [7] Cherita Corbett, Raheem Beyah, and John Copeland.“Using Active Scanning to Identify Wireless NICs.”, Appeared, Proceedings of IEEE Information Assurance Workshop (IAW), June 2006. [8] Alefiya Hussain, John Heidemann, and Christos Papadopoulos. “A Framework for Classifying Denial of Service Attacks” Proceedings of ACM SIGCOMM 2003. [9] Patrice Abry and Darryl Veitch.“Wavelet Analysis of Long-Range-Dependent Traffic”, IEEE Transactions on Information Theory, VOL. 44, NO. 1, January 1998. [10] P. Huang, A. Feldmann, and W. Willinger.“A non-intrusive, wavelet-based approach to detecting network performance problems”,Proceedings of ACM SIGCOMM Internet Measurement Workshop (2001), pp. 213-227. [11] John Sadowsky.“Investigation of Signal Characteristics Using the Continuous Wavelet Transform”, John Hopkins APL Technical Digest Volume 17, Number 3 (1996). [12] Gilbert Strang and Truong Nguyen.“Wavelets and Filter Banks”, Wellesley-Cambridge Press, 1996, pp. 28-34 and 183-193. [13] I. W. Selesnick, R. G. Baraniuk, and N. Kingsbury.“The dual-tree complex wavelet transform - A coherent framework for multiscale signal and image processing.”,IEEE Signal Processing Magazine, 22(6):123-151, November 2005. [14] H. Kim, V. Pai, S. Rixner.“Exploiting Task-Level Concurrency in a Programmable Network Interface”,ACM SIGPLAN Symposium on Principles and Practices of Parallel Programming (PPoPP), San Diego, CA, (June 2003). [15] Richard W. Stevens, Bill Fenner, Andrew M. Rudoff.“Unix Network Programming, Vol. 1: The Sockets Networking API”, Third Edition, Addison-Wesley Professional, 22 October, 2003.
[16] Lanier Watkins, Kenneth R. Perry, John S. Hurley, B.Olson and B. Pain.“Wavelet Transform Image Compression Prototype”, 1999 Technical Proceedings of the International Conference on Modeling and Simulation of Microsystems, pg 671-674. [17] “Memory Performance Study”, Mindcraft White Paper 2003, http://www.kingston.com/branded/server_memory.asp. [18] Chao-Tung Yang; Chuan-Lin Lai.“Apply cluster and grid computing on parallel 3D rendering”,2004. ICME '04. 2004 IEEE International Conference on Multimedia and Expo,Volume 2, 27-30 June 2004 Page(s):859 - 862 Vol.2. [19] Mustafee, N.; Taylor, S.J.E.“Using a desktop grid to support simulation modeling”,.; International Conference on Information Technology Interfaces, 2006. 28th, 2006 Page(s):557 – 562. [20] Xiaojuan Ren; Seyong Lee; Eigenmann, R.; Bagchi, S. “Resource Availability Prediction in Fine-Grained Cycle Sharing Systems”,2006 15th IEEE International Symposium on High Performance Distributed Computing, June 19-23 2006 Page(s):93 – 104. [21] Anglano, C.; Canonico, M.“A Comparative Evaluation of High-Performance File Transfer Systems for Data-intensive Grid Applications”13th IEEE International Workshops on Enabling Technologies: Infrastructure for Collaborative Enterprises, 2004. WET ICE 2004, 14-16 June 2004 Page(s):283 – 288. [22] Jigang Wang; Guochang Gu; Shibo Xie; Lifeng Xu.“Reliable and Efficient Data Transfer Protocol Based on UDP in Cluster System”,First International Multi-Symposiums on Computer and Computational Sciences, 2006. IMSCCS '06. Volume 1, 20-24 June 2006 Page(s):518 – 524. [23] G. Cooperman, Xiaoqin Ma and Viet Ha Nguyen.“Static Performance Evaluation for Memory-Bound Computing: the MBRAM Model”,Proc. of the 2004 International Conference on Parallel and Distributed Processing Techniques and Applications (PDPTA'04), 2004. [24] Matsuda, M.; Kudoh, T.; Ishikawa, Y.“Evaluation of MPI implementations on grid-connected clusters using an emulated WAN environment”,; 3rd IEEE/ACM International Symposium on Cluster Computing and the Grid, 2003 Proceedings. CCGrid 2003. 12-15 May 2003 Page(s):10 – 17.
Related Documents