Using My NASA Data to Explore Earth Systems Lynne H. Hehr John G. Hehr University of Arkansas Department of Geosciences And Center for Math and Science Education

Using My NASA Data to Explore Earth Systems Lynne H. Hehr John G. Hehr University of Arkansas Department of Geosciences And Center for Math and Science.
Dec 25, 2015
Welcome message from author
This document is posted to help you gain knowledge. Please leave a comment to let me know what you think about it! Share it to your friends and learn new things together.
Transcript
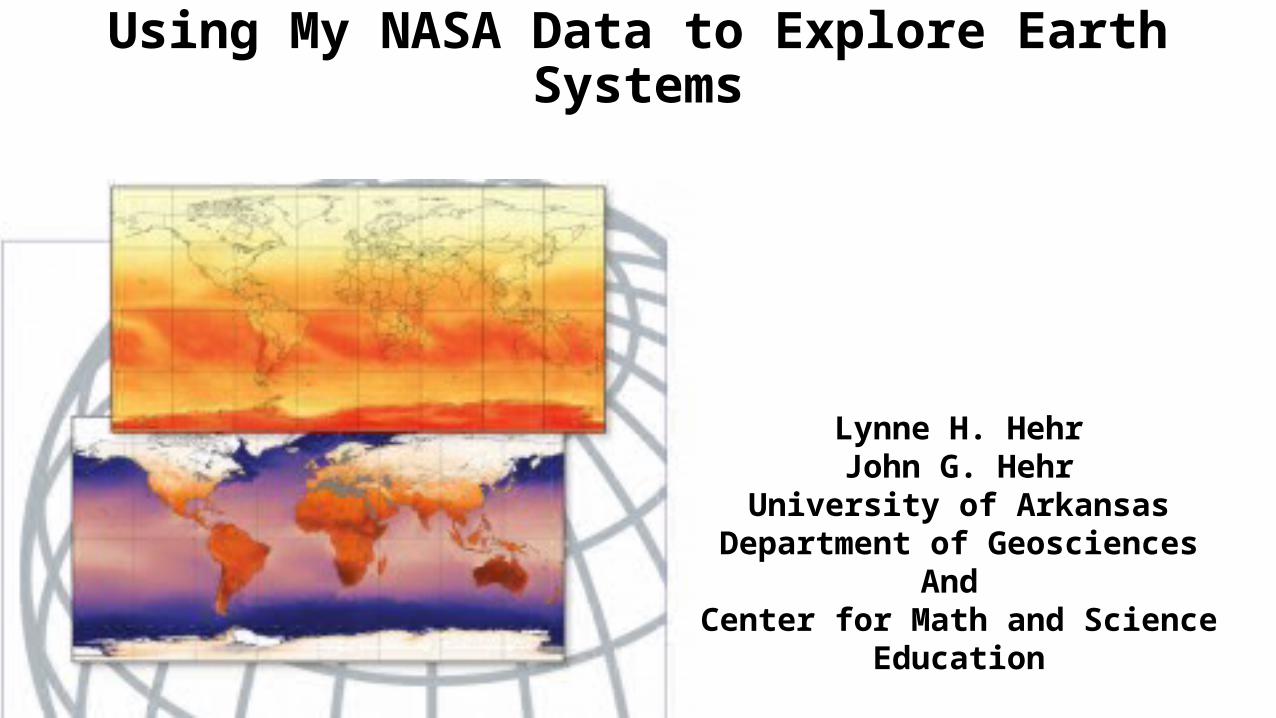
Using My NASA Data to Explore Earth Systems
Lynne H. HehrJohn G. Hehr
University of ArkansasDepartment of Geosciences
And Center for Math and Science Education
Define/Discuss
• Aerosols• Biosphere• Solar Energy• Insolation• Average Temperature• Surface Temperature
• Cloud Cover• Cloud Fraction• Precipitation• Soil Moisture• Vegetation
Activity 1: Explore a Single Map• Find the scale bar at the bottom of the map. What is the range of values
shown?• Give the answer in the terms of the measurement units displayed on the map
(watts per square meter, degrees Celsius, percent, millimeters, etc).
• Where in the world are the highest and lowest values of the data on the map? Where are the extremes? Why are the extremes in these locations, and not somewhere else?• Look for patterns. Describe them. Are they different on different
continents or over water compared to over land? Explain these patterns?
Activity 2: Explore Annual Changes (column)
1. What changes are seen through the year? What seasonal changes and annual cycles emerge? What explanations are suggested for these patterns?
2. Pick a location or area. During which months do the extreme highs and lows occur for each data type? What explanations can be suggested for the timing of those extremes?
3. Which regions experience the extreme high’s and low’s for each data type? Which regions don’t experience the extremes? Why is this?
4. What differences, if any, are found between the year’s variations over the oceans versus the year’s variations over the continents?
5. Are there regions that remain unchanged over the year? Why is this?
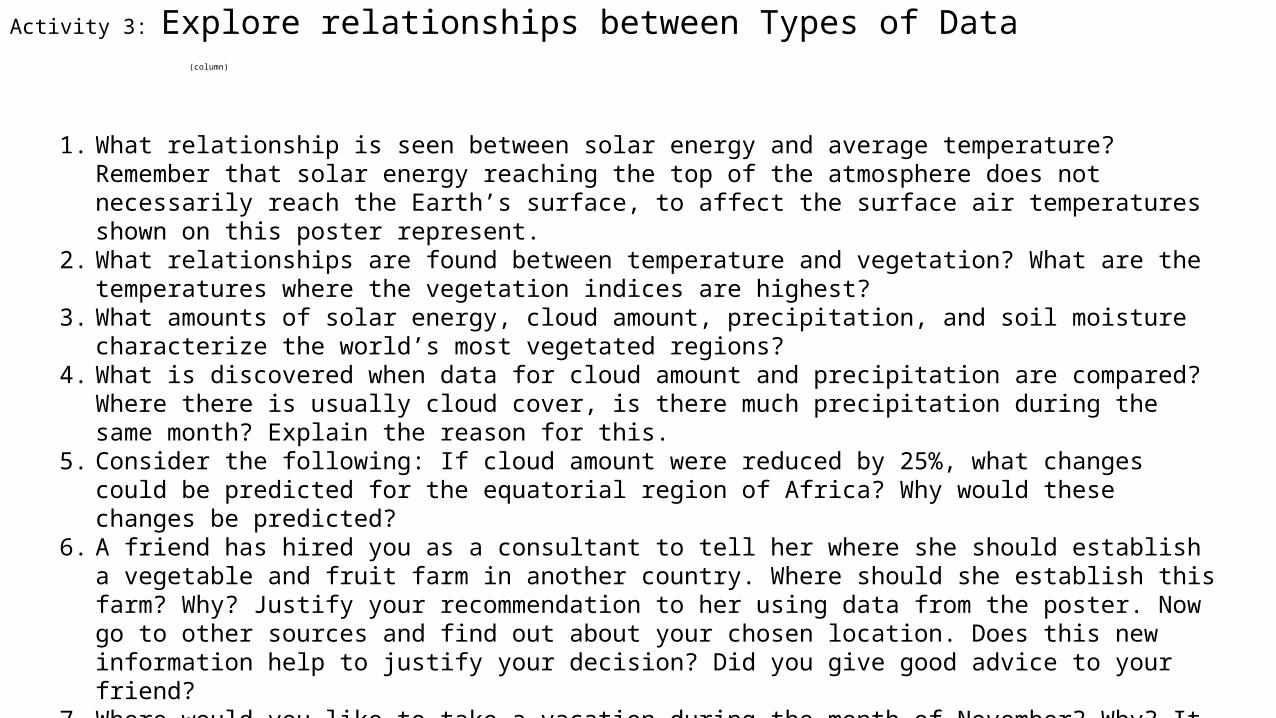
Activity 3: Explore relationships between Types of Data (column)
1. What relationship is seen between solar energy and average temperature? Remember that solar energy reaching the top of the atmosphere does not necessarily reach the Earth’s surface, to affect the surface air temperatures shown on this poster represent.
2. What relationships are found between temperature and vegetation? What are the temperatures where the vegetation indices are highest?
3. What amounts of solar energy, cloud amount, precipitation, and soil moisture characterize the world’s most vegetated regions?
4. What is discovered when data for cloud amount and precipitation are compared? Where there is usually cloud cover, is there much precipitation during the same month? Explain the reason for this.
5. Consider the following: If cloud amount were reduced by 25%, what changes could be predicted for the equatorial region of Africa? Why would these changes be predicted?
6. A friend has hired you as a consultant to tell her where she should establish a vegetable and fruit farm in another country. Where should she establish this farm? Why? Justify your recommendation to her using data from the poster. Now go to other sources and find out about your chosen location. Does this new information help to justify your decision? Did you give good advice to your friend?
7. Where would you like to take a vacation during the month of November? Why? It may be interesting to notice what kind of data you choose to consider first: Is it solar energy or cloud amount? (Do you like it sunny?) Is it temperature? (Do you love the heat?) Is it vegetation?
Activity 4: Global Patterns
1. How does the global pattern of solar energy relate to the other data on the poster?
2. Compare conditions at the poles with conditions at the equator. What do you discover, and how can you explain it?
3. Look at the equatorial region across the globe. What characterizes it? 4. Look at the regions around 30 degrees N and 30 degrees S. What
patterns do you find there? One pattern that students may discover is the band of high cloud amount, precipitation, soil moisture, and vegetation around the region of the Equator. Another pattern they may discover lies in bands of dry, low-vegetation, low-precipitation at approximately 30º degrees N latitude and 30 degrees S latitude.
Activity 5: Link with GLOBE Data
Students compare • their own local observations — or those of another GLOBE school — with data
shown in the poster• GLOBE student data maps and visualizations with the maps in the poster.
Purpose
• identify global patterns and connections in environmental data contained in the GLOBE Earth Systems poster • develop an understanding of the interactions within the Earth system.
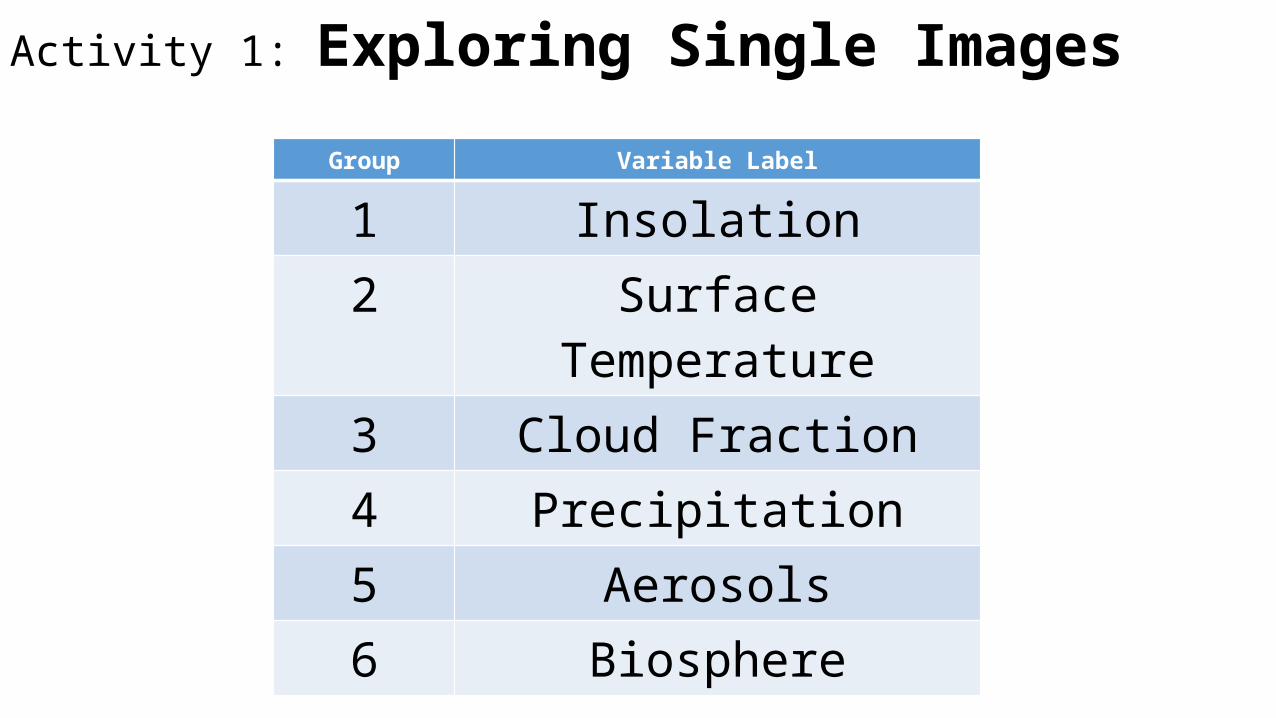
Activity 1: Exploring Single Images
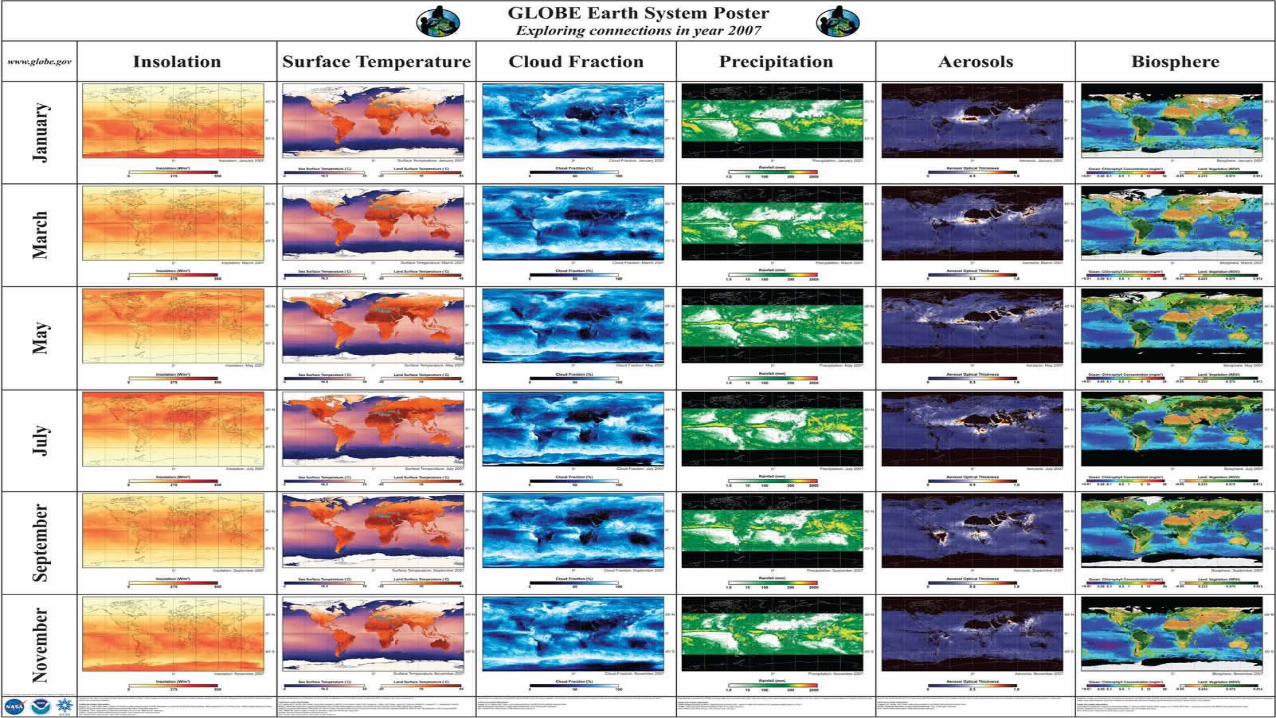
Group Variable Label
1 Insolation2 Surface Temperature3 Cloud Fraction4 Precipitation5 Aerosols6 Biosphere
Questions to ask while looking at the images…
• What variable did you examine and what is the range of values shown on the scale bars?• Where in the world do you find the highest and lowest values (the
extremes) of the data in your images? Why do these locations experience the extremes and not other locations?• Are any patterns in the data noticeable? Are patterns different on
different continents? Different over water than over land? Explain these patterns.
Activity 2: Exploring Annual Changes
• What changes do you see through the year? What explanations can you suggest for these patterns?• Choose a location or region. During which months do the extreme
highs and lows occur? What explanations can you suggest for the timing of those extremes?• Which regions experience both the extreme highs and lows? Which
regions don’t experience the extremes? Why do you think this happens?• What differences, if any, do you find between the year’s variations
over the oceans versus the year’s variations over the continents?• Are there regions that remain relatively unchanged over the year?
Why do you think this happens?
Activity 3: Exploring Relationships Between Two Variables
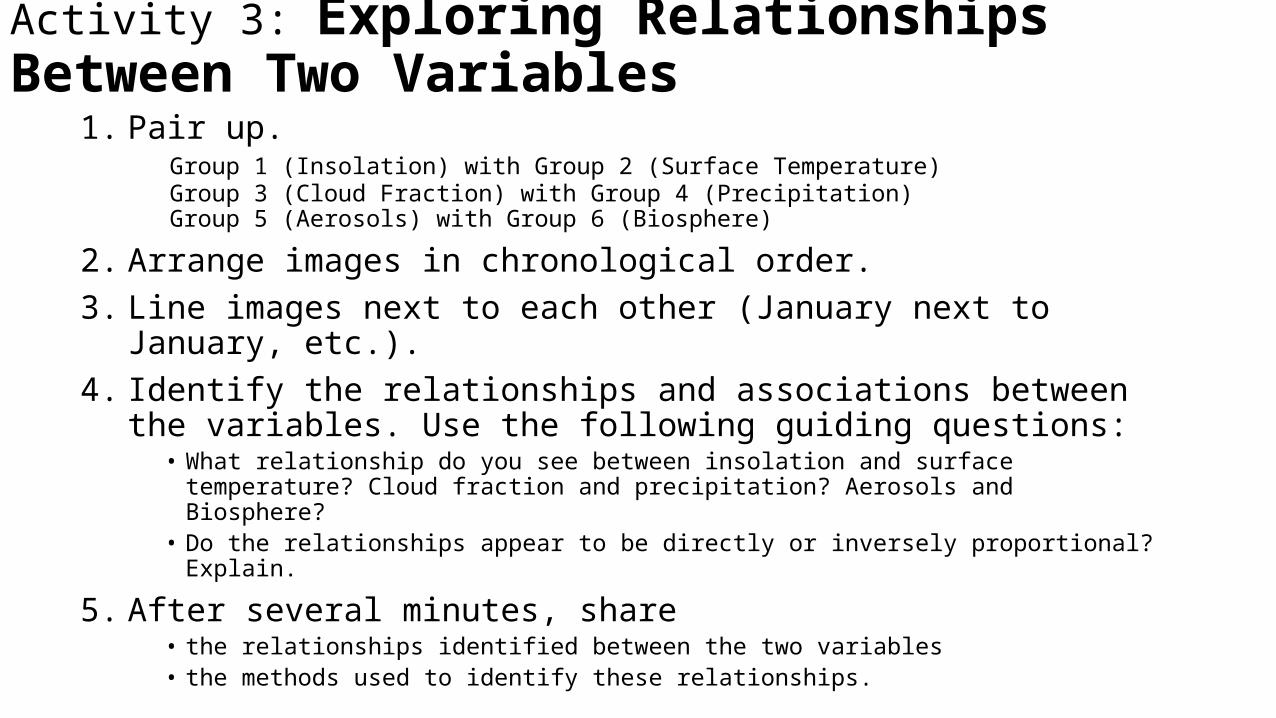
1. Pair up.Group 1 (Insolation) with Group 2 (Surface Temperature) Group 3 (Cloud Fraction) with Group 4 (Precipitation) Group 5 (Aerosols) with Group 6 (Biosphere)
2. Arrange images in chronological order. 3. Line images next to each other (January next to January, etc.). 4. Identify the relationships and associations between the variables.
Use the following guiding questions:• What relationship do you see between insolation and surface temperature? Cloud
fraction and precipitation? Aerosols and Biosphere? • Do the relationships appear to be directly or inversely proportional? Explain.
5. After several minutes, share • the relationships identified between the two variables• the methods used to identify these relationships.
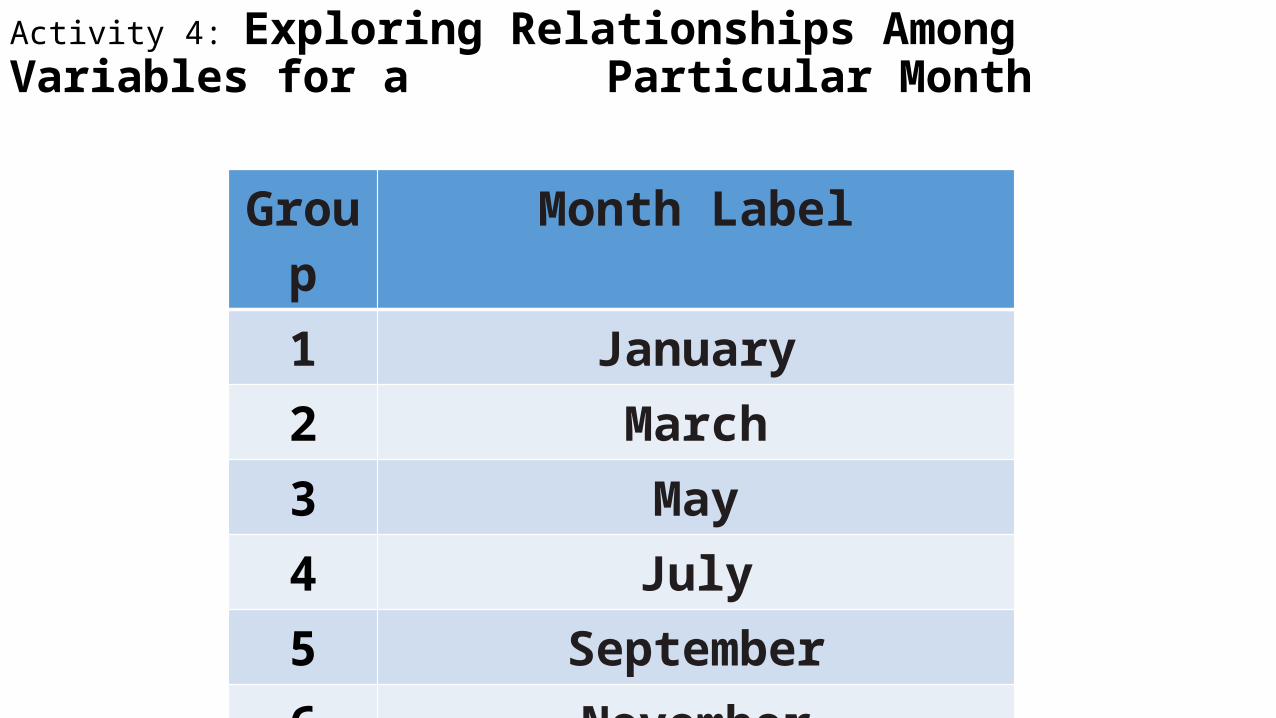
Activity 4: Exploring Relationships Among Variables for a Particular Month
Group Month Label1 January2 March3 May4 July5 September6 November
Questions to ask while looking at the images…
• Which regions experience the extreme highs and lows for each variable?• Which regions don’t experience the extremes? Why do you think this
occurs?• What differences, if any, do you find between variations of variables
over the oceans versus variations in variables over the continents?• What amounts of insolation, surface temperature, cloud fraction,
precipitation and aerosols characterize the world’s most vegetated regions for a particular month? Where is the greatest concentration of aerosols originating from and how would you characterize that particular environment based on the six images?
Activity 5: Exploring Relationships Among Variables 6 Months Apart
1. Pair Up• Group 1 (January) with Group 4 (July). • Group 2 (March) with Group 5 (September). • Group 3 (May) with Group 6 (November).
2. Line the global images next to each other by variable (Insolation January next to Insolation July, Surface Temperature January next to Surface Temperature July, etc.).
3. Identify the changes that occur in the six variables between the six-month period. Use the following guiding questions: • Which variables change the most over the six-month period? Which variables change the least?
Why do you think this happens? • Do you see any relationships among the variables that you didn’t see previously?
Share the relationships identified among the variables and the methods used to identify these relationships.
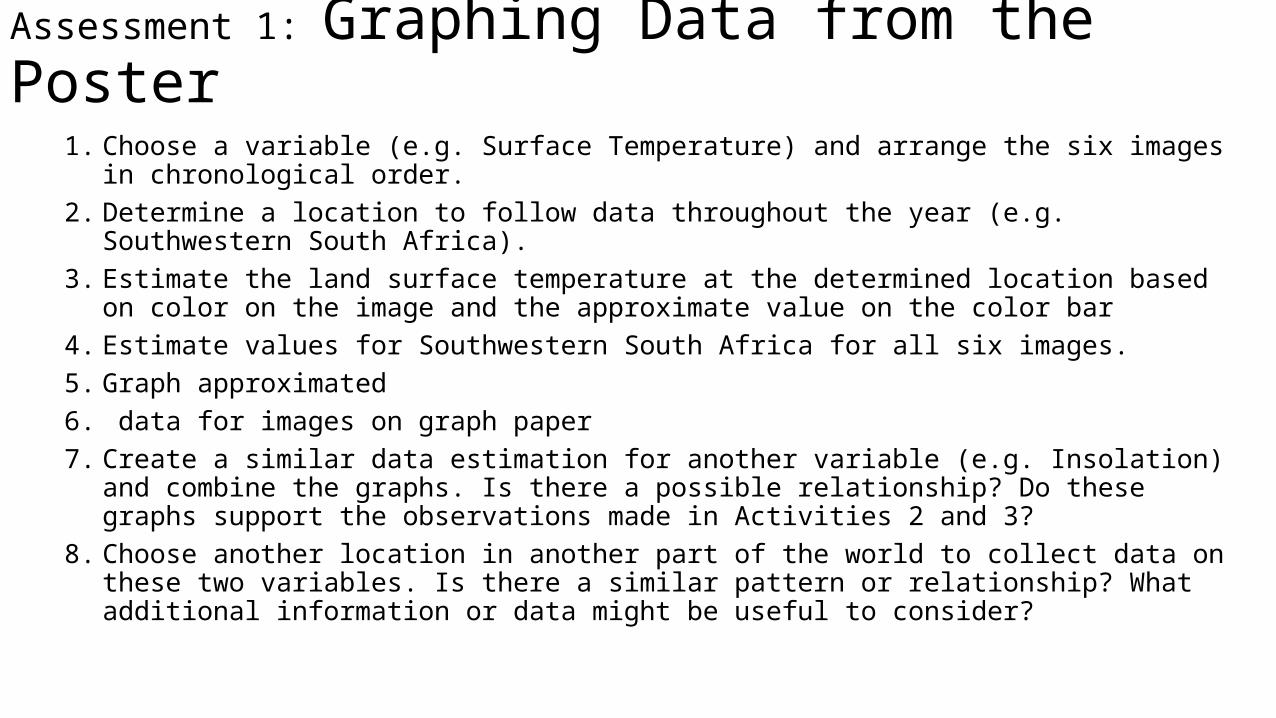
Assessment 1: Graphing Data from the Poster
1. Choose a variable (e.g. Surface Temperature) and arrange the six images in chronological order.
2. Determine a location to follow data throughout the year (e.g. Southwestern South Africa).
3. Estimate the land surface temperature at the determined location based on color on the image and the approximate value on the color bar
4. Estimate values for Southwestern South Africa for all six images. 5. Graph approximated6. data for images on graph paper7. Create a similar data estimation for another variable (e.g. Insolation) and combine the
graphs. Is there a possible relationship? Do these graphs support the observations made in Activities 2 and 3?
8. Choose another location in another part of the world to collect data on these two variables. Is there a similar pattern or relationship? What additional information or data might be useful to consider?
Assessment 2: Sequencing Annual Changes in a Variable
1. Arrange the images in order. 2. Explain how the images were arranged in chronological order without
knowing the dates. 3. Uncover the dates on the images to check the order. Was it difficult or
easy to arrange the images? Which variables were easiest to arrange in chronological order? What clues in the images helped? Which variables were the most difficult? Why?
More:
Assessment 2: Sequencing Annual Changes in a VariableAssessment 3: Applying the Data
Extension 1: Exploring Further Relationships – AerosolsExtension 2: Polar Studies
Related Documents