Ecological Modelling 191 (2006) 131–143 Using multi-objective classification to model communities of soil microarthropods Damjan Demˇ sar a,∗ , Saˇ so Dˇ zeroski a , Thomas Larsen b , Jan Struyf c , Jørgen Axelsen b , Marianne Bruus Pedersen b , Paul Henning Krogh b a Department of Knowledge Technologies, Joˇ zef Stefan Institute, Jamova Ljubljana, Slovenia b Department of Terrestrial Ecology, National Environmental Research Institute, Roskilde, Denmark c Department of Computer Science, Katholieke Universiteit Leuven, Leuven, Belgium Available online 7 October 2005 Abstract In agricultural soil, a suite of anthropogenic events shape the ecosystem processes and populations. However, the impact from anthropogenic sources on the soil environment is almost exclusively assessed for chemicals, although other factors like crop and tillage practices have an important impact as well. Thus, the farming system as a whole should be evaluated and ranked according to its environmental benefits and impacts. Our starting point is a data set describing agricultural events and soil biological parameters. Using machine learning methods for inducing regression and model trees, we produce empirical models able to predict the soil quality from agricultural measures in terms of quantities describing the soil microarthropod community. We are also interested in discovering additional higher level knowledge. In particular, we have identified the most important factors influencing the population densities of springtails and mites and their biodiversity. We also identify to which agricultural actions different microarthropods react distinctly. To obtain this higher level knowledge, we employ multi-objective regression trees. © 2005 Elsevier B.V. All rights reserved. Keywords: Multi-objective classification; Modelling; Soil microarthropods 1. Introduction The impact of anthropogenic sources on the soil environment is almost exclusively assessed for chem- ∗ Corresponding author. E-mail addresses: [email protected] (D. Demˇ sar), [email protected] (S. Dˇ zeroski), [email protected] (T. Larsen), [email protected] (J. Struyf), [email protected] (P.H. Krogh). ical factors only, although in agriculture mechanical factors like tillage and biological factors such as crops have a large impact as well (Steen, 1983). Since farm- ing systems consist of a certain temporal sequence of interdependent events of different types and durations it is necessary to handle the farming system as a whole in order to accurately rank its environmental bene- fits and impacts. Based on data about the agricultural events and the soil biological parameters reflecting 0304-3800/$ – see front matter © 2005 Elsevier B.V. All rights reserved. doi:10.1016/j.ecolmodel.2005.08.017

Welcome message from author
This document is posted to help you gain knowledge. Please leave a comment to let me know what you think about it! Share it to your friends and learn new things together.
Transcript
Ecological Modelling 191 (2006) 131–143
Using multi-objective classification to model communitiesof soil microarthropods
Damjan Demsara,∗, Saso Dzeroskia, Thomas Larsenb, Jan Struyfc,Jørgen Axelsenb, Marianne Bruus Pedersenb, Paul Henning Kroghb
a Department of Knowledge Technologies, Jozef Stefan Institute, Jamova Ljubljana, Sloveniab Department of Terrestrial Ecology, National Environmental Research Institute, Roskilde, Denmark
c Department of Computer Science, Katholieke Universiteit Leuven, Leuven, Belgium
Available online 7 October 2005
Abstract
In agricultural soil, a suite of anthropogenic events shape the ecosystem processes and populations. However, the impactfrom anthropogenic sources on the soil environment is almost exclusively assessed for chemicals, although other factors likecrop and tillage practices have an important impact as well. Thus, the farming system as a whole should be evaluated andranked according to its environmental benefits and impacts. Our starting point is a data set describing agricultural events and soilbiological parameters. Using machine learning methods for inducing regression and model trees, we produce empirical modelsable to predict the soil quality from agricultural measures in terms of quantities describing the soil microarthropod community.We are also interested in discovering additional higher level knowledge. In particular, we have identified the most importantf iculturala gressiont©
K
1
e
sj
icalops-ce oftionsholene-turalting
0
actors influencing the population densities of springtails and mites and their biodiversity. We also identify to which agrctions different microarthropods react distinctly. To obtain this higher level knowledge, we employ multi-objective re
rees.2005 Elsevier B.V. All rights reserved.
eywords: Multi-objective classification; Modelling; Soil microarthropods
. Introduction
The impact of anthropogenic sources on the soilnvironment is almost exclusively assessed for chem-
∗ Corresponding author.E-mail addresses: [email protected] (D. Demsar),
[email protected] (S. Dzeroski), [email protected] (T. Larsen),[email protected] (J. Struyf), [email protected] (P.H. Krogh).
ical factors only, although in agriculture mechanfactors like tillage and biological factors such as crhave a large impact as well (Steen, 1983). Since farming systems consist of a certain temporal sequeninterdependent events of different types and durait is necessary to handle the farming system as a win order to accurately rank its environmental befits and impacts. Based on data about the agriculevents and the soil biological parameters reflec
304-3800/$ – see front matter © 2005 Elsevier B.V. All rights reserved.doi:10.1016/j.ecolmodel.2005.08.017
132 D. Demsar et al. / Ecological Modelling 191 (2006) 131–143
these events, we build empirical models that relate thesequence of agricultural events to the biological param-eters. More specifically, we employ machine learningalgorithms that build regression and model trees toinduce models able to predict the soil quality in termsof quantities describing the microarthropod commu-nity, given historical data about sequences of crops,tillage, fertilisation and other agricultural measures.
Besides building accurate models, we are alsointerested in discovering higher level knowledge. Inparticular, we identify the most important factors influ-encing the biodiversity and the population densities ofdifferent microarthropods. Such knowledge can guideus in further experiments and in more focused datacollection.
The long-term goal of this work is to design a deci-sion support system for managing farms, which cantake into account both the economical and ecologicalconsequences of agricultural actions. The knowledgediscovered in this study can be later incorporated intothe ecological part of this system. For this reason thepurpose of the present modelling exercise is not onlyto discover new knowledge, but also to “rediscover”the knowledge in a quantitative form and thereforeoperational form. Obtaining knowledge from domainexperts can be hard because it is generally difficult toput down in writing or may be simply too obvious tomention from the expert’s point of view. Therefore, weprefer machine learning tools that produce descriptivemodels from datasets, which can be used as a sourceo ouldo anta romt thed ports
inel ion.S tings odeli onef tou urala ro-p llowu ay,w ivea
This paper is organized as follows. Section2describes the data: the data sources, the observedvariables and the transformations that are used. InSection3, we discuss the modelling techniques thatwe apply namely single and multi-objective regres-sion trees and model trees. Section4 describes themodelling phase: the experimental setup, the obtainedmodels and the knowledge that can be derivedfrom these models. In Section5, we state the mainconclusions.
2. Data
The data that is used in this study originates fromtwo data sets. The first data set (Krogh, 1994) describesfour experimental farming systems (all located atthe Foulum experimental station, Denmark) over theperiod 1989–1993. Two systems are conventional sys-tems with pesticide use; the other two are organicones with no pesticide use. Five hundred and thirtymicroarthropod samples are available in this data set(Demsar et al., 2003). The second data set describesa number of organic farms (Foulum and Flakkebjergexperimental stations and a number of farms in Jut-land) over the period 2002–2003. One thousand fourhundred and fifteen samples are collected.
The combined data set has 1945 records in total(while our approach works also with significantlyless records, larger data sets usually improve accu-r ibeso 145a d 3a andC iver-s ortd
them ludea king,t eralm re isa col-l earsa
ntedw iblec rop
f questions to domain experts. Such questions wtherwise be impossible to pose without a significmount of background knowledge. The answers f
he experts can then be used in combination withiscovered knowledge to construct the decision supystem.
To obtain interpretable models, we employ machearning tools capable of multi-objective regressuch tools allow us to produce one model prediceveral biological variables at once. This one ms not only simpler compared to a set of models,or each individual variable, but can also help usnderstand different effects of the same agricultctions on different aspects of the soil microarthod community. The tools that we use moreover as to constrain the size of the models. In this we can easily trade off interpretability for predictccuracy.
acy and reduce overfitting). Each record descrne microarthropod sample. A record consists ofttributes, of which 142 are input attributes anre target attributes (the abundances of Acariollembolans as well as Shannon–Wiener biodity). Table 1lists each attribute together with a shescription.
The input attributes describe the field whereicroarthropod sample was taken and mainly incgricultural measures (e.g., crops planted, pac
illage, fertilizer and pesticide use, etc.). For seveasures a history of 3 years is recorded, i.e., then attribute for the year in which the sample was
ected, one for the past year, and one for 2 and 3 ygo.
The type of crop planted on the field is represeith a set of binary attributes, one for each possrop. The attribute corresponding to the actual c
D. Demsar et al. / Ecological Modelling 191 (2006) 131–143 133
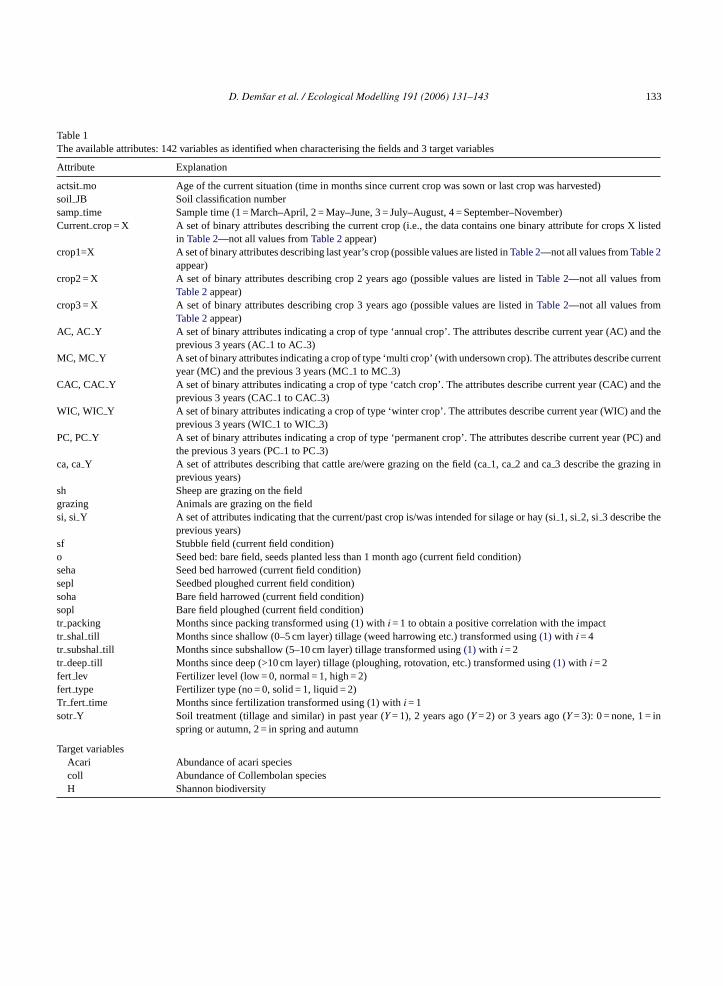
Table 1The available attributes: 142 variables as identified when characterising the fields and 3 target variables
Attribute Explanation
actsitmo Age of the current situation (time in months since current crop was sown or last crop was harvested)soil JB Soil classification numbersamptime Sample time (1 = March–April, 2 = May–June, 3 = July–August, 4 = September–November)Currentcrop = X A set of binary attributes describing the current crop (i.e., the data contains one binary attribute for crops X listed
in Table 2—not all values fromTable 2appear)crop1=X A set of binary attributes describing last year’s crop (possible values are listed inTable 2—not all values fromTable 2
appear)crop2 = X A set of binary attributes describing crop 2 years ago (possible values are listed inTable 2—not all values from
Table 2appear)crop3 = X A set of binary attributes describing crop 3 years ago (possible values are listed inTable 2—not all values from
Table 2appear)AC, AC Y A set of binary attributes indicating a crop of type ‘annual crop’. The attributes describe current year (AC) and the
previous 3 years (AC1 to AC 3)MC, MC Y A set of binary attributes indicating a crop of type ‘multi crop’ (with undersown crop). The attributes describe current
year (MC) and the previous 3 years (MC1 to MC 3)CAC, CAC Y A set of binary attributes indicating a crop of type ‘catch crop’. The attributes describe current year (CAC) and the
previous 3 years (CAC1 to CAC 3)WIC, WIC Y A set of binary attributes indicating a crop of type ‘winter crop’. The attributes describe current year (WIC) and the
previous 3 years (WIC1 to WIC 3)PC, PCY A set of binary attributes indicating a crop of type ‘permanent crop’. The attributes describe current year (PC) and
the previous 3 years (PC1 to PC3)ca, caY A set of attributes describing that cattle are/were grazing on the field (ca1, ca2 and ca3 describe the grazing in
previous years)sh Sheep are grazing on the fieldgrazing Animals are grazing on the fieldsi, si Y A set of attributes indicating that the current/past crop is/was intended for silage or hay (si1, si 2, si 3 describe the
previous years)sf Stubble field (current field condition)o Seed bed: bare field, seeds planted less than 1 month ago (current field condition)seha Seed bed harrowed (current field condition)sepl Seedbed ploughed current field condition)soha Bare field harrowed (current field condition)sopl Bare field ploughed (current field condition)tr packing Months since packing transformed using (1) withi = 1 to obtain a positive correlation with the impacttr shal till Months since shallow (0–5 cm layer) tillage (weed harrowing etc.) transformed using(1) with i = 4tr subshaltill Months since subshallow (5–10 cm layer) tillage transformed using(1) with i = 2tr deeptill Months since deep (>10 cm layer) tillage (ploughing, rotovation, etc.) transformed using(1) with i = 2fert lev Fertilizer level (low = 0, normal = 1, high = 2)fert type Fertilizer type (no = 0, solid = 1, liquid = 2)Tr fert time Months since fertilization transformed using (1) withi = 1sotr Y Soil treatment (tillage and similar) in past year (Y = 1), 2 years ago (Y = 2) or 3 years ago (Y = 3): 0 = none, 1 = in
spring or autumn, 2 = in spring and autumn
Target variablesAcari Abundance of acari speciescoll Abundance of Collembolan speciesH Shannon biodiversity
134 D. Demsar et al. / Ecological Modelling 191 (2006) 131–143
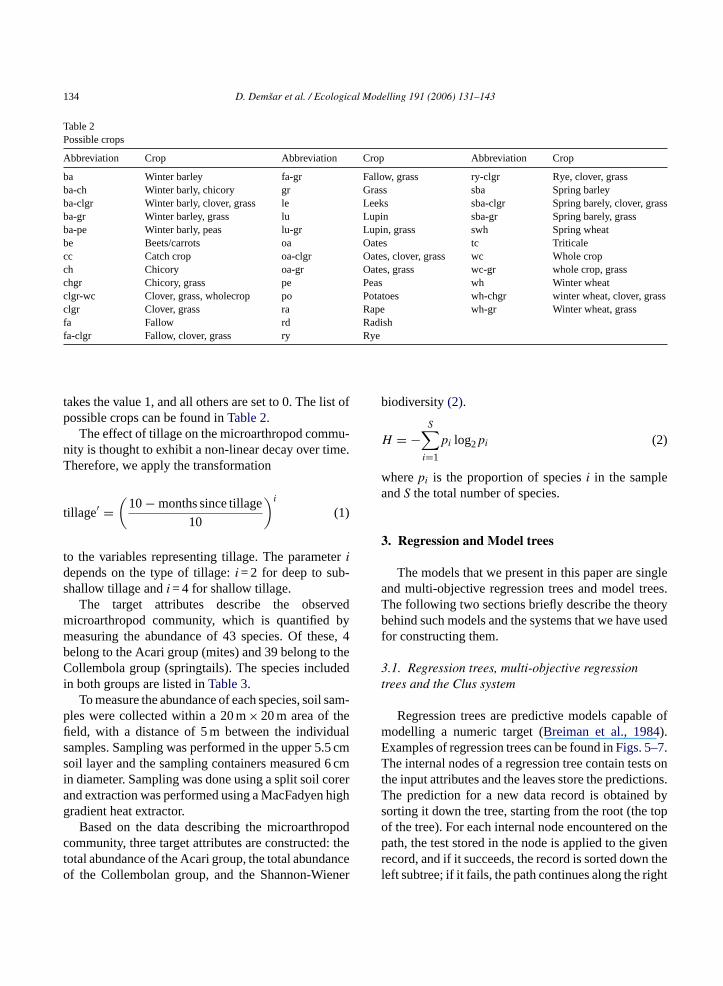
Table 2Possible crops
Abbreviation Crop Abbreviation Crop Abbreviation Crop
ba Winter barley fa-gr Fallow, grass ry-clgr Rye, clover, grassba-ch Winter barly, chicory gr Grass sba Spring barleyba-clgr Winter barly, clover, grass le Leeks sba-clgr Spring barely, clover, grassba-gr Winter barley, grass lu Lupin sba-gr Spring barely, grassba-pe Winter barly, peas lu-gr Lupin, grass swh Spring wheatbe Beets/carrots oa Oates tc Triticalecc Catch crop oa-clgr Oates, clover, grass wc Whole cropch Chicory oa-gr Oates, grass wc-gr whole crop, grasschgr Chicory, grass pe Peas wh Winter wheatclgr-wc Clover, grass, wholecrop po Potatoes wh-chgr winter wheat, clover, grassclgr Clover, grass ra Rape wh-gr Winter wheat, grassfa Fallow rd Radishfa-clgr Fallow, clover, grass ry Rye
takes the value 1, and all others are set to 0. The list ofpossible crops can be found inTable 2.
The effect of tillage on the microarthropod commu-nity is thought to exhibit a non-linear decay over time.Therefore, we apply the transformation
tillage′ =(
10− months since tillage
10
)i
(1)
to the variables representing tillage. The parameteridepends on the type of tillage:i = 2 for deep to sub-shallow tillage andi = 4 for shallow tillage.
The target attributes describe the observedmicroarthropod community, which is quantified bymeasuring the abundance of 43 species. Of these, 4belong to the Acari group (mites) and 39 belong to theCollembola group (springtails). The species includedin both groups are listed inTable 3.
To measure the abundance of each species, soil sam-ples were collected within a 20 m× 20 m area of thefield, with a distance of 5 m between the individualsamples. Sampling was performed in the upper 5.5 cmsoil layer and the sampling containers measured 6 cmin diameter. Sampling was done using a split soil corerand extraction was performed using a MacFadyen highgradient heat extractor.
Based on the data describing the microarthropodcommunity, three target attributes are constructed: thetotal abundance of the Acari group, the total abundanceo ner
biodiversity(2).
H = −S∑
i=1
pi log2pi (2)
wherepi is the proportion of speciesi in the sampleandS the total number of species.
3. Regression and Model trees
The models that we present in this paper are singleand multi-objective regression trees and model trees.The following two sections briefly describe the theorybehind such models and the systems that we have usedfor constructing them.
3.1. Regression trees, multi-objective regressiontrees and the Clus system
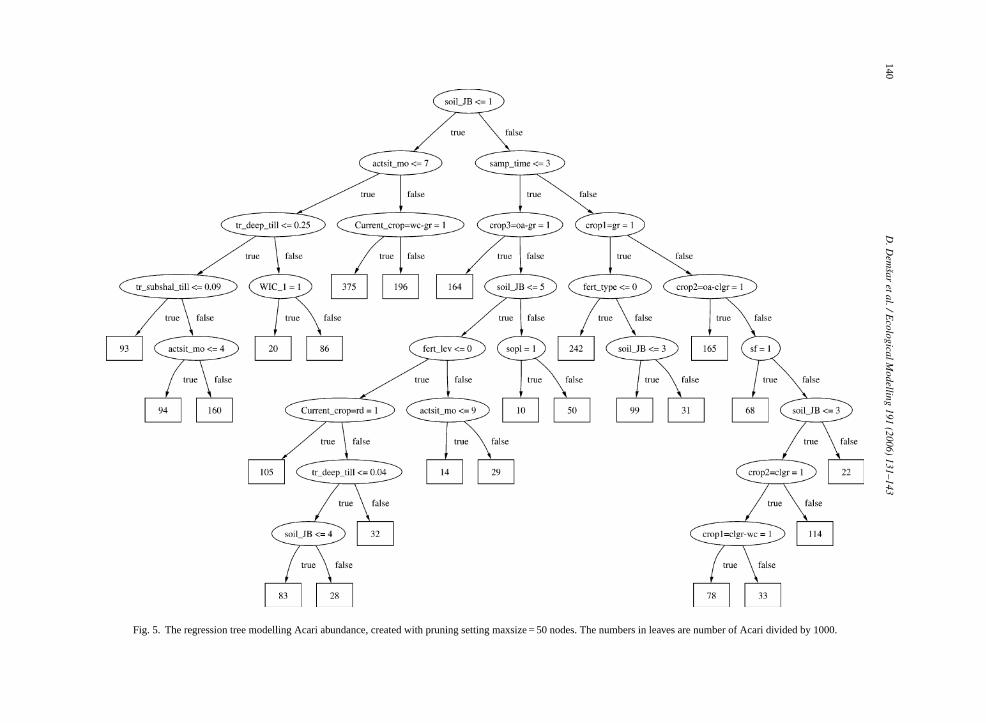
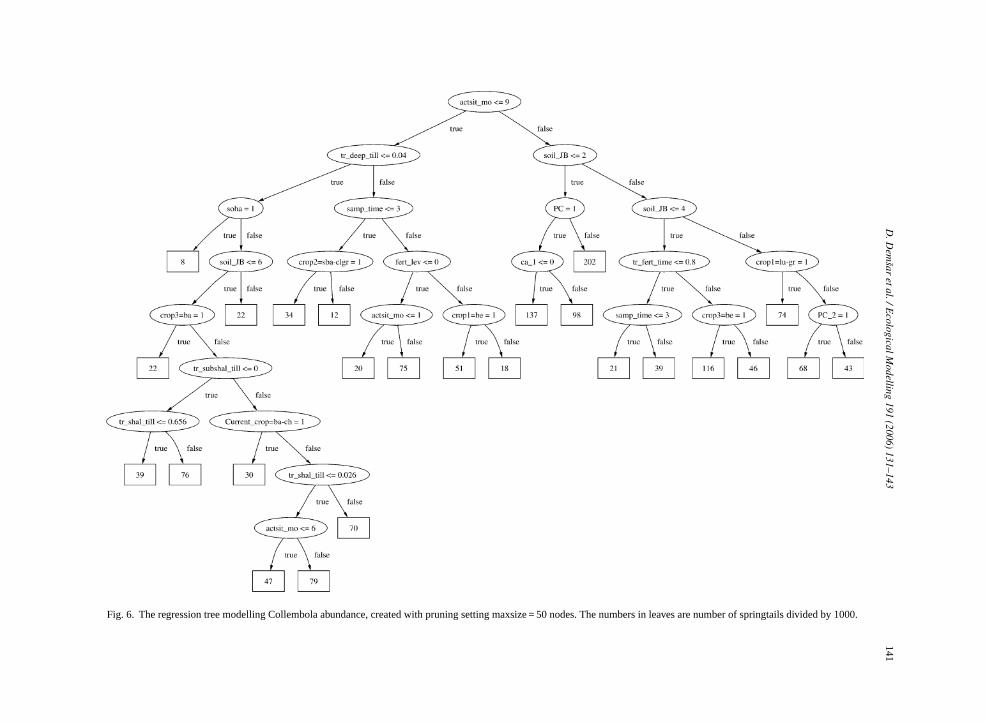
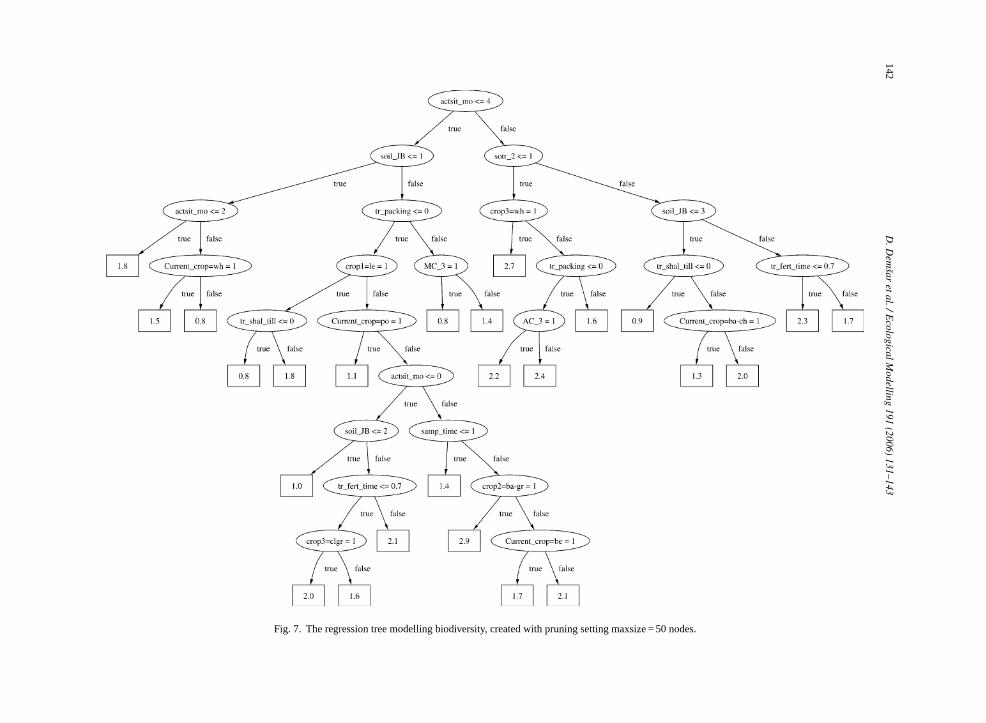
Regression trees are predictive models capable ofmodelling a numeric target (Breiman et al., 1984).Examples of regression trees can be found inFigs. 5–7.The internal nodes of a regression tree contain tests onthe input attributes and the leaves store the predictions.The prediction for a new data record is obtained bysorting it down the tree, starting from the root (the topof the tree). For each internal node encountered on thepath, the test stored in the node is applied to the givenrecord, and if it succeeds, the record is sorted down thel ight
f the Collembolan group, and the Shannon-Wie eft subtree; if it fails, the path continues along the r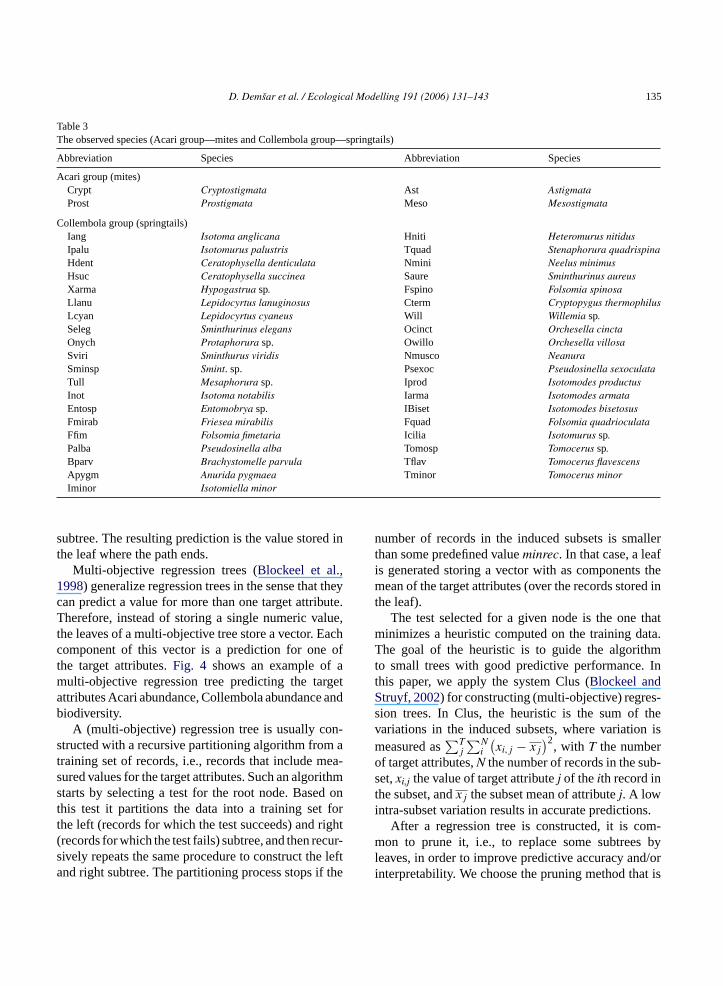
D. Demsar et al. / Ecological Modelling 191 (2006) 131–143 135
Table 3The observed species (Acari group—mites and Collembola group—springtails)
Abbreviation Species Abbreviation Species
Acari group (mites)Crypt Cryptostigmata Ast AstigmataProst Prostigmata Meso Mesostigmata
Collembola group (springtails)Iang Isotoma anglicana Hniti Heteromurus nitidusIpalu Isotomurus palustris Tquad Stenaphorura quadrispinaHdent Ceratophysella denticulata Nmini Neelus minimusHsuc Ceratophysella succinea Saure Sminthurinus aureusXarma Hypogastrua sp. Fspino Folsomia spinosaLlanu Lepidocyrtus lanuginosus Cterm Cryptopygus thermophilusLcyan Lepidocyrtus cyaneus Will Willemia sp.Seleg Sminthurinus elegans Ocinct Orchesella cinctaOnych Protaphorura sp. Owillo Orchesella villosaSviri Sminthurus viridis Nmusco NeanuraSminsp Smint. sp. Psexoc Pseudosinella sexoculataTull Mesaphorura sp. Iprod Isotomodes productusInot Isotoma notabilis Iarma Isotomodes armataEntosp Entomobrya sp. IBiset Isotomodes bisetosusFmirab Friesea mirabilis Fquad Folsomia quadrioculataFfim Folsomia fimetaria Icilia Isotomurus sp.Palba Pseudosinella alba Tomosp Tomocerus sp.Bparv Brachystomelle parvula Tflav Tomocerus flavescensApygm Anurida pygmaea Tminor Tomocerus minorIminor Isotomiella minor
subtree. The resulting prediction is the value stored inthe leaf where the path ends.
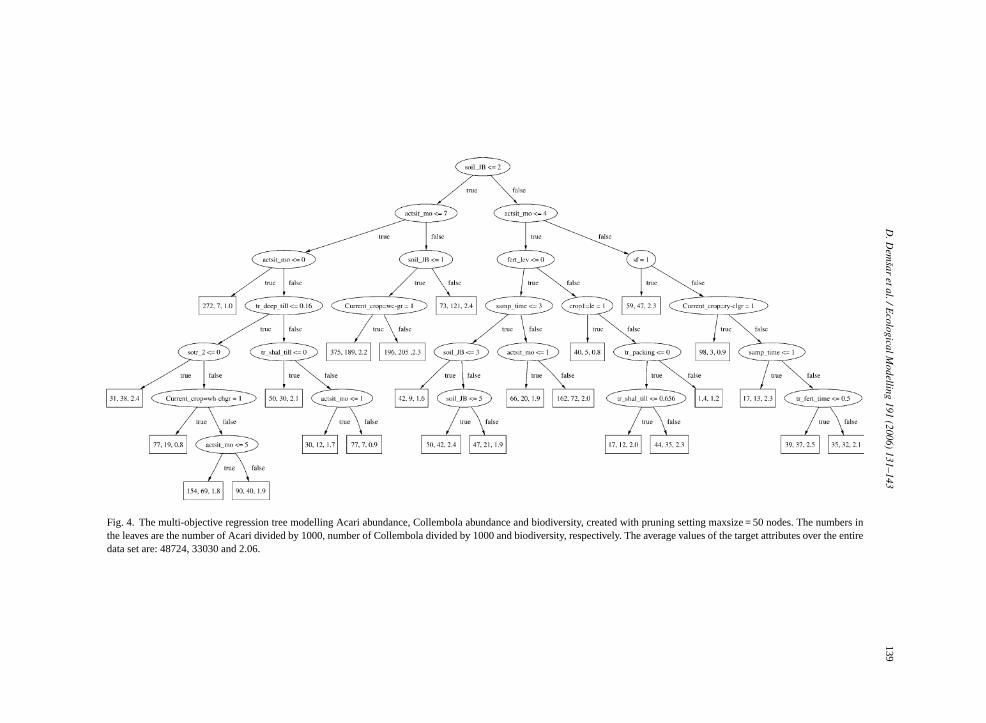
Multi-objective regression trees (Blockeel et al.,1998) generalize regression trees in the sense that theycan predict a value for more than one target attribute.Therefore, instead of storing a single numeric value,the leaves of a multi-objective tree store a vector. Eachcomponent of this vector is a prediction for one ofthe target attributes.Fig. 4 shows an example of amulti-objective regression tree predicting the targetattributes Acari abundance, Collembola abundance andbiodiversity.
A (multi-objective) regression tree is usually con-structed with a recursive partitioning algorithm from atraining set of records, i.e., records that include mea-sured values for the target attributes. Such an algorithmstarts by selecting a test for the root node. Based onthis test it partitions the data into a training set forthe left (records for which the test succeeds) and right(records for which the test fails) subtree, and then recur-sively repeats the same procedure to construct the leftand right subtree. The partitioning process stops if the
number of records in the induced subsets is smallerthan some predefined valueminrec. In that case, a leafis generated storing a vector with as components themean of the target attributes (over the records stored inthe leaf).
The test selected for a given node is the one thatminimizes a heuristic computed on the training data.The goal of the heuristic is to guide the algorithmto small trees with good predictive performance. Inthis paper, we apply the system Clus (Blockeel andStruyf, 2002) for constructing (multi-objective) regres-sion trees. In Clus, the heuristic is the sum of thevariations in the induced subsets, where variation ismeasured as
∑Tj
∑Ni
(xi,j − xj
)2, with T the numberof target attributes,N the number of records in the sub-set,xi,j the value of target attributej of theith record inthe subset, andxj the subset mean of attributej. A lowintra-subset variation results in accurate predictions.
After a regression tree is constructed, it is com-mon to prune it, i.e., to replace some subtrees byleaves, in order to improve predictive accuracy and/orinterpretability. We choose the pruning method that is
136 D. Demsar et al. / Ecological Modelling 191 (2006) 131–143
proposed byGarofalakis et al., 2003. Essentially, thisis a dynamic programming optimization method thatselects a subtree from the constructed tree with at mostmaxsize nodes and minimum training set error (meansquared error, summed over all target attributes). Weemploy this particular method because we are inter-ested in obtaining small and interpretable trees, i.e.,we setmaxsize to a manageable value and the algo-rithm then returns the best subtree satisfying this sizeconstraint.
3.2. Model trees and the M5′ system
We compare the regression trees built by Clus tomodel trees (Quinlan, 1992). Model trees differ fromregression trees in the sense that the leaves do not con-tain numeric values, but linear regression models. Inorder to obtain a prediction with a model tree, the givenrecord is sorted into a leaf and then the correspondinglinear model is applied to obtain the actual prediction.Model trees are generally more accurate than regres-sion trees, but more difficult to interpret because ofthe linear models. In the experiments, we apply theM5′ (Wang and Witten, 1997) system for inducingmodel trees, which is available in the Weka (Wittenand Frank, 1999) data mining toolkit. Note that M5′can only generate single-objective trees and that it usesa heuristic and pruning method that differs from theones employed by Clus.
4
aveb uesp std e them sw them
4
iss nce,C paret ulti-o ing,
three regression trees are constructed: one predictingAcari abundance, one Collembola abundance and onebiodiversity. In the multi-objective setting a single treepredicts all of these three target attributes at once.While multi-objective trees can yield a lower predic-tive performance, they have the important advantagethat they are easier to interpret. Obviously interpret-ing one single tree is less difficult than three differ-ent trees. Moreover, the multi-objective model allowsone to identify conditions that have different effectson target attributes, e.g., if a particular leaf predictsan Acari abundance above average and a biodiversitybelow average, then one can conclude that the condi-tions describing the leaf have a positive effect on Acarispecies, but a negative effect on other species and bio-diversity.
Since we are interested in obtaining simple andunderstandable trees, we constrain the number of nodesin a tree to be less thanmaxsize. To be able to quantifythe possible performance loss incurred by smaller treeswe experiment with different values of this parameter:400, 200, 100, 50, 20 and 10. In all experiments, theminrec parameter of Clus was set to 5. For the multi-objective trees, we also enabled normalization, whichinternally transforms the target attributes by subtractingthe mean and dividing them by their standard deviation.In this way, each target attribute has a similar contribu-tion in the computation of the heuristic and in the errorestimate used by the pruning method. All other param-eters are set to their default values. We also performa em ana ze).
delsi rrorm AE,r ear-s reo rroro .
5
bet-tc iver sults
. Experiments
In this section we discuss the models that heen obtained by applying the modelling techniqresented in Section3 to the available data. We firescribe the experimental setup. Next, we comparodels obtained with Clus and M5′. The section endith a discussion of the knowledge entailed byodels.
.1. Setup
As discussed in Section2, the data set used in thtudy contains three target attributes: Acari abundaollembola abundance and biodiversity. We com
wo settings: single-objective regression and mbjective regression. In the single-objective sett
number of experiments with M5′ where we vary thinrec parameter (in order to find a model tree withcceptable compromise between accuracy and si
The predictive performance of each of the mos estimated with ten-fold cross validation. The e
easures used are: relative mean absolute error RMelative root mean squared error RRMSE and the Pon correlation coefficientr. The relative measures abtained by dividing the error of the model by the ef a baseline model that always predicts the mean
. Results
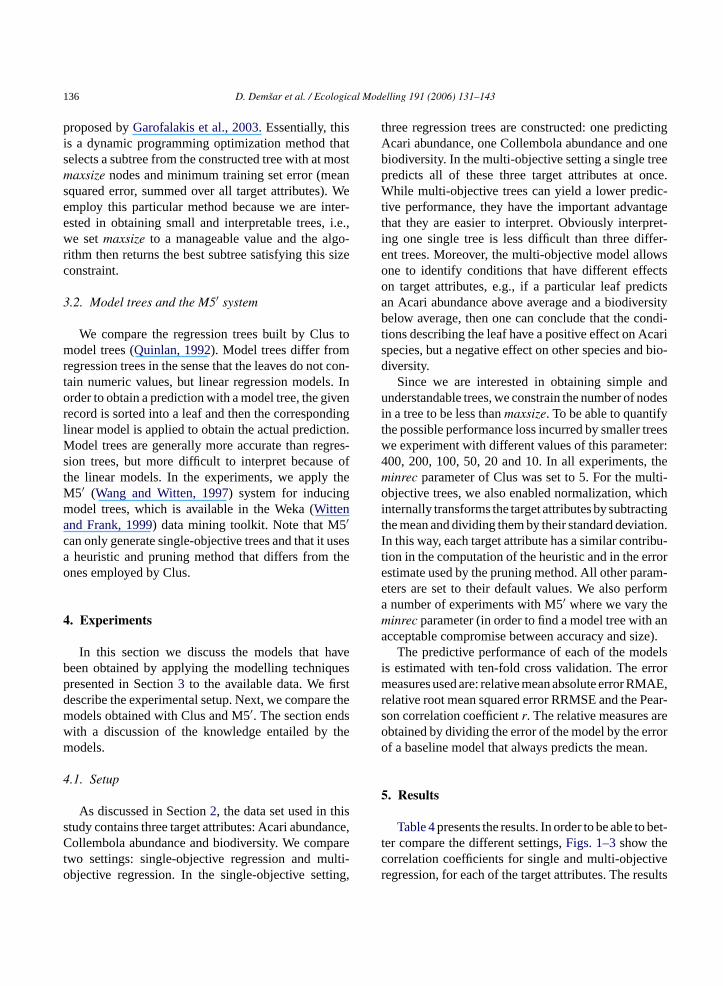
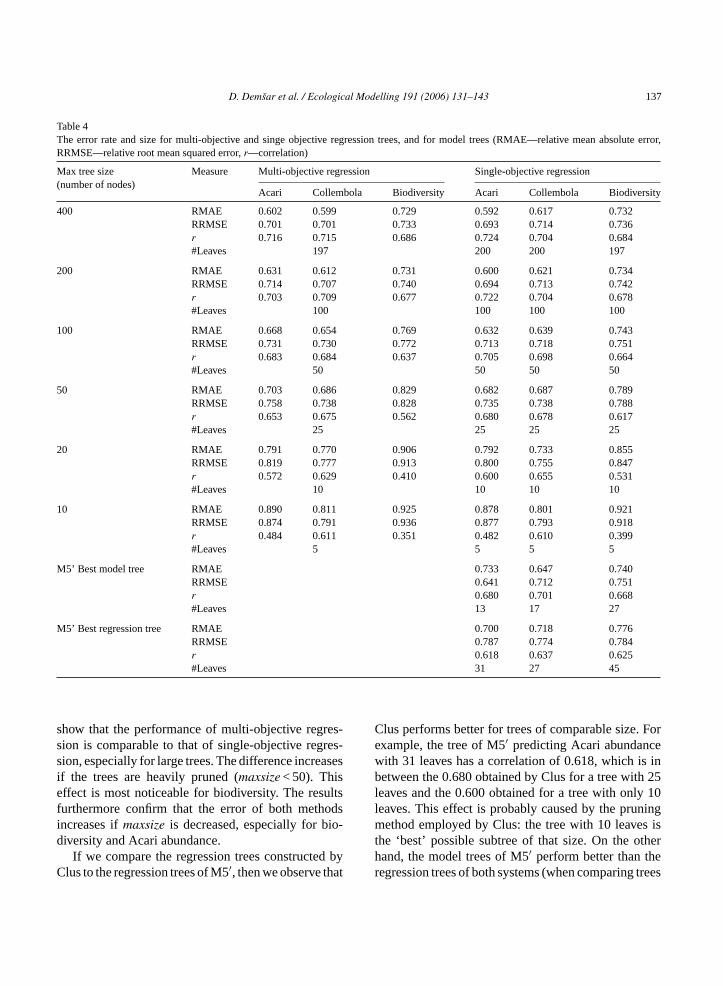
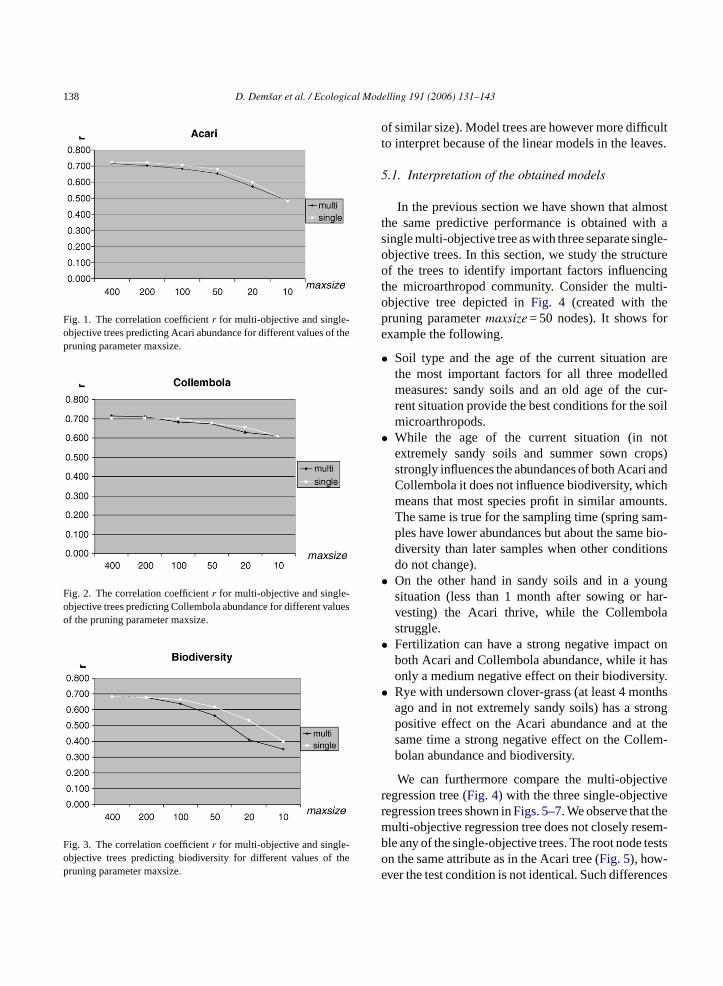
Table 4presents the results. In order to be able toer compare the different settings,Figs. 1–3show theorrelation coefficients for single and multi-objectegression, for each of the target attributes. The re
D. Demsar et al. / Ecological Modelling 191 (2006) 131–143 137
Table 4The error rate and size for multi-objective and singe objective regression trees, and for model trees (RMAE—relative mean absolute error,RRMSE—relative root mean squared error,r—correlation)
Max tree size(number of nodes)
Measure Multi-objective regression Single-objective regression
Acari Collembola Biodiversity Acari Collembola Biodiversity
400 RMAE 0.602 0.599 0.729 0.592 0.617 0.732RRMSE 0.701 0.701 0.733 0.693 0.714 0.736r 0.716 0.715 0.686 0.724 0.704 0.684#Leaves 197 200 200 197
200 RMAE 0.631 0.612 0.731 0.600 0.621 0.734RRMSE 0.714 0.707 0.740 0.694 0.713 0.742r 0.703 0.709 0.677 0.722 0.704 0.678#Leaves 100 100 100 100
100 RMAE 0.668 0.654 0.769 0.632 0.639 0.743RRMSE 0.731 0.730 0.772 0.713 0.718 0.751r 0.683 0.684 0.637 0.705 0.698 0.664#Leaves 50 50 50 50
50 RMAE 0.703 0.686 0.829 0.682 0.687 0.789RRMSE 0.758 0.738 0.828 0.735 0.738 0.788r 0.653 0.675 0.562 0.680 0.678 0.617#Leaves 25 25 25 25
20 RMAE 0.791 0.770 0.906 0.792 0.733 0.855RRMSE 0.819 0.777 0.913 0.800 0.755 0.847r 0.572 0.629 0.410 0.600 0.655 0.531#Leaves 10 10 10 10
10 RMAE 0.890 0.811 0.925 0.878 0.801 0.921RRMSE 0.874 0.791 0.936 0.877 0.793 0.918r 0.484 0.611 0.351 0.482 0.610 0.399#Leaves 5 5 5 5
M5’ Best model tree RMAE 0.733 0.647 0.740RRMSE 0.641 0.712 0.751r 0.680 0.701 0.668#Leaves 13 17 27
M5’ Best regression tree RMAE 0.700 0.718 0.776RRMSE 0.787 0.774 0.784r 0.618 0.637 0.625#Leaves 31 27 45
show that the performance of multi-objective regres-sion is comparable to that of single-objective regres-sion, especially for large trees. The difference increasesif the trees are heavily pruned (maxsize < 50). Thiseffect is most noticeable for biodiversity. The resultsfurthermore confirm that the error of both methodsincreases ifmaxsize is decreased, especially for bio-diversity and Acari abundance.
If we compare the regression trees constructed byClus to the regression trees of M5′, then we observe that
Clus performs better for trees of comparable size. Forexample, the tree of M5′ predicting Acari abundancewith 31 leaves has a correlation of 0.618, which is inbetween the 0.680 obtained by Clus for a tree with 25leaves and the 0.600 obtained for a tree with only 10leaves. This effect is probably caused by the pruningmethod employed by Clus: the tree with 10 leaves isthe ‘best’ possible subtree of that size. On the otherhand, the model trees of M5′ perform better than theregression trees of both systems (when comparing trees
138 D. Demsar et al. / Ecological Modelling 191 (2006) 131–143
Fig. 1. The correlation coefficientr for multi-objective and single-objective trees predicting Acari abundance for different values of thepruning parameter maxsize.
Fig. 2. The correlation coefficientr for multi-objective and single-objective trees predicting Collembola abundance for different valuesof the pruning parameter maxsize.
Fig. 3. The correlation coefficientr for multi-objective and single-objective trees predicting biodiversity for different values of thepruning parameter maxsize.
of similar size). Model trees are however more difficultto interpret because of the linear models in the leaves.
5.1. Interpretation of the obtained models
In the previous section we have shown that almostthe same predictive performance is obtained with asingle multi-objective tree as with three separate single-objective trees. In this section, we study the structureof the trees to identify important factors influencingthe microarthropod community. Consider the multi-objective tree depicted inFig. 4 (created with thepruning parametermaxsize = 50 nodes). It shows forexample the following.
• Soil type and the age of the current situation arethe most important factors for all three modelledmeasures: sandy soils and an old age of the cur-rent situation provide the best conditions for the soilmicroarthropods.
• While the age of the current situation (in notextremely sandy soils and summer sown crops)strongly influences the abundances of both Acari andCollembola it does not influence biodiversity, whichmeans that most species profit in similar amounts.The same is true for the sampling time (spring sam-ples have lower abundances but about the same bio-diversity than later samples when other conditionsdo not change).
• On the other hand in sandy soils and in a youngar-la
• t onhasity.
• nthsrongthe
em-
tiver er em em-b testsoe ces
situation (less than 1 month after sowing or hvesting) the Acari thrive, while the Collembostruggle.Fertilization can have a strong negative impacboth Acari and Collembola abundance, while itonly a medium negative effect on their biodiversRye with undersown clover-grass (at least 4 moago and in not extremely sandy soils) has a stpositive effect on the Acari abundance and atsame time a strong negative effect on the Collbolan abundance and biodiversity.
We can furthermore compare the multi-objecegression tree (Fig. 4) with the three single-objectivegression trees shown inFigs. 5–7. We observe that thulti-objective regression tree does not closely resle any of the single-objective trees. The root noden the same attribute as in the Acari tree (Fig. 5), how-ver the test condition is not identical. Such differen
D.D
emsar
etal./EcologicalM
odelling191
(2006)131–143
139
Fig. 4. The multi-objective regression tree modelling Acari abundance, Collembola abundance and biodiversity, created with pruning setting maxsize = 50 nodes. The numbers inthe leaves are the number of Acari divided by 1000, number of Collembola divided by 1000 and biodiversity, respectively. The average values of the target attributes over the entiredata set are: 48724, 33030 and 2.06.
140D
.Dem
saretal./E
cologicalModelling
191(2006)
131–143
Fig. 5. The regression tree modelling Acari abundance, created with pruning setting maxsize = 50 nodes. The numbers in leaves are number of Acari divided by 1000.
D.D
emsar
etal./EcologicalM
odelling191
(2006)131–143
141
Fig. 6. The regression tree modelling Collembola abundance, created with pruning setting maxsize = 50 nodes. The numbers in leaves are number of springtails divided by 1000.
142D
.Dem
saretal./E
cologicalModelling
191(2006)
131–143
Fig. 7. The regression tree modelling biodiversity, created with pruning setting maxsize = 50 nodes.
D. Demsar et al. / Ecological Modelling 191 (2006) 131–143 143
in trees are to be expected because decision trees areknown to be unstable, e.g., for a given data set, typi-cally many trees exist that have a comparable predictiveperformance. Some similarities between the trees nev-ertheless do exist. The attributes that Clus selected assplitting criteria in the nodes are similar in all four trees.This confirms that soil type, age of the current situa-tion, tillage, the use of crops belonging to the familyof grasses, etc. are important for the community of soilmicroarthropods.
6. Conclusions
We have modelled the community of soil micro-arthropods in agricultural soil with machine learningmethods based on data describing chemical, biolog-ical and mechanical actions on the fields. We usedthe obtained models to identify the most importantparameters influencing the abundance of soil mites andspringtails and the biodiversity of soil microarthropods.In particular, we show that the most important param-eters are the soil type, the age of the current situation,and the different forms of tillage. We also identifiedthe different effects of one action on several agricul-tural measures: some actions have a positive effect onone type of soil microarthropods and a negative effecton other types. We gained knowledge that will help usin further modelling and, in the end, in building a deci-sion support system for the management of farms. Weh n beu ccu-r aina romd
Acknowledgements
This work is supported by the ECOGEN projectfunded by the Fifth European Community FrameworkProgramme: Quality of Life and management of liv-ing resources contract no QLK5-CT-2002-01666 andDARCOF, Nature quality in organic farming.
References
Blockeel, H., Struyf, J., 2002. Efficient algorithms for decision treecross-validation. J. Mach. Learn. Res. 3 (Dec), 621–650.
Blockeel, H., De Raedt, L., Ramon, J., 1998. Top-down inductionof clustering trees. In: Shavlik, J. (Ed.), Proceedings of the 15thInternational Conference on Machine Learning, pp. 55–63.
Breiman, L., Friedman, J.H., Olshen, R.A., Stone, C.J., 1984. Clas-sification and Regression Trees. Wadsworth.
Demsar, D., Dzeroski, S., Krogh, P.H., Larsen, T., 2003. Identifyingthe most important agricultural factors for the soil community ofmicroathropods. In: Proceedings of the International Electrotech-nical and Computer Science Conference, Ljubljana, Slovenia.
Garofalakis, N., Hyun, D., Rastogi, R., Shim, K., 2003. Buildingdecision trees with constraints. Data Mining Knowl. Discov. 7(2), 187–214.
Krogh, P.H., 1994. Microarthropods as bioindicators. A study of dis-turbed populations. PhD thesis Ministry of the Environment andEnergy. National Environmental Research Institute, Silkeborg.
Quinlan, J.R., 1992. Learning with continuous classes. In: Pro-ceedings of the Fifth Australian Joint Conference on ArtificialIntelligence, pp. 343–348.
Steen, E., 1983. Soil animals in relation to agricultural practices andsoil productivity. Swedish J. Agric. Res. 13, 157–165.
Wang, Y. and Witten, I.H., 1997. Induction of model trees for pre-ers ofics
W arn-San
ave also shown that machine learning models cased in multiple ways: they can be used to predict aate values, to gain new knowledge about the domt hand, and to assist us in obtaining knowledge fomain experts.
dicting continuous classes. Proceedings of the poster papthe ECML 97. University of Economics, Faculty of Informatand Statistics, Prague.
itten, I.H., Frank, E., 1999. Data Mining: Practical machine leing tools with Java im-plementations. Morgan Kaufmann,Francisco.
Related Documents


