USING MANIPULATIVES AND VISUAL CUES WITH EXPLICIT VOCABULARY ENHANCEMENT FOR MATHEMATICS INSTRUCTION WITH GRADE THREE AND FOUR LOW ACHIEVERS IN BILINGUAL CLASSROOMS A Dissertation by EDITH POSADAS GARCIA Submitted to the Office of Graduate Studies of Texas A&M University in partial fulfillment of the requirements for the degree of DOCTOR OF PHILOSOPHY May 2004 Major Subject: Educational Psychology brought to you by CORE View metadata, citation and similar papers at core.ac.uk provided by Texas A&M University

Welcome message from author
This document is posted to help you gain knowledge. Please leave a comment to let me know what you think about it! Share it to your friends and learn new things together.
Transcript

USING MANIPULATIVES AND VISUAL CUES WITH EXPLICIT VOCABULARY
ENHANCEMENT FOR MATHEMATICS INSTRUCTION WITH GRADE THREE
AND FOUR LOW ACHIEVERS IN BILINGUAL CLASSROOMS
A Dissertation
by
EDITH POSADAS GARCIA
Submitted to the Office of Graduate Studies of Texas A&M University
in partial fulfillment of the requirements for the degree of
DOCTOR OF PHILOSOPHY
May 2004
Major Subject: Educational Psychology
brought to you by COREView metadata, citation and similar papers at core.ac.uk
provided by Texas A&M University

USING MANIPULATIVES AND VISUAL CUES WITH EXPLICIT VOCABULARY
ENHANCEMENT FOR MATHEMATICS INSTRUCTION WITH GRADE THREE
AND FOUR LOW ACHIEVERS IN BILINGUAL CLASSROOMS
A Dissertation
by
EDITH POSADAS GARCIA
Submitted to Texas A&M University in partial fulfillment of the requirements
for the degree of
DOCTOR OF PHILOSOPHY
Approved as to style and content by:
_____________________________ _________________________ Rafael Lara-Alecio Richard Parker (Co-chair of Committee) (Co-chair of Committee) _____________________________ __________________________ Salvador Hector Ochoa Robert Slater (Member) (Member) _________________________________ Victor Willson (Head of Department)
May 2004
Major Subject: Educational Psychology

iii
ABSTRACT
Using Manipulatives and Visual Cues with Explicit Vocabulary
Enhancement for Mathematics Instruction with Grade Three and Four
Low Achievers in Bilingual Classrooms. (May 2004)
Edith Posadas Garcia, B.S., University of Texas-Pan American;
M.Ed., Prairie View A&M University
Co-Chairs of Advisory Committee: Dr. Rafael Lara-Alecio Dr. Richard Parker
A study was conducted to assess the effects of two instructional strategies:
manipulative-based instruction and visual cues in mathematics (both enhanced by
explicit vocabulary enrichment) in a small group setting with young Hispanic students
who are English language learners. The duration of the study was five weeks. Sixty-
four third and fourth grade students were selected for participation based on their
performance with problem solving items from the four release tests for 1999-2002
mathematics Texas Assessment of Academic Skills (TAAS) for third and fourth grades.
A pre-assessment composed of 10 of the 13 TAAS objectives were administered. The
four preselected objectives on which the students scored the lowest were identified for
further instruction and assessment. The student population was limited to those of the
original sixty-four achieving <55% overall on the pre-assessment. Following each week
of instruction, a different assessment/probe was administered, for a total of 6 probes—
including the initial pretest. For instruction, students were organized into three groups:
1) manipulative based instruction, 2) visual (drawings) cue instruction, and 3) no
iv
additional mathematical instruction. The students in the three groups were of equivalent
mathematical ability, and every effort was made to ensure the groups had the same
number of students.
Pre-posttest improvement was measured with a mixed ANOVA (repeated measures,
with a grouping factor), with instructional group as the grouping factor, and the pre/post
assessment of math as the repeated measure. ANOVA results included non-significant
progress for either grade level. Neither of the experimental groups in grades three or four
showed significant improvement between the pre and post assessment.
Six sequential probes also were administered throughout the five-week study. A
trend analysis for the three separate groups was conducted on the probe results to
evaluate growth over time; trend analyses were conducted for each individual student
and then averaged for each group. For the two experimental groups, the overall
improvement at third and fourth grades was minimal. Overall, gradual improvement
was noted, but the progress did not consistently occur from one week to another, and the
improvement trend was not linear.

v
This dissertation is dedicated to all of you, who through God’s
grace, gave me the courage to nurture my dreams, to keep hope
alive in spite of adversity, and persevere in the face
of seemingly overwhelming obstacles.

vi
ACKNOWLEDGEMENTS
Someone once said that there is no limit to what you can accomplish, as long as you
set your goals and remain true to your aspirations. This dissertation was accomplished
with the help and support of many people:
To my two children—Samantha Nicole and Robert James—your love is my joy and
my strength.
To the father of my children, who in sharing them with me provided the living
embodiment of the children who inspired my search for knowledge.
To my father, Ismael Posadas, and my mother, Olga Garcia, who have made me who
I am today. They instilled in me values, morals, character and the drive to succeed. But
most importantly, they believed in me.
To Karen Hackler, who supported and encouraged me from the beginning and
remained calm when work and school work became overwhelming.
To my friend Mel, who constantly reminded me to focus on God and was there for
me as my support system and who genuinely demonstrates everyday the meaning of true
friendship.
To my colleague, Joy Kanyo, for her feedback and support. You are a true
professional and a person filled with wisdom, knowledge, experience and a teacher at
heart.
To the members of my committee—Co-chairs Rafael Lara-Alecio and Richard
Parker, Hector Ochoa and Robert Slater— for their time and support. A special thanks
to Dr. Richard Parker for his important feedback, encouragement and support who
unselfishly gave his time.

vii
To my colleagues in the Waller Independent School District—Richard McReavy,
Danny Twardowski and other staff—who supported me daily in my professional
endeavors.
And finally, I thank God, my companion, who at times carried me through and is
profoundly real to me in the midst of all my trying moments, and who has proven that he
can indeed be the pillar of strength we all need.

viii
TABLE OF CONTENTS Page
ABSTRACT……………………………………………………………………… iii
DEDICATION…………………………………………………………………… v
ACKNOWLEDGEMENTS……………………………………………………… vi
TABLE OF CONTENTS………………………………………………………… viii
LIST OF FIGURES……………………………………………………………… x
LIST OF TABLES………………………………………………………………. xi
CHAPTER
I INTRODUCTION……………………………………………….. 1
Relevance of Study………………………………………. 4 Purpose of the Study……………………………………... 6 Research Questions………………………………………. 7 Definition of Terms………………………………………. 7 II REVIEW OF RELATED LITERATURE………………….……. 9 Use of Manipulatives in Mathematics Instruction……….. 9 Use of Visual and Drawings in Mathematics Instruction………………………………………………… 14 Relationship between Mathematics and Language/Vocabulary Development………….……… 19 Academic Achievement and Mathematics Ability of Bilingual Learners………. …………………….. 28 Summary………………………………………………….. 35 III METHODS……………………………………………………........ 36 Context of Study and Sample………………………........... 36 Bilingual Education Program………………………............ 37 Participants…………………………………………........... 38 Instrumentation……………………………………………. 39 Instrument Validity ……………………………………….. 43 Interventions ……………………………………………… 50 Research Design……………………………………............ 51 Data Analysis………………………………………………. 57

ix
CHAPTER Page
IV RESULTS………………………………………………........... 59
Descriptive Information on 3rd and 4th Grade Study Participants……………………… 60 Descriptive Results of the Pre-Assessment Mathematic Performance………………………………… 66 Instrument Reliability on Pre/Post Assessment Instruments………………………………………………… 74 Research Question One……………………………............ 76 Research Question Two………………………………… 82 Instrument Reliability for the Mini-Probes………………… 83 Summary of Graphical Representation for Third Grade Manipulative, Visual and Comparison Groups…… 94 Summary of Graphical Representation for Fourth Grade Manipulative, Visual and Comparison Groups…… 95 Individual Slope Coefficients for Third Grade Students….. 97 Individual Slope Coefficients for Fourth Grade Students… 98 V SUMMARY, CONCLUSIONS, LIMITATIONS AND RECOMMENDATIONS …………………………………….. 100 Discussion………………………………………………… 110 Limitations of the Study …………………………………. 113 Implications for Future Research ……………………...…. 115 Conclusion………………………………………………… 117 REFERENCES…………………………………………………………………… 119
APPENDICES……………………………………………………………………. 137
VITA……………………………………………………………………………… 169

x
LIST OF FIGURES
FIGURE Page
1 Box plots of Pre-Assessment Results for All Thirty-two Third Grade Students by Group………………………….…………………………. 69 2 Box plots of Pre-Assessment Results for All Thirty-two Fourth Grade Students by Group………………………….…………………………. 71 3 ANOVA Interaction Graphs for Third Grade…………….………………79 4 ANOVA Interaction Graphs for Fourth Grade…………………………. 82 5 Third Grade Manipulatives Group’s Growth Over Time for Six Weekly Mathematical Probes…………………………………………. 84 6 Third Grade Visual Group’s Growth over Time for Six Weekly Mathematical Probes………………..……………………….. 86 7 Third Grade Comparison Group’s Growth Over Time for Six Weekly Mathematical Probes…………………………………………. 87 8 Fourth Grade Manipulatives Group’s Growth Over Time for Six Weekly Mathematical Probes…………………………………………. 89 9 Fourth Grade Visual Group’s Growth Over Time for Six Weekly Mathematical Probes…………………….……………..... 91 10 Fourth Grade Comparison Group’s Growth Over Time for Six Weekly Mathematical Probes………………………………………… 93

xi
LIST OF TABLES
TABLE Page
1 Comparison of Difficulty Level for the Same Objective………………. 43
2 TAAS Mathematical Objectives Used in the Study………………….. 46
3 Comparison of Original TAAS Question with Created Question……………………………………………………………….. 47 4 Descriptive Information for Third Grade Participants …………………. 61 5 Descriptive Information for Fourth Grade Participants……………….. 62 6 Descriptive Information for Third Grade Participant Student’s General School Performance……………………………………………………. 63 7 Descriptive Information for Fourth Grade Participant Student’s General School Performance…………...……………………………………….. 65 8 Quantile Distribution Table Showing Percent of Students Scoring in Each Quartile of the Pre-Assessment ……………………… 68 9 Descriptive Statistics for All Students for the Pre-Assessment ……….. 72 10 Descriptive Statistics for Third Grade Students for the Pre-Assessment......................................................................................... 73 11 Descriptive Statistics for Fourth Grade Students for the Pre-Assessment…………………………………………………………. 74 12 Third Grade Analysis of Variance……………………………………... 77 13 Third Grade Means and Standard Deviation from ANOVA………….. 78 14 Fourth Grade Analysis of Variance Table ……….……………………. 80

xii
TABLE Page 15 Fourth Grade Means and Standard Deviation from ANOVA…………. 81 16 Descriptive Statistics for Third Grade Students for the Mini- Probes for Third Grade Manipulatives Group………………………… 85 17 Descriptive Statistics for Third Grade Students for the Mini- Probes for Third Grade Visual Group………………………………..... 87 18 Descriptive Statistics for Third Grade Students for Mini- Probes for Third Grade Comparison Group……………………………. 88 19 Descriptive Statistics for Fourth Grade Students for the Mini- Probes for Fourth Grade Manipulatives Group………………………... 90 20 Descriptive Statistics for Fourth Grade Students for the Mini- Probes for Fourth Grade Visual Group………………………………… 92 21 Descriptive Statistics for Fourth Grade Students for Mini- Probes for Comparison Group…………….…………………………... 94 22 Raw Score Slope Coefficient for Third Grade Manipulative, Visual and Comparison Groups………………………………………... 97 23 Raw Slope Coefficient for Fourth Grade Manipulative, Visual and Comparison Group ……………………………………….. 98

1
CHAPTER I
INTRODUCTION
According to the US Census Bureau, by the year 2025, Hispanic Americans will
account for 18 percent of the U.S. population. In 2000-2001 within Texas, 570,453
English language learners (ELL) were identified and served in bilingual and ESL
programs (Texas Education Agency [TEA] PEIMS, 2001). As the Hispanic American
student population increases in Texas, failure rates and low achievement rates also
increase for these students. Achievement differences between language minority and
language majority students have been documented (Cocking & Chipman, 1998).
Language minority students tend to score lower than Caucasian students on
standardized tests of mathematic achievement at all grade levels. As there is no
evidence to suggest that the basic abilities of minority students are different from
Caucasian students, researchers speculate that the differential performance may be due
in part to differences in English proficiency and inequalities of a challenging curriculum
(Cocking & Chipman, 1998; Mestre, 1988). Effective instructional strategies should
specifically target the academic needs of Hispanic and struggling learners in
mathematics.
The overall passing rate of Hispanics in mathematics in Texas grades three through
five is 86.9%. However, the new statewide mathematics assessment being developed
promises to be of greater complexity and require a more in depth level of critical
_______________________ This dissertation follows the style and format of the Bilingual Research Journal

2
thinking than the current Texas Assessment of Knowledge and Skills (TAAS) (TEA,
2001). Additionally, large numbers of Hispanic students of all ages in Texas fail to
demonstrate grade-level proficiency in solving word problems (Cawley, Parmar, Foley,
Salmon, & Roy, 2001; National Assessment of Educational Progress, 1992). With the
results of the proposed study I hope to contribute to the research base and to facilitate
knowledge of effective instruction to teachers so they may deliver effective instruction
to improve Hispanic students’ achievement in mathematics.
Language proficiency also appears to be a contributing factor in problem solving:
nationally, Hispanic American students’ performance on word problems is generally 10-
30% below that on comparable problems in numeric format (Carpenter, Corbitt, Kepner,
Linquist, & Reys, 1980; Cummins, Kintsch, Reusser, & Weimer, 1988; Saxe, 1988;
Noonan, 1990). English language learners’ discrepancy between performance on verbal
and numeric format problems strongly suggests that factors other than mathematical
skills contribute to that failure (August & Hakuta, 1997; Cummins, Kintsch, Reusser, &
Weimer, 1988; LeCelle-Peterson & Rivera, 1994; Zehler, Hopscotch, Fleischmann, &
Greniuk, 1994). A number of studies have provided evidence for a significant, positive
correlation between math achievement and verbal ability (Aiken, 1971; Cocking &
Chipman, 1988). Also DeAvila and Duncan (1981) and Fernandez and Nielson (1986)
found a significant relationship between Hispanics’ English proficiency and their
mathematic achievement. During the instructional component of the study, to minimize
the effects of the students’ limited English proficiency, instruction using manipulatives
and visual cues was in English and Spanish. English language learners (ELL) tend to
spend most of their time on the prerequisite basic skills such as computation and rarely

3
have exposure to high-order mathematics skills such as problem solving (Schwartz,
1991; Secada & Carey, 1990; Stoloff, 1989). Research in England, Japan, China, and
the United States supports the idea that mathematics instruction and student mathematics
understanding will be more effective if manipulative and activities with visual cues are
used (Canny, 1984; Clements & Battista, 1990; Deines, 1960; Driscoll 1981; Fennema,
1972, 1973; Skemp, 1987; Sugiyama, 1987; Suydam, 1984). Additionally, visual cues
have been shown to amplify and explain images and facilitate recall of new knowledge
and to create imagery during learning that is critical to memory processes. Without
these two skills, recall of new knowledge and memory processes, students are unable to
move from concrete operations to abstract concepts successfully (Shephard and Cooper,
1982; Mayer and Gallini, 1990).
Furthermore, ELL need the conceptual based vocabulary that permits them to focus
on key words, to interpret the meaning of sentences presented in the lesson, and to
continue the general language acquisition process by requiring them to interact with
peers and discuss subject matter. Researchers like Markovits and Sowder (1994),
Baroody (1987) and Silver, Kilpatrick and Schlesinger (1990) point out that if students
are encouraged to explore numbers relations through discussion of their own invented
strategies and those of their peers; their intuitive understanding of numbers and number
relations would be used and strengthened. Through this interaction both grammar and
vocabulary are developed, and this process promotes English acquisition in a context-
embedded, cognitively demanding activity that further promotes their understanding of
difficult and abstract concepts (Piskor, 1988, 1986). Caine and Caine (1994) propose
that as educators we must assist students in their search for how to make sense of

4
things. Van de Valle and Watkins (1993) suggest that little research has been done in
effective teaching strategies in early grades.
Relevance of Study
The study examined how vocabulary, manipulatives, and visual cues integrated into
a mathematics lesson affected students’ problem solving skills in mathematics. There is
evidence that ELLs’ achievement improves with the use of hands-on teaching and
testing, permitting hands-on manipulation of three dimensional props (Garcia, 1991;
Tharp, 1989). Other researchers have confirmed the potential for manipulatives in
mathematic instruction, but caution that manipulatives are commonly misused
(Carpenter, Fennema, Fuson, Heibert, Human, Murray, Oliver, & Wearne, 1994).
However, there is limited research that focuses specifically on the use of manipulatives
with Hispanic English language learners.
Much research exists that validates the teaching and use of visualization skills to
enhance learning. Mathematics can be taught and learned visually; communication does
not necessarily refer exclusively to the spoken language. Visual communication in
mathematics is especially important to language minority students or students having
limited proficiency in English (Cummins, 1984). An important skill is that of spatial
sense, for which students may need many and varied experiences with drawing and
visualizing (National Council of Teachers of Mathematics, 1989). The term spatial
sense identifies what has been labeled spatial visualization, visual imagery, visual skill,
mental rotations and visual processes (Bishop, 1993; Davey & Holliday, 1992; Stanic &
Owens, 1990).

5
Vocabulary development is critical for English language learners because we know
that there is a strong relationship between vocabulary knowledge in English and
academic achievement. Without the necessary vocabulary knowledge students do not
recognize concepts already in their schema and failed to visualize accurately. Therefore,
it is necessary that vocabulary is an integral part of the core instruction and for students
to know the vocabulary in order to visualize the concept. A survey of recent second
language acquisition research found that second language vocabulary knowledge is the
single more important factor (of oral proficiency) for academic achievement (Saville-
Troike, 1984). Basic proficiency is not adequate as language minority students do not
have exposure to, or lack an understanding of, the content-specific vocabulary needed to
perform the more demanding tasks required in academic courses (Short & Spanos,
1989). Ruddell (1997) found that when students are shown how to identify key content
vocabulary they become adept at selecting and learning words they need to know. For
example, if students were given a problem of multiplication that asks them to arrange 5
rows of baseball cards so that every row has 5 cards and then determine the total number
of cards, they were unable to perform this task because they did not know the meaning
of row. Because they couldn’t perform the task it seemed that they couldn’t perform the
math concept; however, they might of known the math concept but not understand the
vocabulary. Teachers must therefore pre-teach the vocabulary. Saville-Troike (1988,
p.5) describes transfer as “a preexisting knowledge base for making inferences and
predictions” or a “preexisting script for school”. Hakuta (1990) gives the example that “a
child learning about velocity in Spanish should be able to transfer this knowledge to

6
English with out having to relearn the concepts as long as the relevant vocabulary (in
English) is available.”
In the present study two groups of students received vocabulary instruction prior to
solving mathematical problems. Group I solved the problems using manipulatives and
Group II solved the problems using visual cues. The students were administered five
additional probes during the five weeks of the study to assess their improvement in
problem solving. Later these students were assessed to compare their performance on a
standardized math test⎯a version of the TAAS. A third group of students did not
receive any type of instruction but simply took all of the assessments.
Purpose of the Study
The purpose of the present study was to measure the effectiveness of intensive small
group instruction using three instructional strategies to improve Hispanic bilingual
students’ ability to solve mathematical problems. The setting of the study was third and
fourth grade classrooms in a rural school district in Texas. The project measured the rate
of improvement of a group of students who had high to low mathematical ability skills.
At the same time, the study examined the effectiveness of small group instruction of
these students using vocabulary enrichment, manipulatives, and visual cues. The study
was designed to extend the research into a previously unstudied area: effective
mathematics instruction outside of the class with a small bilingual group composed of at
risk students who are limited English proficient and possess limited English vocabulary.

7
Research Questions
This study addressed two research questions:
1. Based upon pre-post testing, which of two small-group interventions,
emphasizing, a) Manipulatives or b) Visual Cues (and both emphasizing
vocabulary enrichment) conducted four days a week for five weeks, most
improves Hispanic English language learners’ mastery of mathematical concepts
in operation and problem solving, compared to their peers in the comparison
group?
2. Based on progress monitoring probes, when compared to their peers in the
comparison group, to what degree did members of the two experimental groups
improve in mastery of mathematical concepts in operation and problem solving?
Definition of Terms
The terms used in the present study and their definitions follow:
Texas Assessment of Academic Skills (TAAS): A state standardized test administered
at the end of the school year to assess student’s mastery of skill in the following content
areas: math, reading/writing, science, social studies. It is administered to third through
twelfth grade students to assess the students’ objectives and skill established in the state
curriculum.
Texas Assessment of Knowledge and Skills (TAKS): A state level assessment that
replaced the TAAS in 2002-2003 school year. It is administered to third through
twelfth grade students to assess the students’ objectives and skill established in the state
mandated curriculum. Students are assessed in the following content areas: math,
science, social studies and Reading/Writing.

8
Bilingual Education: An instructional setting in which instruction is conducted in
two language: the native language of the student and English.
English Language Learners (ELL): A student whose native language is not English
and the proficiency level in English is not considered sufficient by district and state
criteria.
Oral Language Proficiency Test: An oral assessment that determines the English
language proficiency level of students with a language other than English spoken at
home. It designates three levels of fluency, non-English speaker (NES), limited English
speaker (LES), fluent English speaker (FES).

9
CHAPTER II
REVIEW OF RELATED LITERATURE
Use of Manipulatives in Mathematics Instruction
Clements and McMillan (1996) state that concrete knowledge can be of two types:
“sensory-concrete” which is demonstrated when student’s sensory materials to make
sense of an idea; and “integrated concrete” which is built through learning. Integrated
concrete thinking derives its strength from the combination of many separate ideas in an
interconnected structure of knowledge. When children have this interconnected type of
knowledge, the physical objects, the actions they performed on the objects and the
abstractions they make are all interrelated in a strong mental structure. This is in line
with the constructivist belief that students build their own knowledge; they do not
receive knowledge prepackaged from others (Clements and McMillan, 1996).
In every decade since 1940, the National Council of Teachers of Mathematics
(NCTM) has encouraged the use of manipulatives at all grade levels. Suydam and
Higgins (1977), in a review of activity based mathematics learning K-8, determined that
mathematic achievement increased when manipulatives were used. Sowell (1989)
performed a meta-analysis of 60 studies to examine the effectiveness of manipulatives
used in mathematics with kindergarten through postsecondary students. The consensus
of these studies indicated that manipulatives could be effective; however, they also
suggested that many teachers did not use manipulatives. Sowell also found that long
term use of manipulatives was more effective than short term use. Even so, when

10
manipulatives were used over an extended period of time, teachers’ level of training
critically influenced the effectiveness of manipulatives.
Researchers who examined the potential of manipulatives in mathematics instruction
cautioned that manipulatives were not well used (Carpenter, Fennema, Fuson, Hiebert,
Human, Murray, Oliver, & Wearne, 1994). Regardless of the innate appeal of using
materials, investigations of the effectiveness of the use of concrete materials yielded
mixed results (Benarz & Janvier, 1998; Bughardt, 1992; Hiebert, Wearne, & Taber,
1991; Thompson, J., 1992). P. Thompson (1994) suggested that the apparent
contradictions in studies using manipulatives were probably due to aspects of instruction
and students’ engagement to which the studies did not pay close attention. Just using
concrete material was not enough to guarantee success according to Baroody (1989).
Yet, manipulatives could play a role in students’ construction of meaningful ideas.
In Texas, Chapter 75 of current education law has stated that new concepts should be
introduced with appropriate manipulatives at the elementary and secondary level
(Peavler, DeValcourt, Montalto, & Hopkins, 1987). The new assessment in the state of
Texas, named the Texas Assessments of Knowledge and Skills (TAKS), requires more
rigorous standards than the prior assessment, the Texas Assessment of Academic Skills
(TAAS). Students are expected to be actively involved in structured activities that
develop understanding and enhance the ability to apply skills. Mastery at the concrete
level is to be evaluated by the students’ demonstrating use of manipulatives under
TAKS. However, building concrete interpretations of math problems by using
manipulatives does not by itself ensure student learning (Hiebert et al, 1991).

11
One measure of a student’s knowledge in mathematics is the ability to explain why
and how he/she processed the information to come to a solution (Markovits & Sowder,
1994, Baroody, 1987, Silver, Kilpatrick & Schlesinger, 1990). When a student explains
or writes about the thinking related to the experience of solving the problem he is
involved in metacognitive processes and thus understands his own learning. To be a
good problem solver and be able to explain one’s thinking, one must be proficient in the
language of problem solving. The English language leraners may be at a disadvantage
due to lack of accessibility in the second language rather than an inability to solve the
problem (Mestre, 1981).
Many studies confirmed that young children, regardless of socio-economic
background, possess considerable informal mathematical knowledge that they have
gained through play, but which the curricula may fail to use this knowledge (Bell & Bell,
1988; Resnick, Lesgold, & Bill, 1990; Carpenter, Ansell, Franke, Fennema, &
Weisbeck, 1993). For example, even without instruction, most kindergarten children are
capable of solving a wide range of simple addition and subtraction story problems using
their own inventive methods, often involving objects at hand (Riley, Greeno, & Heller,
1983; Carpenter and Moser, 1984). Multiplication, division, and fraction problems are
also within their reach when manipulatives are available (Carpenter, Ansell, Franke,
Fennema, & Weisbeck, 1993).
The need for increased use of manipulatives during instruction and self-initiated play
or learning in schools was recognized before 1990 and educators continue to advocate
using a variety of forms to represent mathematical ideas and concepts for students.
Research findings (Suydam, 1984, 1986) and theoretical considerations (Hiebert, 1984,

12
1988; Lesh, Post, Behr, 1987) have supported the use of manipulatives in school. For
example, when physical three dimensional objects are available, students experience
mathematics as processes that demand thought, creativity and understanding (Davis,
1984). This is in sharp contrast to the limited learning that occurs when students
participate only in seatwork on algorithms or procedures (Carpenter and Lehrer, 1999).
The use of manipulatives in mathematics instruction has also been demonstrated by
several other researchers.
Cramer, Post and DeLamas (2002) contrasted the achievement of students using
either commercial curriculum (CC) for initial fraction learning with the achievement of
students using the Rational Number Project (RNP) fraction curriculum. The RNP
curriculum placed particular emphasis on the use of multiple physical models and
translations within and between modes of representation—pictorial, manipulative,
verbal, real-world, and symbolic. The instructional program lasted 28-30 days and
involved over 1600 fourth and fifth graders in 66 classrooms. Students were randomly
assigned to treatment groups. Students using RNP project materials had statistically
higher mean scores on the posttest and retention test and on four of six subscales:
concepts, order, transfer, and estimation. Interview data showed differences in the
quality of students' thinking as they solved order and estimation tasks involving
fractions. RNP students approached such tasks conceptually by building on their
constructed mental images of fractions, whereas CC students relied more often on
standard, often rote, procedures when solving identical fraction tasks. These results
were consistent with earlier RNP experimental work with smaller numbers of students in
several teaching settings.

13
Olkun’s (2003) study compared the effect of computer versus concrete manipulatives
for the learning of two-dimensional geometry. Participants were 93 fourth and fifth
grade students. A pretest, treatment, and posttest experimental design was used. The pre
and posttest consisted of a paper and pencil test of 24 two dimensional geometry
questions, designed by the researcher. There were three treatment groups: computer,
concrete, and control. The computer groups solved computer-based tangrams; the
concrete group solved wooden tangrams; the control group had no filler activity. Both
the computer and concrete groups improved significantly, with the computer group
improving slightly more. Fourth graders gained more in the concrete situation, while
fifth graders benefited more from the computer manipulatives.
Shafer (1998) described a three-point plan to improve the mathematics scores of
students at an elementary school in Texas. In investigating the causes for students' low
scores, the school found that its mathematics curriculum was being followed only
sporadically by teachers; its curriculum was not fully aligned with the Texas Assessment
of Academic Skills; its teachers were not implementing effective strategies in
mathematics instruction in a consistent manner; many of its teachers did not feel
adequately prepared to teach mathematics effectively; and its mathematics instruction
was in the traditional, textbook-driven, paper-and-pencil format. The plan required
teachers to teach the objectives to be tested, use manipulatives and teach problem
solving, and spend increased time teaching mathematics. Results indicated that the three-
point plan worked. Mathematics scores showed a steady increase each year and the
school wide math mastery score of 37.5 percent in 1993 rose to 84.1 percent by 1997.

14
Terry (1995) designed a study to assess the effectiveness of mathematics
manipulatives and mathematics manipulative software use on students' computation
skills and spatial sense. Three treatment groups were created--Mathematics Manipulative
(MM), Mathematics Manipulative Software (MS), and Mathematics Manipulative with
Mathematics Manipulative Software (BOTH). A three week unit was taught with focus
on the development of computation skills: addition for grades two and three and
multiplication for grades four and five. In addition, a one week unit was taught that
focused on the development of spatial sense, specifically on the ability of the subjects to
create layering models. Base Ten Blocks and attribute shapes, both in manipulative and
manipulative software form, were utilized for the computation unit and spatial sense
unit, respectively. A three way analysis of variance was used to interpret the data from
the study. In four of the six ANOVAs for the computation unit there was a significant
difference for the treatment group which used both; whereas, the spatial sense group had
no significant statistical findings. Teachers reported a marked preference for software.
They reported that it was easier to manage instruction, students were more on task with
the software, and students were more motivated and excited when utilizing the software.
The overall findings of the four research studies discussed all yielded positive results
and significant gains when manipulatives were used in the classroom. However, it is
imperative that all teachers receive training on how to use the manipulatives effectively
and enhance learning.
Use of Visuals and Drawings in Mathematics Instruction
Mathematics can be taught and learned visually; communication does not rely
exclusively on spoken language. Visual communication in mathematics was found to be

15
especially important to language minority students or students having limited
proficiency in English (Cummins, 1984). Visual literacy must be taught in order to
include visual abilities in problem solving.
Visual literacy has been defined as “the ability to read and understand that which is
seen and the ability to generate materials that has to be seen to be understood”
(Wileman, quoted in Seels, 1994, p.103). Furthermore, “visual literacy is the learned
ability to interpret visual messages accurately and to create such messages” (Heinich,
Molenda, & Russell, quoted in Seels, 1994. p. 104). In other words, “visual literacy is
the ability to understand and use images, including the ability to think, learn, and express
oneself in terms of images” (Braden & Hortin, quoted in Seels, 1994, p. 104). Just
because we are able to see does not mean we are able to understand. We know that
learning involves making connections and those connections depend upon what the
individual brings to learning—prior knowledge and past experiences (Brooks & Brooks,
1993; Piaget, 1973).
Visual literacy occurs in the classroom when students translate concepts presented
verbally into visual representations such as emphasis mapping, (McCagg & Dansereau,
1991), diagrams (Guri-Rozenblit, 1998), visual analogies/imagery (Smith & Ragan,
1992), visualization of numerical data (Tufte, 1983) and visual organizers—Venn
diagrams, concept maps, chains, flow charts (Clark, 1991). These applications all
encourage the use of cognitive strategies (West, Farmers, & Wolf, 1991), in any subject
area, but especially in mathematics.
Although these instructional aides are in place in classrooms, teachers are not
necessarily trained how to use them to their full potential. It was determined by Box and
16
Cochenour (1995) through a survey of teacher training programs that teachers had
limited to no knowledge about implementation of these activities in the classroom. Since
teachers did not teach these connections, the majority of students were unable to transfer
what they learned in the classroom to mathematical applications in everyday math (Lave,
1988; Lave & Wenger, 1991 Kaput, 1994). For example, everyday situations may have
involved multiple steps of problem solving, such as percentages and distance, but
students were not able to visualize or draw the problem steps to facilitate understanding
and problem solving.
However, English is a language of many shaded meanings which cause confusion to
ELL. In mathematics, ‘line’ has a very specific meaning which differs from its meaning
in home economics. In mathematics line is a noun meaning a row, column or stroke.
However, to line in home economics is a verb meaning to coat. Furthermore, language
minority students are often literal readers. Support for such learners can be enhanced by
supplementing discussions and activities with pictures and visual supports (LaPlante,
1997) when students are exploring new mathematical concepts with new mathematical
vocabulary. Without knowledge of the specific contextual meaning the ELL will not
have automatized communicative tools. Visuals may make mathematics more
comprehensible to those students who have limited language facility. The following are
summaries of recent research demonstrating the use of visual cues in academic
instruction:
Goins (2001) examined the effects that manipulatives had on the learning of
algorithmic skills and understanding. His study specifically examined the effects of
using algebra tiles on students' learning of polynomial multiplication. Whole class

17
participation with rectangular tiles such as Lab Gear™, algebra tiles, and algeblocks
were used as the manipulative teaching method. Visual teaching consisted of the use of
pictures or graphs. Teacher demonstration without the use of any manipulative or picture
setting was the non-visual/non-manipulative method of teaching. The class of the
teachers who volunteered to participate was used as the accessible population sample.
These consisted of Algebra I and Applied Math classes. Each class was a unit of analysis
for the data. The classes were randomly assigned to the three methods of instruction.
Teachers were given a curriculum with examples, illustrations, and worksheets for each
lesson to be taught in the concept of multiplying positive polynomials.
All three treatments used the same or equivalent written examples and worksheets.
The three methods of instruction were being implemented throughout South Carolina
and the United States as illustrated in textbooks and research materials. These have
become established and accepted methods of instruction. A statistically significant
difference between the non-visual/non-manipulative and the manipulative teaching
methods was found in both the skill data and the understanding data. This difference also
extended to the open-ended question while asked students to explain the process of
multiplying polynomials. The use of manipulatives had a positive effect in learning the
algorithm of multiplying binomials and extending to the general situations of
multiplying polynomials. The students who were taught using the manipulatives method
were better able to explain the process of multiplying polynomials in a written
paragraph. The use of manipulatives, pictures, and numbers and variables provided
students with multiple representations of the concepts. Results showed that even
through there was no statistically significant difference between the non-visual/non-

18
manipulative and the visual methods, students using the visual method had a higher
mean score in both skill and understanding and were better able to explain the process of
multiplying polynomials.
Edens and Potter (2003) conducted a study to examine the conditions under which
learner-generated illustrations serve as an instructional strategy promoting conceptual
change. Specifically, the nature of students' misconceptions and the effects of student-
generated descriptive drawings on conceptual understanding of scientific principles
associated with the law of conservation of energy were studied. Students were randomly
assigned to groups in which they copied an illustration, generated a drawing, or wrote a
description about the principles. A statistically significant difference on a posttest
conceptual understanding measure was found between students who generated
descriptive drawings and those who wrote in a science log. Students who copied an
illustration also scored higher than the writing group, but not at a significant level. Also,
the quality and number of concept units present in the drawing/writing log were
significantly correlated with posttest and delay test scores. Findings suggested that under
certain conditions, descriptive drawing is a viable way for students to learn scientific
concepts, a finding which supported the use of generative drawings as a conceptual
change strategy.
Baker and Bielse (2001) investigated the types of experiences children should
encounter to best understand the concept of average. Using a traditional approach with
problem solving, a concrete approach with manipulatives, or a visual approach with
computer spreadsheets, similar lessons on the arithmetic mean were taught to 22 children
in grades 4-6, in three multiage groups. Differences among pretest, posttest, and

19
interview performances suggest some advantage in the use of a visual instructional style.
Continued gains in performance were found after 4 months without further instruction.
An algorithmic-like definition of average corresponded to better long-term performance
than less precise definitions. Collaborative deliberations resulted in positive implications
for the researchers' teaching.
The overall findings of the previous three studies suggest that visual cues and using
descriptive drawing to solve problems is a viable way for students to learn math and
scientific concepts. Findings support the theory that mathematics can be taught and
learned visually, and in some cases enhance students’ performance.
Relationship between Mathematics and Language/Vocabulary Development
Mathematics, a discipline that deals with abstract entities, requires the ability to
reason as a tool for understanding (Russell, 1999). The National Council of Teachers of
Mathematics (NCTM, 1989) recommended students be afforded varied experiences
pertaining to the far-reaching and increasing impact of mathematics in order to
appreciate the significance of math in today’s global and technical society. Mathematics
proficiency requires a mastery of the specific language and organization of ideas in
mathematics as well as a grasp of mathematical concepts (Boyd, 2000). Research
demonstrates that mathematics is not a universal language (Ramirez, Corpus, Mather &
Chiodo, 1994; Secada, 1983) and that students must master specific vocabulary and
specialized terms.
Research has drawn attention to the importance of language in student performance
on assessments in mathematics (Abedi, Lord, & Hofstetter, 1998; Abedi, Lord &
Plummer, 1995; Garcia, 1991; Lepik, 1990). Since language facilitates the acquisition

20
of new information as well as learning complex ideas and processes, open-ended
questioning encourages the type of complexity encountered in thinking through
mathematical concepts (Bodrova, & Leong, 1996). Many language educators and a
growing number of mathematics educators argue that the nature of mathematical
language impose a heavy burden on all students regardless of the language of instruction
(Spanos, Rhodes, Dale & Crandall, 1988; Cuevas, 1984; Mestre, 1981). In addition,
language seems to affect mathematics performance and marked difference in English
and Spanish fluency is considered to be a contributor to Hispanic Americans’
performance and involvement in mathematics (Valverde, 1984).
Students from linguistically diverse backgrounds usually arrive to school with a
basic understanding of math concepts (Chamot & O’Malley, 1987; Cummins, 1989), yet
ELL tend to score lower on standardized tests of mathematic achievement. There is no
evidence to suggest that the basic mathematical abilities of ELL differs from non-ELL
(Cocking & Chipman, 1988; Mestre, 1988), and the ELL are often misjudged as
underachievers (Moss & Puma, 1995).
In short, to succeed in the mainstream classroom, ELL must learn both academic and
communication skills in an environment where instruction is presented in a relevant and
meaningful way that is appropriate for English language development skills (Secada,
1989). Underachievement for Hispanics students in mathematics is related to their
limited English skills because assessment problems are presented in an abstract form that
was very reliant on verbal/reading skills and on linear reasoning (Garcia, 1991; Tharp
1989). Review of studies on language and mathematics, (Aiken 1971, 1972) found
significant correlations between reading ability and arithmetic problem-solving ability

21
Students, including ELL, must be taught in ways that allow them to experience the
content as understandable (Carpenter and Lehrer, 1999; Goldsmith & Shifter, 1993).
Further, evidence shows that ELL achievement improves with the use of hands-on
teaching and tests which permit hands-on manipulation of three dimensional props
(Garcia, 1991; Tharp, 1989). Similar levels of success occur when students conduct
thoughtful investigations with their peers using appropriate materials in a supportive
environment (Maher Martino, Davis, 1994).
In mathematics assessment situations, Khristy (1992) and Morgan (1998) argued that
the learner needed to understand a particular math concept or procedure and also needed
to understand and choose the thinking processes that lead to correctly resolving the
problem. The difficulty was increased because the students did not heed directions, such
as to explain and justify. They did not do so because they did not know what was meant
by the mathematical directions (Dossey, Mullis, & Jones, 1993). The issue then
becomes one of equity because students possessing linguistic skills associated with
advantaged, literate backgrounds are more likely to display the appropriate operations
than those from less advantaged backgrounds (Morgan, 1998).
One important aspect of reading and listening, comprehension is vocabulary. If a
student has a higher level of vocabulary then reading and listening comprehension will
usually also be higher. Therefore, the linguistic cues—the words and structure guiding
processes and thinking—used in math lessons are significant to learning (Winograd &
Higgins, 1995). To afford an equal opportunity for success to ELL in mathematics, the
vocabulary of mathematics and general vocabulary must be deliberately and specifically
taught. An alternative to this would be to change the language of the problems to the

22
students’ native language. Studies by Rothman and Cohen (1989) further supported the
link between language and the vocabulary of mathematics. Ginsburg (1981) discovered
that the vocabulary students have for expressing math and number concepts differed
widely and changing the language of the problem to the student’s native language raised
student performance. To further demonstrate the relationship between mathematical
ability and the development of vocabulary detailed summaries of relevant research were
reviewed.
Abedi and Lord (2001) investigated the importance of language in student test
performance on mathematics word problems. Students were given released items from
the National Assessment of Educational Progress mathematics assessment, along with
parallel items that were modified to reduce their linguistic complexity. In interviews,
students typically preferred the revised items over the original counterparts. Paper-and-
pencil tests containing original and revised items were administered to 1,174 8th grade
students. Students who were ELL scored lower on the math tests than proficient speakers
of English. Linguistic modification of test items resulted in significant differences in
math performance; scores on the linguistically modified version were slightly higher.
Some student groups benefited more from the linguistic modification of items—in
particular, students in low-level and average math classes, but also ELL.
Folmer (2002) investigated the impact that direct instruction in strategic reading and
problem solving would have on enhancing students' mathematical thinking processes
when solving non-routine, text-based mathematical problems. As a result of the
inclusion of such mathematical problem solving in the Pennsylvania State System of
Assessment, it was necessary to consider the potential implications of this

23
implementation on mathematics instruction, curriculum, and assessment as it occurred in
the classroom. What realignment of mathematics instruction, curriculum, and assessment
needed to occur in order to provide students with opportunities to integrate reading,
problem solving, and mathematical thinking processes within the context of language-
based problems?
The study examined the impact that direct instruction in strategic reading and
problem solving have on enhancing students' mathematical thinking processes asked
three research questions that were designed to examine the essential elements inherent in
this topic. The first question investigated the potential for improving students' abilities to
accurately solve language-based mathematics problems when provided with instruction
in a framework of strategic thinking. The second question focused on how the use of
reading and problem-solving strategies in language-based mathematics problems might
be affected through direct instruction and meta-cognitive experiences. The third question
explored how levels of confidence in approaching unique mathematical tasks might be
developed when information is provided to support thinking. The study took place in a
suburban, elementary school setting using two intact fourth grade classes (N = 48). The
design was a quasi-experimental Pretest/Posttest Nonequivalent Peer Group. The
independent variable was a 30-day intervention, in which reading and reasoning
strategies needed for mathematical problem solving of text-based problems were taught.
Dependent variables assessing solution accuracy, demonstrated strategy use, and
perceived level of confidence were measured before and after the intervention for the
experimental and control groups. The data was quantitatively and qualitatively analyzed.
The quantitative results indicated that the application of reading strategies and the

24
problem-solving process by the experimental group was statistically significant. Non-
significant results were indicated in levels of accuracy in solving non-routine, text-based
problems, except in the areas which examined discipline-related vocabulary.
Results indicated that providing students with a framework for the strategic use and
application of specific reading and problem-solving strategies was beneficial
metacognitively and in increasing students' levels of confidence.
Lager (2002) designed a study to investigate the language-mathematics interactions
that hinder middle school ELL when responding to algebraic tasks about a linear pattern.
Specifically, this investigation focused on how well students, both ELL and fluent
English speakers (Non-ELL), understood task instructions, performed mathematically,
and communicated their responses.
Two hundred twenty-one students from twenty classrooms in two low-performing
southern California middle schools chose to participate. There was a 60/40 split between
ELL and Non-ELL and a similar split between 6th graders and 8th graders. The majority
of students were Latinos; almost all ELL were Spanish-speakers. Both quantitative and
qualitative methods were used to gather and analyze data. All students engaged a
mathematics activity centered on the development and multiple representations of a
visually-based linear function.
The activity was comprised of nine related written tasks and made available both in
English and Spanish. Students had to work silently, alone, and without notes. The
investigator administered and evaluated the activity for all students. Soon thereafter, the
investigator conducted one-on-one interviews with twenty-four of the students,
encouraging them to explain their thinking in their own words.

25
The data were transcribed, coded, and analyzed for identifying language-
mathematics interactions and exploring their composition. Many interactions were
identified, explored, and catalogued within the mathematics register. However, other
interactions necessitated calling for the addition of three new semantic categories to the
Mathematics Register: words used to describe or define mathematical vocabulary, forms,
and comparing the performance of non-ELL and ELL. The interactions found that some
linguistic difficulties affected Non-ELL to a lesser degree (e.g. not recognizing
"pattern"), some affected both groups to the same extent (e.g., misinterpreting Figure
number ("n")), and a few affected non-ELL to a greater degree (e.g., double bar
confusion). In terms of the number of correct responses to the tasks, there was an
English proficiency effect, as non-ELL outperformed ELL. There was a smaller grade
effect as 8th graders slightly outperformed 6th graders. On average, non-ELL attempted
more tasks than ELL, as they typically encountered fewer language difficulties.
Olexa (2001) addressed the interdependency of language development and academic
progress by studying the relationships between language proficiency of children entering
kindergarten and the reading, math, and written language achievement of those students
as measured by standardized tests at fifth grade. A multiple regression analysis was used
to examine the predictability of reading, math, and written language scores at the fifth
grade by using preschool receptive and expressive language scores as predictor
variables. An archival record study of 130 students was performed. The resulting
correlations were positive and significant for all six experimental designs. The multiple
regression equation was developed from the correlation results and used to predict

26
reading, math, and written age scores. Receptive and expressive language were found to
be valid predictive measures of reading, math and written language at the fifth grade.
Snyder (1994), in a cooperative learning situation examined the effects of
manipulatives upon student ability to communicate mathematically. Previous research
conducted in this area indicated that cooperative learning and manipulatives improved
student ability to communicate mathematically. The objectives were based on The
National Research Council entitled Everybody Counts: A Report to the Nation on the
Future of Mathematics Education which states that the best way to learn mathematics is
through discussion while working in groups. The ability to communicate mathematically
was one of the major objectives stated by the National Council of Teachers of
Mathematics in their Curriculum and Evaluation Standards for School Mathematics.
One of the best ways to develop effective language use is to encourage open
discussion and honest criticism of ideas. Classroom activities were designed so that
students were encouraged to express their ideas, both orally and in written form.
Students worked cooperatively in small groups to solve problems and developed
arguments to convincingly defend their approach amid conflicting ideas and strategies.
A continuum related to student ability to communicate mathematically their
understanding of concepts emerged.
When talking with children about mathematics and listening to their explanations of
mathematical concepts, a wide range of responses were presented by students. The
responses fell along a continuum, ranging from no knowledge or no response to
complete understanding with the ability to communicate concepts correctly. Many
students responded with answers which were characteristic of rote learning. They did not

27
show complete understanding of the concepts being presented. Another group of
students displayed understanding but did not use the vocabulary presented by the book.
Teachers needed to listen to student answers in order to understand vocabulary which
may vary from book vocabulary or explanations. Additional research was recommended
to further investigate and identify other locations along the continuum.
Stephenson (2002) conducted a case study to compare the ways that language was
used as a medium for social interaction, representation of experience, and as a tool for
socialization in two fifth grade classrooms with contrasting approaches to mathematics.
The follow-up, and then related language use to students' mathematical experiences and
outcomes using sociocultural and sociolinguistics frameworks.
A combination of qualitative and quantitative methods captured data on multiple
planes within each community: including observation and participation, videotaping and
audio taping classroom interaction, collecting student work, teacher reflection and
ratings of students, school and student background questionnaires, achievement testing,
individual, paired, and group performance assessments, timed math facts tests, "think
aloud" problem solving, and essays on "What is Math?" and "What is Social Studies?" In
both classrooms, language was used as a medium for social interaction, representation of
experience, and as a tool for socialization, in different ways and with different outcomes.
In the traditional classroom, social interaction was largely limited to teacher-directed
Interaction-Response-Feedback sequences around tasks with low levels of cognitive
demand. The opportunities for student participation, student choice, and narrative
expressions of thought were minimal. In the open classroom, students had many
opportunities to participate in a variety of interactions around high-level mathematical

28
tasks, as well as to choose their activities, partners, and tools. Students from the two
classes performed equally well on traditional mathematical tasks, but open classroom
students outperformed the traditional on the more conceptual, open-ended, and social
tasks. Open classroom students also had more productive interaction skills, used more
conceptual problem solving strategies, and made linguistic choices that suggested that
they had more diverse and connected views of mathematics than traditional students.
Participation in the open classroom also seemed to mitigate some of the effects of
socialization in the broader community by gender, suggesting that differences may be
more a function of context than the nature of either females or mathematics. The
methodology and findings of this study had implications for future research on the role
of language in mathematics education, and reform efforts in mathematics education in
general.
Overall results from the previous studies discussed, measured the relationship
between mathematical ability and the development of vocabulary, especially students
with limited English proficiency, showed positive results and improved performance.
Their mathematical skills improved by simply using linguistic modification of test items
that resulted in significant differences in math performance.
Academic Achievement and Mathematic Ability of Bilingual Learners
With an increasingly culturally diverse and technological society, it is essential that
all children be provided with equal opportunities to master the mathematical skills
essential for social and economic success (Campbell, 1995; National Science
Foundation, 1994; Rechin, 1994). The most urgent social issue affecting poor people,
Hispanics, and other minorities is economic access, which is critically dependent upon

29
mathematic literacy (Moses, 2001). A disproportionate number of Hispanics drop out
of mathematics courses, denying themselves access to economic advancement through
employment in the technical sector (Miller 1995; National Commission on Mathematics
and Science Teaching for the 21st Century, 2000; National Science Foundation [NSF],
2000). Hence, students with negligible mathematics skills end up having access to only
the lowest paying jobs (Moses, 2001) and continued inadequate education of Hispanics
in math will exact a high economic toll for society (Pelavin & Kane, 1990).
The report to the nation given by the National Research Council in Everybody
Counts (1989) shows a need to increase Hispanic involvement in mathematics at all
levels; to not do so is to risk becoming a divided nation in which economic and political
power will be beyond the reach of Hispanics. Barriers for Hispanics in mathematics are
the same factors that cause attrition from formal schooling and can be traced to
differences in educational process and language (Schuhmann, 1992). The problems with
language are self-evident, but educators are not necessarily aware that the accepted
educational process itself hindered these students.
Although minorities and Hispanics made up one third of high school seniors, only
one in ten scored at the advanced level on the most recent National Assessment of
Educational Progress (NAEP) mathematics tests (Johnston & Viadero, 2000). Hispanics
scores lagged behind those of Whites in academic and mathematic skills as early as
kindergarten (Johnston & Viadero, 2000). As a result of educators’ perceptions that
these students have limited cognitive mastery, English Language Learner (ELL) were
vulnerable to the “Matthew effect” where low achieving students in primary and
elementary school will likely do progressively worse as they continued in school

30
(Reynolds, 1989; Stanovich, 1986). Limited cognitive mastery was defined in terms of
a students’ lack of procedural and conditional knowledge. Procedural knowledge was the
ability to recognize how to solve the problem; conditional knowledge was the ability to
know under what conditions something should be done (Waxman et al, 1991; Gagne,
1985; Jones, Palinscar, Ogle, & Carr, 1987).
Research suggested that expectations set for students directly influence students’
achievement in mathematics. In as many as a third of all classes, teacher behaviors
sustain the poor performance of low achievers (Good & Biddle, 1988). The implications
of this for ELL students is an overemphasis on remediation, which may lead to perceived
notions of “learned helplessness” and ultimate denial of opportunities to learn higher-
order thinking skills necessary for advancement in mathematics (Knapp & Shields,
1990; Lehr & Harris, 1988; Foster, 1989). Less than one percent of Hispanics achieved a
level in mathematics advanced enough to demonstrate the problem-solving skills needed
to work in algebra and geometry (Division of Research, Evaluation and Dissemination,
Directorate of Education and Human Resources, 1992). Given these factors and the
purpose of the current study other studies were reviewed that outlined the academic
achievement and mathematical ability of bilingual learners in general.
Ainsa (1999) devised a math activity that initially utilized "m & m's"™ as
manipulatives, and then progressed to computer software math activities that was piloted
and evaluated in five early childhood classrooms. The observational data obtained in this
study is useful to other classroom teachers and scholars. There were no significant
differences between learning tasks, monolingual students vs. bilingual students, and
manipulative (hands-off) activities vs. computer (hands-on) activities. The positive effect

31
was that the project was a successful and different approach to learning for monolingual
and bilingual children. The most rewarding aspects of the program, according to the
children, were candy and computers. Both seem to be high on children's evaluation of
fun and learning.
Baez (1997) examined Mexican-American children's self-concept and its relationship
to their academic achievement while controlling for acculturation. Anglo students were
used as comparisons. One hundred seventy-four fourth and fifth grade students from a
large, southeastern Texas school district participated. The Piers-Harris Self-Concept
Scale, the Norm-Referenced Assessment Program for Texas (NAPT) and the Children's
Hispanic Background Scale were administered. Three hypotheses stated there would be
no significant effect of ethnicity, gender or self-concept on reading, math and language
achievement, with the effects of acculturation statistically controlled. Findings were not
as expected. Results found significance in reading by ethnicity as well as in math by
self-concept. Practical suggestions in practice and future research were provided.
Bresser (2003) developed strategies for developing the computational fluency of
English-language learners. The strategies included asking questions and using prompts,
giving students time to process questions and formulate responses before eliciting
responses to questions, modifying teacher talk, recasting mathematical terms and ideas,
posing problems with familiar contexts, connecting words and symbols, reducing the
stress level in the classroom, encouraging students to describe the methods of other
students, getting students to translate the strategies of others, and inviting students to
consider a strategy before sharing it with a partner and then the class. The
implementation of these strategies with second- and third-grade students is described. As

32
soon as communication became the focus of mathematics class, however, students began
to make progress in their mathematical thinking. This process did not come easily; it
took time and did not happen merely because students were allowed to talk. The author’s
role as the teacher was to create a safe environment for expressing ideas, model
mathematical talk, provide mathematics games for students to work on in small groups
that encourage conversations, and moderate discussions to make sure that the talk was
productive and focused on the mathematics.
Over time, the class became less resistant to the teacher’s expectation that an
explanation must accompany an answer to a mathematics problem. When facilitating
productive talk during mathematics class, teachers helped ensure that emergent English
speakers fully participated by structuring discussions in ways that provided access to
students with varying linguistic expertise. By using prompts, asking questions, and
encouraging mathematics conversations, teachers accomplished two valuable goals:
English-language development and computational fluency.
Dermitzaki and Efklides (2002) examined the structure of cognitive, metacognitive
and motivational factors that contribute to academic achievement, and whether the
structure of these factors was different in the domains of school language and
mathematics. The sample consisted of 512 7th, 9th and 11th grade students in a Greek
city. The variables measured were students' performance in school language and math
and their respective verbal and quantitative abilities. Metacognitive experiences
regarding the tasks at hand as well as metacognitive strategy knowledge were also
measured. Finally, 4 different aspects of students' academic self-concept in school
language and math, as well as their motivational orientation towards learning were

33
examined. Results of confirmatory factor analysis with the nested factor method
confirmed the existence of distinct cognitive and metacognitive structures involving both
general and task-specific factors. Affective factors were not explained by a common
general structure representing affect. Finally, there were no differences in the structure
of the above factors between the domains of language and mathematics.
Edwards (2003) researched whether students who worked in collaborative groups to
solve mathematical problems would later be more adept at solving similar problems on
their own. Data were obtained from 122 fifth and sixth grade students who were
assigned to mixed-language, mixed-ability groups of three or four students. The results
suggested that although many students in these five bilingual classrooms may have been
able to benefit from the opportunity to work collaboratively to solve mathematics
problems, and although the class as a whole showed a statistically significant increase on
the written test, a number of the students could not gain maximum benefit from this
setting. Clearly, simply placing students in groups—even groups that are heterogeneous
in terms of mathematical ability and language—does not guarantee that all members will
participate fully and have the opportunity to verbalize, and eventually internalize,
powerful methods of problem solving. Possible suggestions for improving math
achievement among mixed-language learners, including roles for collaborative problem
solving in mathematics, could include a "summarizer" who restates the clues or problem,
a recorder of information, a materials manager, a "checker" who tests to see if potential
solutions fit all clues, and so on. It also may be useful to state clearly and reinforce the
rules for working in small groups; for example, taking turns, listening to other students,
and giving specific reasons for statements and suggestion, because these behaviors seem

34
to be associated with greater increases in problem-solving ability. Another recommended
change involved the language used in the groups. In the study, although clues and
materials were available in Spanish, almost all the groups discussed their work in
English and held some side conversations in Spanish. For students who are new to the
English language, teachers might consider first creating groups that carry out discussions
in the students' native language and then transitioning to mixed-language groups.
Himmele (2001) examined the impact of English language proficiency on students'
performance and understanding of math concepts taught through Math Land®, a
manipulatives-based math program that emphasized the 1989 NCTM math reform
standards. The researcher was a participant observer in two multilingual classrooms and
one native English speaking classroom, and interviewed 40 teachers and 63 students.
While the development of higher order thinking skills was said to be an important
purpose of the program, opportunities to develop these skills were lacking in two of the
three classrooms.
Language proficiency played an important role in the way concepts were presented
to students. Interview assessments were omitted from lessons because of the students'
difficulty in verbally answering questions. Debriefing portions of the lessons were easy
to omit, and only one of the three teachers observed (a multilingual teacher) consistently
included this very important portion in her lessons.
Overall, students seemed to have a positive attitude towards math. The role of
American culture was evident in the way that students were taught. The mode of
instruction fostered individualism and competition. The role of teacher as authority was
emphasized through the role of praise and teacher's expressed discomfort and

35
ambivalence toward the philosophy of the math reform and that of the program used.
Lack of language proficiency did present a challenge to teachers and did not prevent
teachers from providing students with higher order thinking opportunities.
Wang and Goldscmidt (1999) hypothesized that immigrant students, especially those
with English language learners (ELL), perform less well than native-born students do.
The authors explored the hypothesis that the ELL and immigrant students are channeled
by schools (or self-selected) into less demanding courses, thereby reducing their
opportunity to master core subjects in the curriculum. Data were taken from a large
urban school district in California to investigate the roles of opportunity to learn (OTL),
language proficiency, and immigrant status on 2,443 middle school students'
mathematics achievement and growth over 3 years. Using a multilevel growth model,
the authors found that reduced OTL lead to performance shortfalls, suggesting promises
for the relatively inexpensive approach of directing immigrant and ELL into more
demanding and sequenced curriculum pathways to improve achievement.
Summary
A review of literature in the area of mathematical instruction with the use of
manipulatives demonstrated that they can be successfully employed for most students.
Specifically visuals and drawings seem to improve learning in the fields of science and
mathematics. Several studies indicated a relationship between mathematical ability and
the development of language and vocabulary. Finally there is evidence that the
mathematical ability and the overall academic achievement of bilingual learners can be
improved through the use of manipulatives, bilingual education strategies with specific
consideration to culture and language.

36
CHAPTER III
METHODS
Context of Study and Sample
The district where the study took place is the second largest in total square miles in
the Houston area, encompassing 328 square miles. It is a semi-rural/agricultural and
currently undergoing rapid residential and commercial development. The population
within the district is approximately 10,000 people with a total of seven campuses serving
over 4,600 students in grades prekindergarten through twelve. Under the state
accountability rating system, the district was rated as Acceptable, in other words the
passing rate in every content area tested on the TAAS met the minimum of 70%.
The present study took place at two of the four elementary schools in the district.
Prior to this year, fourth grade students attended a purely fourth grade campus. The third
grade participants attended one of the two K-3 campuses. In 2002-2003, the year of the
study, third and fourth grade students were housed on all four elementary campuses.
The 4th grade only campus will became a K-4 campus and a new K-4 campus will be
added. The other two campuses were change from K-3 to K-4, as well.
The district’s overall passing rate in mathematics for 3rd and 4th grade on the 2002
TAAS was approximately 90%. The Texas Education Agency offers the TAAS in both
English and Spanish for grades 3 through 6. Students take the Spanish version if they
are recent immigrants and/or their Spanish literacy is higher than their English literacy.
This was determined at a Language Proficiency Assessment Committee hearing. The
district-wide Hispanics’ passing rate on the English version of TAAS for 3rd grade was

37
approximately 80% and for fourth grade 90%. In third grade 43% of ELL took the
TAAS in Spanish in mathematics. In fourth grade 42% of ELL took the Spanish version
of TAAS in mathematics, with low percentage of those students passing. The students
taking the Spanish version of TAAS in 3rd had a passing rate of approximately 80% and
in 4th grade 70%.
Students in fourth grade all attended one campus; therefore, the district and campus
passing rate is the same. But third grade students attended two different campuses. At
the campus that was used in this present study, third grade students’ passing rate overall
on the mathematics test was approximately 80%; of the Hispanic third graders taking the
test in English the passing rate was 70%. Those taking it in Spanish achieved a passing
rate of 80%. There is an obvious discrepancy in passing rates between the general
population and the Hispanic population, whether or not they test in English.
Bilingual Education Program
The bilingual education program on the two elementary campuses ensured that ELL
students learned English and would succeed academically in school. Students
participating in these programs were provided linguistically appropriate instruction
which was cognitively appropriate in that creativity, problem solving, and other thinking
skills were cultivated in mathematics and other content areas. The district implemented
a transitional bilingual program that provided a gradual progression from instruction in
Spanish and English to instruction solely in English. Every grade level, beginning in
Pre-K, used a ratio of instruction in English and Spanish. In third grade it was 50%
Spanish and 50% English; in fourth grade it was 60% English and 40% Spanish. In

38
other words, three of the six hours of instruction in third grade were in Spanish and in
fourth grade two hours of the six were in Spanish.
The schools in this district served bilingual students in grades Pre-K through four
who had been identified as English language learners (ELL) in accordance with state
identification and assessment requirements (19 TAC §89.1225). The curriculum taught
was the standard Texas Essential Knowledge and Skills (TEKS) ⎯the state
curriculum⎯which had adaptations for students acquiring a second language.
Therefore, the only significant difference between the two curricula (standard and
adapted) was the language of instruction. Students were served in a self contained
bilingual classroom where the bilingual teacher taught all the content areas.
Participants
Participants in this study were sixty-four students in grades three and four, male and
female, ages 9 through 11 who were in a bilingual program. Some participants were
first generation immigrants from Latin America, especially Mexico, with only 3% from
Central America. Spanish was the primary language most often spoken at home; the
majority of the parents were non-English speakers, other had limited literacy in their
first language. All parents were employed jobs that entailed agricultural. All of the
third and fourth grade ELLs were identified as economically disadvantaged and
participate in the free and reduced lunch program that the district offered.
Students were selected to participate in the present study based on the overall score
of the pre-assessment. Students who showed a deficit in mathematical skill based on
results from the pre-assessment that ranged a score of 0% to 55% were included as
participants. A fourth group of students were created, comprised of students who score

39
at 56% or higher. This group participated only in the pre and post assessment parts of
the study so that they would not feel totally left out. This additional data also allowed
for further comparison between groups.
Instrumentation
This study used two sets of instruments which mathematical items were derived from
the 1999-2002 TAAS release tests: a) a pre/post math assessment; and b) a series of 4
weekly math probes.
Pre/Post-Assessment Instrument
The assessment items in the pre- and post-assessment were taken directly from the
original test items in the third and fourth grade TAAS tests that were administered in the
spring of 1999-2002. A committee of mathematics specialists and teachers selected the
items and objectives for the pre/post assessment. They were selected based on the
criteria that they must readily lend themselves to working with manipulatives and visual
cues. Each of the selected objectives was represented by two word problems on the
pre/post assessment; there were a total of twenty items.
Consistency of question level and content was controlled. The pre and post
assessments were developed at the same time, using essentially the same questions, but
changed only the numerical representations and names in the word problems. The pre-
and post assessments were created in English and Spanish to eliminate language as a
barrier to improvement. The focus was solely on the understanding and learning of the
mathematical concept/objective that was taught. The post-assessment measured the
overall improvement of the participants and non-participants from the instructional

40
phase of the study in order to yield an improvement comparison. Items on all probes
were sequenced using TAAS mathematics objectives 8, 9, 10, and 11 in that order.
The pre-assessment was administered in both English and Spanish so that the
researcher could identify students with low mathematical skills, whether they were
English or Spanish speakers. During the English version administration, questions were
read to the students by the researcher. When students completed the test, it was
administered again, this time it was read to them in Spanish. They were given
approximately three to four minutes to complete each question. Each question was read
twice and participants responded in a written form using a supply-type response format
which required that they create rather than choose an answer. This format also allowed
them to show their work and processes that the used to solve the word problem. For the
four probes and the post assessments, students were able to choose the language in
which they preferred to take the test. Thus, the post-assessment had the same level of
difficulty and format as the pre-assessment.
Mini-Probes
The purpose of the four equivalent mini-probes was to measure weekly improvement
over the five week duration of the study. The researcher administered a mini-probe once
every Friday after students had four days of instruction. The mini-probes contained
twelve word problems that assessed a total of four objectives; all items were obtained
from the 1999-2002 TAAS third and fourth grade mathematics release tests. Three items
per objective on all of the mini-probes were provided in English and Spanish. There
were insufficient original items from the released TAAS so additional items were
created. To maintain consistency with the TAAS test, only minor changes were made:

41
the names and numbers within the items. All problems had the same format and
difficulty level. All items were word problems which required participants to use
problem solving skills and supply their answers in writing. The test was read to students
in their language of choice with each question read twice. Participants were given three
to four minutes to answer each item. Items were scored 0/1 for accuracy, yielding
summative percent correct scores for each student per objective.
Test Construction
The instruments that were used in the present study were compiled from the third
and fourth grade release TAAS tests for the years 1999-2002. The study was composed
of a total of six probes that include a pre- and post-assessment, each comprised of twenty
items, and four mini-probes, each comprised of twelve items.
The two sets of test instruments⎯pre/post assessment and mini-probes⎯that were
used in the present study were created from the content universe that was developed by
the Texas Education Agency (TEA) for the Texas Assessment of Academic Skills
(TAAS) in mathematics for grades three and four. In 1981 the TEA defined the skills
and objectives that were to be part of the curriculum framework: the Essential Elements
(EEs). TEA undertook a rigorous process in which they integrated the input of content
area teachers ⎯ in this case mathematics and science teachers ⎯ school administrators,
parents, business people, and members of the general public in order to write the EEs.
This curriculum framework established what students should learn. Using a similar
process including field testing for reliability, the state also developed a series of
assessment instruments to measure student achievement. The alignment between the
EEs and these tests, first the Texas Assessment of Basic Skills (TABS), then the Texas

42
Educational Assessment of Minimum Skills (TEAMS), and finally the Texas
Assessment of Academic Skills (TAAS) was inadequate. In July 1997 the State Board of
Education adopted the Texas Essential Knowledge and Skills, new more specific
curriculum, for implementation in September 1998. The alignment between TEKS and
TAAS was better but still not total.
The Texas Education Agency (TEA) provides a representative form of each
assessment instrument under the Texas Education Code, Chapter 39, and Subchapter B,
which is made available periodically for public review and for formative student
evaluations by school districts. These are called released tests.
The items of the two sets of instruments used in this study were sequenced and
constructed using the same objectives, length, content, presentation format and response
format. Students in grade three and four were randomly selected to be administered
either Form A or Form B.
An item analysis was conducted to determine which objectives from each release
TAAS year had the lower percentage passing. Table 1 illustrates an example, objective
8 from the 1999 released test, as shown below, may not be represented because it had a
high passing percentage. A question representing the same objective but from the 2002
released TAAS was used because it had a more complex questioning structure, which
students found to be more difficult.

43
Table 1
Comparison of Difficulty Level for the Same Objective
Objective 8 in Released TAAS 1999
Item #39
Objective 8 Released TAAS 2002
Item #40
A piece of paper was folded into two parts.
Jorge drew six stars in each part. Which
picture shows how many stars Jorge drew?
Mark your answer. (Visual representation)
Jennifer bought 8 packages of donuts.
Each package had six donuts. How many
donuts did Jennifer buy in all? Mark you
answer. (No visual representation)
The administration of the assessment followed a standardized format developed by
the researcher to ensure a consistent routine. Testing took place at the same time, and
location, with a consistent ambience. Sitting was pre-arranged and the specific
instructions were given orally at every administration.
Instrument Validity
Face Validity
Face validity involves a casual and subjective inspection of the test items to judge
whether they cover the content that the test purports to measure (Nevo, 1985). The
instruments were reviewed by two bilingual teachers to determine whether they believe
the test was measuring what it was intended to measure. They were asked if the type of
mathematical items that were used in the assessment instruments in the present study
represented the type of assessment they used to measure learning in their classroom.
Teachers agreed that the items used to measure student improvement looked similar if

44
not identical to the state assessment, TAAS. They agreed that these items were also the
same type of question in the same identical format that they used to prepare their
students for the TAAS test.
Content Validity
From the third and fourth grade mathematics TEKS, three mathematical domains
were represented on the TAAS test. The mathematical domains: Concepts; Operations;
and Problem Solving encompassed specific objectives and skills from the TEKS that
students needed in order to master and apply. Thus, the TAAS represents a more
comprehensive assessment of the state mandated curriculum.
The test items for TAAS were validated by TEA for their match with the state
curriculum and the objectives of the Texas Essential Knowledge and Skills (TEKS).
During the lesson planning phase of the study the actual TEKS which match the TAAS
objectives will be incorporated in instruction and the assessment format will match
TAAS. As explained before, content validity was supported by sampling items from an
item universe of third and fourth grade released TAAS tests that were developed by
TEA. Content validity will be ensured by systematically and sequentially presenting
concepts to the students prior to initiating assessment of those concepts.
It had been established by TEA using the annual Texas Learning Index. The Texas
Learning Index, or TLI, is a score that describes how far a student's performance is
above or below the passing standard. The TLI is provided for the TAAS mathematics
tests at Grades three and four. The TLI was developed to allow students, parents, and
schools both to relate student performance to a passing standard and to compare student
performance from year to year.

45
Table 2(below) represents the objectives from the TAAS tests for 1999 and 2002
which address the three test domains of mathematical concepts, operations, and problem
solving as set forth by TEA. The researcher assessed the participants’ level of
mathematical ability in a pre-assessment that represented each of the objectives on the
table with two problems per objective for a total of twenty items. Those objectives on
which the participants demonstrated a high failure rate were used for the main body of
the study⎯in the mini-probes; the post-test followed the format, sequence, and content
of the pre-assessment. The ten objectives in Table 2 were derived from the three
mathematical domains that were compatible with the use of manipulatives and visual
cues for instruction. The average score per group/per student was displayed in a time
series graphic representation.

46
Table 2
TAAS Mathematical Objectives Used in the Study
Domain Objective Description
Domain I Concepts 3 The student will demonstrate an understanding of
geometric properties and relationships
Domain I Concepts 4 The student will demonstrate an understanding of
measurement concepts using metric and customary units.
Domain 2 Operations 6 The students will use the operation of addition to solve
problems.
Domain 2 Operations 7 The students will use the operation of subtraction to solve
problems
Domain 2 Operations 8 The students will use the operation of multiplication to
solve problems.
Domain 2 Operations 9 The students will use the operation of division to solve
problems.
Domain 3 Problem Solving 10 The student will estimate solutions to a problem situation.
Domain 3 Problem Solving 11 The student will determine solution strategies and will
analyze or solve problems
Domain 3 Problem Solving 12 The students will express or solve problems using
mathematical representation.
Domain 3 Problem Solving 13 The students will evaluate the reasonableness of a solution
to a problem situation

47
The released TAAS tests did not provide enough sample items to compile the four
mini- probes. Additional items were created with changes only to the name of the
person and the quantity in the word problem whenever possible. If the quantity in the
word problem was a single digit the new item maintained that same structure. If the
original question required carrying, borrowing, or regrouping, this was also maintained
in the created question. Table 3 shows an example of an original TAAS question from
2002 3rd grade release TAAS test and a question created to add to one of the four mini-
probes.
Table 3
Comparison of Original TAAS Question with Created Question
Original Item from Release TAAS test
2002
Objective 10, item #26 on Release TAAS
Question created using release TAAS
Item #3 on mini-assessment #1
A spelling book contains 88 pages. A math
book contains 203 pages. Which is the
best estimate of how many fewer pages the
spelling book has than the Math book has?
Write your answer.
A grammar book contains 66 pages. A
math book contains 302 pages. What is the
best estimate of how many fewer pages the
grammar book has than the Math book
has? Write your answer.

48
The mini-probes consisted of four objectives that showed a high percent of student
failures. Each probe contained twelve problems; each objective from released TAAS
was represented by three problems on the probe.
The mini-probes were comprised of the 1999-2002 sample items from the released
TAAS tests. The release TAAS years were chosen based on the results of an item
analysis of the pretest results to determine the items with the highest failure rate. The
item difficulty index will be in the range of 0% to 20%. If, in any given test year, an item
did not present a high level of difficulty for the students, it was not be used. Because of
insufficient items and the different question structures from the released TAAS,
questions will need to be created for the mini-probes.
Internal Consistency (Reliability)
Internal consistency is an estimate of the average intercorrelation of all items on a
test (or subtest), i.e. the extent to which they all measure the same skill (Gall, Borg, and
Gall, 1996). Internal consistency was assessed to measure whether all items represented
the same mathematical domain. The pre/post probes represented three domains and at
least 6 items per domain. The four mini probes represented two domains in which six
items are represented per domain. For each of the six probes, Cronbach's Alpha was
calculated for the entire test. Given the small number of items (6) per domain, Alpha
was not expected to be large, but should be at least .65 (Carmines, 1990). Alpha for the
entire test should be at least .80 in order to have a reasonable level of reliability and
determine if they indeed measure those mathematical skills (Carmines, 1990). The
results will be presented in the Results chapter of the present study.

49
Other Data Collection
Multiple forms of data, e.g. attendance rosters, student work samples, student
questionnaires, were gathered during and after the study. The data collection sources that
were used are described below.
Oral Language Proficiency Test (OLPT)—was provided in both English and Spanish
to measure the students’ level of language proficiency. Three levels of fluency are
described for both languages in speaking and thinking. They are applied to non-English
speaker (NES), limited English speaker (LES), fluent English speaker (FES) and non-
Spanish speaker (NSS), limited Spanish speaker (LSS) and fluent Spanish speaker
(FSS). The OLPT is a widely used test and it has been nationally norm-referenced.
Lesson plans —Lesson plans were created to ensure the consistency of the
instructional strategies being implemented. The objectives were taught in the following
weekly sequence:
• Monday ⎯ Objective 8 ⎯ use of the operation of Multiplication to solve
problems
• Tuesday ⎯ Objective 9 ⎯ use of the operation of Division to solve problems
• Wednesday ⎯ Objective 10 ⎯ Estimate solution to a problem situation
• Thursday ⎯ Objective 11 ⎯ Determine solution strategies and analyze or solve
problems
Attendance Rosters — Attendance rosters were created to monitor daily attendance
of all participants and non participants to document that all have equal opportunity and
exposure to the instructional interventions. All absences were documented to provide

50
additional explanations of results. There were two students that were absent in the five
week duration of the study.
Interventions
Instruction
Participants were instructed in a small group setting using two instructional strategies
that utilized manipulatives and visual cues and had vocabulary enrichment embedded as
part of the lesson. Research and theorists stress the importance of natural language,
concrete, physical or mental visual images (including pictures, graphs, and diagrams)
and symbols in representing mathematical ideas (Lesh, Post, & Behr, 1987; Silver, 1987;
Hiebert, 1988). Instruction required each participant to actively participate and work
with the others in the group.
Explicit scripted lesson plans were followed daily and included vocabulary for
students, materials needed the process as guided practice, and finally independent
practice. For example, when objective 9 was taught (the use of the operation of division
to solve problems) the teacher/researcher pre-selected vocabulary from the questions
which potentially are a stumbling block for students. The words were selected based on
students’ lack of background knowledge or prior experience with the term. Usually the
words were nouns. For example, Spanish speaking students did not recognize the word
row as meaning a line of like objects. The teacher taught the word using the students’
prior knowledge of how corn is planted in rows. This concept was readily accessible to
them because of their agricultural backgrounds.
Once the vocabulary was understood by the participants, the teacher/researcher
moved on to the guided practice stage of the lesson. Once participants demonstrated

51
understanding of both vocabulary and process of using manipulative or visual cues, they
were given a new version of the same problem, with different numbers, to solve
independently or with a partner. Teacher/researcher monitored for understanding as the
students work independently or with a partner.
Once the mathematical objective was clearly understood students had the
opportunity for independent practice using different daily practice problems along with
manipulatives or visual cues to solve the problem. Materials varied depending on the
activity for the day. Vocabulary was always a part of the lesson process, as words were
introduced and clarified to increase student’s comprehension; it facilitated the solving of
story problems.
Research Design
The present study utilized two separate designs, a pre-post comparison group design,
and a time series design. Together, the two designs included four groups with a total of
sixty-four third and fourth grade bilingual students.
Pre-Post Comparison Group Design
The pre-post design included four groups which received different interventions: (a)
instruction with the researcher using manipulatives, (b) instruction with the researcher
using visual cues, (c) a control group with the classroom teacher using traditional
instruction, and or (d) a group with the regular classroom teacher which participated in
only the pre and post probes, not the mini-probes. Each group had an equal number of
students. All four groups received a pre and post assessment but the manipulative,
visual cues, and control group also received the mini-probes.

52
Time Series Design
The study encompassed a five-week phase including 6 probes: the pre-assessment
occurred at the beginning; four mini-assessments were administered, one per week; and
the post assessment occurred at the end of week five.
Procedure
The following steps were taken to implement the pre-posttest control group and the
time series design:
1. Equivalent groups were created, based both on random assignment and then on
adjusting by matched pairs on the basis of pretest skill levels.
o The practice of using a pretest to assist the randomization enabled the
researcher to form matched pairs of low scores within the range of 0% to
55% passing.
o The pretest yielded a percentage score that will be used to determine
group placement and participation.
2. The pretest and posttest was administered to all groups at the same time, and the
four mini probes at periodic equal intervals during a five week period.
3. Administered twenty-five minute small group mathematics instruction, except to
the control groups, over the five week duration of the study.
4. Created logs for the home room teacher for scheduling purposes.
o Teachers were asked to make adjustments in their schedule to
accommodate the supplemental instruction.

53
o Supplemental instruction schedules were coordinated to ensure that
students do not miss any classroom teacher instruction during their math
time.
o A consistent time and schedule were kept throughout the five-week study.
o This ensured that the standardized procedure was followed throughout the
study.
Internal Validity of the Design
The internal validity of an experiment is the extent to which extraneous variables
have been controlled by the researcher, so that any observed effect can be attributed
solely to the treatment variable (Gall, Borg, and Gall, 1996). The researcher was able to
measure and observe improvement in the small group setting using the interventions.
Using the complex design, as displayed above, that includes the pretest-posttest
comparison group in addition to a time series design, can effectively strengthen internal
validity.
The comparison group may control for the potential threats to internal validity as
originally identified by Campbell and Stanley (1963): history, maturation and testing,
instrumentation, statistical regression, selection, and mortality. The threat of history was
reduced by eliminating several sources of bias: the teacher-researcher and time of day
was consistent, and the instructional component of the study was conducted every school
day without interruption for a five-week period. Also participants were randomly
selected to participate in all three groups that include a comparison group.
Maturation and testing were controlled in that the total time covered by the study is
five weeks⎯not short enough to be influenced by student memorization of items, but

54
not so long that students’ physiological maturation would be a factor. Also, the two
treatment groups were compared to the comparison group to examine any changes.
Instrumentation was controlled because conditions for intrasession history existed by
using multiple judges, on several occasions, to observe the fidelity of implementation of
instruction.
Statistical regression was intended to be avoided by equivalently creating groups
based on low performance (0 to 55% accuracy) on the pretest and by comparing scores
to the comparison group. The participants were grouped by randomly selecting them
into each of the three groups. This was followed by a post-hoc matching to ensure
equivalency. Selection threat was controlled for through randomization: the pre-test
scores were compared to assure initial equivalence of groups. The threat of mortality
was examined through attendance rosters for treatment groups and then separately for
the comparison group.
Internal validity was strengthened through three elements:
Multi-group Comparison Including a Comparison or Control Group—The multi-
group comparison enabled the researcher to make strong inferences about the
effectiveness of the proposed study. If extraneous variables have brought about changes
between the pretest and posttest, these should be reflected in the scores of the control
groups. Thus, the change between the groups receiving small group instruction and the
control or comparison group can be attributed to the intervention, with a fair degree of
certainty.
Equivalent Groups——In order to improve logical inferences from the results,
equivalent groups were formed by matching on the pretest results, from randomized

55
student lists. Randomization with post-matching for balance is superior to pure
randomization with small numbers of subjects. Students with similar scores were
matched and then randomly re-assigned to treatment groups to make the groups as
equivalent as possible.
Pre-Post, Time Series Measurement——The pre-post design coupled with time
series measurement allows for a strong design. The pretest was used to select students
for participation, to ensure that the groups were equivalent, and to check the gains made
during study. The posttest will was used to compare significant gains. In a parallel
design, time series measures were conducted throughout the study to judge improvement
trends. Four probes were administered during the five week study, at one week intervals.
Generalizability
Given that the complex pre-posttest control or comparison group with a time series
design had strong internal validity, the findings from the study permitted the researcher
to draw conclusions about the effectiveness with other third and fourth grade students.
The following elements were important in permitting the study to have strong
generalizability: the type of participants, the generality of the mathematical content, and
the practicability of the intervention.
The selected participants in this study were third and fourth grade bilingual students.
They were Hispanic, primarily of Mexican descent, and were considered to be
economically disadvantaged in accordance with state law. Their parents had a limited
education and did not speak English. Participants were experiencing the transition
between Spanish to English in their classroom instruction. All students had been in the
United States for at least three years. This population was typical of that found in a

56
Texas public school third and/or fourth grade multiethnic classroom and yielded strong
generalizability.
The mathematical content taught during the intervention for skills was drawn directly
from the state curriculum and national mathematical basals: multiplication, division,
estimation, and problem solving strategies. All were incorporated in any national
mathematical textbook series or curriculum. The assessment probes required students to
demonstrate the mathematical skills mentioned. Since Texas is a leader in influencing
textbook writing, the Texas (and California) curriculum becomes, to a large degree, the
national curriculum. Thus, this study contains high generalizability according to its
instructional content.
The interventions in the present study consisted of two instructional techniques to
facilitate learning: vocabulary enrichment using manipulatives and visual cues. These
instructional techniques were implemented in a small group setting with a maximum of
four students per group. Teachers in a classroom setting can easily group students by
ability to target instruction. The manipulatives used are inexpensive and usually are
constructed with simple material such as buttons, paper money, and teacher made clocks.
Training with the manipulatives is of critical importance when instructing students with
a variety of academic levels. The three interventions used: vocabulary enrichment,
manipulatives, and visual cues are part of best practices in all instruction and, thus,
enhance the generalizability of this study.
Internal Consistency (Reliability)
Internal Consistency, a form of reliability, was calculated on the mini-probes using
Cronbach’s Alpha. There were twelve items covering two mathematical domains

57
(Operations and Problem Solving); each domain contained two objectives and each
objective will have three word problem questions. Item analysis was conducted on each
separate mathematical domain on all of the six probes used through out the study.
Alternate Form Reliability
Another analysis that was calculated is the standard error of the slope across the six
probes to determine how much alternate form reliability there is in the probes. It was
calculated both individually for every participant and as a group in order to compare
with other groups and other students. Once this is calculated and is graphically
displayed it will allow us to establish the degree of consistency or variability (through
visual and statistical analysis of "bounce") from one equivalent measure to the next.
Data Analysis
Research Question One: Based upon pre-post testing which of these two interventions,
small group instruction emphasizing, (a) vocabulary enrichment with manipulatives or
(b) vocabulary enrichment with visual cues, conducted four days a week for five weeks,
improve Hispanic English language learner (ELL) learner’s mastery of mathematical
concepts in operation and problem solving, when compared to their peers in the
comparison group?
A mixed ANOVA (repeated measures, with a grouping factor) was used as the
analysis, with instructional group as the grouping factor, and pre/post assessment of
math the repeated measure. This analysis was repeated for grade levels three and four.
The source of data for the ANOVA was one nominal, categorical grouping variable, with
three levels which are: manipulative, visual cues, and the comparison group. The
ANOVA also used one continuous, equal-interval math score variable, with 2 levels, pre

58
and post. The total N for the study included forty-eight third and fourth grade bilingual
students together who were assigned to four bilingual teachers. Each ANOVA had six
cells, which will yield a cell size of eight.
Research Question Two: When compared to their peers in the comparison group, to
what degree did Hispanic English language learner’s (ELL) mastery of mathematical
concepts in operation and problem solving improve?
A trend analysis for the three separate groups was conducted to see growth over
time. The six probes were used to compare each group for growth and improvement.
The time series variable used the equal-interval scale, as the probes were administered at
the same time every week. Trend analyses was conducted for each individual student,
and then averaged for each group. Statistical differences between the group trend
coefficients were conducted. There will be a total of 18 cells, which yield an average
cell size of approximately two.

59
CHAPTER IV
RESULTS
This chapter presents the results that respond to the two research questions:
1. Based upon pre-post testing, which of two small-group interventions, emphasizing,
a) Manipulatives or b) Visual Cues (and both emphasizing vocabulary enrichment)
conducted four days a week for five weeks, most improves Hispanic English
language learners’ mastery of mathematical concepts in operation and problem
solving, compared to their peers in the comparison group?
2. Based on progress monitoring probes, when compared to their peers in the
comparison group, to what degree did members of the two experimental groups
improve in mastery of mathematical concepts in operation and problem solving?
This study assessed the effects of two instructional strategies, both involving
explicit vocabulary enrichment: manipulative-based instruction; and visual cues in
mathematics, conducted in a small group setting with twenty-four 3rd grade and twenty-
four 4th grade bilingual, Hispanic students who are English language learner’s (ELL).
The study used two sets of instruments: a) a pre/post math assessment derived from the
1999-2002 TAAS release tests; and

60
b) a series of 4 math mini-probes, following the pre-assessment and preceding the post-
assessment. The assessment items in the pre- and post-assessment were taken directly
from the original test items in the 3rd and 4th grade TAAS tests administered in the spring
of 1999-2002. A committee of mathematics specialists and teachers selected the items
for the assessment. The items represented those objectives which most readily lend
themselves to working with manipulatives and visual cues in mathematics instruction.
Each of the selected objectives was represented by two word problems on the test; thus
there were a total of twenty items. The mini-probes contained twelve word problems
that assessed four objectives of the 1999-2002 TAAS 3rd and 4th grade mathematics
release tests. The released TAAS tests did not provide enough sample items to compile
the four mini-probes, so additional items were created with minor changes, e.g. to the
name of the person and the quantities in the word problem. The four equivalent mini-
probes measured weekly improvement throughout the study.
Descriptive Information on the 3rd and 4th Grade Study Participants
Table 4 shows descriptive information for the twenty-four 3rd grade participants to
include the following: a) gender, b) Oral Language Proficiency Test (OLPT); and c)
home language.

61
Table 4
Descriptive Information for the Third Grade Participants. Information Includes the Following: a) Gender, b) OLPT; and c) Home Language. Group Gender OLPT Home Language
aNES 0 bLES 1
Male 4
cFES 3
English 0
aNES 0 bLES 3
Manipulatives N=8
Female 4
cFES 1
Spanish 8
aNES 1 bLES 2
Male 3
cFES 0
English 0
aNES 2 bLES 1
Visual Cues N=8
Female 5
cFES 2
Spanish 8
aNES 1 bLES 1
Male 4
cFES 2
English 0
aNES 1 bLES 1
Comparison Group N=8
Female 4
cFES 2
Spanish 8
a Non English Speaker b Limited English Speaker c Fluent English Speaker
Table 4 shows that of the twenty-four 3rd grade students who participated in the
study: eleven male and thirteen female. The majority of the students in the 3rd grade
were at least limited English speakers and the greatest number was fluent English
speakers. This was true for both male and female students. All students had a home
language of Spanish which indicated that the primary source of their level of English
proficiency was school and/or peers. All students qualified for free and reduced lunch,
which also labels them economically disadvantaged.

62
Table 5 shows descriptive information for the twenty-four 4th grade participants to
include the following: a) gender, b) Oral Language Proficiency Test (OLPT); and c)
home language.
Table 5
Descriptive Information for the Fourth Grade Participants. Information Includes the Following: a) Gender, b) OLPT); and c) Home language. Group Gender OLPT Home Language
aNES 1 bLES 3
Male 5
cFES 1
English 0
aNES 0 bLES 1
Manipulatives N=8
Female 3
cFES 2
Spanish 8
aNES 1 bLES 1
Male 2
cFES 0
English 0
aNES 1 bLES 2
Visual Cues N=8
Female 6
cFES 3
Spanish 8
aNES 2 bLES 2
Male 6
cFES 2
English 0
aNES 0 bLES 1
Comparison Group N=8
Female 2
cFES 1
Spanish 8
a Non English Speaker b Limited English Speaker cFluent English Speaker
Table 5 shows that a total of twenty-four 4th grade students participated in the study:
thirteen males and eleven females. The home language for all 4th grade participants was
Spanish. Most had been in the country for more than three years and did not qualify as
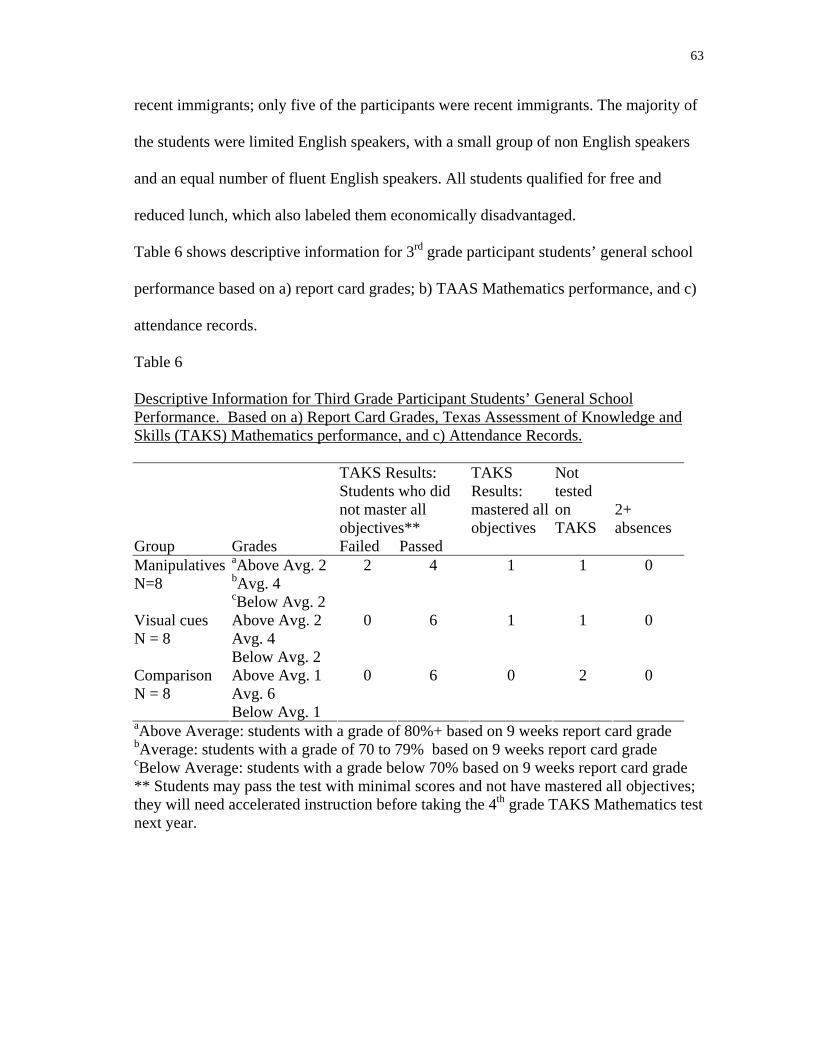
63
recent immigrants; only five of the participants were recent immigrants. The majority of
the students were limited English speakers, with a small group of non English speakers
and an equal number of fluent English speakers. All students qualified for free and
reduced lunch, which also labeled them economically disadvantaged.
Table 6 shows descriptive information for 3rd grade participant students’ general school
performance based on a) report card grades; b) TAAS Mathematics performance, and c)
attendance records.
Table 6
Descriptive Information for Third Grade Participant Students’ General School Performance. Based on a) Report Card Grades, Texas Assessment of Knowledge and Skills (TAKS) Mathematics performance, and c) Attendance Records.
TAKS Results: Students who did not master all objectives**
TAKS Results: mastered all objectives
Not tested on TAKS
2+ absences
Group
Grades Failed Passed aAbove Avg. 2 bAvg. 4
Manipulatives N=8
cBelow Avg. 2
2 4 1 1 0
Above Avg. 2 Avg. 4
Visual cues N = 8
Below Avg. 2
0 6 1 1 0
Above Avg. 1 Avg. 6
Comparison N = 8
Below Avg. 1
0 6 0 2 0
aAbove Average: students with a grade of 80%+ based on 9 weeks report card grade bAverage: students with a grade of 70 to 79% based on 9 weeks report card grade cBelow Average: students with a grade below 70% based on 9 weeks report card grade ** Students may pass the test with minimal scores and not have mastered all objectives; they will need accelerated instruction before taking the 4th grade TAKS Mathematics test next year.

64
Table 6 shows descriptive information for the 3rd grade students’ general academic
performance based on the average yearly report card grades, TAKS (Texas Assessment
Knowledge and Skills) mathematic performance, and attendance. In the Manipulatives
group, four students passed the TAKS mathematics test without mastering all objectives.
They showed minimally necessary skills in 3rd grade mathematics but will need
accelerated instruction to pass the next level of testing (i.e. the 4th grade test in the next
year). The two students who failed mastered none of the objectives and did not meet
minimal requirements on a sufficient number of the objectives to pass. Similarly, in the
Visual Cues and Comparison groups, six students passed the test with minimal
requirements and no mastery of the objectives.
The grades are reflective of student general yearly performance in the core subject
areas: math, science, social studies, and language arts. Prior to the end of the school
year, in April, the TAKS was administered to all eligible students⎯those who met Texas
Education Agency requirements of three or more years of residence in the United States
and had attended school in their country of origin. The majority of the students, sixteen,
passed the mathematics portion of the TAKS with the minimum requirement, two of the
students did not pass, only two mastered all objectives, two (recent immigrants) were
exempt from taking the test based on their limited time in the United States, and two
others withdrew from school before the test was administered.
The State Board of Education established a two-year phase-in period for students to
meet a recommended passing standard. They followed the national Technical Advisory
Committee’s recommendation to use the standard error of measurement (SEM) statistic
to determine the standards during the phase-in period. For 2003, the passing standard

65
was set at 2 SEM below the panel recommendation, moving up to 1 SEM below for
2004 and to panel recommendation for 2005. The students in this study “passed TAKS”
at 2 SEM below the panel recommended performance standard. Had the standard for
2003 been at panel recommended level, the majority of the students would have failed
the 3rd test in mathematics.
Table 7 shows descriptive information for 4th grade participant students’ general
school performance based on a) report card grades; b) TAAS Mathematics performance,
and c) attendance records.
Table 7
Descriptive Information for Fourth Grade Participant Students’ General School Performance. Information Based on a) Report Card Grades; b) TAAS Mathematics Performance, and c) attendance records.
TAKS Results: Students who did not master all objectives**
TAKS Results: mastered all objectives
Not tested on TAKS
2+ absences
Group
Grades Failed Passed aAbove Avg. 1 bAvg. 2
Manipulatives N=8
cBelow Avg. 5
2 5 0 1 0
Above Avg. 0 Avg. 2
Visual cues N = 8
Below Avg. 6
2 4 1 1 0
Above Avg. 2 Avg. 4
Comparison N = 9
Below Avg.2
0 7 1 0 0
aAbove Average: students with a grade of 80%+ based on 9 weeks report card grade bAverage: students with a grade of 70 to 79% based on 9 weeks report card grade cBelow Average: students with a grade below 70% based on 9 weeks report card grade ** Students may pass the test with minimal scores and not have mastered all objectives; they will need accelerated instruction before taking the 5th grade TAKS Mathematics test next year.

66
Table 7 shows descriptive information for the 4th grade students’ general academic
performance based on the average yearly report card grades, TAKS (Texas Assessment
Knowledge and Skills) mathematic performance, and attendance. In the Manipulatives
group, five students passed the TAKS mathematics test without mastering all objectives.
They showed minimally necessary skills in 4th grade mathematics but will need
accelerated instruction pass the next level of testing (i.e. the 5th grade test in the next
year). The two students in the Manipulatives group mastered none of the objectives and
did not meet minimal requirements on a sufficient number of the objectives to pass.
Similarly in the Visual Cues group four students passed with minimal skills and two did
not meet even that level. In the Comparison group 7 passed with minimal skills but
demonstrated no mastery of the objectives. There was an overall below average level of
academic and particularly mathematic performance for all participants.
The grades are reflective of student general yearly performance in the core subject
areas: math, science, social studies, and language arts. These students were tested under
the same requirements as the third grade group. The majority of the students, fourteen,
passed the mathematics portion of the TAKS with the minimum requirement, four of the
students did not pass, only two mastered all objectives, and four were exempt from
taking the test based on their limited time in the United States. As with their third grade
counterparts, these students passed only because the phase-in allowed for 2 SEM below
the panel recommended passing standard.
Descriptive Results of the Pre-Assessment Mathematic Performance
The pre-assessment was composed of ten of the thirteen TAAS objectives, pre-
selected for their potential relationship to manipulative based instruction and/or visual

67
cues. Two questions were used for each objective, for a total of twenty. The pre-
assessment was given in both English and Spanish to all available 3rd and 4th grade
students so that the researcher could identify those students with low mathematical
skills, whether they were English or Spanish speakers, and which objectives should be
included in the study. The Pre-assessment also served as the first in the series of six
probes for all students in both grades.
Students were divided into two groups; third and fourth grade, with thirty-two
students in each group. The researcher first read each question to the 3rd grade students
in English. Students were allowed three to four minutes to complete the answer. Then
the researcher read the next question in English. When the students had completed the
English version of the pre-assessment, the questions were read aloud again, this time in
Spanish, and the same procedures for answering were followed. Both languages were
used to rule out language as a barrier to performance and measure only the mathematical
skills of the students. Students responded in writing using a supply-type response format
which required that they create rather than choose an answer, and show their work for
solving the problem. The same set of procedures was used for the 4th grade group.
An informal item analysis of the ten objectives in the pre-assessment identified four
objectives on which the students scored lowest and which were to be used as the basis of
further instruction and assessment. The student population for further study was selected
by limiting to those of the original sixty-four achieving <55% overall on the pre-
assessment.
Table 8 illustrates the Quantile distribution of student performance on the pre-
assessment based on a) all available students; b) all available 3rd grade students; c) all

68
available 4th grade students; d) 3rd grade students identified to participate in the study; e)
4th grade students identified to participate in the study; and f) all students assigned to the
control group.
Table 8 Quantile Distribution Table Showing Percent of Students Scoring in Each Quartile of the Pre-Assessment. Data based on a) All Available Students; b) All Available 3rd Grade Students; c) All Available 4th Grade Students; d) 3rd Grade Students Identified to Participate in the Study; e) 4th Grade Students Identified to Participate in the Study; and f) all Students Assigned to the Control Group.
Percentile All Groups
10th 25th 50th 75th 90th All Studentsa (N=64) 10 20 35 50 55
3rd Grade Students (N=32) 10 15 42.5 50 55
4th Grade Students (N=32) 6.5 21.25 35 45 55
3rd Grade Participants (N=24) 10 11.25 32.5 50 50
Manipulatives (N=8) 5 10 22.5 48.75 50
Visual Cues (N=8) 10 11.25 37.5 47.5 50
Comparison (N=8) 10 16.25 32.5 50 55
4th Grade Participants (N=24) 5 16.25 27.5 38.75 45
Manipulatives (N=8) 5 7.5 22.5 37.5 45
Visual Cues (N=8) 5 21.25 30 35 45
Comparison (N=8) 10 17.5 32.5 40 45
Table 8 shows that for performance of all sixty-four students on the pre-assessment,
90% answered fewer than 67.5% of the questions correctly, which was below the usually
accepted passing average of 70%.The median score for all students was 37.5%. The

69
participating 3rd and 4th grade students were selected based upon those of the original
sixty four who scored <55% overall on the pre-assessment.
Figure 1 shows a box plot for all 3rd grade students and their success on the pre-
assessment, calculated from only the ten pre-selected objectives (20 questions) from the
1999-2002 released TAAS mathematics tests for 3rd grade. The scores were calculated as
a percentage correct out of twenty questions. The students who scored lowest on all ten
objectives were identified to form the experimental groups (Manipulative, Visual Cue,
and Comparison) to receive supplemental small group math instruction twenty-four
minutes a day, four days a week for five weeks.
Figure 1. Box Plots of Pre-Assessment Results for All Thirty-two Third Grade Students by Group. The groups are as following: Manipulative (N=8), Visual Cues (N=8),, Control Group (N=8),, and d) Other (N=8). Students who were used Only as a Second, Separate Comparison Group in order to Compare Averages. Box Plots of All Students in their Designated Groups
100.0
75.0
Scor
e
50.0
25.0
0.0 1Manip 2 Visual 3 Control 4 Other
Group
The above figure illustrates percentile distributions for pre-assessment results for 3rd
grade groups: Manipulative, Visual, Comparison, and Other group. The box plot labeled

70
“Other” are the students who did not qualify for the study based on the maximum score
limit of 55. All three participant groups are similar, with interquartile ranges (IQR) no
higher than 55. In the Other group, composed of those who did not receive an
intervention, the scores are between 55 and 75.
Figure 2 shows a box plot for pre-assessment scores of all 4th grade students using
only the ten pre-selected objectives (20 questions) from the 1999-2002 released TAAS
mathematics tests for 4th grade. The scores were calculated as a percentage correct out
twenty questions. The students whose average scores were the lowest on all ten
objectives were identified to become members of treatment groups and receive
supplemental small group math instruction twenty-five minutes a day, four days a week
for five weeks. In order to improve logical inferences from the results, equivalent
groups were formed by matching the pretest results, from the randomized student lists.
Randomization with post-matching for balance is superior to pure randomization with
small numbers of subjects. Students with similar scores were matched and then
randomly reassigned to treatment groups to make the groups as equivalent as possible.

71
Figure 2. Box Plots of Pre-Assessment Results Illustrating all Thirty-two Fourth Grade Students by Group. The Groups are the following: a) Manipulative, b) Visual cues, c) Control group, and d) Other. Students that were Ineligible to Participate based on their score. Box Plots of All Students in their Designated Groups. (Manipulatives N=8) (Visual N=8) (Control N=8) (Other N=8)
4th Grade Students by Group
100.0
75.0
50.0
Scor
e
25.0
0.0 2 Visual 3 Control 4 Other1Manip
Group
Figure 2 illustrates pre-assessment percentile distributions for 4th grade groups:
Manipulative, Visual Cues, Comparison and the Other groups. All three participant
groups⎯Manipulative, Visual Cues and Comparison⎯ were similar with the
interquartile range (IQR) no higher than a 45. In the Other group, which included only
those who did not receive the interventions and were excluded from the study other than
to participate in the pre and post assessment average scores were not much higher.
Table 9 shows descriptive statistics for all students for the pre-assessment: a) all
available students (3rd and 4th combined), b) all available 3rd grade students, c) all
available 4th grade students.

72
Table 9
Descriptive Statistics for All Students for the Pre-Assessment. Based on the following Information: a) all available students (3rd and 4th combined); b) all available 3rd grade students c) all available 4th grade students.
Pre-Assessment All Available Students
N Median M SE SD All Students (N=64) 64 35.000 35.200 2.300 18.040
3rd Grade Students(N=32) 32 42.500 36.250 3.230 18.310
4th Grade Students (N=32) 32 35.000 34.210 3.180 18.010
Table 9 shows the descriptive means for the pre-assessment of all available students
combined and by grade level. The overall mean for all available students was 35.2% out
of a possible 100%, with no notable differences between and across grade levels. Other
descriptive statistics such as the standard deviation was noted between pre-assessment
scores of all students, scores are consistently at the failing level.
Table 10 shows descriptive statistics for 3rd grade students for the pre-assessment a)
all available 3rd grade students; b) three 3rd grade subgroups: manipulatives, visual cues,
comparison, and other,

73
Table 10
Descriptive Statistics for Third Grade Students for the Pre-Assessment. Information on the following: a) All Available 3rd Grade Students; b) Three 3rd Grade Subgroups: Manipulatives, Visual Cues, Comparison, and Other,
Pre-Assessment
All 3rd Grade Participants N Median M SE SD
3rd Grade Participants N=24) 24 32.500 30.410 3.530 17.310
Manipulatives(N=8) 8 22.500 26.870 6.800 19.260
Visual Cues(N=8) 8 37.500 31.250 6.030 17.060
Comparison(N=8) 8 32.500 33.120 6.110 17.300
Table 10 shows the descriptive means for the pre-assessment of all 3rd grade
participants and the selected participants in their designated group. The overall mean for
all participants was 30.4% out of a possible 100%. Equivalent ability groups based on
scores were formed by randomly re-assigning students to three different instructional
intervention groups: explicit vocabulary using Manipulatives, explicit vocabulary using
Visual Cues and a Comparison group. Due to the small number of 3rd grade students in
each intervention group the standard deviation was still relatively consistent with all
participants.
Table 11 shows descriptive statistics for 4th grade students for the pre-assessment a)
all 4th grade participants; b) three 4th grade subgroups: Manipulatives, Visuals Cues, and
Comparison.

74
Table 11
Descriptive Statistics for Fourth Grade Students for the Pre-Assessment. Information of the Following: a) All Available 4th grade students; g) Three 4th Grade Subgroups: Manipulatives, Visuals Cues, and Comparison.
Pre-Assessment
All 4th Grade Participants N Median M SE SD
4th Grade Participants (N=24) 24 27.500 27.080 2.650 13.010
Manipulatives(N=8) 8 22.500 23.120 5.250 14.860
Visual Cues(N=8) 8 30.000 28.120 4.320 12.220
Comparison(N=8) 8 32.500 30.000 4.430 12.530
Table 11 shows the descriptive means for the pre-assessment of all 4th grade
participants and the selected participants in their designated group. The overall mean for
all participants was 27.08% out of a possible 100%. The standard deviation is 13.01
meaning the range of scores was from approximately 14% to approximately 40%
passing rate. Equivalent ability groups based on scores were formed by randomly re-
assigning student to three different intervention instructional groups: explicit vocabulary
using manipulatives, explicit vocabulary using visual cues and a comparison group.
Even though there were a small number of 4th grade students in each intervention group
the standard deviation were still relatively consistent across intervention groups.
Instrument Reliability for Pre/Post Assessment Instruments
A Cronbach’s alpha (or coefficient alpha) is a measure of internal consistency, one
important type of reliability. It is a good estimate of the reliability of the pre/post test
based on its comparison with another equivalent form of the test. Alpha is the average
of all possible split/half comparisons between equal item groups in the test. The pre/post

75
tests were developed at the same time using essentially the same questions, but changed
numerical representation and names in the story problems. Both tests were created to be
equivalent with the same level of difficulty and format. Since Cronbach’s alpha is a
correlation, it can range between -1 and 1. In most cases it is positive, although negative
values arise occasionally as was the result of the grade level four of this present study.
According to Carmines (1990), a Cronbach's Alpha value of at least 0.8 should be
achieved for widely used instruments. For experimental instruments, which are not
being applied for important real-world decision-making, then .75 may be acceptable.
Furthermore, a Cronbach's Alpha is conducted on an entire test only when all items
in the test measure closely related skills, as in the present study. All items in the pre/post
assessment instruments were mathematical and required multi-step to solve the word
problem that included division, multiplication and other basic skills. Results from the
Alpha on the grade level three tests yielded a .799 and for grade level four a .711. For
an experimental test, grade three possesses reasonable reliability so it should have been
reasonably sensitive to measure the improvement of participants in the present study.
However, the manipulative and visual cue interventions needed to be strong and long
enough.
The grade level four tests show quite low reliability (internal consistency), so it
produced a weak measurement for the present study. With such weak reliability,
improvement was difficult to measure. Extra time should have been spent to try out
different items until the tests arrived at a higher level of reliability.

76
Research Question One
Based upon pre-post testing, which of these two interventions, a) Manipulatives or b)
Visual Cues (both including vocabulary enrichment), conducted four days a week for
five weeks, improve Hispanic English language learner’s mastery of mathematical
concepts in operation and problem solving, when compared to their peers in the
comparison group?
To answer this question, a mixed ANOVA (repeated measures, with a grouping
factor) was used, with instructional group as the grouping factor, and pre/post
assessment of math the repeated measure. This analysis was conducted independently
for grade levels 3 and 4. The ANOVA included a nominal, categorical instructional
intervention variable, with three levels: Manipulative, Visual Cues, and the Comparison
group. The ANOVA also used one continuous, equal-interval math score variable,
mathematical assessments with 2 levels, pre and post. Each ANOVA had six cells,
which yielded a cell size of eight.
A power analysis for the mixed ANOVA design (one repeated measure with two
levels and one between-factor with three levels) was conducted. Using the significance
level of .05, the power results for the design was 75% for a critical effect size of .65, and
85% for a critical effect size of d=.65. This amount of power was considered
marginally adequate for the expected results.
Table 12 shows the results of the mixed ANOVA (repeated measures, with a
grouping factor). The instructional group was used as a grouping factor and the pre/post
assessment of mathematics as the repeated measure.

77
Table 12
Third Grade Analysis of Variance Table
DF
Sum of Squares Mean Square F-Ratio
Prob.Level
Instructional Group 2 116.666 58.333 0.160 0.851
Pre/Post Math Test 1 8268.750 8268.750 22.810 0.000
Interaction 2 237.500 118.750 .330 .722
Error 42 15225.000 362.500
Total(adjusted) 47 23847.920
Table 12 shows the results of the mixed ANOVA (repeated measures, with a
grouping factor) with the instructional group as a grouping factor and the pre/post
assessment of math, the repeated measure. The source of data was one nominal,
categorical grouping variable, with three levels which are: Manipulatives, Visual Cues,
and the Comparison group. The ANOVA also used a continuous, equal interval math
score variable, with two levels, pre and post assessment. The total number (N) of 3rd
grade students was twenty-four. The ANOVA had six cells, which yielded a cell size of
eight.
A mixed ANOVA yields the results of three main effects thus calculating three F-
ratio scores: between groups; across time (pre/post); and the interaction which was a
cross between the over time comparison and between group comparison. The only
relevant output was the third F which was the interaction. There was not a significant
difference in the means between either the instructional groups [F=.16, p value=.857] or
the interaction [F=.33, p value=.722], respectively. The individual groups did not show

78
a significant different amount of improvement between the pre- and post-assessment.
There was no progress from the pre/post assessment that could be attributed to the
intervention the students received in their instructional group.
Table 13 shows the third grade means and standard deviation from the ANOVA,
presented by sub-groups (treatment group x test time).
Table 13
Third Grade Means and Standard Deviation from ANOVA. Information presented by sub-groups (Treatment group x Test time).
Sub Group Count M SD Manipulative Pre 8 26.875 6.731
Manipulative Post 8 56.875 6.731
Visual, Pre 8 31.250 6.731
Visual, Post 8 60.000 6.731
Comparison Pre 8 33.125 6.731
Comparison Post 8 53.125 6.731
Table 13 shows the means and standard deviations of the pre and post scores
according to the different intervention group. There was improvement in the average of
scores from pre- to post-assessment. The Manipulative group improved by 30 points
from the pre- to the post-assessment. The Visual Cue group improved 28.75 points from
the pre- to the post-assessment. The Comparison group was the least improved with the
20 points of improvement from the pre- to the post-assessment. The standard deviation
was consistent throughout all the pre- and post-assessment in all three groups.

79
Figure 3 illustrates the interaction groups for 3rd grade. It gives a visual
representation of the three instructional groups across time (pre and post assessment).
Figure 3. ANOVA Interaction Graphs for Third Grade. Instructional Group x Math Test time (pre/Post) (N=24)
0.00
25.00
50.00
75.00
100.00
1Pre 2Post
Means of Score
PrePost
Scor
e
GroupControlManipVisual
0.00
25.00
50.00
75.00
100.00
1Pre 2Post
Score vs PrePost by Group
PrePost
Scor
e
The above graphs depict graphically the means table results: all three treatment
groups improved over time. However, differential rates of improvement cannot be
detected between the interventions.
Table 11 shows the results of the mixed ANOVA (repeated measures, with a grouping
factor) for 4th grade. The instructional group will be used as a grouping factor and the
pre/post assessment of mathematics as the repeated measure.

80
Table14
Fourth Grade Analysis of Variance Table
DF Sum of Squares
Mean Square
F-Ratio Prob. Level
Instructional Group 2 396.875 198.437 0.710 0.496
Pre/Post Math Test 1 1752.083 1752.083 6.290 0.016
Interaction 2 38.541 19.270 0.070 0.933
Error 42 11693.750 278.422
Total(adjusted) 47 13881.250
Table 14 shows the results of the mixed ANOVA (repeated measures, with a
grouping factor) with the instructional group as a grouping factor and the pre/post
assessment of math, the repeated measure. The total number (N) of 4th grade students
was twenty-four. The ANOVA had six cells, which yielded a cell size of eight.
A mixed ANOVA yielded the results of three main effects thus calculating three F-
ratio scores: between groups; across time (pre/post); and the interaction which was a
cross between the over time comparison and between group comparison. The only
relevant output was the third F which was the interaction. There was not a significant
difference in the means between either the instructional groups [F=.71, p value=.496] or
the interaction [F=.07, p value=.933], respectively. The individual groups did not show
significant different amount of improvement between the pre- and post-assessment.
There was no progress from the pre/post assessment that could be attributed to the
intervention the students received in their instructional group.

81
Table 15 shows the fourth grade means ands standard deviation from the ANOVA,
presented by sub-groups (treatment group x test time).
Table 15
Fourth Grade Means and Standard Deviation from ANOVA. Information presented by subgroups (Treatment group x Test time).
Sub Group Count M SDManipulative Pre 8 23.125 5.899
Manipulative Post 8 35.000 5.899
Visual, Pre 8 28.125 5.899
Visual, Post 8 42.500 5.899
Comparison Pre 8 30.000 5.899
Comparison Post 8 40.000 5.899
Table 15 shows the means and standard deviations of the pre and post scores
according to the different intervention group. There was improvement in the average of
scores from pre to post assessment. The Manipulative group improved by 11.88 points
form the pre to the post assessment. The Visual Cue group improved 14.38 points from
the pre to the post assessment. The Comparison group was the least improved with the
10 points of improvement from the pre to the post assessment. The standard deviation
was consistent throughout all the pre and post assessment in all three groups.
Figure 4 illustrates the interaction groups for 4th grade. It gives a visual
representation of the three instructional groups across time (pre- and post-assessment).

82
Figure 4. ANOVA Interaction Graphs for Fourth Grade. Instructional Group x Math Test time (Pre/Post) (N=24)
0.00
20.00
40.00
60.00
80.00
1Pre 2Post
Means of Scorex
PrePostx
Scor
ex
GroupxControlManipVisual
0.00
20.00
40.00
60.00
80.00
1Pre 2Post
Scorex vs PrePostx by Groupx
PrePostx
Scor
ex
The above graphs confirm what the means table concluded: General improvement is
noted across all three instructional groups. However, the improvement cannot be
attributed to any particular intervention.
Research Question Two
The second research question was: When compared to their peers in the comparison
group, to what degree did Hispanic English language learners improve in mathematical
concepts in operation and problem solving?
To answer this question, a trend analysis for the three separate groups was conducted to evaluate
growth over time, based on six sequential probes. The "Time" variable had an equal-interval
scale, as probes were administered at the same time every week. Trend analyses were
conducted to identify slope coefficients and their significance, for each individual student, and
for group averages. There were a total of eighteen cells, which yielded an average size cell of
approximately two. A trend analysis was also conducted for each individual student, and then
averaged for each group. Statistical differences between the group trend coefficients were
conducted.

83
Instrument Reliability for the Mini-Probes
Reliability in time-series is judged by how much bounce there is from one administration of
mini assessment to the next. Where there is a trend, then the bounce or variability is measured
around a trend line rather than around a flat mean line. A lot of bounce will yield insignificant
trend lines as was the result in the present study. However, lack of significance in trend lines
can also be due to very slight or small slopes (lines nearly flat), so additional information to
judge significance of measurement in time series was obtained. The standard error of the slope
was used as additional information. The standard error of slope was calculated by using the
study’s’ time series data and using a regression module. Data unreliability is concluded when
there are large or wide error bands around the slope. The standard error of slope is the span or
interval within which there is a 68% certainty that the true slope lies, found as the SE for the
raw slope coefficient. Whether a SE value is big or little can be judged by comparing the error
of Slope with the slope coefficient. Typical and expected would be a standard error of about a
third of the slope coefficient. A larger SE value which is close to the slope coefficient or even
larger would be considered quite large, hence the time series measurement would be considered
to have low reliability.

84
Figure 5 Third Grade Manipulatives Group
0
1
2
3
4
5
6
7
1 2 3 4 5 6
Progress of 3rd Grade Manipulative Group
ProbeNo
Sco
re
Figure 5 shows the 3rd grade Manipulative group’s growth over time for six weekly
mathematical probes. The probes had a maximum of twelve math items.
The circles on the graph represent the raw score means for the Manipulative group. The
wands extending above and below the means are the 85% Confidence Interval (CI) for
the mean, which bracket outside boundaries within which there is 85% certainty that the
true mean really lies. There appeared to be a gradual improvement from the first probe
through the fifth and then a decrement in the 6th probe. The slope reversed downward,
from probe five to six and created a curvilinear trend. Significant improvement did
occur approximately every three weeks. Overall, rate of improvement was not rapid, as
between any two adjacent probes there was not a significant mean difference, as shown
by overlap of adjacent confidence intervals.

85
Table 16
Descriptive Statistics for Third Grade Students for the Mini Probes for Third Grade Manipulatives Group
Weekly Mini Probes
3rd Grade Manipulatives N Wk 1 Wk2 Wk3 Wk4 Wk5 Wk6
M 8 2.125 2.75 3.625 4.000 4.875 4.250
SD 8 1.808 2.375 3.335 2.619 3.563 2.493
Table 16 shows the means and standard deviations for each weekly probe for the 3rd
grade Manipulative group, graphed in Figure 5. There was a maximum of twelve items
correct per probe. The first week the mean score was approximately 16% correct. From
probe one through five there was a gradual total increase of 2 items correct. The highest
average for items correct that the 3rd grade Manipulative group obtained was in week
five, approximately 42% items correct overall.

86
Figure 6. Third Grade Visual Group
0
1
2
3
4
5
6
7
8
1 2 3 4 5 6
Progress of 3rd Grade Visual Group
ProbeNo
Sco
re
Figure 6 shows the 3rd grade Visual groups’ growth over time for six weekly
mathematical probes each with a maximum of twelve math items. There was a gradual
improvement from the first probe through the fourth and then a slight decrement in the
5th and 6th probes. Significant improvement occurred between the first and the third
probe as shown by the difference in the mean scores; also, significant improvement
occurs approximately every four weeks. However, the graph line showed a curvilinear
trend, due to the slope change after probe three. Overall improvement was not as large
as between the first three adjacent probes; there was not a significant mean difference as
shown by the confidence interval.

87
Table 17
Descriptive Statistics for Third Grade Students for the Mini Probes for Third Grade Visual Group.
Weekly Mini Probes
3rd Grade Visuals N Wk 1 Wk2 Wk3 Wk4 Wk5 Wk6
M 8 1.875 3.75 5.875 6.000 5.625 4.875
SD 8 1.245 1.909 3.482 2.268 2.973 1.727
Table 17 shows the means and standard deviation for each weekly probe for the 3rd grade
Visual group, graphed in Figure 6. The first week the mean score was approximately 14% of
items correct. From probe one through three there was a gradual increase of approximately 3
items correct, which was about a 25% improvement from one administration to another. The
highest average for items correct obtained by the 3rd grade Visual group was in week four, with
6 out of 12 items or 50% correct overall. In probe five there was a decrease of .375 in the mean
and in probe six a 1.125 decrease from the peak score achieved in probe four.
Figure 7. Third Grade Comparison Group
0
1
2
3
4
5
6
1 2 3 4 5 6
Progress of 3rd Grade Comparison Group
ProbeNo
Sco
re

88
Figure 7 shows the 3rd grade Comparison groups’ growth over time for six weekly
mathematical probes. The line graph was curvilinear: upward from probe one through
three, then a decrement after the fourth probe, and a slight increase to the sixth probe.
Thus, there was inconsistent improvement from the third probe to the sixth probe. There
appeared to be significant improvement between the first probe and the second probe;
also, significant improvement did occur approximately every two weeks. Overall,
improvement was not as large as between the first two adjacent probes and there is no
significant mean difference.
Table 18
Descriptive Statistics for Third Grade Students for the Mini Probes for Third Grade Comparison Group.
Weekly Mini Probes
3rd Grade Comparison N Wk 1 Wk2 Wk3 Wk4 Wk5 Wk6
M 8 1.750 3.250 4.625 4.875 3.625 4.000
SD 8 1.581 2.121 3.160 2.800 1.685 2.070
Table 18 shows the means and standard deviations for each weekly probe for the 3rd grade
Comparison group, graphed in 7. Considering the bounce that the graph shows from probe three
to six, we can be quite (85%) sure, that there was consistent improvement from probe one
through three. The first week's mean score was approximately 13% correct. From probe one
through four there was increase of approximately 2 items correct, which was about a 16%
improvement from one administration to another. The highest average for items correct that the

89
3rd grade Comparison group obtained was in week four, with fewer than 5 out of 12 items
correct, or less than 50% of items correct overall.
Figure 8. Fourth Grade Manipulatives Group
0
1
2
3
4
1 2 3 4 5 6
Progress of 4th Grade Manipulative Group
ProbeNo
Sco
re
Figure 8 shows the 4th grade Manipulative group's growth over time for six weekly
mathematical probes. The 4th grade manipulatives graph had a curvilinear trend. The
mean of items correct shows a decrement in probe four and probe six, but overall there
was an increase of two items correct throughout the five week study. The wands
extending above and below the means are the 85% Confidence Interval (CI) for the
mean There was a gradual improvement in means between the first and third probe and a
slight decrease in the mean from the third probe to the fourth and then again from the
fifth probe to the sixth. The overlap of confidence interval lines in probe two through
six signifies that their means are not significantly different form one another. Overall

90
improvement was not large; between any two adjacent probes there is not significant
mean difference. Significant improvement occurred every two weeks. Where
confidence intervals overlap we cannot be 85% certain that the group mean scores are
really different.
Table 19
Descriptive Statistics for Fourth Grade Students for the Mini Probes for Fourth Grade Manipulatives Group.
Weekly Mini Probes
4th Grade Manipulatives N Wk 1 Wk2 Wk3 Wk4 Wk5 Wk6
M 8 .750 1.75 2.375 2.125 2.625 2.250
SD 8 1.035 2.765 2.387 2.296 2.825 1.982
Table 19 shows the means and standard deviations for each weekly probe for the 4th grade
Manipulative group, graphed in Figure 8. The first week the mean score was approximately less
than 8% of items correct. From probe one through three there was a gradual total increase of 2
items correct, which was about a 16% improvement from one administration to another. The
highest average for items correct obtained by the 4th grade Manipulative group was in week
five, with approximately 2 out of 12 items correct or 16% of items correct overall.

91
Figure 9. Fourth Grade Visual Group
0
1
2
3
4
5
1 2 3 4 5 6
Progress of 4th Grade Visual Group
ProbeNo
Sco
re
Figure 9 shows the 4th grade Visual groups’ growth over time for six weekly
mathematical probes. The shape of the line graph had a concave curvilinear trend that
decreased between probe one and three, then increases from probe three to six. There
was a gradual decrease in mean score between probes one through three. Significant
improvement did occur after the third probe. Overall improvement was not as large as
between any two probes adjacent to one another. There was not a significant mean
difference in the mean score as shown by the confidence interval and there is overlap of
confidence intervals between probe one and three and four and five.

92
Table 20
Descriptive Statistics for Fourth Grade Students for the Mini Probes for Visual Group.
Weekly Mini Probes
4th Grade Visuals Group N Wk 1 Wk2 Wk3 Wk4 Wk5 Wk6
M 8 1 .875 .625 1.500 1.625 3.125
SD 8 0.926 1.356 0.916 1.690 1.408 2.642
Table 20 shows the means and standard deviations for each weekly probe for the 4th
grade Visual group, graphed in Figure 9. In the first week, the mean score was
approximately 8% correct. From probe one through three there was a gradual decrease
of approximately 2 items correct. The highest average for items correct for the 4th grade
Visual group was in week six, with approximately 3 out of 12 items correct, or 25% of
items correct overall.

93
Figure 10. Fourth Grade Comparison Group
0
1
2
3
4
1 2 3 4 5 6
Progress of 4th Grade Comparison Group
ProbeNo
Sco
re
Figure 10 shows the results of the 4th grade Comparison groups’ growth. The graph
line had a curvilinear trend, slightly decreasing in mean of items correct from probe one
to two, then increasing from two through four. Another decrease of mean improvement
is from four to five. There was gradual improvement from the second probe through the
fourth, a slight decrement from the first to the second probe, and another slight
decrement from the fourth probe to the fifth probe. Significant improvement did occur
approximately every four weeks. Overall improvement was not as large as between any
two adjacent probes, and there was no significant mean difference in the score. Overlap
of confidence intervals occurs from the first through the third and then again third
through the sixth; thus, there is no difference in the means.

94
Table 21
Descriptive Statistics for Fourth Grade Students for the Mini Probes for Comparison Group.
Weekly Mini Probes
4th Grade Comparison Group N Wk 1 Wk2 Wk3 Wk4 Wk5 Wk6
M 8 1.500 1.375 2.000 2.875 2.250 2.375
SD 8 0.926 2.133 1.773 2.167 2.188 1.598
Table 21 shows the means and standard deviations for each weekly probe for the 4th grade
Comparison group, graphed in Figure 10. In the first week, the mean score was approximately
12% of items correct. From probe one through two there was a slight decrease of less than 1
item correct, about an 8% decrease. The highest average for items correct obtained by the 4th
grade Comparison group was in week four, with approximately 2 out of 12 items correct or16%
of items correct overall.
Summary of Graphical Representation for Third Grade Manipulative, Visual and Comparison
Groups
In summary, all three third grade instructional groups (Manipulative, Visual and
Comparison) improved slightly over the five week duration of the study, as seen in their
increasing mean scores. There was much variability, as evidenced by SE slope and by the
overlapping Confidence Intervals. The improvement did not occur from one week to another,
and the trend was not linear. The graphs show curvilinear trends in all 3rd grade instructional
groups. In the first three administrations a slight improvement on items correct did occur but
this was not maintained with each subsequent administration, occasionally there was a decrease

95
in mean scores. The overall highest average of items correct per week in all three groups was six
out of twelve possible math items on the probe
All groups show improvement in the early probes with varying degrees of decrement in the
later probes. The Manipulative group shows a consistent improving trend from probe one
through four with an inflection in probe five. Throughout the study the Manipulative group
averaged slightly less than five items correct per probe. The Visual group also showed a
consistent improvement in probes one through three then the trend line changes taking a
downward direction from probe three to six. This group also had the highest items correct per
weekly probe in the first three probes, averaging 6 out of 12. The Comparison group showed a
significant increase from probe one to four, the trend line takes a downward direction to probe
five, and then slightly increases to probe six. Similar to the Manipulative group the average
items correct per week for the Comparison group was approximately 5.
Overall, according to the graphs, all the instructional groups seem to improve between the
first three consecutive administrations where they show a linear trend with adjacent probes. For
example, the Manipulative group has a linear trend between probe one and five, the Visual
group between one and three, the Comparison group between one and four. Although they
show linear trends in the graph, their maximum average for items correct per week was 6 out of
12 which occurred in the Visual group. All three groups had mean scores decrease in the later
probes, mostly between probes four to six.
Summary of Graphical Representation for Fourth Grade Manipulative,
Visual and Comparison Groups
In summary, the overall improvement in all three fourth grade groups (Manipulatives,
Visual, and Comparison) was minimal as seen in their mean scores. There was much variability

96
as evidenced from the SE slope and overlapping CIs. The minimal improvement was not
consistent throughout the five week duration of the study, and the trend was not linear. The
graphs show curvilinear trends in all 4th grade instructional groups. Improvements on items
correct per every administration of the mathematical probe were low, with the overall highest
average per week in all three groups being approximately three out of the twelve possible math
items.
There is no consistent pattern among all three groups across the study. The Manipulative
group shows a gradual improvement in means between the first and third probe, with slight
decrements in probe four and six. The Visual group had low mean scores at the beginning
between probe one and three, and slightly increased their mean score between probe four and
six. Their greatest improvement was at the end between probe five and six. The Comparison
group shows a slight decrease in means scores in probe two, and again in probe five.
Overall according to the graphs, the Manipulative and Comparison groups seem to improve
between the earlier consecutive administrations; they show a linear trend in adjacent probes.
For example, the Manipulative group has a linear trend between probe one and three, the
Comparison group between two and four. Although they show linear trends in the graph, their
maximum average for item correct per week was less than 3 out of 12. The Visual group
showed decreasing mean scores with a trend line that slightly decreased to a mean of less than 1
item correct between probe one and three. However, according to the graphs the Visual group
seemed to have the most improvement between probes three and six, thus also having the
highest average of items correct per week of slightly less than 4 out of 12.

97
Individual Slope Coefficients for Third Grade Students
Table 22 shows the raw score slope coefficient for 3rd grade Manipulative, Visual and
Comparison individuals. The table contains the raw slope coefficient for every participant,
interpretable as the weekly rate of linear improvement across the six mathematical probes.
Table 22
Raw Score Slope Coefficient for Third Grade Manipulative, Visual and Comparison Groups.
Manipulative Visual Comparison Slope Signif. Slope Signif. Slope Signif -0.143 NS 0.029 NS -0.429 NS 0.114 NS 0.229 NS 0.029 NS 0.400 NS 0.543 NS 0.257 NS 0.486 NS 0.657 NS 0.286 NS 0.571 NS 0.686 NS 0.486 NS 0.627 NS 0.800 S 0.571 NS 0.714 S 0.800 S 0.743 S 1.200 S 1.000 S 0.943 S
Not Significant (NS) value on the table signifies that the student did not make significant improvement
As shown in Table 22 for the third grade Manipulative, Visual and Comparison
groups, the raw slope coefficient is the average improvement per week. Significant tests
of the trustworthiness or reliability of each slope was conducted for certainty of where
the slope really lies. In order to show a wider range of improvement, a significance level
of .15 was used for all three instructional groups, outlining a boundary within which
exists 85% certainty that the true raw slope coefficient or rate of improvement lies.
The overall improvement of the third grade instructional groups’ (Manipulatives, Visual and
Comparison) raw slope coefficients was significantly small. There were eight students in every

98
instructional group. In the Manipulative group one out of the eight students had a negative
decrease in linear performance over the six probes. Two of the students showed significant
improvement while the rest did not. In the Visual group all eight students show a positive
improvement based on a linear trend, three participants made significant improvement and the
remaining five did not. In the Comparison group, one of the eight students demonstrated an
overall decrease in performance. Two of the students showed significant improvement and the
rest did not. Overall there were seven out of all the participants in each group (N=24) who
made significant improvement. The majority of the participants made a positive improvement
but not a significant improvement.
Individual Slope CoefficientsFor Fourth Grade Students
Table 23 shows the raw score slope coefficient for 4th grade Manipulative, Visual and
Comparison individuals. The table contains the raw slope coefficient for every participant,
interpretable as the weekly rate of linear improvement across the six mathematical probes.
Table 23 Raw Score Slope Coefficient for Fourth Grade Manipulative, Visual and Comparison Groups
Manipulative Visual Comparison Slope Signif. Slope Signif. Slope Signif0.057 NS -0.229 NS -0.229 NS 0.057 NS 0.000 NS -0.029 NS 0.086 NS 0.086 NS 0.057 NS 0.200 NS 0.143 NS 0.171 NS 0.371 NS 0.229 NS 0.200 NS 0.457 S 0.886 S 0.257 NS 0.486 S 1.000 S 0.286 NS 0.543 S 1.029 S 1.086 S
Not Significant (NS) value on the table signifies that the student did not make significant improvement

99
As shown in Table 23 for the third grade Manipulative, Visual and Comparison
groups, the raw slope coefficient shows the average improvement per week. Significant
tests of the trustworthiness or reliability of each slope was conducted for certainty of
where the slope really lies. In the Manipulative group, three of the eight participants
show a significant improvement based on a linear trend, while the remaining five did
not. In the Visual group one participant demonstrated an overall decrease in performance
and another participant had no improvement. Three of the participants in the Visual
group made significant improvement. In the Comparison group two participants
demonstrated a decrease in overall performance. One of the students had significant
improvement.
Most of the students’ average growth per week ranges from less than 1 point to
slightly above 1 point of improvement between administrations in all three instructional
groups. For the majority of participants in all instructional groups, the upper and lower
confidence intervals include zero, so the results were not significant, which means that
the trends were not significantly different from zero; they were flat.

100
CHAPTER V
SUMMARY, CONCLUSIONS, LIMITATIONS AND RECOMMENDATIONS
This study’s purpose was to determine the improvement of third and fourth grade
Hispanic English language learners’ mathematical skills due to two instructional
strategies, each involving explicit vocabulary enrichment⎯manipulative-based
instruction and visual cues⎯conducted in a small group setting The purpose generated
two research questions: 1) which daily intervention⎯Manipulatives or Visual
Cues⎯would most improve low-achieving Hispanic ELL learner's math skills?; and 2)
based on six progress monitoring probes, what amount and type of progress would be
shown in the two experimental groups’ operations and problem solving skills? The
following section discusses findings from the results for these two research questions.
Independent analyses were conducted for third and fourth grade levels.
The mixed ANOVA with repeated measures and grouping factors was used to
compare the growth from beginning to end of the five week duration of the study. A
power showed marginally adequate power for expected results, with the available
sample size. Results from the pre/post test comparison of the three groups showed that
no improvement could be attributed to the interventions. The third grade level’s mixed
ANOVA showed no significant difference in the mean scores between either the
instructional groups or the interaction.
The individual instructional groups for third grade (Manipulatives, Visual Cues, and
Comparison) did not show a significant improvement between the pre and post
assessment. There was no progress from the pre and post assessment that could be

101
attributed to the intervention the students received in their instructional group based on
the intervention F-ratio score.
In addition, a Cronbach’s alpha analysis was conducted to determine the amount of
internal consistency in the pre/post assessment instruments for grades three and four. As
a result, the grade three pre/post assessments yielded reasonable internal consistency
(reliability). However, the grade four pre/post assessments showed low internal
consistency (reliability), so it produced weak measurement of the interventions in the
present study. Because of the lack of reliability of the grade four pre/post assessment
instrument they were insufficiently sensitive to measure improvement.
The results of the fourth grade level’s mixed ANOVA yielded a non-significant
interaction (between time and instructional group). According to the findings there was
not a significant difference in growth among the instructional groups. None of the
instructional groups for fourth grade (Manipulatives, Visual Cues, and Comparison)
showed significant improvement between the pre and post assessment. Improvement
was greater in fourth grade than third grade; however, that amount of improvement
could well have happened had the students remained in the classroom without receiving
additional Manipulative or Visual cue instruction.
Six reasons may serve as explanation for the negative or inconclusive results for the
manipulative and visual cues instruction groups. First, the duration of the study was
limited to five weeks in the first semester of the school year. Had the study been
conducted over a full semester, or a longer time period, students may have maintained
the improvement shown at first as they became accustomed to the instructional

102
processes. This minimal improvement was not consistent throughout the five weeks of
the study and the trend lines on each instructional group were curvilinear.
In spite of the generally positive results in other studies, the present study’s results
are not uncommon; other inconsistencies were found in the extant research. As
Thompson (1992) points out, research results concerning concrete materials vary, even
among treatments that were closely controlled and monitored and that involved the same
concrete material. For example, even studies by Resnick and Omanson (1987) and by
Labinowicz (1985) showed little impact on children’s learning using base-ten blocks. In
contrast, both Hiebert and Werne (1992) reported positive results from using the same
manipulative. Other studies such as Sowell (1989) concluded that “when treatments
lasted a school year or longer, the result was significant: whereas, treatments of shorter
duration did not produce statistically significant results” (p.502).
The second reason for the inconclusive results of the present study may be because
of the particular mathematical skills that were chosen as a result of the pre-assessment.
The skills were taken from TAAS which is administered at the end of the school year.
Students may have had insufficient time to develop basic mathematics skills and
concepts that are required for the operation and problem solving skills selected for use
with the interventions in the present study. The international mathematics and science
studies found a strong correlation between the student’s opportunity to learn
mathematical concepts and skills and the student’s mathematical improvement (Husen,
1967, McKnight at al., 1987, Schmidt, McKnight, and Rizen, 1997). Furthermore,
according to the Texas Education Agency’s policy research report, the TAAS test was
moved from fall to spring in the 1992-93 school year primarily because insufficient time

103
was being allowed for students to develop problem solving and critical thinking skills.
Since the manipulative and visual cue interventions were used during the early part of
the school year, the improvement shown at the beginning of the five week study could
simply be an indication of students’ recovery from loss of retention over the summer
break and not as a result of the interventions themselves.
The third reason for the inconclusive results for the manipulative and visual cues
instruction groups may be the selection of available participants based on a mastery
percentage below a fifty-five on the pre –assessment. The operation and problem
solving domains in mathematics for TAAS are two of the most challenging and show a
low percentage passing for all students (TEA, 2000). Therefore, the skills selected for
the present study may have been too difficult for students to learn within the study’s five
week time frame. The mathematical operation and problem solving domains of TAAS
also involve multi-step processes to solve word problems. Despite receiving
manipulative and visual cue instruction, participants may have been poorly equipped to
solve more complex, multi-step problems. Extant research shows that it is important to
provide students the opportunity for problem solving, but opportunity alone has not been
found to relate significantly to student’s use of learned strategy. Therefore, if the strategy
is used in isolation, students may not adequately learn how to solve non-routine or
complex math problems (Waxman et al., 1998; Waxman and Knight, 1988) similar to
the problems used in this present study.
The fourth reason for the inconclusive results may have been that not enough time
was allotted for students to become acquainted with the manipulatives. When using
concrete and visual resources, the participants seemed to lose focus on the skill to be

104
learned and focus on the objects at hand. As a result the researcher allowed an
additional five minutes each instructional session for students to become familiar with
the materials that were to be used, and thus reduced the time on task during the lesson.
The original plan was a greater amount of time on task so that students could process
information effectively. The provision of sufficient amount of time as well as the
threading of mathematics throughout an instructional day rather than only at a brief daily
specified time plays a vital role in student learning. In addition to the focused time on a
mathematical skill, students should have an opportunity to discuss their mathematical
learning to make connections to other learning (Early Math Strategy, 2003). Carpenter,
Fennema, Penelope, Chiang, and Loef (1989) found that, when instruction focuses
strictly on problem solving skills, more time is needed to practice and consolidate skills,
balanced with time to put those skills to use in a problem-solving context. If children
memorize or simply mimic the teacher’s use of the mathematical procedures without
understanding, they find it difficult to go back later and build understanding (Resnick &
Omanson, 1987; Wearne & Hiebert, 1988).
The fifth reason for the negative results for the manipulatives and visual cues
instruction groups may have been to the lack of instrument (pre/post) reliability.
Carmines (1990) suggest that as a rule, a Cronbach’s Alpha value should be of at least
0.8 for widely used instruments such as the mathematical instruments used in the present
study. The Alpha for grade three was .799 and the Alpha for grade four was .711, grade
four yielded a lower reliability level than grade three. Because of the low reliability of
the grade level four pre/post instrument, instruments will produce a weak measurement
resulting in difficulty to measure improvement. The grade four tests were insufficiently

105
sensitive to measure improvement. An increase number of items on the tests
accompanied by greater internal consistency of all items would have ensured a higher
reliability. More time in piloting of math items would have been necessary to achieve
this. Had the duration of the study been extended or increased items in the pre/post, the
level of reliability would have increased. On the other hand, grade level three pre/post
assessments poses reasonable reliability, so should be reasonably sensitive to
improvement. Although it possesses reasonable reliability, the elimination of bad items
(items which had poor correlation with other items) would have increased reliability.
Although, this method is limiting because the fewer item usually means low reliability,
the pre/post assessments could have had a larger number of items, i.e. thirty or forty.
A final reason for the negative results for the manipulative and visual cues
instruction groups may be the limited amount of time of the small group instructions.
The lessons were developed for intervals of twenty-five minutes, four days a week; this
may have been too little time of periodic instruction to develop skills and vocabulary
needed to improve comprehension and skills application in such low achieving
mathematical learners. Sowell (1989) performed a meta-analysis of sixty studies to
examine the effectiveness of manipulatives used in mathematics over time. The
consensus of these studies indicated that manipulatives can be effective; however, the
long-term use of manipulatives was more effective than short-term use. In addition, Just
and Carpenter (1987) found that time spent practicing a task can become one of the most
important determinants of developing mathematical skills and greatly impacts the
student’s performance.

106
In summary, the most likely explanation for the small improvements in the
experimental groups was the limited duration of the present study which was conducted
in a pull -out setting. Five weeks was not sufficient time for students to develop the
higher level thinking skills necessary to solve multi-step problems. Thomas and Collier
(1997) found that, due to the lack of reinforcement in the regular classroom, skills and
learning strategies learned in the small pull-out group were instructionally limiting.
These higher level thinking skills for problem solving require repetitive opportunities of
application for students to have a basic understanding of the mathematical concepts.
Mathematics instruction for young children should be an integrated whole, rather than a
series of isolated or discrete learning opportunities. Connections between topics,
between mathematics and other subjects, and between mathematics and everyday life
should permeate children’s mathematical experiences (Clements et al., in press).
The present study’s results confirm those from previous studies which examined the
use of manipulatives and visual cues in mathematics instruction and indicated that they
are not successful unless used well (Carpenter, Fennema, Fusson, Hiebert, Human,
Murray, Oliver, & Wearne, 1994). The results obtained by the present study confirmed
findings in the literature that suggest that concrete materials alone are not sufficient to
guarantee success (Baroody, 1989; Fennema, 1972). Guidelines need to be established
on how manipulatives should be used; teachers need to be trained in best practices for
use of manipulatives. Sowell (1989) also suggested that improvement of mathematical
performance occurs when the teachers are knowledgeable in their use.
In the present study the interventions using manipulatives and visual cues were well
used but perhaps should have been extended. Although the interventions were used

107
appropriately to teach the selected mathematical skills, the instructional lesson did not
consistently incorporate activities that allowed students to use the manipulatives and
visual cues as a thinking tool that would enable them to reflect on the mathematical
concepts. As a result of the research study from the Early Math strategy report (2002),
the following three guidelines were found to be effective when selecting and using
manipulatives and visual cues and were used in the present study: 1) make certain that
the manipulative and visualization chosen support the selected mathematics concepts to
be taught, 2) have enough of the manipulatives and materials for visual cues so that all
students can become active participants in the activity and, 3) provide initial
opportunities for students to become familiar with the manipulatives and visual cues.
However, in the present study one important component was lacking, which was to
avoid activities within the lesson that simply allow children to copy the actions of the
teacher. Students may have been mimicking the teacher and memorizing the steps when
the teacher was modeling the use of manipulatives and visualization cues instead of
using the manipulatives and visual cues as thinking tools to enable them to process and
reflect on the mathematical concept to be learned (Early Math Strategy, 2003).
Even though the present study confirms some results of other studies, it differs in
three ways in terms of design: 1) inclusion of explicit vocabulary enrichment instruction
for English language learners (ELL), 2) the use of the TAAS (Texas Assessment of
Academic Skills) as a pre and post assessment instrument, and 3) the use of explicit
lesson plans that directly targeted the mathematical skills that posed a challenge to ELL
according to the pre-assessment results. Research shows that explicit vocabulary
instruction for ELL is beneficial since text comprehension is a critical step in the

108
problem solving process (Leplante, 1997). Ginsburg (1981) found that the vocabulary
children have for expressing math and number concepts differs widely. In the present
study, despite the attention given to the vocabulary in the word problems themselves, it
was not sufficient to enable students to grasp the mathematical concepts within the
problem solving process.
The use of TAAS as the assessment instrument was a positive design feature in the
present study. The mathematical domains included in the TAAS are specific and
designed to measure problem solving and critical thinking skills in the state curriculum
(TEA, 2002). Therefore, all assessment instruments used in the present study were
created from the content universe developed by TEA for the TAAS in mathematics,
grades three and four. The Texas Education Agency followed a rigorous process to
ensure reliability and developed a series of assessment instruments to measure student
achievement.
The present study also incorporated a third design feature: explicit scripted lesson
plans developed to directly target the mathematical skills that pose a challenge to ELL
according to the pre-assessment results. Although the intent of the present study was to
focus on the mathematical concepts in the pre-assessment with which students
demonstrated a weakness and to improve their performance on those concepts, it did not
allow students to interpret and apply personal experience to give meaning to the new
knowledge (Stein & Bovalino, 2001). Therefore, the manipulatives and visual cues were
not used as a thinking tool; rather they were utilized to recapitulate the steps and
processes that were modeled by the teacher.

109
The second question addressed by this study was about the rate of improvement by
the two experimental groups in the mathematical domains of operation and problem
solving, based on six progress monitoring probes.
A trend analysis was conducted independently for third and fourth grade to
determine growth over time. An individual raw slope coefficient was also conducted for
third and fourth to interpret the weekly rate of linear improvement across the six
mathematical probes. Results from the trend analysis showed a slight improvement of
items correct per week with an occasional decrease of mean scores. However, the
improvement trend lines lacked significance and deemed lack of reliability. The trend
line for the third grade experimental groups was not linear; it had much bounce from one
administration to the next. The overall improvement of the third grade groups’ raw
slope coefficients was small.
The results from the three experimental groups (Manipulative, Visual, and
Comparison) showed minimal improvement in mean scores. The graphs showed
curvilinear trends in all 4th grade instructional groups. According to the findings the
early administration of the probes demonstrates a linear trend to the initial adjacent
probes. However, results of the fourth grade level’s trend analysis yielded inconsistent
results. In time-series data, reliability of assessment instruments may be judged by how
much bounce there is from one time to the next. Sine there was much bounce; we may
be able to say that it yielded few significant trend lines, which lacked in the present
study. Results from the raw slope coefficient showed a range from slight increase to a
decrease for some of the participants, which indicate the trend to be insignificant the
same as zero, they are flat.

110
Overall the results for third and fourth grade showed similar trend lines and minimal
increases in mean scores. The progress from one week to another was inconsistent, due
to the low reliability of the assessment instruments used in the present study.
Discussion
Five reasons may serve as explanations for the inconsistent, minimal or nonexistent
improvement results that the trend analysis yielded for third and fourth grade growth
across the six weekly mathematical probes. First, four days a week of instruction may
have been insufficient time for students to learn new mathematical skills involving new
processes, manipulatives and visual cues. Four days of instruction was probably
insufficient opportunity to learn the application of manipulatives and visual cues prior to
the weekly assessments. This is particularly true when students are asked to solve
complex mathematical story problems. The Early Math Strategy (2003) found that in
order for mathematics instruction to be meaningful students must be allowed sufficient
time to practice integrated learning of manipulatives and visual cues to solve
mathematical word problems. The weekly assessments were given on the fifth day after
four days of instruction. The four mathematical objectives were taught sequentially with
a different objective taught daily. This fragmented instructional schedule may have
caused the minimal or non-existent growth across the six weekly probes. Greater growth
may have occurred had one week been devoted to each objective. Garafalo and Lester
(1985) explained that children’s knowledge can be expanded through multiple
opportunities to practice the instructional models given and although multiple
opportunities to practice were given; they were not given consecutively and devoted to a
single objective. Thus, the weekly grouping of all objectives rather than teaching each

111
objective for a full week may have not allowed students to recognize and apply the skills
consistently.
The second reason that may explain the inconsistent results from the third and fourth
grade participants over the six weekly probes is the time of the school year during which
the last three probes were administered. The last three probes were administered during
the Fall season celebrations. Students may have been distracted by celebrations that
were occurring in the classroom and unfocused during the lessons and furthermore
rushed, through the weekly assessment. In addition, research suggests that elementary
students use procedures, correctly or incorrectly, for the purpose of obtaining an answer
and not for the purpose of solving a problem (Baroody, 1985). Garafalo (1985)
discovered that once a student is aware of and confident in using what they consider to
be a good strategy such as the use of manipulative or visual cues presented in the present
study,, they are likely to use the strategy inappropriately and forego seeing if their final
answer makes sense. Thus, students in this study may have been distracted unfocused,
rushed and satisfied with simply finding an answer.
The third reason that may explain the inconsistent results and minimal improvement
is that the participants were also undergoing additional testing required by the school
district. Students may have become fatigued with the overwhelming amount of
assessments being administered. The complex mathematical problem solving tasks and
processes may have overwhelmed the participants and negatively impacted their
performance on the weekly assessment probes. Research suggests that in the early
grades testing may cause anxiety, therefore, hindering students’ natural instincts for
learning (Early Math Strategy, 2003).

112
The fourth reason that may explain the inconsistent results and minimal
improvement is the amount of reliability in the time series probes was judged by how
much bounce there was from one administration to another. There was much bounce in
the third and fourth grade as shown by the graphic representation, which yields
insignificant trend lines. However, lack of significance in trend lines can also be due to
slight or small slopes (nearly flat); therefore, additional information, was used to judge
significance of the measurement. The standard error of the slope was summarized by the
confidence bands placed around the trend lines. Also, the time series data were
calculated through a regression module which yields the standard error of the slope.
Thus the mini-probes were unreliable as shown by the large or wide error bands around
the slope. In the present study the standard error of the slope was large based on the
comparison to the slope coefficient. Hence, the standard error of about a third of the
slope coefficient or any larger standard error value which is close to the slope coefficient
is quite large: the time series measurement is considered to have low reliability.
The final reason that may explain the inconsistent results is the way language may
affect mathematics performance. Marked differences in English and Spanish fluency are
considered a contributor to Hispanic Americans’ performance and level of involvement
in mathematics (Valverde, 1984). The participants in this study fall under those
predicaments that are associated with ELL. Although the language of instruction was
taken into consideration in the present study it may not have been enough for students
with limited background knowledge to process and apply new mathematical concepts
and skills.

113
Morgan (1998) found that students possessing linguistic skills associated with the
advantage of having a literate background are more likely to display the appropriate
mathematical operations than those that are from less advantaged backgrounds.
Therefore, the participants in this study may have lacked high utility language related to
both mathematics and thinking to enable them to perform at consistent progressing
levels
Limitations of the Study
Four limitations associated with this experimental study. The first limitation was the
low mathematical skill and ability levels of the participants The participants did not
demonstrate the basic mathematical computation skills necessary to solve multi-step
story problems requiring higher level thinking and application abilities. Since the
participants selected for this study scored <55% overall on the pre-assessment, their
mathematical skills and ability may have been too low for the domains of operations and
problem solving and the learning and use of new processes. Students may have needed
more time to learn the process of effectively using manipulatives and visual cues to
solve mathematical word problem.
The second limitation may have been the five week duration of the present study. If
extended, the duration may have made a difference in the inconsistent and negative
results. Although the graphs of the trend analysis showed linear trend lines with the
initial administration of the mini-probes, the duration of the study was too short to
determine if sustained improvement would have occurred. Perhaps, if the study had
been conducted over a one year period like Sowell (1989) suggests, the results would

114
have been more consistent and students may have maintained the improvement shown at
the beginning.
The third limitation may have been the twenty-five minute four days a week
instructional small group sessions. The sessions may have been too short a period of
instruction for low achieving mathematical learners’ to develop skills and vocabulary
necessary to improve comprehension and skills application. Should the length of
instruction be extended to forty-five minutes a day four days a week, students would
have the opportunity to discuss and apply the new learning strategy with manipulatives
and visual cues.
The fourth limitation in the present study was the reliability of both pre/post
assessments and the multiple probes. A Cronbach’s alpha analysis was conducted to
determine the amount on internal consistency in the pre/post assessment instruments for
grades three and four. As a result, the grade four pre/post assessments showed low
internal consistency (reliability) and grade three pre/post assessments yielded reasonable
internal consistency (reliability). Therefore, had the duration of the study been extended
or more items in the pre/post the level of reliability would have increased. In addition,
an increase number of items on the tests accompanied by greater internal consistency of
all items would have ensured a higher reliability, which also meant more time to test
additional items.
Lack of reliability in the mini-probes was a potential reason for inconsistent results.
The amount of reliability in the time series probes was judged by how much bounce
there was from one administration to another. There was much bounce in the third and
fourth grade as shown by the graphic representation, which yields insignificant trend

115
lines. However, lack of significance in trend lines can also be due to slight or small
slopes (nearly flat); therefore, additional information, was used to judge significance of
the measurement. The mini-probes were unreliable as shown by the large or wide error
bands around the slope. In the present study the standard error of the slope was large
based on the comparison to the slope coefficient.
Implications for Future Research
Given the inconsistent or negative results obtained by this study, the question still
remains whether manipulative and visual cues improve the third and fourth grade
Hispanic English language learners’ mathematical skills. While effective instructional
strategies to improve mathematical skills for Hispanic ELL utilizing manipulative and
visual cues would certainly be an ideal goal to achieve, evidence from the present study
suggests that there is still much to learn about using such interventions. In fact earlier
studies concur that, regardless of the innate appeal of manipulatives and visual cues as
instructional strategies, their effectiveness may produce inconsistent and negative results
(Benarz & Janvier, 1998; Bughardt, 1992; Hiebert, Wearne, & Taber, 1991; Thompson,
J., 1992). In addition, manipulatives have been found to poses dubious value in
teaching computational skills especially for more complex problems (Kuchemann,
1981).
Mixed results from other studies suggest that manipulatives and visual cues can
improve mathematic achievement when they are used with activity based mathematics
learning (Suydam & Higgins, 1977). However, future research efforts would need to be
structured differently from the present study in order to address this study’s questions.

116
A recommended modification for future research is the way in which the
interventions in the present study were used. The manipulatives and visual cues
strategies needed to be used as a tool rather than a procedure. This would allow students
to create situations that enhance the use of manipulatives and visual cues to solve
complex word problems instead of replicating the procedure or process that is necessary
when answering mathematical questions that allow for alternative processes.
Another recommended modification for future research would be the selection of
participants. In the present study the participants scored below 55% overall in the pre-
assessment which indicated very low levels of basic mathematical skills. Friedman
(1978) found the effectiveness of manipulatives or visual cues in teaching children in
fourth grade or below to be of little or no benefit when teaching them computational
skills such as multiplication. Therefore, participants would need to be selected on the
bases of having a basic understanding of math facts and computational processes
necessary for multi-step mathematical problem solving that require higher level of
thinking skills. In addition to the pre-assessment scores to determine participation in the
present study, teacher input regarding instructional math level and attitudes about math
could also used in selecting participants.
Another recommended modification for future research is the design of the present
study. Although having a pre/post with time series design is one of the most effective to
obtain strong internal validity, the length of time and the intervals of assessment need to
be restructured. The duration of the study could be extended for ten weeks or longer.
The weekly assessments would also need to be extended for administration every two
weeks instead of every week. According to the analysis of regression conducted over

117
time with the weekly mini probes, two weeks would have been a better time frame for
students to apply what they have learned especially when new processes are to be
learned.
A further modification in the instructional component of the study would be to focus
on each learning objective independently rather than in groups. Thus, the students could
learn prerequisite skills before moving on to the next sequential objective. This would
also yield information through assessment as to which objectives were truly mastered.
A final recommended modification would be an extended daily instructional time
from twenty-five minutes four days a week to forty-five minutes with nine instructional
sessions before an assessment. This would have allowed students to interact and discuss
how manipulatives and visual cues helped them solve the problems. It would also
provide immediate feedback for the researcher to make observation on metacognitive
process which could have been addressed in the next session. Sowell (1989) found that
long-term use of manipulatives was more effective than short-term use.
Conclusion
The results from the present study confirmed findings in the literature suggesting that
concrete materials alone are not sufficient to guarantee success (Baroody, 1989). The
Manipulative, Visual Cue and Comparison groups did not show a significant
improvement between the pre- and post-assessment. Contrary to expectations and
predictions, this study’s manipulative and visual cue instruction had no significant
relation to skill improvement for the ELL. This study thus concurs with other research
which has shown that, regardless of the innate appeal of manipulatives, their

118
effectiveness may produce mixed results (Benarz & Janvier, 1998; Bughardt, 1992;
Hiebert, Wearne, & Taber, 1991; Thompson, J., 1992).
Two types of analysis were conducted in the present study: a mixed ANOVA to
measure pre-post improvement, and the regression analysis to measure improvement
over several probes. Furthermore, the reliability of the instruments used was not
consistent for both grade levels. The grade four pre/post assessments had low reliability,
so the interventions could not be accurately measured. Although the pre-post time series
design has strong internal validity it did not provide positive results for the experimental
interventions. The time series analyses concurred that the third grade instructional
groups improved slightly as seen in their mean scores. However, the improvement did
not occur from one week to another and the trend was not linear. The most likely
reasons for the limited improvement by the experimental groups were: the four days a
week of instruction may not have been sufficient time, the holiday time of the year when
the study was conducted; the low reliability of grade four pre/post, additional
mathematical testing that was being administered by the school district, and finally the
language barrier that students encountered.

119
REFERENCES
Abedi, J. & Lord, C. (2001). The language factor in mathematics tests. Applied
Measurement in Education, 14 (3), 219-234.
Abedi, J., Lord, C., & Hofstetter, C. (1998). Impact of selected background variable on
students’ NAEP math performance. Los Angeles: University of California Los
Angeles, Center for the Study of Evaluation/National Center for Research on
Evaluation, Standards, and Student Testing.
Abedi, J., Lord, C. & Plummer, J. (1995). Language background as a variable in NAEP
mathematics performance: NAEP TRP Task 3D: language background study.
Los Angeles: University of California Los Angeles, Center for the Study of
Evaluation/National Center for Research on Evaluation, Standards, and Student
Testing.
Aiken, L. R. (1971). Verbal factors and mathematics learning: A review of research.
Journal for Research in Mathematics Education, 2(4), 304-13.
Aiken, L. R. (1972). Language factors in learning mathematics. Review of Education
Research, 42, 359-85.
Ainsa, T. (1999). Success of using technology and manipulatives to introduce numerical
problem solving skills in monolingual/bilingual early childhood classrooms. The
Journal of Computers in Mathematics and Science Teaching, 18 (4), 361-369.
August, D., & Hakuta, K. (1997). Improving schooling for language-minority children:
A research agenda. Washington, DC: National Academy Press.

120
Baroody, A. J. (1989). Manipulatives don’t come with guarantees. Arithmetic Teacher,
37, 4-5.
Bell, M.S. & Bell, J.B. (1988). Assessing and enhancing the counting and numeration
capabilities and basic operation concepts of primary school children.
Unpublished manuscript, University of Chicago, IL.
Bernarz, N. & Janvier, B. (1988). A constructivist approach to numeration in primary
school: results of a three year intervention with the same group of children.
Educational Studies in Mathematics, 19, 299-331.
Bishop, A.J. (1983). Space and geometry. In R. Lesh & M. Landau (Eds.), Acquisition of
mathematics concepts and processes (pp.177-199). New York: Academic Press,
Inc.
Bodrova, E., & Leong, D. J. (1996). Tools of the mind: The Vygotskian approach to
early childhood education. Columbus, OH: Merrill. (ED 455 014)
Box, C. A., & Cochenour, J. (1995). Visual Literacy: What do prospective teachers need
to know? In imagery and visual literacy: Selected Readings from the Annual
Conference of the International Visual Literacy Association. Tempe, Arizona.
October 12-16.
Boyd, R. R. (2000). Attitudes of teachers of Spanish as a foreign language toward
teaching Spanish to Hispanic students in urban schools. Unpublished
dissertation. Chicago, IL.
Braden, R. A. (1994). Visual Verbal Relationships. In David M. Moore & Francis M.
Dwyer (Eds.), Visual Literacy: A Spectrum of Visual Learning. (p. 193 – 208).

121
Bresser, R. (2003). Helping English-language learners develop computational fluency.
Teaching Children Mathematics, 9 (6). 294-299.
Brooks, J. G., & Brooks, M. G. (1993). In search of understanding: The case for
constructivist classrooms. Alexandria, VA: Association for Supervision and
Curriculum Development.
Campbell, D. T., & Stanley, J. C. (1963). Experimental and quasi-experimental designs
for research. Chicago: Rand McNally.
Campbell, P. (1995). Redefining the girl problem in mathematics. In W. Secada and E.
Fennema (Eds.). New Directions for equity in mathematics education, ( p. 225-
241). New York: Cambridge University Press.
Canny, M.E. (1984). The relationship of manipulative materials to achievement in three
areas of fourth-grade mathematics: computation, concept development, and
problem solving. Dissertation Abstracts International 45A (775-76).
Carpenter, T.P., Ansell, E., Franke, M.L., Fennema, E.,& Weisbeck, L. (1993). Models
of problem-solving processes. Journal for Research in Mathematics Education,
24(5): 428-441.
Carpenter, T.P., Corbitt, M.K., Kepner, H.S., Linquist, M.M., & Reys, R.E. (1980).
Solving verbal problems: Results and implications from national assessment.
Arithmetic Teacher, 28(1) 8-12
Carpenter, T. P., Fennema, E., Fuson, K., Heibert, J., Human, P., Murray, H., Oliver, A.,
& Wearne, D. (1994). Teaching Mathematics with Understanding in the Primary
Grades. Unpublished paper presented at the annual meeting of the American
Educational Research Association, New Orleans, LA.

122
Carpenter, T.P. & Lehrer, R. (1999). Teaching and learning mathematics with
understanding. In. E. Fennema & T.A.Romberg (Eds.), Mathematics classrooms
that promote Understanding. (pp.19-32). New Jersey: Lawrence Erlbaum
Associates, Inc.
Carpenter, T.P., & Moser, J.M. (1984). The acquisition of addition and subtraction
concepts grades one through three. Journal of Research in Mathematics
Education, 15(3) 179-202.
Cawley, J., Parmar, R., Foley, T.E., Salmon, S., & Roy, S. (2001). Arithmetic
performance of students: Implications for standards and programming.
Exceptional Children 136-142.
Chamot, A.U., & O’Malley,.J.M. (1987). The cognitive academic language learning
approach: A bridge to mainstream. TESOL Quarterly, 21, 227-250.
Clark, J.A. (1991). Self-directed learning and clinical performance: A comparison of
traditionally taught and learning contract-taught nursing students (Doctoral
dissertation, University of Southern Mississippi, 1990). Dissertation Abstracts
International, 51(07), 2236A.
Clements, D. H., & Battista, M. T. (1990). Constructive learning and teaching. The
Arithmetic Teacher, 38, 34-35
Clements, D.H., & McMillan, S. (1996). Rethinking “concrete manipulatives”. Teaching
Children Mathematics, 2(5), 270-279.

123
Cocking, R. R., & Chipman, S. (1988). Conceptual issues related to mathematics
achievement of language minority children. In R.R. Cocking & J. P. Mestre
(Eds.), Linguistic and cultural influences on learning mathematics (pp. 17-46).
Hillside, NJ: Lawrence Erlbaum Associates, Inc.
Cramer, K.A., Post, T.R. & Del Mas, R.C. (2002). Initial fraction learning by fourth- and
fifth grade students: A comparison of the effects of using commercial curricula
with the effects of using the rational number. Journal for Research in
Mathematics Education, 33 (2), 111-144.
Cuevas, G. (1984). Mathematics learning in English as a second language. Journal for
Research in Mathematics Education, 15 (2), 134-144.
Cummins, D., D., Kintsch, W., Reusser, K., & Weimer, R. (1988). The role of
understanding in solving word problems. Cognitive Psychology, 20, 405 – 438.
Cummins, J. (1989). Empowering minority students. Sacramento: California Association
for Bilingual Education.
Cummins, J. (1984). A theoretical framework for relating language proficiency to
academic achievement among bilingual students. In C. Rivera (ED.), Language
proficiency and academic achievement (pp. 2 – 19). Avon, England:
Multicultural Matters LTD.
Davey, G. & Holliday, J. (1992). Van Hiele guidelines for geometry. The Australian
Mathematics Teacher, 48(2), 26-29.
Davis, R. B. (1984). Learning mathematics: The cognitive science approach to
mathematics education. Norwood, New Jersey: Ablex Publishing Co.

124
DeAvila, E., & Duncan, S. (1981). The language minority child: A psychological,
linguistic, and social analysis. In J.E. Alanis (Eds.). Georgetown University
Roundtable on Language and Linguistics. 1980: Current issues in bilingual
education. Washington, DC: Georgetown University Press.
Dienes, Z. P. (1960). Building Up Mathematics. London: Hutchinson Educational.
Dossey, J. A., Mullis, I. V. S., & Jones, C. O. (1993). Can students do mathematical
problem solving? Results from constructed-response questions in NAEP’s 1992
mathematics assessment. Washington, DC: National Center for Education
Statistics.
Driscoll, M. J. ( 1981). Research Within Reach: Elementary School Mathematics.
Reston, VA: National Council of Teachers of Mathematics & CEMREL, Inc.
Driscoll, M. J. (1984). What Research says. The Arithmetic Teacher, 31, 34-35
Edwards, L.D. (2003). Collaborative problem solving in mixed-language groups.
Teaching Children Mathematics, 9 (9), 534-538.
Fennema, E.H. (1972). Models and mathematics. The Arithmetic Teacher, 19, 635-640.
Fennema, E.H. (1973). Manipulative in the classroom. The Arithmetic Teacher, 20, 350-
352.
Fernandez, R., & Nielson, P. (1986). Bilingualism and Hispanic scholastic achievement:
Some baseline results. Social Science Research, 15, 43-70.
Follmer, R. (2001). Reading, mathematics, and problem-solving: The effects of direct
instruction in the development of fourth grade students' strategic reading and
problem-solving approaches to text-based, non-routine mathematics problems.
Dissertation Abstracts International - A, 62 (2), 510. (UMI No. AAT3003350)

125
Gagne, E. (1985). The cognitive psychology of school learning. Boston: Little Brown.
Gall, M. D., Borg, W. R., & Gall, J. P. (1996). Educational research: An introduction
(6th ed.). New York: Longman Publishers.
Garcia, E. (1991). The education of linguistically and culturally diverse students:
Effective instructional practices. (Educational Practice Report No.1). Santa
Cruz, CA and Washington, DC; National Center for Research on Cultural
Diversity and Second Language Learning.
Garcia, G. E. (1991). Factors influencing the English reading test performance of
Spanish-speaking Hispanic children. Reading Research Quarterly, 26, 371 –391.
Ginsburg, H. (1981). The clinical interview in psychological research on mathematical
thinking: Aims, rationales, techniques. For the Learning of Mathematics, 1(3), 4-
11.
Goins, K.B., (2002). Comparing the effects of visual and algebra tile manipulative
methods on student skill and understanding of polynomial multiplication.
Dissertation Abstracts International - A 62 (12), 4098. (UMI No. AAT3036200)
Goldsmith, L.T., & Schifter, D. (1993). [Characteristics of model for the development of
mathematics teaching]. Report and Papers in progress. Newton, MA: Center for
Learning, Teaching and Technology, Education Development Center.
Good, T.L., and Biddle, B.J. (1988). Research and the improvement of mathematics
instruction: The need for observational resources. In D.A. Grouws and T.J.
Cooney (Eds.), Perspectives on research on effective mathematics teaching. New
York: Longman.

126
Guri-Rozenblit, S. (1998). Impact of diagrams one recalling sequential elements in
expository texts. Reading Psychology: International Year Quarterly, 9 121-139.
Hakuta, K. (1990). Bilingualism and bilingual education. A research perspective. Focus
No 1. Washington, DC: National Clearinghouse for Bilingual Education.
Heinich, R., Molenda, M,. Russell, J. D., & Smaldino, S. E., ( 1996). Instructional
Media and Technologies for Learning. Englewood Cliffs, New Jersey: Prentice
Hall.
Hiebert, J. (1984). Children’s mathematical learning: The struggle to link form and
understanding. Elementary School Journal, 84(5):497-513.
Hiebert, J. (1988). A theory of developing competence with written mathematical
symbol. Educational Studies in Mathematics, 19: 333-355.
Hiebert, J., & Carpenter, T.P. (1992). Learning and teaching with understanding. In D
Grouws, (Ed). Handbook of Research on Mathematics Teaching and Learning.
New York: MacMillan Publishing Company (pp. 65-97)..
Hiebert, J., Wearne, D., & Taber, S. (1991). Fourth graders’ gradual construction of
decimal fractions during instruction using instruction using different physical
representations. Elementary School Journal, 91, 321-341.
Himmele, P. (2001). Math reform and English language learners. Dissertation Abstracts
International - A, 62 (2), 500. (UMI No. AAT3003474)
Hofstetter, C.H. (2003). Contextual and mathematics accommodation test effects for
English-language learners. Applied Measurement in Education, 16 (2), 159-189.
Johnston, R. C., & Viadro, D. (2000). Unmet promise: Raising minority achievement.
http://www.edweek.org/ew/ewstory.cfm?slug=27gapintro.h19

127
Jones, B., Palincsar, A., Ogle, D., and Carr, E. (1987). Strategic teaching and learning:
Cognitive instruction in the content areas. Arlington: Association for
Supervision and Curriculum Development.
Kaput, J. J. (1994). Technology and mathematics education. In Handbook of Research
on Mathematics Teaching and Learning. Douglas Grouws (Ed). (p. 515-555)
New York: MacMillan Publishing Company
Khristy, L . (1994). A naturalistic look at language factors in mathematics teaching
bilingual classroom. Proceedings of the Third National Research Symposium on
Limited English Proficient student issues. State department of Education:
OBEMBLA.
Knapp, M.S., and Shields, P.M. (1990). Reconceiving academic instruction for the
children of poverty. Phi Delta Kappan, 71, 753-758.
Lager, C.A. (2002). Language and mathematics: Improving algebra instruction for
English learners. Dissertation Abstracts International - A, 63 (11), 3887. (UMI
No. AAT3070085)
LaPlante, B. (1997). Teaching science to language minority students in elementary
classrooms. New York State Association for Bilingual Education Journal, 12, 62-
83.
Lave, J. (1988). Cognition in practice: Mind, mathematics and culture in everyday life.
Irvine, CA: University of California.
Lave, J. & Wenger, E. (1991). Situated learning: Legitimate peripheral participation.
Cambridge University Press

128
LeCelle-Peterson, M., & Rivera, C. (1994). Is it real for all kids? A framework for
equitable assessment policies for English language learners. Harvard
Educational Review, 64, 55-75.
Lehr, J.B., and Harris, H.W. (1988). At risk, low achieving students in the classroom.
Washington, D.C.: National Education Association.
Lepik, M. (1990). Algebraic word mathematics problems: Role of linguistic and
structural variables. Educational Studies , 21, 83-90.
Lesh, R., Post, T.,& Behr, M. (1987). Representations and translations among
representations in mathematics learning and problem-solving. In C. Janvier (Ed.),
Problems of representation in the teaching and learning of mathematics
(Chap.4). Hillsdale, NJ: Erlbaum.
Maher, C.A., Martino, A.N., & Davis, R.B. (1994). Children’s different ways of thinking
about fractions. Proceedings of Psychology of Mathematics Education XVIII.
Lisbon, Portugal.
Mayer, R. E., & Gallini, J. K. (1990). When is an illustration worth ten thousand words?
Journal of Educational Psychology, 82 (6) 715-726.
McCagg, E. C., & Dansereau, D. F. (1991). A convergent paradigm for examining
knowledge mapping as a learning strategy. Journal of Educational Research, 84
317-324.
Mestre, Jose P., (1981). Predicting academic achievement among bilingual Hispanic
college technical students. Educational and Psychological Measurement, Vol.
41, pp.1255-1264.

129
Mestre, P. (Eds.), (1988) Linguistic and cultural influences on learning mathematics (
pp. 221-240). Hillsdale, NJ: Lawrence Erlbaum Associates, Inc.
Miller, S. (1995). An American imperative. New Haven, CT: Yale University Press.
Morgan, C. (1998). Assessment of mathematical behavior: A social perspective. In P.
Gates (webmaster), First Mathematics Education and Society Conference
Proceedings. Retrieved Oct 29, 1999 from World Wide Web:
http://www.nottingham.ac.uk/csme/meas/papers/morgan.html
Moses, R. P. (2001). Radical equations: Math literacy and civil rights. Boston: Beacon
Press.
Moss, M. & Puma, M. (1995). Prospects: The congressionally mandated study of
educational growth and opportunity: Fiscal year report on language minority
and limited English proficient students. Washington, DC: U.S. Department of
Education.
National Assessment of Educational Progress (1992). NAEP 1992 mathematics report
card for the nation and the states. Washington, DC: National Center for
Educational Statistics report No 23-ST02.
National Commission on Mathematics and Science Teaching for the 21st Century,
(2000). Before it’s too late: A report to the nation. Washington DC. US
Department of Education.
National Council of Teachers of Mathematics. (1989). Curriculum and evaluation
standards for school mathematics.
National Council of Teachers of Mathematics. (2000). Professional standards for
teaching mathematics. Reston, VA: Author. ED

130
National Research Council, (1989). Everybody counts: A report to the nation on the
future of mathematics education. Washington, DC: National Research Council.
National Science Foundation, (2000). Science and engineering indicators 2000.
Washington DC: Author.
National Science Foundation, (1994). Women, minorities, and persons with disabilities
in science. Washington, DC: National Science Foundation, 94-333.
Nevo, B. (1985). Face validity revisited. Journal of Educational Measurement, 22, 287-
293.
Noonan, J. (1990). Readability problems presented by mathematics text. Early Child
Development and Care, 54, 57-81
Olkun, S. (2003). Comparing computer versus concrete manipulatives in learning 2D
Geometry. The Journal of Computers in Mathematics and Science Teaching, 22
(1), 43-56.
Peavler, C., DeValcourt, R., Montalto, B., Hopkins, B. (1987). The mathematics
Program: An overview and explanation. Focus on Learning Problems in
Mathematics, 9, 39-50.
Pelavin, S.H., & Kane, M.B. (1990). Minority Participation in Higher Education,
Washington, D.C.: Pelavin Associates.
Piaget, J. (1973). Child and reality. New York: Grossman.
Piskor, I. (1986). Categorization of some rally! A reading program skills based on
Cummins proficiency design (Book 4).

131
Ramirez Corpus Mather, J. & Chiodo, J. (1994). A mathematical problem: How do we
teach mathematics to ELL? The Journal of Education Issues of Language
Minority Students, 13, 1-12.
Rechin, K. (1994). Test gap widening between rich and poor. Lansing State Journal, 4,
9A.
Resnick, L.B., Lesgold, S.,& Bill, V. (1990). From protoquantities to number sense. A
paper prepared for the Psychology of Mathematics Education Conference,
Mexico City.
Reynolds, J. (1989). Syntactic control of interference, part II. in International
colloquium on automata, languages and programming.
Richardson, K. & Salkeld, L. (1995). Transforming mathematics curriculum. In Sue
Bredekamp & Teresa Rosegrant (Eds.), Reaching potentials: Transforming early
childhood curriculum and assessment (Vol.2, pp.23-42). Washington, DC:
National Association for the Education of Young Children. ED 391 598
Riley, M.S., Greeno, J.G. & Heller, J.I. (1983). Development of children’s problem-
solving ability in arithmetic. In H. Ginsburg (Ed.). The Development of
Mathematical Thinking, 153-196, New York: Academic Press.
Rothman, R.W., & Cohen, J. (1989). The language of math needs to be taught. Academic
Therapy, 25, 133-142.
Ruddell, M. R. (1997). Teaching content reading and writing. Boston, MA: Ally and
Bacon.

132
Russell, S. J. (1999). Mathematical reasoning in the elementary grades. In L. Stiff & F.
Curcio (eds.) Developing Mathematical Reasoning in Grades K-12: 1999
Yearbook (pp.1-12). NCTM: Reston, VA.
Saxe, G. B. (1988). The mathematics of child street vendors. 59, 415-425.
Saville-Troike, M. (1984). What really matters in second language learning for academic
achievement? TESOL Quarterly, 18 (2), 199-219.
Saville-Troike, M. (1988). Teaching and testing for academic achievement: Perspectives
on an ill structured domain. Unpublished Manuscript, University of Chicago, IL.
Schuhmann, A. (1992). Learning to teach Hispanic students. In M. Dilworth’s (Ed.)
Diversity in Teacher Education-New Expectations. New York: Josey Bass.
Schwartz, W. (1991). Teaching limited English proficient students to understand and use
mathematics. (Eric Document Reproduction Service No.ED 334 310)
Secada, W. (1983). The educational background of limited English Proficient students:
Implications for the arithmetic classroom. Washington, DC: Office of Bilingual
Education Minority Language Affairs. (ERIC Document Reproduction Service
No.ED 237 318).
Secada, W.G. (1989). Agenda setting, enlightened self-interest, and equity in
mathematics education. Peabody Journal of Education, 66 (2), 22-56.
Secada, W. O. & Carey, D.A. (1990). Teaching mathematics with understanding to
limited English proficient students. (Eric Document Reproduction Service No.
ED 322 284)
Seels, B.A. (994). Visual literacy: The definition problem. In D. M. Moor & F. M Dwyer
(Eds.). Visual literacy: A spectrum of visual learning 97-112.

133
Shepard, R. N., Cooper, L. A. (1982). Mental images and their transformations. MIT
Press/ Bradford Brooks, Cambridge, MA.
Short, D. J., & Spanos, G. (1989). Teaching mathematics to limited English proficient
students. ERIC Digest. Washington, DC: ERIC/CLL.
Shafer, P. (1998). Three ways to improve math scores. Principal (Reston, Va.), 78 (2),
24-46.
Silver, E.A. (1987). Foundation of cognitive theory and research for mathematics
problem-solving instruction. In A.H. Schoenfeld (Ed.), Cognitive science and
mathematics education (pp.33-60). Hillsdale, N.J.: Erlbaum.
Skemp, R. (1987). Psychology of learning mathematics. Hillsdale, NJ: Lawrence
Earlbaum Associates, Inc., Publishers.
Smith, P. L., & Ragan, T. J. (1992). Instructional Design. New York: Merrill MacMillan
Publishing Company.
Snyder, V. (1994). Effects of cooperative learning upon student ability to communicate
mathematically: an ethnographic study (Math manipulatives). Dissertation
Abstracts International - A, 55 (4), 856. (UMI No. AAT9424633)
Spanos, G., Rhodes, N. C., Dale, T. C., & Crandall, J. (1988). Effects of
manipulative materials in mathematics instruction. Journal for Research in
Mathematics Education, 20, 498-505.
Stanic, G.M. A.& Owens, D.T (1990). Spatial sense. Arithmetic Teacher, 37(6), 48-51.
Stanovich, K.E. (1986). Matthew effect in reading: Some consequences of individual
differences in the acquisition of literacy. Reading Research Quarterly.

134
Stoloff, D.L. (1989). Limited English proficient students and mathematics achievement:
strategies for success practiced within California Academic Partnership
Program Projects. (Eric Document Reproduction Service No. ED 310923).
Sugiyama, Y. (1987). Comparison of word problems in textbooks between Japan and the
U. S. In J.P. Becker & T. Miwa (Eds.), Proceedings of U.S. – Japan Seminar on
Problem Solving. Carbondale, IL: Board of Trustees, Southern University.
Suydam, M., & Higgins, J. (1977). Activity-based learning in elementary school
mathematics: Recommendations from research. Columbus, OH: ERIC Clearinghouse for
Science, Mathematics, and Environmental Education. (ERIC Document Reproduction
Service No. ED 44 840)
Suydam, M.N. (1984). Research report: Manipulative materials. The Arithmetic Teacher,
31(5):27.
Suydam, M.N. (1986). Research report: Manipulative materials and achievement.
Arithmetic Teacher, 33(6):10.
Terry, M.K., (1996). An investigation of differences in cognition when utilizing math
manipulatives and math manipulative software. Dissertation Abstracts
International, 56 (7), 2650. (UMI No. AAT9536433)
Texas Education Agency (2002a, August). Comprehensive Annual report on Texas
public schools. A report to the 78th Texas Legislature.
Texas Education Agency (TEA) (2002b, August). Secondary school completion and
dropouts in Texas public schools. 2000-2001. Document No. GEO2 601 05.
Austin, TX.

135
Tharp, R. G., (1989). Psychocultural variables and constants: Effects on teaching and
learning in schools. American Psychologist, 44, (2) 1-11.
Thompson, J. (1992). Estimation and number sense. In D.A. Grouws, (Ed.), Handbook
of Research on Mathematics Teaching and Learning, (pp. 371 – 387). New York:
Macmillan Publishing Company.
Thompson, P. (1992). Notations, conventions nd constraitns: contributions to effective
uses of concrete materials in elementary mathematics. Journal for Research in
Mathematics Education, 23(3), 123-147.
Tufte, E. (1983). The visual display of quantitative information. Cheshire, CT: Graphics
Press.U.S. Department of Commerce, U.S. Census Bureau, Current Population
Survey (CPS), October 2000.
Valverde, L. A. (1984). Underachievement and under representation of Hispanics in
mathematics and mathematics related to careers. Journal for Research in
Mathematical Education, 15 (16) 123-133.
Waxman, H.C., Padron, Y.N., & Knight, S.L. (1991). Risks associated with students’
limited cognitive mastery. In M.C. Wang, M.C. Reynolds, & H.J. Walberg
(Eds.), Handbook of special education: Research and Practice. New York:
Pergamon.
West, C., Farmer, J., & Wolf, P. (1991). Instructional design: Implications from
cognitive science. Englewood Cliffs, New Jersey: Prentice Hall.
Wiggins, G., & McTighe, J. (1998). Understanding by Design. Alexandria, VA:
Association for Supervision and Curriculum Development.

136
Winograd, K., & Higgins, K. M. (194-95). Writing, reading and talking mathematics:
One interdisciplinary possibility. The Reading Teacher, 48(4), 310 –318.
Zehler, A.M., Hopstock, P. J., Fleishman, H.L., & Greniuk, C. (1994) . An examination
of assessment of limited English proficient students. Arlington, VA:
Development Associates, Special Issues Analysis Center.

137
APPENDICES

138
APPENDIX A
3rd Grade Post Assessment Form A Spanish
1. Observa la figura. ¿Cuantas caras tiene la figura? 2. Margie y 4 amigas se repartieron en partes iguales 30 conchas que tenían.
Exactamente, ¿cuantas conchas le tocaron a cada una? 3. Observa el dibujo del prisma triangulo. ¿Cuantas aristas tiene el prisma
triangulo? 4. Lori tenía 16 monedas. Las dividió en 4 grupos iguales. ¿Cuántas monedas había
en cada grupo? 5. Aproximadamente, ¿Qué hora muestra el reloj?

139
6. Peggy vendió 26 boletos para la obra de teatro de la escuela. Raymond vendio72 boletos. ¿Cuál es la mejor estimación de cuantos boletos mas vendió Raymond que Peggy?
7. ¿Qué punto en la recta numérica representa al 33? 8. Miguel entrega 125 cada día de lunes a sábado. Los domingos entrega 286
periódicos. ¿Cuál es la mejor estimación de cuantos periódicos mas entrega Miguel el domingo que cualquier otro día de la semana?
9. El lunes Julia puso 25 centavos en su alcancía. Al día siguiente puso 36 centavos
en su alcancía. ¿Cuánto dinero puso en su alcancía esos 2 días?

140
10. Martín tiene una colección de 332 monedas. Tiene 183 de las monedas en una lata y 60 de las monedas en una taza. El resto de las monedas están en una alcancía. ¿Cuántas monedas hay en la alcancía?
11. En un cine se vendieron 204 boletos para la primera función de una película, 38
boletos para la segunda función, y 191 boletos para la tercera. ¿Cuál fue el número total de los boletos que se vendieron?
12. Josué tenía 5 globos. Compro 3 globos más. Después se le fue 1 globo. ¿Cuántos
globos tiene Josué ahora? 13. Francisco tiene 376 monedas en una caja. Tomo 197 monedas y las gasto.
¿Cuántas monedas le quedaron a Francisco en la caja?

141
14. El anuncio muestra los precios de la comida en un juego de béisbol. ¿Cuánto costarían un hot dog y unas papas fritas? 15. 42 - 20 16. El grupo de niñas exploradoras de Betty se preparo para hacer una excursión. El
grupo tenia12 sándwiches para compartirlos en partes iguales entre las 6 niñas exploradoras. ¿Cuál oración numérica se puede usar para saber cuantos sándwiches le dieron a cada niña exploradora?

142
17. Se doblo un papel en 2 partes. José dibujo 4 estrellas en cada parte. Has un dibujo que muestra cuantas estrellas dibujo José.
18. Al comprar tomates, Janet los puso en 5 bolsas de plástico. La menor cantidad de
tomates en una bolsa era de 8, y la mayor cantidad de tomates en una bolsa era de 11. ¿Cuál es un numero total razonable de tomates que compro Janet?
19. Elise tiene 7 páginas con calcomanías. Hay 12 calcomanías en cada página.
¿Qué es el número total de calcomanías en estas páginas? 20. Alfredo necesita pagar 54 centavos por un juguete. Tiene 2 monedas de 25
centavos y 2 monedas de 10 centavos. ¿Cuál grupo de monedas seria suficiente para pagar el juguete?

143
APPENDIX B
3rd Grade Post Assessment Form B English
1. Draw a figure that has more than 4 sides? 2. Ms. Donovan put 24 sticks of gum on her desk to use as prizes for the class
spelling bee.
If there were 6 sticks of gum in every package, how many packages did Ms. Donovan need in order to get 24 sticks of gum?
3. Which point on the number line represents 46? Mark your answer. 4. Letty and 3 friends shared 24 jelly beans. Letty put an equal number of jelly
beans into 4 cups. What was the total number of jelly beans in each cup? 5. Which time is shown on the clock?

144
6. Kati saved $87 for a new bicycle. This amount was $25 more than her brother Joseph had saved. What is the best estimate of the amount of money that Joseph had saved?
7. Mrs. McCallen has a flower garden shaped like a rectangle. What is the perimeter of the flower garden? 8. Devin counted the number of cars in 2 parking lots at a grocery store. The front
parking lot had 96 cars. The side parking lot had 44 cars. What is the best estimate of how many more cars were in the front parking lot than were in the side parking lot?

145
9. Felix put 17 cans of soda in an ice chest. Jenny put 14 boxes of juice in the same ice chest. How many cans and boxes of drinks did Felix and Jenny put in the ice chest?
10. The drawing shows the path that Paul takes when he walks from his house to
Larry’s Grocery Store. How many blocks in all will Paul walk if he walks from his house to Larry’s Grocery Store and then back to his house using the same path?
11. Oscar has 3 photograph albums with family pictures in them. The first album has
115 pictures, the second has 201 pictures, and the third has 86 pictures. What is the total number of pictures that Oscar has in the 3 albums?
12. Beverly had a roll of ribbon that was 400 feet long and another roll of ribbon that
was 136 feet long. She used 25 feet of ribbon to decorate some packages. How much ribbon did she have left on the 2 rolls then?

146
13. On Monday 174 customers came into Corbin’s Hardware Store. On Tuesday 158 customers came into the store. What is the difference in the number of customers on these 2 days?
14. Mrs. Riker picked apples from the 4 apple trees in her backyard. She put all the
apples in 4 baskets, with 24 apples in each basket. What was the total number of apples Mrs. Riker picked?
15. A library has 54 videotapes that can be checked out. On Monday the librarian
counted 18 videotapes still on the shelf. How many videotapes were checked out from the library?

147
16. Mrs. Harris raises 6 kinds of vegetables in her garden. She has 4 rows of bean plants with 8 plants in each row. What number sentence shows the total number of bean plants in Mrs. Harris’s garden?
17. Ms. Garret’s picture album has 4 empty pages. Each page has room for 9
pictures. How many pictures can Ms. Garret place on these 4 pages? 18. Stewart Elementary School has 5 third grade classes. The greatest number of
students in a class is 21. The least number of students in a class is 15. Which could be the total number of students in the 5 third-grade classes?
19. Jackie bought 7 packages of doughnuts. Each package had 5 doughnuts. How
many doughnuts did Jackie buy it all? 20. Marco weighs 77 pounds. His father weighs about 125 pounds more than Marco
weighs. Which could be the number of pounds that Marco’s father weighs?

148
APPENDIX C
4th Grade Post Assessment Form A-1
1. Look at the shape. How many faces does a rectangular prism have? 2. Danny made 82 popcorn balls for a bake sale. He put the popcorn balls into
plastic bags to take to the sale. He put 4 popcorn balls into each bag. How many bags did Danny need for all his popcorn?
3. Which angle in the figure best represents a right angle?

149
4. A bus station has 6 rows of seats in the waiting area. Each row has the same number of seats. If there are 48 seats altogether, how many seats are in each row?
5. Mr. Parcos plans to build a pen for his cats. The rectangular pen will be 43 feet
long and 23 feet wide. What will be the perimeter of the cat pen ? 6. The largest fish in a zoo’s aquarium weighs 227 pounds. The smallest fish
weighs 113 pounds. Which is the best estimate of the difference in their weights?

150
7. Which is the best estimate of the area of the polygon drawn on the grid? 8. A boat traveled a distance of about 26 miles each hour for 4 hours. Which is the
best estimate of the total distance the boat traveled? 9. 0.8 + 0.5=

151
10. Martin played 5 games of tennis. Each game lasted the same amount of time. If all 5 games lasted a total of 1 hour and 10 minutes, how long was each game?
11. 1.28 + 0.52 = 12. Maria has a 35 page coin book. There are 20 dimes on each page. Each row on a
page has 5 dimes. How many rows are on each page? 13. 1.70 + 0.35 =

152
14. Fanny sold 61 candy bars for her soccer team. Mark sold 2 times as many candy bars as Fanny. Which number sentence could be used to find the number of candy bars that Mark sold?
15. 1.0 – 0.2 = 16. A store clerk sold 18 sets of school uniforms on Saturday. Each uniform cost
$25. Which number sentence can be used to find the total cost of the school uniforms?
17. 227 x 42

153
18. Fred runs between 6 and 10 kilometers each day that he runs. Last month Fred ran 18 days. Which could be the total number of kilometers Fred ran last month?
19. A bus has 15 rows of passenger seats. There are 5 seats in each row. How many
passenger seats are on the bus? 20. Betty added 113 and 149 on her calculator. Which is a reasonable total?

154
APPENDIX D
4th Grade Post Assessment A-1 Spanish
1. ¿Cuantas caras tiene un prisma rectangular? 2. Daniel hizo 82 bolsas de palomitas de maíz para una fiesta de la escuela. Puso
las bolsas en cajas. En cada caja puso 4 bolsas de palomitas. ¿Cuantas cajas necesita Daniel para todas las bolsas de palomitas de maíz?
3. ¿Cual ángulo de la figura representa mejor un ángulo recto? 4. Una estación de autobuses tiene 6 filas de asientos en la sala de espera. Cada fila
tiene el mismo número de asientos. Si hay 48 asientos en total, ¿cuantos asientos hay en cada fila?

155
5. El señor Parcos piensa construir un corral para sus gatos. El corral rectángulo medirá 43 pies de largo y 23 pies de ancho. ¿Cual será el perímetro del corral para los gatos?
6. El pez mas grande en el acuario de un zoológico pesa 227 libras. El pez mas
pequeño pesa 113 libras. ¿Cual es la mejor estimación de la diferencia entre sus pesos?
7. Cual es la mejor estimación del área del polígono dibujado en la cuadricula? 8. Un barco navego por 4 horas una distancia de aproximadamente 26 millas cada
hora. Cual es la mejor estimación de la distancia total que el barco navego?

156
9. 0.8 + 0.5= 10. Martín jugo 5 juegos de tenis. Cada juego duro la misma cantidad de tiempo. Si
los 5 juegos duraron un total de 1 hora y 10 minutos, ¿Cuanto duro cada juego? 11. 1.28 + 0.52 = 12. Maria tiene una colección de monedadas en un álbum de 35 páginas. Hay 20
monedas en cada página. En todas las páginas cada fila tiene 5 monedas. ¿Cuantas filas hay en cada página?
13. 1.70 + 0.35 =

157
14. Fanny vendió 61 chocolates para su equipo de fútbol. Mark vendió 2 veces más chocolates que Fanny. Que oración numérica podría usarse para encontrar el numero de chocolates que vendió Mark?
15. 1.0 – 0.2 = 16. El empleado de una tienda vendió 18 uniformes escolares el sábado. Cada
uniforme costo $35. ¿Cual oración numérica se puede usar para encontrar el costo total de los uniformes escolares?
17. 227 x 42

158
18. Cada día que Gustavo hace ejercicio, corre entre 6 y 10 kilómetros. El mes pasado Gustavo corrió 18 días. ¿Cual podría ser el total de kilómetros que Gustavo corrió el mes pasado?
19. Un autobús tiene 15 filas de asientos para pasajeros. Hay 5 asientos en cada fila.
¿Cuantos asientos para pasajeros hay en el autobús? 20. Beatriz sumo 113 y 149 en su calculadora. ¿Cual es un total razonable?

159
APPENDIX E
Sample Mini-Probe
3rd Grade English
1. Doreen bought 8 small boxes of crayons. Each box had 8 crayons. What was the
total number of crayons that Doreen bought? Write your answer. 2. Mr. Ferguson planted 8 rose bushes he put an equal number on each of the 2 sides
of his patio. Draw a picture that shows how he divided the rose bushes. 3. A spelling book contains 88 pages. A Math book contains 203 pages. What is the
best estimate of how many fewer pages the spelling book has than the Math book? Write your answer.
4. Mr. Meyer had 131 model dinosaur figures. He gave 35 of the figures to the
students in his class. Then he bought 18 more figures. How many dinosaur figures did he have then? Write your answer.
5. Ray has his baseball cards lined up on the desk. He has 8 rows of cards, with 8
cards in each row. How many cards are on the desk? Write your answer.

160
6. Rosalie planted 21 pumpkin seeds in 3 rows. If she planted the same number of seeds in each row, what was the total number of seeds that she planted in a row?
7. Mr. Grant had a roll of electrical wire that was 350 centimeters long. He used 78 centimeters to fix a lamp. Then he used 145 centimeters to place a new light switch near his desk. What was the length of wire that Mr. Grant had left on the roll? 8. The drawing shows a path that Robert takes when he walks from his house to Mario’s Grocery Store. How many blocks in all will Robert walk if he walks from his house to Mario’s Grocery Store and then back to his house using the same path? Robert’s
House 3 Blocks
2 Blocks Mario’s Grocery Store
3 Blocks
9. Carlos sorted his collection of pennies into stacks of 5 pennies each. He had a total of 37 stacks of pennies. How many pennies did Carlos have in collection? Write your answer.

161
10. Mr. Gonzales had 16 diskettes for his students to use. He put the same number of diskettes at each of the 4 computers in his class. How many diskettes did he put at each computer?
11. The highest point in Caldwell County is 705 feet above sea level. The lowest point is 388 feet above sea level. Which is the best estimate of the difference between the highest point and the lowest point? Write your answer.
12. Carmen had 6 balloons she bought 4 more balloons. Then two balloons flew away. How many balloons did Carmen have left? Write your answer.

162
APPENDIX F Sample Mini-Probe
4th Grade Spanish
1. Un edificio de oficinas tiene 32 pisos. En cada piso hay 18 oficinas. ¿Cual es el
total de oficinas en el edificio? 2. Hay 54 estudiantes en el coro. El maestro quiere organizar el coro de tal forma que
haya 9 estudiantes en cada fila. ¿Cuantas filas de estudiantes habría? 3. El Sr. Martínez compro 45 racimos de plátanos para su tienda. Cada racimo tenia
aproximadamente 6 plátanos. ¿Cual es la mayor estimación del número total de plátanos que el Sr. Martínez compro?
4. El Sr. López gano $15 por hacer 1 corte de pelo. Hizo 21 cortes de pelo cada
semana durante las 3 últimas semanas. ¿Cuanto fue el total de dinero que gano durante las 3 semanas?
5. Un grupo de ladrillos esta ordenado en 24 niveles. Cada nivel tiene 56 ladrillos.
¿Que es el numero total de ladrillos en el grupo?

163
6. El Sr. Jones separo a 84 estudiantes de cuarto grado en 6 grupos. Cada grupo tenía la misma cantidad de estudiantes. ¿Cual fue la cantidad de estudiantes en cada grupo?
7. Un grupo de 68 estudiantes visito un museo. La escuela pago $4 por cada boleto de
estudiante. ¿Que es la mejor estimación del dinero que la escuela pago en total para que los 68 estudiantes entraran al museo?
8. Kevin tiene una colección de monedas en un álbum de 20 páginas. Hay 30 monedas
en cada página. En todas las páginas cada fila tiene 6 monedas. ¿Cuantas filas hay en cada página?
9. Julieta y su mama usaron 84 centímetros de listón para hacer 1 adorno para el
cabello. Si hicieron 15 adornos, ¿Cuantos centímetros de listón usaron en total? 10. Lorenzo tiene 18 carros en su colección de carros de juguetes. Tiene los carros en
exhibición en 3 estantes. Cada estante tiene el mismo número de carros. ¿Cuantos carros hay en 1 estante?

164
11. Abigail tenía $240 en su cuenta de ahorros. Saco $45 para gastar en un viaje al parque de diversión. Después saco $23 para pagar por algunos lentes. ¿Cuanto dinero le quedo en su cuenta de ahorros?
12. El Sr. Gómez compr0 250 sobres para enviar unas cartas de su negocio. Uso 127
sobres en marzo y 92 sobres en abril. En mayo compro 125 sobres más. ¿Cuantos sobres tenia al final?

165
APPENDIX G Sample Lesson Plans
3rd Grade Manipulatives Group
MONDAY October 21, 2002
(1) Math/OBJ 8: TSW use the operation of multiplication to solve problems. (2) Group Activity: TSW take their counters and count to see how many they each have, the symbol X will be introduced as one side meaning “group” and the other meaning “of” to complete the X(times). Teacher will model two different examples. (3) Materials: colorful counters (15 each) (4) Practice Activity: TSW make “groups” “of” 2’s,3’s,4’s and 5’s with a partner
TUESDAY October 22, 2002
(1) Math/OBJ 9: TSW use the operation of division to solve problems (2) Group Activity: TSW will divide evenly into groups using their beans and counters. Teacher will model by using a story, “If I had only 21 beans, and I had 7 friends, I want to divide evenly among them: How many would each one receive… (3) Materials: Beans and counters (4) Practice Activity: TSW practice with a partner using their beans and colored counters.
WEDNESDAY October 23, 2002
(1) Math/OBJ 10: TSW estimate solutions to a problem situation. (2) Group Activity: Teacher will introduce fat belly 5 and model example by using counters and sentence strips and markers to draw hills. Teacher will tell the story and students will follow. (3) Materials: sentence strips, counters, mall number cards to place accordingly. Separate number from 1 through 20, and markers (4) Practice Activity: Students will practice independently and with a partner making their own scenarios.
THURSDAY October 24, 2002
(1) Math/OBJ 11: STW determine solution strategies and will analyze or solve problems. (2) Group Activities: Students will act out the operation of addition and subtraction. Teacher will say: “take something a way from a group” and combine 2 or more groups of things together what happens to the number of things bigger or smaller… (3) Materials: counters, students themselves (4) Practice Activity: Students will act out with a partner and in a group.
FRIDAY October 25, 2002
Group Activity: TSW will take the weekly assessment.

166
APPENDIX H
Sample Lesson Plans
4th Grade Visuals Cues and Drawing Group
MONDAY
October 21, 2002
(1) Math/OBJ 8: TSW use the operation of multiplication to solve problems (2) Group Activities: TSW color the different times tables on a times table chart and skip count starting with the ones and twos together (3) Materials: Times table chart and pencil colors (4) Practice Activity: TSW completely color the times table chart a different color for every #
TUESDAY October 22, 2002
(1) Math/OBJ 9: TSW use the operation of division to solve problems (2) Group Activities: TSW color 16 squares on a grid sheet blue three times leaving room between each row of 16. The teacher will demonstrate on the overhead then color every two squares about the first row to demonstrate that there are 8 groups of two in the number 16. and continue with the 4 and the 8 (3) Materials: Overhead; markers and grid sheets and pencil colors (4) Practice Activity: TSW color 36 squares red in a row and color every four above the 36 a different color to determine how many fours are in 36.
WEDNESDAY October 23,2002
(1) Math/OBJ 10: TSW estimate solutions to a problem situation (2) Group Activities: TSW see and copy the number line on the board. The teacher will inform the students that if a number is a number in the ones place that is less than 5 it will roll back and if it is 5 or more it will spring forward in estimation. (3) Materials: manila paper: colors, pencil overhead, die and post it notes (4) Practice Activity: TSW write a number on a post it note that comes from tossing the die
THURSDAY October 24,2002
(1) Math/OBJ 11: TSW determine solution strategies and will analyze or solve problems (2) Group Activities: TSW read a story problem together with the teacher about shopping and saving. The teacher will draw a visual representation of the loss and gain of money. (3) Materials: manila paper; pencil & overhead (4) Practice Activity: TSW create their own shopping and saving problem that involves subtraction and addition.
FRIDAY October 25,2002
(1) Math/OBJ 8,9,10,11: (2) Group Activities: TSW take the mini-assessment (3) Materials: Mini-Assessments (4) Practice Activity: None

167
APPENDIX I
Sample Schedule
3rd Grade
Monday October 21, 2002
Tuesday October 22, 2002
Wednesday October 23, 2002
Thursday October 24, 2002
Friday October 25, 2002
Time of Pullout: 20 to 25 min.
Time of Pullout: 20 to 25 minutes
Time of Pullout: 20 to 25 minutes
Time of Pullout: 20 to 25 minutes
Assessment 30 minutes
Objective : 8 Objective : 9 Objective : 10 Objective : 11 12 Questions Group I: Students 1.Crystal N. Miranda 2.Yesenia Aguilar 3.Jeannette Robles 4.Isamar Najar Begin Time: ___ End Time: ____ Absences:
Group I: Students 1.Crystal N. Miranda 2.Yesenia Aguilar 3.Jeannette Robles 4.Isamar Najar Begin Time: End Time: Absences:
Group I: Students 1.Crystal N. Miranda 2.Yesenia Aguilar 3.Jeannette Robles 4.Isamar Najar Begin Time: _____End Time: Absences:
Group I: Students 1.Crystal N. Miranda 2.Yesenia Aguilar 3.Jeannette Robles 4.Isamar Najar Begin Time: ___ End Time: Absences:
Students Taking 1.Crystal N.Miranda 2.Yesenia Aguilar 3.Jeannette obles 4.Isamar Najar 5.Crystal Y. Contreras 6.Lazaro Estrada 7.Laura Reyes 8.Jesus A. Sanchez
Group II: Students Names of Student: 1.Crystal Y. Contreras 2.Lazaro Estrada 3.Laura Reyes 4.Jesus A. Sanchez Begin Time: ______ End Time: Absences:
Group II: Students Names of Student: 1.Crystal Y. Contreras 2.Lazaro Estrada 3.Laura Reyes 4.Jesus A. Sanchez Begin Time: ______ End Time: Absences:
Group II: Students Names of Student: 1.Crystal Y. Contreras 2.Lazaro Estrada 3.Laura Reyes 4.Jesus A. Sanchez Begin Time: ______ End Time: Absences:
Group II: Students Names of Student: 1.Crystal Y. Contreras 2.Lazaro Estrada 3.Laura Reyes 4.Jesus A. Sanchez Begin Time: ______ End Time: Absences:
Group II: Students 9.Argenis Garcia 10.Jasmin Espinoza 11.Lauricela Estrada 12. Jessica De Loera Absences:
Type of Instruction for Group I: Manipulatives Type of Instruction for Group II: Drawings & Visuals Type of Instruction for Group III: None, teacher instruction

168
APPENDIX J
ATTENDANCE ROSTER
Homeroom Teacher: __Bautista___ School Year: ____2002-2003____
Grade: Third Number of Students: 20
Week Number: ___One___ Campus: Holleman Elementary
Student Name
Level of English
10/21 10/22 10/23 10/24 10/25 Total
1. Yesenia Aguilar LES 2. Benita Armendariz FES 3. Crystal Y. Contreras NES 4. Jessica De Loera NES 5. Jasmin Espinoza FES 6. Lauricela Estrada LES 7. Lazaro Estrada Jr. LES 8. Vanessa J. Fabela FES 9. Argenis Garcia NES 10. Sonia Y. Garcia LES 11. Melisa S. Lozano LES 12. Oscar A. Martinez FES 13. Crystal N. Miranda FES 14. Isamar Najar LES 15. Manuel D. Ramirez FES 16. Laura Reyes FES 17. Jeanette Robles LES 18. Jovani Ruiz LES 19. Jesus Sanchez LES 20. Jay Taboada LES 21. 22. 23.
• NES: Non-English Speaker, LES: Limited English Speaker, FES: Fluent English Speaker
169
VITA
Edith Posadas Garcia 2311 Millerton Lane
Katy, TX 77450
Experience Highlights Waller Independent School District, Waller, Texas (1998-present) Director, Special Populations Bilingual/ESL/Migrant/Title Programs
Region IV ESC (1998-present) Consultant, Instructor, and Trainer Region VI ESC (1998-2000) Consultant and Trainer Spring Branch Independent School District, Houston, Texas (May 1998 – Nov 1998)
Personnel Administrator Brazosport Independent School District (1999-present) Consultant and Trainer
Spring Branch Independent School District, Houston, Texas (Jan. 1995 – May 1998) Teacher
Weslaco Independent School District, Weslaco, Texas (Aug. 1993 – Dec. 1994) Bilingual Teacher
Weslaco Police Department, Weslaco, Texas (May, 1993 – Dec. 1994) Reserve Police Officer
Education and Credentials Aug. 2000 Texas A&M University College Station, Texas Ph.D. Educational Psychology/Superintendent Aug. 1997 Prairie View A&M University Prairie View, Texas M.S., Education, Minor: Administration May 1993 University of Texas-Pan American Edinburg, Texas B.S., Education Certifications
Jul. 1998 Mid-Management Certification Prairie View A&M
May 1993 Bilingual Certification University of Texas
Related Documents