Using machine learning to identify top predictors for nurses’ willingness to report medication errors Renjie Hu a, * , Amany Farag b , Kaj-Mikael Bj€ ork c, d , Amaury Lendasse c, e a Department of Industrial and Systems Engineering, The University of Iowa, Iowa City, USA b College of Nursing, The University of Iowa, Iowa City, USA c Arcada University of Applied Sciences, Helsinki, Finland d Hanken School of Economics, Helsinki, Finland e Department of Information and Logistics Technology, College of Technology, University of Houston, Houston, USA ARTICLE INFO Keywords: Variable selection Data visualization Dimensionality reduction Extreme learning machines Self-organizing maps Medication error reporting ABSTRACT This paper presents a novel methodology to analyze nurses’ willingness to report medication errors. Parallel Extreme Learning Machines were applied to identify the top interpersonal and organizational predictors and Self- Organizing Maps to create comprehensive visualization. The results of the data analysis were targeted to improve the likelihood of nurses reporting of medication errors. ELMs are accurate by extremely fast prediction models. Self-Organizing Maps enable us to perform non-linear dimensionality reduction to get an accurate visualization of the selected variables. Combining both techniques reduces the curse of dimensionality and improves the inter- pretability of the visualization. 1. Introduction According to the seminal institute of medicine report, medical errors ranked as the leading cause of death in the United States [1], and recently climbed to the third leading cause of death [2]. It is estimated that about 44,000 to 98,000 people die annually from medical errors [1]. These numbers are higher than deaths from breast cancer, AIDS, and car acci- dents combined. Medication errors are the most frequently occurring medical error in healthcare settings [3]. Unfortunately, serious life threatening errors are usually reported, but the majority of other medi- cation errors are not [4]. Medication delivery is a complex multi-stage process that involves several healthcare professionals [5]. Medication errors could occur at each step of the medication process [6], with 38% of errors occurring at the administration phase [7]. Nurses spend about 40% of their time administering medications, and by virtue of their position represent the last safety defense to intercept errors before reaching their patients [8]. Most hospitals relay on nurses to report medication errors, in some cases nurses might be the witness or committer of medication error [9]. Medication error reporting is a voluntary process [10]. Reviewing and analyzing medication error report, known as incident report, pro- vides healthcare administrators and safety officers with opportunities for understanding error root causes and subsequently design interventions to prevent subsequent errors [11–13]. However, having less than 5% of errors reported, makes developing a proper medication error interven- tion a tough challenge [14]. Fear of blame, punishment, humiliation, retaliation from managers and/or peers were some of the reasons de- terring nurses from reporting errors bib15[9,15]. Mayo and Duncan (2004) [9] argued that all efforts of healthcare administrators, policy makers and scholars to create effective medication errors reporting sys- tems, could fail if nurses remain unwilling to report errors. Limited in- formation exist about organizational and interpersonal variables needed to motivate nurses to report medication errors. Therefore, the purpose of the three nursing studies is to identify interpersonal and organizational variables influencing nurses’ willingness to report medication errors. Given the complexity of healthcare organizations, and the non-linear relationships among aspects of healthcare systems, interpersonal re- lationships, and nurses willingness to report medication errors, using traditional regression approaches might often lead to inaccurate results [16,17], and limited interpretability [18,19] which will challenge pro- posing appropriate improvement interventions. Another challenge is that: generally there are large number of the predictor variables, so the possible combinations of the variables (predictors) are extremely large, which makes it difficult to identify which combination is the most effective for predicting nurses’ willingness to report. In this paper, a new method has been proposed to analyze predictors * Corresponding author. E-mail address: [email protected] (R. Hu). Contents lists available at ScienceDirect Array journal homepage: www.elsevier.com/journals/array/2590-0056/open-access-journal https://doi.org/10.1016/j.array.2020.100049 Received 20 December 2019; Received in revised form 24 August 2020; Accepted 11 October 2020 Available online 9 November 2020 2590-0056/© 2020 The Authors. Published by Elsevier Inc. This is an open access article under the CC BY license (http://creativecommons.org/licenses/by/4.0/). Array 8 (2020) 100049

Welcome message from author
This document is posted to help you gain knowledge. Please leave a comment to let me know what you think about it! Share it to your friends and learn new things together.
Transcript
Array 8 (2020) 100049
Contents lists available at ScienceDirect
Array
journal homepage: www.elsevier.com/journals/array/2590-0056/open-access-journal
Using machine learning to identify top predictors for nurses’ willingness toreport medication errors
Renjie Hu a,*, Amany Farag b, Kaj-Mikael Bj€ork c,d, Amaury Lendasse c,e
a Department of Industrial and Systems Engineering, The University of Iowa, Iowa City, USAb College of Nursing, The University of Iowa, Iowa City, USAc Arcada University of Applied Sciences, Helsinki, Finlandd Hanken School of Economics, Helsinki, Finlande Department of Information and Logistics Technology, College of Technology, University of Houston, Houston, USA
A R T I C L E I N F O
Keywords:Variable selectionData visualizationDimensionality reductionExtreme learning machinesSelf-organizing mapsMedication error reporting
* Corresponding author.E-mail address: [email protected] (R. Hu).
https://doi.org/10.1016/j.array.2020.100049Received 20 December 2019; Received in revised fAvailable online 9 November 20202590-0056/© 2020 The Authors. Published by Else
A B S T R A C T
This paper presents a novel methodology to analyze nurses’ willingness to report medication errors. ParallelExtreme Learning Machines were applied to identify the top interpersonal and organizational predictors and Self-Organizing Maps to create comprehensive visualization. The results of the data analysis were targeted to improvethe likelihood of nurses reporting of medication errors. ELMs are accurate by extremely fast prediction models.Self-Organizing Maps enable us to perform non-linear dimensionality reduction to get an accurate visualization ofthe selected variables. Combining both techniques reduces the curse of dimensionality and improves the inter-pretability of the visualization.
1. Introduction
According to the seminal institute of medicine report, medical errorsranked as the leading cause of death in the United States [1], and recentlyclimbed to the third leading cause of death [2]. It is estimated that about44,000 to 98,000 people die annually from medical errors [1]. Thesenumbers are higher than deaths from breast cancer, AIDS, and car acci-dents combined. Medication errors are the most frequently occurringmedical error in healthcare settings [3]. Unfortunately, serious lifethreatening errors are usually reported, but the majority of other medi-cation errors are not [4].
Medication delivery is a complex multi-stage process that involvesseveral healthcare professionals [5]. Medication errors could occur ateach step of the medication process [6], with 38% of errors occurring atthe administration phase [7]. Nurses spend about 40% of their timeadministering medications, and by virtue of their position represent thelast safety defense to intercept errors before reaching their patients [8].Most hospitals relay on nurses to report medication errors, in some casesnurses might be the witness or committer of medication error [9].
Medication error reporting is a voluntary process [10]. Reviewingand analyzing medication error report, known as incident report, pro-vides healthcare administrators and safety officers with opportunities forunderstanding error root causes and subsequently design interventions to
orm 24 August 2020; Accepted 1
vier Inc. This is an open access a
prevent subsequent errors [11–13]. However, having less than 5% oferrors reported, makes developing a proper medication error interven-tion a tough challenge [14]. Fear of blame, punishment, humiliation,retaliation from managers and/or peers were some of the reasons de-terring nurses from reporting errors bib15[9,15]. Mayo and Duncan(2004) [9] argued that all efforts of healthcare administrators, policymakers and scholars to create effective medication errors reporting sys-tems, could fail if nurses remain unwilling to report errors. Limited in-formation exist about organizational and interpersonal variables neededto motivate nurses to report medication errors. Therefore, the purpose ofthe three nursing studies is to identify interpersonal and organizationalvariables influencing nurses’ willingness to report medication errors.
Given the complexity of healthcare organizations, and the non-linearrelationships among aspects of healthcare systems, interpersonal re-lationships, and nurses willingness to report medication errors, usingtraditional regression approaches might often lead to inaccurate results[16,17], and limited interpretability [18,19] which will challenge pro-posing appropriate improvement interventions. Another challenge isthat: generally there are large number of the predictor variables, so thepossible combinations of the variables (predictors) are extremely large,which makes it difficult to identify which combination is the mosteffective for predicting nurses’ willingness to report.
In this paper, a new method has been proposed to analyze predictors
1 October 2020
rticle under the CC BY license (http://creativecommons.org/licenses/by/4.0/).

Table 1Survey measurements summary.
Measurements Number of Questions
Nurse manager’s leadership style 28Warmth and belonging climate 11Organizational trust 12Nurses Basic information* 12Hospital error reporting system 5Willingness to report in scenario 1 1Willingness to report in scenario 2 1Willingness to report in scenario 3 1
Note*: All category variables are converted to numerical values by label encoder.
Table 2Math notations.
Symbols Description
Y All Outcome VariablesYi Outcome Variable iX Predictor Variables for all the samplesxi ith sample from XSk Randomly selected k variables from XW ELM Input Layer Weightsb ELM Input Layer biasesL Number of Hidden Neurons in ELMh ELM Hidden Neurons outputϕ Non-linear transformation function in ELMβ ELM Output Layer Weightscs Best Matching Unit in SOMα Learning Rate in SOMσλ Neighborhood Function in SOMd Distance Function in SOM
R. Hu et al. Array 8 (2020) 100049
of nurses’ willingness to report medication errors and visualize the non-linear relationship between the variables and the nurses’ willingness. Toidentify the top predictors a new parallel variable selection method ispresented with Extreme Learning Machines (ELMs) [20–23]. ELMs isaccurate by extremely fast prediction models [20], therefore, it ispossible with them to test a very large number of possible variables.
The selected variables are visualized by comprehensive Self-Organizing Maps (SOMs) [24–27]. Self-Organizing Maps are perform-ing non-linear dimensionality reduction [24] to get an accurate visuali-zation of the data, which significantly enhances the interpretability of theselected predictors, and reveals the determinant factors for nurses’willingness to report medication errors, therefore guides the hospital toconduct intervention to improve the likelihood of receiving medicationerror reports from nurses.
The paper is organized as follows: in Section 2 the detailed problemdescription is provided. Section 3 discusses about the process of identi-fying the top predictors. Visualization technique is introduced in Section4. The complete experiment settings are presented in Section 5. Finalresults are included in Section 6. Conclusions and the future works are inSection 7.
2. Nurses error report dataset
Three survey data were collected from three funded nursing projects.The projects were conducted to identify interpersonal and organizationalpredictors of nurses’ willingness to report medication errors.
Study Design: non-experimental cross-sectional design was used inthe three projects. Setting: data for the three projects were collected fromRegistered Nurses (RN) working in general medical surgical units, criticalcare units, nursing homes, and Emergency Departments (ED) from mul-tiple hospitals in one Midwestern state.
Study Sample: Full-time, part time, and as needed base nurses (PRN),with no leadership responsibilities regardless their age, gender, years ofexperience were invited to the studies. Nurse managers, nurse practi-tioners, and those who are not involved in passing medication wereexcluded from the studies.
Study Measures/Instruments: Nurses’ demographics were measuredusing a PI developed demographic questionnaire that includes: nurses’age, gender, total years of experience, highest nursing degree, type ofunit, years of experience with the current nurse manager, years ofexperience in the current unit, number of hours worked per week andtype of shift (morning, evening, or rotating). In addition to the previousmeasurements the surveys included further measurements including,Interpersonal variables, Organizational variables (leadership and unitclimate) and Outcome variables of nurses’ willingness to report medi-cation errors.
2.1. Data preparation
Each survey data is collected in a separate.csv file. The variables in thedataset are corresponding to the questions from the survey, and thevalues of the variables are the subjects’ answers to the questions, whichare coded in the numerical Likert scales. The name of the variables arecoded in two parts: the abbreviation of the survey section name followedby the question number. For example: variable LSHPQ1means question 1in the section of Nurse manager’s leadership style, representing thequestion: My unite manager provides me with assistance in exchange formy efforts. Table 1 shows the correspondences among the Measurements,and the Number of Questions in this category. Three distinct outcomesvariables are asked in the survey to measure the nurses’ willingness toreport medication errors in different scenarios.
The samples with missing values in the dataset have been omitted.The final experimental data contains 68 variables and 328 samples/nurses.
There are three different outcome scenarios corresponding to threedistinct outcome variables, which are measured in the survey as follows:
2
ERREPQ1: When a mistake is made, but caught and corrected beforeaffecting the patient, how likely are you to report this error?
ERREPQ2: When a mistake is made, but has no potential harm to thepatient, how likely are you to report this error?
ERREPQ3: When a mistake is made that could harm the patient, but doesnot, how likely are you to report this error?
Table 2 presents the math notations used in this paper.To summarize, the training data is X 2 ℝ328�68. Three outcome var-
iables are Y1; Y2; Y3 2 ℝ328�1, corresponding to the three distinctoutcome scenarios: ERREPQ1, ERREPQ2, and ERREPQ3.
3. Identify top predictor variables with parallel ELMs
The survey data after pre-processing had 68 variables in total. Suchmulti-variable data is usually called high-dimensional data, which can bechallenging to interpret and to analyze due to the curse of the dimen-sionality, data redundancy and noises [28–30]. Any model built uponhigh-dimensional data directly usually suffers from the poor general-ization performances [28]. More importantly, such high-dimensionaldata is also limiting the analysis model’s interpretability [29,31]. Lastbut not least, it is difficult to create visualization of multi-dimensionaldata, which is an effective way of presenting the comprehensive data[29,32], enhancing the data analysis, and guiding the future actions. Inthis study the visualization plays an important role of guiding the man-agement of hospitals to improve the willingness of nurses to reportmedication error. For the purpose of increasing the interpretability, andobtain comprehensive visualization, it is critical to conduct proper var-iable selection to reduce the dimensionality of the data and identify toppredictor variables.
A fast parallel variable selection model is proposed by using ExtremeLearning Machines [20–22] incorporated in a wrapper variable selectionmechanism [33], to identify top predictors of nurses’ willingness toreport the medication errors. Extreme Learning Machines are accurate,

Table 3Typical ELM activation functions.
Hyperbolic Tangent Functionϕðw;x;bÞ ¼ 1� expð�ðx �wþ bÞÞ
1þ expð�ðx �wþ bÞÞSigmoid Function
ϕðw;x;bÞ ¼ 11þ expð�ðx �wþ bÞÞ
RBF (Gaussian)ϕðw;x;bÞ ¼ exp
� jjx� wjj2
2b2
!
R. Hu et al. Array 8 (2020) 100049
extremely fast and non-linear prediction models [20,21], therefore, it ispossible with them to test a very large number of possible combinationsof variables in parallel and obtain superior results than the traditionallinear models bib34[16,19,34,35]. The ELM model is explained in Sec-tion 3.1. The wrapper variable selection method is explained in Section3.3. In the variable selection process, the variables are evaluated by theR2 value of each ELM model, this is explained in Section 3.2.
3.1. Extreme Learning Machine
Extreme Learning Machine in Ref. [23,36] as important emergentmachine learning techniques, are proposed for training Single-hiddenLayer Feed-forward Neural Networks (SLFNs) [20,22,37–40].
In contrast with the traditional Feedforward Neural Networks (FNNs),which generally are trained by the well-known backpropagation (BP)algorithms, in ELM, the wight for the hidden layer are randomly initiatedand then fixed without iteratively tuning. Then commonly used activa-tion functions are applied on the hidden neurons. The only parameterslearned in ELM are the weights between hidden layer and the outputlayer. In this way, the parameters of the hidden neurons can be inde-pendent of the training data, which makes it possible for ELM to attainthe near optimal generalization bound of traditional FNN. Theoreticalstudies as in Ref. [22,38,39] has shown that ELM has the universalapproximation and classification properties.
The unique training process of ELM provides a huge leverage for thelearning speed. A non-iterative solution of ELM provides a speedup of 5orders of magnitude compared to Multilayer Perceptron ([41], MLP) or 6orders of magnitude compared to Support Vector Machines ([42], SVM).
ELM was proposed for the fast training for the Single-hidden LayerFeed-forward Networks (Fig. 1). An SLFN has three layers of neurons:Input layer provides data features and performs no computations; Hiddenlayers is the only layer where the non-linear transformation happens;Output layer is linear without any transformation function and bias.
ELM is trained in two stages: First, random feature mapping. In thisstage, the input data are projected randomly into a new space. ELMrandomly initializes the input layer weights W 2 ℝd�L and biases b 2 ℝL,where L is the number of the hidden neurons. An input data x 2 ℝd aremapped non-linearly by an activation function hi onto the hidden neuroni, denoted as:
Fig. 1. Extreme learning machine.
3
hiðxÞ¼ϕðwi; x; biÞ;wi 2ℝd b 2 ℝ; (1)
where ϕ is a non-linear piecewise continues function, generally can beselected from the following functions:
The hidden layer is not constrained to have only one type of trans-formation function in neurons. Different functions (see Table 3) can beused together. Some neurons may have no transformation function at all.They are linear neurons, and learn linear dependencies between datafeatures and targets directly, without approximating them by a nonlinearfunction. Usually, the number of linear neurons equals the number ofdata features, and each of these neurons copies the corresponding feature(by using an identity W ¼ I and zero b ¼ 0).
The second stage of ELM is solving the linear system, finding theoptimal β, that minimize the following cost function:
MSEðX;YÞ¼minβkHβ� Yk2; (2)
where, H is the output from the hidden layer:
H¼0@ ϕðw1; x1; b1Þ … ϕðwL; x1; bLÞ
… ⋱ …
ϕðw1; xN ; b1Þ … ϕðwL; xN ; bLÞ
1A: (3)
The cost function itself is the Mean Square Error (MSE) between theapproximation of ELM (Hβ) and the true target value Y. The optimalsolution for the cost function, β⋆ is given by:
β⋆ ¼HyY; (4)
where, Hy is the pseudoinverse and computed as:
Hy ¼ ðHTHÞ�1HT : (5)
Practically, the implementations of the pseudoinverse include a smallregularization term Hy ¼ ðHTH þ αIÞHT .
3.2. Evaluating predictor variables with R2 value
R2 value can be used as an accurate measurement of variable selectionperformance [43]. Due to the distinct scenarios of the outcomes, therelationship between predictor variables and each outcome variables areevaluated separately, with the calculated R2 values. This means the dataare grouped into three predictor-outcome pairs for ELM training: ðX;Y1Þ,ðX;Y2Þ, and ðX;Y3Þ.
A R2 value is calculated, using the MSE value from ELM the model:
R2ðX;YiÞ ¼ 1�MSEðX;YiÞ
VarðYiÞ : (6)
The MSE value can also be rewrite as:
MSEðX;YiÞ¼ 1N
�Yi � bYi
��Yi � bYi
�T; (7)
where, bYi is the estimation of Yi from the output of the ELM model.The higher the R2 value is, the more accurate prediction bYi is. Hence,
the R2 value is used to evaluate the performance of the selected variables.
R. Hu et al. Array 8 (2020) 100049
3.3. Wrapper variable selection with ELM
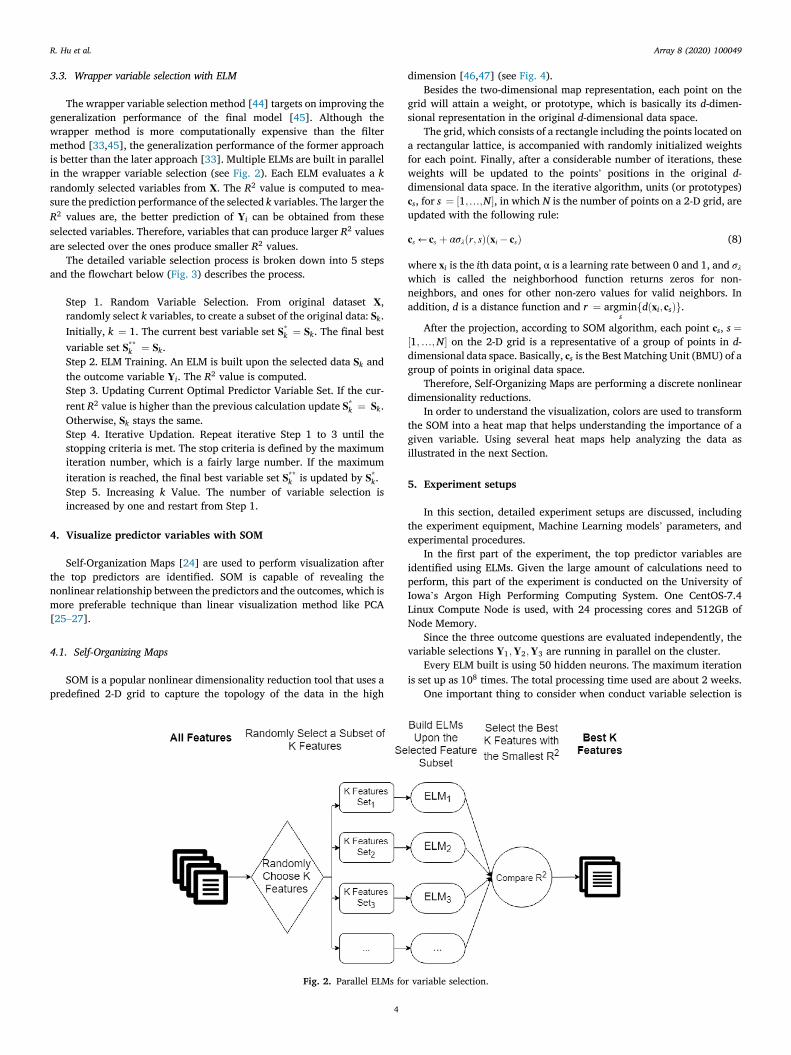
The wrapper variable selection method [44] targets on improving thegeneralization performance of the final model [45]. Although thewrapper method is more computationally expensive than the filtermethod [33,45], the generalization performance of the former approachis better than the later approach [33]. Multiple ELMs are built in parallelin the wrapper variable selection (see Fig. 2). Each ELM evaluates a krandomly selected variables from X. The R2 value is computed to mea-sure the prediction performance of the selected k variables. The larger theR2 values are, the better prediction of Yi can be obtained from theseselected variables. Therefore, variables that can produce larger R2 valuesare selected over the ones produce smaller R2 values.
The detailed variable selection process is broken down into 5 stepsand the flowchart below (Fig. 3) describes the process.
Step 1. Random Variable Selection. From original dataset X,randomly select k variables, to create a subset of the original data: Sk.Initially, k ¼ 1. The current best variable set S*k ¼ Sk. The final bestvariable set S**k ¼ Sk.Step 2. ELM Training. An ELM is built upon the selected data Sk andthe outcome variable Yi. The R2 value is computed.Step 3. Updating Current Optimal Predictor Variable Set. If the cur-rent R2 value is higher than the previous calculation update S*k ¼ Sk.Otherwise, Sk stays the same.Step 4. Iterative Updation. Repeat iterative Step 1 to 3 until thestopping criteria is met. The stop criteria is defined by the maximumiteration number, which is a fairly large number. If the maximumiteration is reached, the final best variable set S**k is updated by S*k.Step 5. Increasing k Value. The number of variable selection isincreased by one and restart from Step 1.
4. Visualize predictor variables with SOM
Self-Organization Maps [24] are used to perform visualization afterthe top predictors are identified. SOM is capable of revealing thenonlinear relationship between the predictors and the outcomes, which ismore preferable technique than linear visualization method like PCA[25–27].
4.1. Self-Organizing Maps
SOM is a popular nonlinear dimensionality reduction tool that uses apredefined 2-D grid to capture the topology of the data in the high
Fig. 2. Parallel ELMs fo
4
dimension [46,47] (see Fig. 4).Besides the two-dimensional map representation, each point on the
grid will attain a weight, or prototype, which is basically its d-dimen-sional representation in the original d-dimensional data space.
The grid, which consists of a rectangle including the points located ona rectangular lattice, is accompanied with randomly initialized weightsfor each point. Finally, after a considerable number of iterations, theseweights will be updated to the points’ positions in the original d-dimensional data space. In the iterative algorithm, units (or prototypes)cs, for s ¼ ½1;…;N�, in which N is the number of points on a 2-D grid, areupdated with the following rule:
cs ← cs þ ασλðr; sÞðxi � csÞ (8)
where xi is the ith data point, α is a learning rate between 0 and 1, and σλwhich is called the neighborhood function returns zeros for non-neighbors, and ones for other non-zero values for valid neighbors. Inaddition, d is a distance function and r ¼ argmin
sfdðxi;csÞg.
After the projection, according to SOM algorithm, each point cs, s ¼½1;…;N� on the 2-D grid is a representative of a group of points in d-dimensional data space. Basically, cs is the Best Matching Unit (BMU) of agroup of points in original data space.
Therefore, Self-Organizing Maps are performing a discrete nonlineardimensionality reductions.
In order to understand the visualization, colors are used to transformthe SOM into a heat map that helps understanding the importance of agiven variable. Using several heat maps help analyzing the data asillustrated in the next Section.
5. Experiment setups
In this section, detailed experiment setups are discussed, includingthe experiment equipment, Machine Learning models’ parameters, andexperimental procedures.
In the first part of the experiment, the top predictor variables areidentified using ELMs. Given the large amount of calculations need toperform, this part of the experiment is conducted on the University ofIowa’s Argon High Performing Computing System. One CentOS-7.4Linux Compute Node is used, with 24 processing cores and 512GB ofNode Memory.
Since the three outcome questions are evaluated independently, thevariable selections Y1;Y2;Y3 are running in parallel on the cluster.
Every ELM built is using 50 hidden neurons. The maximum iterationis set up as 108 times. The total processing time used are about 2 weeks.
One important thing to consider when conduct variable selection is
r variable selection.
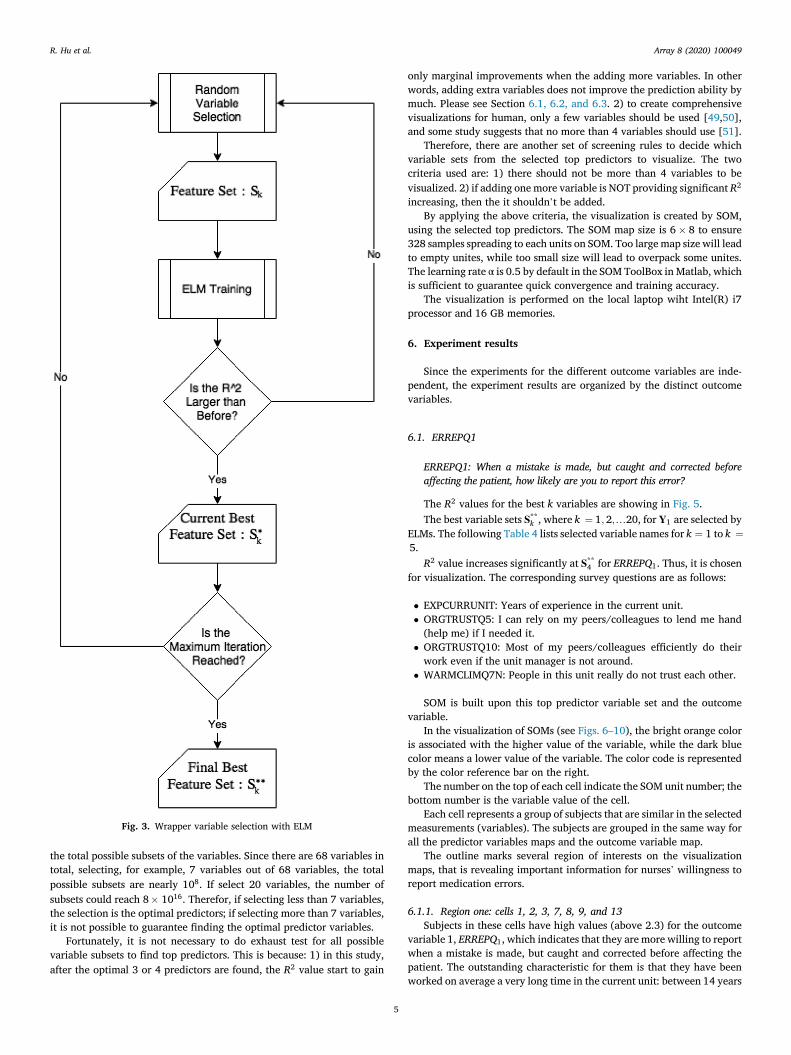
Fig. 3. Wrapper variable selection with ELM
R. Hu et al. Array 8 (2020) 100049
the total possible subsets of the variables. Since there are 68 variables intotal, selecting, for example, 7 variables out of 68 variables, the totalpossible subsets are nearly 108. If select 20 variables, the number ofsubsets could reach 8� 1016. Therefor, if selecting less than 7 variables,the selection is the optimal predictors; if selecting more than 7 variables,it is not possible to guarantee finding the optimal predictor variables.
Fortunately, it is not necessary to do exhaust test for all possiblevariable subsets to find top predictors. This is because: 1) in this study,after the optimal 3 or 4 predictors are found, the R2 value start to gain
5
only marginal improvements when the adding more variables. In otherwords, adding extra variables does not improve the prediction ability bymuch. Please see Section 6.1, 6.2, and 6.3. 2) to create comprehensivevisualizations for human, only a few variables should be used [49,50],and some study suggests that no more than 4 variables should use [51].
Therefore, there are another set of screening rules to decide whichvariable sets from the selected top predictors to visualize. The twocriteria used are: 1) there should not be more than 4 variables to bevisualized. 2) if adding one more variable is NOT providing significant R2
increasing, then the it shouldn’t be added.By applying the above criteria, the visualization is created by SOM,
using the selected top predictors. The SOM map size is 6� 8 to ensure328 samples spreading to each units on SOM. Too large map size will leadto empty unites, while too small size will lead to overpack some unites.The learning rate α is 0.5 by default in the SOM ToolBox in Matlab, whichis sufficient to guarantee quick convergence and training accuracy.
The visualization is performed on the local laptop wiht Intel(R) i7processor and 16 GB memories.
6. Experiment results
Since the experiments for the different outcome variables are inde-pendent, the experiment results are organized by the distinct outcomevariables.
6.1. ERREPQ1
ERREPQ1: When a mistake is made, but caught and corrected beforeaffecting the patient, how likely are you to report this error?
The R2 values for the best k variables are showing in Fig. 5.The best variable sets S**k , where k ¼ 1; 2;…20, for Y1 are selected by
ELMs. The following Table 4 lists selected variable names for k ¼ 1 to k ¼5.
R2 value increases significantly at S**4 for ERREPQ1. Thus, it is chosenfor visualization. The corresponding survey questions are as follows:
� EXPCURRUNIT: Years of experience in the current unit.� ORGTRUSTQ5: I can rely on my peers/colleagues to lend me hand(help me) if I needed it.
� ORGTRUSTQ10: Most of my peers/colleagues efficiently do theirwork even if the unit manager is not around.
� WARMCLIMQ7N: People in this unit really do not trust each other.
SOM is built upon this top predictor variable set and the outcomevariable.
In the visualization of SOMs (see Figs. 6–10), the bright orange coloris associated with the higher value of the variable, while the dark bluecolor means a lower value of the variable. The color code is representedby the color reference bar on the right.
The number on the top of each cell indicate the SOM unit number; thebottom number is the variable value of the cell.
Each cell represents a group of subjects that are similar in the selectedmeasurements (variables). The subjects are grouped in the same way forall the predictor variables maps and the outcome variable map.
The outline marks several region of interests on the visualizationmaps, that is revealing important information for nurses’ willingness toreport medication errors.
6.1.1. Region one: cells 1, 2, 3, 7, 8, 9, and 13Subjects in these cells have high values (above 2.3) for the outcome
variable 1, ERREPQ1, which indicates that they are more willing to reportwhen a mistake is made, but caught and corrected before affecting thepatient. The outstanding characteristic for them is that they have beenworked on average a very long time in the current unit: between 14 years
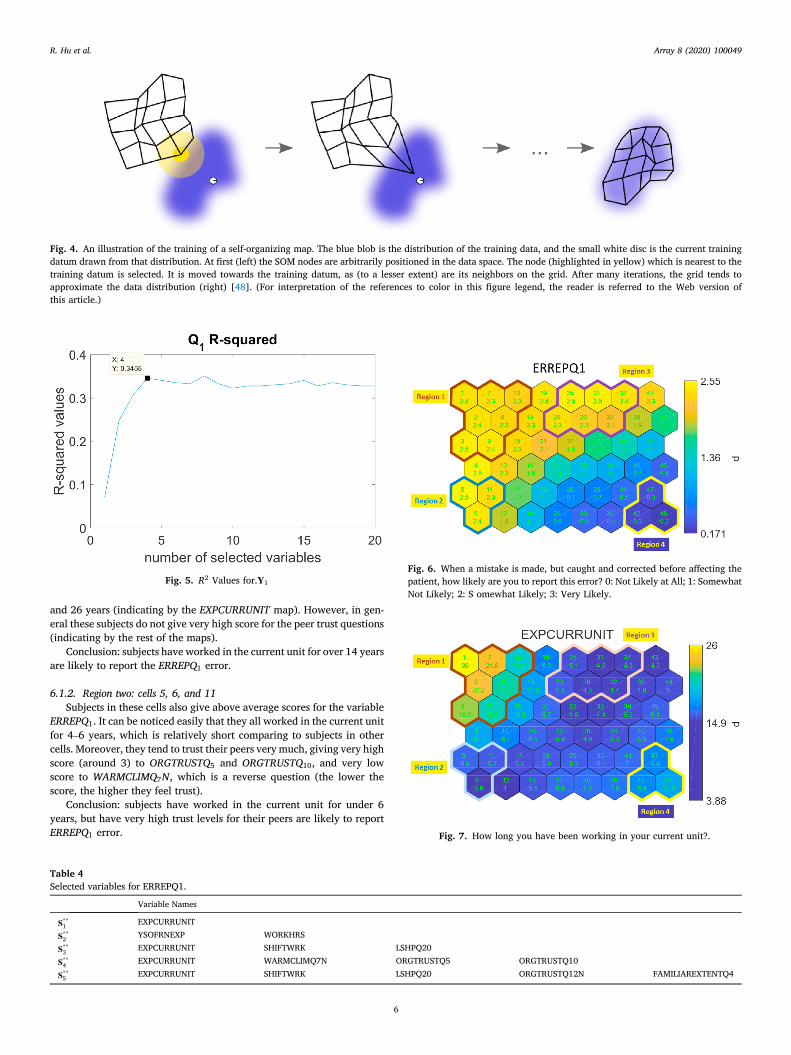
Fig. 4. An illustration of the training of a self-organizing map. The blue blob is the distribution of the training data, and the small white disc is the current trainingdatum drawn from that distribution. At first (left) the SOM nodes are arbitrarily positioned in the data space. The node (highlighted in yellow) which is nearest to thetraining datum is selected. It is moved towards the training datum, as (to a lesser extent) are its neighbors on the grid. After many iterations, the grid tends toapproximate the data distribution (right) [48]. (For interpretation of the references to color in this figure legend, the reader is referred to the Web version ofthis article.)
Fig. 5. R2 Values for.Y1
Fig. 6. When a mistake is made, but caught and corrected before affecting thepatient, how likely are you to report this error? 0: Not Likely at All; 1: SomewhatNot Likely; 2: S omewhat Likely; 3: Very Likely.
Fig. 7. How long you have been working in your current unit?.
R. Hu et al. Array 8 (2020) 100049
and 26 years (indicating by the EXPCURRUNIT map). However, in gen-eral these subjects do not give very high score for the peer trust questions(indicating by the rest of the maps).
Conclusion: subjects have worked in the current unit for over 14 yearsare likely to report the ERREPQ1 error.
6.1.2. Region two: cells 5, 6, and 11Subjects in these cells also give above average scores for the variable
ERREPQ1. It can be noticed easily that they all worked in the current unitfor 4–6 years, which is relatively short comparing to subjects in othercells. Moreover, they tend to trust their peers very much, giving very highscore (around 3) to ORGTRUSTQ5 and ORGTRUSTQ10, and very lowscore to WARMCLIMQ7N, which is a reverse question (the lower thescore, the higher they feel trust).
Conclusion: subjects have worked in the current unit for under 6years, but have very high trust levels for their peers are likely to reportERREPQ1 error.
Table 4Selected variables for ERREPQ1.
Variable Names
S**1 EXPCURRUNIT
S**2 YSOFRNEXP WORKHRS
S**3 EXPCURRUNIT SHIFTWRK LSHPQ20
S**4 EXPCURRUNIT WARMCLIMQ7N ORGTRUSTQ5 ORGTRUSTQ10
S**5 EXPCURRUNIT SHIFTWRK LSHPQ20 ORGTRUSTQ12N FAMILIAREXTENTQ4
6

Fig. 8. I can rely on my peers/colleagues to lend me hand (help me) if I neededit. 0: Definitely Disagree; 1: Inclined to Disagree; 2: Inclined to Agree; 3: Defi-nitely Agree.
Fig. 9. Most of my peers/colleagues efficiently do their work even if the unitmanager is not around. 0: Definitely Disagree; 1: Inclined to Disagree; 2: In-clined to Agree; 3: Definitely Agree.
Fig. 10. People in this unit really do not trust each other. 0: Definitely Disagree;1: Inclined to Disagree; 2: Inclined to Agree; 3: Definitely Agree.
R. Hu et al. Array 8 (2020) 100049
6.1.3. Region three: cells 20, 25, 26, 31, 32 and 37Subjects in theses cells are more willing to report as well. They are
also relatively young to the current unit, between 4 and 5 years. How-ever, their trust to the peers are not too strong, on the margin of the lowtrust level: around 2 for both ORGTRUST questions and between 1 for to2 for the WARMCLIM question.
Conclusion: subjects have worked in the current unit for around 5years, but somehow feel the lack of the peer trust, are likely to reportERREPQ1 error.
7
6.1.4. Region four: cells 42 47 and 48Subjects in these cells are very unwilling to report the error (average
score is around or bellow 0.3). They worked in the current unit for 8–10years. They feel somewhat trust among peers but far from strong trust.
Conclusion: subjects who have very high trust and who have very lowtrust are both likely to report the error. However, subjects who havemedium or medium low level of peer trust are uncertain whether theywill report the error or not. How long have they been working in the unitalso has some effect on the subjects for reporting the error.
6.2. ERREPQ2
ERREPQ2: When a mistake is made, but has no potential harm to thepatient, how likely are you to report this error?
The R2 values for the best k variables are showing in Fig. 11.The best variable sets S**k , where k ¼ 1; 2;…20, for Y2 are selected by
ELMs. The following Table 5 lists selected variable names for k ¼ 1 to k ¼5.
R2 value increases significantly at S**3 for ERREPQ2. Thus, it is chosenfor visualization. The corresponding survey questions are as follows:
� SHIFTWRK: Typical working shift.� LSHPQ5: Seeks differing perspectives when solving problems.� LSHPQ9: Talks enthusiastically about what needs to be accomplished.
SOM is built upon this top predictor variable set and the outcomevariable. The colored map from SOM are presented in Figs. 12–15.
6.2.1. Region one: cells 32, 37–40, and 43-48Subjects in these cells are somewhat likely or very likely to report the
error. The outstanding character for these subjects is that they all givevery high score for the two unit manager leadership measurementquestions.
Conclusion: subjects who believe their unit manager is creative whensolving the problems and has enthusiasm about the goal are likely toreport the error.
6.2.2. Region two: cells 6, 12, 18, 24, and 30Subjects in these cells are not likely at all or somewhat unlikely to
report the error. However the reason why they are not motivated toreport is not obvious. For subjects in the cell 6 and 12, the low recog-nition level of the unit manager’s leadership may cause the unwillingnessto report. For the rest subjects the long work-shift (many of the subjects in
Fig. 11. R2 Values for.Y2

Table 5Selected variables for ERREPQ2.
Variable Names
S**1 LSHPQ5
S**2 Age WARMCLIMQ8N
S**3 SHIFTWRK LSHPQ5 LSHPQ9
S**4 Age WARMCLIMQ8N ORGTRUSTQ5 ORGTRUSTQ8
S**5 LSHPQ1 LSHPQ10 LSHPQ11 LSHPQ17 ORGTRUSTQ5
Fig. 12. When a mistake is made, but has no potential harm to the patient, howlikely are you to report this error? 0: Not Likely at All; 1: Somewhat Not Likely;2: Somewhat Likely; 3: Very Likely.
Fig. 13. Seeks differing perspectives when solving problems. 0: Not at all; 1:Once in a while; 2: Sometimes; 3: Fairly often; 4: Frequently if not always.
Fig. 14. Talks enthusiastically about what needs to be accomplished. 0: Not atall; 1: Once in a while; 2: Sometimes; 3: Fairly often; 4: Frequently if not always.
Fig. 15. Please indicate your typical shift (the shift that your work most of yourtime). 0 ¼ 7am-3pm; 1 ¼ 3pm–11pm; 2 ¼ 11pm-7am; 3 ¼ 7am-7pm; 4 ¼ 7pm-7am; 5 ¼ 8am-5pm; 6 ¼ other; 7 ¼ no specific shift/rotating.
Fig. 16. R2 Values for.Y
R. Hu et al. Array 8 (2020) 100049
these cell are working at a 12 h work-shift) may be the reason of lack ofmotivation to report.
Conclusion: subjects who work at a long shift and think their managerare not seeking differing perspective when solving the problems or lack
8
of enthusiasmwhen speaking of the goals are unlikely to report the error.
6.3. ERREPQ3
ERREPQ3: When a mistake is made that could harm the patient, but doesnot, how likely are you to report this error?
The R2 values for the best k variables are showing in Fig. 16.The best variable sets S**k , where k ¼ 1; 2;…20, for Y3 are selected by
ELMs. The following Table 6 lists selected variable names for k ¼ 1 to k ¼5.
R2 value increases significantly at S**3 for ERREPQ3. Thus, it is chosenfor visualization. The corresponding survey questions are as follows:
� EXPCURRUNIT: Years of experience in the current unit.� LSHPQ6: Talks optimistically about the future.� ORGTRUSTQ6: My unit manager seems to do an efficient job.
3

Table 6Selected variables for ERREPQ3.
Variable Names
S**1 LSHPQ18
S**2 Age WORKHRS
S**3 EXPCURRUNIT LSHPQ6 ORGTRUSTQ6
S**4 Age LSHPQ15 LSHPQ17 LSHPQ20
S**5 LSHPQ10 LSHPQ18 ORGTRUSTQ6 COMPLERREPQ2 ERREPTIMEQ5
Fig. 19. Talks optimistically about the future. 0: Not at all; 1: Once in a while; 2:Sometimes; 3: Fairly often; 4: Frequently if not always.
R. Hu et al. Array 8 (2020) 100049
SOM is built upon this top predictor variable set and the outcomevariable. The colored map from SOM are presented in Figs. 17–20.
6.3.1. Region one: cells 31, 32, 37, 38, 43 and 44Subjects in these cells are somewhat likely to report the error. For the
out come variable ERREPQ3 the majority people are choosing very likelyto report. However, for this region, subjects are hesitating. The subjectsbelive their manager are very optimistic about the future according to theLSHPQ6 map, but they don’t think their manager can do his/her jobefficiently.
Conclusion: Subjects who have some doubts about their manager’sefficiency and think the manager is optimistic about the future aresomewhat likely to report the error.
7. Conclusions and future work
Results of this data analysis using SOM showed that nurses’ willing-ness to report medication error is contingent on three factors of
Fig. 17. When a mistake is made, that could harm the patient, but does not,how likely are you to report this error? 0: Not Likely at All; 1: Somewhat NotLikely; 2: Somewhat Likely; 3: Very Likely.
Fig. 18. How long you have been working in your current unit?.
Fig. 20. My unit manager seems to do an efficient job. 0: Definitely Disagree; 1:Inclined to Disagree; 2: Inclined to Agree; 3: Definitely Agree.
9
experience in the unit, nursing experience, organizational trust particu-larly trust in peers, and nurse manager leadership behaviors. Further-more, the results showed that outcome predictors varied based on level oferror severity. Based on this result, hospital administrators shouldconsider focusing on the previously outlined predictors if they want toimprove nurses’ willingness to report medication errors regardless itslevel of severity. Using SOM, accounted for the non-liner relationshipthat exist among the different study variables. Most importantly itshowed the pattern of organizational trust development. This informa-tion was not evident when we used traditional liner modeling.
The new methodology that is combining ELMs and SOMs has pro-vided an clear understanding of the studied dataset. Some of the analysisare obviously right and similar to the conclusions that can be obtainedwith traditional data analysis. Nevertheless, more understanding hasbeen obtained. For example, the model is sparse (few variables). It is awell-known results in the field of perception that only 5 to 6 variables canbe easily understood by humans [49,50]. Furthermore unknownsnonlinear interactions between variables have been discovered using ourapproach. It has to be mentioned that our methodology is suitable for big
R. Hu et al. Array 8 (2020) 100049
data: it can handle the 3 attributes of big data: Volume, Velocity andVariety.
In the future, we are planing to use the same methodology to othermedical and nursing problems. It is important to work together withpractitioners to validate the results but we are willing to make themethodology nearly automatic and usable by any person that does nothave a strong background in machine learning.
Author Contributions
Renjie Hu: Main contributor (all section writing, doing experiments).Amany Farag: Nursing Survey Data collecting, preliminary analysis,Introduction, data description, text checking. Kaj-Mikael: ideas and ex-periments and text checking. Amaury Lendasse: ideas and experimentsand text checking.
Author Declaration
We wish to confirm that there are no known conflicts of interestassociated with this publication and there has been no significantfinancial support for this work that could have influenced its outcome.
We confirm that the manuscript has been read and approved by allnamed authors and that there are no other persons who satisfied thecriteria for authorship but are not listed. We further confirm that theorder of authors listed in the manuscript has been approved by all of us.
We confirm that we have given due consideration to the protection ofintellectual property associated with this work and that there are noimpediments to publication, including the timing of publication, withrespect to intellectual property. In so doing we confirm that we havefollowed the regulations of our institutions concerning intellectualproperty.
We understand that the Corresponding Author is the sole contact forthe Editorial process (including Editorial Manager and direct communi-cations with the office). He/she is responsible for communicating withthe other authors about progress, submissions of revisions and finalapproval of proofs. We confirm that we have provided a current, correctemail address which is accessible by the Corresponding Author andwhich has been configured to accept email from: [email protected].
Declaration of competing interest
The authors declare that they have no known competing financialinterests or personal relationships that could have appeared to influencethe work reported in this paper.
References
[1] Institute of Medicine. To Err is human: building a safer health system. Washington,DC: The National Academies Press; 2000.
[2] M. A. Makary, M. Daniel, Medical error—the third leading cause of death in the us,BMJ 353.
[3] Janet C, Alison H, Tracey B. Nurses’ role in medication safety. J Nurs Manag 2010;18(7):853–61.
[4] Balas M, Scott L, Rogers A. Frequency and type of errors and near errors reported bycritical care nurses. Can J Nurs Res 2006;38(2):24–41.
[5] Brady A, Malone A, Fleming S. A literature review of the individual and systemsfactors that contribute to medication errors in nursing practice. J Nurs Manag 2009;17:679–97.
[6] Soon KK, So-Hi K, Jin-A K, Sunhee C. Nurses’ perceptions of medication errors andtheir contributing factors in South Korea. J Nurs Manag 2011;19(3):346–53.
[7] Santell JP, Hicks RW, McMeekin J, Cousins DD. Medication errors: experience ofthe United States pharmacopeia (usp) medmarx reporting system. J Clin Pharmacol2003;43(7):760–7.
[8] Reason J. Human error: models and management. Br Med J 2000;320(7237):768–70.
[9] Mayo A, Duncan D. Nurse perceptions of medication errors: what we need to knowfor patient safety, vol. 19; 2004. p. 209–17.
[10] H Jones J, Treiber L. When the 5 rights go. wrong 2010;25:240–7.[11] L. Lefrak, Moving toward safer practice: reducing medication errors in neonatal
care, J Perinat Neonatal Nurs 16 (2).
10
[12] Benn J, Koutantji M, Wallace L, Spurgeon P, Rejman M, Healey A, Vincent C.Feedback from incident reporting: information and action to improve patient safety.BMJ Qual Saf 2009;18(1):11–21.
[13] J Wakefield B, Wakefield D, Uden-Holman T, Blegen M. Nurses’ perceptions of whymedication errors occur 1998;7:39–44.
[14] Cohen H, Robinson ES, Mandrack M. Getting to the root of medication errors:survey results. Nursing 2003;33(9):36–45.
[15] C. L. Covell, J. A. Ritchie, Nurses’ responses to medication errors: suggestions forthe development of organizational strategies to improve reporting, J Nurs Care Qual24 (4).
[16] Performance comparison of nonlinear and linear regression algorithms coupledwith different attribute selection methods for quantitative structure - retentionrelationships modelling in micellar liquid chromatography. J Chromatogr A 2020;1623:461146.
[17] Tomberg A, Johansson MJ, Norrby P-O. A predictive tool for electrophilic aromaticsubstitutions using machine learning. J Org Chem 2019;84(8):4695–703. pMID:30336024.
[18] Talebi M, Schuster G, Shellie RA, Szucs R, Haddad PR. Performance comparison ofpartial least squares-related variable selection methods for quantitative structureretention relationships modelling of retention times in reversed-phase liquidchromatography. J Chromatogr A 2015;1424:69–76.
[19] Goodarzi M, Jensen R, Vander Heyden Y. Qsrr modeling for diverse drugs usingdifferent feature selection methods coupled with linear and nonlinear regressions.J Chromatogr B 2012;910:84–94. chemometrics in Chromatography.
[20] Huang G-B, Zhu Q-Y, Siew C-K. Extreme learning machine: a new learning schemeof feedforward neural networks. In: Neural Networks, 2004. Proceedings. 2004IEEE international joint conference on, vol. 2. IEEE; 2004. p. 985–90.
[21] Huang G-B, Zhu Q-Y, Siew C-K. Extreme learning machine: theory and applications.Neurocomputing 2006;70(1–3):489–501.
[22] Huang G-B, Zhou H, Ding X, Zhang R. Extreme learning machine for regression andmulticlass classification., Systems, Man, and Cybernetics, Part B: Cybernetics. IEEETransactions on 2012;42(2):513–29.
[23] Cambria E, et al. Extreme learning machines [trends controversies]. IEEE Intell Syst2013;28(6):30–59.
[24] Kohonen T. Self-organized formation of topologically correct feature maps. BiolCybern 1982;43(1):59–69.
[25] Lendasse A, Cottrell M, Wertz V, Verleysen M. Prediction of electric load usingkohonen maps - application to the polish electricity consumption. In: Proceedings ofthe 2002 American control conference (IEEE cat. No.CH37301), vol. 5; 2002.p. 3684–9. 5.
[26] Dablemont S, Simon G, Lendasse A, Ruttiens A, Blayo F, Verleysen M. Time seriesforecasting with SOM and local non-linear models-application to the DAX30 indexprediction. In: Proceedings of the workshop on self-organizing maps, Kitakyushu,Japan, Citeseer; 2003.
[27] Merlin P, Sorjamaa A, Maillet B, Lendasse A. X-som and l-som: a doubleclassification approach for missing value imputation. Neurocomputing 2010;73(7):1103–8 [advances in Computational Intelligence and Learning].
[28] Lee JA, Verleysen M. Nonlinear dimensionality reduction. first ed. New York:Springer-Verlag; 2007.
[29] Kaski S, Peltonen J. Dimensionality reduction for data visualization. IEEE SignalProcess Mag 2011;28(2):100–4.
[30] Lee JA, Lendasse A, Verleysen M. Nonlinear projection with curvilinear distances:isomap versus curvilinear distance analysis. Neurocomputing 2004;57:49–76. newAspects in Neurocomputing: 10th European Symposium on Artificial NeuralNetworks 2002.
[31] Hu R, Ratner K, Ratner E, Miche Y, Bj€ork K-M, Lendasse A. ELM-SOMþ: acontinuous mapping for visualization. Neurocomputing 2019;365:147–56.
[32] Kireeva NV, Ovchinnikova SI, Tetko IV, Asiri AM, Balakin KV, Tsivadze AY.Nonlinear dimensionality reduction for visualizing toxicity data: distance-basedversus topology-based approaches. ChemMedChem 2014;9(5):1047–59.
[33] Wikipedia contributors. Feature selection — wikipedia, the free encyclopedia.available at: https://en.wikipedia.org/w/index.php?title¼Feature/_selection/&oldid¼849580613.
[34] Miche Y, Sorjamaa A, Bas P, Simula O, Jutten C, Lendasse A, OP-ELM. Optimallypruned extreme learning machine, Neural Networks. IEEE Transactions 2010;21(1):158–62.
[35] A. Akusok, D. Veganzones, Y. Miche, K.-M. Bj€ork, P. D. Jardin, E. Severin, A.Lendasse, MD-ELM: originally mislabeled samples detection using OP-ELM model,Neurocomputing.
[36] Miche Y, van Heeswijk M, Bas P, Simula O, Lendasse A. Trop-elm: a double-regularized elm using lars and tikhonov regularization. Neurocomputing 2011;74(16):2413–21.
[37] Huang G-B, Chen L, Siew C-K. Universal approximation using incrementalconstructive feedforward networks with random hidden nodes. IEEE Trans NeuralNetwork 2006;17(4):879–92.
[38] G.-B. Huang, What are Extreme learning machines? Filling the gap between frankrosenblatt’s dream and john von Neumann’s puzzle, [Cognitive Computation].
[39] Huang G-B. An insight into extreme learning machines: random neurons, randomfeatures and kernels. Cognitive Computation 2014;6(3):376–90.
[40] Gritsenko A, Sun Z, Baek S, Miche Y, Hu R, Lendasse A. Deformable surfaceregistration with extreme learning machines. In: International conference onExtreme learning machine. Springer; 2017. p. 304–16.
[41] Rosenblatt F, Nonr C. The perceptron: a probabilistic model for information storageand organization in the brain. Psychol Rev 1958;65(6):386–408.
[42] Cortes C, Vapnik V. Support-vector networks. Mach Learn 1995;20(3):273–97.

R. Hu et al. Array 8 (2020) 100049
[43] Glantz SA, Slinker BK, Neilands TB. Primer of applied regression and analysis ofvariance, vol. 309. New York: McGraw-Hill; 1990.
[44] Guyon I, Elisseeff A. An introduction to variable and feature selection. J Mach LearnRes 2003;3:1157–82.
[45] Meiri R, Zahavi J. Using simulated annealing to optimize the feature selectionproblem in marketing applications. Eur J Oper Res 2006;171(3):842–58.
[46] Akusok A, Baek S, Miche Y, Bjork K-M, Nian R, Lauren P, Lendasse A. ELMVISþ: fastnonlinear visualization technique based on cosine distance and extreme learningmachines. Neurocomputing 2016;205:247–63.
11
[47] Hu R, Roshdibenam V, Johnson HJ, Eirola E, Akusok A, Miche Y, Bj€ork K-M,Lendasse A. Elm-som: a continuous self-organizing map for visualization. In: 2018international joint conference on neural Networks (IJCNN). IEEE; 2018. p. 1–8.
[48] Wikipedia. Self-organizing map. https://en.wikipedia.org/wiki/Self-organizing/_map.
[49] Tufte ER. The visual display of quantitative information. Cheshire, CT, USA:Graphics Press; 1986.
[50] Ware C. Information visualization: perception for design. third ed. San Francisco,CA, USA: Morgan Kaufmann Publishers Inc.; 2012.
[51] Halford GS, Baker R, McCredden JE, Bain JD. How many variables can humansprocess? Psychol Sci 2005;16(1):70–6.
Related Documents


![An Introduction to Ensemble Learning in Credit Risk Modelling · [L. Breiman Bagging Predictors. 1996 Machine Learning 24 (2):123-140.] [L. Breiman. Random Forests. 2001 Machine Learning](https://static.cupdf.com/doc/110x72/5f02a0e27e708231d40536b7/an-introduction-to-ensemble-learning-in-credit-risk-modelling-l-breiman-bagging.jpg)

