Citation: Marques, P.A.; Jorge, D.; Reis, J. Using Lean to Improve Operational Performance in a Retail Store and E-Commerce Service: A Portuguese Case Study. Sustainability 2022, 14, 5913. https://doi.org/ 10.3390/su14105913 Academic Editor: Taho Yang Received: 10 April 2022 Accepted: 11 May 2022 Published: 13 May 2022 Publisher’s Note: MDPI stays neutral with regard to jurisdictional claims in published maps and institutional affil- iations. Copyright: © 2022 by the authors. Licensee MDPI, Basel, Switzerland. This article is an open access article distributed under the terms and conditions of the Creative Commons Attribution (CC BY) license (https:// creativecommons.org/licenses/by/ 4.0/). sustainability Article Using Lean to Improve Operational Performance in a Retail Store and E-Commerce Service: A Portuguese Case Study Pedro Alexandre Marques 1, *, Diana Jorge 1 and João Reis 1,2 1 EIGeS—Research Centre in Industrial Engineering, Management and Sustainability, Lusófona University, Campo Grande, 376, 1749-024 Lisbon, Portugal; [email protected] (D.J.); [email protected] (J.R.) 2 Department of Military Sciences, Portuguese Military Academy and CINAMIL, Rua Gomes de Freire 203, 1169-203 Lisbon, Portugal * Correspondence: [email protected]; Tel.: +351-21-751-5500 Abstract: Ensuring on-shelf availability is essential for retailers to maintain high service levels for both in-store and E-Commerce consumers. The performance of this indicator largely depends on reorder planning decisions, as well as on the effectiveness of the replenishment process. This paper presents a case study that involved two Lean initiatives, which together have contributed to a significantly reduction in the number of out-of-stock events incurred by a retail store and an increase in the order fulfilment rate accomplished by the online commerce service. In the first initiative, a value stream management (VSM) methodology was adopted to redesign the existing replenishment process in the most relevant fresh food market: fruits and vegetables. The second initiative involved the implementation of a simple, but effective visual inventory management system in the warehouse of the E-Commerce division, where a wide set of fast-moving consumer goods (FMCG) is stored using kanban cards. This paper hence demonstrates, through practical application, that Lean tools can be employed to improve operational processes with positive impacts on both the physical store performance and on results regarding the online commerce business. Keywords: E-Commerce; lean management; order fulfilment rate; out-of-stock; value stream mapping 1. Introduction Out-of-stock (OOS) is a major problem in the retail business, since it contributes to lost sales and decreased consumer loyalty [1–3]. Poor in-store replenishment significantly contributes to a decrease of on-shelf availability (OSA) performance, hence negatively impacting consumer behavior and sales [4,5]. Furthermore, customer order fulfilment in online retailing largely depends on the OSA performance of the physical store [6,7]. Accord- ing to recent reports, the number of online purchases is expected to keep rising significantly in the coming years [8], especially after the pandemic situation caused by COVID-19 that has contributed to an acceleration in digital purchases and to the increased importance of E-Commerce in the retail business [9,10]. E-commerce is nowadays a critical part of a retailer’s multi- and omni-channel strategy [11,12], being relevant to an understanding of how effective channel integration is and how it can be improved [13,14]. Due to the rapid growth of online shopping during recent years, the opportunity for the expansion of the fresh food E-Commerce market has become a reality [15]; however, the unique and intrinsic characteristics of fresh products may lead consumers to retain a preference for the supermarket as their main channel of purchasing, since virtual purchasing limits the ability to examine the purchased items [16]. Among all the areas of a food retail store, fresh food markets are of great impor- tance, as they account for 30 percent of overall sales (usually with higher margins than packaged items) and represent around 50% of the total inventory turnover [17]. Further- more, they have higher-than-average daily sales per item [18] and, according to Buck and Minvielle [19], they are amongst the strongest drivers of customer loyalty and store Sustainability 2022, 14, 5913. https://doi.org/10.3390/su14105913 https://www.mdpi.com/journal/sustainability

Welcome message from author
This document is posted to help you gain knowledge. Please leave a comment to let me know what you think about it! Share it to your friends and learn new things together.
Transcript
Citation: Marques, P.A.; Jorge, D.;
Reis, J. Using Lean to Improve
Operational Performance in a Retail
Store and E-Commerce Service: A
Portuguese Case Study. Sustainability
2022, 14, 5913. https://doi.org/
10.3390/su14105913
Academic Editor: Taho Yang
Received: 10 April 2022
Accepted: 11 May 2022
Published: 13 May 2022
Publisher’s Note: MDPI stays neutral
with regard to jurisdictional claims in
published maps and institutional affil-
iations.
Copyright: © 2022 by the authors.
Licensee MDPI, Basel, Switzerland.
This article is an open access article
distributed under the terms and
conditions of the Creative Commons
Attribution (CC BY) license (https://
creativecommons.org/licenses/by/
4.0/).
sustainability
Article
Using Lean to Improve Operational Performance in a RetailStore and E-Commerce Service: A Portuguese Case StudyPedro Alexandre Marques 1,*, Diana Jorge 1 and João Reis 1,2
1 EIGeS—Research Centre in Industrial Engineering, Management and Sustainability, Lusófona University,Campo Grande, 376, 1749-024 Lisbon, Portugal; [email protected] (D.J.); [email protected] (J.R.)
2 Department of Military Sciences, Portuguese Military Academy and CINAMIL, Rua Gomes de Freire 203,1169-203 Lisbon, Portugal
* Correspondence: [email protected]; Tel.: +351-21-751-5500
Abstract: Ensuring on-shelf availability is essential for retailers to maintain high service levels forboth in-store and E-Commerce consumers. The performance of this indicator largely depends onreorder planning decisions, as well as on the effectiveness of the replenishment process. This paperpresents a case study that involved two Lean initiatives, which together have contributed to asignificantly reduction in the number of out-of-stock events incurred by a retail store and an increasein the order fulfilment rate accomplished by the online commerce service. In the first initiative, avalue stream management (VSM) methodology was adopted to redesign the existing replenishmentprocess in the most relevant fresh food market: fruits and vegetables. The second initiative involvedthe implementation of a simple, but effective visual inventory management system in the warehouseof the E-Commerce division, where a wide set of fast-moving consumer goods (FMCG) is storedusing kanban cards. This paper hence demonstrates, through practical application, that Lean toolscan be employed to improve operational processes with positive impacts on both the physical storeperformance and on results regarding the online commerce business.
Keywords: E-Commerce; lean management; order fulfilment rate; out-of-stock; value stream mapping
1. Introduction
Out-of-stock (OOS) is a major problem in the retail business, since it contributes tolost sales and decreased consumer loyalty [1–3]. Poor in-store replenishment significantlycontributes to a decrease of on-shelf availability (OSA) performance, hence negativelyimpacting consumer behavior and sales [4,5]. Furthermore, customer order fulfilment inonline retailing largely depends on the OSA performance of the physical store [6,7]. Accord-ing to recent reports, the number of online purchases is expected to keep rising significantlyin the coming years [8], especially after the pandemic situation caused by COVID-19 thathas contributed to an acceleration in digital purchases and to the increased importanceof E-Commerce in the retail business [9,10]. E-commerce is nowadays a critical part of aretailer’s multi- and omni-channel strategy [11,12], being relevant to an understandingof how effective channel integration is and how it can be improved [13,14]. Due to therapid growth of online shopping during recent years, the opportunity for the expansionof the fresh food E-Commerce market has become a reality [15]; however, the unique andintrinsic characteristics of fresh products may lead consumers to retain a preference for thesupermarket as their main channel of purchasing, since virtual purchasing limits the abilityto examine the purchased items [16].
Among all the areas of a food retail store, fresh food markets are of great impor-tance, as they account for 30 percent of overall sales (usually with higher margins thanpackaged items) and represent around 50% of the total inventory turnover [17]. Further-more, they have higher-than-average daily sales per item [18] and, according to Buckand Minvielle [19], they are amongst the strongest drivers of customer loyalty and store
Sustainability 2022, 14, 5913. https://doi.org/10.3390/su14105913 https://www.mdpi.com/journal/sustainability
Sustainability 2022, 14, 5913 2 of 19
traffic. Fresh food refers to product categories such as fruits and vegetables, meat, seafood, baked goods, among other perishable items. Due to its distinctively short shelf life,fresh food is complex to manage and particularly vulnerable to operational and supplychain risks [20]. Moreover, some fresh product categories are often subjected to specifictemperature and handling requirements, leading to additional challenges when performingthe replenishment process [14,21].
In order to enhance the effectiveness and productivity of their in-store, online and/orsupply chain operations, many retailers have adopted operational excellence programsbased on Lean principles, methods and tools to improve performance, productivity andcustomer satisfaction [22–26]. They seek the systematic adoption of proven methods andtools that will allow them to continuously identify and eliminate waste factors from theirvalue streams or processes [27]. The origins of Lean can be found on the shop floors ofJapanese manufacturers, in particular at the Toyota Motor Corporation [28]. However, overthe past two decades, the world has embraced Lean management thinking, while a largeamount of literature suggesting the benefits of Lean has accumulated [29]. Furthermore, ithas spread to all kinds of industries and application areas [30], including in retail [24,31–33].
This paper presents a successful continuous improvement project conducted in 2018 ata hypermarket store of a large multinational retail enterprise operating in Portugal. In thebackroom of this hypermarket there is a warehouse, managed by the E-Commerce divisionthat is used to store a set of fast-moving consumer goods, namely the 600 best-sellingproduct references and some high-volume items. The remaining items ordered online arepicked up at the store, including fresh food items. This project aimed at increasing theorder fulfilment rate achieved by the online business, which depends on the out-of-stock(OOS) rates in both the hypermarket store and the online warehouse. To reduce the OOSrate in the warehouse, a simple, but effective visual inventory management procedurewas introduced through the use of kanban cards. A decrease of the OOS rate focused onthe fruits and vegetables section, the most relevant fresh food market, by redesigning theexisting replenishment procedure using a value stream management (VSM) methodology.Kanban and VSM are two relevant approaches available from the Lean toolbox, and in thispaper a set of new VSM icons, that were specifically designed to suit the in-store operationalprocesses of commerce and retail, were introduced for the first time. By managing inventorymore effectively, as well as by ensuring greater efficiency in the replenishment of freshproducts, such as fruits and vegetables, the company was also able to reduce the negativeimpact of fresh food waste, thus contributing to an enhancement in its performance from asustainability point of view.
This paper also aims to demonstrate the applicability and advantages of employingLean concepts, methods and tools in a company from the retail sector. As far as the authorsare aware of, this is the first published case study describing an improvement project inthe Portuguese retail sector. Another contribution of the paper is the fact that it describeshow Lean can be used simultaneously to improve the performance of in-store operationsand processes from the E-Commerce business. Finally, it intends to explore how a kanbanpull system can contribute to a reduction in stockouts in a warehouse dedicated to onlinecommerce, hence driving an increase in the fulfilment rate of online orders. The paperis organized around four sections. In the next section a complete literature review isperformed. This is followed by the presentation of the case study, which comprises thedescription of the methodology adopted, the scope of the problem, the conduction ofdiagnosis analysis, the development and testing of solutions and the discussion of theresults. Finally, the main conclusions of the paper are summarized and suggestions forfuture research are proposed.
2. Literature Review
This section is divided into two subsections: the first is related to the literature reviewon Lean Management (VSM and kanban), while the second presents the literature on theapplications of Lean Management to retail.
Sustainability 2022, 14, 5913 3 of 19
2.1. Lean Management
The concept of Lean Management has its roots in the Toyota Production System (TPS),a manufacturing approach pioneered by the Japanese engineers Taiichi Ohno and ShigeoShingo [34–36]. The TPS working culture promotes the empowerment of teams and con-tinuous improvement (kaizen) practices, having been developed while Toyota was facingdifficulties that were jeopardizing its survival [37,38]. It is likely that the first formal docu-mentation on TPS were the supplier manuals published by Toyota’s Purchasing Adminis-tration Department (established in 1965), in order to teach suppliers about the requirementsfor operating a just-in-time (JIT) delivery system using the kanban concept [39,40]. Forover 30 years TPS or JIT were used interchangeably to refer to Ohno’s/Shingo’s efficientmanufacturing system [41]. The generic term “Lean Production” came into existence fromthe international motor vehicle program (IMVP) research at Massachusetts Institute ofTechnology, being first used by Krafcik [42] and popularized by Womack et al. [43] in “TheMachine that Changed the World”.
Widespread interest from western manufacturers did not begin until the early 1980s [28].However, since then, many Lean practices, grounded in TPS, have disseminated beyondToyota to other automakers and to all kinds of industries across the globe [29,30,37], includ-ing applications in non-manufacturing areas [31,35,44–46], such as in retail [22,24–26,32].Lean has also been successfully integrated with other management practices, including SixSigma [34,47]. Authors such as Yadav and Desai [48] and Singh and Rathi [49] provide acomplete review about the application of Lean Six Sigma in a wide range of sectors andbusiness activities.
It is possible to encounter diverse definitions for the concept of “Lean” in the publishedliterature [29,35,36]. In a simplistic way, Lean intends to create more value for the customerand to business, while reducing waste and cost factors for everyone [28,44,50]. The pre-vailing published literature describes Lean as an approach to systematically identify andeliminate waste (or muda in Japanese) in the organizational processes [29]. Historically, thefollowing seven types of waste have been identified [51]: unnecessary movement, excess oftransportation, waiting, inadequate inventory levels, overproduction, overprocessing, anddefects/errors/non-conformities. More recently, waste of human capital was added as aneighth type of waste [52].
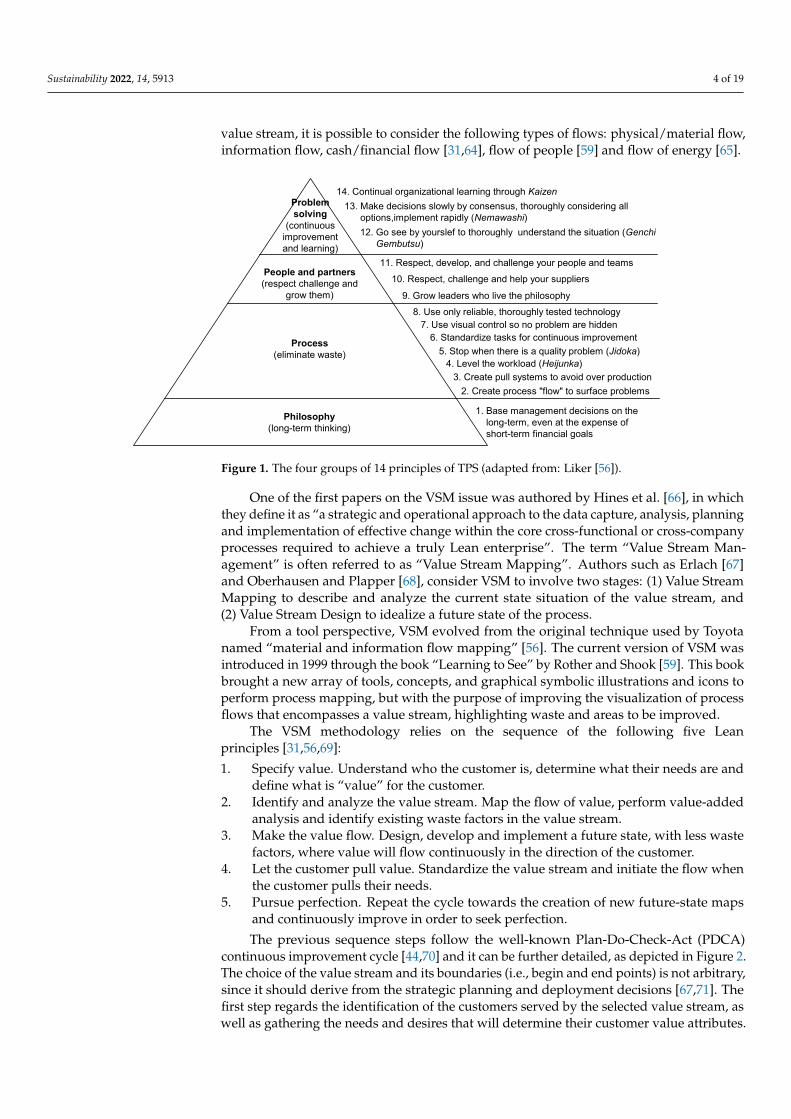
Although the focus on efficient waste-free flows remains at the center of Lean sys-tems [36], to ensure the long-term sustainability of the results of an organization, it mustbe regarded as a company-wide management system [29,41,50,53]. Many companies failto sustain and deploy their Lean programs because they misuse the application of thetools and practices with the system itself and its principles [54,55]. Liker [56] identified14 principles, clustered under four groups, and two pillars of TPS. The pillars are con-tinuous improvement (kaizen) and respect for people. Kaizen, the first pillar, is definedas a culture of sustained improvement targeting the elimination of waste in all systemsand processes of an organization [57]. The second pillar relies on respecting every singleindividual [55]. The 14 principles and their corresponding groups are depicted in Figure 1.
Lean offers a wide variety of tools and techniques, which can be effectively adoptedby any type of organization to eliminate anything that does not create value [57].
In the context of the case study presented in this paper, two tools assume particularrelevance: Value stream management (VSM) and kanban. Each of them will be discussedin the following subsections.
2.1.1. Value Stream Management—VSM
The concept of “value stream” is fundamental to Lean [58–60] and it refers to all the(value-added and non-value-added) activities that an organization needs to perform todesign and create its products or services and deliver to its customers [61,62]. Usually,value streams cross through multiple departments within an organization [56], providingan overview of the entire work processes and how they interact [63]. A value streamconsists of processes and each process consists of activities or tasks [51]. When managing a
Sustainability 2022, 14, 5913 4 of 19
value stream, it is possible to consider the following types of flows: physical/material flow,information flow, cash/financial flow [31,64], flow of people [59] and flow of energy [65].
Sustainability 2022, 14, x FOR PEER REVIEW 4 of 19
Figure 1. The four groups of 14 principles of TPS (adapted from: Liker [56]).
Lean offers a wide variety of tools and techniques, which can be effectively adopted
by any type of organization to eliminate anything that does not create value [57].
In the context of the case study presented in this paper, two tools assume particular
relevance: Value stream management (VSM) and kanban. Each of them will be discussed
in the following subsections.
2.1.1. Value Stream Management—VSM
The concept of “value stream” is fundamental to Lean [58–60] and it refers to all the
(value‐added and non‐value‐added) activities that an organization needs to perform to
design and create its products or services and deliver to its customers [61,62]. Usually,
value streams cross through multiple departments within an organization [56], providing
an overview of the entire work processes and how they interact [63]. A value stream con‐
sists of processes and each process consists of activities or tasks [51]. When managing a
value stream, it is possible to consider the following types of flows: physical/material flow,
information flow, cash/financial flow [31,64], flow of people [59] and flow of energy [65].
One of the first papers on the VSM issue was authored by Hines et al. [66], in which
they define it as “a strategic and operational approach to the data capture, analysis, plan‐
ning and implementation of effective change within the core cross‐functional or cross‐
company processes required to achieve a truly Lean enterprise”. The term “Value Stream
Management” is often referred to as “Value Stream Mapping”. Authors such as Erlach
[67] and Oberhausen and Plapper [68], consider VSM to involve two stages: (1) Value
Stream Mapping to describe and analyze the current state situation of the value stream,
and (2) Value Stream Design to idealize a future state of the process.
From a tool perspective, VSM evolved from the original technique used by Toyota
named “material and information flow mapping” [56]. The current version of VSM was
introduced in 1999 through the book “Learning to See” by Rother and Shook [59]. This
book brought a new array of tools, concepts, and graphical symbolic illustrations and
icons to perform process mapping, but with the purpose of improving the visualization
of process flows that encompasses a value stream, highlighting waste and areas to be im‐
proved.
The VSM methodology relies on the sequence of the following five Lean principles
[31,56,69]:
1. Specify value. Understand who the customer is, determine what their needs are and
define what is “value” for the customer.
Problemsolving
(continuousimprovementand learning)
People and partners(respect challenge and
grow them)
Process(eliminate waste)
Philosophy(long-term thinking)
1. Base management decisions on the long-term, even at the expense of short-term financial goals
2. Create process "flow" to surface problems
3. Create pull systems to avoid over production
4. Level the workload (Heijunka)5. Stop when there is a quality problem (Jidoka)
6. Standardize tasks for continuous improvement7. Use visual control so no problem are hidden
8. Use only reliable, thoroughly tested technology
9. Grow leaders who live the philosophy
10. Respect, challenge and help your suppliers
11. Respect, develop, and challenge your people and teams
12. Go see by yourslef to thoroughly understand the situation (Genchi Gembutsu)
13. Make decisions slowly by consensus, thoroughly considering all options,implement rapidly (Nemawashi)
14. Continual organizational learning through Kaizen
Figure 1. The four groups of 14 principles of TPS (adapted from: Liker [56]).
One of the first papers on the VSM issue was authored by Hines et al. [66], in whichthey define it as “a strategic and operational approach to the data capture, analysis, planningand implementation of effective change within the core cross-functional or cross-companyprocesses required to achieve a truly Lean enterprise”. The term “Value Stream Man-agement” is often referred to as “Value Stream Mapping”. Authors such as Erlach [67]and Oberhausen and Plapper [68], consider VSM to involve two stages: (1) Value StreamMapping to describe and analyze the current state situation of the value stream, and(2) Value Stream Design to idealize a future state of the process.
From a tool perspective, VSM evolved from the original technique used by Toyotanamed “material and information flow mapping” [56]. The current version of VSM wasintroduced in 1999 through the book “Learning to See” by Rother and Shook [59]. This bookbrought a new array of tools, concepts, and graphical symbolic illustrations and icons toperform process mapping, but with the purpose of improving the visualization of processflows that encompasses a value stream, highlighting waste and areas to be improved.
The VSM methodology relies on the sequence of the following five Leanprinciples [31,56,69]:
1. Specify value. Understand who the customer is, determine what their needs are anddefine what is “value” for the customer.
2. Identify and analyze the value stream. Map the flow of value, perform value-addedanalysis and identify existing waste factors in the value stream.
3. Make the value flow. Design, develop and implement a future state, with less wastefactors, where value will flow continuously in the direction of the customer.
4. Let the customer pull value. Standardize the value stream and initiate the flow whenthe customer pulls their needs.
5. Pursue perfection. Repeat the cycle towards the creation of new future-state mapsand continuously improve in order to seek perfection.
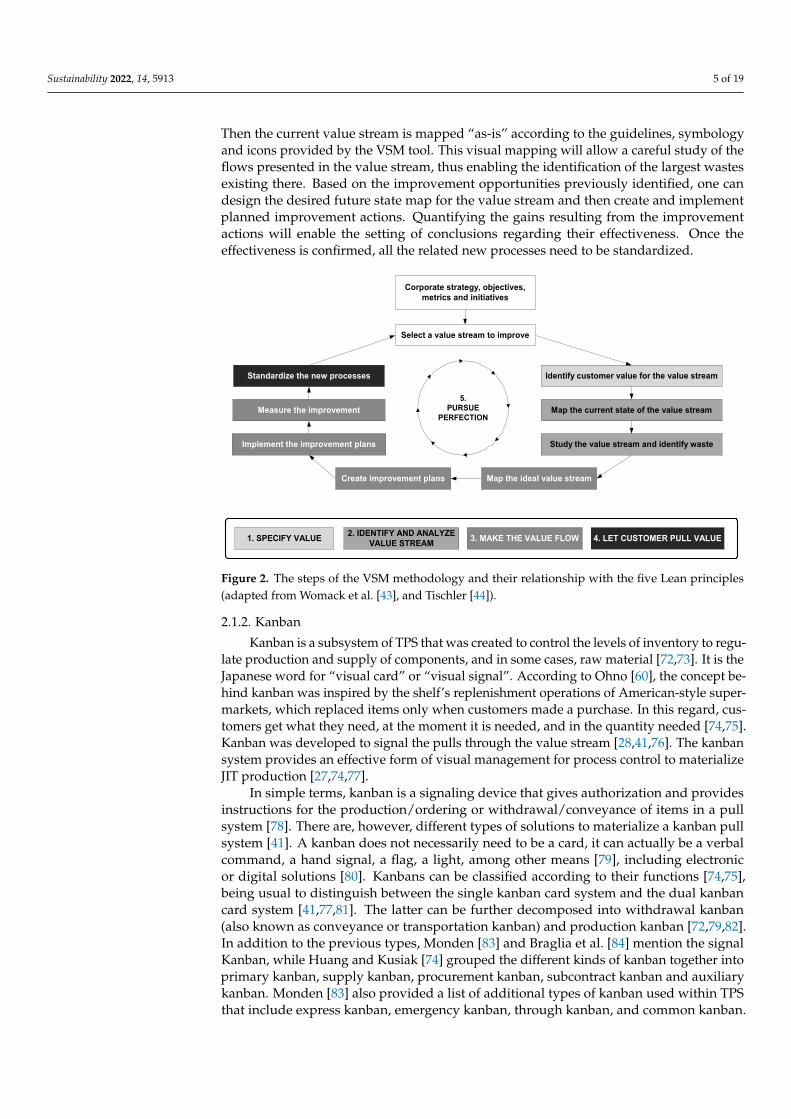
The previous sequence steps follow the well-known Plan-Do-Check-Act (PDCA)continuous improvement cycle [44,70] and it can be further detailed, as depicted in Figure 2.The choice of the value stream and its boundaries (i.e., begin and end points) is not arbitrary,since it should derive from the strategic planning and deployment decisions [67,71]. Thefirst step regards the identification of the customers served by the selected value stream, aswell as gathering the needs and desires that will determine their customer value attributes.
Sustainability 2022, 14, 5913 5 of 19
Then the current value stream is mapped “as-is” according to the guidelines, symbologyand icons provided by the VSM tool. This visual mapping will allow a careful study of theflows presented in the value stream, thus enabling the identification of the largest wastesexisting there. Based on the improvement opportunities previously identified, one candesign the desired future state map for the value stream and then create and implementplanned improvement actions. Quantifying the gains resulting from the improvementactions will enable the setting of conclusions regarding their effectiveness. Once theeffectiveness is confirmed, all the related new processes need to be standardized.
Sustainability 2022, 14, x FOR PEER REVIEW 5 of 19
2. Identify and analyze the value stream. Map the flow of value, perform value‐added
analysis and identify existing waste factors in the value stream.
3. Make the value flow. Design, develop and implement a future state, with less waste
factors, where value will flow continuously in the direction of the customer.
4. Let the customer pull value. Standardize the value stream and initiate the flow when
the customer pulls their needs.
5. Pursue perfection. Repeat the cycle towards the creation of new future‐state maps
and continuously improve in order to seek perfection.
The previous sequence steps follow the well‐known Plan‐Do‐Check‐Act (PDCA)
continuous improvement cycle [44,70] and it can be further detailed, as depicted in Figure
2. The choice of the value stream and its boundaries (i.e., begin and end points) is not
arbitrary, since it should derive from the strategic planning and deployment decisions
[67,71]. The first step regards the identification of the customers served by the selected
value stream, as well as gathering the needs and desires that will determine their customer
value attributes. Then the current value stream is mapped “as‐is” according to the guide‐
lines, symbology and icons provided by the VSM tool. This visual mapping will allow a
careful study of the flows presented in the value stream, thus enabling the identification
of the largest wastes existing there. Based on the improvement opportunities previously
identified, one can design the desired future state map for the value stream and then cre‐
ate and implement planned improvement actions. Quantifying the gains resulting from
the improvement actions will enable the setting of conclusions regarding their effective‐
ness. Once the effectiveness is confirmed, all the related new processes need to be stand‐
ardized.
Figure 2. The steps of the VSM methodology and their relationship with the five Lean principles
(adapted from Womack et al. [43], and Tischler [44]).
2.1.2. Kanban
Kanban is a subsystem of TPS that was created to control the levels of inventory to
regulate production and supply of components, and in some cases, raw material [72,73].
It is the Japanese word for “visual card” or “visual signal”. According to Ohno [60], the
concept behind kanban was inspired by the shelf’s replenishment operations of American‐
style supermarkets, which replaced items only when customers made a purchase. In this
regard, customers get what they need, at the moment it is needed, and in the quantity
needed [74,75]. Kanban was developed to signal the pulls through the value stream
Corporate strategy, objectives,metrics and initiatives
Select a value stream to improve
Identify customer value for the value stream
Map the current state of the value stream
Study the value stream and identify waste
Map the ideal value streamCreate improvement plans
Implement the improvement plans
Measure the improvement
Standardize the new processes
1. SPECIFY VALUE2. IDENTIFY AND ANALYZE
VALUE STREAM3. MAKE THE VALUE FLOW 4. LET CUSTOMER PULL VALUE
5.PURSUE
PERFECTION
Figure 2. The steps of the VSM methodology and their relationship with the five Lean principles(adapted from Womack et al. [43], and Tischler [44]).
2.1.2. Kanban
Kanban is a subsystem of TPS that was created to control the levels of inventory to regu-late production and supply of components, and in some cases, raw material [72,73]. It is theJapanese word for “visual card” or “visual signal”. According to Ohno [60], the concept be-hind kanban was inspired by the shelf’s replenishment operations of American-style super-markets, which replaced items only when customers made a purchase. In this regard, cus-tomers get what they need, at the moment it is needed, and in the quantity needed [74,75].Kanban was developed to signal the pulls through the value stream [28,41,76]. The kanbansystem provides an effective form of visual management for process control to materializeJIT production [27,74,77].
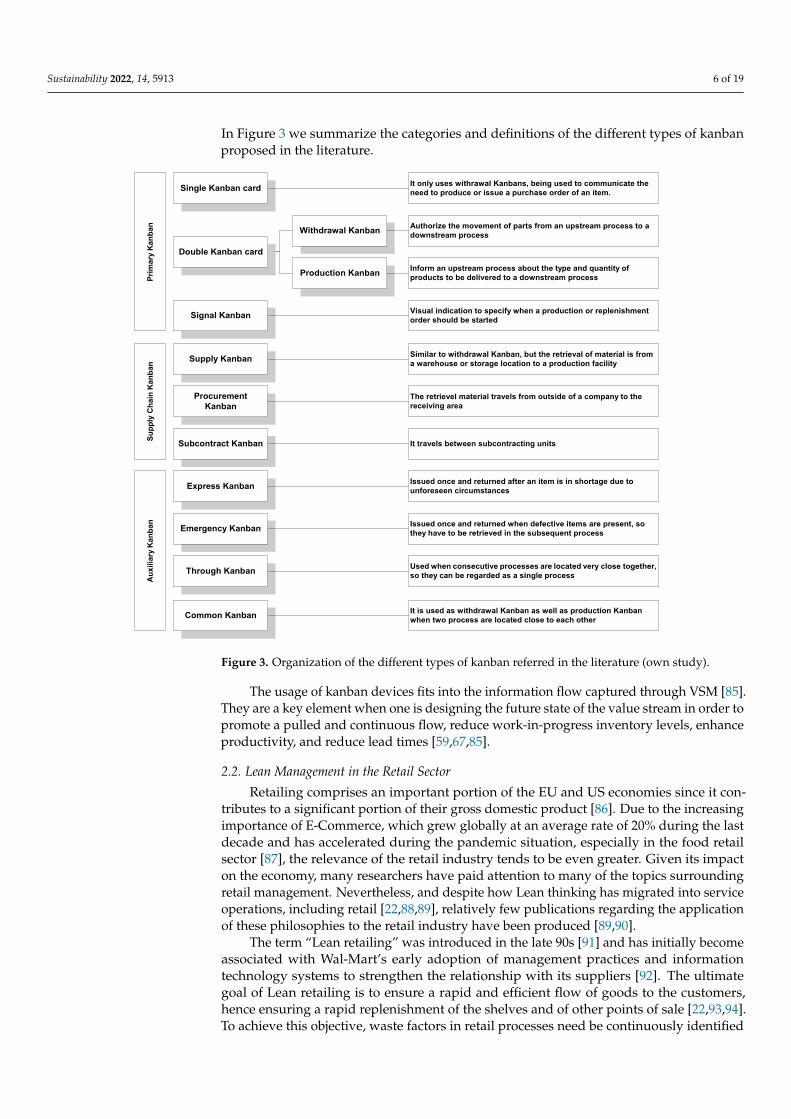
In simple terms, kanban is a signaling device that gives authorization and providesinstructions for the production/ordering or withdrawal/conveyance of items in a pullsystem [78]. There are, however, different types of solutions to materialize a kanban pullsystem [41]. A kanban does not necessarily need to be a card, it can actually be a verbalcommand, a hand signal, a flag, a light, among other means [79], including electronicor digital solutions [80]. Kanbans can be classified according to their functions [74,75],being usual to distinguish between the single kanban card system and the dual kanbancard system [41,77,81]. The latter can be further decomposed into withdrawal kanban(also known as conveyance or transportation kanban) and production kanban [72,79,82].In addition to the previous types, Monden [83] and Braglia et al. [84] mention the signalKanban, while Huang and Kusiak [74] grouped the different kinds of kanban together intoprimary kanban, supply kanban, procurement kanban, subcontract kanban and auxiliarykanban. Monden [83] also provided a list of additional types of kanban used within TPSthat include express kanban, emergency kanban, through kanban, and common kanban.
Sustainability 2022, 14, 5913 6 of 19
In Figure 3 we summarize the categories and definitions of the different types of kanbanproposed in the literature.
Sustainability 2022, 14, x FOR PEER REVIEW 6 of 19
[28,41,76]. The kanban system provides an effective form of visual management for pro‐
cess control to materialize JIT production [27,74,77].
In simple terms, kanban is a signaling device that gives authorization and provides
instructions for the production/ordering or withdrawal/conveyance of items in a pull sys‐
tem [78]. There are, however, different types of solutions to materialize a kanban pull sys‐
tem [41]. A kanban does not necessarily need to be a card, it can actually be a verbal com‐
mand, a hand signal, a flag, a light, among other means [79], including electronic or digital
solutions [80]. Kanbans can be classified according to their functions [74,75], being usual
to distinguish between the single kanban card system and the dual kanban card system
[41,77,81]. The latter can be further decomposed into withdrawal kanban (also known as
conveyance or transportation kanban) and production kanban [72,79,82]. In addition to
the previous types, Monden [83] and Braglia et al. [84] mention the signal Kanban, while
Huang and Kusiak [74] grouped the different kinds of kanban together into primary kan‐
ban, supply kanban, procurement kanban, subcontract kanban and auxiliary kanban.
Monden [83] also provided a list of additional types of kanban used within TPS that in‐
clude express kanban, emergency kanban, through kanban, and common kanban. In Fig‐
ure 3 we summarize the categories and definitions of the different types of kanban pro‐
posed in the literature.
The usage of kanban devices fits into the information flow captured through VSM
[85]. They are a key element when one is designing the future state of the value stream in
order to promote a pulled and continuous flow, reduce work‐in‐progress inventory levels,
enhance productivity, and reduce lead times [59,67,85].
Figure 3. Organization of the different types of kanban referred in the literature (own study).
It only uses withrawal Kanbans, being used to communicate theneed to produce or issue a purchase order of an item.
Withdrawal Kanban
Production Kanban
Single Kanban card
Double Kanban card
Authorize the movement of parts from an upstream process to adownstream process
Inform an upstream process about the type and quantity ofproducts to be delivered to a downstream process
Signal KanbanVisual indication to specify when a production or replenishmentorder should be started
Pri
mary
Ka
nb
an
Supply Kanban
Su
pp
ly C
hai
n K
anb
an
ProcurementKanban
Similar to withdrawal Kanban, but the retrieval of material is froma warehouse or storage location to a production facility
Au
xili
ary
Kan
ban
The retrievel material travels from outside of a company to thereceiving area
Subcontract Kanban It travels between subcontracting units
Express KanbanIssued once and returned after an item is in shortage due tounforeseen circumstances
Emergency KanbanIssued once and returned when defective items are present, sothey have to be retrieved in the subsequent process
Through KanbanUsed when consecutive processes are located very close together,so they can be regarded as a single process
Common KanbanIt is used as withdrawal Kanban as well as production Kanbanwhen two process are located close to each other
Figure 3. Organization of the different types of kanban referred in the literature (own study).
The usage of kanban devices fits into the information flow captured through VSM [85].They are a key element when one is designing the future state of the value stream in order topromote a pulled and continuous flow, reduce work-in-progress inventory levels, enhanceproductivity, and reduce lead times [59,67,85].
2.2. Lean Management in the Retail Sector
Retailing comprises an important portion of the EU and US economies since it con-tributes to a significant portion of their gross domestic product [86]. Due to the increasingimportance of E-Commerce, which grew globally at an average rate of 20% during the lastdecade and has accelerated during the pandemic situation, especially in the food retailsector [87], the relevance of the retail industry tends to be even greater. Given its impacton the economy, many researchers have paid attention to many of the topics surroundingretail management. Nevertheless, and despite how Lean thinking has migrated into serviceoperations, including retail [22,88,89], relatively few publications regarding the applicationof these philosophies to the retail industry have been produced [89,90].
The term “Lean retailing” was introduced in the late 90s [91] and has initially becomeassociated with Wal-Mart’s early adoption of management practices and informationtechnology systems to strengthen the relationship with its suppliers [92]. The ultimategoal of Lean retailing is to ensure a rapid and efficient flow of goods to the customers,hence ensuring a rapid replenishment of the shelves and of other points of sale [22,93,94].To achieve this objective, waste factors in retail processes need be continuously identified
Sustainability 2022, 14, 5913 7 of 19
and eliminated, from in-store operations to the whole upstream processes that comprisethe retail supply chain [95]. The key is therefore to manage and continuously improve theretail value streams towards the implementation of a “pull” replenishment that will enablethe achievement of high levels of product availability [22,27,31,94].
Retailing is a service industry that is embracing Lean thinking [24,31,32,96], often ledby well-known retail companies. Wal-Mart, the world’s largest retail company, and Tesco,the leading UK retailer, have become famous examples of the adoption of Lean principles inthis sector [93]. By developing closer supplier relationships and communication, as well asimproving distribution and logistics processes under a “pull” vision, these two giants havebeen able to increase their levels of service to consumers, while reducing inventory andoperational costs [24,91]. The Spanish supermarket giant Mercadona is another example ofintegrating Lean into its operations and processes. Its business model is organized aroundthe customer, which the company calls “the boss” [97]. This stance is supported by theimplementation of excellent operations management principles that focus on eliminatingeverything that does not add value to the consumer [96]. In addition to well-designedprocesses, well-treated and well-trained people in all core operational processes are keyelements of Mercadona’s model [98]. Naruo and Toma [32] studied how Lean principlesand concepts were successfully applied in Seven-Eleven Japan and describes the outcome ofsome projects that contributed to an increase in the integration of processes from orderingto delivery, enhanced service levels, boosted sales and reduced inventory levels. Onetto [99]outlined how Lean continuous improvement (Kaizen) practices adopted at Amazon fit intothe already existing culture of the company. The implementation of daily managementand kaizen activities at Sonae MC, a leading company that owns more than 300 hyper-and supermarkets in Portugal, was reported by Imai [33]. Based on another three articlesMyerson [24] summarizes the adoption of the Lean approach at Starbucks to excel customerexperience. The author illustrates the application of a set of Lean practices, including visualmanagement solutions, as well as actions to improve and standardize operational processes.Robinson [100] describes five ways that Zara used Lean to achieve competitive advantagesover other fashion retailers, including the adoption of kanban systems to accomplish pulledworkflows in their processes.
There are also a number of case studies in the literature reporting the developmentof improvement initiatives in the retail sector that make use of Lean principles, methodsand tools. Jaca et al. [90] describe a Lean project, conducted at a distribution center, thatenhanced the productivity rate. In a study conducted by Domingo [101] in a South Africanretailer, the author determined that about 70% of out-of-stock situations were caused bythe stores themselves while only 30% was driven by operational inefficiencies outside thestores. Noda [23] describes aspects of an operational and business Lean transformationthat occurred in a mid-size Japanese retailer that sold foods, consumables, apparels, andgeneral merchandise goods. The authors also describe how the company adopted stan-dardized work and process improvement practices based on Lean principles. Evans andLindsay [102] refer to a Kaizen event conducted at the retail services of Magnivision toinvestigate the causes of problems that continually plagued employees. Özkavukcu andDurmusoglu [103] illustrate how hoshin kanri, a Lean method for strategic planning anddeployment can be applied at Migros Ticaret A.S, a Turkish food retailer. Eklund [104]reported a study involving nine stores in Sweden where Lean methods were applied toreduce food waste in the fresh food markets. More recently, Abdelhadi [105] conductedresearch to study how Lean methods and tools can be utilized to prevent the spread ofSARS-CoV-2 in a retail store.
3. Case Study
The case study was conducted in one store of a multinational retailer located nearLisbon, in Portugal, in 2018. The data date back to 2018, so the research results werenot influenced by COVID-19. In addition to the physical store, the hypermarket uses anE-Commerce warehouse to supply most of the Lisbon metropolitan area. In this warehouse
Sustainability 2022, 14, 5913 8 of 19
600 best-selling, fast-moving consumer goods product references are stored and some high-volume items that are picked up when a customer places an online order. The remainingitems ordered online by a customer are picked up at the store, including items from the freshfood section. This case study aimed at increasing the “order fulfilment rate” accomplishedby the online commerce business. This key performance indicator (KPI) is a metric thatmeasures the service level provided to the customer.
3.1. Problem Statement
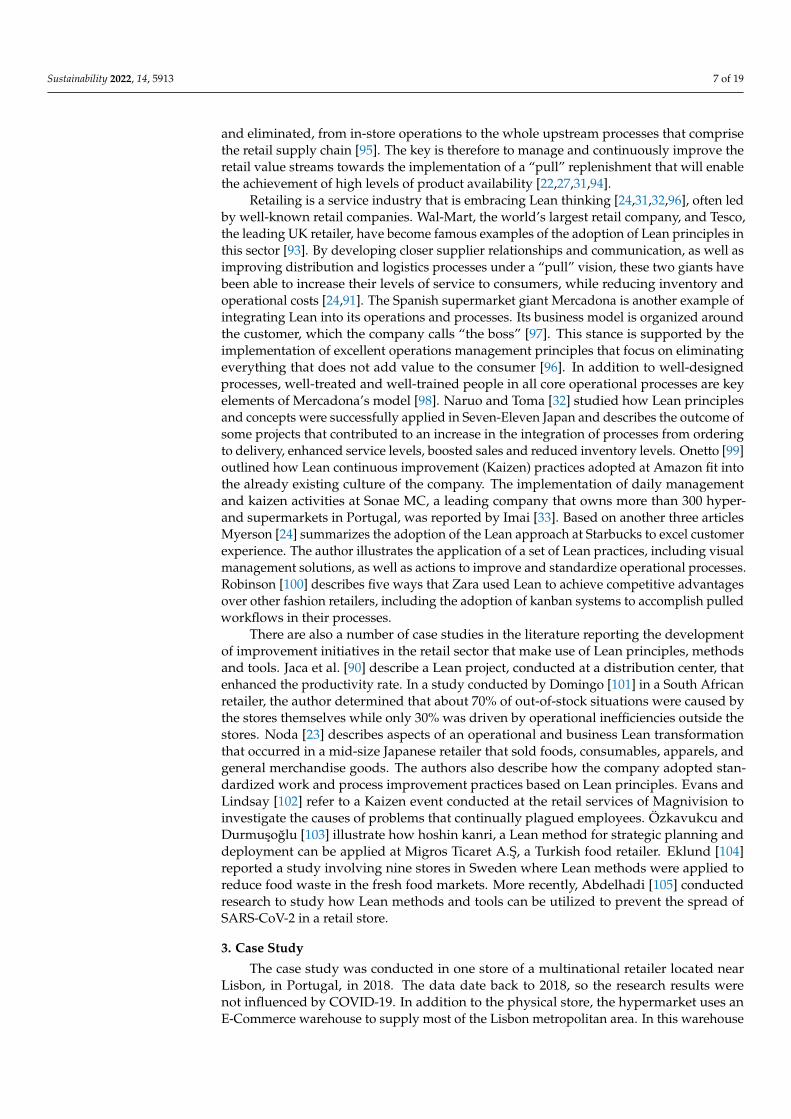
The performance regarding the order fulfilment rate was considered to be poor (<93%).The results for this indicator show a deterioration in performance compared to the previousyear and the outlined objective of 95% was far from being achieved. To better understandthe factors that most contributed to a change in the value of the order fulfilment rate, theproject team developed the construction of a KPI tree, exhibited in Figure 4.
Sustainability 2022, 14, x FOR PEER REVIEW 8 of 19
general merchandise goods. The authors also describe how the company adopted stand‐
ardized work and process improvement practices based on Lean principles. Evans and
Lindsay [102] refer to a Kaizen event conducted at the retail services of Magnivision to
investigate the causes of problems that continually plagued employees. Özkavukcu and
Durmuşoğlu [103] illustrate how hoshin kanri, a Lean method for strategic planning and
deployment can be applied at Migros Ticaret A.Ş, a Turkish food retailer. Eklund [104]
reported a study involving nine stores in Sweden where Lean methods were applied to
reduce food waste in the fresh food markets. More recently, Abdelhadi [105] conducted
research to study how Lean methods and tools can be utilized to prevent the spread of
SARS‐CoV‐2 in a retail store.
3. Case Study
The case study was conducted in one store of a multinational retailer located near
Lisbon, in Portugal, in 2018. The data date back to 2018, so the research results were not
influenced by COVID‐19. In addition to the physical store, the hypermarket uses an E‐
Commerce warehouse to supply most of the Lisbon metropolitan area. In this warehouse
600 best‐selling, fast‐moving consumer goods product references are stored and some
high‐volume items that are picked up when a customer places an online order. The re‐
maining items ordered online by a customer are picked up at the store, including items
from the fresh food section. This case study aimed at increasing the “order fulfilment rate”
accomplished by the online commerce business. This key performance indicator (KPI) is
a metric that measures the service level provided to the customer.
3.1. Problem Statement
The performance regarding the order fulfilment rate was considered to be poor
(<93%). The results for this indicator show a deterioration in performance compared to
the previous year and the outlined objective of 95% was far from being achieved. To better
understand the factors that most contributed to a change in the value of the order fulfil‐
ment rate, the project team developed the construction of a KPI tree, exhibited in Figure
4.
Figure 4. KPI tree used to determine the scope and boundaries of the Lean project (own study).
This shows that, to increase the order fulfilment rate, it is necessary to reduce the
number of out‐of‐stocks in the physical store, as well as in the warehouse belonging to the
Order FulfilmentRate
Out‐Of‐Stocks (OOS) inWarehouse of E‐Commerce
Out‐Of‐Stocks (OOS) inphysical store
Out‐Of‐Stocks (OOS) inFresh Food markets
Out‐Of‐Stocks (OOS) inFMCG markets
Fruits& Vegetables
Cheese
& Cold
MEat
Butchery
Other
Out‐Of‐Stocks (OOS)in
F&V market
Figure 4. KPI tree used to determine the scope and boundaries of the Lean project (own study).
This shows that, to increase the order fulfilment rate, it is necessary to reduce thenumber of out-of-stocks in the physical store, as well as in the warehouse belongingto the E-Commerce division. Given that the warehouse stores the main references ofFMCG products, the team decided to concentrate efforts on the fresh products division.Within this division, the fruits and vegetables (FV) market was the one with the highestincidence of stockouts. The occurrence of stockouts, in its turn, depends on how effectivethe replenishment processes are to ensure an adequate on-shelf availability. Given theabove, the team decided to focus improvement efforts on reducing the number of OOS intwo areas:
1. The warehouse of E-Commerce.2. The market of F V in the physical store.
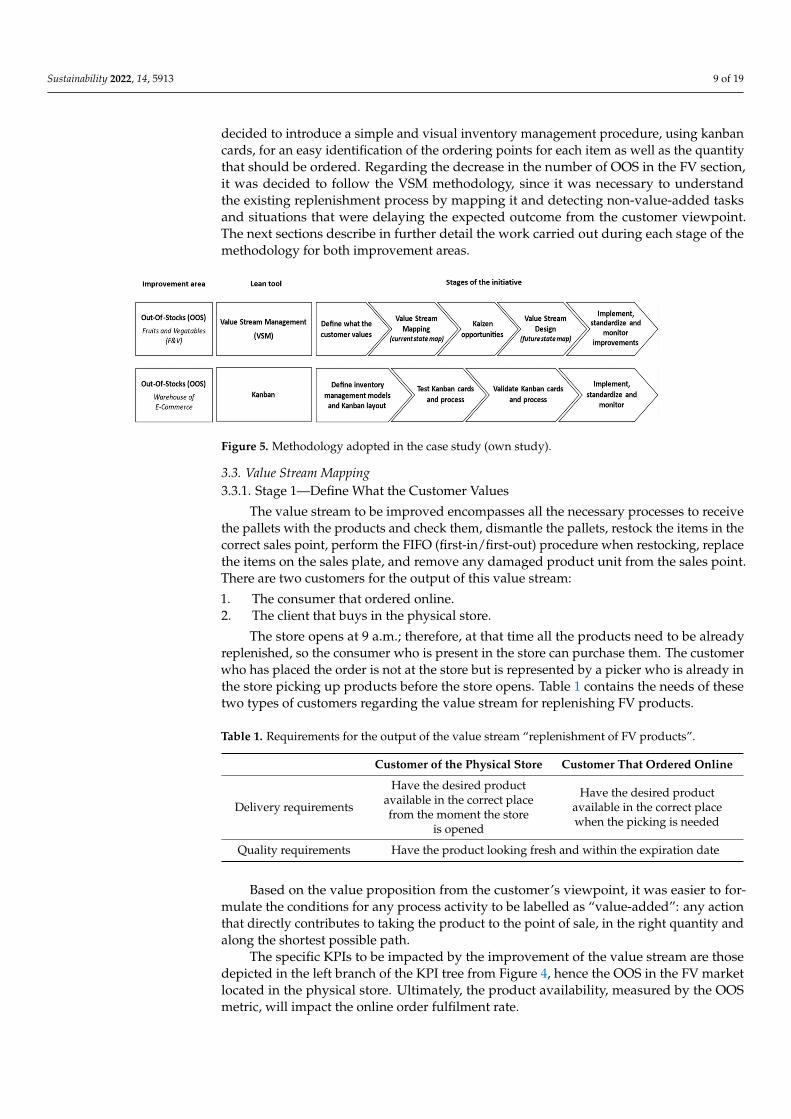
3.2. Methodology
The methodology is depicted in Figure 5, being the branch set for the FV marketaligned with the predominant VSM approach proposed by the relevant literature, asdescribed in Section 2.1.1, while the second branch that regards the implementation ofkanban cards in the E-Commerce warehouse was specifically proposed under this research.It captures not only the sequence of stages that were followed during both initiatives, butalso the Lean approach or tool that was adopted. To reduce OOS in the warehouse it was
Sustainability 2022, 14, 5913 9 of 19
decided to introduce a simple and visual inventory management procedure, using kanbancards, for an easy identification of the ordering points for each item as well as the quantitythat should be ordered. Regarding the decrease in the number of OOS in the FV section,it was decided to follow the VSM methodology, since it was necessary to understandthe existing replenishment process by mapping it and detecting non-value-added tasksand situations that were delaying the expected outcome from the customer viewpoint.The next sections describe in further detail the work carried out during each stage of themethodology for both improvement areas.
Sustainability 2022, 14, x FOR PEER REVIEW 9 of 19
E‐Commerce division. Given that the warehouse stores the main references of FMCG
products, the team decided to concentrate efforts on the fresh products division. Within
this division, the fruits and vegetables (FV) market was the one with the highest incidence
of stockouts. The occurrence of stockouts, in its turn, depends on how effective the replen‐
ishment processes are to ensure an adequate on‐shelf availability. Given the above, the
team decided to focus improvement efforts on reducing the number of OOS in two areas:
1. The warehouse of E‐Commerce.
2. The market of F V in the physical store.
3.2. Methodology
The methodology is depicted in Figure 5, being the branch set for the FV market
aligned with the predominant VSM approach proposed by the relevant literature, as de‐
scribed in Section 2.1.1, while the second branch that regards the implementation of kan‐
ban cards in the E‐Commerce warehouse was specifically proposed under this research.
It captures not only the sequence of stages that were followed during both initiatives, but
also the Lean approach or tool that was adopted. To reduce OOS in the warehouse it was
decided to introduce a simple and visual inventory management procedure, using kanban
cards, for an easy identification of the ordering points for each item as well as the quantity
that should be ordered. Regarding the decrease in the number of OOS in the FV section,
it was decided to follow the VSM methodology, since it was necessary to understand the
existing replenishment process by mapping it and detecting non‐value‐added tasks and
situations that were delaying the expected outcome from the customer viewpoint. The
next sections describe in further detail the work carried out during each stage of the meth‐
odology for both improvement areas.
Figure 5. Methodology adopted in the case study (own study).
3.3. Value Stream Mapping
3.3.1. Stage 1—Define What the Customer Values
The value stream to be improved encompasses all the necessary processes to receive
the pallets with the products and check them, dismantle the pallets, restock the items in
the correct sales point, perform the FIFO (first‐in/first‐out) procedure when restocking,
replace the items on the sales plate, and remove any damaged product unit from the sales
point. There are two customers for the output of this value stream:
1. The consumer that ordered online.
2. The client that buys in the physical store.
The store opens at 9 a.m.; therefore, at that time all the products need to be already
replenished, so the consumer who is present in the store can purchase them. The customer
who has placed the order is not at the store but is represented by a picker who is already
in the store picking up products before the store opens. Table 1 contains the needs of these
two types of customers regarding the value stream for replenishing FV products.
Based on the value proposition from the customer’s viewpoint, it was easier to for‐
mulate the conditions for any process activity to be labelled as “value‐added”: any action
Figure 5. Methodology adopted in the case study (own study).
3.3. Value Stream Mapping3.3.1. Stage 1—Define What the Customer Values
The value stream to be improved encompasses all the necessary processes to receivethe pallets with the products and check them, dismantle the pallets, restock the items in thecorrect sales point, perform the FIFO (first-in/first-out) procedure when restocking, replacethe items on the sales plate, and remove any damaged product unit from the sales point.There are two customers for the output of this value stream:
1. The consumer that ordered online.2. The client that buys in the physical store.
The store opens at 9 a.m.; therefore, at that time all the products need to be alreadyreplenished, so the consumer who is present in the store can purchase them. The customerwho has placed the order is not at the store but is represented by a picker who is already inthe store picking up products before the store opens. Table 1 contains the needs of thesetwo types of customers regarding the value stream for replenishing FV products.
Table 1. Requirements for the output of the value stream “replenishment of FV products”.
Customer of the Physical Store Customer That Ordered Online
Delivery requirements
Have the desired productavailable in the correct placefrom the moment the store
is opened
Have the desired productavailable in the correct placewhen the picking is needed
Quality requirements Have the product looking fresh and within the expiration date
Based on the value proposition from the customer’s viewpoint, it was easier to for-mulate the conditions for any process activity to be labelled as “value-added”: any actionthat directly contributes to taking the product to the point of sale, in the right quantity andalong the shortest possible path.
The specific KPIs to be impacted by the improvement of the value stream are thosedepicted in the left branch of the KPI tree from Figure 4, hence the OOS in the FV marketlocated in the physical store. Ultimately, the product availability, measured by the OOSmetric, will impact the online order fulfilment rate.
Sustainability 2022, 14, 5913 10 of 19
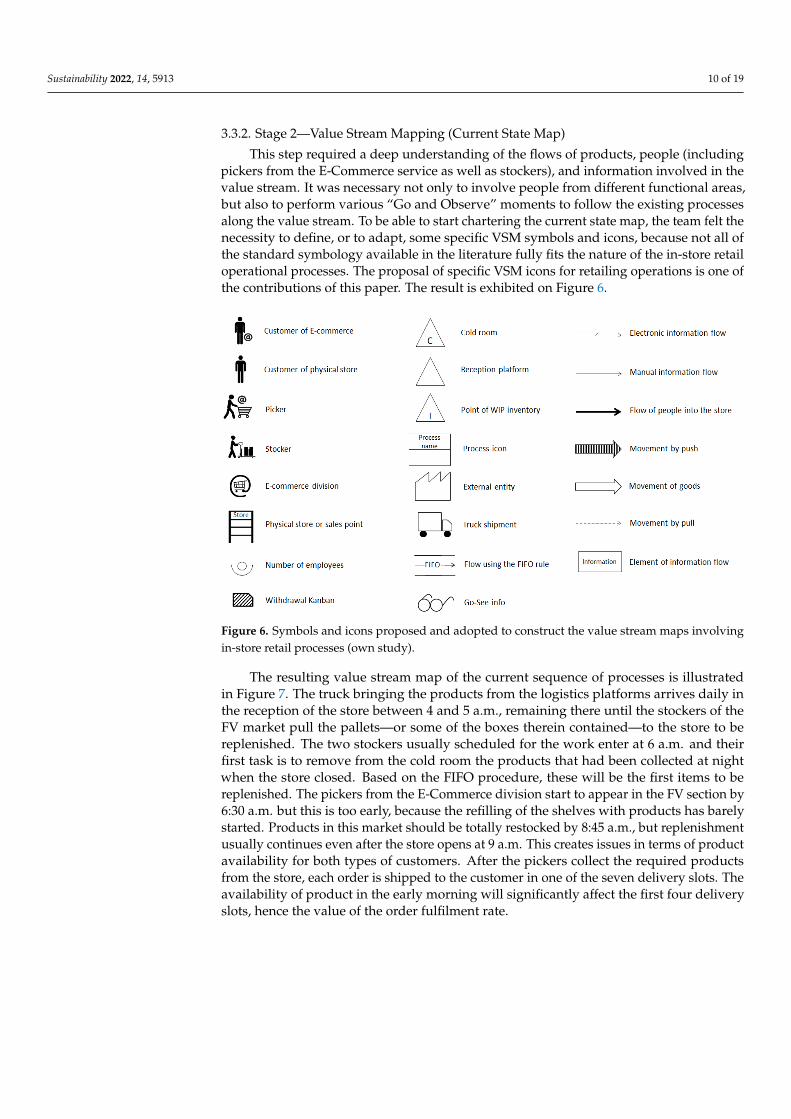
3.3.2. Stage 2—Value Stream Mapping (Current State Map)
This step required a deep understanding of the flows of products, people (includingpickers from the E-Commerce service as well as stockers), and information involved in thevalue stream. It was necessary not only to involve people from different functional areas,but also to perform various “Go and Observe” moments to follow the existing processesalong the value stream. To be able to start chartering the current state map, the team felt thenecessity to define, or to adapt, some specific VSM symbols and icons, because not all ofthe standard symbology available in the literature fully fits the nature of the in-store retailoperational processes. The proposal of specific VSM icons for retailing operations is one ofthe contributions of this paper. The result is exhibited on Figure 6.
Sustainability 2022, 14, x FOR PEER REVIEW 10 of 19
that directly contributes to taking the product to the point of sale, in the right quantity
and along the shortest possible path.
Table 1. Requirements for the output of the value stream “replenishment of FV products”.
Customer of the Physical Store Customer That Ordered Online
Delivery re‐
quirements
Have the desired product available
in the correct place from the mo‐
ment the store is opened
Have the desired product available
in the correct place when the pick‐
ing is needed
Quality re‐
quirements Have the product looking fresh and within the expiration date
The specific KPIs to be impacted by the improvement of the value stream are those
depicted in the left branch of the KPI tree from Figure 4, hence the OOS in the FV market
located in the physical store. Ultimately, the product availability, measured by the OOS
metric, will impact the online order fulfilment rate.
3.3.2. Stage 2—Value Stream Mapping (Current State Map)
This step required a deep understanding of the flows of products, people (including
pickers from the E‐Commerce service as well as stockers), and information involved in
the value stream. It was necessary not only to involve people from different functional
areas, but also to perform various “Go and Observe” moments to follow the existing pro‐
cesses along the value stream. To be able to start chartering the current state map, the team
felt the necessity to define, or to adapt, some specific VSM symbols and icons, because not
all of the standard symbology available in the literature fully fits the nature of the in‐store
retail operational processes. The proposal of specific VSM icons for retailing operations is
one of the contributions of this paper. The result is exhibited on Figure 6.
Figure 6. Symbols and icons proposed and adopted to construct the value stream maps involving
in‐store retail processes (own study).
The resulting value stream map of the current sequence of processes is illustrated in
Figure 7. The truck bringing the products from the logistics platforms arrives daily in the
reception of the store between 4 and 5 a.m., remaining there until the stockers of the FV
market pull the pallets—or some of the boxes therein contained—to the store to be replen‐
ished. The two stockers usually scheduled for the work enter at 6 a.m. and their first task
Figure 6. Symbols and icons proposed and adopted to construct the value stream maps involvingin-store retail processes (own study).
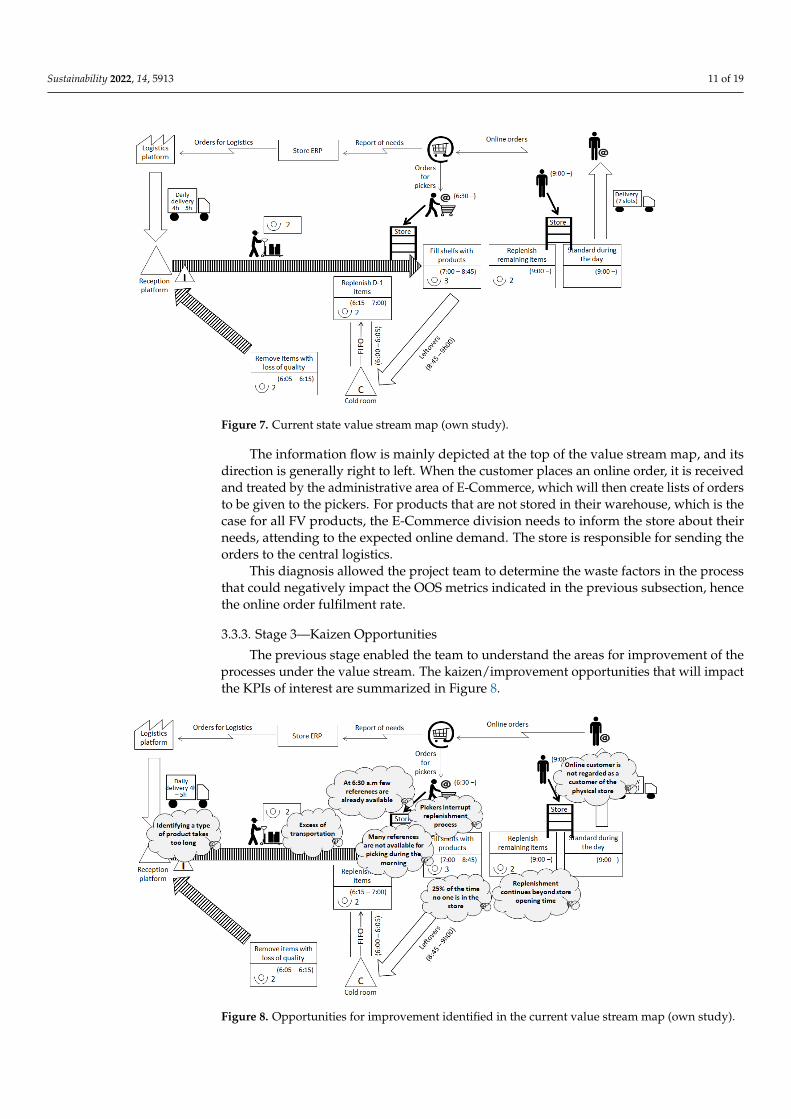
The resulting value stream map of the current sequence of processes is illustratedin Figure 7. The truck bringing the products from the logistics platforms arrives daily inthe reception of the store between 4 and 5 a.m., remaining there until the stockers of theFV market pull the pallets—or some of the boxes therein contained—to the store to bereplenished. The two stockers usually scheduled for the work enter at 6 a.m. and theirfirst task is to remove from the cold room the products that had been collected at nightwhen the store closed. Based on the FIFO procedure, these will be the first items to bereplenished. The pickers from the E-Commerce division start to appear in the FV section by6:30 a.m. but this is too early, because the refilling of the shelves with products has barelystarted. Products in this market should be totally restocked by 8:45 a.m., but replenishmentusually continues even after the store opens at 9 a.m. This creates issues in terms of productavailability for both types of customers. After the pickers collect the required productsfrom the store, each order is shipped to the customer in one of the seven delivery slots. Theavailability of product in the early morning will significantly affect the first four deliveryslots, hence the value of the order fulfilment rate.
Sustainability 2022, 14, 5913 11 of 19
Sustainability 2022, 14, x FOR PEER REVIEW 11 of 19
is to remove from the cold room the products that had been collected at night when the
store closed. Based on the FIFO procedure, these will be the first items to be replenished.
The pickers from the E‐Commerce division start to appear in the FV section by 6:30 a.m.
but this is too early, because the refilling of the shelves with products has barely started.
Products in this market should be totally restocked by 8:45 a.m., but replenishment usu‐
ally continues even after the store opens at 9 a.m. This creates issues in terms of product
availability for both types of customers. After the pickers collect the required products
from the store, each order is shipped to the customer in one of the seven delivery slots.
The availability of product in the early morning will significantly affect the first four de‐
livery slots, hence the value of the order fulfilment rate.
The information flow is mainly depicted at the top of the value stream map, and its
direction is generally right to left. When the customer places an online order, it is received
and treated by the administrative area of E‐Commerce, which will then create lists of or‐
ders to be given to the pickers. For products that are not stored in their warehouse, which
is the case for all FV products, the E‐Commerce division needs to inform the store about
their needs, attending to the expected online demand. The store is responsible for sending
the orders to the central logistics.
This diagnosis allowed the project team to determine the waste factors in the process
that could negatively impact the OOS metrics indicated in the previous subsection, hence
the online order fulfilment rate.
Figure 7. Current state value stream map (own study).
3.3.3. Stage 3—Kaizen Opportunities
The previous stage enabled the team to understand the areas for improvement of the
processes under the value stream. The kaizen/improvement opportunities that will impact
the KPIs of interest are summarized in Figure 8.
Figure 7. Current state value stream map (own study).
The information flow is mainly depicted at the top of the value stream map, and itsdirection is generally right to left. When the customer places an online order, it is receivedand treated by the administrative area of E-Commerce, which will then create lists of ordersto be given to the pickers. For products that are not stored in their warehouse, which is thecase for all FV products, the E-Commerce division needs to inform the store about theirneeds, attending to the expected online demand. The store is responsible for sending theorders to the central logistics.
This diagnosis allowed the project team to determine the waste factors in the processthat could negatively impact the OOS metrics indicated in the previous subsection, hencethe online order fulfilment rate.
3.3.3. Stage 3—Kaizen Opportunities
The previous stage enabled the team to understand the areas for improvement of theprocesses under the value stream. The kaizen/improvement opportunities that will impactthe KPIs of interest are summarized in Figure 8.
Sustainability 2022, 14, x FOR PEER REVIEW 12 of 19
Figure 8. Opportunities for improvement identified in the current value stream map (own study).
3.3.4. Stage 4—Value Stream Design (Future State Map)
Considering the opportunities for improvement, the team developed a new value
stream map regarding the intended future state for it. The resulting map is depicted in
Figure 9. The main changes summarized below attempted to introduce a pull flow in the
processes, eliminate waiting times, rework, unnecessary movements and in‐store travels:
Instead of remaining in the reception, the pallets are moved by the personnel of this
area into the corridor of the store nearby the FV market area. A stocker from the FV
market arrives 1 h earlier at 5 a.m. to dismantle the pallets and sort the products by
category.
The other two stockers of the FV market arrive at 6 a.m. to start refilling the shelves.
Unlike what happened before, these two people remain in the store and do not need
to move to the backroom of the store nor to the reception area. Any necessary trans‐
portation or movement is exclusively performed by the worker that arrived earlier,
who also has the role of supplying all the goods to be replenished and to remove
pallets and empty boxes. Lean calls to this role “Mizusumashi” [106].
To leverage the workload among work shift, it was decided that the evening shift
(responsible for closing the store) would advance the replenishment process by re‐
filling all the products that do not need to remain at a controlled temperature. This
takes away needed work time for the tasks necessary to prepare the store opening.
The managers of the store and of the E‐Commerce division agreed that the pickers
would only go to the FV section from 7:30 onwards. Between 6 a.m. and 7:30 a.m. the
priority for the stockers is to refill all the product references required by the customer
that ordered online. Every day, the E‐Commerce division communicates to the store
the list of products to be picked, so this is similar to a withdrawal kanban system. It
avoids unnecessary interruption in the work performed by both the pickers and
stockers.
The pickers will have access to the list of goods that are not available in the store
because they were not delivered by the truck that arrived from the logistics platform.
This will avoid pickers wasting further time.
Table 2 states the baseline value as well as the objectives set for the KPIs of interest
to be impacted by the improvement of the replenishment process in the FV market.
Figure 8. Opportunities for improvement identified in the current value stream map (own study).
Sustainability 2022, 14, 5913 12 of 19
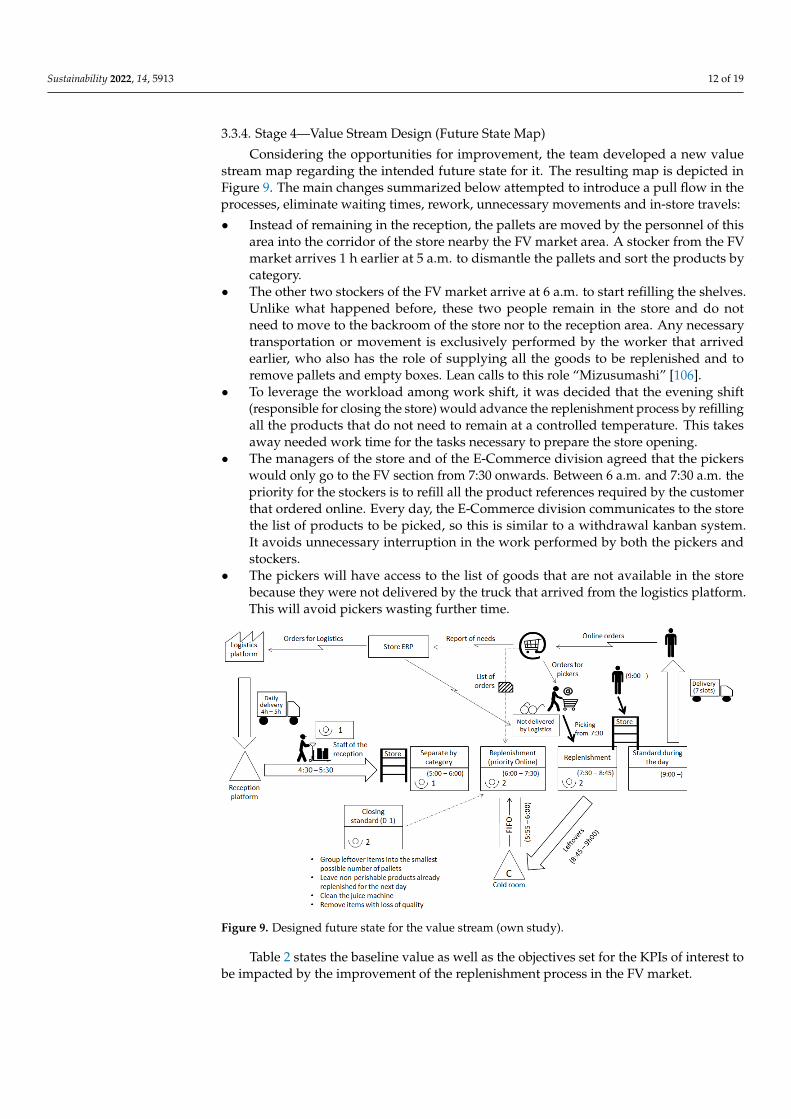
3.3.4. Stage 4—Value Stream Design (Future State Map)
Considering the opportunities for improvement, the team developed a new valuestream map regarding the intended future state for it. The resulting map is depicted inFigure 9. The main changes summarized below attempted to introduce a pull flow in theprocesses, eliminate waiting times, rework, unnecessary movements and in-store travels:
• Instead of remaining in the reception, the pallets are moved by the personnel of thisarea into the corridor of the store nearby the FV market area. A stocker from the FVmarket arrives 1 h earlier at 5 a.m. to dismantle the pallets and sort the products bycategory.
• The other two stockers of the FV market arrive at 6 a.m. to start refilling the shelves.Unlike what happened before, these two people remain in the store and do notneed to move to the backroom of the store nor to the reception area. Any necessarytransportation or movement is exclusively performed by the worker that arrivedearlier, who also has the role of supplying all the goods to be replenished and toremove pallets and empty boxes. Lean calls to this role “Mizusumashi” [106].
• To leverage the workload among work shift, it was decided that the evening shift(responsible for closing the store) would advance the replenishment process by refillingall the products that do not need to remain at a controlled temperature. This takesaway needed work time for the tasks necessary to prepare the store opening.
• The managers of the store and of the E-Commerce division agreed that the pickerswould only go to the FV section from 7:30 onwards. Between 6 a.m. and 7:30 a.m. thepriority for the stockers is to refill all the product references required by the customerthat ordered online. Every day, the E-Commerce division communicates to the storethe list of products to be picked, so this is similar to a withdrawal kanban system.It avoids unnecessary interruption in the work performed by both the pickers andstockers.
• The pickers will have access to the list of goods that are not available in the storebecause they were not delivered by the truck that arrived from the logistics platform.This will avoid pickers wasting further time.
Sustainability 2022, 14, x FOR PEER REVIEW 13 of 19
Table 2. Baseline and objectives for the KPIs impacted by the replenishment process in the FV mar‐
ket.
Name of KPI Baseline Objective
Out‐of‐stock (OOS) rate in the fresh food markets 6.5% 5.0%
Out‐of‐stock (OOS) rate in FV 10.0% 7.5%
Figure 9. Designed future state for the value stream (own study).
3.3.5. Stage 5—Implement, Standardize and Monitor Improvements
An action plan with the mentioned improvement activities was defined, planned,
and implemented in the following weeks. A set of procedures were standardized and the
people involved in the processes trained in these standards. The KPIs were followed reg‐
ularly according to the control plan.
3.4. Kanban
3.4.1. Stage 1—Define Inventory Management Models and Kanban Layout
A single card type of kanban was considered adequate to accomplish the objective of
implementing a visual inventory management procedure at the E‐Commerce warehouse.
The purpose of using this tool is to decrease the likelihood of stockouts in this warehouse,
measured by the OOS rate for this area. Two important parameters to include in the kan‐
ban card were defined: (1) reorder point, and (2) order quantity. The algorithms to deter‐
mine the values of both parameters were suggested by the supply chain division. The
team decided that the cards should include the following information:
Conversion Factor (number of product items contained in a supplied box of product);
Photo and description of the product;
Product European Article Number (EAN) code—a type of barcode that encodes an
article number;
Name of the supplier;
Days of the week to place an order;
Days of the week provided for receiving orders.
The kanban cards were defined so that they would be located in the racks of the
warehouse near to the product reference they correspond to.
Figure 9. Designed future state for the value stream (own study).
Table 2 states the baseline value as well as the objectives set for the KPIs of interest tobe impacted by the improvement of the replenishment process in the FV market.
Sustainability 2022, 14, 5913 13 of 19
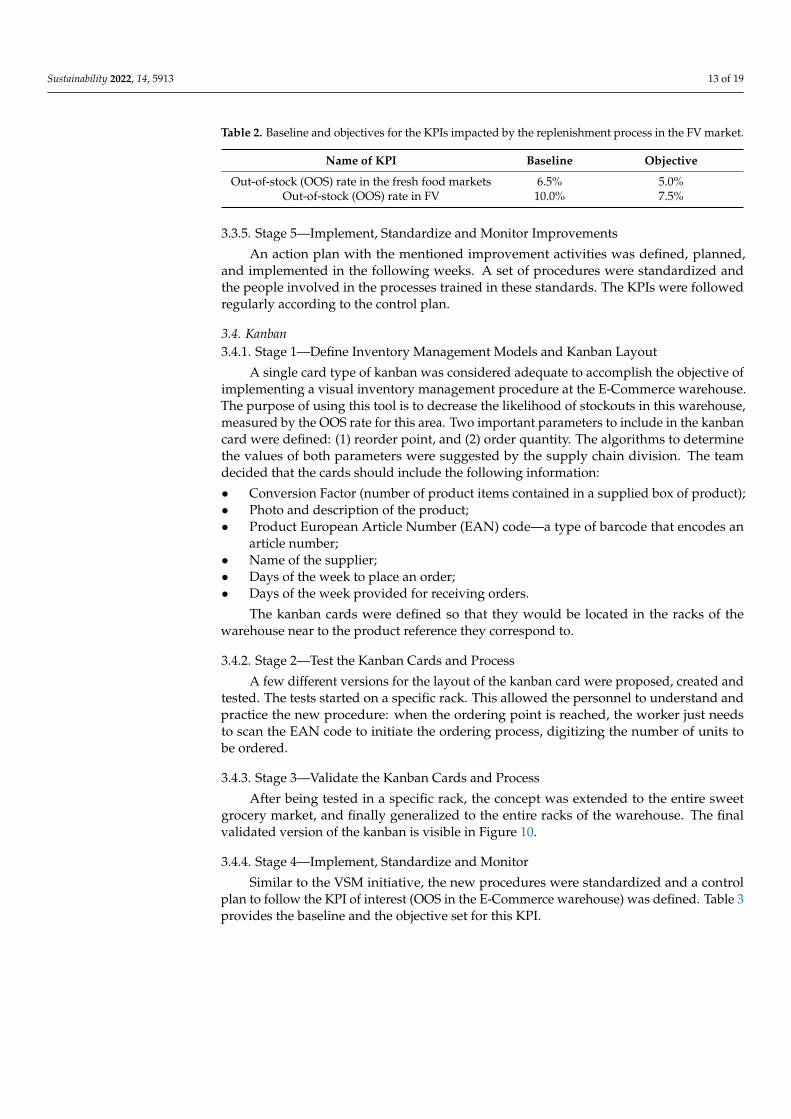
Table 2. Baseline and objectives for the KPIs impacted by the replenishment process in the FV market.
Name of KPI Baseline Objective
Out-of-stock (OOS) rate in the fresh food markets 6.5% 5.0%Out-of-stock (OOS) rate in FV 10.0% 7.5%
3.3.5. Stage 5—Implement, Standardize and Monitor Improvements
An action plan with the mentioned improvement activities was defined, planned,and implemented in the following weeks. A set of procedures were standardized andthe people involved in the processes trained in these standards. The KPIs were followedregularly according to the control plan.
3.4. Kanban3.4.1. Stage 1—Define Inventory Management Models and Kanban Layout
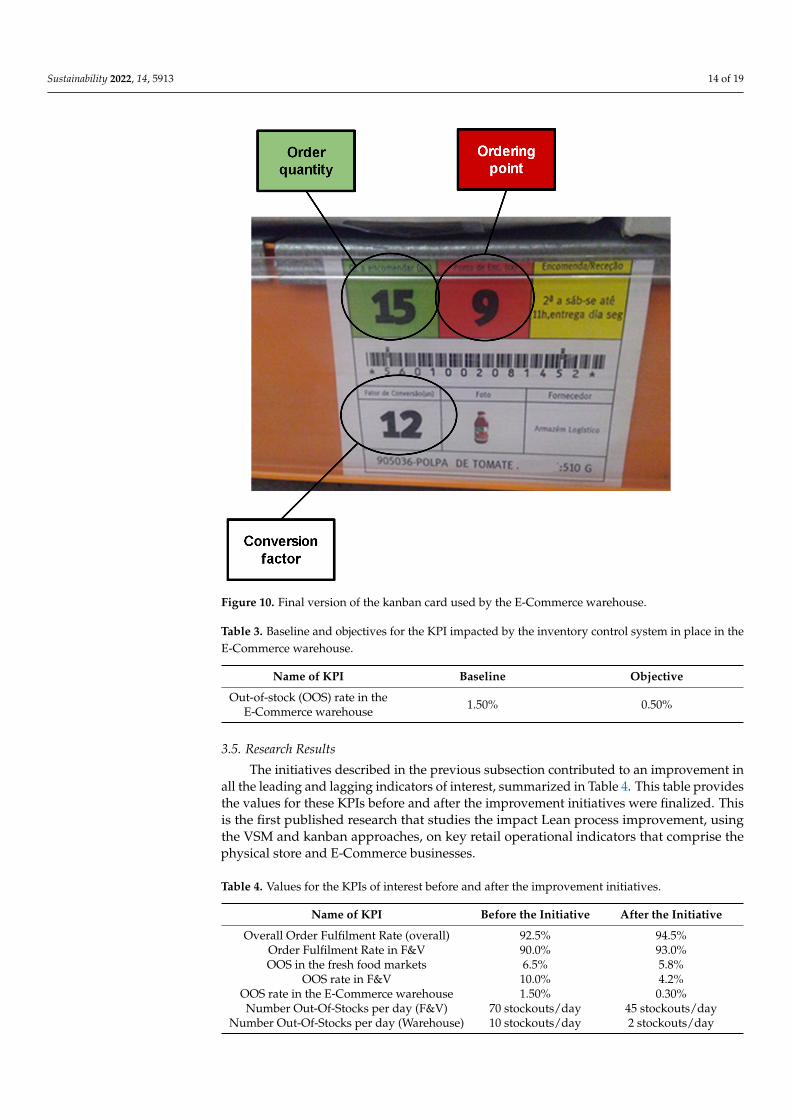
A single card type of kanban was considered adequate to accomplish the objective ofimplementing a visual inventory management procedure at the E-Commerce warehouse.The purpose of using this tool is to decrease the likelihood of stockouts in this warehouse,measured by the OOS rate for this area. Two important parameters to include in the kanbancard were defined: (1) reorder point, and (2) order quantity. The algorithms to determinethe values of both parameters were suggested by the supply chain division. The teamdecided that the cards should include the following information:
• Conversion Factor (number of product items contained in a supplied box of product);• Photo and description of the product;• Product European Article Number (EAN) code—a type of barcode that encodes an
article number;• Name of the supplier;• Days of the week to place an order;• Days of the week provided for receiving orders.
The kanban cards were defined so that they would be located in the racks of thewarehouse near to the product reference they correspond to.
3.4.2. Stage 2—Test the Kanban Cards and Process
A few different versions for the layout of the kanban card were proposed, created andtested. The tests started on a specific rack. This allowed the personnel to understand andpractice the new procedure: when the ordering point is reached, the worker just needsto scan the EAN code to initiate the ordering process, digitizing the number of units tobe ordered.
3.4.3. Stage 3—Validate the Kanban Cards and Process
After being tested in a specific rack, the concept was extended to the entire sweetgrocery market, and finally generalized to the entire racks of the warehouse. The finalvalidated version of the kanban is visible in Figure 10.
3.4.4. Stage 4—Implement, Standardize and Monitor
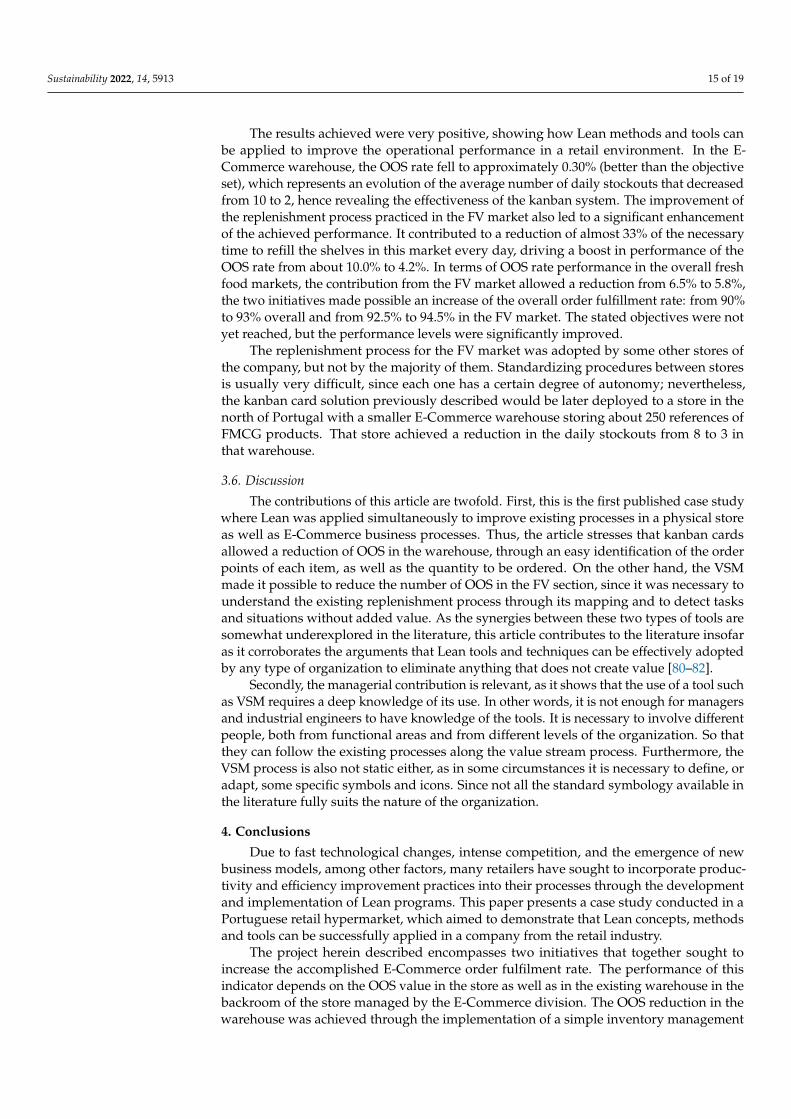
Similar to the VSM initiative, the new procedures were standardized and a controlplan to follow the KPI of interest (OOS in the E-Commerce warehouse) was defined. Table 3provides the baseline and the objective set for this KPI.
Sustainability 2022, 14, 5913 14 of 19
Sustainability 2022, 14, x FOR PEER REVIEW 14 of 19
3.4.2. Stage 2—Test the Kanban Cards and Process
A few different versions for the layout of the kanban card were proposed, created
and tested. The tests started on a specific rack. This allowed the personnel to understand
and practice the new procedure: when the ordering point is reached, the worker just needs
to scan the EAN code to initiate the ordering process, digitizing the number of units to be
ordered.
3.4.3. Stage 3—Validate the Kanban Cards and Process
After being tested in a specific rack, the concept was extended to the entire sweet
grocery market, and finally generalized to the entire racks of the warehouse. The final
validated version of the kanban is visible in Figure 10.
Figure 10. Final version of the kanban card used by the E‐Commerce warehouse.
3.4.4. Stage 4—Implement, Standardize and Monitor
Similar to the VSM initiative, the new procedures were standardized and a control
plan to follow the KPI of interest (OOS in the E‐Commerce warehouse) was defined. Table
3 provides the baseline and the objective set for this KPI.
Table 3. Baseline and objectives for the KPI impacted by the inventory control system in place in
the E‐Commerce warehouse.
Name of KPI Baseline Objective
Out‐of‐stock (OOS) rate in the E‐Commerce warehouse 1.50% 0.50%
Figure 10. Final version of the kanban card used by the E-Commerce warehouse.
Table 3. Baseline and objectives for the KPI impacted by the inventory control system in place in theE-Commerce warehouse.
Name of KPI Baseline Objective
Out-of-stock (OOS) rate in theE-Commerce warehouse 1.50% 0.50%
3.5. Research Results
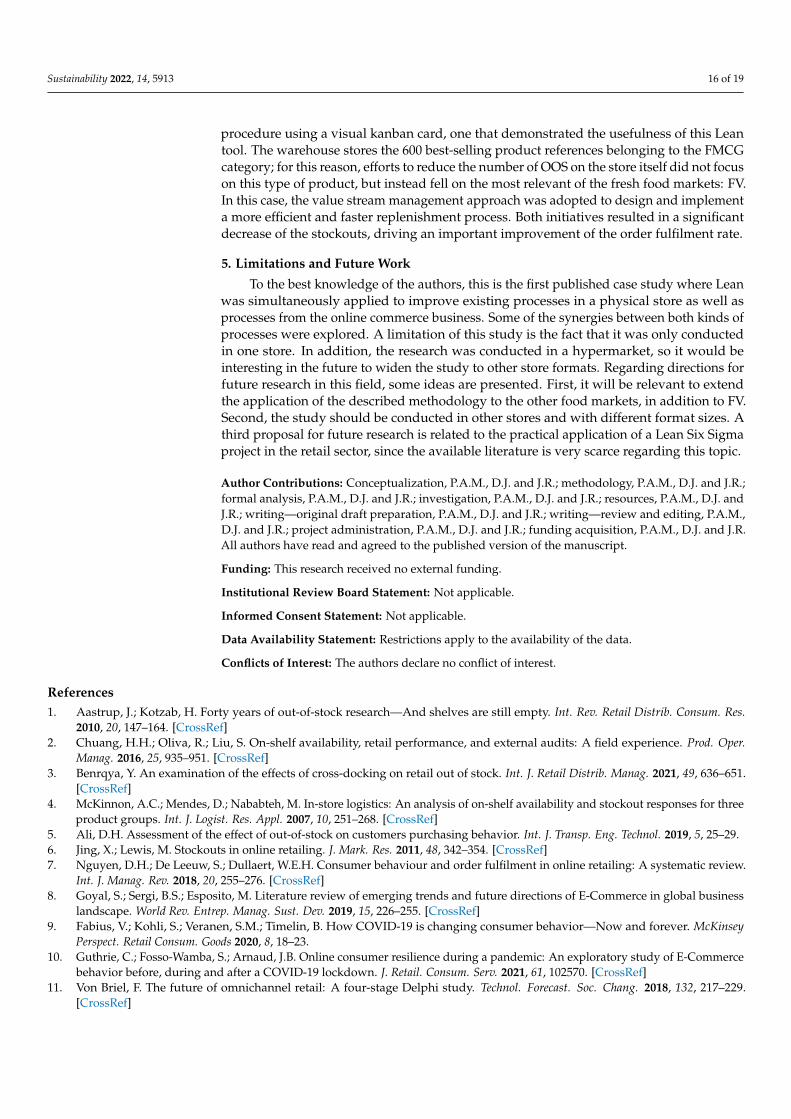
The initiatives described in the previous subsection contributed to an improvement inall the leading and lagging indicators of interest, summarized in Table 4. This table providesthe values for these KPIs before and after the improvement initiatives were finalized. Thisis the first published research that studies the impact Lean process improvement, usingthe VSM and kanban approaches, on key retail operational indicators that comprise thephysical store and E-Commerce businesses.
Table 4. Values for the KPIs of interest before and after the improvement initiatives.
Name of KPI Before the Initiative After the Initiative
Overall Order Fulfilment Rate (overall) 92.5% 94.5%Order Fulfilment Rate in F&V 90.0% 93.0%OOS in the fresh food markets 6.5% 5.8%
OOS rate in F&V 10.0% 4.2%OOS rate in the E-Commerce warehouse 1.50% 0.30%Number Out-Of-Stocks per day (F&V) 70 stockouts/day 45 stockouts/day
Number Out-Of-Stocks per day (Warehouse) 10 stockouts/day 2 stockouts/day
Sustainability 2022, 14, 5913 15 of 19
The results achieved were very positive, showing how Lean methods and tools canbe applied to improve the operational performance in a retail environment. In the E-Commerce warehouse, the OOS rate fell to approximately 0.30% (better than the objectiveset), which represents an evolution of the average number of daily stockouts that decreasedfrom 10 to 2, hence revealing the effectiveness of the kanban system. The improvement ofthe replenishment process practiced in the FV market also led to a significant enhancementof the achieved performance. It contributed to a reduction of almost 33% of the necessarytime to refill the shelves in this market every day, driving a boost in performance of theOOS rate from about 10.0% to 4.2%. In terms of OOS rate performance in the overall freshfood markets, the contribution from the FV market allowed a reduction from 6.5% to 5.8%,the two initiatives made possible an increase of the overall order fulfillment rate: from 90%to 93% overall and from 92.5% to 94.5% in the FV market. The stated objectives were notyet reached, but the performance levels were significantly improved.
The replenishment process for the FV market was adopted by some other stores ofthe company, but not by the majority of them. Standardizing procedures between storesis usually very difficult, since each one has a certain degree of autonomy; nevertheless,the kanban card solution previously described would be later deployed to a store in thenorth of Portugal with a smaller E-Commerce warehouse storing about 250 references ofFMCG products. That store achieved a reduction in the daily stockouts from 8 to 3 inthat warehouse.
3.6. Discussion
The contributions of this article are twofold. First, this is the first published case studywhere Lean was applied simultaneously to improve existing processes in a physical storeas well as E-Commerce business processes. Thus, the article stresses that kanban cardsallowed a reduction of OOS in the warehouse, through an easy identification of the orderpoints of each item, as well as the quantity to be ordered. On the other hand, the VSMmade it possible to reduce the number of OOS in the FV section, since it was necessary tounderstand the existing replenishment process through its mapping and to detect tasksand situations without added value. As the synergies between these two types of tools aresomewhat underexplored in the literature, this article contributes to the literature insofaras it corroborates the arguments that Lean tools and techniques can be effectively adoptedby any type of organization to eliminate anything that does not create value [80–82].
Secondly, the managerial contribution is relevant, as it shows that the use of a tool suchas VSM requires a deep knowledge of its use. In other words, it is not enough for managersand industrial engineers to have knowledge of the tools. It is necessary to involve differentpeople, both from functional areas and from different levels of the organization. So thatthey can follow the existing processes along the value stream process. Furthermore, theVSM process is also not static either, as in some circumstances it is necessary to define, oradapt, some specific symbols and icons. Since not all the standard symbology available inthe literature fully suits the nature of the organization.
4. Conclusions
Due to fast technological changes, intense competition, and the emergence of newbusiness models, among other factors, many retailers have sought to incorporate produc-tivity and efficiency improvement practices into their processes through the developmentand implementation of Lean programs. This paper presents a case study conducted in aPortuguese retail hypermarket, which aimed to demonstrate that Lean concepts, methodsand tools can be successfully applied in a company from the retail industry.
The project herein described encompasses two initiatives that together sought toincrease the accomplished E-Commerce order fulfilment rate. The performance of thisindicator depends on the OOS value in the store as well as in the existing warehouse in thebackroom of the store managed by the E-Commerce division. The OOS reduction in thewarehouse was achieved through the implementation of a simple inventory management
Sustainability 2022, 14, 5913 16 of 19
procedure using a visual kanban card, one that demonstrated the usefulness of this Leantool. The warehouse stores the 600 best-selling product references belonging to the FMCGcategory; for this reason, efforts to reduce the number of OOS on the store itself did not focuson this type of product, but instead fell on the most relevant of the fresh food markets: FV.In this case, the value stream management approach was adopted to design and implementa more efficient and faster replenishment process. Both initiatives resulted in a significantdecrease of the stockouts, driving an important improvement of the order fulfilment rate.
5. Limitations and Future Work
To the best knowledge of the authors, this is the first published case study where Leanwas simultaneously applied to improve existing processes in a physical store as well asprocesses from the online commerce business. Some of the synergies between both kinds ofprocesses were explored. A limitation of this study is the fact that it was only conductedin one store. In addition, the research was conducted in a hypermarket, so it would beinteresting in the future to widen the study to other store formats. Regarding directions forfuture research in this field, some ideas are presented. First, it will be relevant to extendthe application of the described methodology to the other food markets, in addition to FV.Second, the study should be conducted in other stores and with different format sizes. Athird proposal for future research is related to the practical application of a Lean Six Sigmaproject in the retail sector, since the available literature is very scarce regarding this topic.
Author Contributions: Conceptualization, P.A.M., D.J. and J.R.; methodology, P.A.M., D.J. and J.R.;formal analysis, P.A.M., D.J. and J.R.; investigation, P.A.M., D.J. and J.R.; resources, P.A.M., D.J. andJ.R.; writing—original draft preparation, P.A.M., D.J. and J.R.; writing—review and editing, P.A.M.,D.J. and J.R.; project administration, P.A.M., D.J. and J.R.; funding acquisition, P.A.M., D.J. and J.R.All authors have read and agreed to the published version of the manuscript.
Funding: This research received no external funding.
Institutional Review Board Statement: Not applicable.
Informed Consent Statement: Not applicable.
Data Availability Statement: Restrictions apply to the availability of the data.
Conflicts of Interest: The authors declare no conflict of interest.
References1. Aastrup, J.; Kotzab, H. Forty years of out-of-stock research—And shelves are still empty. Int. Rev. Retail Distrib. Consum. Res.
2010, 20, 147–164. [CrossRef]2. Chuang, H.H.; Oliva, R.; Liu, S. On-shelf availability, retail performance, and external audits: A field experience. Prod. Oper.
Manag. 2016, 25, 935–951. [CrossRef]3. Benrqya, Y. An examination of the effects of cross-docking on retail out of stock. Int. J. Retail Distrib. Manag. 2021, 49, 636–651.
[CrossRef]4. McKinnon, A.C.; Mendes, D.; Nababteh, M. In-store logistics: An analysis of on-shelf availability and stockout responses for three
product groups. Int. J. Logist. Res. Appl. 2007, 10, 251–268. [CrossRef]5. Ali, D.H. Assessment of the effect of out-of-stock on customers purchasing behavior. Int. J. Transp. Eng. Technol. 2019, 5, 25–29.6. Jing, X.; Lewis, M. Stockouts in online retailing. J. Mark. Res. 2011, 48, 342–354. [CrossRef]7. Nguyen, D.H.; De Leeuw, S.; Dullaert, W.E.H. Consumer behaviour and order fulfilment in online retailing: A systematic review.
Int. J. Manag. Rev. 2018, 20, 255–276. [CrossRef]8. Goyal, S.; Sergi, B.S.; Esposito, M. Literature review of emerging trends and future directions of E-Commerce in global business
landscape. World Rev. Entrep. Manag. Sust. Dev. 2019, 15, 226–255. [CrossRef]9. Fabius, V.; Kohli, S.; Veranen, S.M.; Timelin, B. How COVID-19 is changing consumer behavior—Now and forever. McKinsey
Perspect. Retail Consum. Goods 2020, 8, 18–23.10. Guthrie, C.; Fosso-Wamba, S.; Arnaud, J.B. Online consumer resilience during a pandemic: An exploratory study of E-Commerce
behavior before, during and after a COVID-19 lockdown. J. Retail. Consum. Serv. 2021, 61, 102570. [CrossRef]11. Von Briel, F. The future of omnichannel retail: A four-stage Delphi study. Technol. Forecast. Soc. Chang. 2018, 132, 217–229.
[CrossRef]
Sustainability 2022, 14, 5913 17 of 19
12. Hänninen, M.; Kwan, S.K.; Mitronen, L. From the store to omnichannel retail: Looking back over three decades of research. Int.Rev. Distrib. Consum. Res. 2021, 31, 1–35. [CrossRef]
13. Cao, L.; Li, L. The impact of cross-channel integration on retailers’ sales growth. J. Retail. 2015, 91, 198–216. [CrossRef]14. Li, Y.; Liu, H.; Lim, E.T.K.; Goh, J.M.; Yang, F.; Lee, M.K.O. Customer’s reaction to cross-channel integration in omnichannel
retailing: The mediating roles of retailer uncertainty, identity attractiveness, and switching costs. Decis. Support Syst. 2018, 109,50–60. [CrossRef]
15. Yu, H.; Tweed, T.; Al-Hussein, M.; Nasseri, R. Development of Lean model for house construction using value stream mapping. J.Constr. Eng. Manag. 2009, 135, 782–790. [CrossRef]
16. Sturiale, L.; Scuderi, A. The marketplaces and the integration between physic and virtual in the business models of fruit andvegetables E-Commerce. HAICTA Comput. Sci. Bus. 2017, 2030, 79–90.
17. Van Donselaar, K.H.; Peters, J.; De Jong, A.; Broekmeulen, R.A.C.M. Analysis and Forecasting of Demand During Promotions forPerishable Items. Int. J. Prod. Econ. 2016, 172, 65–75. [CrossRef]
18. Van Woensel, T.; Van Donselaar, K.; Broekmeulen, R.; Fransoo, J. Consumer responses to shelf out-of-stocks of perishable products.Int. J. Phys. Distrib. Logist. Manag. 2007, 37, 704–718. [CrossRef]
19. Buck, R.; Minvielle, A. A fresh take on food retailing. McKinsey Perspect. Retail Consum. Goods 2014, 2, 71–84.20. Srivastava, S.K.; Chaudhuri, A.; Srivastava, R.K. Propagation of risks and their impact on performance in fresh food retail. Int. J.
Logist. Manag. 2015, 26, 568–602. [CrossRef]21. Kirci, M.; Biçer, I.; Seifert, R.W. Optimal replenishment cycle for perishable items facing demand uncertainty in a two-echelon
inventory system. Int. J. Prod. Res. 2019, 57, 1250–1264. [CrossRef]22. Lukic, R. The effects of application of Lean concept in retail. Econ. Ser. Manag. 2012, 15, 88–98.23. Noda, T. Integration of Lean operation and pricing strategy in retail. J. Mark. Dev. Compet. 2015, 9, 50–60.24. Myerson, P. Lean retail. In The Routledge Companion to Lean Management; Netland, T.H., Daryl, J., Powell, D.J., Eds.; Routledge:
New York, NY, USA, 2017; pp. 413–421.25. Madhani, P.M. Performance optimisation of retail industry: Lean Six Sigma approach. ASBM J. Manag. 2020, 13, 74–91.26. Silva, P.; Braga, A.; Mota, S.; Soares, M.; Ferreira, M.R. A Lean-Kaizen implementation: A case study in the food retail industry. In
Reviving Businesses with New Organizational Change Management Strategies; Geada, N., Anunciação, P., Eds.; IGI Global: Philadelphia,PA, USA, 2021; pp. 182–195.
27. Powell, M.; Childerhouse, P. Retail value stream management. Int. J. Electron. Cust. Relatsh. Manag. 2010, 4, 209–227. [CrossRef]28. Hines, P.; Holweg, M.; Rich, N. Learning to evolve: A review of contemporary Lean Thinking. Int. J. Oper. Prod. Manag. 2004, 24,
994–1011. [CrossRef]29. Bhasin, S. Clarification of the Lean concept. In Lean Management beyond Manufacturing: A Holistic Approach; Bhasin, S., Ed.;
Springer: Cham, Switzerland, 2015; pp. 11–26.30. Netland, T.H.; Powell, D.J. A Lean world. In The Routledge Companion to Lean Management; Netland, T.H., Powell, D.J., Eds.;
Routledge: New York, NY, USA, 2017; pp. 465–473.31. Womack, J.P.; Jones, D.T. Lean consumption. Harv. Bus. Rev. 2005, 83, 58–68. [CrossRef]32. Naruo, S.; Toma, S.G. From Toyota Production System to Lean retailing. Lessons from Seven-Eleven Japan. In Advances in
Production Management System; Olhager, J., Perrson, F., Eds.; Springer: Boston, MA, USA, 2007; Volume 246, pp. 387–395.33. Imai, M. Gemba Kaizen: A Commonsense Approach to a Continuous Improvement Strategy, 2nd ed.; McGraw-Hill: New York, NY, USA,
2012; pp. 239–248.34. Arnheiter, E.D.; Maleyeff, J. The integration of Lean management and Six Sigma. TQM Mag. 2005, 17, 5–18. [CrossRef]35. Stone, K.B. Four decades of Lean: A systematic literature review. Int. J. Lean Six Sigma 2012, 3, 112–132. [CrossRef]36. Hopp, W.J.; Spearman, M.S. The lenses of Lean: Visioning the science and practice of efficiency. J. Oper. Manag. 2020, 67, 610–626.
[CrossRef]37. Lee, B.; Jo, H. The mutation of the Toyota Production System: Adapting the TPS at Hyundai Motor Company. Int. J. Prod. Res.
2007, 45, 3665–3679. [CrossRef]38. Takeuchi, H.; Osono, E.; Shimizu, N. The contradictions that drive Toyota’s success. Harv. Bus. Rev. 2008, 86, 96–104.39. Cusumano, M.A. Manufacturing innovation: Lessons from the Japanese auto industry. Sloan Manag. Rev. 1988, 30, 29.40. Holweg, M. The genealogy of Lean production. J. Oper. Manag. 2007, 25, 420–437. [CrossRef]41. Goetsch, D.L.; Davis, S.B. Quality Management for Organizational Excellence: Introduction to Total Quality, 8th ed.; Pearson: Boston,
MA, USA, 2016; pp. 366–395.42. Krafcik, J.F. The triumph of the Lean production system. Sloan Manag. Rev. 1988, 30, 41–52.43. Womack, J.P.; Jones, D.T.; Roos, D. The Machine that Changed the World: The Story of Lean Production—Toyota’s Secret Weapon in the
Global Car Wars that is Now Revolutionizing World Industry; Rawson Associates: New York, NY, USA, 1990; pp. 17–70.44. Tischler, L. Bringing Lean to the office. Qual. Prog. 2006, 39, 32–38.45. Chen, J.C.; Cox, R.A. Value stream management for Lean office—A case study. Am. J. Ind. Bus. Manag. 2012, 2, 17–29. [CrossRef]46. Yokoyama, T.T.; De Oliveira, M.A.; Futami, A.H. A Systematic Literature Review on Lean Office. Ind. Eng. Manag. Syst. 2019, 18,
67–77. [CrossRef]47. Pepper, M.P.J.; Spedding, T.A. The evolution of Lean Six Sigma. Int. J. Qual. Reliab. Manag. 2010, 27, 138–155. [CrossRef]48. Yadav, G.; Tesai, T.N. Lean Six Sigma: A categorized review of the literature. Int. J. Lean Six Sigma 2016, 7, 2–24. [CrossRef]
Sustainability 2022, 14, 5913 18 of 19
49. Singh, M.; Rathi, R. A structured review of Lean Six Sigma in various industrial sectors. Int. J. Lean Six Sigma 2019, 10, 622–664.[CrossRef]
50. Ohno, T. Toyota Production System: Beyond Large Scale Production; Productivity Press: New York, NY, USA, 1988; pp. 1–44.51. Pienkowski, M. Waste measurement techniques for Lean companies. Lean Think. 2014, 5, 9–24.52. Smith, S. Muda, Muri and Mura. Six Sigma Forum Mag. 2014, 13, 36–37.53. Bicheno, J.; Holweg, M. The Lean Toolbox: A Handbook for Lean Transformation, 5th ed.; PICSIE Books: Buckingham, UK, 2016;
pp. 4–17.54. Cusumano, M.A.; Holweg, M.; Howell, J.; Netland, T.; Shah, R.; Shook, J.; Ward, P.; Womack, J. Commentaries on the lenses of
Lean. J. Oper. Manag. 2021, 67, 627–639. [CrossRef]55. Miller, R.D. Hearing the Voice of the Shingo Principles: Creating Sustainable Cultures of Enterprise Excellence; Routledge: New York, NY,
USA, 2018; pp. 21–54.56. Liker, J.K. The Toyota Way: 14 Management Principles from the World’s Greatest Manufacturer; McGraw-Hill: New York, NY, USA,
2004; pp. 27–66.57. Bhuiyan, N.; Baghel, A. An overview of continuous improvement: From the past to the present. Manag. Decis. 2005, 43, 761–771.
[CrossRef]58. Alaskari, O.; Ahmad, M.M.; Pinedo-Cuenca, R. Development of a methodology to assist manufacturing SMEs in the selection of
appropriate lean tools. Int. J. Lean Six Sigma 2016, 7, 62–84. [CrossRef]59. Rother, M.; Shook, J. Learning to See—Value Stream Mapping to Add Value and Eliminate Muda; The Lean Enterprise Institute: Boston,
MA, USA, 1999; pp. 3–45.60. Seth, D.; Nitin, S.; Pratik, D. Application of value stream mapping (VSM) for Lean and cycle time reduction in complex production
environments: A case study. Prod. Plan. Control 2017, 28, 398–419. [CrossRef]61. Belokar, R.M.; Vikas, K.; Sandeep, S.K. An application of value stream mapping in automotive industry: A case study. Int. J.
Innov. Technol. Explor. Eng. 2012, 1, 152–157.62. Sharma, D.; Khatri, A.; Mathur, Y.B. Application of value stream mapping in Bhujia Manufacturing. Int. J. Mech. Eng. Technol.
2016, 7, 443–448.63. Amin, M.A.; Karim, A. A systematic approach to evaluate the process improvement in Lean manufacturing organizations. In
Sustainable Manufacturing: Shaping Global Value Creation; Seliger, G., Ed.; Springer: Berlin/Heidelberg, Germany, 2012; pp. 65–70.64. Saleeshya, P.G.; Rajan, V.; Premkumar, N. Optimising the financial performance of supply chain—A case study. Int. J. Adv. Oper.
Manag. 2019, 11, 232–255.65. Bogdanski, G.; Schönemann, M.; Thiede, S.; Andrew, S.; Herrmann, C. An extended energy value stream approach applied on the
electronics industry. In Advances in Production Management Systems. Competitive Manufacturing for Innovative Products and Services;Emmanouilidis, C., Taisch, M., Kiritsis, D., Eds.; Spinger: Berlin/Heidelberg, Germany, 2013; pp. 65–72.
66. Hines, P.; Rich, N.; Bicheno, J.; Brunt, D.; Taylor, D.; Butterworth, C.; Sullivan, J. Value Stream Management. Int. J. Logist. Manag.1998, 9, 25–42. [CrossRef]
67. Erlach, K. Value Stream Design: The Way Towards a Lean Factory; Springer: Dortmund, Germany, 2013; pp. 25–96.68. Oberhausen, C.; Plapper, P. Value stream management in the Lean manufacturing laboratory. Procedia CIRP 2015, 32, 144–149.
[CrossRef]69. Sony, M. Industry 4.0 and Lean management: A proposed integration model and research propositions. Prod. Manuf. Res. 2018, 6,
416–432. [CrossRef]70. Martin, K.; Osterling, M. Value Stream Mapping: How to Visualize Work and Align Leadership for Organizational Transformation;
McGraw-Hill: New York, NY, USA, 2014; pp. 1–26.71. Chiarini, A. Lean Organization: From the Tools of the Toyota Production System to Lean Office; Springer: Bologna, Italy, 2013; pp. 15–30.72. Lage, M., Jr.; Filho, M.G. Variations of the kanban system: Literature review and classification. Int. J. Prod. Econ. 2010, 125, 13–21.
[CrossRef]73. Rahman, N.A.A.; Sharif, S.M.; Esa, M.M. Lean manufacturing case study with kanban system implementation. Procedia Econ.
Financ. 2013, 7, 174–180. [CrossRef]74. Huang, C.; Kusiak, A. Overview of kanban systems. Int. J. Comput. Integr. Manuf. 1996, 9, 169–189. [CrossRef]75. Thürer, M.; Stevenson, M.; Protzman, C. Card-Based Control Systems for a Lean Work Design; CRC Press: Boca Raton, FL, USA, 2016;
pp. 25–56.76. Frein, Y.; Mascolo, M.D.; Dallery, Y. On the design of generalized kanban control systems. Int. J. Oper. Prod. Manag. 1995, 15,
158–184. [CrossRef]77. Kumar, C.S.; Panneerselvam, R. Literature review of JIT-kanban system. Int. J. Adv. Manuf. Technol. 2007, 32, 393–408. [CrossRef]78. Miwa, K.; Nomura, J.; Takakuwo, S. Module-Based Modeling and Analysis of Just-In-Time Production Adopting Dual-Card
Kanban System and Mizusumashi Worker. In Proceedings of the 2017 Winter Simulation Conference, Las Vegas, NV, USA,3–6 December 2017.
79. Esparrago, R.A., Jr. Kanban. Prod. Inventory Manag. J. 1988, 29, 6–10.80. Kouri, I.A.; Salmimaa, T.; Vilpola, I. The principles and planning process of an electronic kanban system. In Novel Algorithms and
Techniques in Telecommunications, Automation and Industrial Electronics; Sobh, T., Elleithy, K., Mahmood, A., Mohammad, A., Eds.;Springer: Dordrech, The Netherlands, 2008; pp. 99–104.
Sustainability 2022, 14, 5913 19 of 19
81. Yang, K.K. Managing a flow line with single-kanban, dual kanban or ConWip. Prod. Oper. Manag. 2000, 9, 349–366. [CrossRef]82. Akturk, M.S.; Erhun, F. An Overview of design and operational issues of kanban systems. Int. J. Prod. Res. 1999, 37, 3859–3881.
[CrossRef]83. Monden, Y. Review of kanban system principles. In Toyota Production System, 2nd ed.; Monden, Y., Ed.; Springer: Boston, MA,
USA, 1994; pp. 313–326.84. Braglia, M.; Gabbrielli, R.; Marrazzini, L. Rolling kanban: A new visual tool to schedule family batch manufacturing processes
with kanban. Int. J. Prod. Res. 2019, 58, 3998–4014. [CrossRef]85. Sabaghi, M.; Rostamzadeh, R.; Mascle, C. Kanban and value stream mapping analysis in Lean manufacturing philosophy via
Simulations: A plastic fabrication (case study). Int. J. Serv. Oper. Manag. 2015, 20, 118–140. [CrossRef]86. Mou, S.; Robb, D.J.; DeHoratius, N. Retail store operations: Literature review and research directions. Eur. J. Oper. Res. 2018, 265,
399–422. [CrossRef]87. Villa, R.; Monzón, A. Mobility restrictions and E-Commerce: Holistic balance in Madrid centre during COVID-19 lockdown.
Economies 2021, 9, 57. [CrossRef]88. Carmignani, G.; Zammori, F. Lean thinking in the luxury-fashion market: Evidences from an extensive industrial project. Int. J.
Retail Distrib. Manag. 2015, 43, 988–1012. [CrossRef]89. Kroes, J.R.; Manikas, A.S.; Gattiker, T.F. Operational leanness and retail firm performance since 1980. Int. J. Prod. Econ. 2018, 197,
262–274. [CrossRef]90. Jaca, C.; Santos, J.; Errasti, A.; Viles, E. Lean thinking with improvement teams in retail distribution: A case study. Total Qual.
Manag. 2012, 23, 449–465. [CrossRef]91. Abernathy, F.H.; Dunlop, J.T.; Hammond, J.H.; Weil, D. A Stitch in Time: Lean Retailing and the Transformation of Manufacturing—Lessons
from the Apparel and Textile Industries; Oxford University Press: Oxford, UK, 1999; pp. 39–86.92. Bloom, J.D.; Hinrichs, C.C. The long reach of Lean retailing: Firm embeddedness and Wal-Mart’s implementation of local produce
Sourcing in the US. Environ. Plan. 2017, 49, 168–185. [CrossRef]93. Wright, C.; Lund, J. Variations on a Lean theme: Work restructuring in retail distribution. New Technol. Work Employ. 2006, 21,
59–74. [CrossRef]94. Daine, T.; Winnington, T.; Head, P. Transition from push to pull in the wholesale/retail sector: Lessons to be learned from Lean.
Int. J. Logist. Syst. Manag. 2011, 8, 214–232. [CrossRef]95. Fernie, J.; Grant, D.B. On-shelf availability in UK retailing. In Logistics and Retail Management—Emerging Issues and New Challenges
in the Retail Supply Chain, 4th ed.; Fernie, J., Sparks, L., Eds.; Kogan Page: London, UK, 2014; pp. 179–204.96. Morcillo-Bellido, J.; Duran, A. Supply chain sustainability in Spanish major retailer through strategic alliances and Lean practices.
In Closing the Gap between Practice and Research in Industrial Engineering; Viles, E., Ormazábal, M., Lleó, A., Eds.; Springer: Cham,Switzerland, 2018; pp. 11–18.
97. López-González, A.; Lois-González, R.C.; Fernández-Casal, R. Mercadona (Spain): A retail model in expansion. Int. J. RetailDistrib. Manag. 2013, 41, 6–26. [CrossRef]
98. Hanna, J. How Mercadona Fixes Retail’s Last 10 Yards Problem; Research & Ideas; Harvard Business School: Boston, MA, USA, 2010.99. Onetto, M. When Toyota Met E-Commerce—Lean at Amazon. McKinsey Q. 2014, 41, 1–7.100. Robinson, N. How Zara Used Lean to Become the Largest Fashion Retailer. Available online: https://www.linkedin.com/pulse/
how-zara-used-lean-become-largest-fashion-retailer-nathan-robinson/ (accessed on 18 July 2021).101. Domingo, T.M. The Adoption of Lean Techniques to Optimize the On-Shelf Availability of Products and Drive Business
Performance in the Food Industry: A South African Manufacturing and Retail Case Study. Masters’s Thesis, University of CapeTown, Cape Town, South Africa, 2013.
102. Evans, J.R.; Lindsay, W.M. An Introduction to Six Sigma & Process Improvement, 2nd ed.; CENGAGE Learning: Stamford, CT, USA,2015; pp. 65–198.
103. Özkavukcu, A.; Durmusoglu, M.B. Product development by Hoshin Kanri approach: An application in retail sector. Sigma J. Eng.Nat. Sci. 2016, 34, 563–575.
104. Eklund, J. Lean in Retail—Implementation in Stores. In Proceedings of the NES2017 Conference, Lund, Sweden,20–23 August 2017.
105. Abdelhadi, A. Applying Lean manufacturing to retail business to prevent the spread of COVID-19. Acad. Strateg. Manag. J. 2021,20, 1–5.
106. Coimbra, E.A. Total Flow Management: Achieving Excellence with Kaizen and Lean Supply Chains; Kaizen Institute: Oporto, Portugal,2009; pp. 1–277.
Related Documents