Transforming Washington DC’s Parking Meter Program Using Lean Six Sigma Based Asset Management by Soumya S. Dey, P.E., PMP Director of Research and Technology Transfer District Department of Transportation Washington, DC 20003 E-mail: [email protected] Phone; (202) 671-1369 Submitted: October 29, 2013 Word Count 4997 Figures (7) 1750 Tables (3) 750 Total 7497 TRB 2014 Annual Meeting Paper revised from original submittal.

Welcome message from author
This document is posted to help you gain knowledge. Please leave a comment to let me know what you think about it! Share it to your friends and learn new things together.
Transcript
1
Transforming Washington DC’s Parking Meter Program
Using Lean Six Sigma Based Asset Management
by
Soumya S. Dey, P.E., PMP Director of Research and Technology Transfer
District Department of Transportation Washington, DC 20003
E-mail: [email protected] Phone; (202) 671-1369
Submitted: October 29, 2013
Word Count 4997
Figures (7) 1750
Tables (3) 750
Total 7497
TRB 2014 Annual Meeting Paper revised from original submittal.
2
ABSTRACT 1
The District Department of Transportation (DDOT) is responsible for maintaining and operating over 2
18,000 metered on-street spaces in Washington, DC. The program went through significant changes in 3
2009 and 2010 including two rate adjustments, reintroduction of meter enforcement on Saturdays and 4
extending hours of meter operation to 10 PM in some areas. These changes caused operational 5
problems for the Department and frustration for the customers. This paper describes how DDOT 6
applied lean six sigma (LSS) processes and techniques to dramatically transform its on-street parking 7
meter program. The paper introduces the concept of LSS and discusses how some of the analytical 8
techniques and concepts were applied. Techniques such as root cause analysis, process capability, mean 9
testing, pareto analysis and process mapping were used to identify fundamental problems with the 10
program and assets. Once the problems were identified, DDOT quickly developed a strategic vision for 11
the future and aggressively implemented the vision. Applying lean six sigma techniques has reaped 12
significant rewards for DDOT within a very short period of time. These benefits include higher customer 13
satisfaction through enhanced payment options, lower number of service requests, better system 14
uptime, more proactive management of assets, better executive visibility and increased revenue. 15
Washington DC’s parking program is now recognized as one of the most innovative, forward thinking 16
programs in the country. The success of applying LSS in parking has encouraged DDOT to apply this 17
concept in other program areas as well. 18
TRB 2014 Annual Meeting Paper revised from original submittal.
Dey, S.S., Transforming Washington DC’s Parking Meter Program Using Lean Six Sigma Based Asset Management
3
BACKGROUND 1
The District Department of Transportation (DDOT) is responsible for developing and maintaining a 2
cohesive, sustainable transportation system that delivers safe, affordable, and convenient ways to move 3
people and goods—while protecting and enhancing the natural, environmental and cultural resources of 4
the nation’s capital. As an agency, DDOT is very unique – it has attributes of both a state and municipal 5
department of transportation (DOT). As part of this mission, DDOT manages and operates all the 6
transportation assets in Washington, DC. These assets are valued at $44 billion [1]. Over the past few 7
years, DDOT has gone through a paradigm shift in how it manages its assets. These techniques include 8
performance based contracting (with incentive/disincentive and liquidated damages), application of 9
data mining and process enhancement techniques such as lean six sigma (LSS) and participating in 10
constructive partnering forums with the private sector for more cost effective service delivery. 11
The District Department of Transportation (DDOT) is responsible for maintaining and operating over 12
18,000 metered on-street spaces in Washington, DC. Until late 2010, these spaces were controlled by 13
two basic asset types; (a) traditional single space meters (SSM) that each cover one space, and (b) multi 14
space meters (MSM) that cover approximately an average of eight metered spaces. The MSMs are 15
networked, while the SSMs are mechanical, non-networked assets. Moreover, the SSM are more than 16
10 years old and at the end of their useful life. From a customers’ perspective, credit cards were 17
accepted as a payment option (in addition to coins) only at the MSMs. For the rest of the assets, only 18
coins were accepted. Up until late 2010 customers could pay by credit cards at only 23% of the metered 19
spaces. 20
Between March of 2009 and January 2010, the program underwent significant changes including two 21
rate adjustments, lifting of the Saturday moratorium on parking meter fees and extending the duration 22
during which meters are operational [2, Error! Reference source not found., 4]. These operational 23
changes put significant stress on a system that had assets that were beyond their useful life. 24
The changes caused significant frustration amongst customers. Due to the rate adjustments, the 25
number of coin transactions on the system increased. This increased failure rates for the meters. 26
Consequently, customers were frequently encountered with broken meters [5]. The rate increase also 27
necessitated customers to carry more change. This caused additional frustration [6]. Parking related 28
service requests through Washington, DC’s centralized 311 system became the highest service request 29
in DC. In 2010, the agency received approximately 200,000 parking meter related service requests [7]. 30
Just to put things in perspective, in 2009 DDOT received more parking meter related service requests 31
than the Department of Public Works (DPW) received as an entire agency [8]. Also, the perception gap 32
(the difference between percentage on-time service delivery and customer’s perception about the level 33
of service delivery measured through a sample survey), for parking meters was at 55% [9]. This was the 34
highest amongst all DDOT service categories. The press picked-up on the negative customer sentiment 35
as well [10,11]. The program became a burning issue for the Department and the District of Columbia. 36
Consequently, there was significant pressure on the agency to enhance the program. 37
TRB 2014 Annual Meeting Paper revised from original submittal.
Dey, S.S., Transforming Washington DC’s Parking Meter Program Using Lean Six Sigma Based Asset Management
4
This paper discusses how DDOT adopted a lean six sigma (LSS) based approach to identify fundamental 1
problems with its assets and the program, developed a strategic approach to enhance the program, 2
implemented the recommendations and achieved significant enhancements. It discusses some of the 3
analytical tools that were used in the process. 4
WHAT IS LEAN SIX SIGMA 5
Lean and six sigma are process improvement methodologies. Lean is a set of tools that is geared to 6
improve process flow. Lean primarily focuses on the elimination of waste or non-value added activities 7
from all business processes. Lean arose as a method to optimize auto manufacturing (initially at Ford 8
and Toyota). Lean focuses on eliminating seven sources of waste [12]: 9
Overproduction (manufacturing items ahead of demand) 10
Inventory (excess material and information) 11
Defects (production of off-specification products) 12
Transport (excess transport of work-in-process or products) 13
Motion (human movements that are unnecessary or straining) 14
Over-processing (process steps that are not required) 15
Waiting (idle time and delays) 16 17
Six sigma specifically focuses on process variation. It is a methodology driven by understanding of 18
customer needs, and the disciplined use of data, facts and statistical analysis to improve and reinvent 19
organizational processes by reducing variation. Six sigma evolved as a quality initiative to reduce 20
variance in the semi-conductor industry (initially Motorola). From a purely statistical standpoint a six 21
sigma process has 3.4 defects per one million opportunities [13]. The statistical roots of the term six 22
sigma have become less important as six sigma has evolved into a comprehensive management system. 23
Lean six sigma (LSS) is a combination of lean and six sigma approaches. Despite their disparate roots, 24
lean and six sigma share several fundamental commonalities including a focus on customer satisfaction, 25
continuous improvement, identification of root causes, and comprehensive employee involvement [14]. 26
LSS uses a data-based approach to enhance workflow and business processes. 27
Though used primarily in the manufacturing sector, the concept of LSS has been applied successfully in 28
the service sector as well. LSS for services is a business improvement methodology that maximizes value 29
by achieving the fastest rate of improvement in customer satisfaction, cost, quality, process speed and 30
invested capital. 31
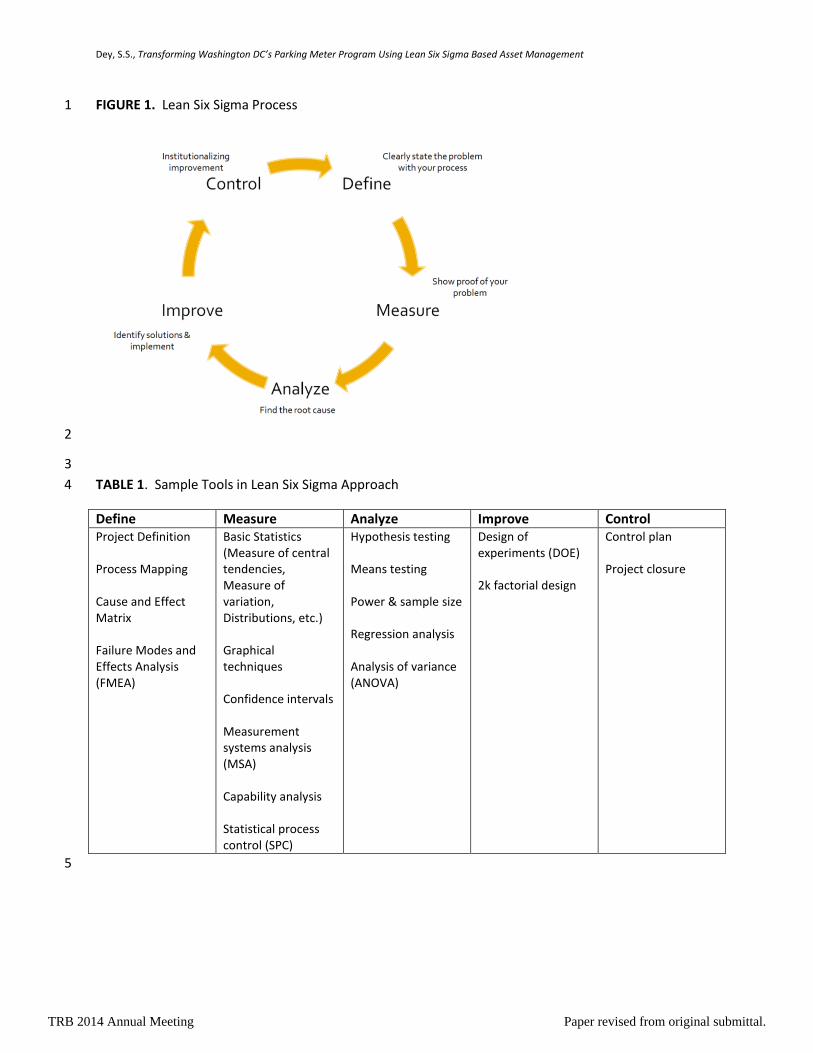
Lean six sigma is a five step process as shown in Figure 1 [15]. Each of these processes has sample tools 32
and procedures as shown in Table 1 [16]. 33
34
35
36
TRB 2014 Annual Meeting Paper revised from original submittal.
Dey, S.S., Transforming Washington DC’s Parking Meter Program Using Lean Six Sigma Based Asset Management
5
FIGURE 1. Lean Six Sigma Process 1
2
3
TABLE 1. Sample Tools in Lean Six Sigma Approach 4
Define Measure Analyze Improve Control Project Definition Process Mapping Cause and Effect Matrix Failure Modes and Effects Analysis (FMEA)
Basic Statistics (Measure of central tendencies, Measure of variation, Distributions, etc.) Graphical techniques Confidence intervals Measurement systems analysis (MSA) Capability analysis Statistical process control (SPC)
Hypothesis testing Means testing Power & sample size Regression analysis Analysis of variance (ANOVA)
Design of experiments (DOE) 2k factorial design
Control plan Project closure
5
TRB 2014 Annual Meeting Paper revised from original submittal.
Dey, S.S., Transforming Washington DC’s Parking Meter Program Using Lean Six Sigma Based Asset Management
6
LITERATURE REVIEW 1
Lean six sigma has been used extensively in the private sector. There are several documented uses of 2
LSS across different levels of government as well. Federal agencies such as the as the Department of 3
Defense (DOD), Environmental Protection Agency (EPA), Department of Energy (DOE); state agencies 4
such as Florida Department of Revenue; and municipal agencies such as City of Fort Wayne (Indiana), 5
City of Hartford (Connecticut) and City of Irving (Texas) have applied six sigma techniques to various 6
components of their programs [17,18,19]. Most of the documented applications of lean six sigma in the 7
transportation industry have been in the area of logistics and supply chain for humanitarian relief, 8
airlines, rental car and rail operations [20,21]. Lean techniques have been used for delivery and 9
construction of infrastructure projects [22,23]. However, as a concept, LSS has not made significant 10
inroads into the mainstream transportation engineering profession. 11
APPLICATION OF LEAN SIX SIGMA TOOLS TO DC PARKING PROGRAM 12
This section discusses how some of the tools in the LSS framework were applied to gain valuable 13
information and knowledge about DDOT‘s parking meter assets. 14
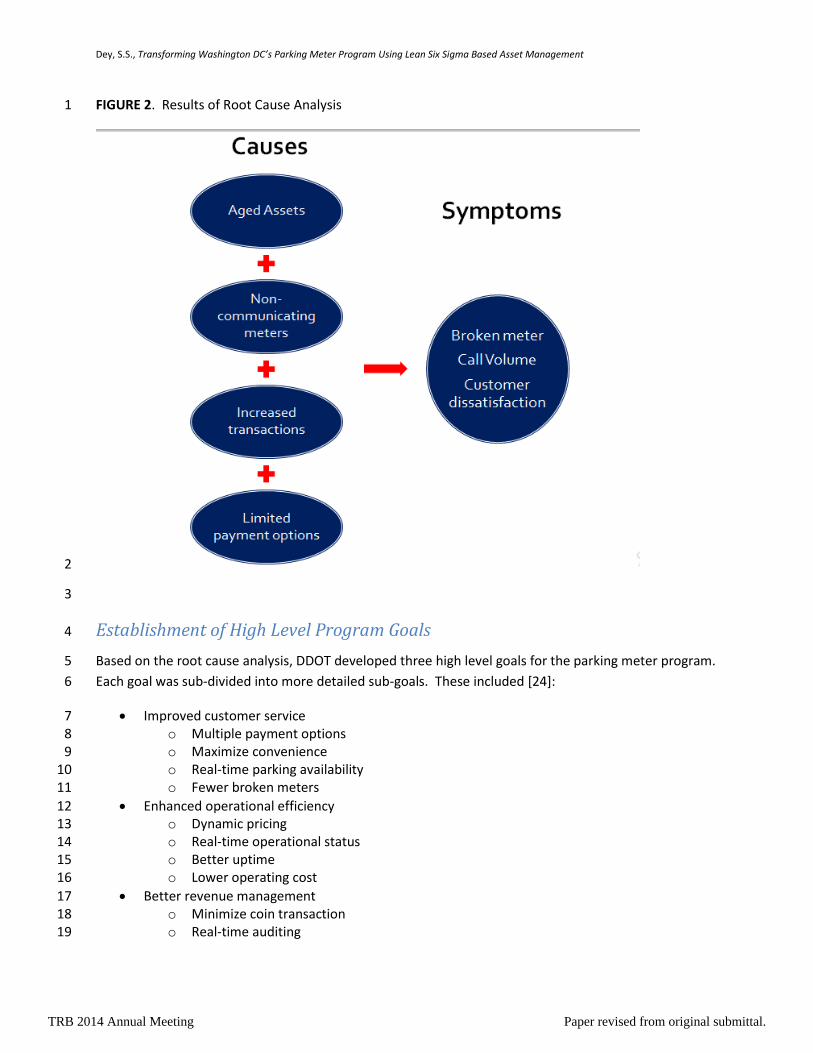
Root Cause Analysis 15
There are several techniques that can be used for root cause analysis such as fishbone diagram, cause 16
and effect mapping, failure modes and effects analysis (FMEA), etc. DDOT utilized cause mapping to 17
identify the “root causes” of the problems associated with the program. During this process, it was 18
important to distinguish between symptoms and causes. During the analysis it became apparent that 19
symptoms such as increase in number of broken meters, broken meter call volumes and customer 20
dissatisfaction were driven by four fundamental causes - aged assets, non-communicating meters, 21
increase coin transactions (because of the rate increases) and limited payment options for customers 22
(shown in Figure 2). Identifying the root causes was fundamental in carting a future course for program 23
enhancements. 24
25
26
27
28
29
30
31
32
33
TRB 2014 Annual Meeting Paper revised from original submittal.
Dey, S.S., Transforming Washington DC’s Parking Meter Program Using Lean Six Sigma Based Asset Management
7
FIGURE 2. Results of Root Cause Analysis 1
2
3
Establishment of High Level Program Goals 4
Based on the root cause analysis, DDOT developed three high level goals for the parking meter program. 5
Each goal was sub-divided into more detailed sub-goals. These included [24]: 6
Improved customer service 7 o Multiple payment options 8 o Maximize convenience 9 o Real-time parking availability 10 o Fewer broken meters 11
Enhanced operational efficiency 12 o Dynamic pricing 13 o Real-time operational status 14 o Better uptime 15 o Lower operating cost 16
Better revenue management 17 o Minimize coin transaction 18 o Real-time auditing 19
TRB 2014 Annual Meeting Paper revised from original submittal.
Dey, S.S., Transforming Washington DC’s Parking Meter Program Using Lean Six Sigma Based Asset Management
8
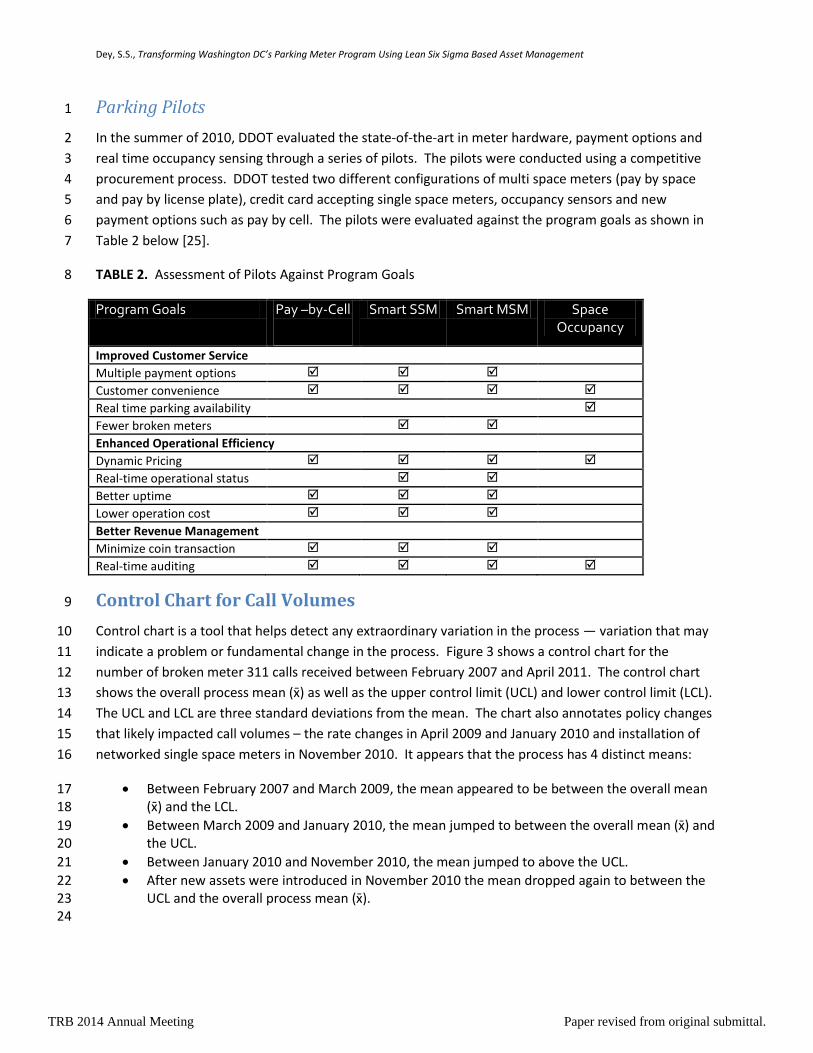
Parking Pilots 1
In the summer of 2010, DDOT evaluated the state-of-the-art in meter hardware, payment options and 2
real time occupancy sensing through a series of pilots. The pilots were conducted using a competitive 3
procurement process. DDOT tested two different configurations of multi space meters (pay by space 4
and pay by license plate), credit card accepting single space meters, occupancy sensors and new 5
payment options such as pay by cell. The pilots were evaluated against the program goals as shown in 6
Table 2 below [25]. 7
TABLE 2. Assessment of Pilots Against Program Goals 8
Program Goals Pay –by-Cell
Smart SSM Smart MSM Space
Occupancy Improved Customer Service
Multiple payment options
Customer convenience
Real time parking availability
Fewer broken meters
Enhanced Operational Efficiency
Dynamic Pricing
Real-time operational status
Better uptime
Lower operation cost
Better Revenue Management
Minimize coin transaction
Real-time auditing
Control Chart for Call Volumes 9
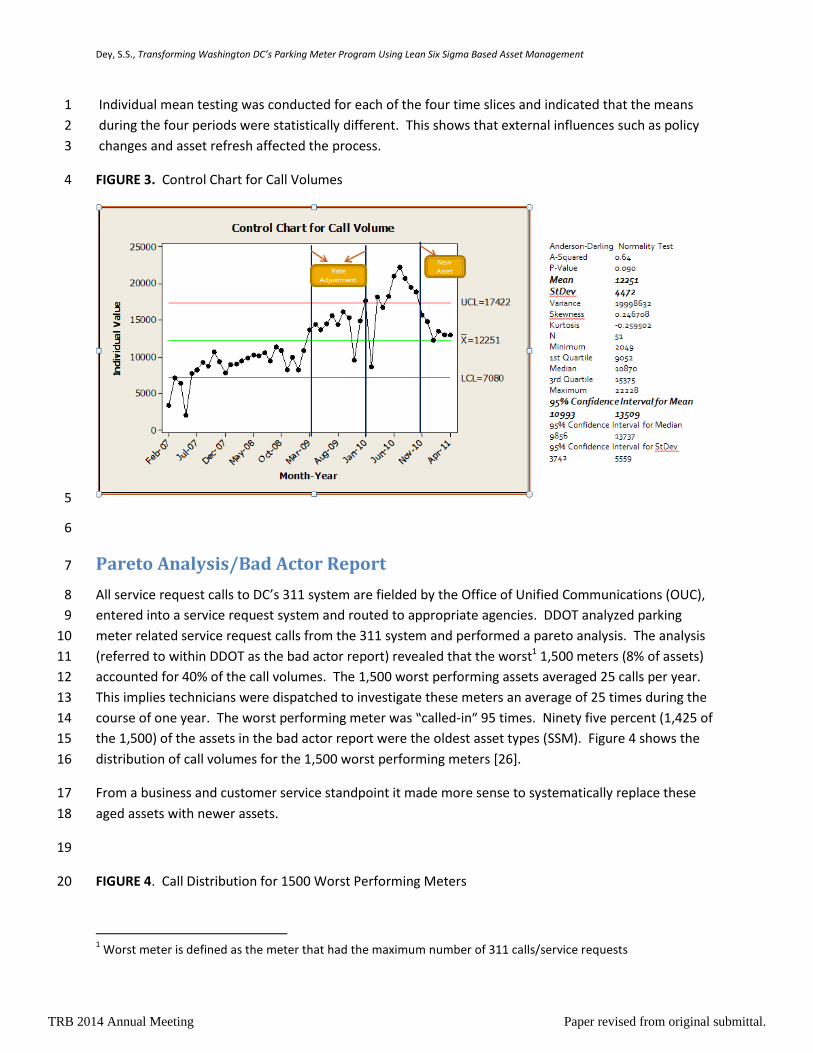
Control chart is a tool that helps detect any extraordinary variation in the process — variation that may 10
indicate a problem or fundamental change in the process. Figure 3 shows a control chart for the 11
number of broken meter 311 calls received between February 2007 and April 2011. The control chart 12
shows the overall process mean (x̄) as well as the upper control limit (UCL) and lower control limit (LCL). 13
The UCL and LCL are three standard deviations from the mean. The chart also annotates policy changes 14
that likely impacted call volumes – the rate changes in April 2009 and January 2010 and installation of 15
networked single space meters in November 2010. It appears that the process has 4 distinct means: 16
Between February 2007 and March 2009, the mean appeared to be between the overall mean 17 (x̄) and the LCL. 18
Between March 2009 and January 2010, the mean jumped to between the overall mean (x̄) and 19 the UCL. 20
Between January 2010 and November 2010, the mean jumped to above the UCL. 21
After new assets were introduced in November 2010 the mean dropped again to between the 22 UCL and the overall process mean (x̄). 23 24
TRB 2014 Annual Meeting Paper revised from original submittal.
Dey, S.S., Transforming Washington DC’s Parking Meter Program Using Lean Six Sigma Based Asset Management
9
Individual mean testing was conducted for each of the four time slices and indicated that the means 1
during the four periods were statistically different. This shows that external influences such as policy 2
changes and asset refresh affected the process. 3
FIGURE 3. Control Chart for Call Volumes 4
5
6
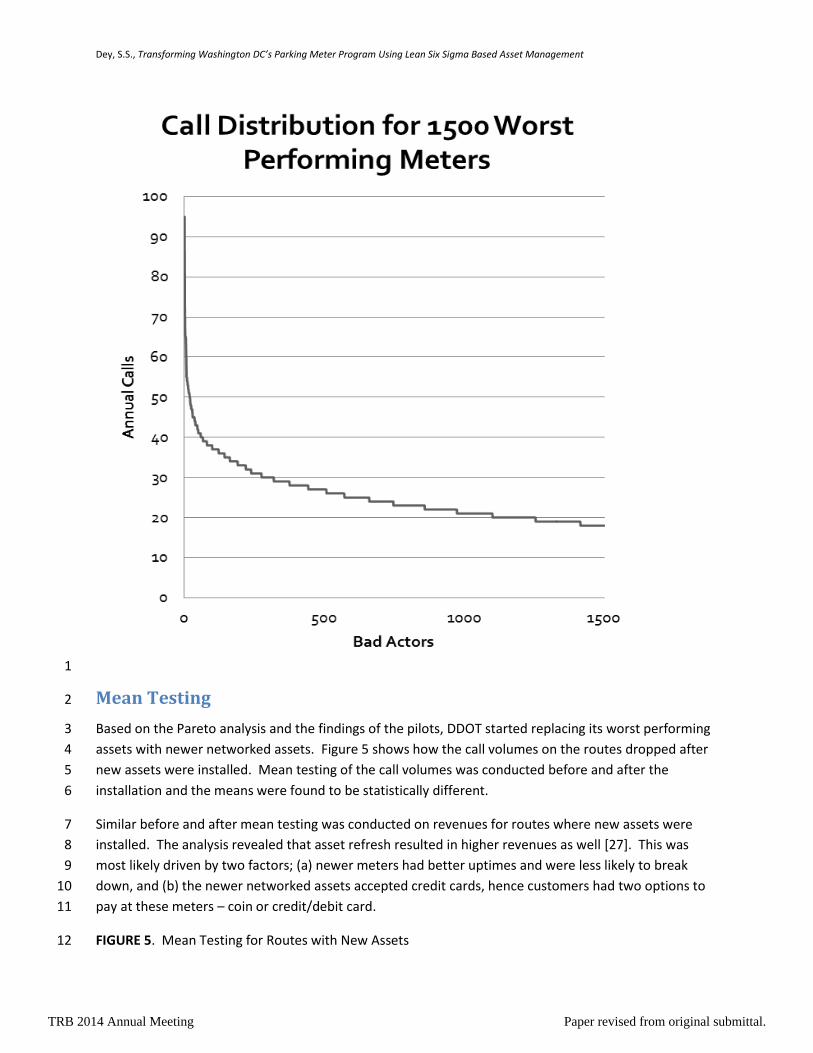
Pareto Analysis/Bad Actor Report 7
All service request calls to DC’s 311 system are fielded by the Office of Unified Communications (OUC), 8
entered into a service request system and routed to appropriate agencies. DDOT analyzed parking 9
meter related service request calls from the 311 system and performed a pareto analysis. The analysis 10
(referred to within DDOT as the bad actor report) revealed that the worst1 1,500 meters (8% of assets) 11
accounted for 40% of the call volumes. The 1,500 worst performing assets averaged 25 calls per year. 12
This implies technicians were dispatched to investigate these meters an average of 25 times during the 13
course of one year. The worst performing meter was “called-in” 95 times. Ninety five percent (1,425 of 14
the 1,500) of the assets in the bad actor report were the oldest asset types (SSM). Figure 4 shows the 15
distribution of call volumes for the 1,500 worst performing meters [26]. 16
From a business and customer service standpoint it made more sense to systematically replace these 17
aged assets with newer assets. 18
19
FIGURE 4. Call Distribution for 1500 Worst Performing Meters 20
1 Worst meter is defined as the meter that had the maximum number of 311 calls/service requests
TRB 2014 Annual Meeting Paper revised from original submittal.
Dey, S.S., Transforming Washington DC’s Parking Meter Program Using Lean Six Sigma Based Asset Management
10
1
Mean Testing 2
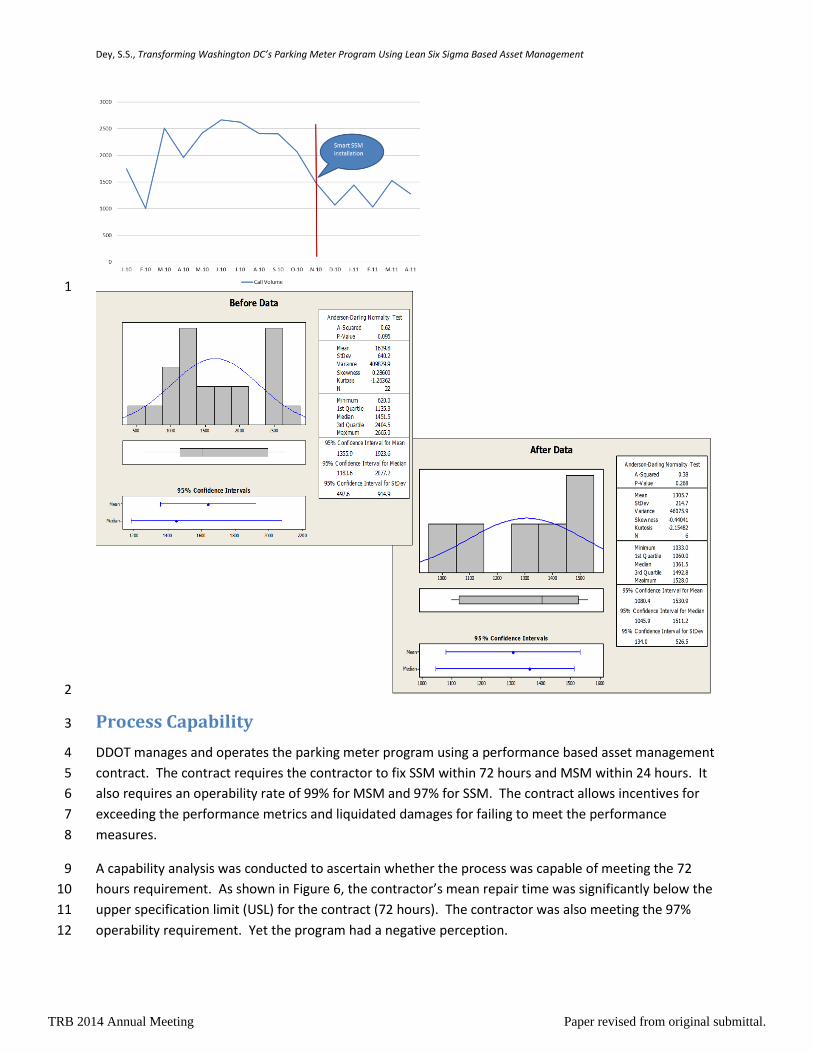
Based on the Pareto analysis and the findings of the pilots, DDOT started replacing its worst performing 3
assets with newer networked assets. Figure 5 shows how the call volumes on the routes dropped after 4
new assets were installed. Mean testing of the call volumes was conducted before and after the 5
installation and the means were found to be statistically different. 6
Similar before and after mean testing was conducted on revenues for routes where new assets were 7
installed. The analysis revealed that asset refresh resulted in higher revenues as well [27]. This was 8
most likely driven by two factors; (a) newer meters had better uptimes and were less likely to break 9
down, and (b) the newer networked assets accepted credit cards, hence customers had two options to 10
pay at these meters – coin or credit/debit card. 11
FIGURE 5. Mean Testing for Routes with New Assets 12
TRB 2014 Annual Meeting Paper revised from original submittal.
Dey, S.S., Transforming Washington DC’s Parking Meter Program Using Lean Six Sigma Based Asset Management
11
1
2
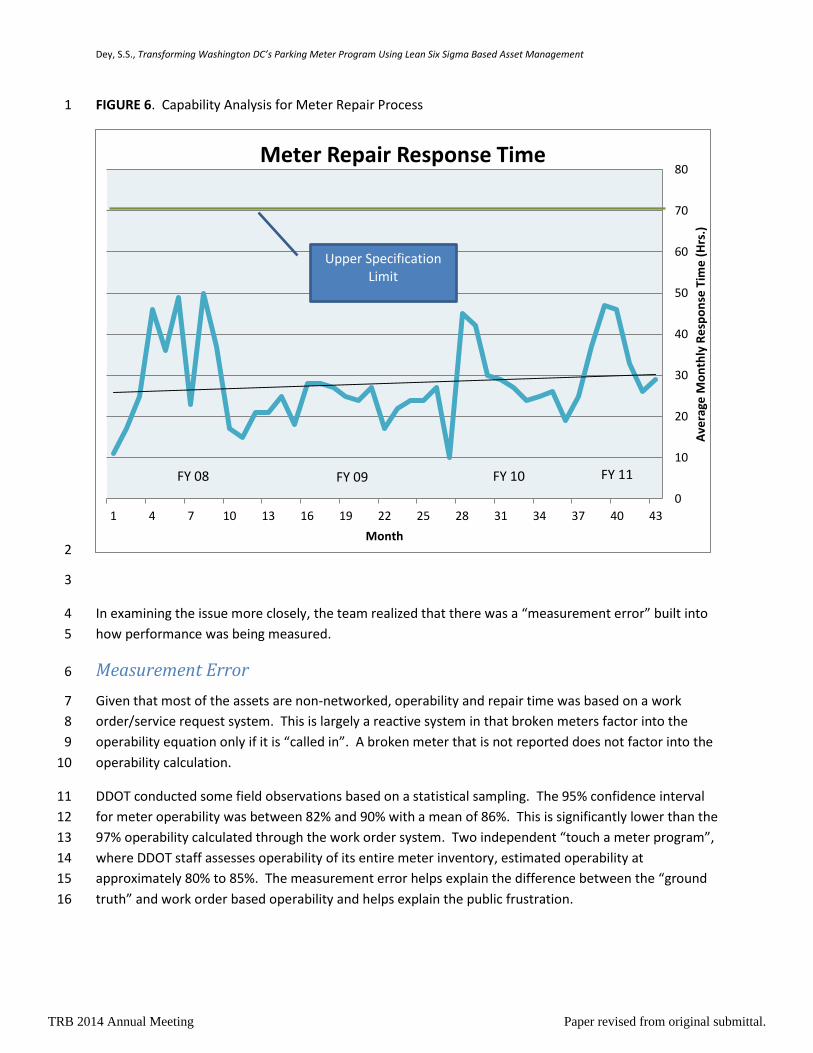
Process Capability 3
DDOT manages and operates the parking meter program using a performance based asset management 4
contract. The contract requires the contractor to fix SSM within 72 hours and MSM within 24 hours. It 5
also requires an operability rate of 99% for MSM and 97% for SSM. The contract allows incentives for 6
exceeding the performance metrics and liquidated damages for failing to meet the performance 7
measures. 8
A capability analysis was conducted to ascertain whether the process was capable of meeting the 72 9
hours requirement. As shown in Figure 6, the contractor’s mean repair time was significantly below the 10
upper specification limit (USL) for the contract (72 hours). The contractor was also meeting the 97% 11
operability requirement. Yet the program had a negative perception. 12
TRB 2014 Annual Meeting Paper revised from original submittal.
Dey, S.S., Transforming Washington DC’s Parking Meter Program Using Lean Six Sigma Based Asset Management
12
FIGURE 6. Capability Analysis for Meter Repair Process 1
2
3
In examining the issue more closely, the team realized that there was a “measurement error” built into 4
how performance was being measured. 5
Measurement Error 6
Given that most of the assets are non-networked, operability and repair time was based on a work 7
order/service request system. This is largely a reactive system in that broken meters factor into the 8
operability equation only if it is “called in”. A broken meter that is not reported does not factor into the 9
operability calculation. 10
DDOT conducted some field observations based on a statistical sampling. The 95% confidence interval 11
for meter operability was between 82% and 90% with a mean of 86%. This is significantly lower than the 12
97% operability calculated through the work order system. Two independent “touch a meter program”, 13
where DDOT staff assesses operability of its entire meter inventory, estimated operability at 14
approximately 80% to 85%. The measurement error helps explain the difference between the “ground 15
truth” and work order based operability and helps explain the public frustration. 16
0
10
20
30
40
50
60
70
80
1 4 7 10 13 16 19 22 25 28 31 34 37 40 43
Ave
rage
Mo
nth
ly R
esp
on
se T
ime
(H
rs.)
Month
Meter Repair Response Time
FY 08 FY 09 FY 10 FY 11
Upper Specification Limit
TRB 2014 Annual Meeting Paper revised from original submittal.
Dey, S.S., Transforming Washington DC’s Parking Meter Program Using Lean Six Sigma Based Asset Management
13
Process Flow Charts 1
DDOT also spent a considerable amount of time mapping out the various processes related to parking 2
and curbside management. The parking function in DDOT is very fragmented with individual groups 3
responsible for policy, operations, signage, permitting and enforcement. Process mapping techniques 4
revealed inefficiencies such as hidden factories, bottlenecks and non-value added activities. It was also 5
apparent that there were delays whenever there was a hand-off of responsibilities between different 6
groups in DDOT. Process mapping allowed DDOT to get a common understanding of the process and 7
responsibilities and identify inefficiencies [28]. 8
IMPLEMENTATION 9
Based on the LSS analysis and the findings of the parking pilots in 2010, DDOT implemented a series of 10
changes to its parking meter program with dramatic results. These included: 11
• Significantly increased the number of networked assets by implementing new networked, credit 12 card accepting single space meters and increased the coverage provided by MSMs. 13
• Launched a citywide pay by cell program – Following two very successful pilots, DDOT launched 14 a citywide pay by cell program in July 2011. The program turned out to be the most successful 15 pay by cell program in the country. In less than two years since launch, the program has 16 600,000 customers and has resulted in over 7 million transactions accounting for over 40% of 17 the annual parking revenue [29]. 18
• Issued a new RFP for the next generation parking asset management – DDOT issued a new RFP 19 for maintaining and managing its parking meter assets for the next five years. The contract is 20 structured as a performance based contract with liquidated damages and incentive/disincentive 21 clauses. It is also structured to make sure that the City is not locked into paying for services that 22 it does not require. Recognizing that the asset mix and revenue mix would change substantially 23 over the next five years, the contract has fixed price elements, fixed unit prices by asset type for 24 maintenance, and percentage fee for items such as coin collection and credit card processing. It 25 also requires use of LSS techniques for program management and an integrated back-end 26 system for asset monitoring and management [30]. 27
28
WASHINGTON, DC’S MIGRATION PATH 29
Non-Communicating Assets to Networked “Smart Assets” 30
DDOT started a systematic process of phasing out non-communicating meters with networked assets. 31
The change out was done in a systematic manner based on the findings of the bad actor report. MSM 32
meters were written into the standard specifications and incorporated as part of capital improvements 33
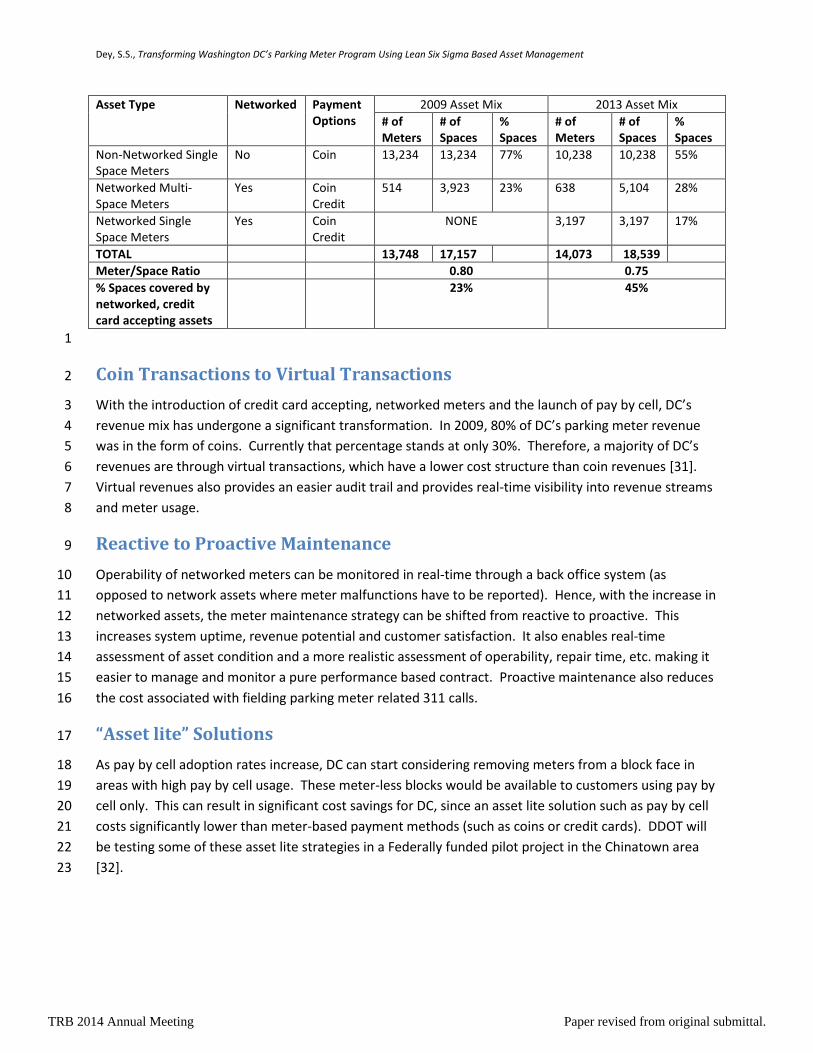
such as streetscape projects. Table 3 shows how the asset mix has changed over the last three years. 34
The number of spaces that are covered by credit card accepting, networked meters jumped from 23% in 35
2009 to 45% in 2013. 36
TABLE 3. Washington, DC’s Changing Asset Mix for Parking Meters (2009 and 2013) 37
TRB 2014 Annual Meeting Paper revised from original submittal.
Dey, S.S., Transforming Washington DC’s Parking Meter Program Using Lean Six Sigma Based Asset Management
14
Asset Type Networked Payment Options
2009 Asset Mix 2013 Asset Mix
# of Meters
# of Spaces
% Spaces
# of Meters
# of Spaces
% Spaces
Non-Networked Single Space Meters
No Coin 13,234 13,234 77% 10,238 10,238 55%
Networked Multi-Space Meters
Yes Coin Credit
514 3,923 23% 638 5,104 28%
Networked Single Space Meters
Yes Coin Credit
NONE 3,197 3,197 17%
TOTAL 13,748 17,157 14,073 18,539
Meter/Space Ratio 0.80 0.75
% Spaces covered by networked, credit card accepting assets
23% 45%
1
Coin Transactions to Virtual Transactions 2
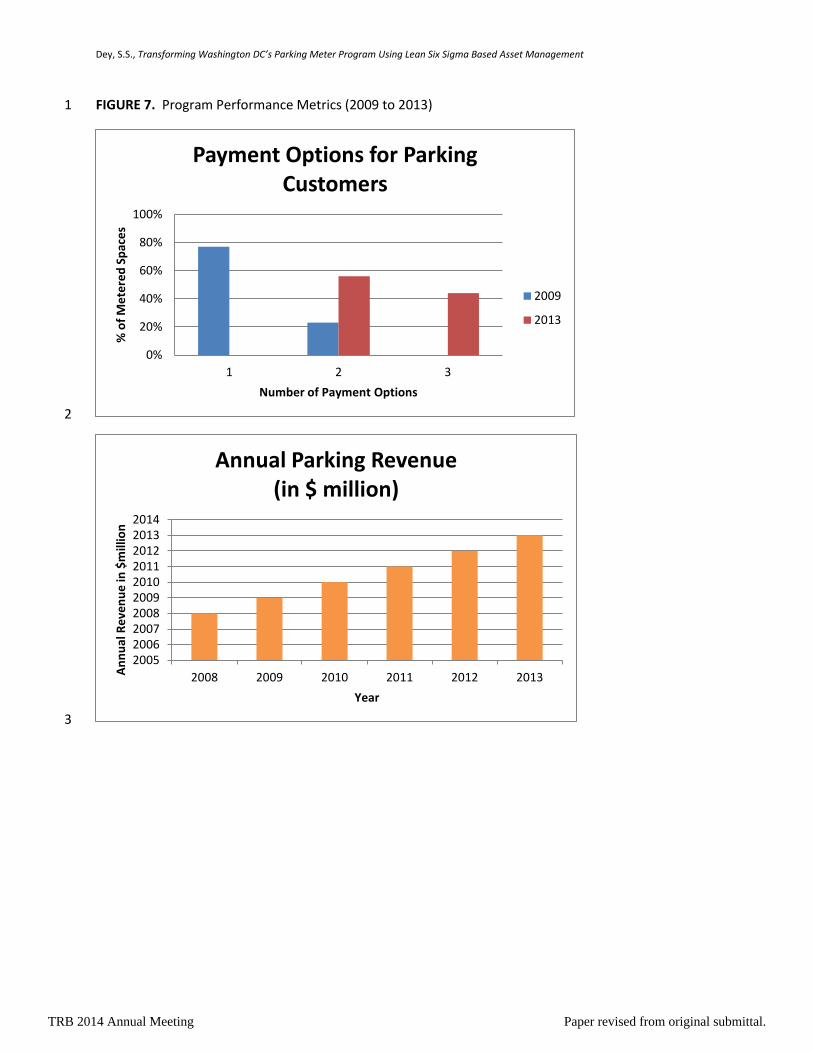
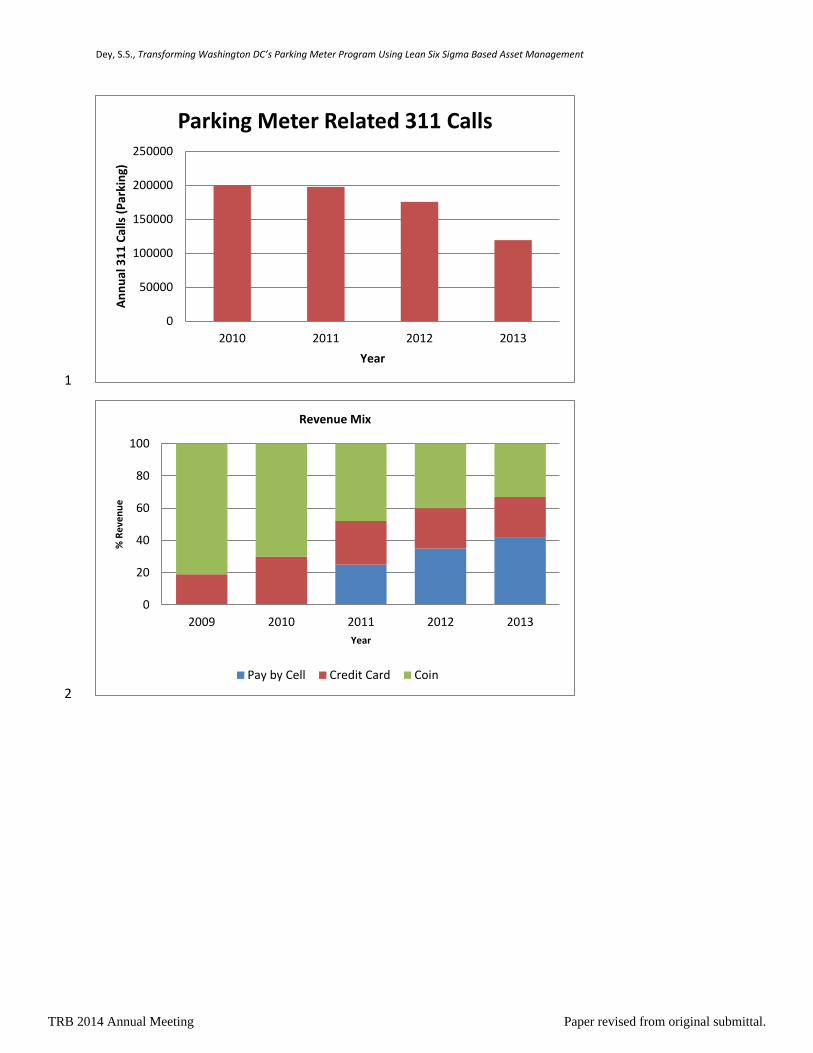
With the introduction of credit card accepting, networked meters and the launch of pay by cell, DC’s 3
revenue mix has undergone a significant transformation. In 2009, 80% of DC’s parking meter revenue 4
was in the form of coins. Currently that percentage stands at only 30%. Therefore, a majority of DC’s 5
revenues are through virtual transactions, which have a lower cost structure than coin revenues [31]. 6
Virtual revenues also provides an easier audit trail and provides real-time visibility into revenue streams 7
and meter usage. 8
Reactive to Proactive Maintenance 9
Operability of networked meters can be monitored in real-time through a back office system (as 10
opposed to network assets where meter malfunctions have to be reported). Hence, with the increase in 11
networked assets, the meter maintenance strategy can be shifted from reactive to proactive. This 12
increases system uptime, revenue potential and customer satisfaction. It also enables real-time 13
assessment of asset condition and a more realistic assessment of operability, repair time, etc. making it 14
easier to manage and monitor a pure performance based contract. Proactive maintenance also reduces 15
the cost associated with fielding parking meter related 311 calls. 16
“Asset lite” Solutions 17
As pay by cell adoption rates increase, DC can start considering removing meters from a block face in 18
areas with high pay by cell usage. These meter-less blocks would be available to customers using pay by 19
cell only. This can result in significant cost savings for DC, since an asset lite solution such as pay by cell 20
costs significantly lower than meter-based payment methods (such as coins or credit cards). DDOT will 21
be testing some of these asset lite strategies in a Federally funded pilot project in the Chinatown area 22
[32]. 23
TRB 2014 Annual Meeting Paper revised from original submittal.
Dey, S.S., Transforming Washington DC’s Parking Meter Program Using Lean Six Sigma Based Asset Management
15
RESULTS 1
Program performance can be measured across various dimensions. The parking meter program has 2
gone through a transformation as a result of LSS analysis and follow-through. The following section 3
discusses some of the accomplishments. 4
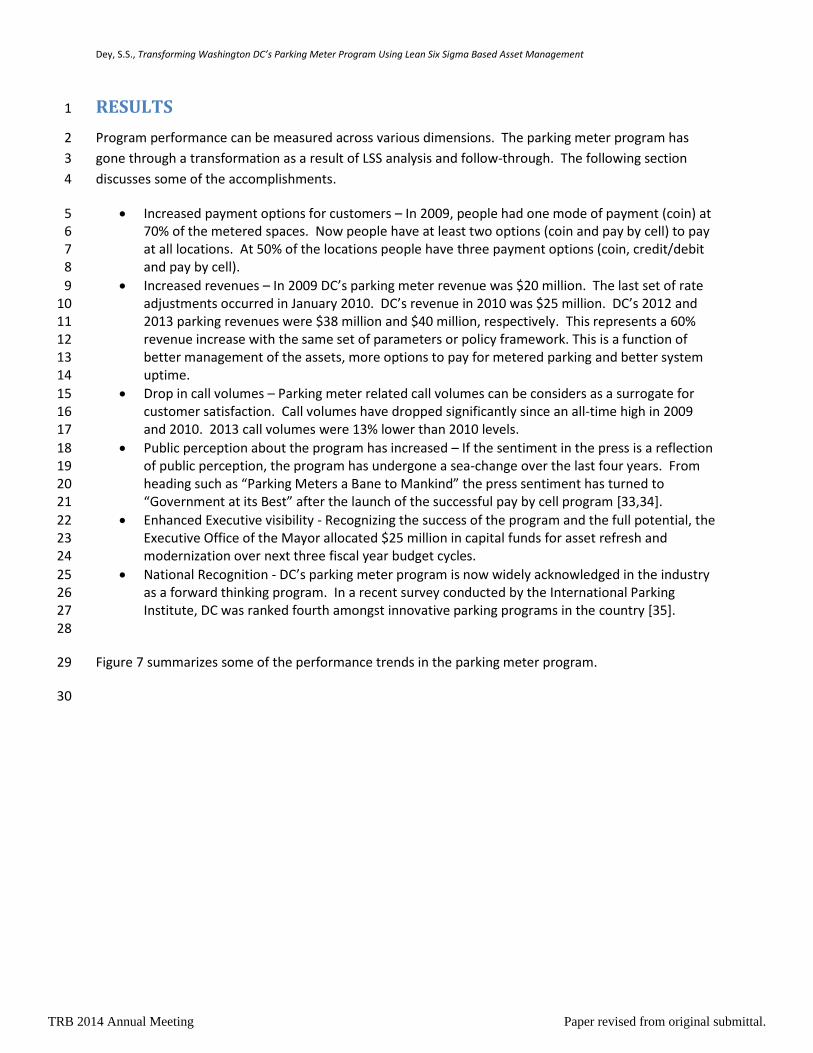
Increased payment options for customers – In 2009, people had one mode of payment (coin) at 5 70% of the metered spaces. Now people have at least two options (coin and pay by cell) to pay 6 at all locations. At 50% of the locations people have three payment options (coin, credit/debit 7 and pay by cell). 8
Increased revenues – In 2009 DC’s parking meter revenue was $20 million. The last set of rate 9 adjustments occurred in January 2010. DC’s revenue in 2010 was $25 million. DC’s 2012 and 10 2013 parking revenues were $38 million and $40 million, respectively. This represents a 60% 11 revenue increase with the same set of parameters or policy framework. This is a function of 12 better management of the assets, more options to pay for metered parking and better system 13 uptime. 14
Drop in call volumes – Parking meter related call volumes can be considers as a surrogate for 15 customer satisfaction. Call volumes have dropped significantly since an all-time high in 2009 16 and 2010. 2013 call volumes were 13% lower than 2010 levels. 17
Public perception about the program has increased – If the sentiment in the press is a reflection 18 of public perception, the program has undergone a sea-change over the last four years. From 19 heading such as “Parking Meters a Bane to Mankind” the press sentiment has turned to 20 “Government at its Best” after the launch of the successful pay by cell program [33,34]. 21
Enhanced Executive visibility - Recognizing the success of the program and the full potential, the 22 Executive Office of the Mayor allocated $25 million in capital funds for asset refresh and 23 modernization over next three fiscal year budget cycles. 24
National Recognition - DC’s parking meter program is now widely acknowledged in the industry 25 as a forward thinking program. In a recent survey conducted by the International Parking 26 Institute, DC was ranked fourth amongst innovative parking programs in the country [35]. 27
28
Figure 7 summarizes some of the performance trends in the parking meter program. 29
30
TRB 2014 Annual Meeting Paper revised from original submittal.
Dey, S.S., Transforming Washington DC’s Parking Meter Program Using Lean Six Sigma Based Asset Management
16
FIGURE 7. Program Performance Metrics (2009 to 2013) 1
2
3
0%
20%
40%
60%
80%
100%
1 2 3
% o
f M
ete
red
Sp
ace
s
Number of Payment Options
Payment Options for Parking Customers
2009
2013
2005200620072008200920102011201220132014
2008 2009 2010 2011 2012 2013An
nu
al R
eve
nu
e in
$m
illio
n
Year
Annual Parking Revenue (in $ million)
TRB 2014 Annual Meeting Paper revised from original submittal.
Dey, S.S., Transforming Washington DC’s Parking Meter Program Using Lean Six Sigma Based Asset Management
17
1
2
0
50000
100000
150000
200000
250000
2010 2011 2012 2013
An
nu
al 3
11
Cal
ls (
Par
kin
g)
Year
Parking Meter Related 311 Calls
0
20
40
60
80
100
2009 2010 2011 2012 2013
% R
eve
nu
e
Year
Revenue Mix
Pay by Cell Credit Card Coin
TRB 2014 Annual Meeting Paper revised from original submittal.
Dey, S.S., Transforming Washington DC’s Parking Meter Program Using Lean Six Sigma Based Asset Management
18
LESSONS LEARNED 1
This section lists some of the key success factors/lessons learned for LSS applications. 2
Get Executive Buy-In – For a program such as LSS to work, there needs to be a commitment and buy-in 3
at the executive level. At DDOT all key executives (the Director, Deputy Director, Associate Directors 4
and Chief-of-Staff) went through six sigma black belt training. This “signaled” the agency staff about the 5
importance of LSS and set the tone for the program within the agency. The executives in turn have deep 6
appreciation of the process and its potential. 7
Develop a Core Group of Champions – Build a core group of LSS champions throughout the agency. This 8
core group needs to comprise of individuals that can adapt to change, believe in the benefits of data-9
based decision making, are enthusiastic about applying the concept to their program areas and can 10
mentor other people in the organization. At DDOT, this core group got subsequent training in a six 11
sigma train-the-trainer course. 12
Institutionalize LSS – Develop training program(s) and provide infrastructure support for the concept to 13
promulgate throughout the agency. LSS is now part of DDOT’s standard curriculum through the training 14
office. 15
Apply LSS to “Right Projects” - It helps if LSS is applied to a project of critical interest. This ensures 16
executive support, continuing momentum and sense of urgency. For DDOT, the parking meter program 17
was one of the highest priority problems that needed to be fixed. In addition, black belt certification 18
requires participants to work on a real-life project. Having executive leadership trained ensured that LSS 19
was being applied to projects of critical interest to the agency. 20
Share Success Stories – Ensure that success stories are shared throughout the organization. DDOT (and 21
the DC government) has a performance/data-based culture. Sharing tangible benefits achieved through 22
application of LSS is part of the natural performance reporting process. 23
Be Patient, Maintain Momentum – Agency transformation through LSS is a marathon, not a sprint. 24
Success requires patience, discipline and sustained focus over a period of time. 25
CONCLUSION 26
Application of LSS helped transform the parking meter program which used to be a source of frustration 27
for DDOT and its customers. LSS helped identify fundamental issues with the program and helped DDOT 28
to aggressively chart a path forward using a fact-based decision making process. Following the success 29
of the parking program, LSS has been applied to other asset classes and programs at DDOT as well. The 30
principles and tools from LSS have been successfully applied to streetlights, urban forestry, traffic 31
control officers and safety service patrols. 32
The current trends in public sector transportation agencies towards increased use of performance 33
management/measurement, higher level of citizen engagement and operating in a financially 34
constrained environment can serve as a catalyst to adopt process improvement efforts such as LSS. 35
TRB 2014 Annual Meeting Paper revised from original submittal.
Dey, S.S., Transforming Washington DC’s Parking Meter Program Using Lean Six Sigma Based Asset Management
19
Applied correctly, it has the potential to provide the framework for achieving sustainable improvements 1
to business processes and service delivery. 2
3
TRB 2014 Annual Meeting Paper revised from original submittal.
Dey, S.S., Transforming Washington DC’s Parking Meter Program Using Lean Six Sigma Based Asset Management
20
REFERENCES 1
1. District Department of Transportation. Action Agenda – DDOT Delivers. 2010. 2 http://www.dc.gov/DC/DDOT/About+DDOT/Who+We+Are/Action+Agenda/Action+Agenda+-3 +2010. Accessed October 23, 2013. 4
2. DDOT Press Release. DDOT Announces DC Parking Meter Rate Increase. February 26, 2009. 5 http://newsroom.dc.gov/show.aspx/agency/ddot/section/2/release/16237. Accessed October 6 23, 2013. 7
3. Council of the District of Columbia. Fiscal Year 2010 Budget Support Act of 2009. May 2009. 8 4. DCMR. Title 18. Chapter 18-24. Section 18-2404. ” Parking Meter and Parking Meter Zones”. 9
Effective 12/26/2011. 10 5. Michael Neibauer. More Money, More Problems for District Parking Meters. Examiner. March 11
1, 2009. 12 6. Tom Bridge. The Difficulty with Parking Meters. September 23, 2010. 13
http://www.welovedc.com/2010/09/23/the-difficulty-with-parking-meters/. Accessed October 14 25, 2013. 15
7. Dey, S.S. and J. Thommana. “Agency Performance Management in the Digital Age”. October 16 2013. Unpublished. 17
8. DC CapStat Session. 911, 311 and Customer Service. October 29, 2009. 18 9. DC Office of Unified Communications. 2009 Customer Service Survey Data. 2009. 19 10. Michael Neibauer. Area Drivers File a Record Number of DC Parking Meter Complaints. The 20
Examiner. November 26, 2008. http://washingtonexaminer.com/area-drivers-file-record-21 number-of-d.c.-parking-meter-complaints/article/104732. Accessed July 28, 2013. 22
11. Jim Newell. Parking Meters Out to Destroy the Human Race. NBC4 News. February 24, 2009. 23 http://www.nbcwashington.com/news/local/Local-Parking-Meters-Develop-Artificial-24 Intelligence-Will-Destroy-Humans.html. Accessed July 28, 2013. 25
12. EPA, The Environmental Professional’s Guide to Lean and Six Sigma, EPA-100-K-09-006, August 26 2009. 27
13. Snyder, Kent and Peters, Newton. White Paper – Lean Six Sigma in the Public Sector, Xerox 28 Corporation, September 2004. 29
14. American Strategic Management Institute. Six Sigma Excellence Summit - Course Materials. July 30 2010. 31
15. The Performance Institute. Lean Six Sigma Train-the-Trainer Course Materials. May 2011. 32 16. The Performance Institute, Lean Six Sigma Black Belt Certification Course Materials, 2010. 33 17. Maleyeff, John. Improving Service Delivery in Government with Lean Six Sigma. IBM Center for 34
the Business of Government, 2007. 35 18. City of Fort Wayne, Indiana. Mayor to be Keynote Speaker at Six Sigma Event in California. 2006. 36
http://www.cityoffortwayne.org/news-archive/974-mayor-to-be-keynote-speaker-at-six-sigma-37 event-in-california.html. Accessed October 25, 2013. 38
19. City of Irving Innovates Services with Lean Six Sigma. http://www.tmac.org/node/102. Accessed 39 October 25, 2013. 40
20. Lean Six Sigma Success Stories in Transportation and Travel Industries. 41 http://www.goleansixsigma.com/lean-six-sigma-success-stories-in-transportation-and-travel-42 industries/. Accessed October 25, 2013. 43
21. Helferich, K. Application of Six Sigma to Humanitarian Relief Logistics. 2013 TRB Annual 44 Meeting, Session 383, Paper P13-5944. 45
22. Hanna, Awad et. al. Applying Lean Techniques in the Delivery of Transportation Infrastructure 46 Projects. 2011 TRB Annual Meeting, Session 388, Paper 11-1405. 47
TRB 2014 Annual Meeting Paper revised from original submittal.
Dey, S.S., Transforming Washington DC’s Parking Meter Program Using Lean Six Sigma Based Asset Management
21
23. Han, Seung Heon et. al. Six Sigma-Based Approach to Improve Performance in Construction 1 Operations. Journal of Management in Engineering, pp21-31, 2008-1. 2
24. DDOT. Pre-Bid Conference - Asset Management Services for Parking Meter Assets Citywide. 3 December 2, 2011. 4 http://app.ocp.dc.gov/RUI/information/scf/solicitation_detail.asp?solicitation=DCKA-2012-R-5 0018. Accessed October 24, 2013. 6
25. Dey, S.S. and T. Viteri. “Washington, DC Pilots New Meter Programs to Enhance Its Parking 7 System.” The Parking Professional, July 2011. 8
26. SAIC, Parking Meter Performance Audit Report, Task 1 – Program Assessment Report. Prepared 9 for DDOT. December 2009. 10
27. Dey, S.S., S.Dock and E. Patterson. “Economic Implications of Changing Dynamics for Metered 11 On-Street Parking”. Unpublished. 12
28. SAIC, Strategic Parking Plan. Prepared for DDOT, September 2010. 13 29. Dey, S.S. and A. Rao. “Dialing and Thriving” The Parking Professional, August 2013. 14 30. Office of Contract & Procurement, DDOT. Asset Management Services for Parking Meter Assets 15
Citywide, DCKA-2012-R-0018, November 2011. 16 31. Dey, S.S., “Asset Lite Solutions to Metered Curbside Parking”, ITE Annual Meeting, August 4-7, 17
2013, Boston, MA. 18 32. DDOT, Multimodal Value Pricing for Metered Curbside Parking, 2012 Discretionary Grant 19
Program – Value Pricing Pilot Grant Application, January 2012. 20 http://s3.documentcloud.org/documents/407820/ddot-value-pricing-pilot-program-grant-21 proposal.pdf. Accessed July 31, 2013. 22
33. David Alpert. An Example of Government at Its Best. The Washington Post. October 18, 2011. 23 http://www.washingtonpost.com/blogs/all-opinions-are-local/post/an-example-of-government-24 at-its-best/2011/03/22/gIQA332RuL_blog.html. Accessed July 29, 2013. 25
34. Justin Jouvenal. DC Rolls Out Pay by Phone Parking Meter System. Washington Post. April 20, 26 2011. http://www.washingtonpost.com/local/dc-rolls-out-pay-by-phone-parking-meter-27 system/2011/04/20/AFg9pSEE_story.html Accessed July 29, 2013. 28
35. International Parking Institute. 2013 Emerging Trends in Parking. May 2013. 29 http://www.parking.org/media/emerging-trends-in-parking.aspx. Accessed July 28, 2013. 30
31
TRB 2014 Annual Meeting Paper revised from original submittal.
Related Documents