Using Landscape Typologies to Model Socioecological Systems Sujith Surendran Nair Ben Preston Anthony King Rui Mei Using landscape typologies to model socioecological systems: Application to agriculture of the United States Gulf Coast. Submitted to Environmental Modeling and Software

Welcome message from author
This document is posted to help you gain knowledge. Please leave a comment to let me know what you think about it! Share it to your friends and learn new things together.
Transcript

Using Landscape Typologies to Model Socioecological Systems Sujith Surendran Nair Ben Preston Anthony King Rui Mei
Using landscape typologies to model socioecological systems: Application to agriculture of the United States Gulf Coast. Submitted to Environmental Modeling and Software

Hierarchical clustering to create typologies
Clustering to create typologies
Meudt et al. BMC Evolutionary Biology 2009 9:111 doi:10.1186/1471-2148-9-111

Input variables for clustering
Socioeconomic Variables (County) Size of farm holding 1982-2007 Agriculture Census, USDA Farm production intensity 1986-2010 NASS-USDA and US BEA Farm specialization 1986-2010 NASS-USDA and US BEA Total factor productivity 1986-2010 InSTePP Database Population and population density 1986-2010 US Census Bureau Road connectivity 1990-2010 US Census Bureau Household income 1986-2010 US Census Bureau, American Community Survey Unemployment 1986-2010 US Census Bureau Education 1986-2010 US Census Bureau
Variables Time Span Data Source Climate 1981-2010 DayMet (30 years monthly, growing-season and annual mean and standard deviations at 18 km2 grid) Soil (Components in map unit key) STATSGO Topography (Average and standard deviation NED, USGS HUC-12 watersheds)

Mapped typologies
a. Climate b. Soil c. Topography d. Socioeconomic e. Bio-Physical (BPT) f. Socio-Ecological (SET)
Typologies
2,410 unique BPT types 4,429 unique SET types
BPT SET
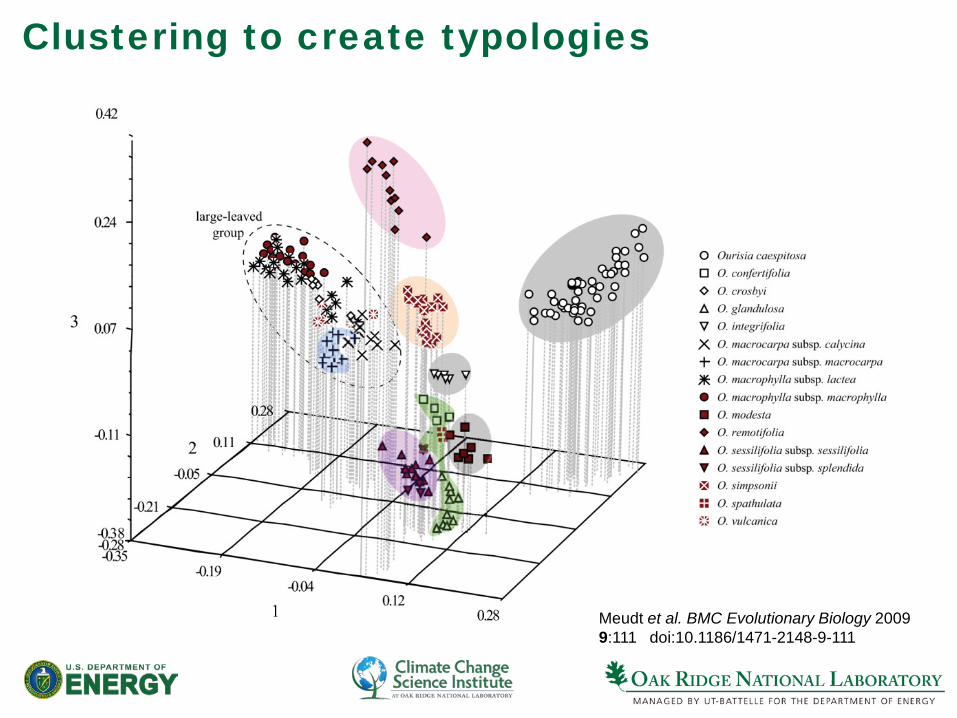
Regression modeling with types as predictor variables
BPT model SET model Ycorn = Flinear(types)

Results from BPT and SET models for corn yield
Property BPT SET
Adjusted R2 0.72 0.89
Share of typologies† (%)
Climate 55 38
Soil 33 17
Topography 12 8
Socioeconomic 37
Number of types dropped from BPT and new types added to SET
Climate 6 18
Soil 4 3
Topography 3 1
Socioeconomic 37
Friedman’s Two-way Analysis of Variance‡
Observed Corn Yield 19.92 0.05
BPT vs. SET 13.92
Partial F test††† 114.44
Including socioeconomic variables explained more of the regional spatial variation in 25-year mean corn yields

Social Vulnerability: loss to climate hazards Climate Topography Socio-economic
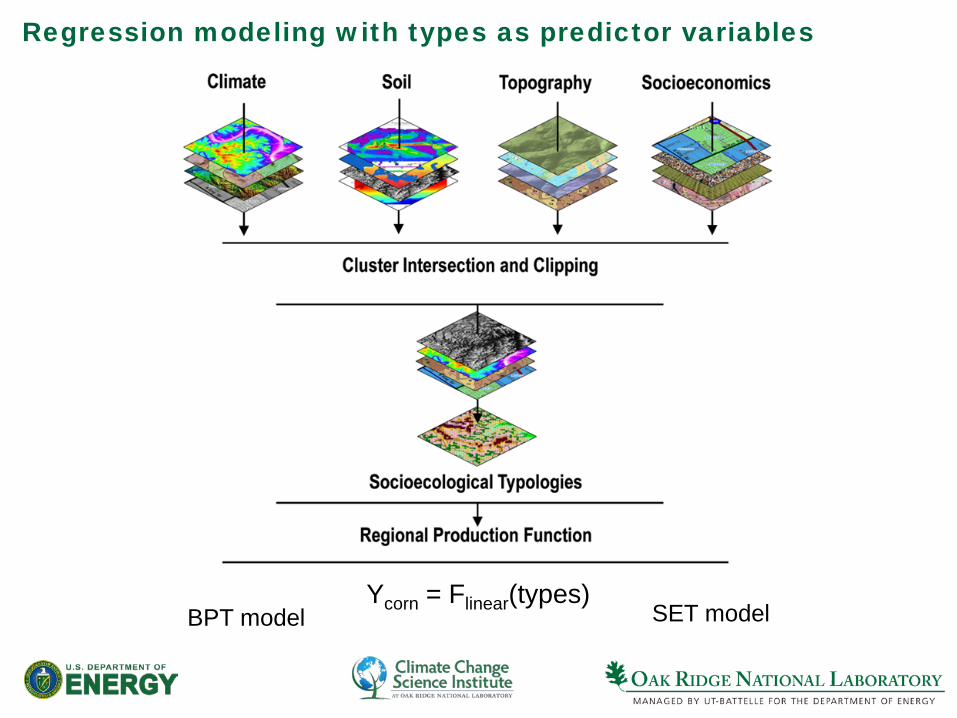
Social Vulnerability
Socioecological Typology
Social Vulnerability Index (SoVI)
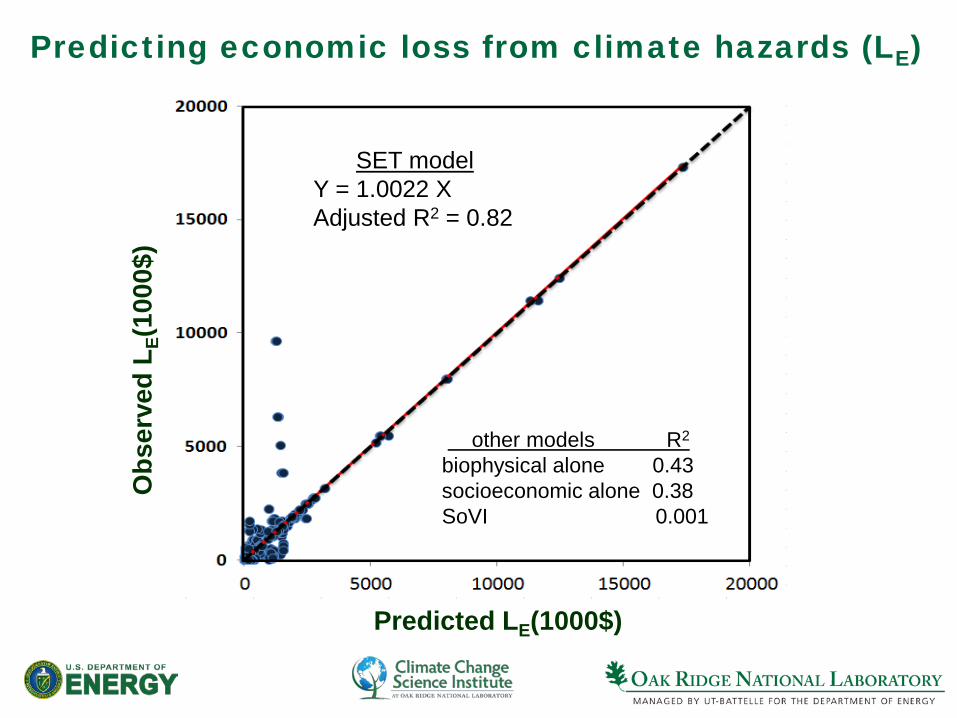
Predicting economic loss from climate hazards (LE)
Predicted LE(1000$)
Obs
erve
d L E
(100
0$)
other models R2 biophysical alone 0.43 socioeconomic alone 0.38 SoVI 0.001
SET model Y = 1.0022 X Adjusted R2 = 0.82

So…

So… typologies and CESM
1. Attribution might inform choice of variables for: a. Scenarios of future socioeconomic forcings b. Endogenous variables in CESM >2
2. Post processing of CESM projections: a. Typological differences
--- how does a future typology compare with the historic BPT straightforward, but future SET will be constrained by projection of socioeconomic variables b. Use future typology with the historical empirical model to project
future values for the target variable c. Evaluate functional responses --- does the relationship between
target variable and typology in the future match the historical
3. Use types within CESM --- analogous to plant functional types
Relevance to SDWG
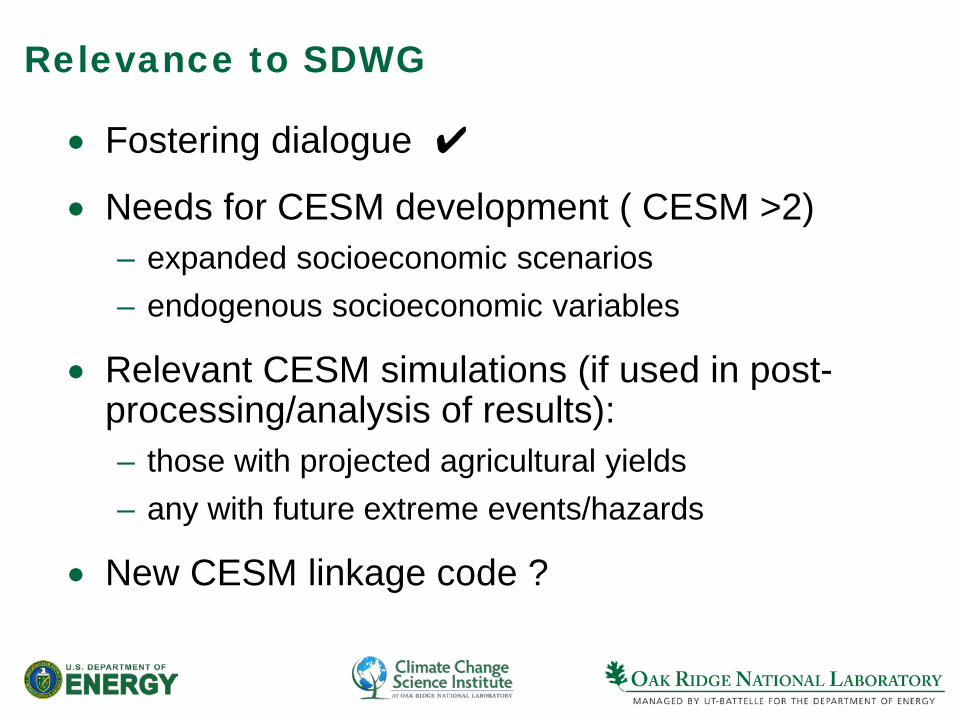
• Fostering dialogue ✔
• Needs for CESM development ( CESM >2) – expanded socioeconomic scenarios – endogenous socioeconomic variables
• Relevant CESM simulations (if used in post-processing/analysis of results): – those with projected agricultural yields – any with future extreme events/hazards
• New CESM linkage code ?

Hierarchical clustering to create typologies

Hierarchical clustering to create typologies
http://www.ied.edu.hk/apfslt/v6_issue2/foreword/foreword4.htm

Selecting the typology (level of clustering)

Hierarchical clustering to create typologies

Predicted versus observed corn yield
Obs
erve
d
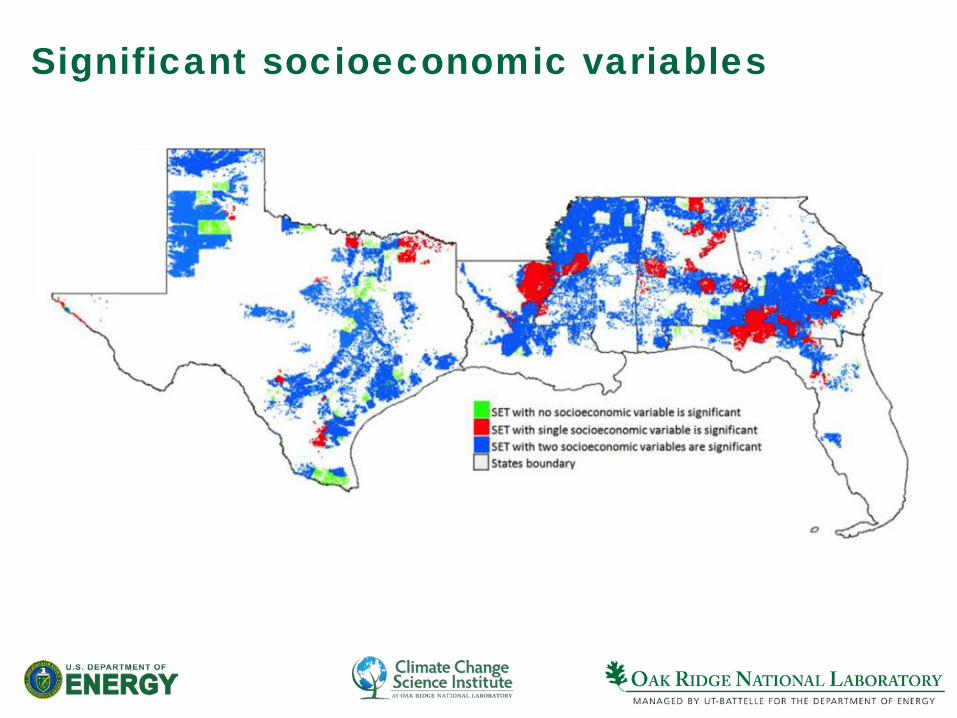
Significant socioeconomic variables

Significant socioeconomic variables
FSize: Farm Size FSp: Farm Specialization FInt: Farming Intensity TFP: Total Factor Productivity Edu: Education PDen: Population Density HIn: Household Median Income Rlength: Road Length.
Related Documents