Using Graphical Representation of User Interfaces as Visual References by Tsung-Hsiang Chang Submitted to the Electrical Engineering and Computer Science in partial fulfillment of the requirements for the degree of Doctor of Philosophy at the MASSACHUSETTS INSTITUTE OF TECHNOLOGY June 2012 c ⃝ Massachusetts Institute of Technology 2012. All rights reserved. Author ............................................................. Electrical Engineering and Computer Science May 23, 2012 Certified by ......................................................... Rob Miller Associate Professor Thesis Supervisor Accepted by ......................................................... Leslie A. Kolodziejski Chair of the Committee on Graduate Students

Welcome message from author
This document is posted to help you gain knowledge. Please leave a comment to let me know what you think about it! Share it to your friends and learn new things together.
Transcript

Using Graphical Representation of User Interfaces asVisual References
by
Tsung-Hsiang Chang
Submitted to the Electrical Engineering and Computer Sciencein partial fulfillment of the requirements for the degree of
Doctor of Philosophy
at the
MASSACHUSETTS INSTITUTE OF TECHNOLOGY
June 2012
c⃝ Massachusetts Institute of Technology 2012. All rights reserved.
Author . . . . . . . . . . . . . . . . . . . . . . . . . . . . . . . . . . . . . . . . . . . . . . . . . . . . . . . . . . . . .Electrical Engineering and Computer Science
May 23, 2012
Certified by . . . . . . . . . . . . . . . . . . . . . . . . . . . . . . . . . . . . . . . . . . . . . . . . . . . . . . . . .Rob Miller
Associate ProfessorThesis Supervisor
Accepted by. . . . . . . . . . . . . . . . . . . . . . . . . . . . . . . . . . . . . . . . . . . . . . . . . . . . . . . . .Leslie A. Kolodziejski
Chair of the Committee on Graduate Students
Using Graphical Representation of User Interfaces as Visual
References
by
Tsung-Hsiang Chang
Submitted to the Electrical Engineering and Computer Scienceon May 23, 2012, in partial fulfillment of the
requirements for the degree ofDoctor of Philosophy
AbstractMy thesis investigates using a graphical representation of user interfaces - screenshots -as a direct visual reference to support various kinds of applications. We have built severalsystems to demonstrate and validate this idea in domains like searching documentation,GUI automation and testing, and cross-device information migration. In particular, SikuliSearch enables users to search documentation using screenshots of GUI elements instead ofkeywords. Sikuli Script enables users to programmatically control GUIs without supportfrom the underlying applications. Sikuli Test lets GUI developers and testers create testscripts without coding. Deep Shot introduces a framework and interaction techniques tomigrate work states across heterogeneous devices in one action, taking a picture. We alsodiscuss challenges inherent in screenshot-based interactions and propose potential solutionsand directions of future research.
Thesis Supervisor: Rob MillerTitle: Associate Professor
2

Acknowledgments
This thesis cannot be completed without lots of help from many people.
My advisor, Rob Miller, has been inspiring me since the first day I came to MIT. Tom
Yeh has been working with me for almost every project in this thesis. Randall Davis guides
me to rethink and present my ideas in a very precise and scientific way. Yang Li, who was
my mentor at Google Research, worked with me to build Deep Shot.
My RQE committee, David Karger and Daniel Jackson, also gave me lots of guidance
on Sikuli Test. I also want to thank Maria Rodriguez, Adam Leonard, and Geza Kovacs for
working with me to make Sikuli more interesting, and the whole the User Interface Design
group, Max Goldman, Michael Bernstein, Jones Yu, Adam Marcus, Eirik Bakke, Katrina
Panovich, Juho Kim, Tom Lieber, Angela Chang, Greg Little, Lydia Chilton, Matthew
Webber, Sangmok Han, Yafim Landa, and Richard Chan.
Finally, thank my fiancée, Kay Hsi, and my family for their support and company.
This work wasy supported in part by the National Science Foundation under award
number IIS-0447800, by Quanta Computer as part of the TParty project, and by Google.
Any opinions, findings, conclusions or recommendations expressed in this publication are
those of the authors and do not necessarily reflect the views of the sponsors, or of the people
mentioned above.
3
Contents
1 Introduction 13
1.1 Thesis Statement . . . . . . . . . . . . . . . . . . . . . . . . . . . . . . . 14
1.2 Screenshots as Reference in User Interface Design . . . . . . . . . . . . . 14
1.2.1 Searching Documents . . . . . . . . . . . . . . . . . . . . . . . . 15
1.2.2 GUI Automation . . . . . . . . . . . . . . . . . . . . . . . . . . . 16
1.2.3 GUI Testing . . . . . . . . . . . . . . . . . . . . . . . . . . . . . . 18
1.2.4 Task Migration Across Devices . . . . . . . . . . . . . . . . . . . 18
1.2.5 Combining Pixels and Accessibility Metadata . . . . . . . . . . . . 20
1.3 Common Pitfalls and Remedies . . . . . . . . . . . . . . . . . . . . . . . . 22
1.4 Contribution . . . . . . . . . . . . . . . . . . . . . . . . . . . . . . . . . . 23
2 Related Work 24
2.1 Screenshot-Driven Interaction . . . . . . . . . . . . . . . . . . . . . . . . 24
2.2 Visual References in Programming and GUI Testing . . . . . . . . . . . . . 25
2.3 Screenshot-Driven Information Migration . . . . . . . . . . . . . . . . . . 26
2.4 Connecting Screenshots and the Metadata of a UI . . . . . . . . . . . . . . 27
3 Sikuli 29
3.1 Sikuli Search . . . . . . . . . . . . . . . . . . . . . . . . . . . . . . . . . 30
3.1.1 Screenshot-Driven Search . . . . . . . . . . . . . . . . . . . . . . 30
3.2 Sikuli Script and IDE . . . . . . . . . . . . . . . . . . . . . . . . . . . . . 32
3.2.1 Visual Scripting API . . . . . . . . . . . . . . . . . . . . . . . . . 32
3.2.2 New API . . . . . . . . . . . . . . . . . . . . . . . . . . . . . . . 37
4
3.2.3 Sikuli IDE . . . . . . . . . . . . . . . . . . . . . . . . . . . . . . 38
3.2.4 Writing Screenshot-based Scripts . . . . . . . . . . . . . . . . . . 39
3.2.5 Running and Debugging Scripts . . . . . . . . . . . . . . . . . . . 40
4 GUI Testing with Screenshots and Computer Vision 42
4.1 Interview Study . . . . . . . . . . . . . . . . . . . . . . . . . . . . . . . . 44
4.2 Testing By Visual Automation . . . . . . . . . . . . . . . . . . . . . . . . 45
4.2.1 Simulating Interactions using Action Statements . . . . . . . . . . 47
4.2.2 Verifying Outcomes using Visual Assertion Statements . . . . . . . 47
4.2.3 Examples . . . . . . . . . . . . . . . . . . . . . . . . . . . . . . . 48
4.3 Testing By Demonstration . . . . . . . . . . . . . . . . . . . . . . . . . . 51
4.3.1 Recording Demonstration . . . . . . . . . . . . . . . . . . . . . . 51
4.3.2 Generating Action Statements . . . . . . . . . . . . . . . . . . . . 52
4.3.3 Generating Assertion Statements . . . . . . . . . . . . . . . . . . . 53
4.4 Supporting Good Testing Practices . . . . . . . . . . . . . . . . . . . . . . 54
4.4.1 Unit Testing . . . . . . . . . . . . . . . . . . . . . . . . . . . . . . 54
4.4.2 Regression Testing . . . . . . . . . . . . . . . . . . . . . . . . . . 56
4.4.3 Test-Driven Development . . . . . . . . . . . . . . . . . . . . . . 57
4.5 Evaluation . . . . . . . . . . . . . . . . . . . . . . . . . . . . . . . . . . . 58
4.5.1 Testability Analysis . . . . . . . . . . . . . . . . . . . . . . . . . . 58
4.5.2 Reusability Analysis . . . . . . . . . . . . . . . . . . . . . . . . . 60
4.6 Conclusion . . . . . . . . . . . . . . . . . . . . . . . . . . . . . . . . . . 65
5 Deep Shot 67
5.1 Motivation . . . . . . . . . . . . . . . . . . . . . . . . . . . . . . . . . . . 69
5.2 Deep Shooting and Posting . . . . . . . . . . . . . . . . . . . . . . . . . . 70
5.3 The Deep Shot Framework . . . . . . . . . . . . . . . . . . . . . . . . . . 73
5.3.1 System Components . . . . . . . . . . . . . . . . . . . . . . . . . 74
5.3.2 Protocol Design . . . . . . . . . . . . . . . . . . . . . . . . . . . . 74
5.3.3 Screen Matching Algorithms . . . . . . . . . . . . . . . . . . . . . 78
5.3.4 Content and State Encoding . . . . . . . . . . . . . . . . . . . . . 80
5
5.3.5 Bootstrapping with a Default Responder . . . . . . . . . . . . . . . 80
5.3.6 Supporting Web and Desktop Applications . . . . . . . . . . . . . 81
5.4 Implementation . . . . . . . . . . . . . . . . . . . . . . . . . . . . . . . . 82
5.5 Developing Deep Shot Extensions . . . . . . . . . . . . . . . . . . . . . . 82
5.6 Scenarios . . . . . . . . . . . . . . . . . . . . . . . . . . . . . . . . . . . 83
5.7 Usability Analysis and Technical Evaluation . . . . . . . . . . . . . . . . . 85
5.7.1 Interaction Model and Usability Analysis . . . . . . . . . . . . . . 85
5.7.2 Technical Evaluation . . . . . . . . . . . . . . . . . . . . . . . . . 86
5.8 Conclusion and Future Work . . . . . . . . . . . . . . . . . . . . . . . . . 90
6 PAX 91
6.1 Pixel Analysis Versus Accessibility API . . . . . . . . . . . . . . . . . . . 93
6.1.1 Pixel Analysis . . . . . . . . . . . . . . . . . . . . . . . . . . . . 93
6.1.2 Accessibility API . . . . . . . . . . . . . . . . . . . . . . . . . . . 94
6.2 PAX: A Hybrid Framework . . . . . . . . . . . . . . . . . . . . . . . . . . 96
6.2.1 Designing PAX . . . . . . . . . . . . . . . . . . . . . . . . . . . . 98
6.2.2 Bridging between Accessibility APIs and Pixels . . . . . . . . . . . 100
6.2.3 Determining the Visibility of UI Elements . . . . . . . . . . . . . . 101
6.2.4 Region-based Hit Testing . . . . . . . . . . . . . . . . . . . . . . . 101
6.2.5 Text Detection and Extraction From Pixels . . . . . . . . . . . . . 102
6.2.6 Text Image Segmentation Given the Text . . . . . . . . . . . . . . 104
6.2.7 Matching Accessibility Metadata with What Users See . . . . . . . 106
6.3 Evaluation of Text Algorithms . . . . . . . . . . . . . . . . . . . . . . . . 107
6.3.1 Text Detection Algorithm . . . . . . . . . . . . . . . . . . . . . . 107
6.3.2 Text Segmentation Algorithm . . . . . . . . . . . . . . . . . . . . 108
6.4 Validation Through Example Applications . . . . . . . . . . . . . . . . . . 109
6.4.1 Sikuli Script . . . . . . . . . . . . . . . . . . . . . . . . . . . . . 109
6.4.2 Screen Search . . . . . . . . . . . . . . . . . . . . . . . . . . . . . 111
6.4.3 Screen Copy . . . . . . . . . . . . . . . . . . . . . . . . . . . . . 113
6.5 Conclusion and Future Work . . . . . . . . . . . . . . . . . . . . . . . . . 114
6

7 Common Pitfalls and Design Principles 117
7.1 Invisible Targets . . . . . . . . . . . . . . . . . . . . . . . . . . . . . . . . 118
7.2 Dynamic Appearance . . . . . . . . . . . . . . . . . . . . . . . . . . . . . 120
7.3 Ambiguity . . . . . . . . . . . . . . . . . . . . . . . . . . . . . . . . . . . 122
7.4 Self-Ambiguity . . . . . . . . . . . . . . . . . . . . . . . . . . . . . . . . 123
7.5 Conclusion . . . . . . . . . . . . . . . . . . . . . . . . . . . . . . . . . . 125
8 Conclusion 126
8.1 Summary . . . . . . . . . . . . . . . . . . . . . . . . . . . . . . . . . . . 128
7

List of Figures
1-1 Sikuli IDE is a script editor specifically designed for writing screenshot-
based scripts. . . . . . . . . . . . . . . . . . . . . . . . . . . . . . . . . . 17
1-2 A user takes a picture of the screen of her computer and then sees the
application with the current state on her phone. Our system recognizes
the application that the user is looking through the camera, automatically
migrates it onto the mobile phone, and recovers its state. . . . . . . . . . . 19
1-3 Comparison between Accessibility metadata and PAX. . . . . . . . . . . . 21
3-1 Sikuli Search allows users to search documentation and save custom anno-
tations for a GUI element using its screenshot (i.e., red rectangle). . . . . . 31
3-2 Examples of Sikuli commands. The first line finds all PDF icons on the
screen and save them into a variable pdfs. Line 4 clicks on a drop-down
box named Location and open it up. Line 7 drags a file “readme.txt” to a
Dropbox folder. Line 9 types “something” into a search box. . . . . . . . . 33
3-3 Spatial operators are used to constrain matching regions. This figure lists
the corresponding regions created with applying each spatial operator on
the region "Alter volume". . . . . . . . . . . . . . . . . . . . . . . . . . . 36
3-4 Comparison between textual view and visual view of a Sikuli script. . . . . 38
3-5 The similarity threshold for matching (.90 in this example) and the point of
click (the red cross) can also be shown with screenshots. . . . . . . . . . . 39
3-6 The user can adjust the similarity threshold and preview the results under
different settings. Here, the threshold is too low so there are many false
positives (the purple areas). . . . . . . . . . . . . . . . . . . . . . . . . . 41
8
3-7 The user can adjust the click offset to the target in the Sikuli IDE. . . . . . 41
4-1 GUI testing (left) traditionally requires human testers to operate the GUI
and verify its behavior visually. Our new testing framework allows the
testers to write visual scripts (right) to automate this labor-intensive task. . . 43
4-2 Sikuli Test interface consists of a test script editor and an information panel
summarizing the test result. . . . . . . . . . . . . . . . . . . . . . . . . . . 46
4-3 An example of taking the difference between two screens to derive the
visual feedback automatically . . . . . . . . . . . . . . . . . . . . . . . . . 54
4-4 Example of automatic generation of assertion statements from detected vi-
sual feedback. . . . . . . . . . . . . . . . . . . . . . . . . . . . . . . . . . 55
4-5 GUI applications used to evaluate the reusability of Sikuli Test scripts as
these applications evolve. Between (a) and (b), there is only one minor
change in the connection settings dialog (a new button below Favourites),
but the dialog has significant changes in (c). As for jEdit, between (d) and
(e), a major change is the disappearance of the tool bar. However, it comes
back with a different style in (f). . . . . . . . . . . . . . . . . . . . . . . . 61
4-6 Example test cases for Capivara . . . . . . . . . . . . . . . . . . . . . . . 62
4-7 Long-term regression testing for Capivara and jEdit. (a) and (c) are tested
with Sikuli Test, while (b) and (d) are done with position-based actions. P
denotes the test was passed, and F1 to F6 are six different causes of failures:
(F1) change in the visual style, e.g. skin, size, font, etc.; (F2) removal of
the action component; (F3) removal of the expected visual feedback; (F4)
change in the surrounding of the target components; (F5) change in internal
behavior; and (F6) change of widget position (only occurred in position-
based tests). . . . . . . . . . . . . . . . . . . . . . . . . . . . . . . . . . . 63
5-1 A user takes a picture of the screen of her computer and then sees the
application with the current state on her phone. Our system recognizes
the application that the user is looking through the camera, automatically
migrates it onto the mobile phone, and recovers its state. . . . . . . . . . . 71
9
5-2 The Deep Shot gallery allows a user to quickly launch an application with
a previously captured work state. A user can flip left or right on the touch
screen to browse the gallery. . . . . . . . . . . . . . . . . . . . . . . . . . 73
5-3 The system architecture of Deep Shot. Solid lines represent direct mes-
sages between components, whereas dotted lines represents the launching
signal sent from the launcher. . . . . . . . . . . . . . . . . . . . . . . . . 75
5-4 The screen matching algorithms match the picture (at the top) against the
screenshot (at the bottom) and find a projective plane (the orange convex)
on it. . . . . . . . . . . . . . . . . . . . . . . . . . . . . . . . . . . . . . 79
5-5 The setup of the reliability experiment. . . . . . . . . . . . . . . . . . . . 87
5-6 The results of the reliability experiment. The total number of trials for each
setting is 20. . . . . . . . . . . . . . . . . . . . . . . . . . . . . . . . . . 88
5-7 The regions the camera sees with a distance 5 to 50 cm away from the
screen while the monitor is parallel to the phone. . . . . . . . . . . . . . . 89
6-1 Low-resolution and antialiased text on the screen is very difficult to be
recognized with off-the-shelf OCR engines. . . . . . . . . . . . . . . . . . 95
6-2 The tree of PAX UI elements. The yellow nodes, created using accessibility
and window manager information. The red nodes are the elements exposed
using accessibility APIs, while the green ones are reverse engineered from
pixels. . . . . . . . . . . . . . . . . . . . . . . . . . . . . . . . . . . . . . 97
6-3 Text Detection process. (1) Given an image, (2) foreground pixels are ex-
tracted as small blobs. (3) Blobs are connected to form larger blobs, (4)
which are classified into text (red), icon (green), or photo blobs (blue). . . 103
6-4 An example of applying Tesseract-OCR 3.01 to a whole screen image gen-
erates very poor results. . . . . . . . . . . . . . . . . . . . . . . . . . . . 105
6-5 An example from the text detection experiment. Red labels are false de-
tection, and the dark blue one is missed. All the other labels are correctly
detected, but not necessarily correctly recognized. . . . . . . . . . . . . . 108
10
6-6 Two examples show correct and incorrect segmentation results. The failure
in this example is caused by the width betwee the two 1’s in 2011 is larger
than the one betwee "–" and "Updated". . . . . . . . . . . . . . . . . . . . 109
6-7 As the cursor moves, the boundaries of the target can be identified auto-
matically in Sikuli Script. After the user clicks to capture a screenshot, the
XPath to this target is also stored with the screenshot image for future use. 110
6-8 The two buttons with only image icons “Decrease Indent” and “Increase
Indent” can be searched with Screen Search because they have the word
“indent” in their accessibility metadata. . . . . . . . . . . . . . . . . . . . 111
6-9 Screen Search finds the given keyword in multiple applications and shows
the matched components and their windows at the same time. . . . . . . . 113
6-10 Screen Copy can be used to select and copy columns of a table or a list view. 115
6-11 With Screen Copy, one can copy a Mac OS X user interface and paste it
into a WYSIWYG HTML editor to create an HTML version of the same
interface. . . . . . . . . . . . . . . . . . . . . . . . . . . . . . . . . . . . 115
7-1 Including a unique label in image patterns can reduce ambiguities effec-
tively. . . . . . . . . . . . . . . . . . . . . . . . . . . . . . . . . . . . . . 123
7-2 Spatial operators are used to constrain matching regions. . . . . . . . . . . 124
11

List of Tables
4.1 The testability of GUI visual behavior under Sikuli Test. The numbers (1
to 4) indicate the combination of the widget and the visual behavior can be
tested with Sikuli Test in the corresponding application. The triangles △
indicate theoretically testable, and the red Fs mean not testable by Sikuli
Test. The rest of the cells marked with an X indicates they are rarely paired
together. . . . . . . . . . . . . . . . . . . . . . . . . . . . . . . . . . . . 58
4.2 Test cases created for the first version automatically (A), semi-automatically
(AM) or manually (M) and their reusability (Pass or Fail) in subsequent
versions (2nd and 4th). . . . . . . . . . . . . . . . . . . . . . . . . . . . . 64
12
Chapter 1
Introduction
In human-to-human communication, people communicate with each other verbally and
visually. However, sometimes it is difficult to verbally describe something. In that case,
we use pictures as visual references. For example, to find a missing dog, we would not
post flyers with only the dog’s name. We would put the dog’s picture on the flyer. For
another example, we would say “I want a haircut like her” and show a hairstyle photo to
the barber.
However, in human-to-computer communication, most interfaces do not interact with
us visually and force us to rely on non-visual alternatives. An example is automation and
testing for graphical user interfaces (GUIs). GUI automation and testing usually require
writing scripts to send commands to particular GUI widgets in order to operate them and
verify the correctness of their behavior. When one wants to write such scripts, one big
challenge is: how to refer to a specific widget in a script?
Common solutions are using the pre-programed name of the widget, which may be
unfamiliar or even unavailable to the users, or using screen location, such as (x, y), which
is very brittle as the widget is not likely to stay at the same place. Both solutions are
examples of non-visual alternatives, which forces the users to learn a new way to operate the
system they are already familiar with, and therefore damages the usability of the automation
system.
Another example is searching for help. With the explosion of information on the web,
search engines are increasingly useful as a first resort for help with an application. Search-
13

ing the web currently requires coming up with the right keywords to describe the GUI
element, which can be very challenging if there is no title or textual label available around.
We observe that these non-visual alternatives present certain limitations to GUI users
as they perform various kinds of tasks. Motivated by these problems, we wonder why we
cannot just use the user interface itself (i.e. its screenshot) as a reference.
This thesis explores the possibilities of using screenshots as a visual reference in vari-
ous domains. We propose a new interaction model, Screenshot-Driven Interaction, a set of
interaction techniques triggered by taking a screenshot to find information or issue com-
mands involving GUI elements. We also contribute a series of work that embodies this
interaction model and the idea of using screenshots as visual references. Furthermore,
while developing these systems, we see new challenges ans obstacles coming up along
with this new notion. To address them, we contribute a set of design principles and discuss
the trade-off in our solutions.
1.1 Thesis Statement
A graphical representation of user interfaces can be used as direct a visual reference to
enable new kinds of screenshot-driven interactions in domains like searching, GUI au-
tomation and testing, and cross-device information migration.
1.2 Screenshots as Reference in User Interface Design
Screenshots are not common design elements in modern GUI systems compared to text
or graphical icons. However, a great potential of using screenshots as visual references
in user interface design has emerged recently. Compared to the non-visual alternatives,
taking screenshots is an intuitive way to specify a variety of GUI elements, applications,
or devices. Most importantly, screenshots are universally accessible for all applications on
all GUI platforms, since it is always possible to take a screenshot of the interface the users
see.
Sikuli Search [49] is the first attempt to explore mixing screenshots into an interaction
14

process. Sikuli Search allows a user to search documentation by taking a screenshot of a
GUI widget instead of using key words to look up the application built-in help. After this,
a similar idea is applied to writing GUI automation scripts and created Sikuli Script and
IDE [49].
Standing on the basis of the Sikuli project, I have applied this idea to more problems,
such as GUI testing and task migration across devices. While exploring the solutions to
these problems, the following systems have been developed.
• Sikuli Test [12], a system based on Sikuli Script [49] that enables GUI developers and
Quality Assurance (QA) testers to create test scripts to verify GUI behavior without
writing code and facilitates applying good testing practices on GUI development.
• Deep Shot [10], a framework for capturing the current work state of a task (e.g.,
the specific part of a document being viewed) and resuming it on a different device.
Two new interaction techniques deep shooting and deep posting with Deep Shot,
for pulling and pushing work states, respectively, using a mobile phone camera are
introduced. For example, we can use a mobile phone camera to take a picture of a
desktop monitor showing a map and continue to browse the same area of the map on
the phone.
• PAX [11], a hybrid framework that associates the visual representation of user inter-
faces and their internal hierarchical metadata. This framework enhances the capabil-
ity of existing pixel-based systems and allows them to reach not only the pixels of a
user interface but also the internal structured data under the pixels.
In this section, I describe how screenshots can be used in various domains.
1.2.1 Searching Documents
Software becomes more and more complex as it evolves in a very fast pace. When a user
has questions with using a particular feature in an application, searching on the web or
looking up the application built-in help are the most common way to request help. In order
to retrieve related documentation or web pages, these methods require the user to come up
15

with right keywords, which can be very challenging. However, if there is a human expert
around, the user may directly point at the user interface of the application and ask questions,
such as "how do I use this tool?" or "why is this button grayed out?"
Yeh et al. [49] introduced Sikuli Search, which uses screenshots to search documen-
tation about GUI elements. For example, a new user of Photoshop may search in a
collection of documents by taking a screenshot of it without knowing its name. In Sikuli
Search, the interaction model consists of two steps: 1) the user takes a screenshot of a por-
tion of the screen, which can be a GUI element, a paragraph of text, or a window; 2) the
system retrieves documents related to the screenshot and present them to the user. Accord-
ing to the user study conducted in [49], the average time of a screenshot-based search is
less than half time of a conventional keyword-based query, with no reduction in the quality
of search results.
1.2.2 GUI Automation
GUI automation or scripting has been a challenging problem for a long time. The main
difficulty is that there are no standard communication channels or protocols for GUI ap-
plications. Some well-engineered applications expose a set of API to other applications
or properly follow a accessibility standard of the operating system, so there is a chance to
communicate with them through these APIs. However, most applications do not have these
kinds of designs, and therefore the only common element among all GUI applications is
the pixels of the user interfaces.
In late 90’s, Potter [34] was the first to explore the idea of analyzing the visual patterns
on the screen and championed its potential for supporting application-independent end-
user programming. About the same time, Zettlemoyer et al. [51] introduced VisMap and
VisScript, which converts the GUI elements on the screen into structured objects and further
allows a user to script the GUI with simple commands and those objects.
Recently, we introduced Sikuli Script [49], a scripting system that enables users to use
screenshots of GUI widgets to control them programmatically. The system is based on
Python, which gives its user the full power of a programming language to author an au-
16

Figure 1-1: Sikuli IDE is a script editor specifically designed for writing screenshot-basedscripts.
tomation script. With Sikuli Script, we can ask the computer to “move all Word documents
to the recycle bin” by using a command dragDrop and taking screenshots of a word
document and a trash can respectively.
To facilitate writing automation scripts with screenshots, I developed Sikuli IDE, which
is a development environment specifically designed for writing screenshot-based automa-
tion scripts (See Figure 1-1). In Sikuli IDE, screenshots are first-class objects, which can
be assigned to variables, returned from a function, or passed as parameters. Every time a
user needs to refer to a GUI element in a script, he/she can take a screenshot of the element
by pressing the "Take screenshot" button on the toolbar or a hot key. The screenshot will be
shown directly in the IDE and then can be used as a first-class object or be moved around
in the script.
More details about Sikuli Script and IDE will be discussed in Chapter 3.
17

1.2.3 GUI Testing
Testing a GUI’s visual behavior typically requires human testers to interact with the GUI
and to observe whether the expected results of interaction are presented. This is a labor
intensive task and has been a hard problem to automate because of the natural difficulty of
GUI automation. However, since Sikuli Script has dealt with the problem of GUI automa-
tion with screenshots, it is natural to extend it beyond automation.
Based on Sikuli Script, I developed Sikuli Test, a system that allow GUI developers and
QA testers to create test scripts to verify GUI behavior without writing code. Sikuli Test
provides a new interaction model called Test By Demonstration, which generates Sikuli
scripts along with the necessary screenshots by recording both the user’s input and screen
images.
Screenshots play the key role in Sikuli Test. In Sikuli Script, one only can write scripts
and take screenshots manually. In contrast, in Sikuli Test, one can either use the old method
or use the new recording mechanism, which continuously takes full screenshots and auto-
matically crops the parts of target elements with computer vision algorithms.
In Chapter 4, I show screenshots can be effectively used to test a variety of GUI behavior
and discuss how this approach can facilitate good testing practices, such as unit testing,
regression testing, and test-driven development.
1.2.4 Task Migration Across Devices
A user task often spans multiple heterogeneous devices, e.g., working on a PC in the office
and continuing the work on a laptop or a mobile phone while commuting on a shuttle.
However, there is a lack of support for users to easily migrate their tasks across devices. To
address this problem, I created Deep Shot, a framework for capturing the user’s work state
that is needed for a task (e.g., the specific part of a webpage being viewed) and resuming it
on a different device.
Deep Shot provides two novel camera-based interaction techniques, deep shooting and
deep posting. These two techniques allow seamless and intuitive migration of user tasks
from one device to another by one uniform operation: taking pictures. Deep shooting
18

Figure 1-2: A user takes a picture of the screen of her computer and then sees the appli-cation with the current state on her phone. Our system recognizes the application that theuser is looking through the camera, automatically migrates it onto the mobile phone, andrecovers its state.
19

allows a user to capture and to persist the deep information, i.e., the information behind
the raw pixels, such as application states, with a camera-like mobile phone application in a
single click (see Figure 1-2). The work state captured with Deep Shooting can be resumed
immediately on the mobile phone, opened later, or migrated to another device with deep
posting. In contrast to with Deep Shooting, Deep posting uses a camera to push deep
information (i.e. the work state) to another device and allows a user to resume the work on
that device.
In Deep Shot, screenshots are used to identify the region of interest on a screen and
also are the visual references to the target information. Unlike Sikuli Script and Test, the
screenshot-driven interaction in Deep Shot is not triggered by taking a screenshot in a
computer, but done by taking a photo of the screen using a different device.
We demonstrate that Deep Shot can be used to support a range of everyday tasks mi-
grating across devices. More details of Deep Shot are discussed in Chapter 5.
1.2.5 Combining Pixels and Accessibility Metadata
The screenshot-driven model is emerging as a new and promising way to develop new
interaction techniques on top of existing user interfaces. However, in order to maintain
platform independence, other available low-level information about GUI widgets, such as
accessibility metadata, was neglected intentionally.
We observe that pixel representation of a user interface and its internal structures and
metadata, such as accessibility information, complement each other. We present a hybrid
framework, PAX, which combines pixels and Accessibility APIs to enhance the capabilities
of current pixel-based systems and enables new interactive applications on top of existing
interfaces.
PAX not only knows what is visible to the user on the screen but also understands the
content and structures behind the pixels (Figure 1-3). We use accessibility metadata as a
convenient and accurate source of widgets’ information. If the accessibility metadata is not
available, PAX automatically switches to pixel-level interpretation and still returns useful
data. Furthermore, we use pixel-level methods to optimize the accessibility metadata. For
20

(a) The internal structure of a GUI given by Accessibility APIs (AX) may not necessarily correspond to theactual visual representation of the GUI. Boxes above indicate the windows and widgets returned by AX eventhough they are not visible to users.
(b) PAX combines pixels and Accessibility APIs for more accurate association between the visual representa-tion and internal structure of a GUI. It filters accessibility information for only visible objects (red boxes) andalso provides role, content, location, and size of objects detected by pixel-based methods (green boxes).
Figure 1-3: Comparison between Accessibility metadata and PAX.
21

instance, when accessibility APIs are not fine-grained enough to return the position of each
word in a paragraph of text, we use a pixel-based segmentation algorithm, along with the
known text for the whole paragraph obtained from the accessibility API, to locate the words
with high precision.
PAX can be used to enhance existing pixel-based systems. For example, we enhance
Sikuli Script so that it can read the value of a slider on a GUI, which is not shown on
the screen at all, and preserve the readability of its script code at the same time. We also
create two novel applications, Screen Search and Screen Copy, to demonstrate how PAX
can be applied to development of desktop-level interactive systems. The details of PAX are
discussed in Chapter 6.
1.3 Common Pitfalls and Remedies
As we develop new systems with the screenshot-driven model, we see new interesting
and promising applications as well as pitfalls due to the nature of pixel matching. We
categorize these pitfalls into four common problems as follows, where the target is defined
as the screenshot taken by the user.
• The target is not visible.
• The target changes its look over time.
• The target can not be uniquely identified.
• The target is indistinguishable in different states.
These problems can be caused by various reasons. For example, the invisibility problem
could be caused by occlusion or scrolling out of view. For each problem, we suggest some
design principles to overcome it from the perspective of the system designers as well as the
users. Each of these design principles are discussed in Chapter 7.
22

1.4 Contribution
In this thesis, I contribute the following ideas, designs, and systems.
• The idea of using screenshots as visual references in user interface design.
• A new interaction model, Screenshot-driven Interaction.
• The design and implementation of Sikuli Script’s API and Sikuli IDE.
• Sikuli Test: using screenshots to support GUI testing.
• Deep Shot: using screenshots to support task migration across devices.
• PAX: associating screenshots and their internal metadata to enhance pixel-based sys-
tems.
• A list of common pitfalls in pixel-based systems and their remedies.
23

Chapter 2
Related Work
2.1 Screenshot-Driven Interaction
The idea of supporting interactions by analyzing the visual patterns rendered on the screen
was examined in the late 90’s. Potter [34] was the first to explore this idea and referred
to it as direct pixel access. He also championed its potential for supporting application-
independent end-user programming. His Triggers system supported novel visual tasks such
as graphical search-and-replace and simulated floating menus. While Triggers can be con-
figured through an interactive dialog to perform some basic tasks similar to the Sikuli Script
examples presented earlier, it is not a full scripting language and does not support fuzzy
matching.
Zettlemoyer & St. Amant [51] described VisMap and VisScript. VisMap inferred high-
level, structured representations of interface objects from their appearances using a rule-
based system and generated mouse and keyboard gestures to manipulate these objects.
However, VisMap is not independent of platforms and requires lots of rules to define each
individual GUI widget. VisScript provided a basic set of scripting commands (mouse-
move, single-click, double-click and move-mouse-to-text) based on the output of VisMap,
but was not integrated with a full-feature scripting language. WinCuts allowed users to cut
a sub-region of an existing window and create an independent live view of the source, but
did not interpret its content [42].
While these early pioneering works shed light on the potential of image-based interac-
24

tion, they led to almost no follow-up work, mostly because the practicality was limited by
the hardware and computer vision algorithms of the time. However, faster hardware and
recent advances in vision algorithms particularly those based on invariant local features
have now presented us with an opportunity to reexamine this idea and develop practical
image-based interactive applications.
2.2 Visual References in Programming and GUI Testing
Conventional programming languages are difficult to learn and use, and may require months
to years of training. Visual Programming systems have been attempting to simplify pro-
gramming using images and graphics since 1980s [18, 31]. These systems allow users to
create a program in a two-dimensional canvas, which makes programming easier but also
difficult to scale. Simonyi introduced a notion called Intentional Programming [38], which
separates source code storage and presentation so a piece of code can have different views
depending on its scenario. For example, a function can be viewed as a mathematical for-
mula or a circuit diagram depending on which kind of code it is. Barista [22] provides a
highly visual and interactive code editor that shows images, mathematical formulas, or a
"match form" view of a logical expression to improve people’s comprehension over their
textual versions.
Inspired by these prior works, Sikuli IDE shows screenshots as visual references in
its code editor for better readability of scripts. Although a user still needs to type com-
mands and take a screenshot of the targets, there is no need to be familiar with additional
application interfaces for merely automation.
The barrier to learn programming could be overcome by creating a Programming By
Demonstration (PBD) system based on screenshots. As early as early 90’s, Singh et al.
[39] proposed the Sage system that can capture and store GUI interactions demonstrated
by users as reusable templates. Wilcox et al. [47] illustrated the value of visual feedback in
programming by demonstration tools especially during the testing process, a finding val-
idates the design decision of Sikuli Test to embed visual feedback directly in test scripts.
Given the popularity of Web-based applications, the Koala system by Little et al. [26] and
25
the CoScripter system by Leshed et al. [23] both aim to enable Web users to capture,share,
automate, and personalize business processes. Based on VisMap, St. Amant et al. [40] then
described several techniques of visual generalization for PBD by observing user behavior
and inferring general patterns based on the visual properties and relationships of user in-
terface objects. Their work then enlightened the possibility of real-time screen analysis of
screen images by PBD systems.
In relation to these works, Sikuli Test extends PBD to serve a new purpose — GUI
testing, and is also applicable to any Web-based GUI as long as its visual feedback is
observable.
2.3 Screenshot-Driven Information Migration
Several research projects have addressed the issues of migrating information across de-
vices. Pick-and-drop [35] is a direct-manipulation technique to pick up an object on a
computer and drop it on another using a pen. Hyperdragging [36] is a technique like drag-
and-drop that transfers information across devices. However, these two techniques require
special, uncommon devices (pen devices and augmented tabletops) so they cannot be easily
deployed to the real world.
Remote Clip [30] is a simple way to share information via a synchronized clipboard
across multiple personal computers. Unlike Pick-and-drop and Hyperdragging, there are
no special hardware requirements for Remote Clip. However, this technique is only feasible
for copying textual or selectable objects.
Some tools [9, 42] allow users to control applications remotely. In contrast, we propose
Deep Shot in this thesis to allow users to interact with the same content via native appli-
cations running on a local device, which eliminates the need to have a constant network
connection.
Associating physical tags or bar codes to digital files is also a way to migrate infor-
mation. Want et al. [46] describes using RFID tags to link physical objects to network
services. Android and iPhone users can install an application by scanning a QR code. The
downside of these techniques is that they require special tags or codes that can only be read
26
by machines. In contrast, graphical user interfaces are already there on the screen for being
used by humans. The screenshots of the GUI can also be recognized by machines and do
not occupy additional spaces on the screen.
On the other hand, some techniques based on only visual features have been proposed.
PACER [25] allows a user to interact with a paper’s digital version based on its visual
features on a mobile phone. Shoot & Copy [8] allows a user to take a picture of file icons
on a large display with a mobile phone, and the list of files will be stored in the phone.
The list of files can then be transfered to another computer using Bluetooth. Shoot & Copy
uses ad-hoc image processing algorithms specifically designed for file icons on a solid-
color desktop. Therefore, it can not be extended to migrate general information or even
application states across devices.
Liu et al. described a system to drag and drop documents with a mobile camera [27].
This system requires the user to take one picture of the source document and another of the
destination computer. Once the source and the destination are identified, the document is
transfered across these two devices through WiFi.
Compared to these systems, we used similar feature matching algorithms in Deep Shot.
However, these techniques only focused on file transfer or document manipulation for cer-
tain applications. In contrast, Deep Shot provides an extensible framework that enables
an arbitrary application to migrate not only its content but also its runtime states across
devices using a mobile phone camera.
2.4 Connecting Screenshots and the Metadata of a UI
Recently, more pixel- or screenshot-based work has emerged. Screen-Crayons allows a user
to create annotation or highlight on any type of document with pixel-based techniques [32].
Mnemonic Rendering determines the visibility of applications and shows motion trails of
the changes when the hidden parts of windows are being revealed [6]. Prefab interprets
the pixels of a GUI and generates a high-level model of the widgets and their hierarchy
[14, 15]. The characteristic common to all this prior work is that it is completely focused
on the pixel level. Instead of pure pixel methods, we propose a hybrid approach in this
27

thesis that leverages pixels and other structured information (e.g. accessibility metadata)
from the operating system to boost the robustness and performance of existing work and to
enable new applications.
Most modern operating systems and GUI toolkits support Accessibility APIs, which
were originally designed to be a standard hook for assistive technology applications, such
as screen readers, or for GUI automation tools to communicate with a user interface pro-
grammatically. In addition to the assistive use of accessibility information, Stuerzlinger et
al.’s User Interface Facades uses such information to allow users to customize an interface
with copy-and-paste [41].
However, accessibility APIs are not widely available in every application and GUI wid-
get. Hurst et al. reported that the Microsoft accessibility API can only correctly identify
74% of targets in eight popular applications on Windows [21]. Thus, instead of using only
accessibility API, they developed a hybrid approach that feeds the visual representation (i.e.
the pixels) of a user interface as well as accessibility metadata into machine learning algo-
rithms to identify GUI targets with higher accuracy. However, their approach does not deal
with content; it is mainly for post-analysis of interaction logs to identify what targets the
users might have clicked. In contrast, the approach in this thesis is designed for real-time
use to associate GUI widgets’ internal metadata and their pixel representation.
28

Chapter 3
Sikuli
Sikuli 1 is our first attempt to apply screenshot-driven interaction to search documentation
and GUI automation. 2 Sikuli allows users or programmers to make direct visual reference
to GUI elements. To search a documentation database about a GUI element, a user can
draw a rectangle around it and then Sikuli takes a screenshot as a query. Similarly, to
automate interactions with a GUI element, a user can take a screenshot of the element and
specify what keyboard or mouse actions to invoke when this element is seen on the screen.
Compared to the non-visual alternatives, taking screenshots is an intuitive way to specify
a variety of GUI elements. Also, screenshots are universally accessible for all applications
on all GUI platforms, since it is always possible to take a screenshot of a GUI element.
In this chapter, two systems derived from the idea of Sikuli will be described.
The first system is Sikuli Search, which enables users to search a large collection of
online documentation about GUI elements using screenshots. In this thesis, I will only
discuss the screenshot-driven interaction used in Sikuli Search but not the algorithm design
and implementation of the whole system, as those details are already covered in Yeh’s
doctoral dissertation [48].
The second system is Sikuli Script and IDE, a scripting system that enables program-
1In Huichol Indian language, Sikuli means “God’s Eye”, symbolic of the power of seeing and understand-ing things unknown.
2 The work described in this chapter are collaborated with Tom Yeh, who designed and implemented theback-end computer vision algorithms of Sikuli Search and Sikuli Script. I designed and implemented thefront-end of the systems, which includes their user interfaces and the API of Sikuli Script.
29

mers to use screenshots of GUI elements to control them programmatically. The system
incorporates a full-featured scripting language (Python) and an editor interface specifically
designed for writing screenshot-based automation scripts. Likewise, in this thesis, I will
only focus on the user interfaces and the screenshot-driven interaction techniques in Sikuli
Script and IDE. The details of computer vision algorithms used in this system are covered
in [48].
3.1 Sikuli Search
The development of Sikuli Search is motivated by the lack of an efficient and intuitive
mechanism to search for documentation about a GUI element, such as a toolbar button,
icon, dialog box, or error message. The ability to search for documentation about an arbi-
trary GUI element is crucial when users have trouble interacting with the element and the
application’s built-in help features are inadequate. Users may want to search not only the
official documentation, but also computer books, blogs, forums, or online tutorials to find
more help about the element.
Current approaches require users to enter keywords for the GUI elements in order to
find information about them, but suitable keywords may not be immediately obvious. For
example, for the users who are not familiar with Photoshop, it is unlikely they know how
to use this tool , nor how to find information about it using keywords.
Instead of querying with keywords, we use a screenshot of the element as a query. Given
their graphical nature, GUI elements can be most directly represented by screenshots. In
addition, screenshots are accessible across all applications and platforms by all users, in
contrast to other mechanisms, such as tooltips and help hotkeys (F1), which may or may
not be implemented by the application.
3.1.1 Screenshot-Driven Search
Sikuli Search allows a user to select a region of interest on the screen, submit the image
in the region as a query to the search engine, and browse the search results. To specify
the region of interest, a user presses a hot-key to switch to Sikuli Search mode and begins
30

Figure 3-1: Sikuli Search allows users to search documentation and save custom annota-tions for a GUI element using its screenshot (i.e., red rectangle).
to drag out a rubber-band rectangle around it (Figure 3-1). After the rectangle is drawn, a
search button appears next to it, which submits the image in the rectangle as a query to the
search engine and opens a web browser to display the results.
The backend database in Sikuli Search indexes screenshots extracted from a wide vari-
ety of resources using three kinds of features described as follows.
1. The text surrounding the screenshots in the source document, which is a typical ap-
proach taken by current keyword-based image search engines.
2. The SIFT feature descriptor [28] extracted from salient image locations of the screen-
shots, which is robust against variations in scale, translation, brightness, and rotation.
3. The embedded text in the screenshots extracted by optical character recognition
(OCR) engines.
With these features of screenshots, users do not need to fit the rectangle perfectly around
a GUI element while taking the screenshot. As a result, the whole interaction of searching
with screenshots can be much faster than traditional keyword queries. According to the
31

user study reported in [49], the average time of a screenshot-based search costs less than
half time of a keyword-based query, whereas the quality of their search results have no
significant differences.
3.2 Sikuli Script and IDE
The development of our visual scripting API for GUI automation is motivated by the de-
sire to address the limitations of current automation approaches. Current approaches tend
to require support from application developers. For example, AppleScript, Apple Au-
tomator, and Windows Scripting all require applications to provide APIs. Some systems
(e.g. DocWizards [5], Chickenfoot [7], and CoScripter [23]) require accessible text labels
for GUI elements. Some macro recorders (e.g. Jitbit 3 and QuicKeys 4) achieve cross-
application and cross-platform operability by capturing and replaying low-level mouse and
keyboard events on a GUI element based on its absolute position on the desktop or relative
position to the corner of its containing window. However, these positions may become
invalid if the window is moved or if the elements in the window are rearranged due to
resizing.
Therefore, we use screenshots of GUI elements directly in an automation script to pro-
grammatically control the elements with low-level keyboard and mouse input. (See Fig-
ure 3-2 for examples) Since screenshots are universally accessible across different appli-
cations and platforms, this approach is not limited to a specific application. Furthermore,
the GUI element a programmer wishes to control can be dynamically located on the screen
by its visual appearance, which eliminates the movement problem suffered by existing ap-
proaches.
3.2.1 Visual Scripting API
Sikuli Script provides a set of visual scripting API for GUI automation. The goal of this API
is to give an existing full-featured programming language a set of image-based interactive
3http://www.jitbit.com/macrorecorder.aspx4http://www.startly.com/products/qkx.html
32

Figure 3-2: Examples of Sikuli commands. The first line finds all PDF icons on the screenand save them into a variable pdfs. Line 4 clicks on a drop-down box named Location andopen it up. Line 7 drags a file “readme.txt” to a Dropbox folder. Line 9 types “something”into a search box.
capabilities. Although our API is currently optimized for Jython (the Python implementa-
tion on Java Virtual Machines), it should be straightforward to adapt it to other languages
running on a JVM since it is built in Java.
The Sikuli Script API has several key components. The find() function takes a
target pattern and returns screen a region matching the pattern. The Pattern and Match
classes represent the target pattern and matching screen regions, respectively. A set of
action commands invoke mouse and keyboard actions on screen regions. Finally, a visual
hash table stores key-value pairs using images as keys. We describe these components in
more detail below.
Find
The find function locates a particular GUI element to interact with. It takes a visual pattern
that specifies the element’s appearance, searches the whole screen or part of the screen, and
returns regions matching this pattern or null if no such region can be found. For example,
find( ) finds regions containing a Word document icon on the whole screen. In addi-
33
tion to find, another function findAll returns a list of all matching regions instead of
the best one.
Pattern
The Pattern class is an abstraction for visual patterns. A pattern object can be created in
three ways: taking a screenshot, from an image file, or from a string of text. When creating
from an image, we use a computer vision algorithm template matching to find matching
screen regions. When created from a string, OCR is used to find screen regions matching
the text of the string. A pattern object has methods for tuning how general or specific
matches must be. They are listed as follows.
• exact(), which indicates the pattern must be exactly matched;
• similar(similarity), which specifies how general (from 0.0 to 1.0) the matches can be;
• anyColor(), which indicates the pattern can match the same shape in any colors;
• anySize(), which indicates the pattern can match the same shape in any sizes;
• targetOffset(x, y), which specifies the click offset to the target (instead of the center
by default).
Each method produces a new pattern, so they can be chained together. For example,
Pattern( ).similar(0.8).anyColor() matches screen regions that are 80% of
pixels similar to of any color composition.
Region and Match
The Region class defines a rectangular region on a screen. Its attributes are x and y coordi-
nates, height, width. The Match class extends the Region class and provides an abstraction
for the screen region(s) returned by the find() function matching a given visual pattern.
It has an additional attribute: similarity score. Typically, a Match object represents the
best match, for example, m = find( ) stores the region found to look most like the
icon in the variable m.
34

Another use of a Region object is to constrain the search to a particular region instead
of the entire screen. For example, find( ).find( ) constrains the search
space of the second find for the ok button to only the region occupied by the dialog box
returned by the first find().
To support other types of constrained search, our visual scripting API provides a ver-
satile set of constraint operators: left, right, above, below, nearby, inside, outside in 2D
screen space. (See Figure 3-3.)
These operators can be used in combination to express a rich set of search semantics
For example,
find( ).inside().find( ).right().find( ) finds for the office tool-
bar first and then constrains the following searches within this matched area. The second
find() searches for the office home button, and finally searches the disk icon within the
region on the home button’s right.
Action
The action commands specify what keyboard and/or mouse events to be issued to the center
of a region found by find(). The core set of commands in our API are:
• click(Pattern|Region, [Modifiers]), doubleClick(Region, [Modifiers]): These two
commands issue mouse-click events to the center of a target region. For example,
click( ) performs a single click on the best-matched close button found on the
screen. If there are multiple matches with the same similarity score, the command
clicks on any one of them randomly. Modifier keys such as Ctrl and Command can
be passed as a second optional argument.
• dragDrop(Pattern|Region target, Pattern|Region destination): This command drags
the element in the center of a target region and drops it in the center of a destination
region. For example, dragDrop( , ) drags a word icon and drops it in the
recycle bin.
35

Figure 3-3: Spatial operators are used to constrain matching regions. This figure liststhe corresponding regions created with applying each spatial operator on the region "Altervolume".
36
• type(Pattern|Region target, String text): This command enters a given text in a target
region by sending keystrokes to its center. For example, type(
,"Sikuli") types the “Sikuli” in the Google search box.
Visual Hash Table
A visual hash table can be used to store key-value pairs using images as keys. It uses the
same syntax as a typical Hash table in Python to create tables and to store values that need
to be quickly retrieved (i.e., sub-linear time) by images. For example, h = { : "word",
: "powerpoint"} creates a visual hash table associating two application names with
their icon images. Then, h[ ] retrieves the string word, h[ ] = "excel" adds the string
"excel" under its icon image, and h[ ] returns a null object.
The visual hash table is useful for mapping a screenshot to an object. For example,
when a user wants to write a poker robot script, a card on the screen needs to be interpreted
as a suit and a number. This can be done with a visual hash table stored with 52 pairs of
card images and their corresponding suits and numbers.
3.2.2 New API
Since we released Sikuli Script in 2009, its API has grown and becomes much more com-
plete to be applied in many different scenarios and environments. The new set of API added
since then are as follows.
• App class, which will be described in Chapter 6;
• global hotkeys, which allows a user to register a Sikuli function on a particular hotkey
dynamically in a script;
• visual assertions, which will be described in Chapter 4;
• creating annotations and contextual help, which is described in a conference paper
[50].
The comprehensive and up-to-date documentation of Sikuli Script can be found at
http://sikuli.org/docx/.
37

(a) A Sikuli script being viewed in a text editor. (b) The same Sikuli script being viewed in SikuliIDE.
Figure 3-4: Comparison between textual view and visual view of a Sikuli script.
3.2.3 Sikuli IDE
To facilitate writing screenshot-based scripts, we have developed Sikuli IDE. (Figure 1-1).
Even without Sikuli IDE, a user still can write a Sikuli script with any text editor, as it is
just a Jython script. However, Sikuli IDE provides two key functions that greatly lower the
barrier to read and write such scripts.
Reading Screenshot-based Scripts
Screenshots are the key components in Sikuli scripts. Internally, a screenshot is simply
represented as a string literal, which stores the path to the image file of the screenshot. In
plain text or code editors, a script is shown as lines of textual strings. When users refer to a
screenshot in such environments, they are actually using the string as an indirect reference
to the image.
For example, in Figure 3-4(a), each line of code contains a string literal, which refers
to an image file. If the images are well named, the user may be able to guess which GUI
component on the screen the image refers to. However, a good naming mechanism needs
some effort from script authors and can not be guaranteed. In the cases as the line 7 and 8
in Figure 3-4(a), there is no way to tell what the images are actually referring to.
To overcome this problem, I developed Sikuli IDE specifically for viewing and editing
Sikuli scripts. In Sikuli IDE, screenshots are embedded in code as direct visual references
(Figure 3-4(b)). This eliminates the problem that the user needs to guess which GUI ele-
ment an image file actually refers to from its file name. The user can know exactly how the
image files looks like directly in the editor.
38

Figure 3-5: The similarity threshold for matching (.90 in this example) and the point ofclick (the red cross) can also be shown with screenshots.
Screenshots are used as visual patterns in Sikuli. Besides screenshots themselves, the
similarity threshold for matching can also be shown with the images in the editor as in
Figure 3-5.
3.2.4 Writing Screenshot-based Scripts
Embedding screenshots directly in Sikuli IDE enhances the readability of Sikuli scripts,
but, how about writing such scripts?
As we mentioned earlier, the file name to a screenshot file is an indirect reference.
Therefore, to fully employ the idea of using screenshots as visual references, it is neces-
sary to avoid using file names in the interaction process. As a result, the process of taking
screenshots in Sikuli IDE has been simplified into only two steps: 1) enter the screen cap-
ture mode by pressing either a hotkey or the button on the toolbar; and 2) drag a rectangular
area around the target.
Once a user has taken a screenshot using Sikuli IDE, the screenshot is saved as an image
file in the PNG format within the same folder of the script. The file name of the image file
is determined automatically with a timestamp by default. In this way, the user does not
need to come up with a name for the screenshot as well as where to save the file. The user
only needs to care if the image shown in the editor can well represent the target on the
screen.
In the capture mode of Sikuli IDE, the user only has one shot to stretch a rectangle
around the target. In other words, once the mouse button is released, the rectangular area
selected by the user is automatically captured. This design not only simplifies the capture
process, but also forces the user not to carefully adjust the boundaries as Sikuli’s fuzzy
39

matching algorithm does not require strict boundaries.
3.2.5 Running and Debugging Scripts
A script can be run in two different modes in Sikuli IDE. One is normal mode, which runs
the script in full speed as a usual Jython script.
While running a script, Sikuli’s automation engine visually identifies the target GUI
component’s current location (x′, y′) by searching the current screen for an image region
matching the target image I . To find a given pattern, we apply the template matching tech-
nique with the normalized correlation coefficient implemented in OpenCV in our current
system [49]. This technique treats the pattern as a template and compares the template to
each region with the same size in an input image to find the region most similar to the tem-
plate. Then, the click event is delivered to the center of the best matched region to simulate
the desired user interaction.
The other one is “slow motion” (or debug) mode, which slows down the automation and
highlights the best match of each target found on the screen. This mode effectively helps
the user to debug the script and figure out if the visual patterns really match the expected
target on the screen.
As for debugging, it is essential to know a visual pattern matches which portions of
the screen and adjust the similarity threshold as needed. Sikuli IDE can preview how a
pattern matches the current desktop (see Figure 3-6) under different similarity thresholds,
so that these can be tuned to include only the desired regions. The editor also allows users
to specify an arbitrary region of screen to confine the search to that region.
The editor also helps adjusting the click offset to the target. This is particularly useful
when one wants to change the click position to somewhere else instead of the center of the
target (Figure 3-7).
40

(a) The targetbeing searchedfor in 3-6(b)
(b) Preview the matching result of a visual pattern. Thered rectangle is the best match, and the other purple onesare partially matched with a low score.
(c) The slider for adjusting the similarity threshold.
Figure 3-6: The user can adjust the similarity threshold and preview the results underdifferent settings. Here, the threshold is too low so there are many false positives (thepurple areas).
Figure 3-7: The user can adjust the click offset to the target in the Sikuli IDE.
41
Chapter 4
GUI Testing with Screenshots and
Computer Vision
Quality Assurance (QA) testers are critical to the development of a GUI application. Work-
ing closely with both programmers and designers, QA testers make efforts to ensure the
GUI application is correctly implemented by following the design specification. Without
such efforts, there is no guarantee the usability promised by a good design is fully realized
in the implementation.
However, GUI testing is a labor intensive task. Consider the following GUI behavior
defined in a design specification of a video player: click the button and it becomes .
To test if this behavior is correctly implemented, a tester must look for the “play” button
on the screen, click on it, and see if it is replaced by the “pause” button. Every time this
behavior needs to be tested again, the tester must manually repeat the same task all over
again.
While GUI testers often toil in their tedious tasks, testers of non-GUI applications have
been enjoying the convenience of tools to automate their tasks. For example, to test if the
function call addOne(3) behaves correctly, a tester can write a script that makes this func-
tion call, followed by an assertion function call, such as assert(addOne(3) == 4),
to check if the result is equal to 4 and report an error if not. This script can be run automat-
ically as many times as desired, which greatly reduces the tester’s effort.
In this chapter, we present Sikuli Test, a new approach to GUI testing that uses screen-
42

Figure 4-1: GUI testing (left) traditionally requires human testers to operate the GUI andverify its behavior visually. Our new testing framework allows the testers to write visualscripts (right) to automate this labor-intensive task.
shots and computer vision to help GUI testers automate their tasks. Sikuli Test enables
GUI testers to write visual scripts using images to define what GUI widgets to be tested
and what visual feedback to be observed. For example, to automate the task of testing the
behavior of the video player described above, a tester can write the following script:
1 button = find( )
2 click(button)
3 assert button.exists( )
4 assert not button.exists( )
When this script is executed, it will act like a robotic tester with eyes to look for the
“play” button on the screen, click on it, and see if it is replaced by the “pause” button, as if
the human tester is operating and observing the GUI him- or herself (Figure 4-1).
This chapter is outlined with the following sections.
Interview study with GUI testers We examine the limitations of current testing tools and
suggest design requirements for a new testing framework.
Automation of visual assertion Based on the visual automation API provided by Sikuli
Script [49], a set of visual assertion API is added to determine if expected outputs
43
are shown or not. The extension of visual assertion fulfills the automation of GUI
testing by using images for verifying outputs in addition to directing inputs.
Test-By-Demonstration Testers can interact with a GUI and record the actions they per-
form and visual feedback they see. Test scripts can be automatically generated to
reproduce the actions and verify the visual feedback for testing purposes.
Support of good testing practices Features are introduced to support good testing prac-
tices including unit testing, regression testing, and test driven development.
Comprehensive evaluation We analyze the testability of a wide range of visual behavior
based on five actual GUI applications. Also, we examine the reusability of test scripts
based on two actual GUI applications evolving over many versions.
4.1 Interview Study
To guide the design and development of our new GUI testing tool, we conducted informal
interviews with four professionals of GUI testing from academia and industry. Questions
asked during the interviews were centered on three topics: current testing practices, use of
existing tools, and experience with existing tools.
In terms of testing practices, we found most of our subjects are involved in the early
design process to coordinate and formulate workable test plans to ensure quality and testa-
bility. Testing is performed frequently (often daily) on the core components. For example,
underlying APIs are tested with simulated inputs and checked if they produce expected out-
puts. But testing the outward behavior of GUIs is less frequent, usually on major milestones
by a lot of human testers. Some of them regularly apply good testing practices such as unit
testing, regression testing, and test-driven development; but the scope of these practices is
limited to the parts without GUI.
In terms of the use of testing tools, some have developed customized automation tools.
They write scripts that refer to GUI objects by pre-programmed names or by locations to
simulate user interactions with these objects. Some have been using existing tools such
44

as Autoit [1], a BASIC-like scripting language designed to automate user interactions for
Windows GUI applications.
In terms of experience with these tools, our subjects expressed frustration and described
their experience as sometimes “painful”, “slow”, and “too much manual work.” Several
problems with current automatic testing tools were identified by the subjects, which might
explain this frustration. First, whenever the GUI design is modified and the positions of
GUI components are rearranged, automatic tools based on the absolute position of compo-
nents often fail and would actually “slow down the testing process” because of the need to
modify the test scripts. Second, while automatic tools based on component naming may
avoid this problem, many components simply can not or have not been named.
Based on the findings of this interview, we identified the following five design goals to
guide the design and development of our new GUI testing tool:
• (G1) The tool should allow testers to write scripts to automate tests.
• (G2) The tool should not require testers to refer GUI components by names or by
locations.
• (G3) The tool should minimize the instances when test scripts need to be modified
due to design changes.
• (G4) The tool should minimize the effort of writing test scripts.
• (G5) The tool should support good testing practices such as unit testing, regression
testing, and test-driven development.
4.2 Testing By Visual Automation
We present Sikuli Test, a testing framework based on computer vision that enables develop-
ers and QA testers to automate GUI testing tasks. Consider the following task description
for testing a particular GUI feature:
Click on the color palette button. Check if the color picking dialog appears.
45

Figure 4-2: Sikuli Test interface consists of a test script editor and an information panelsummarizing the test result.
To carry out this test case, QA testers need to manually interact with the GUI and
visually check if the outcome is correct. Using Sikuli Test, the testers can automate this
process by converting the task description into an automation script. This script consists
of action statements to simulate the interactions and assertion statements to visually verify
the outcomes of these interactions. For example, the above task description can be easily
translated into a test script as:
1 click( )
2 assertExist( )
46

By taking this image-based scripting approach, Sikuli Test meets the first three design
goals: it allows testers to write visual scripts to automate tests (G1), to refer to GUI objects
by their visual representation directly (G2), and to provide robustness to changes in spatial
arrangements of GUI components (G3). The details of how to write test scripts using action
statements and assertion statements are given next.
4.2.1 Simulating Interactions using Action Statements
To simulate interactions involved in a test case, QA testers can write action statements
using the Sikuli Script API, which is described in Chapter 3.
Since Sikuli Script is based on a full scripting language, Python, it is possible for QA
testers to programmatically simulate a large variety of user interactions, simple or complex.
4.2.2 Verifying Outcomes using Visual Assertion Statements
Sikuli Test introduces two visual assertion functions. QA testers can include these func-
tions in a test script to verify whether certain GUI interaction generates the desired visual
feedback. These two assertion functions are:
assertExist(image or string [, region])
asserts that an image or string that should appear on screen or in a specific screen region
assertNotExist(image or string [, region])
asserts that an image or a string should not appear on screen or in a specific screen region
The image is specified as URL or a path to an image file. It also can be captured by a
screenshot tool provided in our Integrated Development Environment (IDE). When a string
is specified, OCR (Optical Character Recognition) is performed to check if the specified
string can be found in the screen region. The optional parameter region is specified as a
rectangular area on the screen (i.e., x, y, width, height). If not specified, the entire screen
is checked. Alternatively, the region can be specified as a second image, in which case the
entire screen is searched for that image and the matching region is searched for the first
image. Spatial operators such as inside, outside, right, bottom, left, and top can be further
applied to a region object to derive other regions in a relative manner.
47
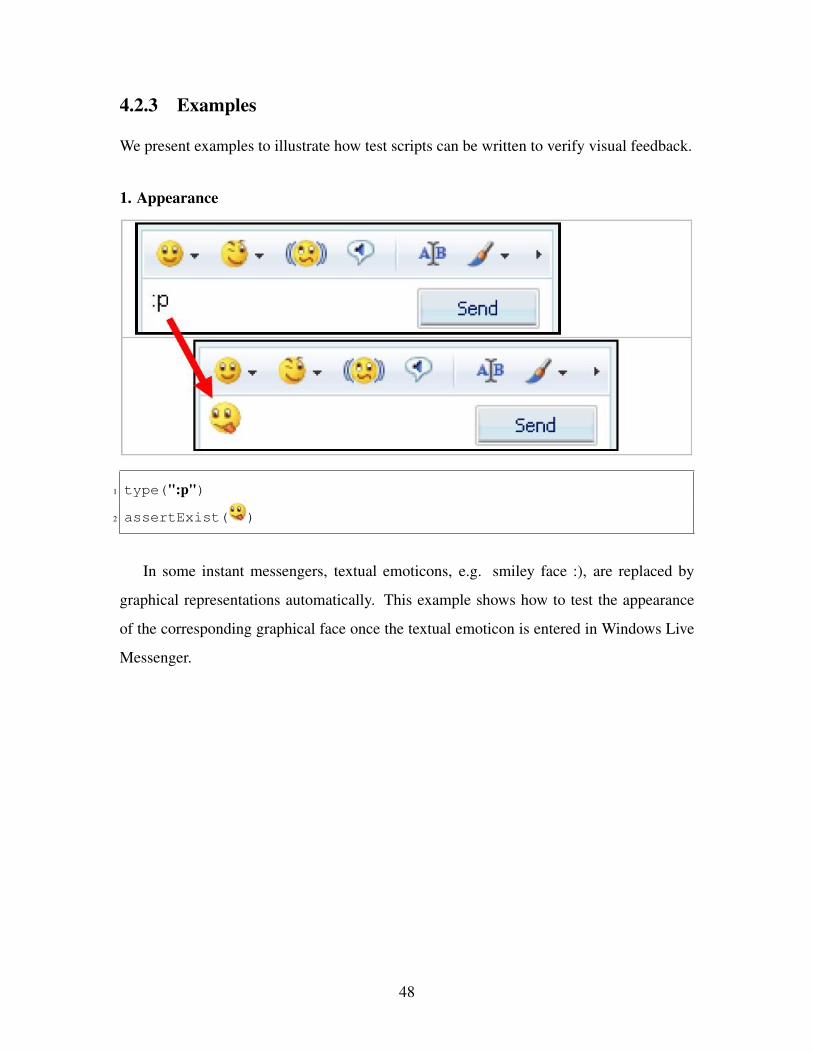
4.2.3 Examples
We present examples to illustrate how test scripts can be written to verify visual feedback.
1. Appearance
1 type(":p")
2 assertExist( )
In some instant messengers, textual emoticons, e.g. smiley face :), are replaced by
graphical representations automatically. This example shows how to test the appearance
of the corresponding graphical face once the textual emoticon is entered in Windows Live
Messenger.
48

2. Disappearance
1 blueArea = find( )[0]
2 closeButton =
3 click(closeButton)
4 assertNotExist(closeButton, blueArea)
5 assertNotExist("5", blueArea)
In this example, the close button is expected to clear the content of the text box as
well as itself. Suppose the GUI is already in a state that contains a "5", at first we find the
blue text box on the screen and store the matched region that has the highest similarity in
blueArea. Then, after clicking the close button, two assertNotExist statements are used to
verify the disappearance in the blue area.
3. Replacement
1 button = find( )
2 click(button)
3 assertExist( , button)
4 assertNotExist( , button)
Typical media players have a toggle button that displays the two possible states of the
player, playing or pause. In this example, we demonstrate a test case that tests the typical
49

toggle button on youtube.com, a popular website of video collection. This script finds the
play button first, and save its match region in the variable button. After clicking on the play
button, all following assertions are restricted within that matched region in order to verify
the replacement behavior.
4. Scrolling/Movement
1 sunset =
2 old_x = find(()sunset)[0].x
3 click( )
4 assert(find(()sunset)[0].x > old_x)
Since Sikuli Test is independent of any GUI platform, it also can be used to test mobile
applications running on an emulator. This example shows how to test scrolling and move-
ment on an Android emulator. This test case works by comparing the position of the target
before and after an action that should move the target. After clicking on the left button, we
expect the series of images to scroll rightward. Therefore, the new x coordinate should be
larger than the old one. We choose the image of sunset to be the target. Its x coordinate that
derived from the most similar match of find() is stored in old_x. After clicking on the left
50

button, its new x coordinate derived from find() again is compared with old_x for verifying
the correctness of the implementation.
4.3 Testing By Demonstration
Sikuli Test provides a record-playback utility that enables QA testers to automate GUI
testing by demonstration. The operation of a GUI can be described as a cycle consisting
of actions and feedback. Given a test case, the testers follow the given actions to operate
a GUI, and verify if the visual feedback is the same as expected. If so, they proceed to do
the next actions and to verify further feedback.
With the record-playback mechanism, the testers can demonstrate the interactions in-
volved in the test case. The actions as well as the screen are recorded and translated into
a sequence of action and assertion statements automatically. The action statements, when
being executed, can replicate the actions, as if the testers are operating the GUI themselves.
The assertion statements can verify if the automated interactions lead to the desired visual
feedback, as if the testers are looking at the screen themselves.
The test-by-demonstration capability of Sikuli Script satisfies the design goal of mini-
mizing the effort needed to write test scripts (G4). Details of how demonstration is recorded
and how actions and assertions are automatically generated from the recorded demonstra-
tion will be given next.
4.3.1 Recording Demonstration
As QA testers demonstrate a test case, a recorder is running in the background to capture
the actions they perform and the visual feedback they see. To capture actions, the recorder
hooks into the global event queue of the operating system to listen for input events related
to the mouse and the keyboard. The list of mouse events recorded includes mouse_down,
mouse_up, mouse_move, and mouse_drag. Each mouse event is stored with the cursor
location (x, y) and the state of buttons. The keyboard events recorded include key_down
and key_up, stored together with key codes. All events include a timestamp that is used to
synchronize with the screen recording. To capture screens, the recorder grabs the screen-
51
shot of the entire screen from the video buffer in the operating system periodically. In our
prototype, the recording can be done at 5 fps at a resolution of 1280x800 on a machine with
2Ghz CPU and 2GB memory.
4.3.2 Generating Action Statements
Given a series of screen images and input events captured by the recorder, action statements
can be generated to replay the interactions demonstrated by the testers. For example, a
single mouse click recorded at time t at location (x, y) can be directly mapped to click(I)
where I is the image of the GUI component that was clicked. The image I can be obtained
by cropping a region around (x, y) from the screen image captured at time t−1 right before
the click event.
The timing to capture the screen images could be more complicated if there are multiple
targets involved in one action statement, such as dragDrop. As a user interact with GUI
components, some visual feedback that changes the look of the GUI may be triggered by
the user’s mouseover events. Therefore, both the images of the source and the target should
be captured before the drag-and-drop begins.
In our current implementation, a constant-size (80x50) region around the input location
is cropped to represent the target GUI component receiving the input. Even though the
region may not necessarily fit the target component perfectly, often it contains enough
pixels to uniquely identify the component on the screen. If ambiguity arises, the user can
adjust the cropping area to include more pixels of the component or the context to resolve
the ambiguity at any time.
Some input events may need to be grouped into a single action statement. For example,
two consecutive mouse clicks in a short span of time is mapped to doubleClick(). Keyboard
typing events can be clustered to form a string and mapped to type(string). A mouse_down
event at one location followed by a mouse_up event at another location can be mapped
to dragDrop(I,J) where I and J denote the images extracted from the locations of the two
mouse events respectively.
52

4.3.3 Generating Assertion Statements
Assertion statements can also be automatically derived from the screen images captured
during the demonstration. We developed and implemented a simple vision algorithm to
accomplish this. We assume any salient change between the two images is very likely
to be the visual feedback caused by an input event. Our algorithm compares the screen
images It and It+1 where t is the time of a recorded input event, and identifies pixels that
are visually different. It then clusters the changed pixels in close proximity and merges
them into the same group. Each group of pixels would probably correspond to the same
GUI component. Finally, it computes a bounding rectangle around each group and obtains
a cropped image containing the visual feedback of each GUI component visually affected
by the input event. If the cropped boundaries are bad, the user can adjust the cropping area
anytime on the recorded images.
An assertion statement that can be later used to check the presence of the visual feed-
back can be generated with this algorithm. Figure 4-3 shows an example of deriving the
visual feedback where a drop-down box is opened by clicking. Often, more than one GUI
component can exhibit visual feedback as the result of a single input event. In this case,
our algorithm results in a compound assertion statement including multiple cropped image
regions. For example, Figure 4-4 shows a dialog box with a checkbox that can be used to
enable several GUI components at once. Checking this checkbox will cause all previously
greyed out components in a panel to regain their vivid colors.
An optional step for the tester to increase the reliability of the automatic visual feedback
detector is to provide hints to where it should look for the visual feedback. After performing
an interaction and before moving on to the next, the tester can move the mouse cursor to
the area where the visual feedback has occurred and press a special key, F5, to trigger a
hint. The detector can use the location of the cursor to extract the relevant visual feedback
more reliably and generates an appropriate assertion statement.
While we can identify many cases in which visual assertion statements can be created
automatically in this manner, there remain a few challenges. First, periodic changes in the
desktop background, such as those related to the system clock or the wireless signal indi-
53

Figure 4-3: An example of taking the difference between two screens to derive the visualfeedback automatically
cator, may be inadvertently detected but irrelevant to the GUI to be tested. One solution
would be to ask the testers to specify the boundary of the GUI beforehand so that back-
ground noises can be filtered out. Second, certain actions might take longer to obtain any
visual feedback; the screen image captured immediately after the action might not contain
the visual feedback. One solution would be to wait until a significant change is detected.
Third, some visual feedback may involve animation spanning several frames, for example,
a large window appearing in a blind-rolling-down fashion. One solution would be to wait
until the screen has stabilized and focus only on the final visual feedback. However, while
it is possible to test the final feedback, testing the intermediate steps of an animation can
still be unreliable, because it is difficult to synchronize between the frames sampled during
the demonstration time and those sampled during the test time.
4.4 Supporting Good Testing Practices
Sikuli Test comes with a set of features to help GUI developers and QA testers engage in
good testing practices such as unit testing, regression testing, and test-driven development,
satisfying the last design goal (G5).
4.4.1 Unit Testing
When a GUI is complex, to make sure it is tested thoroughly requires a systematic ap-
proach. One such approach is to break the GUI down into manageable units, each of which
targets a particular part, feature, or scenario. This approach is known as unit testing.
To support unit testing for GUI, Sikuli Test draws many design inspirations from JUnit,
54
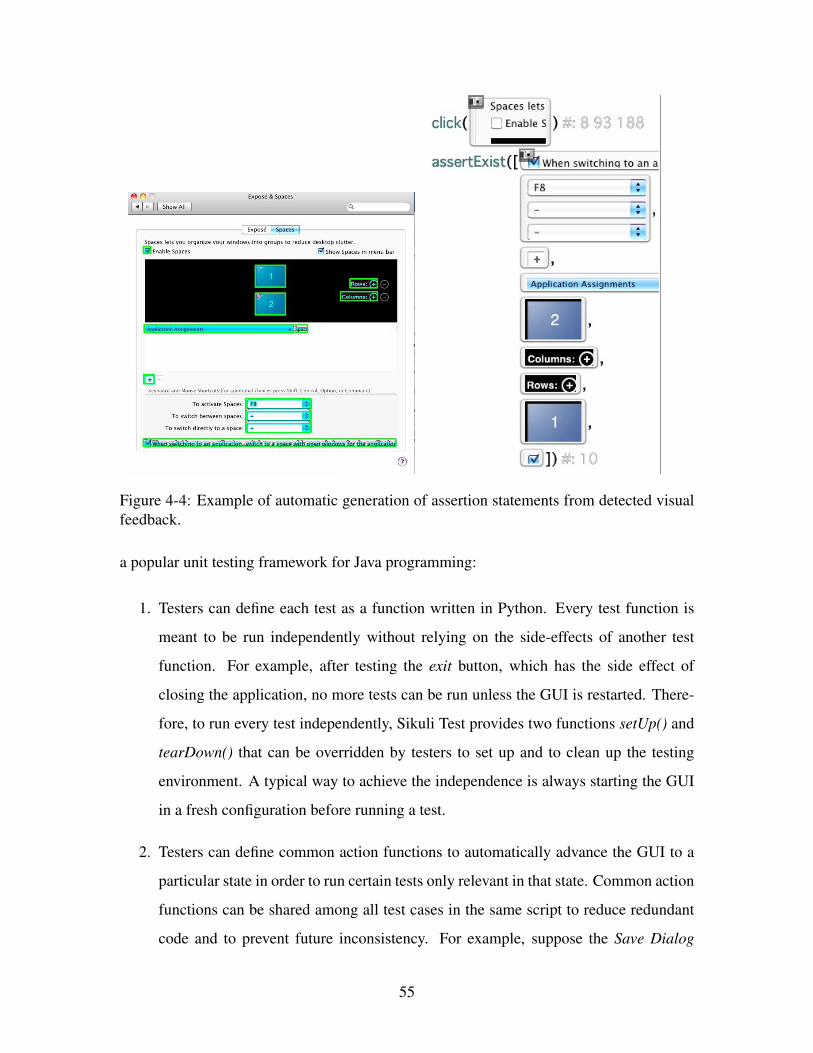
Figure 4-4: Example of automatic generation of assertion statements from detected visualfeedback.
a popular unit testing framework for Java programming:
1. Testers can define each test as a function written in Python. Every test function is
meant to be run independently without relying on the side-effects of another test
function. For example, after testing the exit button, which has the side effect of
closing the application, no more tests can be run unless the GUI is restarted. There-
fore, to run every test independently, Sikuli Test provides two functions setUp() and
tearDown() that can be overridden by testers to set up and to clean up the testing
environment. A typical way to achieve the independence is always starting the GUI
in a fresh configuration before running a test.
2. Testers can define common action functions to automatically advance the GUI to a
particular state in order to run certain tests only relevant in that state. Common action
functions can be shared among all test cases in the same script to reduce redundant
code and to prevent future inconsistency. For example, suppose the Save Dialog
55
box is relevant to several test cases, the tester can write a common action function
to open the Save Dialog that contains a click() on the File menu followed by
another click() on the Save item. On the other hand, testers can also define shared
assertion functions to verify the same visual feedback that are derived from different
actions. For example, the appearance of a save dialog box can be caused by a hotkey
Ctrl-S, by a icon on the toolbar, or by the Save item in the File menu; all could be
verified by assertSaveDialog().
3. Testers can run a test script and monitor the progress as each test function in the script
is run. They can see the summary showing whether each test has succeeded or failed
as well as the total number of successes and failures.
4. When errors are found, testers can communicate the errors to programmers effec-
tively. On the one hand, testers are encouraged to assign each test function a mean-
ingful name, such as test_click_play_button. On the other hand, the images embed-
ded in each function make it visually clear which GUI components and what visual
feedback are involved in the errors.
4.4.2 Regression Testing
When a new feature is implemented, in addition to verifying whether the implementation
is correct, it is equally important to ensure that it does not break any existing feature that
used to be working. This practice is often known as regression testing in software engi-
neering. Many software projects use daily builds to automatically check out and compile
the latest development version from the version control system. The daily build is tested
by automated unit testing suites to validate the basic functionality. However, because of
the weaknesses of automatic testing tools for GUI, current regression testing process is
limited to work only on internal components but not on GUI. Therefore, regression testing
becomes a tedious practice that requires QA testers to manually repeat the same set of tests
whenever there is a modification to the GUI.
Sikuli Test is a labor-saving and time-saving tool enabling QA testers to automate re-
gression testing. Using Sikuli Test, the testers only need to program test cases once and
56

those test cases can be repeatedly applied to check the integrity of the GUI. To show the
feasibility of Sikuli Test for supporting regression testing, an evaluation will be given later.
4.4.3 Test-Driven Development
While our testing framework is originally designed for QA testers, it can be used by both
GUI designers and programmers during the development process. In large GUI projects
where the separation between design and implementation is clearer, designers can create
test cases based on design illustrations or high-fidelity prototypes. For example, a designer
can use a graphic editor such as Photoshop to create a picture illustrating the GUI’s desired
visual appearance. Based on this picture, the designer can crop representative images of
operable GUI components such as buttons to compose action statements. The designer can
also graphically illustrate the expected visual feedback when these GUI components are
operated. Again, this graphical illustration can be used directly in assertion statements. Test
cases can be created and handed to programmers to implement the GUI’s outward visual
behavior. These test cases will initially fail because none of the desired visual behavior
has been implemented yet. As more features are implemented, more test cases can be
passed. When all the test cases are passed, the implementation is not only complete but
also thoroughly tested. This practice is often known as test-driven development, which
has been widely adopted by non-GUI development projects. Our visual testing framework
initiates an opportunity for GUI designers and programmers to engage in this good practice
of software engineering.
Even in small projects when a programmer often doubles as a designer and a tester,
test-driven development can still be practiced. For example, given a design specification, a
program can create the skin of a GUI without any functionality using a Rapid Application
Development (RAD) tool. Then, before the actual implementation, the programmer can
take the screenshots of the skin to write test cases and start writing GUI code to pass these
test cases.
57

Table 4.1: The testability of GUI visual behavior under Sikuli Test. The numbers (1 to 4)indicate the combination of the widget and the visual behavior can be tested with SikuliTest in the corresponding application. The triangles △ indicate theoretically testable, andthe red Fs mean not testable by Sikuli Test. The rest of the cells marked with an X indicatesthey are rarely paired together.
4.5 Evaluation
To evaluate Sikuli Test, we performed testability analysis—how diverse the visual behavior
GUI testers can test automatically, and reusability analysis—how likely testers can reuse a
test script as a GUI evolves.
4.5.1 Testability Analysis
We performed testability analysis on a diverse set of visual behavior. Each visual behavior
can be defined as a pairing of a GUI widget and a visual effect rendered on it. We consid-
58

ered 27 common widgets (e.g., button, check box, slider, etc.) and 25 visual effects (e.g.,
appearance, highlight, focus, etc.). Out of the 675 possible pairings, we identified 368 to
be valid, excluding those that are improbable. We began the analysis by applying Sikuli
Test to test the visual behavior exhibited by four real GUI applications (i.e., 1: Capivara, 2:
jEdit, 3: DrJava, and 4: System Preferences on Mac OS X).
For each pair of a GUI widget and a visual effect, we wrote a script for it using Sikuli
Test to confirm if it is testable. For example, say we would like to know if “text changed”
in a text field is testable, we first found an application that has this combination of visual
behavior, which is (2) jEdit in our experiment. Then we wrote a script, which changed the
text in a text field in jEdit and used an assertExists statement to verify it. If the script can
successfully test this change, we say this pair is testable.
Some pairs of visual behavior are rarely combined together. We call them improbable.
For example, the pair of scrolling bars and font changing is improbable, because there is
even no fonts or text in scrolling bars. Therefore, this pair of visual behavior is unlikely to
be combined together in most GUI applications.
Table 4.1 summarizes the result of the testability analysis. Each cell corresponds to a
visual behavior. Out of 368 valid visual behaviors, 139 (indicated by the number of the
application used to be tested) are empirically testable, visual behavior was found in the
four applications and could be tested; 181 (indicated by a triangle △) are theoretically
testable, visual behavior was not found in the four applications but could be inferred from
the testability of other similar visual behavior; and 48 (indicated by an “F”) are not testable
by Sikuli Test. In addition to these valid visual behaviors, there are 307 rarely paired
improbable visual behaviors indicated by an “X”.
As can be seen, the majority of the valid visual behavior considered in this analysis
can be tested by Sikuli Test. However, complex visual behavior such as those involving
animations (i.e., fading, animation) are currently not testable, which is a topic for future
work.
59

4.5.2 Reusability Analysis
We performed reusability analysis of test scripts based on two real GUI applications: Capi-
vara, a file synchronization tool, and jEdit, a rich-text editor. These two applications were
selected from the popular downloads on SourceForge.net with two criteria: it must have a
rich set of GUI widgets, and it must have at least 5 major releases available for download.
First, we focused on the two earliest versions that can be downloaded of the two ap-
plications. For Capivara, we chose versions 0.5.1 (Apr. ’05) and 0.6 (June ’05) (Figure
4-5 a,b). For jEdit, we chose versions 2.3 (Mar. ’00) and 2.41 (Apr. ’00) (Figure 4-5 d,e).
Since there were modifications to the user interface between these two versions, we were
interested in whether test cases written for the first version can be applied to the second
version to test the unmodified parts of the application. We created 10 and 13 test cases
for Capivara and jEdit respectively. Most of the test cases were created using the test-
by-demonstration tool, while some required manual adjustments such as giving hints and
removing excess contexts from the detected visual feedback. Examples of the test cases
can be seen in Figure 4-6.
Table 4.2 summarizes our findings. These two tables include the first two versions, plus
a later version that showed drastic change in the GUI for Capivara and jEdit respectively.
The column of the first version shows how each test case is made: A denotes automat-
ically generated, AM denotes automatically generated with some modifications, such as
giving hints and removing excess contexts from the detected visual feedback, and M de-
notes manually written. Each column of the other two versions shows the result of each
test case at the version: P denotes passed, whereas F1 - F5 denote failure. (The cause of
each failure will be explained later.)
Between the first two versions of Capivara, we observed one modification to the UI: the
size limitation of the panel splitter was different. Thus, we only needed to update 1 of the
10 original test cases to reflect this modification. In other words, we were able to apply the
other 9 test cases against the second version to test the correctness of unmodified features.
Similarly, in the case of jEdit, we observed 3 modifications among the features covered by
the original 13 test cases. Again, we were able to apply the remaining 10 test cases against
60

(a) Capivara 0.5.1 (1st) (b) Capivara 0.6.0 (2nd)
(c) Capivara 0.8.0 (4th) (d) jEdit 2.3 (1st)
(e) jEdit 2.4.1 (2nd) (f) jEdit 2.6 (4th)
Figure 4-5: GUI applications used to evaluate the reusability of Sikuli Test scripts as theseapplications evolve. Between (a) and (b), there is only one minor change in the connectionsettings dialog (a new button below Favourites), but the dialog has significant changes in(c). As for jEdit, between (d) and (e), a major change is the disappearance of the tool bar.However, it comes back with a different style in (f).
61

(a) Example of an automatically generated testcase
(b) Example of a manual written test case
Figure 4-6: Example test cases for Capivara
the second version.
Next, we examined the long-term reusability of test cases as the applications undergo
multiple design changes. For Capivara, we considered two additional major versions: 0.7.0
(Aug. ’05) and 0.8.0 (Sep. ’06), whereas for jEdit, we considered five more: 2.5.1 (Jul.
’00), 2.6final (Nov. ’00), 3.0.1 (Jan. ’01), 3.1 (Apr. ’01), and 3.2.1 (Sep. ’01). We tested
whether each of the original test cases was still reusable to test the later versions and for
those no longer reusable, identified the causes.
Figure 4-7 summarizes our findings. To show the reusability of the test cases, we ar-
ranged each version across the horizontal axis. For each version, the height of the baseline
region (blue) indicates the number of the original test cases still being reusable for that
version. This region exhibits a downward slope toward the direction of the newer versions,
reflecting the fact that fewer and fewer of the original test cases remained applicable. The
sharpest drop-off can be observed at version 0.8.0 for Capivara (Figure 4-5.c) and at 2.6fi-
nal for jEdit (Figure 4-5.C), which can be attributed to the change of major design in these
versions. The lesson that can be drawn from this observation is that as long as the design
of a GUI evolve incrementally, as often the case, a significant number of test cases can be
reusable, which is important for supporting regression testing.
Also, we identified five major causes for a test case to become unusable: (F1) change
in the visual style, e.g. skin, size, font, etc.; (F2) removal of the action component, e.g. a
button or a checkbox to be clicked; (F3) removal of the expected visual feedback, e.g. a
dialog or some text appears; (F4) change in the surrounding of the target components; and
(F5) change in internal behavior.
62
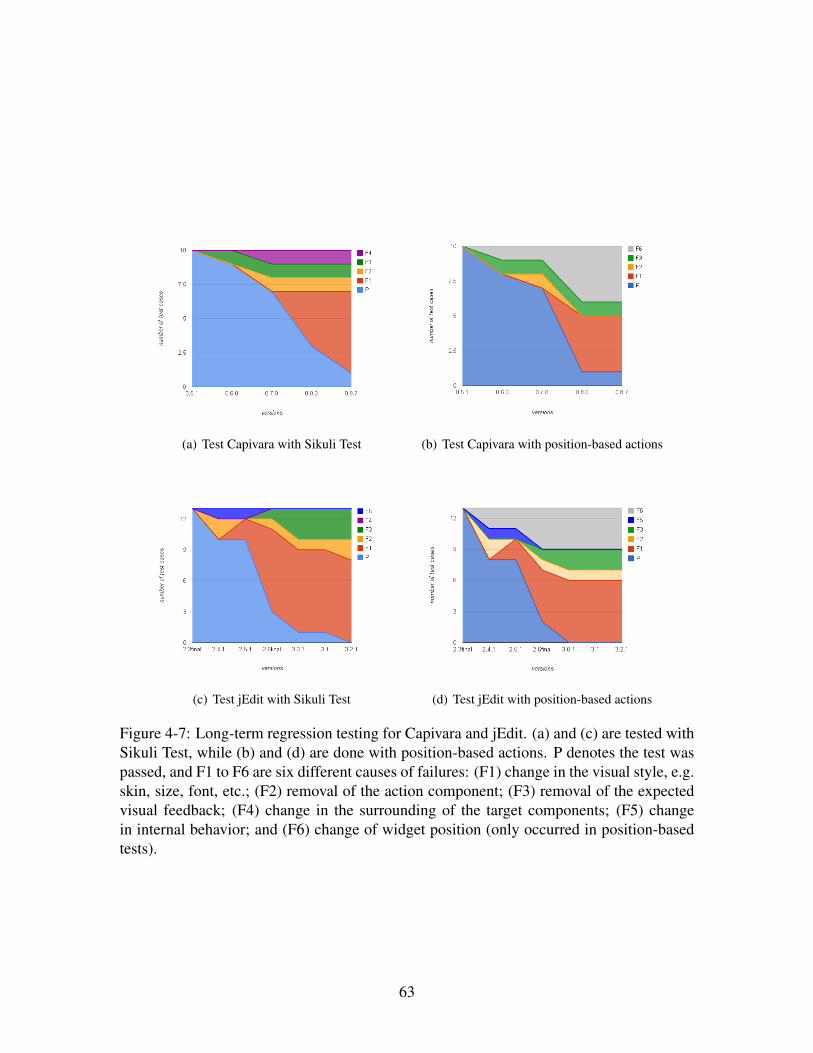
(a) Test Capivara with Sikuli Test (b) Test Capivara with position-based actions
(c) Test jEdit with Sikuli Test (d) Test jEdit with position-based actions
Figure 4-7: Long-term regression testing for Capivara and jEdit. (a) and (c) are tested withSikuli Test, while (b) and (d) are done with position-based actions. P denotes the test waspassed, and F1 to F6 are six different causes of failures: (F1) change in the visual style, e.g.skin, size, font, etc.; (F2) removal of the action component; (F3) removal of the expectedvisual feedback; (F4) change in the surrounding of the target components; (F5) changein internal behavior; and (F6) change of widget position (only occurred in position-basedtests).
63

Test Cases of Capivara (1st) (2nd) (4th)0.5.1 0.6.0 0.8.0
connection-setting-cancel A P Pconnection-setting-ok A P Pnew-host-in-favorites AM P F1text-changed-in-status-and-tab A P F1menu-exit-dialog AM P F2toolbar-sync-dialog A P Pname-size-column-in-listbox A P F1menu-options-tree AM P F4enabled-disabled-buttons AM P F1splitter-resize M F3 F3Test Cases of jEdit (1st) (2nd) (4th)
2.3final 2.4.1 2.6finaltextarea-add-del-by-key AM P F1textarea-add-del-by-menu AM P F1new-tab-by-key A P Pnew-tab-by-menu AM P Pnew-tab-by-toolbar AM F2 F1find-by-key AM P F1find-by-menu AM P F1find-by-toolbar AM P F2textfield-on-toolbar AM F5 F3toolbar-print-dialog A F2 F1menu-submenu AM P Pscroll-textarea M P F1quit-cancel A P F1
Table 4.2: Test cases created for the first version automatically (A), semi-automatically(AM) or manually (M) and their reusability (Pass or Fail) in subsequent versions (2nd and4th).
Each cause of test failures is represented in the figure as one of the colored regions
above the baseline region, with its height indicating the number of unusable test cases
attributed to it. As can be expected, the most dominant cause is change in visual style
(F1, orange), since our testing framework is largely driven by high-level visual cues. One
surprising observation is an unusual upward slope of F2 occurred at jEdit 2.5.1, indicating
that test cases that were not reusable in the previous version became reusable. Upon close
examination, we found that toolbar icons were removed at 2.4.1 but reintroduced at 2.5.1,
making the test cases targeting toolbar icons reusable again. While such reversal of GUI
design is rare in practice, when it does happen, Sikuli Test is able to capture it.
64

To compare the performance of Sikuli Test with existing position-based methods (i.e.
locating widget using fixed coordinates in the scripts instead of using screenshots), an extra
set of experiments are done by replacing each screenshot in the action statements with the
coordinate of the center of the location where the screenshot is taken. Figure 4-7 (b) and (d)
show the result of this experiment, where F6 represents the failures caused by the change of
widgets’ location. This comparison shows that Sikuli Test effectively reduces the failures
caused by the fixed-position method and extends the life of the test cases.
4.6 Conclusion
We presented Sikuli Test, a new approach to GUI testing using computer vision. Besides
meeting the five design goals identified in an interview study with GUI testers, Sikuli Test
offers three additional advantages:
1. Readability of test cases: The semantic gap between the test scripts and the test
tasks automated by the scripts is small. It is easy to read a test script and understand
what GUI feature the script is designed to test.
2. Platform independence: Regardless of the platform a GUI application is devel-
oped on, Sikuli Test can be used to test the GUI’s visual feedback. We have shown
the examples of test scripts written to test traditional desktop GUI applications on
Windows and Mac OS X, as well as Web applications in a browser and mobile appli-
cations in an Android emulator. Even though Sikuli Test is not designed to let users
write scripts once and use them across multiple platforms, it is still possible to do so
as long as the appearance of the applications looks the same.
3. Separation of design and implementation: Test cases can be generated by design-
ers and handed to programmers to implement features that must pass the test cases,
to eliminate the biases that may arise when programmers are asked to test their own
implementation.
However, Sikuli Test currently has two major limitations that can be improved upon in
the future. First, while Sikuli Test can assert what visual feedback is expected to appear or
65

to disappear, it is unable to detect unexpected visual feedback. For example, if a program-
mer accidentally places a random image in a blank area, it is an undetectable error since no
one would have anticipated the need to test that area with assertions. One solution would
be to run the visual feedback detector at the test time to see if there is any detected visual
feedback not covered by an assertion statement. Second, Sikuli Test is designed to test a
GUI’s outward visual feedback and is thus unable to test the GUI’s internal functionalities.
For example, while Sikuli Test can check if a visual feedback is correctly provided to the
user who clicks the save button, it does not know if the file is indeed saved. One solution
would be to treat Sikuli Test not as a replacement of but a complement to an existing testing
tool. Together they make sure both the outward feedback and inward functionalities of a
GUI can be sufficiently tested, a task neither can accomplish alone.
66
Chapter 5
Deep Shot
The landscape of personal computing has shifted from one computer per user to multiple
heterogeneous devices per user [13]. To carry out an everyday task, such as finding a
restaurant for dinner, a user often switches from one device to another according to the
situation. For example, a user has looked up the directions to the restaurant on her PC at
home but then redoes the search on her phone for navigation in her car. A recent study
found that this and other common tasks, such as email and web browsing, were the source
of the most frustration while switching between different devices [24].
The lack of tool support for migrating tasks across devices has also been pointed out
by several previous studies. A survey [35] conducted in 1997 showed that 62.9% of people
stated they transferred information for completing a task on other devices “by hand”, i.e.,
reading a text string on a display and typing it on another computer. A non-trivial number
of people transferred data through shared files, FTP, or emails. Surprisingly, a more recent
study in 2008 [13] showed that people were still using these old-fashioned mechanisms
plus emerging cloud services (e.g., Google Docs) to transfer information across devices.
Although cloud services and ubiquitous access to the Internet seem to be an antidote, the
study found people were still frustrated as they have to manually reconstruct their work
state, e.g., opening and locating the part of a PDF article that was viewed on the previous
computer to continue reading. Furthermore, moving between heterogeneous devices (e.g.,
a PC and a mobile phone) amplifies the task resumption overhead due to various contextual
and resource constraints [3, 2, 24].
67

Prior work made substantial progress in providing more integrated user experience for
task migration across devices (e.g., [16, 30, 33, 37]). However, existing solutions are in-
sufficient in two ways. First, some prior work primarily focused on infrastructure for trans-
ferring data across devices, not user interaction. Compared to moving data or application
windows around on a single computer by drag-and-drop, there is no similarly easy method
for cross-device migration. Secondly, existing tools focusing on user interaction are mostly
document-centric with little support for recovering a work state [30, 3, 2]. Manually recov-
ering a work state requires users to deal with many details that can distract them from the
task that they want to resume.
To address these issues, we present Deep Shot, a framework that supports task migration
by allowing users to transfer not only documents but also application states across devices
using a mobile phone camera. Deep Shot provides two novel camera-based interaction
techniques, deep shooting and deep posting. These two techniques allow seamless and
intuitive migration of user tasks from one device to another by one uniform operation:
taking pictures.
Deep shooting allows a user to capture and to persist the deep information, i.e., the
information behind the raw pixels, such as application states, with a camera-like mobile
phone application in a single click (see Figure 1-2). The captured work state can be resumed
immediately on the mobile phone, opened later, or migrated to another device with deep
posting, which pushes deep information to a device with a camera as well.
To support deep shooting and deep posting, we created a framework, Deep Shot, for
application developers to easily incorporate these techniques into their applications. It
includes two key ideas. First, Deep Shot uses robust computer vision algorithms to identify
what portion of the screen the user is looking at through the camera. We conducted two
experiments to show the feasibility of this technology. Second, Deep Shot requires the
applications to encode the deep information as Uniform Resource Identifiers (URIs) to
respond requests from deep shooting or posting so that a task can be resumed even using
different applications, such as viewing a Microsoft Outlook contact’s information with a
native Android application.
In the rest of this chapter, we first clarify our motivation using a running example in
68
which a user searches for a restaurant and discuss how Deep Shot supports this task by
allowing a user to easily migrate the task across devices. Next, we discuss the design of
our framework, and implementation details. We also show how developers can leverage
our framework to enable deep shooting and posting in their applications. We then discuss
the range of scenarios that Deep Shot can address. Finally, we describe an evaluation of
our techniques and framework, and conclude with related and future work.
5.1 Motivation
Here we discuss why it is important to address task migration across devices. Let us assume
a user, Bob, is searching for a restaurant for dinner on Yelp at home. Bob has read several
reviews of a restaurant on his desktop computer. He decides to try one restaurant and clicks
on the map on the review page to read the driving directions. Everything is going smoothly
until he needs to leave home and move the directions to his mobile phone for navigation in
his car. How can Bob open the same region of the map on his phone?
Bob could manually type the restaurant’s address or name and search on the phone. Or
he could click “Link” on Google Maps to get a bookmarkable URL of the current region,
and email that URL to himself so that he can look for the email and open the URL in it
on his phone later. These approaches generally require the user to perform two steps: 1)
inspecting the internal state of the application, e.g., the URL, and 2) copying it by hand or
via a temporary medium, e.g., a file or an email, from one device to another.
The inspecting step varies widely depending on the applications. In a web page or web
application, the Uniform Resource Locator (URL) on the address bar often represents the
application state that a user intends to transfer. However, in many web applications using
Ajax, the URL no longer represents the current state of the application. A user is often
required to perform extra steps to retrieve the real “bookmarkable” URL, such as what Bob
would do in Google Maps. However, many Ajax and desktop applications do not have a
URL that represents what the user is viewing and working on. Tools have been developed to
overcome this problem by recording the commands needed to return a page [20]. However,
a desktop application’s state is generally inaccessible by end users.
69

The copying step requires a user to either manually re-enter the information on another
device, e.g., when transferring a small piece of information such as a short URL or the
name of a landmark, or understand and deal with low-level operations such as how to save
information in files and use file transferring software.
Anecdotally, people sometimes take a picture of a particular region of interest (ROI) on
the monitor using a camera, which is generally available on modern mobile phones. This
method utilizes the camera as a physical tool to directly inspect and copy the information
at the same time and saves the user’s time from retyping the information on another device.
In Bob’s scenario, he could capture the portion of the map he needs in one simple step, i.e.,
taking a picture. This method is simple, independent of the application the user is using,
and avoids many of the hassles of manual inspection and copying. However, it is limited
in that information being transferred is encoded in raw pixels and will not allow a user to
perform further interaction, e.g., panning or zooming a map.
5.2 Deep Shooting and Posting
Inspired by the picture-shooting metaphor above, we designed and implemented deep
shooting and posting, two novel techniques that are as simple to perform as taking a pic-
ture, but copy deep information behind the raw pixels of the captured region, that is, the
application state.
With deep shooting (see Figure 5-1 ), Bob can copy a specific region of the map dis-
played on his computer’s screen to his mobile phone by simply taking a picture of it with
the phone’s camera. The same region is then shown on the phone automatically. More
importantly, the captured map remains interactive on the mobile phone. In other words,
Bob can pan the map to see the area that is not originally captured by the camera, or zoom
in to see more details of the streets.
Based on the picture captured with deep shooting, our system automatically identifies
the captured area on the screen and the front-most application containing that area. Our
system then pulls information from the application and sends it to the mobile phone that
took the picture. The information is encoded as a URI, which has been accepted as a stan-
70

Figure 5-1: A user takes a picture of the screen of her computer and then sees the appli-cation with the current state on her phone. Our system recognizes the application that theuser is looking through the camera, automatically migrates it onto the mobile phone, andrecovers its state.
71

dard way to launch applications on contemporary mobile operating systems such as Apple
iOS and Android. Therefore, the user can view or manipulate the extracted information on
the mobile phone with native applications.
As a complement to deep shooting, deep posting allows a user to push information from
a mobile phone to another device. Let us assume Bob has opened the restaurant review page
on his mobile phone to write a review, but soon decides he would rather continue this task
on his desktop computer, where it is easier to type. To do so, Bob aims the mobile phone
camera at the computer screen with the review page still shown on the phone. Once deep
posting is activated (e.g., via a hot-button on the phone), the review page becomes semi-
transparent so that the user can see through it and know which part of the screen he is
targeting at. Based on the screen region as seen through the camera, once Bob confirms,
deep posting identifies the intended computer screen and automatically opens the same
review page on it.
Deep posting employs the same mechanism as deep shooting in identifying the target
computer screen and the specific region on the screen that the user sees through the camera.
However, unlike deep shooting, deep posting does not need to identify which application
the user is looking at, since the application for handling the information being posted may
not be running.
The deep shooting application running on the mobile phone maintains the history of
deep shots that a user has taken. Similar to browsing photos in a photo gallery application,
a user can browse all of his deep shots (see Figure 5-2 ). Each shot in this gallery shows
the title and the thumbnail of the captured application. With the gallery, a user can directly
launch a desired application with its captured state on the phone. The gallery provides a
simple interface for users to manage their tasks and switch between them.
Currently, the Deep Shot framework is designed for migrating tasks across personal
devices. Thus, before using deep shooting or posting, a user needs to log into a remote
server with the user’s credential on each personal device, and the credentials can be stored
in the devices thereafter. Therefore, this authentication step only needs to be performed
once for each device. We will discuss the possibilities of eliminating the authentication
process in the Future Work section.
72
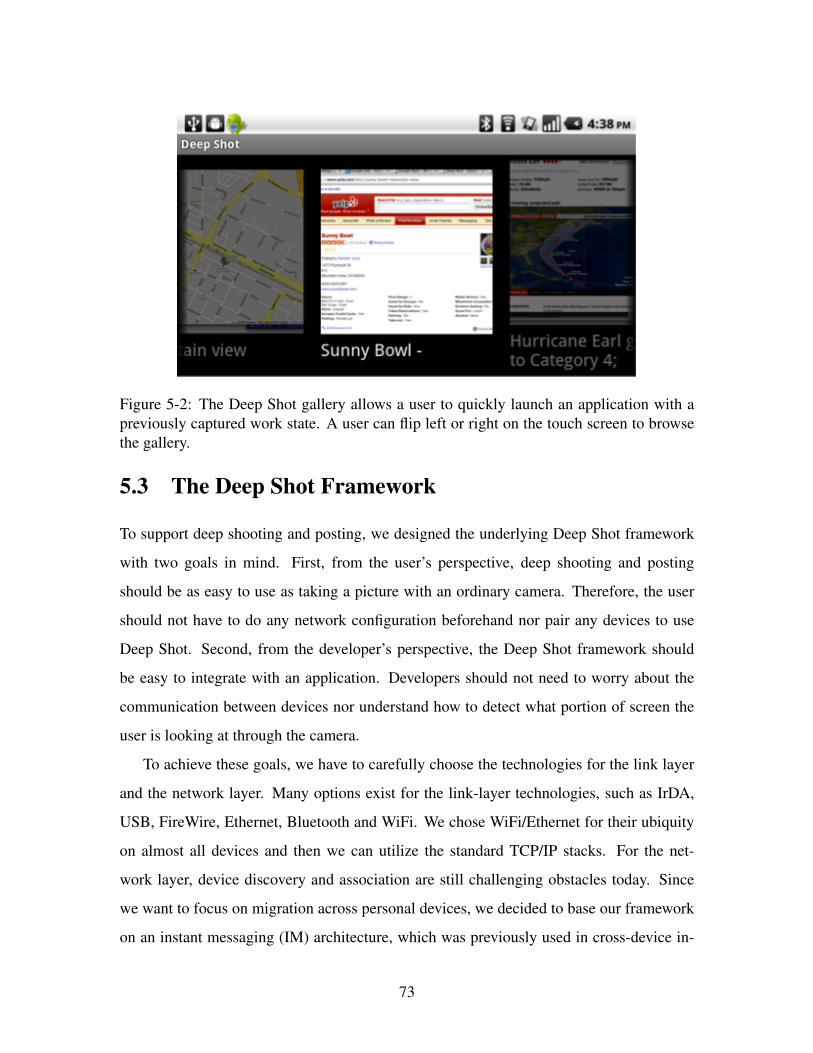
Figure 5-2: The Deep Shot gallery allows a user to quickly launch an application with apreviously captured work state. A user can flip left or right on the touch screen to browsethe gallery.
5.3 The Deep Shot Framework
To support deep shooting and posting, we designed the underlying Deep Shot framework
with two goals in mind. First, from the user’s perspective, deep shooting and posting
should be as easy to use as taking a picture with an ordinary camera. Therefore, the user
should not have to do any network configuration beforehand nor pair any devices to use
Deep Shot. Second, from the developer’s perspective, the Deep Shot framework should
be easy to integrate with an application. Developers should not need to worry about the
communication between devices nor understand how to detect what portion of screen the
user is looking at through the camera.
To achieve these goals, we have to carefully choose the technologies for the link layer
and the network layer. Many options exist for the link-layer technologies, such as IrDA,
USB, FireWire, Ethernet, Bluetooth and WiFi. We chose WiFi/Ethernet for their ubiquity
on almost all devices and then we can utilize the standard TCP/IP stacks. For the net-
work layer, device discovery and association are still challenging obstacles today. Since
we want to focus on migration across personal devices, we decided to base our framework
on an instant messaging (IM) architecture, which was previously used in cross-device in-
73

frastructures such as PIE [33]. Thus, we can build on top of standard TCP/IP and avoid the
problems of dynamic IP addresses, private IP addresses behind Network Address Transla-
tion (NAT) gateways, and firewalls that block connections from the outside. However, this
architecture requires an authentication step before using our system. Fortunately, authenti-
cation only needs to be performed once for each device and does not add any cost for using
Deep Shot thereafter.
We chose Extensible Messaging and Presence Protocol (XMPP), also known as Jabber,
for our IM protocol. One reason is that XMPP supports logging in with the same user ac-
count from multiple different devices. A user account with a device has a unique identifier
of the form "user@server/device." This allows users to set up all of their devices with the
same user name. Since XMPP can list all of a user’s presences across devices, users do
not have to manually add their devices into their contact list. Also, the size of a XMPP
message is not limited, which means we can send relatively large data, e.g., a JPEG photo,
through a typical message packet without hacking the protocol.
5.3.1 System Components
Deep Shot’s architecture is shown in Figure 5-3. The pink components are required for deep
posting, whereas the yellow ones are required for deep shooting. There are five roles in our
system: a shooter, a poster, a dispatcher, launchers and applications (apps). The shooter
and the poster only run on a capturing device, e.g., a mobile phone equipped with a camera.
The dispatcher runs on a target device, which accepts a deep shooting or posting request
from a capturing device. The launchers run on both sides of the system. On the capturing
device, the launcher launches mobile applications to recover a work state captured by deep
shooting, whereas on the target device it launches desktop applications to present a work
state that is posted by deep posting.
5.3.2 Protocol Design
Here we describe the protocols between each pair of system components. To simplify the
design of our protocols, the messages exchanged among all components are structured and
74

Figure 5-3: The system architecture of Deep Shot. Solid lines represent direct messagesbetween components, whereas dotted lines represents the launching signal sent from thelauncher.
75
encoded in the JavaScript Object Notation (JSON) key-value pairs. Besides, all binary data,
e.g. images, are encoded in Base64 so we can include them in standard XMPP messages.
Deep Shooting: Shooter-Dispatcher Protocol
Once a user uses the shooter to take a picture of the region of interest on a computer
monitor, an XMPP message with the picture and a subject deepshot.req indicating a deep
shooting request is broadcast to all available devices.
When the dispatchers running on the target devices receive the request message, they
immediately take a screenshot of the entire screen of their devices. Each dispatcher then
matches the picture it receives against the screenshot. The matching algorithms (described
in the next section) locate the region that the user was looking at through the camera. Then
the dispatcher sends a new message with the x-y coordinates of the corners of the region
and the central point of the region to the front-most application overlapping the center
point, through a WebSocket connection.
After the application has handled the message and returned a response, the dispatcher
inserts the application name, and the thumbnail of the matched region on the screenshot.
Both are useful for browsing the deep shooting history on the capturing device. Finally, the
dispatcher sends the response to the shooter via the XMPP server. If the picture matches
on two different dispatchers, both send the response back and the client would pick the first
response from them.
Deep Shooting: Application-Dispatcher Protocol
The dispatcher is designed as a daemon that always runs in the background on all personal
devices. The dispatcher has the user’s credentials, so it is always connected to the XMPP
server. Therefore, any device can obtain the availability of any other device from the XMPP
server.
The dispatcher communicates with each application using a dedicated WebSocket con-
nection. WebSocket is a new protocol that supports full-duplex and bi-directional com-
munication over a TCP socket. We choose WebSocket for two reasons. First, it is being
standardized by the IETF and W3C, and modern browsers already support WebSocket.
76

Thus, we can easily implement a browser extension as a second-level dispatcher for web
applications. Second, since the traditional TCP socket is the most pervasive inter-process
communication (IPC) mechanism, and WebSocket is a simple extension of TCP sockets,
traditional desktop applications can support it easily.
Each time an application that supports Deep Shot is launched, it registers itself with
the dispatcher through a WebSocket connection on a TCP port. A registration process
starts after the standard WebSocket handshaking. The application sends out a registration
message with its name. If the dispatcher accepts the registration, it returns an OK message,
or else it returns a decline message indicating the reason and closes the connection. To
support deep posting, an application sends the command “accept URI_SCHEME”, which
indicates what types of URI schemes it accepts. For example, an email client can register
the “mailto:” scheme, and a web browser can register the “http:” and “https:” schemes.
Once the registration is completed, this WebSocket connection should be kept persistent
until the application is closed so the dispatcher can proactively notify the application when
a request is coming.
Once an application has dealt with the dispatcher’s request, it replies with a message
consisting of at least a URI that encodes the state of the application or the information
to expose. If needed, the application can attach offline resources or files in the response
message. Each attached file is stored in a JSON structure with the file name and the content
of the file.
Deep Shooting: Dispatcher-Launcher Protocol
After the dispatcher receives a reply message from the application, it routes that message
with a subject “deepshot.resp” back to the capturing device that sent out the request.
On the capturing device, a launcher waits for the “deepshot.resp” messages. Once a
response message arrives, the launcher decodes the message and writes all attachments to
the storage on the device. Finally, it opens an appropriate application that handles the URI
replied from the target device to recover the work state and resume the task flow.
77

Deep Posting Protocol
The deep posting protocol is based on the same foundation we used in deep shooting,
including JSON structures and XMPP communication. The key role in our system for deep
posting is the poster that runs on a capturing device. The poster accepts requests from the
applications that support our Deep Shot framework. The posting requests should consist of
at least a URI representing the internal state of the application.
Once the poster receives a posting request from an application, it opens the camera and
overlaps the screenshot of the application on the viewfinder so that a user can see the target
device and the information to post at the same time. After the user has confirmed the target
device through the viewfinder, the poster creates a “deeppost.req” message with the picture
taken by the camera and the request from the application. Finally, this message is sent to
all available devices, in the same way as deep shooting.
After the dispatchers running on the user’s other devices receive the “deeppost.req”
message, each of them runs the same vision algorithm used for deep shooting to match the
picture taken by the user against its screenshot. If a dispatcher finds a match, it routes the
request to the launcher.
As we mentioned before, applications register the types of URI schemes they support.
The deep posting launcher requires this information to launch an appropriate application
for the given URI in the request. Each application may register multiple URI schemes.
If a URI scheme can be accepted by multiple applications, the launcher either opens a
dialog so the user can choose an application or just launches a previously specified default
application.
5.3.3 Screen Matching Algorithms
Once a device receives a Deep Shot request, it takes a screenshot of the entire monitor.
It then extracts visual features from the screenshot and the picture taken by the camera,
using a computer vision algorithm, Speeded-Up Robust Features (SURF) [4]. SURF is
robust against scaling and rotation, and faster and more robust than Scale-Invariant Feature
Transform (SIFT) [28], another popular feature extraction algorithm.
78
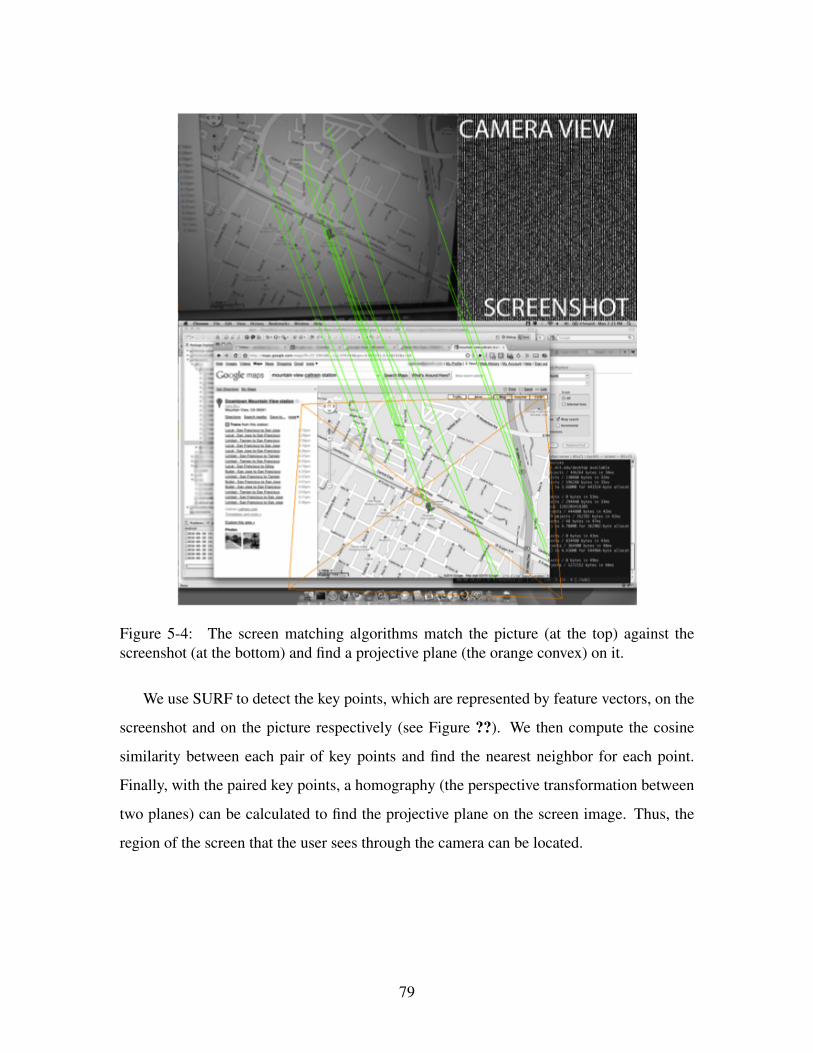
Figure 5-4: The screen matching algorithms match the picture (at the top) against thescreenshot (at the bottom) and find a projective plane (the orange convex) on it.
We use SURF to detect the key points, which are represented by feature vectors, on the
screenshot and on the picture respectively (see Figure ??). We then compute the cosine
similarity between each pair of key points and find the nearest neighbor for each point.
Finally, with the paired key points, a homography (the perspective transformation between
two planes) can be calculated to find the projective plane on the screen image. Thus, the
region of the screen that the user sees through the camera can be located.
79

5.3.4 Content and State Encoding
A migration process of an application consists of transferring not only its content but also
its states. With our framework, developers can store arbitrary offline content, e.g., files,
as an attachment in a Deep Shot request and encode the application states into a URI. A
URI is the key element to resuming a work state in Deep Shot. A URI can be application
independent. For instance, “content://contacts/15” opens a contact manager to show the
person with the id 15; “geo:latitude,longitude” shows the given location in a map applica-
tion; and “document://chi2011.pdf/3” represents the third page of the file “chi2011.pdf”.
Furthermore, developers can append the zoom level, the scrolling position, and all neces-
sary information of this document to the URI as needed. We do not limit the length of a
URI so arbitrary states of an application can be encoded.
Recently, some application frameworks such as Three20 (http://three20.info) have started
to support URL-based navigation in traditional applications. Mobile operating systems
such as Android and iOS also support launching applications with standard URIs (e.g.,
http:, tel: and geo:). Deep Shot allows applications to create their own URIs, although it is
advisable to be compatible with public standards.
5.3.5 Bootstrapping with a Default Responder
To handle the work state of various applications, the Deep Shot framework, needs to be
integrated into those applications by their developers. To deploy such a framework, we need
to address how to bootstrap its usage when application developers have not yet adopted the
framework. Therefore, we implemented a default responder in the dispatcher to handle the
case in which the target application does not support Deep Shot.
If the application that the user is taking a photo of is not registered with the dispatcher,
the default responder replies the screenshot of the entire screen to the capturing device as
well as the coordinates of the matched region. Therefore, users can acquire a clear version
of the screen, i.e., without any noise and distortion caused by the physical camera. They
can also zoom in to see more detail and pan to other parts of the screen that were not in the
original picture. In addition, as the dispatcher takes the screenshot, it also detects clickable
80

URLs and information of interest such as phone numbers or addresses, using the operating
system’s accessibility API. These metadata are also transferred along with the screenshot,
so the user can tap on a URL or a phone number on the screenshot to launch a browser or
dial the number directly.
5.3.6 Supporting Web and Desktop Applications
Deep Shot is a general framework that supports traditional desktop applications as well as
web applications. We discuss how Deep Shot supports these two kinds of applications in
this section.
Most modern web applications are written in JavaScript and run inside a web browser,
while their data are stored on remote servers. To further bootstrap the Deep Shot framework
and support this kind of application, we created a web dispatcher, implemented as a Google
Chrome browser extension, which has three important features.
First, the web dispatcher acts as a second-level dispatcher. It routes messages from
the first-level dispatcher to the appropriate web page and sends reply messages back (see
Figure 5-3).
Second, the web dispatcher is a default responder for all web applications that do not
support Deep Shot. If the web dispatcher gets a request asking for data from a site that does
not register itself with Deep Shot (discussed in a later section), it will only return the URL
to that site as a default response. The URL on the address bar often maps to the state of
the current web application. However, some Ajax applications do not have this property or
hides their real URL on purpose. Fortunately, the last feature of our dispatcher addresses
this problem.
Last, the web dispatcher can inject a script into a web application that allows Deep Shot
to extract the application’s state, without the application knowing about Deep Shot. This
is possible because, as a browser extension, the web dispatcher is capable of injecting any
content into any web page from the browser.
In addition to web applications, desktop applications could be more difficult to migrate
since their developers need to make additional effort to encode the application states into
81

a URI. Fortunately, most mobile versions of a desktop application are simplified and only
provide the key features on the mobile devices. This means the developers do not need to
encode the complete state of their applications, but can focus on a small set of key states.
For example, the key states of a word processor may only consist of the cursor position, the
zoom level, and the scrolling position of the document. The other states, such as the view
mode and the toolbar’s style, could be unimportant because the mobile word processor does
not have these adjustable features.
5.4 Implementation
We implemented Deep Shot to support both deep shooting and posting. On the mobile
side, we chose the Android platform and implemented the system in Java on a Google
Nexus One phone. On the other side, we implemented the dispatcher and the launcher
in Python on a laptop computer. We also set up a XMPP server using Jabber on a Linux
machine. Besides disabling the message size limit in Jabber’s default configuration, we did
not modify Jabber.
5.5 Developing Deep Shot Extensions
To minimize the effort for developers to incorporate Deep Shot into their applications, we
created a Java library that implements the dispatcher-application protocol and hides the
WebSocket connection inside the library.
The library has a DeepShot class that has one public method, addListener (defined
as follows), for applications to register themselves to listen to Deep Shot requests.
void addListener(Listener listener, String app_name, String[] accepted_uris)
The Listener interface has only one method, DeepShot.Response
onShot(DeepShot.Request req), where the Response contains a URI and op-
tional file attachments, and the Request contains the four corner points and the center
point of the ROI. Deep posting also has a similar API, void post(DeepPost.Request
82
req) in a class DeepPost, where DeepPost.Request contains a URI and optional file
attachments.
For web developers, we also provides a JavaScript function, DeepShot.addListener(listener),
from a browser extension, so web developers can simply hook their web applications into
Deep Shot. For example, Google Maps does not show the URL of the current region of the
map in the address bar. To extract the real URL of the current map, we inject the following
script:
if(window.DeepShot){
DeepShot.addListener(function(request){
return {"uri": document.getElementById("link").href};
});
}
With this script, even if Google Maps does not support Deep Shot, users can still use
deep shooting to open any computer map on their phone.
5.6 Scenarios
In this section, we illustrate four typical scenarios that can be accomplished by deep shoot-
ing and posting.
Scenario 1: Taking information to go (PC to mobile phone)
This is the classic scenario that motivated us to develop deep shooting. People usually
work on desktop computers or laptops at work or home. Before moving to another place,
they may look up the information related to that place on their computers. However, as the
information may be hard to remember, they often write down the information on a piece
of paper or look up the same information again on their mobile phones. In this scenario,
people can take the information with them using deep shooting. For example, people could
carry a part of a map or the address of the next meeting place so that they do not need to
83

look it up again. People could even capture a YouTube video being played and later resume
watching the video from where they left off on a mobile phone.
Scenario 2: Viewing or saving mobile phone content on PCs (mobile phone to PC)
People generate various kinds of lightweight information on mobile phones, such as photos,
contacts, or unfinished readings. For lightweight tasks, such as transferring a photo in a
phone to a PC so that more people can see it, using existing software tools for syncing
up mobile phones with PCs is cumbersome (e.g., a user might need to plug in the cable
and find the right folder). With deep posting, users can simply aim their camera at the
target computer monitor with the photo still shown on the mobile phone. The photo will
be automatically transferred and opened on the target monitor. Deep posting also allows an
application to post information at a specific position and size, as seen through the camera,
on the target screen, e.g., a Post It application, which cannot be achieved by Bluetooth-
based sync tools.
Scenario 3: Using mobile phones as a bridge between PCs (PC to PC via a mobile
phone)
USB flash drives are widely used to share files among computers. People are used to saving
the information they want to share as files onto a USB drive, and then taking the drive to
another computer. In this kind of scenario, deep shooting can be used to extract information
from an application (e.g., running on an office PC) and automatically transfer it to a mobile
device. The user can then take this mobile device to a home PC and post the extracted
information or work states onto it with deep posting.
Scenario 4: Sharing content between mobile phones (mobile phone to mobile phone)
Although it is still rare to share information between multiple personal mobile devices, it
is common to share information between mobile phones owned by different people. Re-
searchers have developed techniques to address this need. For example, bumping is a syn-
chronous gesture to connect two mobile devices [19]. Although the current Deep Shot
84

framework does not support communication between multiple users’ devices, deep shoot-
ing and posting can be used to locate the devices as well as the region of information to
share across multiple users. For example, a user could take a picture of a contact displayed
on another person’s mobile phone with deep shooting, and then the full contact informa-
tion would be automatically transferred to our phone. This scenario potentially requires a
different authentication mechanism though.
5.7 Usability Analysis and Technical Evaluation
We analyze and evaluate this work from three perspectives. From a user’s perspective,
we analyze the interaction model and the usability of deep shooting and posting. From a
developer’s perspective, we analyze the usability and the utility of the API that we provide
for developers. Lastly, from a technical perspective, we evaluate the performance of our
framework and the feasibility of using a camera to locate a region on a monitor.
5.7.1 Interaction Model and Usability Analysis
Traditional GUI applications on PCs provides an action such as “send this to . . . ” in their
menus to let users send local files to remote devices. However, we argue this model is less
intuitive than the deep shooting and posting. For the same task of migrating applications
across devices, in the traditional model, a user would need to select the source application,
the data of interest, and the target device from a list of names or identifiers in multiple
steps with a GUI, which can distract the user from the task. In contrast, deep shooting and
deep posting adopts an old technique - taking pictures using a camera - to simultaneously
identify the source device, the data to transfer, and the target device, all in one action of
taking pictures of computer screens, which is just as easy as doing so of the real world.
This is consistent with the informal feedback we collected from users.
Since there is no extra step beyond taking pictures, the learnability and the memorability
of our techniques are as good as using ordinary cameras on mobile phones. The efficiency
of our techniques is related to two factors. One is the steps performed by the user, and
the other is the performance of our system in terms of speed and accuracy. To do a deep
85

shooting or a deep posting, a user needs to perform three steps: launching our application
on a phone, locating the target window on a device through the viewfinder, and pressing the
shutter. These steps are exactly the same as taking a picture using a camera application on
a phone. Therefore, our techniques are as fast as taking a picture from a user’s perspective.
The other factor, the speed and accuracy of our system, will be discussed later from the
technical perspective. Finally, because the steps a user needs to perform are minimized, the
type of error that may occur is taking a wrong region on the screen. However, the user can
simply discard an incorrect capture and redo the procedure. In addition to user errors, our
system may have errors while matching pictures against screenshots. We will examine this
kind of error with a controlled experiment in the following sections.
5.7.2 Technical Evaluation
Finally, we evaluate our system from a technical perspective. We set up two experiments to
explore whether using a camera to locate a region on a monitor is feasible in terms of speed
and accuracy. The first experiment was to test the speed of our system, and the second one
was to test the accuracy of our image-matching algorithm.
Experiment 1: Speed Performance
We used a laptop, a 15-inch MacBook Pro with a high-resolution 1680Œ1050 monitor as
the target device, and a Nexus One running Android 2.2 as the capturing device that takes
512x384 pictures. The capturing device was held by the experimenter at a distance of 20
to 40 cm and a pitch angle of ±20◦ so that about 13
of the screen could be seen through the
viewfinder.
We tested four target applications: photos (from Google Street View), short textual
information (from Yelp.com), long textual article with a few images (from CNN.com),
and maps (from Google Maps). For each application three photos were taken using deep
shooting under the setting described above.
The average time of the whole procedure across 12 trials (3 pictures for 4 applications)
was 7.7 seconds (SD 0.3 seconds). By examining the average time of each step, we found
86

Figure 5-5: The setup of the reliability experiment.
the network transmission occupied about 50% of the total time, while the rest of processing
time was spent on the target device (34%) and the capturing device (16%). The transmis-
sion caused a significant portion of the latency because our current implementation attaches
raw images captured by the camera in the messages and these messages were routed via
an external server. As a result, we can significantly reduce the latency of our system by
improving the transmission efficiency, e.g., using only visual features instead of the entire
image and not using a third-party server. We will discuss the possibilities in the Future
Work section.
Experiment 2: Reliability
In this experiment, we wanted to test the accuracy of our image-matching algorithm under
typical conditions for taking a picture of a screen as well as extreme conditions that are not
so common. Our experimental setup is shown in Figure 5-5. We used a 15-inch MacBook
Pro laptop so that we could easily adjust and measure the pitch angle of the screen. We
tested four pitch angles for the screen with respect to the phone: −20◦, 0◦, 20◦, and 40◦.
The laptop shows a full-screen browser (Google Chrome) with a web page of the most
popular local restaurant on Yelp, which is a typical webpage consisting of text and images.
An Android phone, Google Nexus One, was tied to an L-square ruler that is perpendicular
87

Figure 5-6: The results of the reliability experiment. The total number of trials for eachsetting is 20.
to the floor. The height of the camera, which was measured from the surface of the laptop
keyboard to the center of the camera lens, was fixed at 19 cm while the pitch angle was 0◦ or
20◦, and 14.5 cm while the pitch angle was −20◦ or 40◦. These height settings allowed the
camera to focus around the same target on the screen, namely the name of the restaurant.
We set the phone in front of the screen with a distance of 5 to 50 cm, as measured from the
screen shaft to the camera lens. Finally, for each pitch angle, we took five pictures for every
5 cm between 5 cm and 50 cm, which resulted in a total of 200 pictures. This experiment
was conducted in an office with ceiling fluorescent lights.
We used the algorithm mentioned before to match each picture against the screen dis-
played on the laptop. If the center of the matched region overlapped the expected region
on the screen, it was considered as a successful match.
The results of this experiment are summarized in Figure 5-6. The chart shows the num-
ber of successful matches for each adjusted distance to the screen, instead of the distance
measured to the screen shaft. Because the screen was tilted, we adjust the distance to the
shaft by adding h tan θ, where h is the height of the phone and θ is the pitch angle. With
88

Figure 5-7: The regions the camera sees with a distance 5 to 50 cm away from the screenwhile the monitor is parallel to the phone.
this adjustment, we only show the results between 15 cm and 40 cm where all the settings
have valid measurements.
The experiment showed that the matching algorithm was highly robust with a 97%
success rate, when the camera was parallel to the monitor and the distance between them
ranged between 10 and 40 cm. This range is sufficient to cover everything from a small
region, such as a restaurant’s name, to the entire screen (see Figure 5-7). Even when the
camera was tilted, taking pictures in the range of 20 to 30 cm was still robust (96.7%
success). The accuracy significantly decreased when the camera is too close to (< 10 cm)
or too far (> 40 cm) from the screen, but these conditions are uncommon as users can seek
the appropriate size of the target through the camera. The results of this experiment showed
that using a camera with our algorithm was robust enough to locate a region on a monitor.
89
5.8 Conclusion and Future Work
We conclude by discussing the limitation of Deep Shot and possible extensions for future
work.
Multiple users: Our current system finds possible target devices from a list of the
user’s online devices. It is easy to add other users’ devices into the user’s “friend list,” so
that they can be notified when a capture event happens. However, this would add extra
effort of managing the device list. A possible solution is to replace the XMPP layer with a
local service discovery protocol, such as Apple Bonjour, and broadcast the request to local
devices.
Transmitting visual features instead of pictures: In the current implementation, we
send pictures directly in a request, which raise privacy concerns since the devices that re-
ceive the request can “see” the pictures, especially for a multiple-user environment. There-
fore, a possible solution is to extract the visual features directly on the capturing device
and only send the feature vectors in a request. This could dramatically speed up the perfor-
mance and also prevent malicious request sniffers. In addition, this could enable real-time
matching feedback on the target screen, so users can be confident that the matching is
successful and also know which region of the screen will be captured.
Limitation on feature matching: Feature matching may not work in some scenarios.
For example, nothing can be extracted and matched if a user intends to capture a blank
region. However, we can assume that no valuable information exist in this area and sim-
ply show the photo she took back to her. A more common problem is unfocused photos,
although this could be solved with the real-time matching feedback we mentioned above.
This chapter presented two novel interaction techniques, deep shooting and deep post-
ing, to migrate a task across devices and a robust and extensible framework to support
them called Deep Shot. We demonstrated that Deep Shot is reliable and feasible to support
a range of everyday tasks migrating across devices using one simple gesture.
90

Chapter 6
PAX
Pixels are the most common characteristic and the ultimate elements produced by every
application with a graphical user interface (GUI). However, pixel-level interpretation for
GUI automation, testing, and customization have room for improvement in terms of speed
and accuracy. For example, Sikuli Script (described in Chapter ?? is not very fast, because
it searches the screenshots of GUI elements across the whole screen and does not know
how to narrow down the search space. Furthermore, it is hard to detect and extract the
text content from pixel data. Current Optical Character Recognition (OCR) algorithms
are designed for scanned documents, which are high-resolution with white background
and simple column-based layouts, but not for on-screen text, which is low-resolution with
colored background and could be randomly placed on the screen. Using current OCR
algorithms on screen text would generate poor results [45, 43]. (See Figure 6-4 for an
example.)
In order to maintain platform independence, current pixel-based systems have inten-
tionally neglected the other information that can be obtained from window managers or
accessibility APIs. Unlike pixels, these extra sources of information are not necessarily
available. For example, accessibility APIs are the standard hooks for exposing the internal
structured metadata of a GUI to third-party assistive programs, such as screen readers, but
to support such APIs requires engineering effort from individual software developers. As
a result, accessibility hooks may be omitted or added later as the software matures. Fortu-
nately, even not all applications, some popular commercial applications and built-in soft-
91
ware on modern operating systems are accessibility-enabled. Hurst et al. reported that 74%
of the widgets in eight popular applications were correctly identified by the accessibility
API [21]. Therefore, why not leverage the accessibility metadata if the target applications
provide them?
This chapter introduces PAX, a hybrid framework combining Pixels and Accessibility
APIs. PAX enhances the capabilities of current pixel-based systems and enables new in-
teractive applications on top of existing interfaces. The key insight is that accessibility and
pixel interpretations complement each other. Thus, both of these sources of information
should be used together if possible.
PAX combines pixels with other information sources provided by GUIs, including ac-
cessibility metadata and low-level rendering data from the window manager, and associates
the pixels with their internal hierarchical and structured attributes. As a result, PAX not
only knows what is visible to the user on the screen but also understands the content and
structures behind the pixels. We use accessibility metadata as a convenient and accurate
source of widgets’ information. If the accessibility metadata is not available, PAX automat-
ically switches to pixel-level interpretation and still returns useful data. Furthermore, we
use pixel-level methods to optimize the accessibility metadata. For instance, when accessi-
bility APIs are not fine-grained enough to return the position of each word in a paragraph of
text, we use a pixel-based segmentation algorithm, along with the known text for the whole
paragraph obtained from the accessibility API, to locate the words with high precision.
The potential impact of PAX lies in its ability to improve existing pixel-based systems
and to enable implementation of novel interaction techniques on top of existing interfaces.
We validate this claim with concrete examples: the enhancement of pixel-based GUI au-
tomation (i.e., Sikuli Script [49]) and the implementation of two novel applications: Screen
Search and Screen Copy. Screen Search allows users to conduct text-based search across
multiple applications over the entire desktop rather than being limited to a particular win-
dow. It is applicable to any GUI components with text on the screen (e.g. on a title bar or
in a tooltip of a button), even if it is occluded by other windows. Screen Copy allows users
to copy the text content of a GUI component as well as the component itself. Users can
paste the copied text into a text editor or reuse the copied component in a GUI designer
92
application. The tool can be applied even when the text is not selectable or when the source
code of the GUI is not available.
We make the following contributions in this chapter:
• A hybrid framework that demonstrates how pixel analysis and accessibility metadata
can be used together and complement each other.
• A text detection algorithm that finds text in screenshots, even with colorful back-
grounds.
• A text segmentation algorithm that segments an image of a paragraph of text into
individual word images, given known text from the accessibility metadata.
• Validation of the framework in two novel applications and one enhancement of an
existing system.
6.1 Pixel Analysis Versus Accessibility API
In this section, we describe the advantages and disadvantages of pixel-based methods and
how we can use accessibility APIs to enhance the capabilities and performance of those
methods.
6.1.1 Pixel Analysis
Pixels are the most common output medium of current computing devices. Every GUI
application is eventually rendered as pixels on a screen. Unlike the pixels perceived from
the real world and generated by a digital camera, the pixels generated by a computer itself
have no noise, no distortion, and no other source of interference. Thus, early systems were
able to use naïve bitmap matching to find targets on a screen [34, 51]. Furthermore, Prefab
has demonstrated that a UI model can be built from pixels in real-time so that researchers
can build new interaction techniques on top of existing interfaces [14, 15].
In contrast to understanding the UI model behind pixels, Sikuli Script takes a different
approach to automate existing interfaces. In order to let users use loosely-bounded screen-
93

shots of automation targets, Sikuli uses template matching to fuzzily find the screenshots
on the whole screen.
While they hold promise, the effectiveness of pixel-based methods can be challenged
by four factors:
• Visibility constraints. Invisible information, such as the items out of the current
scrolling area or even the targets that are occluded by other windows, cannot be
detected by pixel-based methods.
• Visual variations. The accuracy of pixel analysis depends heavily on the look of
target interfaces. If the user makes dramatic changes to the color scheme or the
application theme, neither Prefab’s trained prototypes nor Sikuli Script’s fuzzy tem-
plate matching screenshots can deal with the visual variations that result from such
changes.
• Exhaustive screen search. Pixel analysis is a potentially expensive operation, espe-
cially in high-resolution and multiple monitor environments with many millions of
pixels. However, existing pixel-based methods such as Sikuli and Prefab often need
to consider every pixel on the screen indiscriminately in order to locate certain tar-
gets, unless there is an external mechanism to direct their attention to specific regions
on the screen.
• Low-resolution text. The text content of an interface is hard to extract purely from
pixels. Existing OCR engines are designed for high-resolution (150 to 300 DPI)
scanned documents with white background and simple column-based layouts, but not
for low-resolution screens (72 or 96 DPI) with colorful backgrounds and arbitrary
layout. (See Figure 6-1 for examples of low-resolution text.) Simply plugging an
existing OCR engine into a pixel-based system does not immediately work.
6.1.2 Accessibility API
Accessibility APIs are the standard interfaces built in modern desktop operating systems for
assistive applications, such as screen readers, to access the low-level information of a user
94
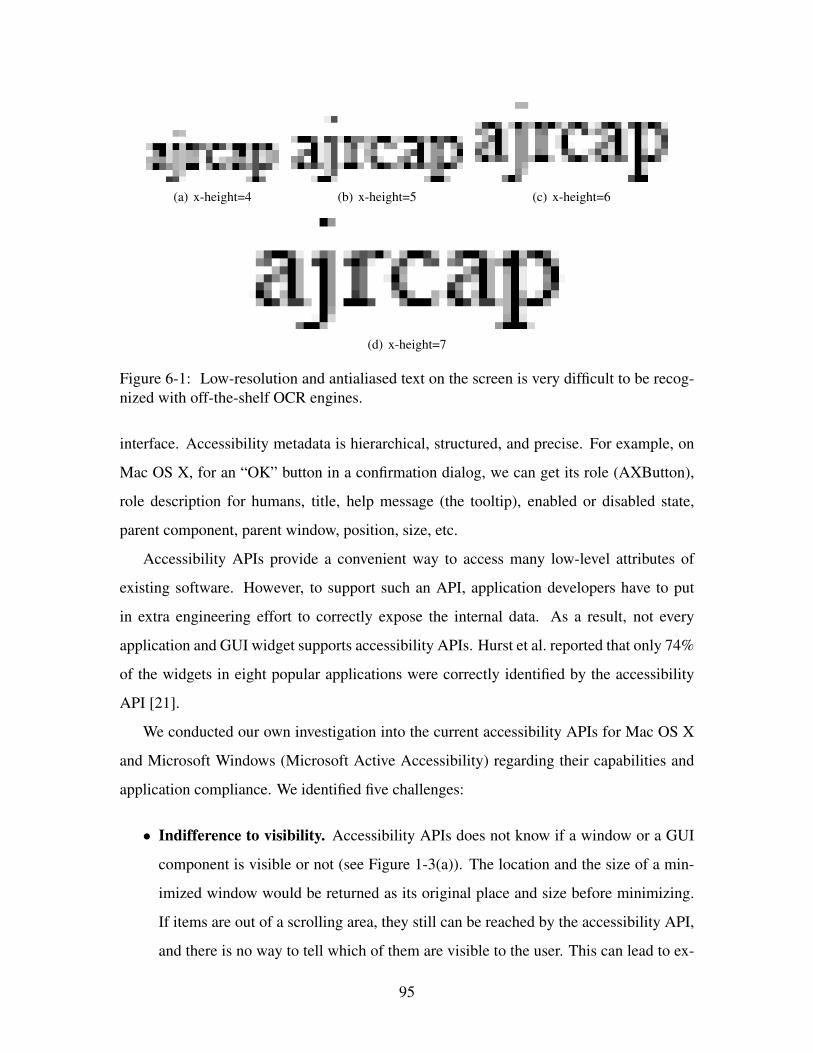
(a) x-height=4 (b) x-height=5 (c) x-height=6
(d) x-height=7
Figure 6-1: Low-resolution and antialiased text on the screen is very difficult to be recog-nized with off-the-shelf OCR engines.
interface. Accessibility metadata is hierarchical, structured, and precise. For example, on
Mac OS X, for an “OK” button in a confirmation dialog, we can get its role (AXButton),
role description for humans, title, help message (the tooltip), enabled or disabled state,
parent component, parent window, position, size, etc.
Accessibility APIs provide a convenient way to access many low-level attributes of
existing software. However, to support such an API, application developers have to put
in extra engineering effort to correctly expose the internal data. As a result, not every
application and GUI widget supports accessibility APIs. Hurst et al. reported that only 74%
of the widgets in eight popular applications were correctly identified by the accessibility
API [21].
We conducted our own investigation into the current accessibility APIs for Mac OS X
and Microsoft Windows (Microsoft Active Accessibility) regarding their capabilities and
application compliance. We identified five challenges:
• Indifference to visibility. Accessibility APIs does not know if a window or a GUI
component is visible or not (see Figure 1-3(a)). The location and the size of a min-
imized window would be returned as its original place and size before minimizing.
If items are out of a scrolling area, they still can be reached by the accessibility API,
and there is no way to tell which of them are visible to the user. This can lead to ex-
95

cessive and incorrect information when the developer just wants information about
those the visible objects.
• Point-based object access. Accessibility APIs support hit testing to gain access to
an interface object shown on the screen. However, this ability is point-based and is
limited to a single object. In many scenarios, such as in Deep Shot and Sikuli Script,
the user could select an arbitrary region on the screen, which consists of multiple
objects within that region. Therefore, we need a mechanism to allow accessing a
group of objects in a given region.
• Incomplete support. Even applications that support accessibility APIs may not do
so completely, as confirmed in the study of Hurst et al. [21]. An application may
include new or complicated widgets that do not provide any accessibility metadata
because they are not in the standard widget set.
• Coarse granularity. The granularity of accessibility metadata may not fulfill the
developer’s needs. For example, the text content of a document may be returned
as a block of text, where a novel interface technique may need the location of each
individual word.
• Inconsistent text. The text shown on an interface is not necessary consistent with the
accessibility metadata, as it can be reformatted in an unknown way. For example, a
date in accessibility metadata is “Friday, April 15, 2011 10:48:27 PM ET” but could
be displayed as “Today, 10:48PM” on the screen.
Recognizing the respective strengths and weaknesses of pixels and accessibility APIs,
we believe it would be ideal to combine them in a complementary manner, offering both
generality from pixels and precision from accessibility metadata at the same time.
6.2 PAX: A Hybrid Framework
We propose PAX, a Pixel+Accessibility hybrid framework that associates the high-level
visual representation of GUI widgets with their low-level structured and hierarchical infor-
96

Figure 6-2: The tree of PAX UI elements. The yellow nodes, created using accessibilityand window manager information. The red nodes are the elements exposed using accessi-bility APIs, while the green ones are reverse engineered from pixels.
mation. PAX has three sources of input: pixels, accessibility APIs, and window managers.
PAX consolidates the information from these three sources into a new API that allows de-
velopers to easily access not only the pixels of the GUI widgets on the screen but also their
internal information.
PAX associates the pixel representation of each GUI element on the screen with its
underlying attributes, such as its role (which could be a button, a text field, etc.) and its
text content or value. The underlying attributes are retrieved from the accessibility API if
available. If not, PAX attempts to infer the role of the element from its pixel representation
using template matching and uses pixel-based algorithms to detect and recognize the text
(see Figure 6-2).
PAX can improve the effectiveness of existing systems that are based purely on ac-
cessibility APIs or on pixels. On the one hand, systems based on accessibility APIs can
benefit from the knowledge of the GUI’s apparent visual representation to resolve certain
97

ambiguities. On the other hand, pixel-based systems can use PAX to improve speed and
accuracy. For example, PAX enables identification of a particular UI element using an
XPath. Sikuli Script can store the XPath to a target UI component when taking the screen
shot of it along with the screen shot image (e.g. in the header of the PNG file) and later use
that path to locate the component without running template matching on the whole screen,
or to constrain the search in a smaller region. Furthermore, PAX enables Sikuli Script
to accept simple commands, e.g. find( ).value(), to
easily retrieve the value of a slider without calculating the position of the thumb to infer it.
6.2.1 Designing PAX
There are three design goals for PAX:
1. The framework should enable existing pixel-based systems to easily access internal
widget information given a region or a point on the screen.
2. The framework should simplify the difficulty and complexity in implementing novel
interaction techniques on existing interfaces.
3. The framework should automatically give the most accurate results from available
resources (either from accessibility metadata or pixel reverse engineering).
PAX maintains a tree of UIElement objects shown on the screen. The root of this tree
is a virtual node, which does not represent any physical GUI elements. The root returns
all running applications as its children and can be obtained by calling a global function
getUIElementRoot(). Each application is also a UI element, which returns its opened
windows. Each window recursively contains the same hierarchical structure of its title bar,
tool bar, and all the other UI elements.
PAX distinguishes three different visibility levels for a UI element:
• Visible. This element can be fully seen on the screen, or partially seen because of
parts of it are scrolled out.
98

• Virtually visible. This element is meant to be visible on the screen but is partially or
entirely occluded by other windows in front of it because of limited screen space; if
the screen was infinitely large and no windows needed to overlap, this element would
be completely visible.
• Invisible. This element is not meant to be seen by users because it is scrolled out of
view, in a minimized window, or hidden by design.
Therefore, each UI element has three different methods to get its children according
to their visibility: getVisibleChildren(), getVirtuallyVisibleChildren(), getChildren(), where
they return the visible children, virtually visible children, and all children, respectively.
Because a UI element may be partially invisible, PAX also provides two methods, getVisi-
bleBounds(), which returns the bounds of the visible part of a UI element, and getBounds(),
which returns the original bounds.
Like accessibility APIs, PAX provides getRole(), getText(), and getValue(), for getting
the role, the text, and the value of a UI element, respectively. A role represents the type
of a component, e.g. a button or a list item. Text can be the label or the string value of a
component, such as a text label or text field. A value is a number that is only meaningful for
some components, e.g. a slider or a check box. These values are retrieved from accessibility
APIs if they are available; otherwise pixel reverse engineering techniques are used. Further,
PAX also provides getVisibleText(), which returns the text actually shown to the user.
In addition to the standard accessibility attributes, each UI element has a getScreen-
shot() method for getting the screen shot of the element even it is only virtually visible, and
getXPath(), which returns an XPath to the element, such as /Application[name=“Word”]/Window[1]
/TabGroup[1]/Group[text=“Paragraph”]/MenuButton[text=“Bulleted List”]. The name
attribute in an XPath is only valid for Applications nodes, whereas text and value can be
used in the remaining nodes. Developers can save the path and locate the same element
quickly with a global function locateUIElement(xpath).
To find particular elements, two methods can be used, by screen location or by con-
tent. PAX supports single-point hit testing with getUIElementAtPoint(x, y), which returns
the element at the given point, and getUIElementsInRect(rectangle), which returns all the
99

visible elements in the given rectangle on the screen. To find by content, each UI element
has the three methods findChildren(pattern), findVisibleChildren(pattern) and findVirtual-
lyVisibleChildren(pattern), which return all, visible, and virtually visible children whose
text content matches the given regular expression pattern.
Finally, to better support advanced interaction techniques, each UI element has a method
focus(), which sets the keyboard focus to that element and also brings its parent window to
the front at the same time. This is particularly useful when the developers need to perform
further interaction on a UI element.
6.2.2 Bridging between Accessibility APIs and Pixels
One of this framework’s goals is to automatically give the most accurate results from the
available resources. Therefore, PAX constructs the UI element tree from all running ap-
plications and their corresponding accessibility handles. If an application has exposed all
necessary accessibility hooks, its descendants in the PAX tree are simply copied from the
accessibility tree and wrapped up with a UIElement interface. Sometimes a few widgets or
even the entire application do not support accessibility APIs, and in this case, each of these
widgets or windows looks like a black hole, with only a single node in the accessibility tree
to record its boundaries.
When PAX walks down the accessibility tree and reaches a leaf node, it determines if
there is a need to reverse engineer the pixel contents of the node with three simple rules:
(1) if the node is a text component (e.g. a text label, a text field, or a text area), run our text
segmentation algorithm to breaks the text into word component pieces; (2) if the node’s
role is not a container and not a text component (e.g. it is a check box, a radio button, etc.),
do nothing; (3) otherwise run pixel reverse engineering methods on the node’s screenshot.
The text segmentation algorithm is useful for higher-granularity information about text
components, and will be described later in this section.
With pixel reverse engineering methods, such as Prefab, we still can provide similar
information to the accessibility metadata even if we reach a dead end in the accessibility
tree. In our current prototype, we did not attempt to completely build the hierarchy of UI
100
widgets from pixels using Prefab’s method, but we used Sikuli’s template matching to find a
small set of GUI widgets (e.g. radio buttons, check boxes, sliders) instead. Furthermore, we
developed a new algorithm for locating arbitrary text content in a complicated component,
e.g. a web view.
A PAX tree is lazily generated on demand. Once parts of it are generated, the results
are cached for fast response. The developer can explicitly request the cache to be updated.
With proper event hooks that monitor the updates of the corresponding UI, the cache can be
updated automatically after the UI is changed. For the reverse-engineered components, the
tree can be automatically updated by comparing the consecutive screen shots. Comparing
two 1680x1050 screenshots takes only 30ms on a modern PC; therefore, it is feasible to
use this technique to continuously monitor the changes of a UI.
In the last parts of this section, we discuss how we have dealt with the challenges
mentioned above as well as the text segmentation and detection algorithms.
6.2.3 Determining the Visibility of UI Elements
With only accessibility APIs, we cannot tell if a window or a component is visible or not.
To address this problem, our solution is to request the z-order of each window from the
window manager, and create “masks” to cover the occupied areas of each window from top
to bottom. Thus, if a component is not fully covered by the masks and also intersects with
its parent’s visible bounds, it is visible from the user’s point of view.
For virtually visible elements, we only care if a UI element intersects with its parent’s
bounds. If so, it is virtually visible; otherwise it is invisible.
6.2.4 Region-based Hit Testing
Accessibility APIs usually support hit testing, which is used for getting the accessibility
information on a particular point on the screen. Unfortunately, this feature is limited to a
single point and a single object.
To get multiple elements in a region, a naïve method is to run the single-point hit testing
on each point in that region. However, this is inefficient because a region could have
101

millions of points. Another method is to traverse the component tree and find all visible
elements that intersect with the given region. But this is not possible with pure accessibility
APIs, because they do not know if a component is visible or not.
Fortunately, PAX already has precise information about the visibility of each UI el-
ement. Therefore, PAX provides a function that enables developers to get the internal
information of multiple objects in a given region on the screen.
6.2.5 Text Detection and Extraction From Pixels
Current pixel reverse engineering techniques, such as Prefab, can locate common GUI wid-
gets and extract their textual content. However, Prefab’s method requires text be located
over predictable backgrounds that Prefab can model based on provided examples. If the
text is on a background for which Prefab has not been trained, or a complicated back-
ground that Prefab cannot model (e.g., a photographic wallpaper), it will not find the text.
Recently, computer vision researchers have conducted research on segmentation and recog-
nition methods for small screen-rendered text and reported accuracy achieved of 99.2346%
[45, 43, 44]. However, they assumed the position of the text is known and did not address
the problem of text detection. To complement these pixel reverse engineering techniques,
we have developed a text detection algorithm that locates text in arbitrary position in a
screen image.
Given a screen image, the algorithm for converting it to words has three major steps:
(A1) segment the image into disjoint blobs of pixels, (A2) merge character blobs into word
blobs, and finally apply OCR to extract words.
A1. Salient Component Detection
The goal of this step is to decompose a screen image into a set of salient components, each
of which is composed of a blob of foreground pixels. Given a screen image as input, we
first convert the image from color to grayscale. We apply an adaptive threshold to filter out
low-contrast pixels. Figure 6-3-2 gives an example of the image after this process. Many
container widgets such as panels have large areas of plain background pixels that can be
102

Figure 6-3: Text Detection process. (1) Given an image, (2) foreground pixels are extractedas small blobs. (3) Blobs are connected to form larger blobs, (4) which are classified intotext (red), icon (green), or photo blobs (blue).
easily filtered out in this way. From the high-contrast foreground pixels that are left, we
detect long lines that might be window borders or grouping cues. These long lines are then
removed so that components close to those lines would not be mistakenly interpreted as
being connected by the lines. After this process, text elements turn into a set of blobs, each
of which correspond to a character, whereas image elements turn into a set of disjoint parts.
A2. Text Extraction
Next, we merge blobs of individual characters into larger blobs of words and use OCR to
extract text from each word blob. To merge blobs, we apply a dilation operator to expand
the extent of each blob horizontally. If a blob is a character, horizontal dilation will connect
it with the characters before and after, as long as the amount of dilation exceeds the amount
of character spacing. This spacing depends on the font size, which can be estimated from
the height of the blob. Figure 6-3-3 shows the output of this merging process. Then, given a
string of connected blobs, we check two properties to decide whether it is likely to be text.
First, we check if these blobs share a common height and baseline. Next, we check if the
103
color variation among the foreground pixels is low, since GUI text tends to be rendered in
a single, solid color to improve readability. Blobs satisfying both conditions are considered
to be text blobs (red pixels in Figure 6-3-4) and passed to the OCR engine to extract words
from them.
We did not implement Wachenfeld’s screen text recognition algorithms [45, 43, 44],
but used the Tesseract OCR engine (http://code.google.com/p/tesseract-ocr/) in our current
prototype instead. If it were given the whole screen image as input, the Tesseract OCR
engine would perform poorly because it assumes the text is in a single column. (Figure 6-
4) If we segment screen images into blocks of words that are processed individually by the
OCR engine, the overall performance is better.
6.2.6 Text Image Segmentation Given the Text
The minimum granularity returned by accessibility APIs is one UI component. This may
be not enough if developers need the location and the bounds of each individual word or
even each character in a text component. Therefore, we have developed an algorithm that
segments the image of a text component into individual word blobs. Unlike other text
segmentation algorithms, the text string is known from the accessibility API, so we have
additional clues to locate each word more accurately. Furthermore, since this algorithm
runs on the leaf nodes in accessibility trees, we can assume the text is on a GUI widget with
a simple or gradient background for the sake of readability. If the text has a complicated
background, our algorithm would not work.
Given that the text is already known (except for some inconsistent cases, e.g. reformat-
ted dates), this problem is not as hard as the original text segmentation problem in OCR.
We describe this algorithm in two steps: (B1) segment images into N blobs, where N is the
number of words in the given text; (B2) sort and match each blob to its corresponding word
in the text.
104
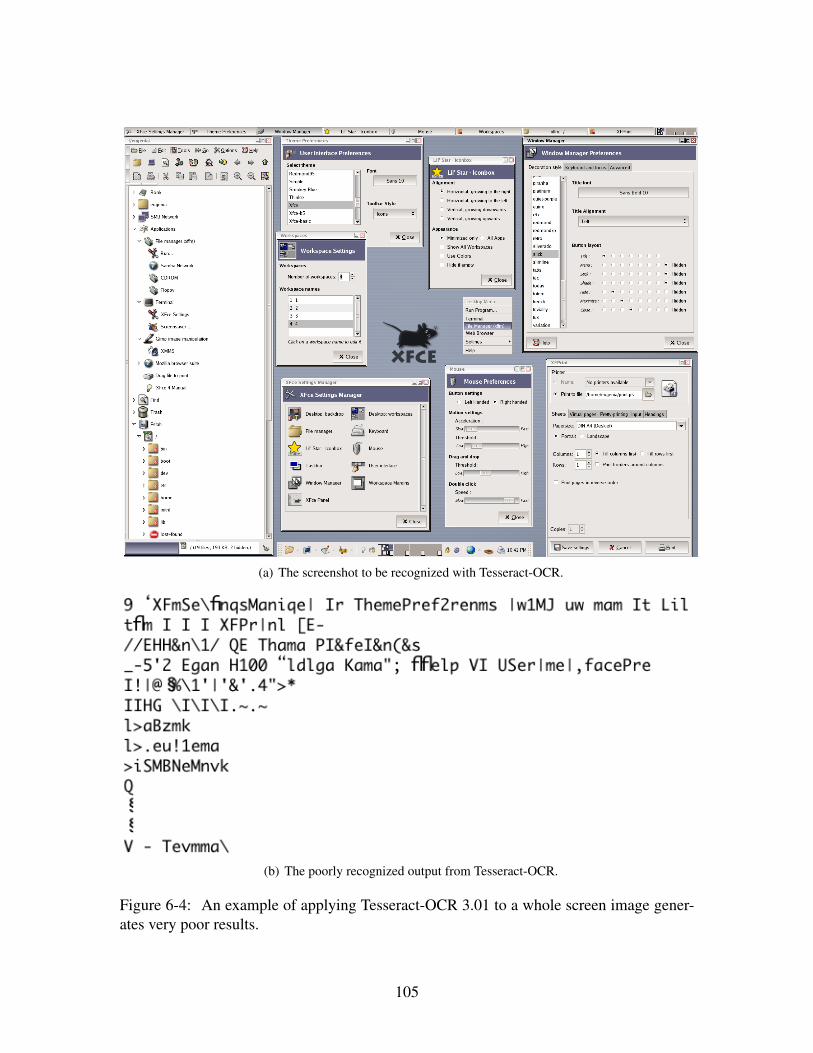
(a) The screenshot to be recognized with Tesseract-OCR.
(b) The poorly recognized output from Tesseract-OCR.
Figure 6-4: An example of applying Tesseract-OCR 3.01 to a whole screen image gener-ates very poor results.
105
B1. Text Segmentation
By assuming the background of the text is a solid or gradient color, we look for a vertical
or horizontal line for which each pixel is the same color, in a descendent or an ascendant
order in the given region. Once we have found such a line, we create a background by
repeating this line to fill the size of the image, and then subtract the original image with
this background to get an image with pure text pixels.
We use a top-down approach that is modified from recursive X-Y cut [17] to break a
text image into word blobs. We assume the text could be split into multiple lines, but no
single word is broken with hyphens. The idea of this algorithm is to calculate the sum of
the pixels in each horizontal and vertical line to produce a density graph of white space.
This graph shows several peaks that define horizontal or vertical gaps between lines or
words, which are also the cut points we need to segment the image into smaller pieces. Our
algorithm finds the largest gap, defined by its number of pixels, in the image, and cuts the
image horizontally or vertically until the number of pieces remaining equals the number of
expected words.
B2. Matching each word with a blob
After the first step, we have N small blobs, each of which corresponds to a word. Next, we
sort these blobs vertically and group them into lines with similar baselines. Blobs in a line
group are then sorted horizontally to match the writing order of western text.
6.2.7 Matching Accessibility Metadata with What Users See
The getVisibleText() method of a UIElement should return the text that users see on the
screen. One goal of PAX is to deliver the most accurate results. Therefore, we should use
the text from the accessibility API if possible. However, the text shown on the screen is not
necessary consistent with the one returned by the accessibility API.
A common example is automatic truncation when a string is too long. For example,
“my doctoral thesis revision 3.txt” may appear on the screen as “ my doctoral thesis . . . ion
3.txt”. Another example is time and date formation. For instance, “Friday, April 15, 2011
106
10:48:27 PM ET” could be shown as “Today, 10:48PM” on the screen.
To address this inconsistency, we compare the text from the accessibility API and the
text from OCR. If the edit distance between these two strings is smaller than a threshold
(20% in PAX, which is proportional to the length of the OCR string), we infer that no
inconsistency exists and return the accessibility string as the visible text. Otherwise, when
the strings are inconsistent, the OCR text is returned. Note the developer needs to be aware
that OCR text could be noisy due to OCR errors. In some cases, the developer does not
necessarily need the visible text, which is why we provide getVisibleText() and getText() for
developers to choose according to their scenario.
6.3 Evaluation of Text Algorithms
In this section, we describe the evaluation of our text detection and segmentation algorithms
in PAX.
6.3.1 Text Detection Algorithm
To test the performance of our text detection algorithm, we constructed a dataset that con-
sists of six high-resolution screenshots downloaded from the Internet. This dataset covers
a variety of GUI widgets and text content on three major platforms (Mac OSX, Ubuntu
Linux, and Windows 7). Each word in the screenshots was located and labeled manually
as ground truth. The total number of visible words in this dataset is 1141. The number
of visible windows is 16. This dataset was held back while we were developing the text
detection algorithm; we used screenshots of our own computers for training purposes and
preserved this collection only for testing.
During testing, we manually cropped the images of the 16 windows (since window
bounds are available in PAX) and applied our text detection algorithm to each image. Our
algorithm made 1236 detections. We compared the results to the ground truth and found our
algorithm was able to achieve a precision of 84.39% (1043/1236) and a recall of 91.41%
(1043/1141). The most common errors were isolated digits that were too small and were
107

Figure 6-5: An example from the text detection experiment. Red labels are false detec-tion, and the dark blue one is missed. All the other labels are correctly detected, but notnecessarily correctly recognized.
repeatedly mistaken by the algorithm as noise for 32 times (2.81%). An example of the
testing results can be see in Figure 6-5.
6.3.2 Text Segmentation Algorithm
To evaluate the performance of our text segmentation algorithm, we built a dataset of 331
images each of which is a tightly bound block of text. This dataset was split into training
and test sets to prevent overfitting when developing the algorithm. The former has 546
words in 57 images and the latter has 2046 words in 274 images. Each image block has at
least two words. These images were collected from our own Mac computers and covered
108

(a) An example of correct segmentation.
(b) An example of incorrect segmentation.
Figure 6-6: Two examples show correct and incorrect segmentation results. The failurein this example is caused by the width betwee the two 1’s in 2011 is larger than the onebetwee "–" and "Updated".
popular desktop applications and web sites (e.g., Microsoft Word, twitter.com, cnn.com).
We applied the text segmentation algorithm to each image and manually verified the results.
We found only 30 words out of 2046 words were incorrectly segmented, which represents
an accuracy of 98.55%. Examples of correct and incorrect segmentations can be seen in
Figure 6-6.
6.4 Validation Through Example Applications
To validate the usefulness of PAX, we present three novel applications enabled by PAX:
enhanced Sikuli Script, Screen Search and Screen Copy.
6.4.1 Sikuli Script
Since Sikuli Script was deployed in early 2010, the discussions on its user forum suggest
some difficulties of using Sikuli in practice. First, full-screen matching leads to ambiguity
and slow performance. Users need an efficient way to constrain the search space to a
certain application. Second, screen matching fails if the target window is occluded by other
windows. It would be better if the matching worked even when the target window is only
virtually visible. Finally, users need a reliable method to read the text from applications
and can accept poor OCR results as better than nothing.
To demonstrate the validity of PAX, we enhanced Sikuli Script by addressing the above
issues using the system. First, we added a new App class, which manages the information
about an application and its window. App provides methods to open, close, and switch
109

Figure 6-7: As the cursor moves, the boundaries of the target can be identified automati-cally in Sikuli Script. After the user clicks to capture a screenshot, the XPath to this targetis also stored with the screenshot image for future use.
focus to a certain application by giving its name or a disk path. Once an application has
opened, the corresponding App instance saves a reference to the UIElement of that appli-
cation. Thus, a user may call app.window(n) to get the nth window as a Sikuli region and
then all subsequent pixel computation can be constrained to this region for improved ef-
ficiency. This App class uses applications’ accessibility information provided by PAX to
enable Sikuli Script to constrain the matching area within an application window dynami-
cally instead of using a fixed region on the screen, and also addresses the performance and
ambiguity problem.
Second, we enhanced Sikuli’s screen capture interface and searching algorithm with
PAX. In the screen capture interface, we use PAX’s hit testing to automatically identify the
target’s boundaries as the mouse cursor moves (see Figure 6-7). A user can simply click on
a target to take its screenshot, or use the original method of dragging out a rectangle around
the target. When a screenshot is taken, the XPath to the target’s UIElement is also saved
along with the screenshot (as metadata of the PNG file). Later, when the script is executed,
Sikuli Script attempts to find the target with its XPath using PAX first, and then uses the
original template matching method if the XPath fails or is unavailable.
Unlike the first enhancement that requires explicit use, this implicitly speeds up the
time spent searching for a target and removes the ambiguity. If the complete XPath is not
available, because the target widget does not support accessibility APIs, the enhancement
still helps because we can at least know which application the target belongs to and con-
strain the search within the region of that application. This enhancement also addresses the
second issue to allow Sikuli to search virtually visible windows, whose screen content can
be seen from PAX even when they are overlapped by others.
110
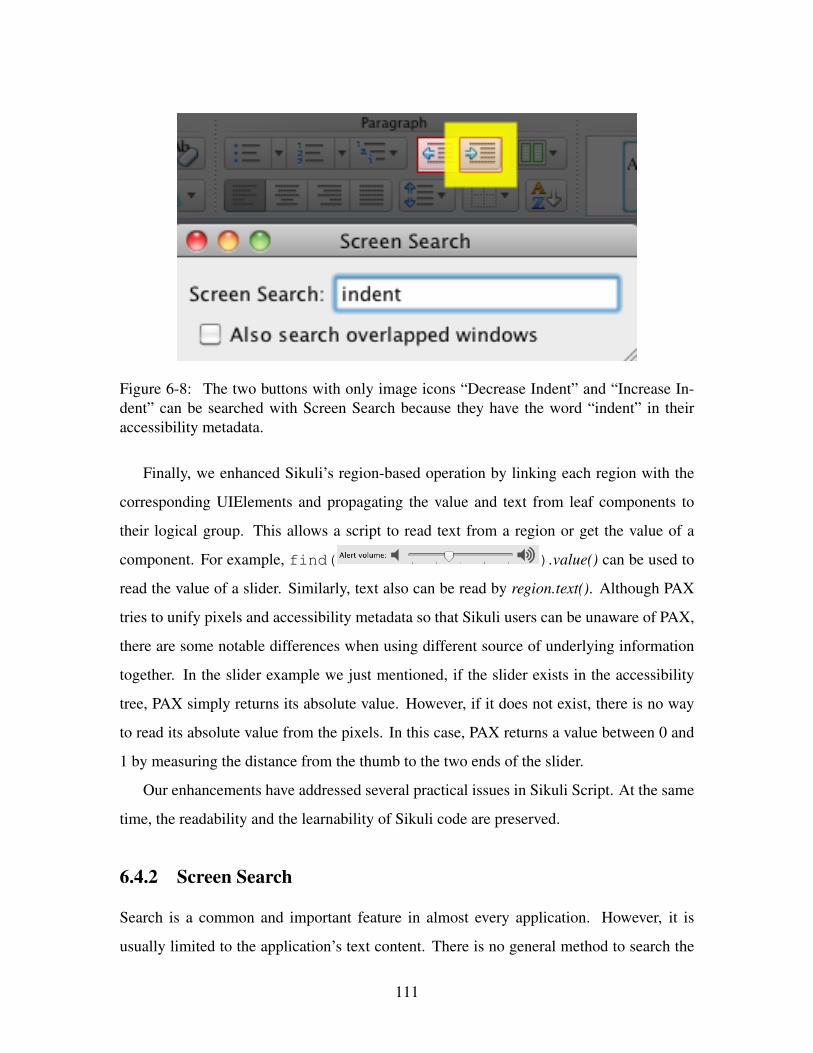
Figure 6-8: The two buttons with only image icons “Decrease Indent” and “Increase In-dent” can be searched with Screen Search because they have the word “indent” in theiraccessibility metadata.
Finally, we enhanced Sikuli’s region-based operation by linking each region with the
corresponding UIElements and propagating the value and text from leaf components to
their logical group. This allows a script to read text from a region or get the value of a
component. For example, find( ).value() can be used to
read the value of a slider. Similarly, text also can be read by region.text(). Although PAX
tries to unify pixels and accessibility metadata so that Sikuli users can be unaware of PAX,
there are some notable differences when using different source of underlying information
together. In the slider example we just mentioned, if the slider exists in the accessibility
tree, PAX simply returns its absolute value. However, if it does not exist, there is no way
to read its absolute value from the pixels. In this case, PAX returns a value between 0 and
1 by measuring the distance from the thumb to the two ends of the slider.
Our enhancements have addressed several practical issues in Sikuli Script. At the same
time, the readability and the learnability of Sikuli code are preserved.
6.4.2 Screen Search
Search is a common and important feature in almost every application. However, it is
usually limited to the application’s text content. There is no general method to search the
111
GUI components in a user interface. For example, the text in a text field or in a text area
is searchable, but the buttons on a toolbar or the text label on a check box are not. As GUI
applications become large and complicated, searching GUI components is especially useful
for the users who are not familiar with an interface. For instance, toolbars are widely used
in many applications, but the image icons on them are not necessarily easy to understand.
In these cases, a user must move the mouse cursor to hover over each button and wait for the
tooltip to learn its meaning. The ability to search components by their label or description
would be a solution for this problem.
We have created Screen Search as a sample application to demonstrate how PAX can
support building new interaction techniques on existing user interfaces. Screen Search en-
ables a user to search not only text but also all GUI components on the screen by keywords.
Unlike the usual search bound to a single application, Screen Search is a global function
that searches the content and UI of multiple applications at the same time. Furthermore, it
allows a user to quickly navigate or switch the keyboard focus to any components found
by Screen Search. In other words, this feature enables the use of a keyboard to navigate a
user interface in an arbitrary order. For example, a user can search for “indent” to locate
the “Increase Indent” and the “Decrease Indent” buttons on a toolbar, and hit the Enter key
to select the highlighted one (Figure 6-8).
Screen Search has two modes: searching only the visible objects (the ones that can be
seen on the screen), or virtually visible objects (the ones can be seen or are just objects in
the first mode are visible on the screen, we simply highlight them using a yellow box. In
the second mode, matched objects are not necessarily visible, so we cannot just draw a box
at each position. Instead, we draw a thumbnail of each window that has matched objects
in a row and a big preview window with the current selected object. The user can press the
Tab key to switch the focus among all matched objects and also bring their parent window
to the preview position.
With PAX, the implementation of Screen Search is straightforward because PAX has
decided the best source for obtaining the metadata of a component. A naïve implementation
is calling findVisibleChildren or findVirtuallyVisibleChildren of the root of the UIElement
tree, depending on the search mode, to retrieve the matched components in each window.
112

Figure 6-9: Screen Search finds the given keyword in multiple applications and shows thematched components and their windows at the same time.
However, to support incremental search, we traverse all nodes in the UIElement tree and
build an index of the text in each node in a background thread periodically. This requires
more complexity but provides a better interface that suggests how many and which objects
are matched as a user types.
6.4.3 Screen Copy
Screen Copy is a novel application we have built using PAX. Screen Copy allows a user
to select a rectangular area on the screen and copies not only the text but also the GUI
widgets within that area into the system clipboard. Figure 6-11 shows an example where
the interface for setting the appearance on Mac OS X can be copied and pasted into a
WYSIWYG HTML editor.
Screen Copy does not simply copy GUI widgets independently, but preserves the hier-
archy of widgets and their logical grouping. In the example shown in Figure 6-11, the two
sets of radio buttons are correctly grouped together. Thus, only one button in each group
can be selected at a time.
Screen Copy is useful for copying an existing interface without its source code and
113
converting it into another format of representation. For example, we could train a library
of Flex/Flash widgets using template matching or methods based on machine learning such
as Prefab, and then use Screen Copy to convert a Flex/Flash interface to HTML.
Screen Copy also provides a rectangular selection model to existing programs that only
have the common text selection implementation. For example, in a web browser, it is very
hard to select and copy any non-text objects, such as a table or a form with pictures. The
selection is constrained by the flow of text and the underlying structure of HTML. Thus,
one can not easily select only one column of a table or two objects across their different
containers. However, these can be achieved with the rectangular selection model provided
by Screen Copy (see Figure 6-10).
Screen Copy is straightforward to implement with PAX. Using PAX’s rectangular hit
testing, the corresponding UIElements within the selected area can be retrieved easily. With
the selected objects, Screen Copy transforms each UIElement to HTML tags according to
its role and content. Finally, the HTML is copied into the system clipboard and a proper
MIME type of the data is set so other applications can then convert it into their own format.
Screen Copy only copies the static interface of an application. It does not copy the
dynamic behavior or animated effect on the interface. Additionally, some items that require
more interactions to see (such as a drop-down box or a context menu) cannot be copied, so
the drop-down boxes in Figure 6-10 were populated with only the one item that was visible
at that time. Currently, as a tool implemented to demonstrate PAX, it does not copy widgets
that cannot be represented in standard HTML tags. However, in the future, more complex
transformations can be implemented to support non-standard widgets.
6.5 Conclusion and Future Work
We have described PAX, a hybrid framework that uses pixels and accessibility metadata
to complement each other. We proposed and evaluated two new algorithms for detecting
text on screen and segmenting a text image into word blobs assuming the text is known.
We validated our framework by implementing three applications: improving Sikuli Script,
Screen Search, and Screen Copy. While promising, PAX has several limitations for future
114

Figure 6-10: Screen Copy can be used to select and copy columns of a table or a list view.
Figure 6-11: With Screen Copy, one can copy a Mac OS X user interface and paste it intoa WYSIWYG HTML editor to create an HTML version of the same interface.
115

work:
First, in our prototype system, we used template matching to identify GUI widgets from
pixels as a proof of concept. The modular design of our framework makes it possible to
integrate other powerful pixel reverse engineering methods such as Prefab in the future.
Second, the developers who use PAX need to be aware of the uncertainty due to OCR
errors. As future work, more robust OCR algorithms can be integrated with PAX to mini-
mize this uncertainty.
Third, PAX currently uses the accessibility APIs provided by each OS. However, other
sources of hierarchical UI representation, such as DOM, can also be integrated nicely with
PAX to further improve coverage. For example, on Mac OS X, the built-in browser Safari
has implemented a transformation that converts a DOM to an accessibility tree, making this
integration possible.
Lastly, PAX currently uses the most common set of accessibility metadata for maximum
compatibility on each platform. If more platform-specific metadata and APIs can be used,
this opens the door for a diverse body of research. For example, we can add more actions,
such as push buttons, or open a drop down menu, to each UIElement, so PAX could be
a UI automation framework that automatically uses accessibility APIs or Sikuli Script as
its backend. PAX could also support UI customization that provides set methods on each
UIElement and draw a customized UI on top of the existing one to show different layout or
effects.
116

Chapter 7
Common Pitfalls and Design Principles
The systems built with the screenshot-driven model are discussed in Chapter 3 to 6. As I
described, this model is promising for creating new interaction techniques on any existing
UIs. However, while exploring the design of these systems, we found that many users of
our systems may encounter some common pitfalls caused by the nature of pixel matching
and the screenshot-driven model. As the designers of these screenshot-driven systems, we
also faced many challenges while developing them.
For example, once screenshots in Sikuli scripts are taken, the user who writes the script
would expect it would work every time in the future. However, the look of the user’s
desktop changes very often, e.g., opening a new application creates a new window on top
of some windows and this may occlude targets in the scripts written by the user. Even
scrolling a file list view may stop a script that looks for a specific file icon in that window
from working normally.
In this chapter, I discuss the pitfalls we met and also provide design principles as solu-
tions to future designers of such systems. We figure that system designers could incorporate
these principles into their design of screenshot-based systems to improve the usability of
the systems.
Each design principle is noted with a header as the following, which includes the name
and the executor of the principle. The executor could be system designers or users, which
suggests who should take care of that principle.
117

Design Principle: An Example Executor: system designers or users
7.1 Invisible Targets
A screenshot-driven technique is, by definition, triggered by taking a screenshot of a target
object. Typically, this screenshot is later used as an image pattern to match against the
whole screen to locate the target. However, while matching the pattern, the target may no
longer exist on the screen. That is, it becomes invisible somehow.
The most common reasons that cause this problem are,
• Occlusion, there are other windows, applications, or widgets in front of the target;
• Out-of-view, the target is in a scrolling view and has been scrolling out of the view,
or the target is dragged out of off the screen;
• Hidden or Minimized, the target is hidden or minimized due to its nature of design
(e.g., dropdown items, menu items, or minimized windows).
Occlusion is a very common problem for Sikuli Script and Test. Opening a new window
or bringing a window to the front hide everything behind that window, and therefore cause
this problem.
Out-of-view is another common problem. As screen real estate is limited, scrollable
views can display a component that is large or has dynamic size depending on its content.
Furthermore, the whole screen is also a view in which limits the number of components
displayed. When a target is out of a view, it is invisible to the user as well as to screenshot-
driven systems.
Finally, a target could be hidden or minimized because it is designed to be capable of
these functionality.
We propose two design principles for these two problems.
Design Principle: Dedicated Channel Executor: system designers
118

Sometimes, even a target is occluded by some windows, it is still possible to “see” it
through special dedicated channels. For example, Mac OS X accepts an option
kCGWindowListOptionIncludingWindow in its screen capture API to request the
screenshot of a particular window even it is minimized, occluded, or off-screen. For the
scrolling-off problem, there are some special APIs for capturing the image of the whole
area within a scrolling pane. With those APIs, we can bypass the limitation of the size of
the screen and the scrollable view.
Another way to deal with the occlusion problem is to prevent the occlusion in the first
place using a dedicated channel that shows only the window containing the target. For
example, Virtual Network Computing (VNC), X server, or virtual machines are solutions
for creating such a channel. While using Sikuli Script or Test for test automation, a common
requirement is to test the system under test (SUT) in a controlled environment that no other
windows could cover the SUT. In this case, a dedicated channel such as VNC is a perfect
solution.
Design Principle: Scripting Executor: system designers, users
Scripting is the most general solution requiring no special channels or APIs to the oc-
clusion and the scrolling-off problems. For the occlusion problem, we can script a target
by bringing it to the front or moving it to an empty place. Alternatively, we can script the
windows on top of the target by minimizing or hiding them. For the scrolling-off problem,
we can script the scrolling pane to reveal the hidden areas.
While developing Sikuli IDE, a problem we encountered in the early design phase was
that the IDE covered almost the whole desktop so that the user could not take screenshots
of the windows underneath it. Similarly, while running a script, the IDE also occlude a
large space of the desktop. To deal with this problem, we used this principle to script the
Sikuli IDE itself by minimizing it before taking a screenshot and running a script.
In PAX, we add an App class to Sikuli Script in order to let the users bring a particular
to the front easily. For example, App.focus("Firefox") switches the focus to the
first Firefox window and brings it to the front. With this command, the user can be sure the
119
Firefox window is not occluded by other windows.
7.2 Dynamic Appearance
While matching a screenshot, the target may look different over time. The difference may
appear in the target itself, or in the surrounding pixels. There are many potential causes of
this problem, for example,
• animation, the target itself is an animation and changes its look over time;
• different context, the target may be moved to a different place than the one where
the screenshot of it was taken;
• different skin, the skin or the theme of the GUI toolkit may be changed so that the
target looks different;
• different data, the target may contain GUI components which are populated with
different data;
• different state, the target may contain GUI components whose states are changed,
e.g. being selected or highlighted;
• environment noise, the target may be rendered in an environment with noise, e.g. in
a photo of the screen.
We propose the following design principles to deal with these problems.
Design Principle: Fuzzy Matching Executor: system designers, users
Image matching algorithms play the key role in a screenshot-driven system. As the
appearance of the target or its surrounding may change over time, the matching algorithms
must be robust against the changes to some extent. In Sikuli Script and Test, we used tem-
plate matching with correlation coefficients and set a default threshold 0.7 to allow 30%
120
differences while matching an image pattern. This design allows the user to take screen-
shots in a sloppy manner, and therefore greatly lowers the barrier to script user interfaces
with screenshots. Unlike Sikuli Script and Test, in Deep Shot, we had to use a more sophis-
ticated algorithm SURF as the matching algorithm. The main reason was that we needed to
match a photo taken by a camera, rather than a clear screenshot, against the screen. There-
fore, we needed to be robust against environment noise, rotation and scaling, and SURF
was the best choice given these constraints.
Although system designers can choose the appropriate algorithm for their screenshot-
driven systems, the users may still need to adjust how similar an image pattern can match
by themselves. For example, while writing a Sikuli script, if the user would like to use
a sloppily-cropped PDF icon to match all PDF icons on all kinds of backgrounds, it is
necessary to lower the similarity threshold of the icon pattern. To simplify this process, we
design a preview tool in Sikuli IDE so that the user can adjust the similarity threshold of an
image pattern and preview how well it matches the screen. Similarly, if the user expect the
pattern to match all the PDF icons in different colors, .anyColor() method needs to be
called.
Design Principle: Content Understanding Executor: system designers
Many GUI widgets are designed to present dynamic text or data to users, e.g. text
labels, text fields, drop-down boxes, and menus. These widgets can look very different
when they are populated with different data. In some cases, fuzzy matching still can locate
the desired target if the image pattern contains sufficient “background pixels” that do not
change with data population. However, matching with background pixels could easily
cause false positives.
There are some techniques for understanding the content of GUI widgets so that the
users can focus on what they really want to find or match on the screen. For example, PAX
(Chapter 6) allows a user to locate a GUI widget using the XPath to it in the accessibility
tree. Furthermore, PAX also allows one to search a particular widget according to its
content or text data.
121

Optical Character Recognition (OCR) is another technique that can be used for this
problem. However, traditional OCR algorithms are not designed for detecting and recog-
nizing text on GUIs. In PAX, we introduced a new text detection algorithm for locating
text in screenshots. With this algorithm, we are able to locate the text and then use off-shelf
OCR engines with some image processing techniques to recognize them.
7.3 Ambiguity
GUI widgets are designed to be used repeatedly so people do not have to learn how to use
a user interface from scratch every time. As a result, it is common to see multiple instances
of the same widget on a screen. With screenshot-driven systems, users are often confused
with this ambiguous situation if they only want to match a particular target.
Design Principle: Constraint on Patterns Executor: users
Most ambiguity problems can be resolved by taking a larger screenshot consisting of
more pixels. In particular, the user can include a unique label or object in the screenshot
to reduce ambiguities while matching. For example, Figure 7-1(a) is a pattern that is too
small and can lead to ambiguities while matching against Figure 7-1(c). A better pattern is
Figure 7-1(b), which includes a unique label “Documents.” In addition to reducing ambigu-
ities, including a unique label in image patterns also makes the pattern easier to understand
for the user.
Design Principle: Constraint on Matching Region Executor: system designers and users
Besides adding constraints on image patterns, it is also possible to constrain matching
areas. For example, with the App class we introduced to Sikuli Script, a user can get the
boundaries of a particular window and then limit the image matching within that region. A
screenshot-driven system can even record which application a screenshot is taken and then
match the screenshot only within that application later.
122

(a) Ambiguous pattern (b) A pattern including a unique label
(c) The screen that have many drop-down boxes
Figure 7-1: Including a unique label in image patterns can reduce ambiguities effectively.
Constraining using the App class prevents external ambiguities, which occur outside
of the working application. However, internal ambiguities may still exist. In order to help
users to deal with this problem, we designed spatial operators to constrain the matching
area to a region next to a reference region. For example, in Figure 7-2, there are two sliders
that look exact the same. How do we refer to the particular thumb of the “Alert volume”
slider? With spatial operators, we use the “Alert volume” label as a pointer, and then use
the right operator to constrain the matching area within the region to the right of the label.
The corresponding Sikuli script command is find( ).right().find( ).
Similarly, we can also use above, below, or left to specify the corresponding regions.
7.4 Self-Ambiguity
We have described that ambiguities can be caused by many GUI widgets that look the
same. Sometimes ambiguities may come from the target itself in different states. For
example, when a widget is disabled and grayed out, it may still look very similar to itself
in the normal (enabled) state. With the fuzzy matching algorithms we described earlier,
the algorithms may mistakenly find the disabled one using a pattern in the normal state. In
addition to the enabled/disabled states, focus and selection could also cause this problem.
Design Principle: Exact Matching Executor: users
123
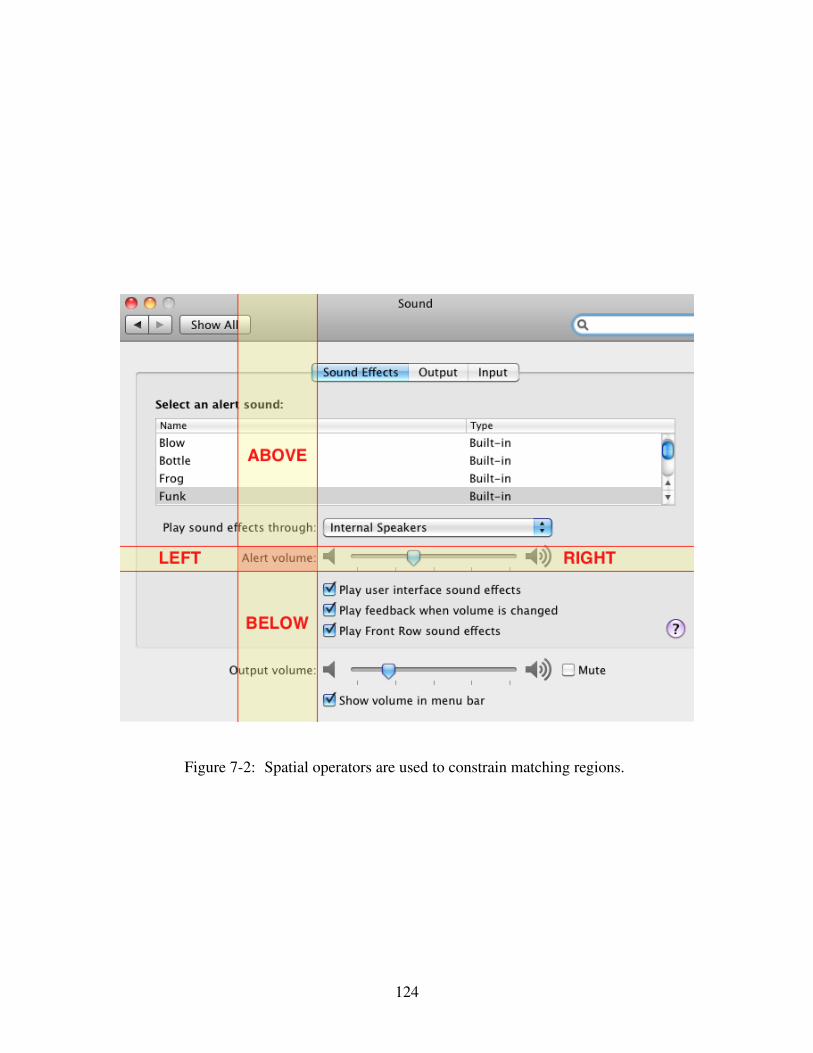
Figure 7-2: Spatial operators are used to constrain matching regions.
124

Fuzzy matching is suitable for most cases in screenshot-driven systems. However, to
match GUI widgets in a particular state, the system should use exact matching algorithms
instead of fuzzy ones. Although a screenshot-driven system can provide both the exact and
the fuzzy matching algorithms, the user is still responsible to tell the system which one to
use depending on his/her intention.
In Sikuli Script and Test, we use fuzzy matching as the default algorithm. At the same
time, we also provide a method .exact() in the Pattern class for the users to specify if
they want the image pattern to be matched in an exact manner. Besides this, the users also
can raise the similiarity threshold of a very high value using the preview dialog in Sikuli
IDE (Figure 3-6) to distinguish between different states of the widget.
7.5 Conclusion
In this chapter, we have discussed four common pitfalls in screenshot-driven systems,
which include invisible targets, dynamic appearance, ambiguity, and self-ambiguity. We
also provided various design principles for system designers and users to overcome these
problems.
125

Chapter 8
Conclusion
In this thesis, I have presented the notion of using screenshots as visual references in user
interface design and the interaction model driven by screenshots. I also described the po-
tential applications, frameworks and algorithms to facilitate the interaction driven by taking
screenshots.
For the applications, I have described how I applied the screenshot-driven model for the
Sikuli project, which includes searching documentation and GUI automation using screen-
shots. Based on Sikuli Script, I described a GUI testing system for GUI developers and QA
testers to verify GUI behavior without writing code. Except for augmenting the interaction
within a computer, I described Deep Shot, which expands the screenshot-driven model to
task migration across multiple devices.
For the frameworks and algorithms, I have described PAX, which is a hybrid framework
that associates the visual representation of user interfaces and their internal hierarchical
metadata. This framework augments the existing pixel-based systems and allow them to
access the pixels as well as the internal structured data of a user interface. To build PAX,
I also described two algorithms: 1) a text detection algorithm that locates text in arbitrary
position in a screen image; 2) a text segmentation algorithm that segments the image of a
text component into individual word blobs given the underlying text string is known.
Finally, we identified common pitfalls in screenshot-driven systems and provided de-
sign principles for system designers or users to deal with them.
There are many promising future directions for further exploration on this topic.
126

Visual Memory
Nothing would ever be forgotten after seeing it once if we have photographic memory,
whether it is an important number, date, image, or phrase. With modern computers and
software technologies, it is possible to record screen pixels continuously and make them
searchable. In Sikuli Search, we have explored searching a collection of documents using
screenshot. We can further extend this notion to search information along the time dimen-
sion. For example, we can search a particular web page or document we have seen by text
or images. We also can search and restore old configuration settings that broke something
accidentally.
Creating Automation Scripts with Block Programming and Screenshots
In Sikuli IDE, we introduced using screenshots as first-class objects in a textual script
editor. However, it is still difficult for novices to write a script in a text editor without
syntax errors. One solution for this is to further extend the scripting environment to a
visual programming editor, for example, a block programming user interface in Scratch
[29]. With this way, a user can drag a desired command block out of a palette and drop it
into other blocks to form a sequence of commands.
Annotation on Existing User Interfaces
With the screenshot-driven model we described, it is possible to let users create annota-
tions on existing user interfaces using screenshots. One application of this is for creating
contextual help on any GUI. Yeh et al. [50] have initiated building a tool to support users
with common computer skills to create contextual help. An extension of this idea could
be automatically converting tutorials consisting of screenshots into Sikuli-style scripts that
create contextual help on actual user interfaces.
127
8.1 Summary
To conclude, this thesis has introduced a new notion of using screenshots as visual refer-
ences and an interaction model driven by taking screenshots. I presented many applications
that embody this notion as well as their common pitfalls. I hope to inspire others to explore
this new area of research and find out more potential applications based on this idea.
128

Bibliography
[1] Autoit. http://www.autoitscript.com/autoit3/, 1999.
[2] Jakob Bardram. Activity-based computing: support for mobility and collaboration in
ubiquitous computing. Personal and Ubiquitous Computing, Jan 2005.
[3] Jakob Bardram, Jonathan Bunde-Pedersen, and Mads Soegaard. Support for activity-
based computing in a personal computing operating system. CHI ’06, April 2006.
[4] Herbert Bay, Tinne Tuytelaars, and Luc Van Gool. Surf: Speeded up robust features.
Computer Vision–ECCV 2006, Jan 2006.
[5] Lawrence Bergman, Vittorio Castelli, Tessa Lau, and Daniel Oblinger. Docwizards: a
system for authoring follow-me documentation wizards. In UIST ’05, pages 191–200,
New York, NY, USA, 2005. ACM.
[6] Anastasia Bezerianos, Pierre Dragicevic, and Ravin Balakrishnan. Mnemonic render-
ing: An Image-Based Approach for Exposing Hidden Changes in Dynamic Displays.
In UIST ’06, 2006.
[7] Michael Bolin, Matthew Webber, Philip Rha, Tom Wilson, and Robert C. Miller.
Automation and customization of rendered web pages. In UIST ’05, pages 163–172,
New York, NY, USA, 2005. ACM.
[8] Sebastian Boring, Manuela Altendorfer, Gregor Broll, and et al. Shoot & copy:
phonecam-based information transfer from public displays onto mobile phones. Mo-
bility ’07, Jan 2007.
129
[9] Sebastian Boring, Dominikus Baur, Andreas Butz, and et al. Touch projector: Mobile
interaction through video. CHI ’10, pages 1–10, Jan 2010.
[10] Tsung-Hsiang Chang and Yang Li. Deep Shot: A framework for migrating tasks
across devices using mobile phone cameras. In CHI ’11. ACM, 2011.
[11] Tsung-Hsiang Chang, Tom Yeh, and Rob Miller. Associating the visual representation
of user interfaces with their internal structures and metadata. In UIST ’11, pages 245–
256, New York, NY, USA, 2011. ACM.
[12] Tsung-Hsiang Chang, Tom Yeh, and Robert C. Miller. GUI testing using computer
vision. In CHI ’10, pages 1535–1544, New York, NY, USA, 2010. ACM.
[13] David Dearman and Jeffery S. Pierce. It’s on my other computer!: computing with
multiple devices. In CHI ’08, pages 767–776, New York, NY, USA, 2008. ACM.
[14] Morgan Dixon and James Fogarty. Prefab: implementing advanced behaviors using
pixel-based reverse engineering of interface structure. CHI ’10, April 2010.
[15] Morgan Dixon, Daniel Leventhal, and James Fogarty. Content and Hierarchy in Pixel-
Based Methods for Reverse Engineering Interface Structure. CHI ’11, pages 1–10,
February 2011.
[16] Google. Chrome to phone. http://code.google.com/p/chrometophone.
[17] Jaekyu Ha and Robert M. Haralick. Recursive XY cut using bounding boxes of con-
nected components. ICDAR ’95, 1995.
[18] Daniel Conrad Halbert. Programming by example. PhD thesis, 1984.
[19] Ken Hinckley. Synchronous gestures for multiple persons and computers. UIST ’03,
Nov 2003.
[20] Darris Hupp and Robert C. Miller. Smart bookmarks: automatic retroactive macro
recording on the web. UIST ’07, Jan 2007.
130

[21] Amy Hurst, Scott E. Hudson, and Jennifer Mankoff. Automatically identifying targets
users interact with during real world tasks. IUI ’10, February 2010.
[22] Andrew Ko and Brad Myers. Barista: An implementation framework for enabling
new tools, interaction techniques and views in code editors. CHI ’06, pages 387–396,
2006.
[23] Gilly Leshed, Eben M. Haber, Tara Matthews, and Tessa Lau. Coscripter: automating
& sharing how-to knowledge in the enterprise. In CHI ’08, pages 1719–1728, New
York, NY, USA, 2008. ACM.
[24] Yang Li and James A. Landay. Activity-based prototyping of ubicomp applications
for long-lived, everyday human activities. In CHI ’08, pages 1303–1312, New York,
NY, USA, 2008. ACM.
[25] Chunyuan Liao, Qiong Liu, Bee Liew, and Lynn Wilcox. PACER: Fine-grained inter-
active paper via camera-touch hybrid gestures on a cell phone. CHI ’10, pages 1–10,
Jan 2010.
[26] Greg Little, Tessa A. Lau, Allen Cypher, James Lin, Eben M. Haber, and Eser Kan-
dogan. Koala: capture, share, automate, personalize business processes on the web.
In CHI ’07, pages 943–946, New York, NY, USA, 2007. ACM.
[27] Qiong Liu, Paul McEvoy, and Cheng-Jia Lai. Mobile camera supported document
redirection. Multimedia ’06, pages 791–792, 2006.
[28] David G. Lowe. Object recognition from local scale-invariant features. Computer
Vision, IEEE International Conference on, 2:1150, 1999.
[29] John H. Maloney, Kylie Peppler, Yasmin Kafai, Mitchel Resnick, and Natalie Rusk.
Programming by choice: urban youth learning programming with scratch. In SIGCSE
’08, pages 367–371, New York, NY, USA, 2008. ACM.
[30] Robert C. Miller and Brad A. Myers. Synchronizing clipboards of multiple comput-
ers. CHI ’99, Jan 1999.
131

[31] Brad A. Myers. Visual programming, programming by example, and program visu-
alization: a taxonomy. CHI ’86, page 66, 1986.
[32] Dan R. Olsen Jr, Trent Taufer, and Jerry Alan Fails. ScreenCrayons: annotating
anything. ACM, October 2004.
[33] Jeffrey Pierce and Jeffrey Nichols. An infrastructure for extending applications’ user
experiences across multiple personal devices. UIST ’08, Oct 2008.
[34] Richard Lee Potter. Pixel data access: interprocess communication in the user in-
terface for end-user programming and graphical macros. PhD thesis, College Park,
MD, USA, 1999.
[35] Jun Rekimoto. Pick-and-drop: a direct manipulation technique for multiple computer
environments. UIST ’97, Jan 1997.
[36] Jun Rekimoto and Masanori Saitoh. Augmented surfaces: a spatially continuous work
space for hybrid computing environments. CHI ’99, Jan 1999.
[37] Bill Schilit and Uttam Sengupta. Device ensembles. IEEE Computer, Jan 2004.
[38] Charles Simonyi. The death of computer languages, the birth of intentional program-
ming. NATO Science Committee Conference, 1995.
[39] Gurminder Singh and Zhao Cuie. Sage: creating reusable, modularized interactive
behaviors by demonstration. In CHI ’94, pages 297–298, New York, NY, USA, 1994.
ACM.
[40] Robert St. Amant, Henry Lieberman, Richard Potter, and Luke Zettlemoyer. Pro-
gramming by example: visual generalization in programming by example. Commun.
ACM, 43(3):107–114, 2000.
[41] Wolfgang Stuerzlinger, Olivier Chapuis, Dusty Phillips, and Nicolas Roussel. User
interface façades: towards fully adaptable user interfaces. UIST ’06, pages 309–318,
2006.
132
[42] Desney Tan. Wincuts: Manipulating arbitrary window regions for more effective use
of screen space. pages 1–4, Dec 2003.
[43] Steffen Wachenfeld and Stefan Fleischer. A multiple classifier approach for the recog-
nition of screen-rendered text. Computer Analysis of Images and Patterns, 2007.
[44] Steffen Wachenfeld, Stefan Fleischer, and Hans-Ulrich Klein. Segmentation of very
low resolution screen-rendered text. ICDAR ’07, 2007.
[45] Steffen Wachenfeld and Hans-Ulrich Klein. Recognition of screen-rendered text. Pat-
tern Recognition, 2006.
[46] Roy Want, Kenneth Fishkin, Anuj Gujar, and et al. Bridging physical and virtual
worlds with electronic tags. CHI ’99, Jan 1999.
[47] E. M. Wilcox, J. W. Atwood, M. M. Burnett, J. J. Cadiz, and C. R. Cook. Does con-
tinuous visual feedback aid debugging in direct-manipulation programming systems?
In CHI ’97, pages 258–265, New York, NY, USA, 1997. ACM.
[48] Tom Yeh. Interacting with computers using images for search and automation. PhD
thesis, Cambridge, MA, USA, 2009.
[49] Tom Yeh, Tsung-Hsiang Chang, and Robert C. Miller. Sikuli: Using GUI screenshots
for search and automation. In UIST ’09, pages 183–192. ACM, 2009.
[50] Tom Yeh, Tsung-Hsiang Chang, Bo Xie, Greg Walsh, Ivan Watkins, Krist Wong-
suphasawat, Man Huang, Larry S. Davis, and Benjamin B. Bederson. Creating con-
textual help for guis using screenshots. In UIST ’11, pages 145–154, New York, NY,
USA, 2011. ACM.
[51] Luke S. Zettlemoyer and Robert St. Amant. A visual medium for programmatic con-
trol of interactive applications. In CHI ’99, pages 199–206, New York, NY, USA,
1999. ACM.
133
Related Documents


