549 Journal of Vegetation Science 19: 549-562, 2008 doi: 10.3170/2008-8-18406, published online 30 March 2008 © IAVS; Opulus Press Uppsala. Abstract Questions: How similar are solutions of eight commonly used vegetation classification methods? Which classification methods are most effective according to classification validity evaluators? How do evaluators with different optimality criteria differ in their assessments of classification efficacy? In par- ticular, do evaluators which use geometric criteria (e.g. cluster compactness) and non-geometric evaluators (which rely on diagnostic species) offer similar classification evaluations? Methods: We analysed classifications of two vegetation data- sets produced by eight classification methods. Classification solutions were assessed with five geometric and four non- geometric internal evaluators. We formally introduce three new evaluators: PARTANA, an intuitive variation on evaluators which use the ratio of within/between cluster dissimilarity as the optimality criterion, an adaptation of Morisita’s index of niche overlap, and ISAMIC, an algorithm which measures the degree to which species are either always present or always absent within clusters. Results and Conclusions: 1. With the exception of single linkage hierarchical clustering, classifications resulting from the eight methods were often similar. 2. Although evaluators varied in their assessment of best overall classification method, they generally favored three hierarchical agglomerative cluster- ing strategies: flexible beta (β = – 0.25), average linkage, and Ward’s linkage. 3. Among introduced evaluators PARTANA appears to be an effective geometric strategy which provides assessments similar to C-index and Gamma evaluators. Non- geometric evaluators ISAMIC and Morisita’s index demon- strate a strong bias for single linkage solutions. 4. Because non-geometric criteria are of interest to phytosociologists there is a strong need for their continued development for use with vegetation classifications. Keywords: Classification evaluator; Classification validity; Cluster compactness; Indicator species. Abbreviations: ANOSIM = Analysis of similarity; ASW = Average silhouette width; ISA = Indicator species analysis; ISAMIC = Indicator Species Analysis Minimizing Intermediate Constancies; NMDS = Non-metric multidimensional scaling; PAM = Partitioning around medoids; PARTANA = Partition analysis; PBC = Point biserial correlation; TWINSPAN = Two-way indicator species analysis. Using geometric and non-geometric internal evaluators to compare eight vegetation classification methods Aho, Ken 1,4* ; Roberts, David W. 1,2 & Weaver, T. 1,3 1 Department of Ecology, Montana State University, Bozeman MT 59717-3460, USA; 2 E-mail [email protected]; 3 E-mail [email protected]; 4 Current address: Department of Biology, Idaho State University, Pocatello, ID 83209-8007, USA *Corresponding author; E-mail [email protected] Introduction The need for effective algorithms for classifying vegetation data is indisputable (cf. Mucina 1997). Quan- titative classification provides the means to objectively distinguish distinct plant associations or non-arbitrarily partition vegetation continua. Classes recognized by these analyses allow phytosociological comparisons across regions (Peinado et al. 1997), permit tracking of successional changes over time (Shao et al. 1996; Glenn & Collins 1993), and provide targets for conservation and land reclamation (Vujnovic et al. 2000; Weaver & Aho 2006). Given the large number of classification methods available, vegetation scientists need criteria to choose among them, i.e. measures of classification effectiveness. Classification solutions can be evaluated with external or internal tests (Gauch & Whittaker 1981). External evaluators compare the results of a classification with a previously established standard. Examples include recovery of clusters embedded within simulated datasets (Milligan & Cooper 1985; Belbin & McDonald 1993; Hirano et al. 2002), or recovery of subjectively assigned a priori clusters from ecological data (Cao et al. 1997; Gauch & Whittaker 1981). In contrast, internal evalu- ators use the characteristics of the clusters themselves to gauge effectiveness. Examples include cophenetic correlation (Sneath & Sokal 1973), and maximization of between cluster variance (Orlóci 1967). We consider only internal evaluators in this paper. Geometric and non-geometric evaluators Internal evaluators can be separated into two classes, those which use geometric criteria and those which use non-geometric criteria. Consider a typical vegetation data matrix with plant species as columns and samples as rows. In most situations vegetation scientists are inter- ested in clustering samples based on their compositional similarity/dissimilarity. After distances or dissimilarities

Welcome message from author
This document is posted to help you gain knowledge. Please leave a comment to let me know what you think about it! Share it to your friends and learn new things together.
Transcript

- Using geometric and non-geometric internal evaluators to compare classification methods - 549Journal of Vegetation Science 19 549-562 2008doi 1031702008-8-18406 published online 30 March 2008copy IAVS Opulus Press Uppsala
AbstractQuestions How similar are solutions of eight commonly used vegetation classification methods Which classification methods are most effective according to classification validity evaluators How do evaluators with different optimality criteria differ in their assessments of classification efficacy In par-ticular do evaluators which use geometric criteria (eg cluster compactness) and non-geometric evaluators (which rely on diagnostic species) offer similar classification evaluations Methods We analysed classifications of two vegetation data-sets produced by eight classification methods Classification solutions were assessed with five geometric and four non-geometric internal evaluators We formally introduce three new evaluators PARTANA an intuitive variation on evaluators which use the ratio of withinbetween cluster dissimilarity as the optimality criterion an adaptation of Morisitarsquos index of niche overlap and ISAMIC an algorithm which measures the degree to which species are either always present or always absent within clusters Results and Conclusions 1 With the exception of single linkage hierarchical clustering classifications resulting from the eight methods were often similar 2 Although evaluators varied in their assessment of best overall classification method they generally favored three hierarchical agglomerative cluster-ing strategies flexible beta (β = ndash 025) average linkage and Wardrsquos linkage 3 Among introduced evaluators PARTANA appears to be an effective geometric strategy which provides assessments similar to C-index and Gamma evaluators Non-geometric evaluators ISAMIC and Morisitarsquos index demon-strate a strong bias for single linkage solutions 4 Because non-geometric criteria are of interest to phytosociologists there is a strong need for their continued development for use with vegetation classifications Keywords Classification evaluator Classification validity Cluster compactness Indicator species
Abbreviations ANOSIM = Analysis of similarity ASW = Average silhouette width ISA = Indicator species analysis ISAMIC = Indicator Species Analysis Minimizing Intermediate Constancies NMDS = Non-metric multidimensional scaling PAM = Partitioning around medoids PARTANA = Partition analysis PBC = Point biserial correlation TWINSPAN = Two-way indicator species analysis
Using geometric and non-geometric internal evaluators to compare eight vegetation classification methods
Aho Ken14 Roberts David W12 amp Weaver T13
1Department of Ecology Montana State University Bozeman MT 59717-3460 USA2E-mail drobertsmontanaedu 3E-mail tweavermontanaedu
4Current address Department of Biology Idaho State University Pocatello ID 83209-8007 USACorresponding author E-mail ahokenisuedu
Introduction
The need for effective algorithms for classifying vegetation data is indisputable (cf Mucina 1997) Quan-titative classification provides the means to objectively distinguish distinct plant associations or non-arbitrarily partition vegetation continua Classes recognized by these analyses allow phytosociological comparisons across regions (Peinado et al 1997) permit tracking of successional changes over time (Shao et al 1996 Glenn amp Collins 1993) and provide targets for conservation and land reclamation (Vujnovic et al 2000 Weaver amp Aho 2006)
Given the large number of classification methods available vegetation scientists need criteria to choose among them ie measures of classification effectiveness Classification solutions can be evaluated with external or internal tests (Gauch amp Whittaker 1981) External evaluators compare the results of a classification with a previously established standard Examples include recovery of clusters embedded within simulated datasets (Milligan amp Cooper 1985 Belbin amp McDonald 1993 Hirano et al 2002) or recovery of subjectively assigned a priori clusters from ecological data (Cao et al 1997 Gauch amp Whittaker 1981) In contrast internal evalu-ators use the characteristics of the clusters themselves to gauge effectiveness Examples include cophenetic correlation (Sneath amp Sokal 1973) and maximization of between cluster variance (Orloacuteci 1967) We consider only internal evaluators in this paper
Geometric and non-geometric evaluators
Internal evaluators can be separated into two classes those which use geometric criteria and those which use non-geometric criteria Consider a typical vegetation data matrix with plant species as columns and samples as rows In most situations vegetation scientists are inter-ested in clustering samples based on their compositional similaritydissimilarity After distances or dissimilarities
550 Aho K et al
between samples have been calculated and a classifica-tion has been created for a dataset most internal evalu-ators index classification effectiveness based on cluster compactness or the similaritydissimilarity of samples between or within clusters (eg average silhouette width Kauffman amp Rousseeuw 1990 C-index Hubert amp Levin 1976 Goodman-Kruskal index Goodman amp Kruskal 1954) These algorithms are geometric evaluators ie methods which evaluate classification effectiveness based on the relationshipgeometry of samples within and between clusters (cf Dale 1991) In contrast non-geometric evaluators measure classification effectiveness with respect to species distributions For instance a clus-tering solution in which a species occurs predominantly in one cluster while being absent from others constitutes a lsquorealrsquo cluster structure from the perspective of that spe-cies To oversimplify geometric evaluators determine classification effectiveness based on samples (rows) while non-geometric evaluators determine classification effectiveness based on species (columns)
Dale (1995) criticized internal tests which evaluate classifications using purely geometric criteria since they ignore what many phytosociologists are interested in characterization of clusterscommunities with indicator species and decried the lack of non-geometric strategies for evaluating classification solutions A recently devel-oped non-geometric (flexible-asymmetric) evaluator is indicator species analysis (ISA Dufrecircne amp Legendre 1997) which indexes species abundance and fidelity to treatments and allows evaluation of classification solu-tions Although not previously considered or reviewed for this purpose a number of standard ecological indi-ces can also be adapted as non-geometric evaluators eg Morisitarsquos index of niche overlap (Horn 1966) Murdochrsquos index of prey preference (Jacobs 1974) and Hurlbertrsquos Index (Hurlbert 1978) Another unreviewed non-geometric evaluator is Indicator Species Analysis Minimizing Intermediate Constancies (ISAMIC Roberts 2005) which measures the degree to which species are either always present or always absent within clusters or types
Using internal evaluators to compare classification methods
In most cases classification methods have been compared using only external evaluations while internal evaluators (both geometric and non-geometric) have been ignored (Belbin amp McDonald 1993 Cao et al 1997 Gauch amp Whittaker 1981 Hartigan 1975 many others) Furthermore while many internal strategies ex-ist (Dale 1991) most have been used solely as stopping rules in classification solutions (ie determining the optimal number of clusters between 1 and n clusters
where n = number of classified objects) Comparisons of classification method efficacy using internal evalua-tors are rare although studies which have used a single evaluator include Sokal amp Rohlf (1962) who compared four methods using cophenetic correlation Dufrecircne amp Legendre (1997) who compared two methods using ISA indicator values and Milligan (1980) who compared fifteen methods using point biserial correlation Only one paper we know of (Bolshakova amp Azuaje 2006) has compared classification methods using multiple internal evaluators
Classification comparisons using multiple internal evaluators are important for at least two reasons First external evaluation of classification solutions may be dif-ficult for non-simulated datasets Thus scientists working with non-synthetic data must rely on internal strategies for objective assessment of classifications Indeed by choosing evaluators with appropriate optimality criteria one can verify that a classification has the characteristics one is interested in (eg compact clusters with geometric evaluators and high fidelity of species to clusters with non-geometric evaluators) Secondly many authors agree that there is no correct classification method for all datasets (Dubes amp Jain 1976 Kaufman amp Rousseeuw 1990) suggesting that the relationship between clas-sification methods and data should be examined prior to classification For example variance minimization linkage (ie Wardrsquos Method) recovers clusters effectively from spherical multivariate-normal distributions but may perform poorly when clusters in a dataset are ellipsoidal (Everitt 1977) Internal evaluation allows an assessment of the suitability of particular classification methods for particular community (site by species) data
Objectives
In this paper we compare and evaluate the classifi-cation solutions of two typical vegetation datasets pro-duced by eight commonly used classification methods Agreement among the classifiers will be determined and classification solutions will be assessed with five geometric and four non-geometric internal evaluators We have three objectives
1 Determine how differentsimilar classifications solutions of different methods are for two vegetation datasets We expect greatest incongruity between meth-ods which seek and those which do not seek spherical clusters in data
2 Identify which classification methods are deemed particularly effective or ineffective by internal evalua-tors ie recognize methods with consistent classifica-tion characteristics as identified by internal evaluators (eg compact clusters or high fidelity of species to clusters)
- Using geometric and non-geometric internal evaluators to compare classification methods - 551
3 Recognize how classification evaluators agreediffer in their interpretation of classification solutions The extent of agreement between geometric and non-geometric evaluators is of particular interest
Methods
Datasets
Two datasets were analysed The first described alpine vegetation from three high altitude ranges in the Northern Rocky Mountains (the Washburn Absaroka and Beartooth Ranges) The second described a prairie steppe ecosystem from Southeast Montana (Table 1)
The alpine dataset was created by sampling five major physical environments (talus ridgetops south facing slopes ridgetops north facing slopes and snowbanks) on nineteen mountains It consisted of 178 plots and 180 species On each mountain vegetation of each of the five environments was sampled with two randomly located 1 m times 10 m plots Each plot was sampled with 20 cm times 50 cm frames placed at one meter intervals along a ten meter sampling tape See Aho (2006) for additional details
The prairie data were gathered from 1980-1983 by an environmental consulting firm (Westech PO Box 3005 Airport Rd Helena MT 59601) to guide coal mine rec-lamationrevegetation in Southeastern Montana (Weaver amp Aho 2006) The dataset contained 113 plots and 173
species Eight vegetation types were subjectively recog-nized and separately sampled in the field The number of plots sampled for each subjective vegetation type was proportional to the area each occupied in the landscape Plots were randomly located in a homogeneous area rep-resenting a subjective type Each replicate was sampled with twenty 2 dm times 5 dm quadrats placed evenly at 3m intervals along two parallel lines 15m apart
Compositional data for both datasets were ocular estimates of cover of all vascular species within sampled plots Diversity indices and other dataset summaries are provided in Table 1 The datasets are reasonable representatives of herbaceous vegetation data sampled at mid-latitudes because (1) pre-stratification and pro-portional sampling of subjective types commonly occurs in vegetation datasets even when cluster analyses are desired (recent examples include Alard amp Poudevigne 2000 Kaźmierczak et al 1995 Roberts amp Wuest 1999 and Havlovaacute et al 2004) and (2) richness and diversity are comparable to other herbaceous vegetation datasets with similar sampling methods and from similar climatic regimes (cf Alard amp Poudevigne 2000 Lososovaacute et al 2004)
Classification methods
The eight classification methods evaluated consisted of five hierarchical agglomerative methods [flexible-β linkage (Lance amp Williams 1967) Wardrsquos method (Ward 1963) complete linkage (McQuitty 1960) av-
Table 1 Summary of datasets used in this paper
Alpine (n = 178) Prairie (n = 113)
Environmental information Approximate location (Lat Long) 45deg0rsquo N 110deg0rsquo W 45deg53rsquo N 106deg 37rsquo WPrecipitation (mmandash1) 600 ndash 1300 245Mean elevation (m) 3140 992 Sampling information Sample description (10) 2 dm times 5 dm quadrats (20) 2 dm times 5 dm quadratsMultivariate outliers1 56 44 Non-zeros entries in data matrix 95 142 γ-Diversity (Total richness) 180 173 α-Diversity x (Min Max) Plot richness 1706 (1 34) 246 (11 44)Shannon-Wiener2 202 (00 284) 223 ( 086 306)Simpson3 078 (00 093) 083 (037 094) β-Diversity Whittaker4 955 605Average Bray-Curtis dissimilarity 090 076
1Average Bray-Curtis dissimilarity of an outlier plot to other plots is greater than two standard deviations from the mean inter-plot dissimilarity (McCune amp Grace 2002) 2 H p pii i ln= sum (MacArthur amp MacArthur 1961) where pi is the proportion of species i in the sampling unit 3 D pii
= minus sum1 2 (Simpson 1964) 4βW = (γ α)ndash1 (Whittaker 1960) where γ is the total number of species in the landscape and α is average plot richness
552 Aho K et al
erage linkage (Sokal amp Michener 1958) and single linkage (Sneath 1957)] a hierarchical divisive method [TWINSPAN (Hill 1979)] and two non-hierarchical methods [partitioning around medoids (PAM Kauffman amp Rousseeuw 1990) and k-means analysis (MacQueen 1967 Hartigan amp Wong 1979)] The value β = ndash025 was used for flexible-β linkage (cf Lance amp Williams 1967 Legendre amp Legendre 1998) Classification methods are summarized in Table 2 TWINSPAN was run using default parameters from PC-ORD (McCune amp Mefford 1999) Each k-means classification was the lowest sum of squares solution from 100 randomized starts
For all methods but TWINSPAN classifications were based on a Bray-Curtis dissimilarity matrix (Bray amp Curtis 1957) This index generally outperforms Eu-clidean distance with typically sparse (few non-zero entries) vegetation datasets which may contain many plots with nothing in common (Beals 1984 McCune amp Grace 2002) Non-zero entries constituted only 95 and 142 of the alpine and prairie species by site data matrices respectively (Table 1) TWINSPAN does not use an initial distance matrix although its algorithm utilizes
underlying chi-squared distances as a result of an implicit reliance on correspondence analysis (McCune amp Grace 2002) While Wardrsquos linkage was originally designed for and restricted to Euclidean distance (Orloacuteci 1978 Pielou 1984) we used Bray-Curtis dissimilarity We made the substitution to be as be consistent as possible with other methods and based on the demonstration that Wardrsquos method is often successful when used with non-Euclidean (dis)similarity measures (Cao et al 1997 McCune amp Grace 2002)
Classification evaluators
The eight classification methods were compared with nine internal classification evaluators most of which have been tested and reviewed in the literature The nine evaluators consist of five geometric and four non-geometric measures and are summarized in Table 3 Among geometric evaluators we introduce parti-tion analysis (PARTANA) which measures the ratio of within-cluster similarity to between-cluster similarity PARTANA is related to the WB algorithm of McClain
Table 2 Brief summary of classification methods examined in this paper
Classification method Effect on distance matrix space Method descriptionComments [reference] HIERARCHICAL-AGGLOMERATIVE Average linkage (Sokal amp Michener 1958) Conserving Distance between clusters is the average between-cluster distance among samples May produce weak chaining [1] Seeks spherical clusters [2]
Complete linkage (McQuitty 1960) Dilating Distance between clusters is the largest between-cluster distance among samples Similar samples may be assigned to different clusters for solutions with few clusters [2] Seeks highly compact clusters [2] Flexible-β = ndash 025 (Lance amp Williams 1967) Conserving A β value of ndash 025 gives similar results to Wardrsquos method [2] Unlike Wardrsquos the method is compatible with non-Euclidean distances [1] Seeks spherical clusters [1]
Single linkage (Sneath 1957) Contracting Distance between clusters is the smallest between-group distance among samples May strongly chain classification results [23] Often produces drawn out or even linear clusters [2]
Wardrsquos method (Ward 1963) Conserving with Minimizes sums of squared distances of samples to assigned centroids Euclidean distances Incompatible [4] but used successfully with non-Euclidean distances [15] Seeks spherical clusters [3]
HIERARCHICAL-DIVISIVE TWINSPAN (Hill 1979) Distance matrix Simultaneously classifies species and sample units Subdivides CA ordination not provided by user space General cluster shape unknown
NON-HIERARCHICAL K-means analysis (MacQueen 1967) Conserving Iterative reassignment of k-centroids Minimizes the sums of squared distances of samples to assigned centroids Seeks spherical clusters [2]
PAM (Kaufman amp Rousseeuw 1990) Conserving Iterative reassignment of k-lsquomedoidsrsquo Minimizes average within cluster dissimilarity Seeks spherical clusters [2]
1 = McCune amp Grace (2002) 2 = Kaufman amp Rousseeuw (1990) 3 = Legendre amp Legendre (1998) 4 = Orloacuteci (1967) 5 = Cao et al (1997)While the term lsquospace-conservingrsquo has usually been limited to discussion of agglomerative hierarchical methods we use it here to describe k-means analysis and PAM since inter-sample distances are preserved and utilized by their classification routines
- Using geometric and non-geometric internal evaluators to compare classification methods - 553
amp Rao (1975) but uses similarities rather than dissimi-larities or distances Because similarity and dissimilarity are complements rather than opposites PARTANA and WB are generally not reciprocals except in the trivial case of no cluster structure (ie PARTANA = WB = 1) Among non-geometric evaluators we introduce two previously unreviewed measures an adapted form of Morisitarsquos index of niche overlap (Horn 1966) and Indicator Species Analysis Minimizing Intermediate Constancies (ISAMIC Roberts 2005) Detailed descrip-tions and equations for all evaluators are included in the appendix For the geometric evaluators [ie average silhouette width (ASW) C-index Gamma PARTANA and point biserial correlation (PBC)] Bray-Curtis dis-similarity was used to create the required dissimilaritydistance matrices
Procedure
Both datasets were classified with each of the 8 classification methods (ie 16 classifications) Each classification was pruned to find its 20 simplest solu-tions (ie 2 to 21 clusters) For each dataset each of the twenty solutions was (1) compared to the other seven solutions with the same numbers of clusters to find per-cent agreement among methods and was (2) evaluated by each of the nine classification evaluators to compare solution effectiveness
Average percent agreement between methods (ie Number of samples assigned by each method to the same cluster at a particular clustering level divided by Total number of samples) was calculated for all possible
Table 3 Summary of classification evaluators used in this paper
Evaluator Optimality criteria Comments [reference] GEOMETRIC EVALUATORSAverage Silhouette Width Large ASW indicates samples within clusters Use of nearest neighbor objects provides lsquolocalrsquo criterion(ASW Rousseeuw 1987) are compositionally similar and dissimilar to Useful for seeking compact widely separated clusters [1] nearest neighbor samples outside clusters (App 1 Eq 1)
C-Index Low within-cluster dissimilarity with respect to Effective for cluster recovery and as a stopping criterion [23](Hubert amp Levin 1976) dmin and dmax coefficients (App 1 Eq 2) Minimum response = optimal solution
Gamma High number of concordant compared to non- An adaptation of this algorithm [4] was found to be effective(Goodman amp Kruskal 1954) concordant quadruples (App 1 Eq 3) for cluster recovery and as a stopping criterion [23]
PARTANA ratio Low within-cluster dissimilarity and high Not previously reviewed lsquoWBrsquo [5] a similar algorithm (Roberts 2005) dissimilarity of samples within clusters to was found effective for cluster recovery [2] samples outside of clusters (App 1 Eq 7) but ineffective as a stopping criterion [3]
Point Biserial Correlation Low within cluster dissimilarity (App 1 Eq 8) May underestimate number of clusters as a stopping criterion [3](PBC Brogden 1949) Effective for cluster recovery [26]
NON-GEOMETRIC EVALUATORSISA (Average p-value) High ISA values indicate high fidelity and Useful as a stopping criterion [78] Proposed as a procedure for(Dufrecircne amp Legendre 1997) abundance of species within clusters comparing classification methods [8] P-values for ISA-values calculated with Minimum response = optimal solution Monte-Carlo procedures (App 1 Eq 4) ISA (Number of significant See explanation above (App 1 Eq 4) Useful as a stopping criterion [7]indicators α = 005)(Dufrecircne amp Legendre 1997 McCune amp Grace 2002)
ISAMIC Consistent presence or absence of species Not previously reviewed(Roberts 2005) within single clusters (App 1 Eq 5) Morisitarsquos index of niche overlap(adapted from Horn 1966) High proportional occurrence of species Not previously reviewed as a classification evaluator within single clusters (App 1 Eq 6) Minimum response = optimal solution An unbiased estimator of niche overlap [9]
Equations and descriptions for all evaluators included in App 1 1 = Kaufman amp Rousseeuw (1990) 2 = Milligan (1981) 3 = Milligan amp Cooper (1985) 4 = Baker amp Hubert (1975) 5 = McClain amp Rao (1975) 6 = Mil-ligan (1980) 7 = McCune amp Grace (2002) 8 = Dufrecircne amp Legendre (1997) 9 = Smith amp Zaret (1982)
554 Aho K et al
pairwise combinations within each dataset ((82ndash8)2 = 28 pairwise combinations) Since cluster labels made by the classification algorithms are arbitrary a series of computational steps were necessary To compare two vectors of classification results with the same number of clusters the cell of maximum agreement m occurring in a symmetric contingency table was noted and the row and column associated with m were deleted This process was repeated until the table was dimensionless Percent agreement (P) was calculated as
Pm
n
ii
K
= =sum
1 (1)
Where K = the number of clusters and n = the total number of samples
Average percent agreement for each of the pairwise com-binations (eg average vs single linkage) was calculated across the 20 clustering solutions Thus average percent agreement for an entire dataset (ie alpine or prairie) was calculated using 28middot20 = 560 pairwise percent agreements Pairwise agreement at each clustering level was tested for significance with Monte Carlo procedures by permutating categorical assignments of one of the two classification vectors being compared 1000 times and rechecking percent agreement P at each permutation
Superimposing the classification solutions onto the same 2-dimensional NMDS ordination scatterplots (Kruskal amp Wish 1978) allowed qualitative visual com-parisons of classification agreement Ordinations were created using Bray-Curtis dissimilarity matrices Two dimensional Principal Coordinates Analysis (PCoA) configurations were used as initial starting points for the NMDS ordinations
For both datasets and each evaluatorrsquos assessment of each method median evaluator score confidence intervals for medians and maximum evaluator score (best solution) across the 20 solutions were determined Medians rather than means were used as descriptors of evaluator central tendency because distributions of evaluator responses were usually non-symmetric Ninety-five percent confidence intervals for medians were calculated from the interquartile range and are based on the asymptotic normality of the median and roughly equal sample sizes for the medians being compared (McGill et al 1978 p 16)
Differences in median evaluator scores among meth-ods were tested for significance with Kruskal-Wallis non-parametric pairwise tests (Kruskal and Wallis 1952) Significance levels were adjusted for simultaneous infer-ence using Dunnrsquos (1964) procedure
Standardized scores are presented in tabled results to allow comparability among evaluators Standardized scores (xST) were created using the formula
xx x
sSTii=minus( ) (2)
where xi is the ith response for a particular evaluator (eg Gamma) across all classification levels of all classifica-tion methods x = is the sample mean for the evaluator and s = the sample standard deviation
Analysis of Similarity (ANOSIM) was used to test if classification solutions differed significantly from ran-dom allocations of plots (Clark 1993) Bray-Curtis dis-similarity matrices were used for ANOSIM analyses
All classifications were run using the software package PC-ORD (McCune amp Mefford 1999) except for k-means analysis and PAM which were run in R (Anon 2005) All evaluator algorithms and all other functions used to compare classifications were coded using the R language
Results
Classification agreement
Clustering solutions within a dataset (alpine or prai-rie) were often similar among classification methods Agreement among methods in assignment of samples to clusters was significantly better than random (α = 005) for 79 percent of alpine and 96 of prairie clustering solutions with the same number of clusters (Tables 4-5 Fig 1) Single linkage classification solutions were least similar to those of other methods Its agreement with other methods was significantly better than random for only 44 of alpine comparisons and 91 of prairie comparisons (Table 5 Fig 1) Agreement between single linkage and k-means analysis was especially poor for the alpine dataset being significantly better than random for only 5 (120) of alpine classification solutions (Tables 4-5) According to ANOSIM every clustering solution of every classification method differed significantly from random allocations of plots (ie p lt 0001)
Surprisingly the classification methods agreed more with each other than with field assigned strata (ie five alpine physical environments and eight subjectively as-signed prairie vegetation types) The five cluster alpine classifications agreed with field strata assignments in only 33 of cases while the eight cluster prairie classifications agreed with field strata in only 46 of cases (Table 4) In contrast the five cluster alpine classifications agreed with each other in 52 of cases and the eight cluster prairie classifications agreed with each other in 60 of cases The relatively high inter-method agreement for quantitative five and eight cluster solutions emphasizes the fact that methods agreed with each other more for simpler solutions and disagreed more as cluster number increased and solutions became more complex
- Using geometric and non-geometric internal evaluators to compare classification methods - 555
Median evaluator score
Average linkage flexible-β = ndash 025 and Wards link-age were the best classification methods in essentially all ten Kruskal-Wallis pairwise tests comparing geometric evaluator scores (ie 5 evaluators middot 2 datasets = 10 tests Table 6a) The three classifiers had the highest median
score in 1010 910 and 710 tests respectively (Table 6a) Note that several methods may lsquotiersquo for best when their median evaluator scores do not differ significantly (α = 005) PAM complete linkage k-means and single linkage performed at an intermediate level with respect to median geometric evaluator scores while TWINSPAN performed poorly These five methods had the highest
Table 4 Average agreement () for pairs of classifiers (ie Number of samples assigned to the same cluster at a particular clustering level divided by Total number of samples) across 20 clustering solutions (2-21 clusters) Average agreement is reported separately for alpine (A) and prairie (P) datasets
Average Complete Flexible K-means PAM Single TWIN- Field SPAN Wards types1
A middot P A middot P A middot P A middot P A middot P A middot P A middot P A middot P A(5) middot P(8)
Average 68 middot 61 42 middot 71 37 middot 52 39 middot 60 63 middot 54 45 middot 60 41 middot 64 23 middot 57Complete 68 middot 61 55 middot 69 45 middot 56 43 middot 57 48 middot 34 44 middot 51 52 middot 74 30 middot 40Flexible 42 middot 71 55 middot 69 62 middot 58 62 middot 61 25 middot 39 55 middot 55 90 middot 84 38 middot 44K-means 37 middot 52 45 middot 56 62 middot 58 58 middot 56 21 middot 29 48 middot 54 65 middot 58 37 middot 46PAM 39 middot 60 43 middot 57 62 middot 61 58 middot 56 22 middot 32 51 middot 51 62 middot 67 40 middot 42Single 63 middot 54 48 middot 34 25 middot 39 21 middot 29 22 middot 32 30 middot 43 24 middot 35 23 middot 35TWINSPAN 45 middot 60 44 middot 51 55 middot 55 48 middot 54 51 middot 51 30 middot 43 53 middot 53 31 middot 57Wards 41 middot 64 52 middot 74 90 middot 84 65 middot 58 62 middot 67 24 middot 35 53 middot 53 38 middot 44Overall avg 48 middot 60 51 middot 57 56 middot 62 48 middot 52 48 middot 55 33 middot 38 47 middot 52 55 middot 62 33 middot 46 48 middot 55
1Field types were five physical environments sampled for the alpine dataset and eight subjectively assigned vegetation types for the prairie data (see Methods) Five and eight cluster solutions were compared to the alpine and prairie field types respectively Overall average agreement excluding field type comparisons
Fig 1 Four cluster solutions from the (a) alpine and (b) prairie datasets overlaid on a 2D NMDS ordination solution (Kruskal amp Wish 1978) Note that for some methods (eg single linkage) several clusters are single plots (a) Final stress for 2D configurations = 2597 for the alpine and 2068 for the prairie dataset Ellipses are 95 confidence intervals around cluster centroids A disturbed Agropyron cristatum group in the prairie dataset recognized by most methods is indicated with an arrow in (b)
556 Aho K et al
median score in 410 410 310 310 and 010 tests respectively (Table 6a)
Non-geometric evaluators were more divided in their preference of classification methods Every method was found to be effective by at least one of the four non-geometric evaluators for at least one of the two datasets (Table 6b) Flexible-β = ndash 025 PAM k-means analysis and single linkage had the largest number of high scores (48) using non-geometric criteria (Table 6b)
Optimal level evaluation maximum evaluator score
With respect to maximum evaluator score geometric evaluators preferred flexible-β = ndash 025 single linkage and particularly average linkage (Table 7a) Among non-geometric evaluators the two non-ISA evaluators (Morisitarsquos index and ISAMIC) preferred single and average linkage solutions while ISA evaluators found several methods including average linkage PAM k-means analysis and Wardrsquos method to be effective (Table 7b)
Comparing evaluators
Evaluators were usually either significantly positively or negatively correlated with each other (Fig 2) Across both datasets geometric evaluators were significantly positively correlated (α = 005) in 17 of 20 possible pairwise comparisons using Spearmanrsquos rank tests (Fig 2) In particular C-index Gamma and PARTANA were strongly correlated for both datasets ( rs = 083 p lt 001 Fig 2) Among the non-geometric evaluators ISA evaluators were strongly negatively correlated to non-ISA evaluators ie Morisitarsquos index and ISAMIC ( rs = ndash072 p lt 001 Fig 2) The two ISA evaluators were strongly positively correlated ( rs = 092 p lt 001
Fig 2) as were Morisitarsquos index and ISAMIC ( rs = 091 p lt 001 Fig 2) Geometric and non-geometric evaluations were poorly correlated Thirty-five percent of comparisons (1440) between geometric and non-geometric evaluators showed a lack of any statistical association at α = 005 (Fig 2)
Discussion
Classification agreement
Clustering solutions from seven of the eight meth-ods (ie all but single linkage) showed a high degree of similarity (Tables 4-5 Fig 1) Because the classification methods repeatedly detected similar clusters our results suggest the presence of real cluster structures which were detectable from a variety of perspectives (cf Milligan 1980) This view is supported by the fact that the clusters represent credible plant associations (see Aho 2006 and Weaver amp Aho 2006 for alpine and prairie community descriptions respectively) and could be correlated with distinct segments of environmental gradients andor bio-logical interactions including pronounced anthropogenic impacts eg agricultural associations and weed species in the prairie dataset The high level of disagreement of classification solutions with subjective field strata indicates that clusters are not due solely to prestratifi-cation (Table 4) This lack of agreement indicates that quantitatively assigned vegetation associations actually overlap andor subdivide classes subjectively assigned in the field and demonstrates the problems with defen-sibility and repeatability for subjective plant community designations
The incongruity of single linkage solutions is due to this methodrsquos classification strategy While single linkage
Table 5 The percentage () of the 20 classification levels (ie 2-21 clusters) for which agreement between classification solutions was statistically significant12 Comparisons made for both alpine (A) and prairie (P) datasets
Average Complete Flexible K-means PAM Single TWINSPAN Wards A middot P A middot P A middot P A middot P A middot P A middot P A middot P A middot P
Average 85 middot 95 75 middot 100 70 middot 100 90 middot 95 100 middot 95 75 middot 95 75 middot 95Complete 85 middot 95 85 middot 95 85 middot 100 85 middot 100 95 middot 85 85 middot 100 85 middot 100Flexible 75 middot 100 85 middot 95 100 middot 100 100 middot 95 30 middot 90 100 middot 95 100 middot 95K-means 70 middot 100 85 middot 100 100 middot 100 100 middot 100 5 middot 90 100 middot 100 100 middot 100PAM 90 middot 95 85 middot 100 100 middot 95 100 middot 100 30 middot 90 100 middot 100 100 middot 100Single 100 middot 95 95 middot 85 30 middot 90 5 middot 90 30 middot 90 25 middot 100 20 middot 90TWINSPAN 75 middot 95 85 middot 100 100 middot 95 100 middot 100 100 middot 100 25 middot 100 100 middot 100Wards 75 middot 95 85 middot 100 100 middot 95 100 middot 100 100 middot 100 20 middot 90 100 middot 100 Overall 81 middot 96 86 middot 96 84 middot 96 80 middot 99 86 middot 97 44 middot 91 84 middot 99 83 middot 97 79 middot 961 For instance in the alpine dataset 85 of the 20 classifications created by complete and average linkage (ie 1720) with the same number of clusters (eg 2 3 or 4 cluster solutions) were not significantly different from each other at α = 005 H0 there is no agreement between methods ie agreement between methods is not greater than expected by chance See methods for testing procedures2P-values not adjusted for simultaneous inferenceOverall average for the percentage of levels in significant agreement
- Using geometric and non-geometric internal evaluators to compare classification methods - 557
is space contracting and often generates linear clusters due to chaining other methods tested do not seek this structure (Table 2) A high degree of similarity between flexible β = ndash025 and Wardrsquos linkage appears in both datasets (Tables 4-5 Fig 1) This correspondence has
been noted by other authors (Lance amp Williams 1967 McCune amp Grace 2002) although even these methods significantly disagree for their simplest (2 cluster) solu-tion in the prairie dataset (Table 5)
Table 6 Standardized median evaluator scores plusmn 95 CI (see McGill et al 1978) for (a) geometric and (b) non-geometric evaluators Medians were calculated across 20 different clustering solutions (2-21 clusters) for each method Assessments for method scores followed by the same letter are not significantly different at α = 005 using Kruskal-Wallis multiple comparisons Simultaneous inference adjusted using Dunnrsquos (1964) procedure The best scores in each column are bolded a GEOMETRIC EVALUATOR High ASW 1-C index Gamma PARTANA PBC Scores Alpine Prairie Alpine Prairie Alpine Prairie Alpine Prairie Alpine Prairie A P
CLASSIFIER Average 04 plusmn 07 AB 10 plusmn 05 A 05 plusmn 04 A 09 plusmn 03 AB 07 plusmn 03 A 05 plusmn 03 A ndash02 plusmn 01 AB 02 plusmn 01 A 06 plusmn 08 AB 15 plusmn 03 A 5 5Complete ndash07 plusmn 08 BC 01 plusmn 02 BC ndash02 plusmn 03BC ndash02 plusmn 5BCD 03 plusmn 06 BC 03 plusmn 05 AB ndash02 plusmn 01 BCD ndash03 plusmn 03 B 02 plusmn 09 AB ndash01 plusmn 01 BC 3 1Flexible 10 plusmn 03 A 08 plusmn 01 A 01 plusmn 03 B 12 plusmn 03 A 06 plusmn 08 AB 10 plusmn 04 AB ndash02 plusmn 01 ABC 04 plusmn 01 A 10 plusmn 04 A 08 plusmn 04 AB 4 5K-means 01 plusmn 03 AB ndash08 plusmn 02 BC ndash06 plusmn 03 BC ndash03 plusmn 02CD ndash03 plusmn 05 BC 02 plusmn 03 AB ndash02 plusmn 00 CD ndash02 plusmn 01 BC 03 plusmn 02 AB ndash05 plusmn 04 CD 2 1PAM 00 plusmn 02 AB 02 plusmn 01 B ndash04 plusmn 01 B 01 plusmn 04 CD 03 plusmn 03 BC 05 plusmn 03 AB ndash02 plusmn 00 BCD 00 plusmn 02 B 05 plusmn 00 AB ndash06 plusmn 03 BC 3 1Single ndash10 plusmn 04 C ndash15 plusmn 02 C 18 plusmn 03 A ndash09 plusmn 02 D 05 plusmn 05 AB ndash16 plusmn 01 C 02 plusmn 07 A ndash02 plusmn 03 B ndash13 plusmn 02 C ndash12 plusmn 03 D 3 0TWINSPAN ndash10 plusmn 01 C ndash15 plusmn 06 BC ndash10 plusmn 01 C ndash08 plusmn 03 D ndash02 plusmn 02 C ndash02 plusmn 01 BC ndash03 plusmn 00 D ndash04 plusmn 01 C 01 plusmn 00 B ndash01 plusmn 07 BC 0 0Ward 09 plusmn 02 AB 07 plusmn 01 A 00 plusmn 02 B 07 plusmn 05 BC 06 plusmn 7 ABC 07 plusmn 04 A ndash02 plusmn 00 BCD 02 plusmn 03 AB 07 plusmn 03 AB 00 plusmn 03 BC 3 4
b NON - GEOMETRIC EVALUATOR High 1-ISA p-val ISA sig indicators ISAMIC 1 ndash Morindex Scores Alpine Prairie Alpine Prairie Alpine Prairie Alpine Prairie A P
CLASSIFIER Average ndash08 plusmn 03 B ndash01 plusmn 01 C ndash14 plusmn 0 C ndash09 plusmn 01 DE 11 plusmn 01 A 02 plusmn 04 B 12 plusmn 01 A 07 plusmn 02 AB 2 1Complete ndash02 plusmn 03 B 01 plusmn 01 BC ndash12 plusmn 01 C 00 plusmn 02 BC 04 plusmn 01 A ndash04 plusmn 02 C 08 plusmn 01 A ndash02 plusmn 03 C 2 0Flexible 07 plusmn 01 A 03 plusmn 01 AB 10 plusmn 02 A 04 plusmn 02 ABC ndash05 plusmn 02 B ndash05 plusmn 02 C ndash07 plusmn 02 B ndash04 plusmn 02 C 2 2K-means 06 plusmn 01 A 07 plusmn 02 A 09 plusmn 01 AB 10 plusmn 03 A ndash06 plusmn 02 B ndash04 plusmn 02 C ndash07 plusmn 02 B ndash07 plusmn 03 C 2 2PAM 07 plusmn 0 A 04 plusmn 02 AB 09 plusmn 01 A 05 plusmn 03 AB ndash07 plusmn 02 B ndash03 plusmn 02 C ndash08 plusmn 01 B ndash03 plusmn 03 C 2 2Single ndash19 plusmn 01 B ndash21 plusmn 02 D ndash12 plusmn 01 C ndash20 plusmn 03 E 19 plusmn 01 A 26 plusmn 03 A 14 plusmn 01 A 17 plusmn 01 A 2 2TWINSPAN 06 plusmn 0 A 04 plusmn 01 AB ndash01 plusmn 03 B ndash03 plusmn 03 CD ndash07 plusmn 03 B 0 plusmn 02 B ndash03 plusmn 03 B 05 plusmn 03 B 1 1Ward 08 plusmn 01 A 05 plusmn 01 AB 10 plusmn 01 A 05 plusmn 01 A ndash06 plusmn 02 B ndash05 plusmn 01 C ndash07 plusmn 02 B ndash05 plusmn 02 C 2 2
Fig 2 Pairwise correlation comparisons of evaluator scores for alpine and prairie datasets (a and b respectively) Evaluator comparisons in each cell are across all 20 clustering solutions (2-21 clusters) within each of the eight classification methods Thus each cell com-pares 20 8 = 160 scores df = 158 Correlations (rs) and p-values are from Spearmanrsquos rank tests Lines are lsquolowess smoothersrsquo
558 Aho K et al
Median evaluator score geometric evaluators
Because each classification method was evaluated at twenty cluster levels a reasonable measure of overall method effectiveness is the median evaluator score (cf Dufrecircne and Legendre 1997)
Geometric evaluator medians were highest for flexible-β = ndash025 average linkage and Wardrsquos method (Table 6a) Flexible β ca ndash 025 has been recommended as an effective strategy by several authors (Lance amp Wil-liams 1967 McCune amp Grace 2002) Average linkage has been widely recommended as an effective method for detecting clusters with spherical or ellipsoidal shapes (Cunningham amp Ogilvie 1972 Milligan amp Isaac 1980 Milligan 1980 Kaufman amp Rousseeuw 1990) although it may produce more chaining than other space conserv-ing methods (McCune amp Grace 2002) Wardrsquos method is generally effective with spherical distributions (Kaufman amp Rousseeuw 1990 Hirano et al 2002) although it may perform poorly if cluster populations are unequal in size or have unequal cluster diameters (Kuiper amp Fisher 1975 Kaufman amp Rousseeuw 1990 Milligan 1980)
Geometric evaluators found TWINSPAN solutions to be poor (Table 6a) TWINSPAN may suffer from a number of problems in its parent method correspond-ence analysis (CA) which often fails to find patterns in multi-gradient datasets (Belbin amp McDonald 1993) TWINSPAN also implicitly uses chi-squared distance a measure which gives high weight to species with low total abundance (Faith et al 1987) It should be noted that Dale (1995) argued TWINSPAN should not be compared to other classification methods on the basis
of cluster geometry since its primary goal is characteri-zation through indicator species rather than creating a cluster structure It should also be emphasized that by definition geometric evaluators will generally favor spherical solutions over long linear-shaped solutions Thus single-linkage flexible-β gt 0 solutions or for that matter TWINSPAN (which does not seek spheri-cal clusters) may be disproportionately penalized by geometric evaluators
Median evaluator score non-geometric evaluators
Among non-geometric evaluators very different con-clusions were drawn by the ISA evaluators (ISA average p-value and the ISA number of number of significant indicators) which penalize species with low within-group constancy and the two non-ISA evaluators (Morisitarsquos index of niche overlap and ISAMIC) which penalize species with intermediate within-group constancy (Table 6b) Morsisitarsquos index and ISAMIC prefer single link-age classifications since this method continually isolates individual outlier clusters with relatively distinctive taxa (thus lacking species with intermediate constancy) as it chains together the rest of the data In contrast while ISA evaluators found several space-conserving methods to be valid (eg flexible β = ndash025 k-means and PAM Table 2) they found single linkage solutions to be exception-ally poor (Table 6b)
Table 7 Maximum standardized scores for (a) geometric and (b) non-geometric evaluators In each cell the standardized maximum score is listed to the left of the dot and the number of clusters associated with that score is listed to its right Notably high scores in each column are indicated in bold font
a GEOMETRIC EVALUATOR ASW 1ndashC index Gamma PARTANA PBC High scores Alpine Prairie Alpine Prairie Alpine Prairie Alpine Prairie Alpine Prairie A P
CLASSIFIER Average 21 middot 20 24 middot 2 22 middot 2 19 middot 2 18 middot 2 12 middot 21 67 middot 2 84 middot 2 14 middot 21 17 middot 7 5 3Complete 16 middot 21 05 middot 2 20 middot 4 12 middot 21 12 middot 21 13 middot 21 06 middot 4 06 middot 21 10 middot 21 08 middot 8 0 0Flexible 16 middot 21 15 middot 4 08 middot 21 15 middot 21 14 middot 21 15 middot 21 ndash01 middot 21 09 middot 2 12 middot 21 17 middot 4 0 2k-means 11 middot 21 07 middot 3 03 middot 12 07 middot 21 09 middot 20 11 middot 21iexcl ndash02 middot 19 04 middot 21 11 middot 12 14 middot 3 0 0PAM 09 middot 21 07 middot 2 00 middot 21 10 middot 21 09 middot 21 12 middot 21 ndash02 middot 21 06 middot 21 08 middot 9 05 middot 7 0 0Single 00 middot 7 10 middot 4 22 middot 2 14 middot 4 18 middot 2 01 middot 4 67 middot 2 54 middot 4 ndash10 middot 16 02 middot 21 3 0TWINSPAN ndash07 middot 11 07 middot 6 ndash03 middot 2 01 middot 7 02 middot 21 03 middot 20 ndash03 middot 21 ndash01 middot 6 02 middot 12 15 middot 6 0 0Ward 12 middot 19 11 middot 8 03 middot 19 14 middot 21 10 middot 19 14 middot 21 ndash02 middot 21 08 middot 21 10 middot 11 11 middot 8 0 0
b NON-iexclGEOMETRIC EVALUATOR 1ndash ISA pndashval ISA sig indicators ISAMIC 1 ndash Mor index High Scores Alpine Prairie Alpine Prairie Alpine Prairie Alpine Prairie A P
CLASSIFIER Average ndash05 middot 21 04 middot 6 ndash07 middot 3 00 middot 4 15 middot 8 10 middot 20 17 middot 2 11 middot 14 1 0Complete 00 middot 14 10 middot 3 ndash02 middot 2 20 middot 2 13 middot 4 ndash01 middot 21 15 middot 4 02 middot 18 0 0Flexible 10 middot 9 10 middot 3 12 middot 9 10 middot 10 01 middot 21 ndash01 middot 20 01 middot 20 01 middot 15 0 0kndashmeans 09 middot 11 16 middot 3 11 middot (812) 22 middot 9 00 middot 20 00 middot 20 ndash03 middot 20 00 middot 21 0 2PAM 09 middot 11 12 middot 4 12 middot 8 22 middot 4 ndash01 middot 21 00 middot 21 ndash03 middot 21 01 middot 21 0 0Single ndash14 middot 4 ndash16 middot 7 ndash03 middot 3 ndash10 middot 2 21 middot 15 28 middot 17 17 middot 2 24 middot 4 2 2TWINSPAN 10 middot 6 12 middot 2 09 middot (47) 17 middot 2 ndash01 middot 19 07 middot 21 01 middot 19 12 middot 18 0 0Ward 10 middot 10 08 middot 12 14 middot 10 13 middot 3 ndash01 middot 21 ndash01 middot 21 ndash03 middot 21 00 middot 18 2 0
- Using geometric and non-geometric internal evaluators to compare classification methods - 559
Optimal level evaluation maximum score geometric evaluator
While the median evaluator score may describe the overall performance of a classification method it also penalizes methods which may have a single desirable optimum We addressed this discrepancy by comparing maximum evaluator scores among the 20 clustering solutions (Tables 7a and 7b)
While single linkage and particularly average link-age performed well with respect to maximum geometric evaluator scores in most cases the maximum response was a two cluster solution in which a well defined out-lier community or sample was isolated from the rest of the dataset (Table 7a Fig 1) For the prairie dataset this outlier group consisted of five lsquodisturbedrsquo plots ie agricultural range sites dominated by an exotic wheat-grass (Agropyron cristatum) While most other methods also recognized the A cristatum group in three to four cluster solutions (Fig 1b) they did not recognize this separation as the simplest solution For the alpine dataset the outlier ldquogrouprdquo consisted of a single talus vegetation plot which contained only Claytonia megarhiza a rare species in the dataset (Fig 1a) Only two other methods (complete linkage and TWINSPAN) recognized the individual alpine transect as a viable group and only average and single linkage recognized this partition as the simplest solution (Fig 1a Table 7a) All plots in the A cristatum cluster and the single alpine C megarhiza plot were multivariate outliers using criteria described in Table 1 While the identification of multivariate outliers may be a useful by-product of cluster analysis (Kaufman amp Rousseeuw 1990) continual chaining in classification solutions generally resulted in lower median evaluator responses for single linkage (Tables 6a b) Outliers in vegetation classifications are more likely to occur at patchy or monodominant plots (eg alpine talus and agricultural lands) where only a few rareunusual spe-cies occur (cf Rey Beneyas amp Scheiner 1993 Ewa et al 1995)
Geometric evaluators which are sensitive to the dif-ference of within cluster and between cluster distances may find the separation of a single well defined outlier or outlier group to be a particularly good solution regardless of heterogeneity in the non-outlier group (Kaufman amp Rousseeuw 1990 p 218) C-index Gamma and particu-larly PARTANA appeared to be sensitive to outliers in both datasets (Table 7a) It should be emphasized that the isolation of an outlier or outlier group does not mean that a valid overall clustering structure has been found (Kaufman amp Rousseeuw 1990 p 219) Thus when us-ing optimal solutions as validity or pruning criteria it is important to verify that high evaluator responses are not merely the product of outlier recognition
Optimal level evaluation maximum score non-geo-metric evaluators
For maximum non-geometric scores the best non-ISA respondents were average and single linkage In contrast ISA evaluators found flexible-β = ndash025 k-means PAM Wardrsquos method and TWINSPAN to be effective and single linkage to be exceptionally poor (Table 7b) This split in preference reflects the difference in optimality criteria between ISA and non-ISA evaluators discussed with the non-geometric median comparisons above
Classifier performance across datasets
The performance of classification methods varied between datasets For instance while flexible- β = ndash 025 average and Wards linkage had high median scores in both datasets single linkage and PAM had much higher median evaluator scores for their classifications of the alpine dataset than classifications of the prairie dataset (Fig 1a)
The between-dataset variability of classifier perform-ance may indicate a general difference in underlying cluster structureshapes in the two datasets Single link-age solutions were generally unrelated to those of other methods particularly in the alpine dataset (Tables 4-5 Fig 1) This in conjunction with higher evaluator scores for single linkage in the alpine dataset (Table 6a) supports the possibility of a non-spherical cluster interpretation of the alpine data
It is difficult to generalize what cluster shapes are most common to vegetation data since the shape of a detected cluster depends largely on the criteria used for its recognition For instance while the shape of clusters detected by average linkage will vary somewhat in size and symmetry depending on data they cannot radically depart from a spherical construct As noted valid non-spherical and spherical interpretations may both be pos-sible for the alpine dataset and the final choice for best solution should be based on a thorough examination of results from both general strategies
Comparing evaluator criteria
Differences in evaluator criteria underlie differences in their evaluations (Fig 2) The agreement between geo-metric evaluators (ASW C-index Gamma PARTANA ratio and PBC) is due to similarity in their criteria At least in part all geometric evaluators sought solutions with high within-cluster cohesion ie low within-cluster dissimilarity (Table 3) In particular C-index and Gamma and PARTANA give very similar evaluations of cluster-ing solutions (Fig 2) All three methods use the global dissimilaritysimilarity of samples between and within
560 Aho K et al
clusters as criteria The two ISA evaluators interpret classification solutions similarly because they are de-rived from the same algorithm (App 1 Eq 4) Perhaps most interesting is the contrast noted earlier between the two non-geometric evaluators that heavily penalize intermediate constancy species Morisitarsquos index of niche overlap and ISAMIC and the ISA methods which penal-ize low constancy species (Fig 2) These two strategies tend to give opposite interpretations of the efficacy of classification solutions (Fig 2)
Geometric and non-geometric (ISA and non-ISA) evaluators appear to provide highly independent per-spectives of classification efficacy While the ISA and non-ISA evaluators were diametrically opposed (Fig 2) both ISA and non-ISA assessments were unrelated to those of geometric evaluators (Fig 2) As noted earlier thirty-five percent of pairwise comparisons (1440) be-tween geometric and non-geometric evaluators showed a lack of any statistical association (Fig 2)
Additional work
Our work emphasizes the need to develop additional non-geometric internal evaluators This is true because (1) non-geometric evaluator should be less sensitive to the cluster-shape-biases of particular classification methods and (2) because they use criteria that phy-tosociologists are interested in ie the distribution of indicator species
Untested non-geometric criteria include ldquointeraction evaluatorsrdquo which consider plant species which co-occur in the same cluster but which never co-occur in the same plot and have known niche differences (M Austin pers comm) While this situation may indicate that additional clusters may be helpful in describing vegetation units in the landscape it may also indicate the presence of important ecologicalphylogenetic factors eg the lsquoghost of competition pastrsquo (Connel 1980) andor divergent evolution (cf Wilson 1988)
While we used conventional vegetation field data to demonstrate the character of classification methods and evaluators an alternative approach would be to study artificial data (cf Austin et al 2006) Synthetic data allow one to consciously alter data characteristics (eg beta diversity or richness) to determine the effect of such alterations although it may poorly represent ecological realties (Noy-Meir amp Austin 1970 Roberts in press) Ar-tificial data for examination of cluster measures requires the investigator take into consideration additional factors eg which cluster shapes hierarchical or non-hierarchical structures and levels of inter-cluster and intra-cluster variability best represent vegetation communities (Dale 1995) We encourage further exploration of our objec-tives along these lines
Conclusions
1 Classifications made by different methods were often similar suggesting a strong underlying cluster structure particularly in the prairie dataset Greatest dif-ferences in classification solutions were between methods seeking spherical clusters in data (6 of 8 tested methods Table 2) and those which did not (ie single linkage)
2 While radically differing perspectives of ISA and non-ISA evaluators made it difficult to draw conclu-sions about classifier performance using non-geometric criteria three hierarchical agglomerative classification methods (ie average flexible-β = ndash 025 and Wards linkage) outperformed others with respect to median geometric evaluator scores
3 Differing criteria cause internal evaluators to vary greatly in what they perceive as an optimal solution These differences may allow geometric and non-geo-metric evaluators to provide independent interpretations of classification character Geometric and non-geometric evaluators both provide useful information about a clas-sification and allow a researcher to verify a classification has the qualities heshe needs (Table 3) On the other hand concerns such as diametrically opposed classifica-tion assessments and sensitivity to outliers emphasize the need to become familiar with internal evaluator biases before using them to gauge classification solutions
Of the evaluators introduced here PARTANA ap-pears to be a useful geometric evaluator which provides assessments similar to proven geometric evaluators like C-index and Gamma (Milligan 1981 Milligan amp Cooper 1985 Fig 2) although it may be sensitive to outliers The two non-geometric evaluators ISAMIC and Morisitarsquos index both prefer clusters with a minimal number of intermediate-constancy species As a result they appear highly preferential to single linkage solutions This is true because outliers isolated in chaining will inevitably contain species with high (or low) within-group constancy
Our results emphasize the usefulness of internal evaluators both geometric (for evaluation of cluster compactness and separation) and non-geometric (for evaluation of classifications using indicator species) Because non-geometric criteria are of particular inter-est to phytosociologists there is a strong need for the continuing development of these evaluators for use with vegetation classifications
- Using geometric and non-geometric internal evaluators to compare classification methods - 561
Acknowledgements We thank M Austin S Dray and M Taper for discussion and review of this manuscript Support for gathering and classifying of alpine data was supported by the United States National Park Service (YNP-NPS YELL-05116) We thank D Neuman and P Blicker from the Reclamation Re-search Unit at Montana State University and S Regel (Depart-ment of Environmental Quality) D Myran R Montgomery and B Green (from the Absaloka Rosebud and Spring Creek mines respectively) for providing the prairie dataset
References
Anon (R Development Core Team) 2005 R A language and environment for statistical computing R Foundation for Statistical Computing Vienna AT URL httpwwwR-projectorg
Aho K 2006 Alpine and cliff ecosystems in the North-Central Rocky Mountains Unpubl PhD Dissertation Montana State University Bozeman MT US
Alard D amp Poudevigne I 2000 Diversity patterns in grass-lands across a landscape gradient in Northwestern France Journal of Vegetation Science 11 287-294
Austin MP Belbin L Meyers JA amp Luoto M 2006 Evaluation of statistical models used for predicting species distributions Ecological Modelling 199 197-216
Baker FB amp Hubert LJ 1975 Measuring the power of hierarchical cluster analysis Journal of the American Statistical Assocation 70 31-38
Beals EW 1984 Bray-Curtis ordination an effective strategy for analysis of multivariate ecological data Advances in Ecological Research 14 1-55
Belbin L amp McDonald C 1993 Comparing three classifi-cation strategies for use in ecology Journal of Vegetation Science 4 341-348
Bolshakova N amp Azuaje F 2006 Estimating the number of clusters in DNA microarray data Methods of Information in Medicine 43 153-158
Bray RJ amp Curtis JT 1957 An ordination of upland forest communities of Southern Wisconsin Ecological Mono-graphs 27 325-349
Brogden HE 1949 A new coefficient application to biserial correlation and to estimation of selective efficiency Psy-chometrika 14 169-182
Cao Y Bark AW amp Williams WP 1997 A comparison of clustering methods for river benthic community analysis Hydrobiologia 347 25-40
Clarke KR 1993 Non-parametric multivariate analysis of changes in community structure Australian Journal of Ecology 18 117-143
Connell JH 1980 Diversity and the coevolution of competi-tors or the ghost of competition past Oikos 35 131-138
Cunningham KM amp Ogilvie JC 1972 Evaluation of hie-rarchical grouping techniques a preliminary study The Computer Journal 15 209-213
Dale MB 1991 Knowing when to stop cluster concept = concept cluster In Feoli E amp L Orloacuteci (eds) Computer assisted vegetation analysis pp 149-171 Kluwer Acade-mic Publishers Dordrecht NL
Dale MB 1995 Evaluating classification strategies Journal of Vegetation Science 6 437-440
Daubenmire R 1968 Plant communities A textbook of plant synecology Harper and Row New York NY US
Dubes R amp Jain AK 1976 Clustering techniques the userrsquos dilemma Pattern Recognition 8 247-260
Dufrecircne M amp Legendre P 1997 Species assemblages and indicator species the need for a flexible asymmetric ap-proach Ecological Monographs 67 345-367
Dunn OJ 1964 Multiple comparisons using rank sums Technometrics 6 241-252
Everitt B 1977 Cluster analysis Heinemann Educational Books London UK
Faith DP Minchin PR amp Belbin L 1987 Compositional dissimilarity as a robust measure of ecological distance Vegetatio 69 57-68
Gauch HG amp Whittaker RH 1981 Hierarchical classification of community data Journal of Ecology 69 537-557
Goodman L amp Kruskal W 1954 Measures of association for cross-validations Journal of the American Statistical Assocation 49 732-764
Hartigan JA 1975 Clustering algorithms Wiley New York NY US
Havlovaacute M Chytryacute M amp Tichyacute L 2004 Diversity of hay meadows in the Czech Republic major types and environ-mental gradients Phytocoenologia 34 551-567
Hill MO 1979 TWINSPANndash A FORTRAN program for ar-ranging multivariate data in an ordered two-way table by classification of the individuals and attributes Ecology and Systematics Cornell University Ithaca NY US
Hirano S Sun X amp Tsumoto S 2002 Comparison of clustering methods for clinical databases Informatical Sciences 159 155-165
Horn HS 1966 Measurement of lsquooverlaprsquo in comparative eco-logical studies The American Naturalist 100 419-424
Hubert LJ amp Levin JR 1976 A general framework for assessing categorical clustering in free recall Psychology Bulletin 83 1072-1080
Hurlbert SH 1978 The measurement of niche overlap and some relatives Ecology 59 67-77
Jacobs J 1974 Quantitative measurement of food selection Oecologia 14 412-417
Kaufman L amp Rousseeuw P J 1990 Finding groups in data an introduction to cluster analysis John Wiley amp Sons New York NY US
Kruskal JB amp Wallis WA 1952 A nonparametric test for the several sample problem Journal of the American Statistical Assocation 47 583-621
Kruskal JB amp Wish M 1978 Multidimensional scaling Sage Publications Beverly Hills CA US
Kuiper FK amp Fisher L 1975 A Monte Carlo comparison of six clustering procedures Biometrics 31 777-783
Hartigan JA amp Wong MA 1979 A k-means clustering algo-rithm Applied Statistics ndash Journal of the Royal Statistical Society Series C 28 100-108
Horn HS 1966 Measurement of overlap in comparative eco-logical studies The American Naturalist 100 419-424
Kaźmierczak E van der Maarel E amp Noest V 1995 Plant communities in kettle holes of central Poland chance occurrence of species Journal of Vegetation Science 6 836-874
Lance GN amp Williams WT 1967 A general theory of clas-sification sorting strategies I Hierarchical systems The
562 Aho K et al
Computer Journal 9 373-380Legendre P amp Legendre L 1998 Numerical ecology 2nd
English ed Elsevier Amsterdam NLLososovaacute Z Chytryacute M Cimalovaacute S Kropaacuteč Z Otyacutepkovaacute
Z Pyšek P amp Tichyacute L 2004 Weed vegetation of arable land in Central Europe Gradients of diversity and species composition Journal of Vegetation Science 15 415-422
MacArthur RH amp MacArthur JW 1961 On bird species diversity Ecology 42 594-598
MacQueen J 1967 Some methods for classification and analysis of multivariate observations In Le Cam LM amp Neyman J (eds) Proceedings of the Fifth Berkeley Symposium on Math-ematical Statistics and Probability pp 281ndash297 University of California Press Berkeley CA US
McClain JO amp Rao V R 1975 CLUSTISZ A program to test for the quality of clustering of a set of objects Journal of Marketing Research 12 456-460
McGill R Tukey JW amp Larsen WA 1978 Variations of box plots The American Statistician 32 12-16
McCune B amp Grace JB 2002 Analysis of ecological commu-nities MjM Software design Gleneden Beach OR US
McCune B amp Mefford MS 1999 PC-ORD Multivariate analysis of ecological data ver 4 MjM software design Gleneden Beach OR US
McQuitty LL 1960 Hierarchical linkage analysis for the isolation of types Educational and Psychological Me-asurement 20 55-67
Milligan GW 1980 An examination of six types of error perturbation on fifteen Clustering algorithms Psychomet-rika 45 325-342
Milligan GW 1981 A Monte Carlo study of thirty internal criterion measures for cluster analysis Psychometrika 46 187-199
Milligan GW amp Cooper MC 1985 An examination of procedures for determining the number of clusters in a data set Psychometrika 50 159-179
Milligan GW amp Isaac PD 1980 The validation of four ultrametric clustering algorithms Pattern Recognition 12 41-50
Mucina L 1997 Classification of vegetation past present and future Journal of Vegetation Science 8 751-760
Noy-Meir I amp Austin MP 1970 Principal components ordination and and simulated vegetational data Ecology 51 551-552
Orloacuteci L 1967 An agglomerative method for classification of plant communities Journal of Ecology 55 193-206
Orloacuteci L 1978 Multivariate analysis in vegetation research 2nd ed Dr W Junk Publishers Boston MA US
Peinado M Aguirre J L amp Delgadillo J 1991 Phytosocio-logical bioclimatic and biogeographical classification of woody climax communities of Western North America Journal of Vegetation Science 5 505-528
Pielou EC 1984 The interpretation of ecological data Wiley New York NY US
Rey Benayas JM amp Scheiner SM 1993 Diversity of wet meadows of geochemical gradients in central Spain Jour-nal of Vegetation Science 4 103-108
Roberts D 2005 Vegetation classification in R for labdsv ver 11-1 vegetation ecology package httpwwwcranr-projectorg unpubl
Roberts D 2007 Statistical analysis of multivariate fuzzy set ordination Ecology In press
Roberts MR amp Wuest LJ 1999 Plant communities of New Brunswick in relation to environmental variation Journal of Vegetation Science 10 321-334
Rousseeuw PJ 1987 Silhouettes A graphical aid to the in-terpretation and validation of cluster analysis Journal of Computational and Applied Mathematics 20 53-65
Shao G Shugart HH amp Hayden BP 1996 Functional clas-sifications of coastal barrier island vegetation Journal of Vegetation Science 7 391-396
Simpson EH 1949 Measurement of diversity Nature 163 688
Smith EP amp Zaret TM 1982 Bias in estimating niche overlap Ecology 63 1248-1258
Sneath PHA 1957 The application of computers to taxonomy Journal of General Microbiology 17 201-226
Sneath PHA amp Sokal RR 1973 Numerical taxonomy the principles and practice of numerical exploration WH Freeman and Company San Francisco CA US
Sokal RR amp Michener CD 1958 A statistical method for evaluating systematic relationships University of Kansas Science Bulletin 38 1409-1438
Sokal RR amp Rohlf FF 1962 The comparison of dendrograms by objective methods Taxon 11 33-40
Vujnovic K Wein RW amp Dale MRT 2000 Factors de-termining the centrifugal organization of remnant Festuca grassland communities in Alberta Journal of Vegetation Science 11 127-134
Weaver T amp Aho K 2006 Identification of community types of southeast Montana as targets for mine reclamation In 2006 Billings Land Reclamation Symposium June 5-8 2006 Billings MT Jointly published by BLRS and ASMR 3134 Montavista Rd Lexington KY US
Ward JH Jr 1963 Hierarchical grouping to optimize an objective function Journal of the American Statistical Assocation 58 236-244
Whittaker RH 1960 Vegetation of the Sisikyou Mountains Oregon and California Ecological Monographs 30 279-338
Wilson JB 1988 Community structure in the flora of islands in Lake Manapouri New Zealand Journal of Ecology 76 1030-1042
Received 15 June 2007Accepted 26 September 2007
Co-ordinating Editor MP Austin
For App 1 see below (online version)also available at JVSAVS Electronic Archives
wwwopuluspressseAppendix not edited by Opulus Press
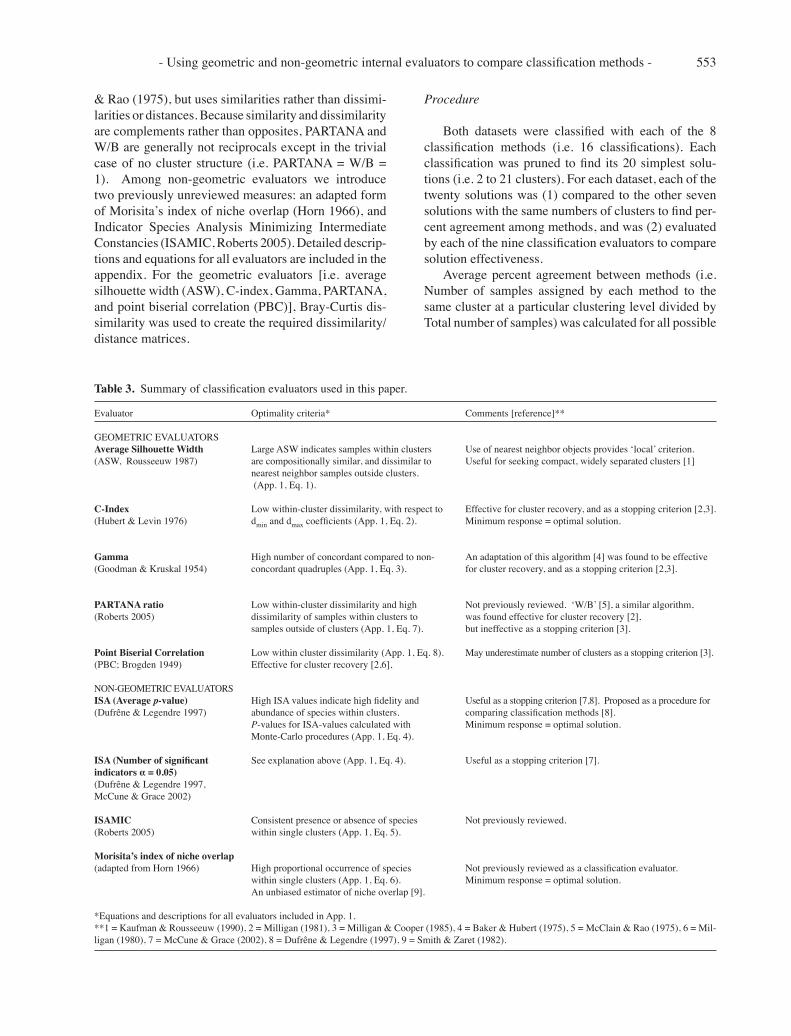
Related Documents