10 TRANSPORTATION RESEARCH RECORD 1261 Using Geographic Information System Technology To Enhance the Pavement Management Process How ARD J. SIMKOWITZ A pavement management system (PMS) should address all aspects of the pavement management process from planning and pro- gramming through project development and implementation. Geographic information system (GIS) technology can be used to expand and enhance each of these PMS components. A GIS can be designed as a platform on which the PMS is built and operated. Such a system is designated a PMS/GIS. The importance of a variety of spatially integrated data to pavement management deci- sion making is examined. Each component of the PMS process is explored and the applicability of GIS technology to this par- ticular component is discussed. This process results in the iden- tification of a set of functions required for an effective PMS/GIS. These functions include thematic mapping, flexible data base edit- ing, formula editing, statistics, charting, matrix manipulations, network generation, and integrated models and algorithms. The results are based on research for integrating GIS technology and pavement management models. All reported concepts and results have been incorporated into TransCAD, the GIS for transportation software. Pavement management has captured the hearts, minds, and pocketbooks of the FHWA and the state highway agencies. This was made clear by FHW A regulations requiring that a pavement management system (PMS) be in place in all states by 1991 and the focus of the Strategic Highway Research Program (SHRP) on asphalt and concrete materials, pave- ment performance, and other PMS-related topics (1). A PMS should be comprehensive in covering all aspects of the process from planning and programming to project development and implementation. For a PMS to be successful, these interre- lated steps must make significant requirements on the collec- tion of specific pavement condition data, require the assess- ment of related data such as accidents and traffic volumes, utilize life cycle costing (LCC) and other analytic models, and take into account other construction and maintenance projects already scheduled or being considered by the agency. A well-designed geographic information system (GIS) pro- vides a platform on which all aspects of the PMS process can be built. The resulting system, a PMS/GIS, represents a sig- nificant enhancement to all aspects of the PMS process. A variety of spatially integrated data are important to pavement management decision making. GIS technology, as defined and explored, is shown to be the most logical way of relating these diverse, but relevant, data. Next, each component of the PMS process and the applicability of GIS technology are discussed. The components include data collection, prelimi- Caliper Corporation, 4819 Cumberland Ave., Chevy Chase, Md . 20815. nary data analysis and interpretation, system assessment, determination of strategies, project identification and devel- opment, and project implementation. Each of these stages in the PMS process is enhanced by GIS technology. Looking at the PMS process in its entirety leads to the enumeration of a set of functions to be embedded in the GIS platform that is required for an effective PMS/GIS. These functions include thematic mapping, a flexible data base editor, formula editing, statistics, charting, matrix manipulations, network generation, models and algorithms, and hooks to external procedures. Research is being conducted on integrating GIS technology and transportation models. This research has resulted in the development ofTransCAD, a transportation GIS. TransCAD provides all the tools that the pavement management analyst needs, at the same time supporting complex transportation models and algorithms in a comprehensive and cohesive struc- ture. All reported concepts and results have been incorporated into the TransCAD software. THE ROLE OF SPATIALLY INTEGRATED DATA IN A PMS Spatial considerations are fundamental to most transportation activities, including pavement management. A transportation system consists of nodes, links, and entities distributed in two- or three-dimensional space. Events happen within this system at a point (an accident, a signal location), along a segment (pavement deficiencies, vehicle volumes), or within a geo- graphical area (people living in one neighborhood who wish to commute downtown). Comprehensive pavement management models require a diverse collection of highway-related data including pavement condition surveys, skid resistance measurements, traffic counts, bridge inspections, sign inventories, photologging, accident investigation, construction and maintenance records, and inventories of signs and roadside obstacles. Although these data may be available in digital format, they are typically unrelated to each other, duplicative, and inconsistent. The various files may have been created independently of one another, using different referencing systems or computer for- mats. Popular referencing systems include milepost, reference post, paper document methods, state plane, and latitude- longitude. In the worst case, some of the data required for analysis may not be spatially referenced at all. As a result, they are difficult to use in a consistent and efficient manner as inputs to a PMS. In the next section, GIS technology is

Welcome message from author
This document is posted to help you gain knowledge. Please leave a comment to let me know what you think about it! Share it to your friends and learn new things together.
Transcript

10 TRANSPORTATION RESEARCH RECORD 1261
Using Geographic Information System Technology To Enhance the Pavement Management Process
How ARD J. SIMKOWITZ
A pavement management system (PMS) should address all aspects of the pavement management process from planning and programming through project development and implementation. Geographic information system (GIS) technology can be used to expand and enhance each of these PMS components. A GIS can be designed as a platform on which the PMS is built and operated. Such a system is designated a PMS/GIS. The importance of a variety of spatially integrated data to pavement management decision making is examined. Each component of the PMS process is explored and the applicability of GIS technology to this particular component is discussed. This process results in the identification of a set of functions required for an effective PMS/GIS. These functions include thematic mapping, flexible data base editing, formula editing, statistics, charting, matrix manipulations, network generation, and integrated models and algorithms. The results are based on research for integrating GIS technology and pavement management models. All reported concepts and results have been incorporated into TransCAD, the GIS for transportation software.
Pavement management has captured the hearts, minds, and pocketbooks of the FHWA and the state highway agencies. This was made clear by FHW A regulations requiring that a pavement management system (PMS) be in place in all states by 1991 and the focus of the Strategic Highway Research Program (SHRP) on asphalt and concrete materials, pavement performance, and other PMS-related topics (1). A PMS should be comprehensive in covering all aspects of the process from planning and programming to project development and implementation. For a PMS to be successful, these interrelated steps must make significant requirements on the collection of specific pavement condition data, require the assessment of related data such as accidents and traffic volumes, utilize life cycle costing (LCC) and other analytic models, and take into account other construction and maintenance projects already scheduled or being considered by the agency.
A well-designed geographic information system (GIS) provides a platform on which all aspects of the PMS process can be built. The resulting system, a PMS/GIS, represents a significant enhancement to all aspects of the PMS process. A variety of spatially integrated data are important to pavement management decision making. GIS technology, as defined and explored, is shown to be the most logical way of relating these diverse, but relevant, data. Next, each component of the PMS process and the applicability of GIS technology are discussed. The components include data collection, prelimi-
Caliper Corporation, 4819 Cumberland Ave., Chevy Chase, Md. 20815.
nary data analysis and interpretation, system assessment, determination of strategies, project identification and development, and project implementation. Each of these stages in the PMS process is enhanced by GIS technology. Looking at the PMS process in its entirety leads to the enumeration of a set of functions to be embedded in the GIS platform that is required for an effective PMS/GIS. These functions include thematic mapping, a flexible data base editor, formula editing, statistics, charting, matrix manipulations, network generation, models and algorithms, and hooks to external procedures.
Research is being conducted on integrating GIS technology and transportation models. This research has resulted in the development ofTransCAD, a transportation GIS. TransCAD provides all the tools that the pavement management analyst needs, at the same time supporting complex transportation models and algorithms in a comprehensive and cohesive structure. All reported concepts and results have been incorporated into the TransCAD software.
THE ROLE OF SPATIALLY INTEGRATED DATA IN A PMS
Spatial considerations are fundamental to most transportation activities, including pavement management. A transportation system consists of nodes, links, and entities distributed in twoor three-dimensional space. Events happen within this system at a point (an accident, a signal location), along a segment (pavement deficiencies, vehicle volumes), or within a geographical area (people living in one neighborhood who wish to commute downtown).
Comprehensive pavement management models require a diverse collection of highway-related data including pavement condition surveys, skid resistance measurements, traffic counts, bridge inspections, sign inventories, photologging, accident investigation, construction and maintenance records, and inventories of signs and roadside obstacles. Although these data may be available in digital format, they are typically unrelated to each other, duplicative, and inconsistent. The various files may have been created independently of one another, using different referencing systems or computer formats. Popular referencing systems include milepost, reference post, paper document methods, state plane, and latitudelongitude. In the worst case, some of the data required for analysis may not be spatially referenced at all. As a result, they are difficult to use in a consistent and efficient manner as inputs to a PMS. In the next section, GIS technology is

Simkowitz
proposed as a framework for data integration because it provides a means of relating data collected under various referencing systems.
GIS TECHNOLOGY AND BENEFITS
A GIS is a computerized data base management system for the capture, storage, retrieval, analysis, and display of spatial (i.e., locationally defined) data. A GIS contains two broad classifications of information, geocoded spatial data and attribute data. Geocoded spatial data define objects that have an orientation and relationship in two- or three-dimensional space. Each object is classified as either a point, a line, or a polygon and is tied to a geographic coordinate system. These objects have precise definitions and are clearly related to each other according to the rules of mathematical topology.
In addition to topological information, a GIS contains the same attribute data that is found in traditional data bases. Attributes associated with a street segment might include its width, number of lanes, construction history, pavement condition, and traffic volumes.
An accident record could contain fields for vehicle types, weather conditions, contributing circumstances, and injuries. What distinguishes a GIS from a traditional data base is that this attribute data is associated with a topologic object (point, line, or polygon) that has a position somewhere on the surface of the earth.
A well-designed GIS permits the integration of these data. The sophisticated data base in a GIS has the ability to associate and manipulate diverse sets of spatially referenced data that have been geocoded to a common referencing system. To permit this, it might be necessary, for example, to use software that transforms state plane coordinates and milepoint data to latitude-longitude data, and vice versa.
A GIS can lead to new ways of thinking about and dealing with the pavement management process . It can expand the decision making on repair strategies and project scheduling by incorporating such diverse data as accident histories, economic needs, hazardous materials shipments, and vehicle volumes.
Rather than being limited to textual queries, a GIS can perform geographic queries in a straightforward, intuitive fashion. A GIS/PMS can display deficient sections, can group sections by deficiencies, can be used to build projects through spatial selection, can compute traffic impacts of various PMS plans , and can incorporate the results of life cycle forecasts into measurements of future mobility.
The following sections explain how GIS technology can be used in all aspects of the pavement management process.
DATA COLLECTION
The first step in the pavement management process is to collect and record the condition of the roadway segments. Typically, the roadway deficiencies are coded on a segment-bysegment basis and the results printed in tabular form. A series of computer displays showing the segments color-coded by the various attributes would greatly facilitate the process of data entry and editing. Omissions in the data collection effort
11
would be immediately apparent from segments in the roadway showing no data. Errors in measurement or coding would also be readily apparent. One such example would be a case in which a long stretch of roadway had recently been resurfaced and a segment in the middle was coded as having severe transverse cracking (Figure 1). With a GIS, this series of map displays can be quickly produced and assimilated.
Recent developments in electronic data collection equipment make it feasible to scan a roadway from a moving vehicle and automatically record pavement distresses on a microcomputer. If the data were to be entered directly into a GIS data base , this procedure could produce an instant map display of the road condition.
PRELIMINARY ANALYSIS AND INTERPRETATION
In the traditional PMS, the highway engineer transfers some of this tabular information to a base map by hand as a step in understanding the data. For example, he might construct a map showing the severity of rutting or block cracking or create a map indicating the overall performance index. As in the situation for data editing, a GIS that integrates the data base attributes describing the pavement condition with a cartographic display of the road network can be used to create any number of illustrative visual displays of the status of the road system. In Figure 2, all segments with block cracking greater than six are highlighted. In Figure 3, the segments have been grouped by the amount of excess asphalt and a different color assigned to each group.
SYSTEM ASSESSMENT
Although these visual representations of the segment-bysegment status of the roadway are a valuable addition to the pavement management process, it is necessary to add analytical capabilities to assess the current status of the system, compare it with previous periods, and make predictions about the future. To do so requires basic formula manipulations, spatial and conditional query capabilities, statistical procedures , and charting for graphical representation of the data. For example, suppose that 10 deficiencies are rated on a scale from 0 to 10, for which 10 is the worst. To obtain an overall rating of each segment, it might be appropriate to add these 10 ratings and place them in a computed field in the road segment data base. The segments could now be sorted in descending order so that the most deficient segments are at the top of the list. Or one might prefer to compute the present serviceability ratings or the serviceability index as defined in the Pavement Condition Rating Guide (2) as a summary measure of condition. Assuming a rating system of 0 to 100, each segment could be placed in 1 of 10 groups (0-10, 11-20, ... , 90-100).
A good PMS/GIS should make it possible to perform statistical analysis of the data . Here are some examples: query the data base by condition to find out how many miles of roadway have a deficiency rating greater than 90; query the data base by road type to find out how many miles of Interstate highway have a deficiency rating greater than 90; query the

.. . . . : .
<-81.b28888.35.517190>
FIGURE 1 Miscoded data.
Ira nsCAD - ( c) Co1"Jr i g ht 1 YUU Cal i 11er Corp. A J l Hi !I hts Heservcd .
NC HPMS Interstate Data/ Interstate SegMents PHUCESSING . . .
FIGURE 2 Highlighting of segments with block cracking greater than six.

Simkowitz 13
FIGURE 3 Segments grouped by the amount of excess asphalt.
data base spatially to find out how many miles of roadway within 15 mi of the center of a major urban area have a deficiency rating greater than 90 (Figure 4) or how many miles are deficient within an engineering district.
The statistical procedures could also be used to obtain the condition of the average road segment, or the variation in segment conditions throughout the system. Charting could be used to create a pie chart showing the relative proportion of road miles in each condition group. By combining traditional conditional query capabilities with spatial queries and adding mathematical manipulation , statistics, and charting, a full assessment of the road system is possible from within the PMS/ GIS. The graphical products produced as part of the assessment could be easily comprehended by management, politicians, and citizen groups, helping to clarify issues and obtain needed support.
DETERMINATION OF STRATEGIES AND ASSIGNMENT OF RESOURCES
The next step in a PMS is the determination of appropriate strategies to deal with the pavement deficiencies over a time horizon and the corresponding assignment of resources to implement these strategies. The determination of strategies could imply a series of decision rules that match deficiency ratings with appropriate actions (Figure 5), or the process could involve a more elaborate calculation of LCC and the appropriate timing of preventive and restorative measures.
The former approach is used in the Pennsylvania DOT STAMPP PMS, in which, for example, rutting plus serious
raveling plus average daily traffic greater than 2,000 imply the need for resurfacing (3). The Florida DOT recommends LCC as part of an economic analysis that includes initial cost, follow-up maintenance and rehabilitation costs, inflation, and the time value of money for each pavement type that is considered ( 4).
Whichever approach is taken, a well-designed PMS/GIS should have direct links to decision models so that the strategies can be readily determined. In other words, the strategy models should have direct access to the PMS/GIS data base, and the model results should be entered directly into the data base.
In addition to the traditional elements contained in a PMS, a GIS would make it possible to enrich the decision-making process by incorporating other types of data that could not easily be brought into the process without the ability to relate data spatially. One important example is being able to use accident analysis in the decision-making process. Accident analysis requires the correlation of a number of explanatory roadway and environmental variables such as roadway geometrics, weather conditions, traffic volumes, signage, signalization , lighting, and pavement condition (Figure 6). A GIS can serve as the integrator of all transportation activities (e .g., pavement management, accident analysis, sign and signal inventories, planning, and hazmat), as well as the link to other agencies with overlapping data needs (e.g., planning, environmental resources , utilities) (5).
Another important component in a PMS is good traffic estimation procedures. It has been pointed out that classification counts are not always representative of actual traffic conditions because of overloaded trucks avoiding weighing

<-80. 839384 ,35.804422)- 15.053 Miles
FIGURE 4 Selecting road segments within a 15-mi radius of the center of an urban area.
NC HPMS l nterstate Data/l nterstate SegMents PROCESS ltiG . ..
FIGURE 5 Decision rules recommend crack seal.

Simkowitz
IransCAD I
•I ap ay
J-----.. Total Persons
1 To <2 2 To <3 3 To <4
11 ;7 ~: ~~ o To <7
or More
15
-.
E
Idaho Acc ident Data /Accident Locations
FIGURE 6 Accidents correlated with pavement condition.
scales and insufficient traffic sampling programs (6). A PMS/ GIS, with an appropriate assignment model, could test for discrepancies between estimated volumes and actual counts.
PROJECT DEVELOPMENT
Once the strategies have been defined and the budgets assigned, it will most likely be the responsibility of the district engineer to implement the strategies through a series of projects. Using the same set of visual and analytical tools that was used for system assessment, the district engineer can group road segments into homogeneous projects on the basis of spatial proximity and resource constraints (Figure 7).
PROJECT IMPLEMENTATION
Individual projects are typically scheduled on the basis of the availability of resources. By encapsulating the PMS within an overall GIS, it would also be possible to schedule projects so that they have minimal impact on the efficiency of the network. Employing demographics and journey-to-work data, a transportation model linked to the GIS could compute traffic assignments on the network. Negative interactions of multiple projects would be readily apparent. User costs resulting from delays could be determined. Shortest path analysis could be used during project implementation to identify optimal diver-
sion routes around segments with the highest volume/capacity ratios (Figure 8).
NETWORK SEGMENTATION IN A PMS/GIS
A transportation system can be viewed as a connected network with ·egment boundaries nodes) defined not just by road inter ections but al ·o by changes in the particular attribute or attributes under consideration. Some segmentation schemes could result in long segments. For example, the number of lanes of an Interstate highway might not change for 100 mi. Other data-delimited elements, such as road condition and vehicle volumes, usually change at more frequent intervals. Finally, other data, such as an accident record, might be tied to a discrete point.
The following represents a hypothetical, but realistic , situation. The first 3 mi of a road are two lanes, at which point the road widens to four lanes. But after the first mile, the concrete surface has been covered with a layer of asphalt for 11/2 mi. Accidents seem to cluster around intersections, but there are two curves that also have a large number of accidents. Five miles down the road, a major highway joins this road, doubling the traffic volume for the next 3 mi. A large number of trucks enters the roadway 2 mi further at a freeway interchange. Suddenly, the amount of edge deterioration increases dramatically.
These observations lead to the question, "When designing a PMS/GIS, how should the network be segmented?" Too

<-77.bY7419.3b.4b~~2&>
FIGURE 7 Selecting the segments to include in a project.
TransCAD - (c \ Co)H r- i!rht 1988 C<i l i per Corp . fl l l R l[Jhts Reserved .
FIGURE 8 Shortest path detour around construction site.

Simkowitz
few segments means that changes in data will be lost. Too many segments will leave the system awash in repetitive detail. Nyerges (7) discusses the pros and cons of fixed length and variable length segmentation schemes.
Fletcher (8) develops the idea of dynamic segmentation of the highway. He proposes that each attribute be stored in its own representation of the network, separate from the base configuration. Segment boundaries in each thematic network would be defined by the variability of each attribute. The network containing pavement widths would probably contain fewer segments than the ones for vehicle-miles of travel or road conditions. Such a construct would minimize data redundancy while capturing data at any desired level of detail. For a particular analysis, only networks of required data elements would be used.
Algorithms have been developed for dynamically segmenting the road network on the basis of changes in the underlying attributes of interest. For example, TransCAD can store attributes in files where each record contains the new attribute value and the beginning milepoint. The analyst selects a subset of attributes of interest and the software automatically inserts nodes in the network wherever one of these attributes changes.
SOURCES OF MAP DATA FOR A PMS/GIS
There are two primary sources of digital map data that are appropriate for use in a PMS/GIS. The Bureau of the Census, in cooperation with the U.S. Geological Survey, has created a topological data base containing every street and block face
- .....-i:lt:"r!RY
ROVIDENCE
17
in the United States for use in the 1990 census. Called TIGER, it combines the 1980 GBF/DIME files in the central cities with the U.S. Geological Survey 1:100,000-scale digital line graphs (9,10) . TIGER would be appropriate for city and county PMS/GISs (Figure 9) . Each road segment in the TIGER file has a street name associated with it, and segments in the urbanized areas also have address ranges identified. Other fields required by a PMS, such as deficiencies and traffic volumes, would have to be added. In addition, TIGER includes all census geography such as census blocks and tracts. This information makes it possible to associate census data from the standard tape files of the decennial census , making TIGER a suitable basemap for all types of planning and analysis (11).
A demonstration project funded by FHWA illustrated how TIGER, combined with GIS technology, could be used for transportation planning and PMS analysis (12). The report explains how a windowed network could be created for all TIGER road segments within a band along the construction site. This network could then be used to develop optimal detour routings as shown in Figure 8.
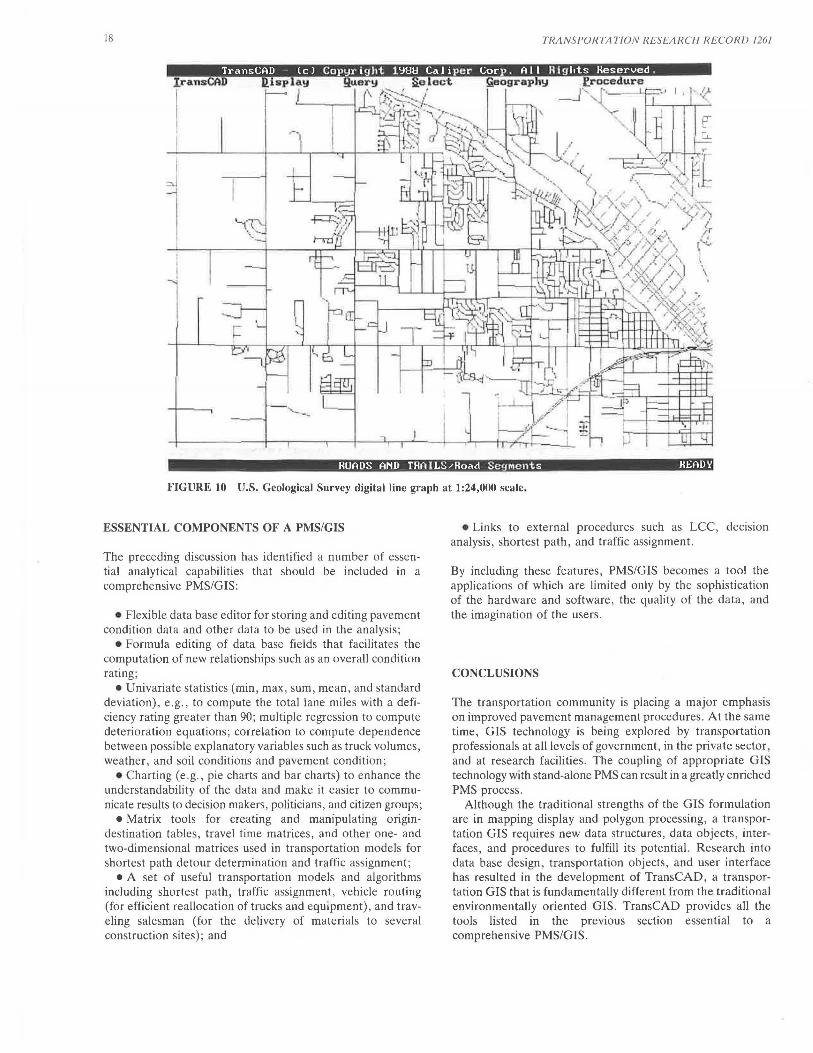
The second source of inexpensive digital data is the digital line graph (OLG) series from the U.S. Geological Survey. Files at 1:100,000 scale are available for the entire United States. Some files are also available at the 1:24,000 scale (13). DLGs are appropriate for state PMS/GISs, particularly when the state has not already digitized its road network (Figure 10) . Unlike TIGER files, only the interstate and primary segments have names identified, and address ranges and census geography are not included.
~aog:raph!,I f.roccdure
\
'BROI
ITT
Boone CoLmty Roads/Road SegMent READY
FIGURE 9 Census TIGER file street map.
18 TRANSPORTATION RESEARCH RECORD 1261
• I
lransCAD !,ieograp
e::
1 \ '
HOADS Al'ID TRA ILS/Roa<l Seg111ents HEAD't'
FIGURE 10 U.S. Geological Survey digital line graph at 1:24,000 scale.
ESSENTIAL COMPONENTS OF A PMS/GIS
The preceding discussion has identified a number of essential analytical capabilities that should be included in a comprehensive PMS/GIS:
• Flexible data base editor for storing and editing pavement condition data and other data to be used in the analysis;
• Formula editing of data base fields that facilitates the computation of new relationships such as an overall condition rating;
•Univariate statistics (min, max, sum, mean, and standard deviation), e.g ., to compute the total lane miles with a deficiency rating greater than 90; multiple regression to compute deterioration equations; correlation to compute dependence between possible explanatory variables such as truck volumes, weather, and soil conditions and pavement condition;
•Charting (e .g., pie charts and bar charts) to enhance the understandability of the data and make it easier to communicate results to decision makers, politicians, and citizen groups;
• Matrix tools for creating and manipulating origindestination tables , travel time matrices, and other one- and two-dimensional matrices used in transportation models for shortest path detour determination and traffic assignment;
• A set of useful transportation models and algorithms including shortest path, traffic assignment, vehicle routing (for efficient reallocation of trucks and equipment), and traveling salesman (for the delivery of materials to several construction sites); and
• Links to external procedures such as LCC, decision analysis, shortest path, and traffic assignment.
By including these features, PMS/GIS becomes a tool the applications of which are limited only by the sophistication of the hardware and software, the quality of the data , and the imagination of the users.
CONCLUSIONS
The transportation community is placing a major emphasis on improved pavement management procedures. At the same time, GIS technology is being explored by transportation professionals at all levels of government, in the private sector, and at research facilities. The coupling of appropriate GIS technology with stand-alone PMS can result in a greatly enriched PMS process .
Although the traditional strengths of the GIS formulation are in mapping display and polygon processing, a transportation GIS requires new data structures, data objects, interfaces, and procedures to fulfill its potential. Research into data base design, transportation objects, and user interface has resulted in the development of TransCAD, a transportation GIS that is fundamentally different from the traditional environmentally oriented GIS . TransCAD provides all the tools listed in the previous section essential to a comprehensive PMS/GIS.
Simkowitz
Computer hardware continues to become less expensive and more powerful. Software continues to grow more sophisticated. Public agencies and private companies are developing more and better geocoded data. The end result is that costeffective GIS-based PMSs will become more and more common within the transportation community.
REFERENCES
1. D . J . Kulash. SHRP Research Products Expected by 1993. TR News, No. 143, July-Aug. 1989, p. 5.
2. J. P. Zaniewski et al. Pavement Condition Rating Guide. FHWA, U.S. Department of Transportation, Office of Highway Planning, Washington, D.C., 1985.
3. PennDOT. Systematic Technique to Analyze and Manage Pennsylvania Pavements. Special Task Force on Pavement Management, Harrisburg, Pa., Oct. 1983.
4. D. E . Peterson. NCH RP Synthesis of Highway Practice 122: LifeCycle Cost Analysis of Pavements. TRB, National Research Council, Washington, D.C., Dec. 1985.
5. L. B. Stephens, Jr. The Integration of a City's PMS with other Street Management Systems. Second North American Conference on Managing Pavements, Proceedings, Vol. 1, FHWA, U.S. Department of Transportation, Washington, D.C., 1987.
6. Desai , et al. Traffic Forecasting for Pavement Design. Federal
19
Highway Administration, Office of Implementation , McLean , Va., 1988.
7. T. L. Nyerges. Design Considerations for Transportation GIS. Presented at the Ninth International Symposium on ComputerAssisted Cartography, Baltimore, Md., 1989.
8. D. Fletcher. Modeling GIS Transportation Networks. URISA 24th Annual Conference Proceedings, Fort Lauderdale, Fla., 1987.
9. R. A. LaMacchia, S. G. Tomasi, and S. K. Piepenburg. The Tiger File: Proposed Products. Geography Division, Bureau of the Census, Washington, D.C., 1987.
10. L. Batten. Geographic Information Systems Research Utilizing 1:100,000 Digital Line Graph Data. U.S. Geological Survey, Reston, Va., 1988.
11. H . J. Simkowitz. Using the Census TIGER/Line Files for Transportation Planning. Presented at the National Conference on Effective Planning Techniques for Small and Medium-Sized Areas, Phoenix , Ariz., 1988.
12. J. Fleck and H. J. Simkowitz. Using the Census TIGER Files for Transportation Planning: Results of an FHWA Demonstration Project. Presented at the Second Conference on Transportation Planning Applications, Orlando, Fla., 1989.
13. U.S. Geological Survey. Guidelines for Acceptance of Digital Cartographic Data into the National Digital Cartographic Data Base. Digital Cartography Program Office, Reston, Va., 1987.
Publication of this paper sponsored by Commillee on Pavement Management Systems.
Related Documents